
Submitted:
17 February 2025
Posted:
18 February 2025
You are already at the latest version
Abstract
Effective management of produced water (PW), a by-product of oil extraction in Oman, is crucial for sustainable water use and environmental protection. PW contains petroleum residues, heavy met-als, and salts, requiring treatment before reuse. In the Nimr oil field, PW is partially treated through constructed wetlands with reed grass. This study evaluates the feasibility of reusing treated PW for irrigation by assessing its effects on soil quality and mineral accumulation in plants under different irrigation conditions. Field experiments were at Sultan Qaboos University (SQU) and Nimr wet-lands treated PW (TDS ~6,500–7,000 mg/L) along with lower-salinity water sources. Soil amend-ments (biochar and gypsum) were tested for salinity mitigation. Results showed that PW irrigation significantly increased boron and major cations (Na, K, Ca, Mg) in soil and plant tissues, leading to higher soil salinity and potential decline in soil health. While biochar reduced boron levels, neither amendment improved plant growth or nutrient uptake. Plants irrigated with PW exhibited signs of salinity stress, including reduced leaf development and premature senescence. These findings highlight both the potential and challenges of PW reuse for irrigation. Adaptive irrigation strategies and soil management practices are essential to maximize benefits while mitigating long-term soil salinity risks.
Keywords:
Treated Produced Water
; Sustainable Irrigation
; Mineral Accumulation in Plants
; Water Quality
; Boron and Sodium Dynamics
1. Introduction
The use of saline water in tolerant-crops production is highly important in arid regions. Introduction of salt tolerant species is the most promising alternative to salinity problems (Asch et al. 2000, Rengasamy 2006, Suyama et al. 2007). Wild grass such as Buffelgrass (C. ciliaris) has shown a resistance to salinity stress. Introduction of salt tolerant fodder crops help with the scarcity of good water quality. Improved salinity tolerance permits the conservation of fresh water and its use for high value purposes, providing both ecological and economic benefits essential for sustainable agriculture in dry lands (Keating et al. 2010). Buffelgrass are constantly confronted with various biotic and abiotic stress factors like high temperature, salt, drought, flooding, heat, oxidative stress, and heavy metal toxicity (Ibarra-Flores et al. 1995, Ward et al. 2006, Marshall et al. 2012). There are many researchers studying (C.ciliaris) Buffelgrass salinity tolerance with different varieties, however there is a limited study on its performance with respect to their water irrigation salinity, soil salinity, production and potintial application using produced water. Moreover, this study aims to look to the impact of using selected plants species to be grown in South of Oman using produced water and monitor metal transfers to the plant’s leaves, roots and soil accumulation.
Such a study can eliminate the freshwater wastage in irrigation for grass fodder production in arid regions. Salt tolerant grass could help farmers to reduce stock feed importation. Nevertheless, growing crops with high saline hydrocarbon water may reduce its yields and biomass production. However, the option of converting such tolerant crops to a biochar is an advancement to food security, environmental pollution, and energy shortage (Chen et al. 2019 , Li et al. 2021). In this study, (C.ciliaris) Buffelgrass biochar option may help as an application and solutions on produced water use.
Produced water quality is challenging due to its solids content, nutrients concentrations, organic load, hydrocarbon pollutants, salinity, heavy elements, pH value, toxic compounds and emerging pollutants. PW out of oilfields considered as one of most challenging where inorganic and toxic contaminants are extant (Pichtel et. al. 2016, Stefanakis et. al. 2017, Atoufi et. al. 2020). Besides that, such water sources’ location on a remote desert area makes it difficult to define suitable remediation options. Nevertheless, a sustainable green structural solution is considered an enhancement for resilience in petrochemical industry. A possible solution could provide an ecosystem service besides effective treatment as it is considered as natural treatment systems which results in energy saving and greenhouse gas emission reductions.
Oman lies in an arid region with limited rainfall (Al-Ajmi et. al. 2013,Al-Ajmi 2018). It has limited water where it need to grow crops and much of saline water on area that difficult to grow like Nimr oil field area. A possible solution and application of oily produced water uses is worthy and a value for Oman. Notwithstanding, building sustainability of water, soil and plants in this arid area will lead to added agriculture values. Reuse of treated wastewater applications are usually seen as an environmentally friendly practice which are serving management of water sustainability approach and economically beneficial practice according to Atherton (2011). On other hand, the reuse of treated wastewater has a potential benefit by its conservation of fresh water supplies and economic advantage according to Metcalf & Eddy et al. (2007).
About 550 ha of water evaporation ponds downstream the PW wetland cells in NWTP are filled with PW. An evaluation field trial was built to evaluate the feasibility of treated produced water reuse for irrigation using salt tolerant plants with different irrigation systems such as flood and drain versus bubbler irrigation. This Bio-saline agriculture research project was constructed at NWTP on 22 ha scale trial (Stefanakis et al. 2017). The research tested and evaluated produced water stress on perennial species like Acacia nilotica, Acacia ampliceps, Casurina equisetifolia, and Conocarpus lancifolius.
Contamination of PW elements of organic and inorganic pollution has been studied all over the world. However, with treated produced water these minerals would be less than the input flow that received by the wetlands in the initial stage. Toxic elements such as cadmium and lead and trace elements like zinc and copper would be risky for food chain if it’s contaminated in fodder grass. The concentrations of toxic and trace minerals would be acceptable to certain concentration of normal metabolic processes (Ogundiran et al. 2012). The high concentrations of minerals from treated wastewater to forage plants could lead to transfer to ruminants to the animal’s blood and milk. Both animals’ health and the environment infer a need of proper management in order to preserve human health and protect the environment.
2. Materials and Methods
This study was conducted at two locations in Oman: The Sultan Qaboos University (SQU) Agricultural Experiment Station (AES) and the Nimr oil field. The objective was to evaluate the growth and mineral uptake of fodder grass under varying irrigation salinity and soil conditions. A stratified random design with four replications per treatment was used across both sites.
At SQU, 96 pots were irrigated with farm groundwater (TDS ~825 mg/L), produced water (TDS ~6,500–7,000 mg/L), and treated municipal wastewater (TDS ~895 mg/L). Two soil types, control soil and Nimr soil were tested, with biochar and gypsum amendments applied in the produced water treatments. A drip irrigation system ensured consistent water application, and four plant varieties, Panicum, Panicum maximum, Buffelgrass, and Alfalfa were monitored for growth and mineral uptake.
At Nimr, 120 plants were grown in native soil and irrigated with produced water (TDS ~6,500–7,000 mg/L) or ground well water (TDS ~3,000 mg/L). Panicum maximum and Buffelgrass were germinated using reverse osmosis (RO) water and ground well water, while Panicum was directly sown. Drip irrigation was used, and soil and water salinity levels were monitored throughout the experiment.
Plants were harvested at designated intervals with three times at SQU and five at Nimr. Post-harvest, plant samples were dried, ground, labeled, and packed for analysis. Root and soil samples were collected at the end of the experiment, and liquid extracts were prepared for mineral analysis. In total, 512 liquid samples (50 mL) and 634 aliquots (15 mL) were processed.
All samples were analyzed at the Sultan Qaboos University laboratory using Inductively Coupled Plasma Optical Emission Spectrometry (ICP-OES, PerkinElmer) to measure boron, sodium, potassium, calcium, magnesium, and other cations. Statistical analysis was performed using Minitab software, with Analysis of Variance (ANOVA) used to assess the effects of water type, soil type, and amendments on plant growth and mineral accumulation. Results were considered statistically significant at p < 0.05.
2.1. Experimental Setup
Experiment 1 was conducted at Sultan Qaboos University (SQU) Agricultural Experiment Station (AES). This pot-based experiment used two soil types: a well-draining control soil (EC ~1.96 mS/cm, TDS ~1.28 g/L, pH 8.1) and Nimr soil (EC ~12.39 mS/cm, TDS ~8.88 g/L, pH 7.5) collected from southern Oman. Soil moisture content was determined using the gravimetric method, and both soils were mixed with perlite and peat moss to improve drainage and minimize salinity buildup. Soil texture values, particularly sand content, are detailed in Figure 1. and Table 1.
To evaluate soil amendments, agricultural gypsum (46.57% acid- extractable sulfate) and biochar were tested for their effects on plant mineral uptake and soil properties. Biochar was produced from locally grown Buffel- grass using a small pyrolysis unit at SQU-AES, where the grass was heated at 300◦C in an oxygen-free environment for three hours.
Experiment 2: Nimr Field Site Conducted in open field used native Nimr desert soil (EC ~12.39 mS/cm, TDS ~8.88 g/L, pH 7.5). Soil amendments, including perlite and peat moss, were incorporated to enhance drainage and manage salinity.
The setup included 10 drip irrigation lines, each supporting four plant species with three plants per species and four replications per treatment. Two water sources were used: ground well water (TDS ~3.0 g/L, pH 7.2), and produced water (TDS ~6.50 g/L, pH 7.4). The plant varieties—Panicum, Panicum maximum, and Buffelgrass—were grown under these conditions.
Seeds were germinated in a nursery for two weeks before transplanting. Panicum and Buffelgrass were germinated using either reverse osmosis (RO) water 0.25 ppm (TDS ~0.00025 g/L) or ground water 3,000 ppm (TDS ~3.0 g/L), while Panicum maximum was germinated separately in a shade house with farm groundwater. After two weeks, Panicum maximum seedlings were trans- planted to the experimental site to assess the effects of early germination conditions on plant stress.
At the Nimr site, a drip irrigation system with 10 lines was installed, each watering 12 plants. Five lines supplied ground well water (TDS ~3.0 g/L, pH 7.2), while the remaining five delivered PW (TDS ~6.50 g/L, pH 7.4). At the Sultan Qaboos University Agricultural Experiment Station (SQU-AES), six drip irrigation lines were used, each supporting 16 plants. Three water sources were tested: treated wastewater (TDS ~895 mg/L), farm groundwater (TDS ~825 mg/L), and PW (TDS ~6,500–7,000 mg/L).( Figure 2.), (Table 2.).
Produced water contamination leads to the accumulation of minerals in plant leaves, roots, and surrounding soil (Table 3.). Each plant variety responds differently to these minerals, depending on its mineral uptake capacity during irrigation. To assess the effect of produced water on soil health, mineral accumulation in the soil was evaluated both before and after the experiments under different irrigation levels. The influence of produced water on plants and soil was studied by planting different crop species across two experimental sites, comparing the effects of high-salinity produced water with those of lower-salinity irrigation sources, such as ground well water and farm groundwater.
At the Nimr site, an irrigation dripping system was established with 10 drip lines, each irrigating 12 plants. Five of the drip lines supplied ground well water with TDS of ~3.0 g/L and pH of 7.2, while the other five lines delivered produced water with TDS of ~6.50 g/L and pH of 7.4. At the Sultan Qaboos University Agricultural Experiment Station (SQU-AES), three water sources were used: treated wastewater with TDS of ~895 mg/L, farm groundwater with TDS of ~825 mg/L, and produced water with TDS of ~6,500–7,000 mg/L. The SQU-AES experiment employed six drip irrigation lines, each watering 16 plants per line (Table 4.).
The plants at the SQU-AES site were harvested three times during the experiment, while those at the Nimr site were harvested five times. Post-harvest, all plant samples were processed at the Postharvest Laboratory, College of Agricultural and Marine Sciences, Sultan Qaboos University. The harvested samples underwent preparation, including drying, grinding, labeling, and packing, before further analysis.
The study was conducted from July 2020 to May 2021, ensuring sufficient time to observe the long-term effects of produced water on mineral uptake by plants and on soil mineral accumulation. This setup allowed for a comprehensive comparison of the impacts of irrigation water salinity on plant growth, soil health, and mineral dynamics across the two experimental sites.
The accumulation of minerals in plant tissues and soil due to produced water (PW) contamination varies by plant species, depending on their mineral uptake capacity. To assess the impact of PW on soil health, mineral accumulation was analyzed before and after the experiments under different irrigation conditions. The study compared the effects of high-salinity PW with lower salinity irrigation sources, such as ground water and, across two experimental sites.
Plants at SQU-AES were harvested three times, while those at Nimr were harvested five times. After each harvest, samples were processed at the Postharvest Laboratory, College of Agricultural and Marine Sciences, Sultan Qaboos University. Processing included drying, grinding, labeling, and packaging for further analysis as shown in Figure 2.
The study was conducted from July 2020 to May 2021. This provided insights into the long-term effects of PW on soil mineral accumulation and plant mineral uptake. The experimental design enabled a comprehensive comparison of how irrigation water salinity influences plant growth, soil health, and mineral dynamics across the two research sites.
Plant samples were collected monthly from both experimental sites, with three harvests from SQU-AES site and five from Nimr site. At the end of the experiments, soil and root samples were also gathered. Soil samples were taken at two depths (0–15 cm and 15–30 cm) to match the soil profile in pots and plant root depth. All samples underwent chemical preparation and analysis for each harvest cycle.
After harvest, plant leaves were washed with distilled water, oven-dried at 70◦C for 72 hours, and ground into a fine powder. One gram of the powdered sample was digested in nitric acid, heated for 45 minutes, diluted to 50 mL with distilled water, and filtered to remove impurities. The filtration was transferred into 15 mL tubes and sent to the Central Analytical and Applied Research Unit (CAARU) for elemental analysis using an Inductively Coupled Plasma Optical Emission Spectrometer (ICP-OES).
Root samples followed the same preparation steps. Soil samples from both depths were air-dried in the lab, and 300 g subsamples were saturated with distilled water for 24 hours. A 50 mL water extract was then filtered into 15 mL tubes for analysis, following standard salinity measurement methods (Rhoades, 1996).
To maintain consistency, both experiments were calibrated for uniform irrigation. Water was applied three times daily using drip irrigation emitters (50–60 mL/min), with each session lasting 20–30 minutes, providing 1–1.8 liters per plant per day. This precise irrigation management minimized waste while ensuring adequate water supply, allowing for an accurate evaluation of water salinity effects on soil and plant health. The minerals used in both experiment sites are shown in Table 3. And Table 4.
2.2. Experimental Setup
Statistical analyses were performed using analysis of variance (ANOVA) with the Tukey Studentized Range Test method at a 95% confidence level. These tests were applied for mean comparisons to assess the level of significance (P 0.05) across all elements analyzed in plant shoots, roots, and soil samples.
The results, presented in tables and graphs, were used to verify the normality of data distribution and make decisions regarding the null hypothesis, either rejecting or failing to reject it. A significant difference at a probability level of 5% (P < 0.05) was used to compare means. The statistical software Minitab 19 was utilized for data organization and calculations. Data were separated into six sheets: three for Experiment 1 (leaves, soil, and seeds) and three for Experiment 2 (leaves, soil, and roots).
Mineral concentration thresholds for plants and soil were benchmarked against established standards from Alloway (1995) and Kabata-Pendias (1993) and Kabata-Pendias (2000). These references provided limitations for various mineral elements, as summarized in Table 5. In general, mineral levels were categorized as follows:
Calcium (Ca): High at 2,001–4,500 ppm; very high above 4,500 ppm. Sodium (Na): High at 121–160 ppm; very high above 160 ppm.
Potassium (K): High at 120–160 ppm; very high above 160 ppm. Magnesium (Mg): High at levels of 100 ppm or more.
Elemental concentrations in liquid samples, including soil extracts, roots, and plant tissues, were determined using Inductively Coupled Plasma Optical Emission Spectrometer (ICP-OES) by PerkinElmer. For samples with particularly high element concentrations, complementary measurements were performed using a flame photometer. Element concentration calculations were based on the amount of emitted light detected at specific mineral wavelengths. All sample analyses were conducted at the Central Analytical and Applied Research Unit (CAARU) at Sultan Qaboos University. CAARU is certified by QS Zurich AG under certificate number 11825, meeting the ISO 9001:2015 standards for management systems related to the testing of soil and water for mineral and element detection. This certification ensures reliability and accuracy of the analyses performed in this study.
3. Results
Experiment 1 was conducted to evaluate the impact of water salinity levels on plant mineral uptake. The study assessed several factors, including soil type, water salinity levels, harvest number, drip irrigation position, and soil amendments, on both plant and soil mineral concentrations. Elements analyzed in plant, root, and soil extracts included arsenic (As), zinc (Zn), lead (Pb), cobalt (Co), cadmium (Cd), nickel (Ni), iron (Fe), boron (B), mercury (Hg), manganese (Mn), chromium (Cr), copper (Cu), aluminum (Al), sodium (Na), potassium (K), calcium (Ca), and magnesium (Mg). Observations of plant survival and health were documented, but biomass quantification was beyond the scope of this study.
Experiment 2, conducted at a different location, involved plants grown directly in soil without pots. This experiment also introduced germination under varying water salinity levels as an additional factor. The primary focus was on assessing plant mineral uptake due to irrigation water salinity, while secondary factors such as harvest number, plant species, and germination were evaluated for their influence on soil and mineral accumulation.
3.1. Plant Tissue
3.1.1. Site of Experiment 1
The study assessed mineral accumulation in plant leaves over three harvests at the SQU-AES site, considering the effects of irrigation water sources (wastewater, produced water, and groundwater), plant species (Panicum maximum, Panicum, Buffelgrass, and Alfalfa), soil treatments (gypsum, biochar, none), soil types (control vs. Nimr), and drip positions. Key elements analyzed included Boron (B), Zinc (Zn), Iron (Fe), Manganese (Mn), Aluminum (Al), Sodium (Na), Magnesium (Mg), Potassium (K), and Calcium (Ca), with statistical significance determined for each factor and their interactions.
Mineral concentrations varied significantly across harvests, reflecting changes in nutrient uptake. Boron (B) levels increased steadily from 60.4 mg/kg in the first harvest to 126.1 mg/kg in the third (p = 0.018), indicating progressive accumulation. Zinc (Zn) peaked in the second harvest (29.7 mg/kg) before declining (24.7 mg/kg, p = 0.000), while Iron (Fe) spiked in the second harvest (402.1 mg/kg) but decreased in the third (215.3 mg/kg, p = 0.000). Manganese (Mn) levels increased from 47.9 mg/kg in the first harvest to 98.5 mg/kg in the third, highlighting the influence of plant growth stages on nutrient uptake.
Water source had a significant impact on Boron (B) accumulation, with the highest levels recorded in plants irrigated with produced water (150.8 mg/kg) and the lowest in those receiving farm groundwater (55.9 mg/kg, p = 0.004). However, Zn, Fe, and Mn concentrations were largely unaffected by water type (p-values: 0.335, 0.977, and 0.299, respectively).
Plant species exhibited distinct nutrient accumulation patterns. Alfalfa had the highest Boron (B) (146.6 mg/kg), significantly surpassing Buffelgrass (51.6 mg/kg), Panicum (98.1 mg/kg), and Panicum maximum (105.5 mg/kg, p = 0.034). A similar trend was observed for Manganese (Mn), with Alfalfa accumulating the highest levels (106.4 mg/kg) and Buffelgrass the lowest (47.9 mg/kg, p = 0.000). Zinc (Zn) and Iron (Fe) concentrations showed no significant species-dependent variations.
Soil amendments had a moderate influence on mineral uptake. Zinc (Zn) levels were slightly higher in biochar-treated soil (24.8 mg/kg) compared to gypsum-treated (18.0 mg/kg) and untreated soil (20.3 mg/kg), but the differences were not statistically significant (p = 0.229). Iron (Fe) concentrations were highest in gypsum-treated soil (338.2 mg/kg) and lowest in biochar-treated soil (208.7 mg/kg, p = 0.065), suggesting a potential role of amendments in Fe availability.
No significant differences were found between control and Nimr soil for Boron (B), Zinc (Zn), Iron (Fe), or Manganese (Mn) (p > 0.2). However, Fe concentrations were slightly higher in Nimr soil (295.1 mg/kg) than in control soil (238.5 mg/kg).
Macronutrient concentrations also fluctuated across harvests. Aluminum (Al) levels increased from 67.6 mg/kg in the first harvest to 179.4 mg/kg in the second, then dropped to 110.6 mg/kg in the third (p = 0.000). Sodium (Na) peaked in the second harvest (24,634.8 mg/kg), while Magnesium (Mg), Potassium (K), and Calcium (Ca) also showed significant variations (p = 0.000), reflecting changing nutrient availability over time.
Produced water irrigation resulted in significantly higher Sodium (Na) accumulation (23,726.9 mg/kg) compared to wastewater (12,894.3 mg/kg) and farm groundwater (10,627.7 mg/kg), though the difference was not statistically significant (p = 0.092). Magnesium (Mg) was highest in plants irrigated with farm groundwater (2,015.4 mg/kg) and lowest in those receiving wastewater (337.2 mg/kg, p = 0.005). Potassium (K) and Calcium (Ca) levels remained stable across water treatments.
Plant species differed in macronutrient uptake. Panicum maximum and Alfalfa accumulated the most Sodium (Na) (21,991.5 mg/kg and 13,683.7 mg/kg, respectively), while Buffelgrass had lower levels (13,114.0 mg/kg). Potassium (K) concentrations were highest in Alfalfa (10,004.0 mg/kg) fol- lowed by Panicum maximum (8,167.7 mg/kg, p = 0.045), while Alfalfa also showed significantly higher Calcium (Ca) levels (9,659.9 mg/kg, p = 0.001), indicating a greater capacity for macronutrient absorption.
Biochar treated soil resulted in the highest Sodium (Na) levels (19,453.3 mg/kg), whereas untreated soil had the lowest (12,326.0 mg/kg), though this was not statistically significant (p = 0.513). Magnesium (Mg) was highest in untreated soil (1,672.6 mg/kg) compared to gypsum-treated soil (685.9 mg/kg, p = 0.101), while Potassium (K) and Calcium (Ca) remained stable across soil treatments.
Significant interactions were found between harvest time, species, and water sources. Sodium (Na) accumulation varied by water source across harvests (p = 0.001), suggesting irrigation effects changed over time. A strong interaction between species and water source was observed for Magnesium (Mg) uptake (p = 0.001), indicating species-specific responses to irrigation water salinity.
3.1.2. Site of Experiment 2
Mineral concentrations in plant leaves varied significantly across harvests, reflecting dynamic nutrient uptake. Zinc (Zn) and Iron (Fe) peaked in the second harvest (43.7 mg/kg and 260.8 mg/kg, respectively) before declining, while Boron (B) accumulated progressively, reaching 211.0 mg/kg in the third harvest. Manganese (Mn) remained stable (p = 0.137). These trends suggest that Zn, Fe, and B uptake depend on plant growth stages and soil nutrient availability, with potential depletion in later harvests.
Water source significantly affected Boron (B) and Manganese (Mn) accumulation. Boron levels were higher in plants irrigated with produced water (186.7 mg/kg) compared to ground well water (90.7 mg/kg, p = 0.000), suggesting greater bioavailability in PW-irrigated soils. Conversely, Manganese (Mn) levels were higher in plants receiving ground well water (55.3 mg/kg) than those irrigated with produced water (73.4 mg/kg, p = 0.002), indicating species-specific uptake responses.
Plant species influenced nutrient absorption. Buffelgrass accumulated the highest Zinc (Zn) levels (41.9 mg/kg, p = 0.000), while Panicum had the highest Boron (B) concentrations (192.8 mg/kg, p = 0.000). Manganese (Mn) uptake was lowest in Buffelgrass (41.6 mg/kg), whereas Panicum max and Panicum had similar levels, highlighting species-dependent nutrient preferences.
Germination conditions affected Zinc (Zn) accumulation, with plants germinated of ground water conditions showing the highest Zn levels (39.3 mg/kg, p = 0.02). However, Fe, B, and Mn concentrations remained unaffected, indicating minimal long-term impact of early growth conditions on mineral uptake.
Macronutrient analysis revealed dynamic shifts over time. Sodium (Na) declined across harvests, from 26,780.2 mg/kg in the first harvest to 19,745.4 mg/kg in the second (p = 0.667), while Potassium (K) peaked in the second harvest (26,955.6 mg/kg) and declined in later harvests (p = 0.005). Aluminum (Al), Magnesium (Mg), and Calcium (Ca) showed minor fluctuations but remained stable.
Produced water irrigation significantly increased Aluminum (Al) and Calcium (Ca) accumulation. Al concentrations were higher in plants irrigated with produced water (117.1 mg/kg) compared to ground well water (85.6 mg/kg, p = 0.004), while Calcium (Ca) was also elevated (11,037.0 mg/kg vs. 8,240.5 mg/kg, p = 0.045). Magnesium (Mg) and Potassium (K) were unaffected by water sources.
Among plant species, Panicum had the highest Magnesium (Mg) accumulation (5,892.7 mg/kg, p = 0.002), while Buffelgrass accumulated the most Sodium (Na) (30,933.8 mg/kg) and Potassium (K) (26,013.0 mg/kg, p = 0.028), suggesting its resilience to high-salinity irrigation. Germination methods had no significant impact on Al, Mg, Ca, Na, or K accumulation (p > 0.1). Significant interactions were observed between harvest time, species, and water source. Zinc (Zn) and Iron (Fe) uptake varied across harvests depending on irrigation source (p = 0.002 and p = 0.000, respectively), while species- water interactions influenced Magnesium (Mg) accumulation (p = 0.019), indicating species-specific responses to irrigation sources.
3.2. Plant Roots
3.2.1. Site of Experiment 2
During the final harvest, mineral composition in plant roots was assessed based on water source (wastewater, produced water, farm groundwater), plant species (Panicum max, Panicum, Buffelgrass, Alfalfa), soil treatments (gyp- sum, biochar, none), soil type (control vs. Nimr), and drip positions. Key elements measured included Boron (B), Zinc (Zn), Cobalt (Co), Nickel (Ni), Iron (Fe), Manganese (Mn), Calcium (Ca), Aluminum (Al), Sodium (Na), Potassium (K), and Magnesium (Mg).
Water sources affected mineral accumulation, though not all changes were significant. Produced water irrigation led to the highest Boron (71.1 mg/kg), while wastewater increased Iron (1,767.9 mg/kg) and Manganese (325.1 mg/kg) levels (p < 0.05). Calcium was highest in wastewater-irrigated plants (15,933.4 mg/kg, p = 0.036), suggesting different water sources influence specific nutrient uptake.
Plant species played a major role in root mineral composition. Alfalfa accumulated the most Boron (171.0 mg/kg, p = 0.005) and Calcium (32,367.4 mg/kg, p = 0.000), while Panicum had the highest Zinc levels (0.6 mg/kg, p = 0.007). Sodium (Na), Potassium (K), and Cobalt (Co) showed no significant variation across species.
Soil amendments had minimal impact, except for Calcium, which was highest in gypsum-treated soil (16,248.0 mg/kg, p = 0.018). Soil type, however, significantly influenced Boron and Calcium accumulation, with Nimr soil supporting higher levels of both (p < 0.005).
The highest root mineral concentrations at final harvest were Wastewater: Zn (1.43 mg/kg), Fe (2,348.5 mg/kg), Mn (649 mg/kg), Al (1,088.5 mg/kg) Produced Water: B (342.5 mg/kg), Na (58,421.5 mg/kg) (Figure 3.), K (6,158 mg/kg), Ca (55,647 mg/kg), Groundwater: Mg (8,924.5 mg/kg)
Figure 3.
Overall effect of irrigation water and factors treatment on plant root concentration of Sodium. 1: Replicate 1, 2: Replicate 2, 3: Replicate 3, 4: Replicate 4, WW: Wastewater, PW: Produced water, FW: Ground water pmax: Panicum Maximum, p: Panicum, b: Buffelgrass and Alfa: Alfalfa.
Figure 3.
Overall effect of irrigation water and factors treatment on plant root concentration of Sodium. 1: Replicate 1, 2: Replicate 2, 3: Replicate 3, 4: Replicate 4, WW: Wastewater, PW: Produced water, FW: Ground water pmax: Panicum Maximum, p: Panicum, b: Buffelgrass and Alfa: Alfalfa.
Figure 3.
Overall effect of irrigation water and factors treatment on plant top layer soil concentration of Sodium. 1: Replicate 1, 2: Replicate 2, 3: Replicate 3, 4: Replicate 4, WW: Wastewater, PW: Produced water, FW: Ground water pmax: Panicum.
Figure 3.
Overall effect of irrigation water and factors treatment on plant top layer soil concentration of Sodium. 1: Replicate 1, 2: Replicate 2, 3: Replicate 3, 4: Replicate 4, WW: Wastewater, PW: Produced water, FW: Ground water pmax: Panicum.
Drip position significantly affected Zinc accumulation (p = 0.035), while species-soil and species-water interactions influenced Boron and Zinc uptake (p = 0.005). Other interactions had no significant effects.
3.2.2. Site of Experiment 2
Water source significantly affected Zinc (Zn) and Copper (Cu) uptake in plant roots. Plants irrigated with ground well water had higher Zn levels (51.5 mg/kg) compared to those receiving produced water (17.1 mg/kg, p = 0.003). Conversely, Cu was more concentrated in plants irrigated with produced water (4.5 mg/kg) than ground well water (4.0 mg/kg, p = 0.008). Other elements, including Nickel (Ni), Iron (Fe), and Boron (B), showed no significant differences across water sources (p > 0.2), indicating selective mineral uptake influenced by irrigation water.
The highest root mineral concentrations at final harvest were on ground Water: Zn (82.0 mg/kg), Mn (75.0 mg/kg), Mg (3,961.5 mg/kg), K (3,037.5 mg/kg) , and Produced Water: Ni (7.5 mg/kg), Fe (518.0 mg/kg), B (30.5 mg/kg), Cu (5.0 mg/kg), Al (458.0 mg/kg), Ca (10,819.5 mg/kg), Na (40,341.0 mg/kg).
These findings suggest that produced water enhances Cu, Al, Fe, B, Na, and Ca accumulation, while ground well water promotes Zn, Mn, Mg, and K uptake.
Plant species significantly influenced Zn and Cu levels but had little effect on Ni, Fe, and B. Panicum max accumulated the highest Zn (51.5 mg/kg, p = 0.008), while Panicum had the highest Cu (4.7 mg/kg, p = 0.006). Other elements remained stable across species, indicating that Zn and Cu uptake is species-dependent, while external conditions primarily influence other minerals.
Water source influenced macronutrient uptake, with K levels higher in ground well water-irrigated plants (2,210.9 mg/kg) than those irrigated with produced water (1,020.4 mg/kg, p = 0.065). Sodium (Na) was more abundant in plants irrigated with produced water (20,579.9 mg/kg) than ground well water (10,313.9 mg/kg, p = 0.125), indicating that salinity may affect Na and K uptake without significantly altering other macronutrients.
Zn and Cu accumulation showed significant interaction effects between water source and plant species (p = 0.022 and p = 0.002, respectively), suggesting species respond differently to irrigation treatments. However, for Ni, Fe, and B, no significant interactions were observed, indicating independent influences of plant species and water source on mineral composition.
3.3. Plant Soil
3.3.1. Site of Experiment One
Water sources significantly influenced soil mineral composition. Produced water had the highest levels of Fe (0.1 mg/kg), B (5.9 mg/kg), and Al (0.24 mg/kg) (p 0.039), while farm groundwater and wastewater contained lower concentrations. Na, K, Ca, and Mg also varied notably. Produced water had significantly higher Na (32,256.3 mg/kg) than wastewater (6,611.7 mg/kg) and farm groundwater (6,886.9 mg/kg) (p = 0.000). Similarly, it contained the highest K (265.0 mg/kg), Ca (640.7 mg/kg), and Mg (131.7 mg/kg) (p 0.008), suggesting that produced water contributes to greater mineral accumulation in soil.
Soil depth had a moderate effect, with Fe levels remaining unchanged, while B was slightly higher in the topsoil. Al and Na concentrations were significantly higher in the bottom and top layers, respectively. Plant species had a minimal impact on Fe, B, and Al but influenced Na, K, Ca, and Mg levels. Panicum max had the highest Mg (152.6 mg/kg), while Buffel had the lowest (51.6 mg/kg, p = 0.002).
Biochar-treated soil had higher Fe (0.12 mg/kg) than gypsum-treated (0.019 mg/kg) and untreated soils (0.08 mg/kg) (p = 0.017). Gypsum treatment increased Ca (761.6 mg/kg) compared to untreated soil (235.1 mg/kg) (p = 0.000). Nimr soil had significantly higher Na (19,676.6 mg/kg) and K (176.2 mg/kg) than control soil (p 0.027), though Mg was slightly higher in control soil (p = 0.018).
Water source and soil depth significantly influenced Na (p = 0.002), while plant species and water sources affected K concentration (p = 0.000). However, most interactions were not statistically significant, indicating that these factors operated independently.
3.3.2. Site of Experiment 2
Water sources played a major role in soil mineral concentrations. Produced water had significantly higher Boron (5.0 mg/kg vs. 1.9 mg/kg, p = 0.001), Magnesium (1155.2 mg/kg vs. 552.4 mg/kg, p = 0.015), and Sodium (13,112.5 mg/kg vs. 5,548.7 mg/kg, p = 0.064) (Figure 4. And Figure 5.) compared to ground well water. However, Zn, Ni, Fe, Mn, Cu, and Al showed no significant differences between the two sources.
Soil depth significantly affected certain minerals. While Zn, Ni, and Fe levels remained stable, Boron (0.17 mg/kg vs. 0.07 mg/kg, p = 0.002) and Manganese (0.91 mg/kg vs. 0.42 mg/kg, p = 0.002) were higher in the topsoil. Major nutrients such as Mg, Ca, K, and Na were also more concentrated in the top layer (p 0.044), suggesting greater accumulation at shallower depths.
Across Panicum max, Panicum, and Buffel, plant species had no significant influence on Zn, Ni, Fe, B, Mn, Cu, Al, Mg, Ca, K, or Na concentrations (p 0.355), indicating that mineral levels remained stable regardless of vegetation type.
3.4. Plant Tissues and Roots Minerals Uptake
In experiment 1 there were variations on elements uptake from the roots and plants shoot on the tested plants. Zinc, Manganese, Sodium, Calcium and Magnesium showed almost similar amounts of concentrations on both plants shoots and roots. Alfalfa showed an indication of Calcium uptakes in plants shoot with all water irrigation levels compared to other plants species. On other hand, Aluminum showed an increase in roots concentration than the shoots with all levels of water irrigation. Moreover, results showed that Aluminum and Iron were higher in plant roots than shoots.
Experiment 2 showed variances as well on elements uptake of plants roots and shoot on the tested plants. Zinc and Copper showed almost comparable amounts of concentrations on both plants shoots and roots. However, Boron, Manganese, Magnesium, Sodium, Potassium and Calcium exposed a higher minerals concentration on plants shoot than the roots due to the cycle of nutrients’ uptake. This accumulation leads to a reduction in plant development. Moreover, all these shoots’ minerals increase were with plants irrigated with produced water except the potassium where the increase was with ground Well Water more than the produced water. Aluminum and Iron showed a similar behavior on balance concentrations of plants shoots and leaves that seen in experiment one.
Soil top/bottom minerals accumulation
As experiment 1 was done in pots, the concentration of minerals in all of the detected minerals on soil top and bottom layer was almost same. However, the biochar pots indicated a reduction of Boron on soil top layer samples compared to the lower part (Figure 5. And Figure 6.). Moreover, the addition of gypsum in soil had increased the Calcium concentration on top part of soil layer comparing to other soils samples that is due to the content of Calcium in the gypsum as Calcium sulphate dihydrate (CaSO4.2H2O). Nevertheless, all minerals accumulated higher than the original sample concentration with the use of produced water irrigation. Though, soils irrigated with ground water showed an increase in Magnesium comparing to other irrigation water Levels and to original soil concentration. There was overall a reduction indication of potassium concentration on sample soils with ground water and wastewater comparing to produced water on soil layers due to soil degradation, salinity and sodicity as seen with Šimůnek et al., (1996) research.
The top soil samples was taken from 0-15 cm and the bottom soil was taken between 15-30cm in both experiments. Experiment 2 was in open soil, the concentration of minerals on both soil layers of Calcium, Nickel, Aluminum, Copper, and Zinc was almost close with some variations. However, the minerals concentration was higher on top layer soil with Iron, Boron, Manganese, Magnesium, Sodium and Potassium. Though, soils irrigated with produced water showed an increase more than soils irrigated with well water in both soil layers in concentrations of Boron, Magnesium, Sodium and Potassium.
n both experiments, plants absorbed minerals differently in roots and shoots. Zinc, manganese, sodium, calcium, and magnesium showed similar levels, while aluminum accumulated in roots. Alfalfa had higher calcium uptake in shoots. Produced water increased most minerals in shoots, stunting growth, except potassium, which was higher with well water. Aluminum and iron showed consistent patterns (Figure 7, Figure 8 and Figure 9).
The results of this study provide significant insights into the impact of different water sources, soil types, and plant species on mineral accumulation in plant tissues and soil. The findings highlight the role of produced water and ground water in altering soil chemistry and plant nutrient uptake, with potential implications for plant growth, soil health, and environmental sustainability (Table 6).
The results from Nimr reeds, which naturally grow under produced water irrigation, revealed high concentrations of iron (Fe), aluminum (Al), and alkali elements such as sodium (Na) and potassium (K). However, these concentrations remained within acceptable limits, suggesting that certain plant species have developed a tolerance to high-salinity conditions. Comparing these results to experimental plants grown under controlled irrigation, it is evident that mineral accumulation in plant shoots was significantly influenced by water quality. Produced water irrigation resulted in elevated levels of sodium, boron (B), magnesium (Mg), and potassium in both plant tis- sues and soil, aligning with previous studies indicating that saline irrigation contributes to soil salinization and nutrient imbalances (Kabata-Pendias, 1993).
While most soil mineral concentrations remained within permissible limits before irrigation, post-experiment results indicated a substantial increase in sodium, manganese (Mn), and potassium levels in the Nimr soil compared to control soil. This suggests that continuous irrigation with produced water leads to soil degradation over time, with a notable sixfold increase in total dissolved solids (TDS) observed in Nimr soil. This accumulation of alkali elements can have long-term effects on soil structure, permeability, and plant nutrient availability, which may ultimately reduce soil productivity.
A critical finding from this study was the excessive sodium and boron concentrations in produced water, exceeding the maximum allowable limits set by Oman’s treated wastewater standards (Oman Ministerial Decree 145/1993 and Royal Decree 115/2011). High sodium levels, particularly in ground well water used in Experiment 2, pose a risk of soil sodicity, which can disrupt soil aggregation, reduce water infiltration, and negatively impact plant root development. Previous research has shown that prolonged exposure to high sodium levels can alter ion uptake in plants, leading to nutrient imbalances and physiological stress (Rengasamy, 2010).
The accumulation of boron in plant tissues also raises concerns, especially if these plants are intended for livestock feed. While boron is an essential micronutrient, excessive levels can be toxic, affecting plant growth and reducing biomass production (Nable et al. 1997 , Reid et al. 2013). Further research is needed to evaluate the potential implications of high boron accumulation on plant metabolism and its transfer within the food chain.
By the end of both experiments, soil mineral concentrations remained within permissible limits; however, the excessive accumulation of sodium, magnesium, potassium, and calcium in soil layers exposed to produced water irrigation suggests the onset of soil degradation. Notably, the final harvest stages of the experiment showed a decline in plant growth, particularly in plots exposed to high-salinity irrigation. This aligns with studies indicating that soil salinization can reduce plant nutrient uptake efficiency, inhibit photosynthesis, and ultimately lead to yield losses (Munns & Tester, 2008, Munns et al. 2020).
Additionally, while most elements in plant tissues remained below toxic thresholds, the significant accumulation of alkali elements in plant shoots suggests potential risks for both plant productivity and ecosystem health. The elevated levels of sodium, magnesium, potassium, and calcium in plant tissues could alter metabolic functions and stress tolerance mechanisms, warranting further investigation into the long-term impacts of irrigation with produced water.
4. Conclusions
This study provides essential insights into the effects of treated oilfield produced water (PW) on soil quality, plant mineral uptake, and overall agricultural sustainability in arid environments. While heavy elements such as arsenic (As), cadmium (Cd), lead (Pb), chromium (Cr), and mercury (Hg) were undetected in plant tissues and soil extracts, copper (Cu) was present at low concentrations (maximum 9.5 mg/kg) and remained below standard regulatory limits (Alloway, 1995). The results suggest that while PW-treated irrigation does not introduce harmful heavy metal contamination, its high salinity and mineral content pose challenges for long-term soil and crop health.
Buffelgrass was the most resilient among the evaluated species, successfully with- standing both water and soil salinity stress across multiple harvests. However, continuous monitoring of plant growth, mineral uptake, and soil contamination is necessary to assess the progressive impact of PW irrigation. Soil electrical conductivity (EC) exceeded 15.5 dS/m in multiple samples, indicating a substantial increase in salinity, which led to a reduction in biomass yield and soil structure stability. These findings underscore the complex interactions between irrigation water quality, soil properties, and plant health, necessitating integrated water management strategies to prevent soil degradation.
Although PW reuse presents a valuable opportunity for water-scarce regions like Oman, long-term sustainability requires careful salinity management to mitigate risks such as sodification, high sodium accumulation, and reduced soil fertility. Increased irrigation volumes can help leach excess salts from the root zone, but this approach leads to water loss, making efficient drainage and irrigation practices critical for balancing water reuse with soil conservation. The observed increase in sodium levels in both soil and plant tissues highlights the need for targeted soil amendments and adaptive irrigation techniques to minimize negative impacts.
Globally, PW reuse has been explored in various locations, but most studies involve either dilution with freshwater or integration with desalination. Moreover, the use of PW for food crops remains restricted due to regulatory limitations. This study provides a foundational dataset for evaluating PW irrigation in cropland applications, highlighting both opportunities and challenges in soil mineral dynamics and plant nutrient uptake. Further research is necessary to assess the broader ecological and economic feasibility of PW reuse, particularly in remote arid regions where conventional freshwater resources are scarce.
Given the lack of established regulatory thresholds for heavy or toxic elements in Omani soils and plants, the detected mineral concentrations were compared to international safety standards (Kabata-Pendias, 1993). The findings indicate that while PW can serve as a supplemental irrigation resource, long-term accumulation of boron, sodium, and other salts requires proactive management. Reed grass (Phragmites australis), currently used in Nimr’s constructed wetlands for PW treatment, presents a promising nature-based solution for soil remediation due to its high biomass output and tolerance to salinity and water stress.
Overall, this study reinforces the importance of integrating sustainable irrigation practices with advanced soil and water management strategies. The excessive boron and sodium levels observed highlight the need for improved irrigation scheduling, soil amendments, and adaptive land-use planning to mitigate long-term degradation risks. Future research should focus on developing optimized irrigation frameworks, exploring bio-based soil enhancers, and assessing the role of PW-treated ecosystems in circular water management. These findings contribute to ongoing efforts in sustainable water reuse, balancing resource efficiency with environmental protection in arid and water-scarce regions.
Future Research Directions
This study highlights the need for further research to assess the long-term impacts of produced water (PW) irrigation on soil health, plant productivity, and ecosystem stability. Key areas for future investigation include:
Soil Remediation Strategies: Optimizing soil management practices, such as gypsum, biochar, and organic amendments, to mitigate sodium and boron accumulation, enhance soil structure, and improve water retention.
Salt-Tolerant Crop Development: Identifying resilient plant species and genetic traits that enhance productivity under saline irrigation, with a focus on nature-based solutions (NBS) for sustainable agriculture.
Food Safety and Human Health Risks: Evaluating the accumulation of alkali elements and heavy metals in crops and their implications for animal feed and human consumption, while developing safe reuse guidelines.
Microbial and Soil Health Dynamics: Investigating how prolonged PW irrigation alters soil microbiota, nutrient cycling, and overall fertility to support long-term land productivity.
Sustainable Water Management and Policy: Establishing long-term monitoring programs to assess environmental trade-offs and economic feasibility, informing evidence-based policies for PW reuse in agriculture.
Addressing these research gaps will advance sustainable irrigation practices, ensuring a balance between water reuse efficiency, soil conservation, and ecosystem resilience in arid and water-scarce regions.
Author Contributions
Material preparation, data collection, and first analysis were performed by Khaled AlJbari. Mushtaque Ahmed and Rhonda R. Janke contributed to the first analysis. Ahmed Al-Busaidi and Alexandros Stefanakis contributed to the statistical analysis of the result. The experimental setup and design were established by Khaled A, Rhonda R. Janke and Ahmed Al-Busaidi. The first draft of the manuscript was written by Khaled A. Mushtaque Ahmed and Alexandros Stefanakis revised the first draft. All authors commented on the second and third versions of the manuscript. All authors read and approved of the final manuscript. All authors have read and agreed to the published version of the manuscript
Funding
This research received no external funding
Data Availability Statement
The datasets used and/or analyzed during the current study are available from the corresponding author upon reasonable request.
Acknowledgments
The authors thank the university and laboratory staff for their valuable support, resources, and guidance throughout this research.
Conflicts of Interest
The authors have no relevant financial or non-financial interests to disclose.
References
- Al-Ajmi, D. N. (2018). Climate aridity: the Sultanate of Oman as a case study. Int. J. Earth Sci. Geol, 1, 1-3. [CrossRef]
- Asch F, Dingkuhn M, Dörffling K, Miezan K (2000) Leaf K/Na ratio predictssalinity induced yield loss in irrigated rice. Euphytica 113, 109–118. [CrossRef]
- Atherton, J. G. (2011). Health and environmental aspects of recycled water. Biotechnology X, Encyclopedia of Life Support Systems (EOLSS), Developed under the Auspices of the UNESCO, Eolss Publishers, Oxford, UK, 138.
- Chen, Y., Jiang, Z., Wu, D., Wang, H., Li, J., Bi, M., & Zhang, Y. (2019). Development of a novel bio-organic fertilizer for the removal of atrazine in soil. Journal of environmental management, 233, 553-560.
- Elfanssi, S., Ouazzani, N., & Mandi, L. (2018). Soil properties and agro-physiological responses of alfalfa (Medicago sativa L.) irrigated by treated domestic wastewater. Agricultural water management, 202, 231-240.
- Ibarra-F, F. A., Cox, J. R., Martin-R, M. H., Crowl, T. A., & Call, C. A. (1995). Predicting buffelgrass survival across a geographical and environmental gradient. Rangeland Ecology & Management/Journal of Range Management Archives, 48(1), 53-59. [CrossRef]
- Kabata-Pendias, A. (2000). Trace elements in soils and plants. CRC press.
- Keating, B. A., Carberry, P. S., Bindraban, P. S., Asseng, S., Meinke, H., & Dixon, J. (2010). Eco-efficient agriculture: Concepts, challenges, and opportunities. Crop science, 50, S-109.
- Metcalf & Eddy. 2007. Water reuse. Issues, technologies, and applications.McGraw-Hill Publisher, New York.
- Ogundiran, M. B., Ogundele, D. T., Afolayan, P. G., & Osibanjo, O. (2012). Heavy metals levels in forage grasses, leachate and lactating cows reared around lead slag dumpsites in Nigeria. International Journal of Environmental Research, 6(3), 695-702.
- Rengasamy P (2006) World salinization with emphasis on Australia. Journalof Experimental Botany 57, 1017–1023. [CrossRef]
- Stefanakis, A. I., Al-Hadrami, A., & Prigent, S. (2017). Reuse of oilfield produced water treated in a Constructed Wetland for saline irrigation under desert climate. In 7th International Symposium on Wetland Pollutant Dynamics and Control (WETPOL), Montana, USA (pp. 21-25).
- Stefanakis, A. I., Al-Hadrami, A., & Prigent, S. (2017). Treatment of produced water from oilfield in a large Constructed Wetland: 6 years of operation under desert conditions. In Proceedings, 7th International Symposium for Wetland Pollutant Dynamics and Control (WETPOL), Montana, USA (pp. 21-25).
- Suyama H, Benes S, Robinson P, Grattan S, Grieve C, Getachew G (2007)Forage yield and quality under irrigation with saline-sodic drainagewater: Greenhouse evaluation. Agricultural Water Management 88,159–172. [CrossRef]
- Šimůnek, J., Suarez, D. L., & Šejna, M. (1996). The UNSATCHEM software package for simulating one-dimensional variably saturated water flow, heat transport, carbon dioxide production and transport, and multicomponent solute transport with major ion equilibrium and kinetic chemistry. Res. Rep, 141, 186.
- Ward, J. P., Smith, S. E., & McClaran, M. P. (2006). Water requirements for emergence of buffelgrass (Pennisetum ciliare). Weed Science, 54(4), 720-725. [CrossRef]
- Marshall, V. M., Lewis, M. M., & Ostendorf, B. (2012). Buffel grass (Cenchrus ciliaris) as an invader and threat to biodiversity in arid environments: a review. Journal of Arid Environments, 78, 1-12. [CrossRef]
- Li, W., Shan, R., Fan, Y., & Sun, X. (2021). Effects of tall fescue biochar on the adsorption and desorption of atrazine in different types of soil. Environmental Science and Pollution Research, 28, 4503-4514. [CrossRef]
- A. I. Stefanakis, A. Al-Hadrami, S. Prigent, Treatment of produced water from oilfield in a large Constructed Wetland: 6 years of operation under desert conditions, in: Proceedings, 7th International Symposium for Wetland Pollutant Dynamics and Control (WETPOL), 2017, pp. 21–25.
- Al-Ajmi, D. N. (2018). Climate aridity: the Sultanate of Oman as a case study. Int. J. Earth Sci. Geol, 1, 1-3. [CrossRef]
- Al-Ajmi, D. N., Idrees, A. M., & Al-Hatrushi, S. M. (2013). Spatial and temporal analysis of recurrence time of rainfall in the Sultanate of Oman. British Journal of Arts and Social Sciences, 12(1), 118-26.
- Alloway, B. J. (1995). Heavy metals in soils.,(Blackie Academic and Professional: London). Heavy Metals in Soils. Blackie Academic and Professional, London.
- Kabata-Pendias, A. (1993). Behavioural properties of trace metals in soils. Applied geochemistry, 8, 3-9. [CrossRef]
- Nable, R. O., Bañuelos, G. S., & Paull, J. G. (1997). Boron toxicity. Plant and soil, 193, 181-198.
- Reid, R. J. (2013). Boron toxicity and tolerance in crop plants. Crop improvement under adverse conditions, 333-346.
- Munns, R., & Tester, M. (2008). Mechanisms of salinity tolerance. Annu. Rev. Plant Biol., 59(1), 651-681. [CrossRef]
- Munns, R., Day, D. A., Fricke, W., Watt, M., Arsova, B., Barkla, B. J., ... & Tyerman, S. D. (2020). Energy costs of salt tolerance in crop plants. New Phytologist, 225(3), 1072-1090. [CrossRef]
- D. Atoufi, H., & Lampert, D. J. (2020). Impacts of oil and gas production on contaminant levels in sediments. Current pollution reports, 6, 43-53.
- Pichtel, J. (2016). Oil and gas production wastewater: Soil contamination and pollution prevention. Applied and environmental soil science, 2016(1), 2707989. [CrossRef]
Figure 1.
Experiment 1 design of the study.
Figure 2.
Experimental workflow for harvest stages and laboratory preparation, including sample collection, processing, and elemental analysis.
Figure 2.
Experimental workflow for harvest stages and laboratory preparation, including sample collection, processing, and elemental analysis.
Figure 4.
Overall effect of irrigation water and factors treatment on plant Bottom layer soil concentration of Sodium. 1: Replicate 1, 2: Replicate 2, 3: Replicate 3, 4: Replicate 4, WW: Wastewater, PW: Produced water, FW: Ground water pmax: Panicum Maximum, p: Panicum, b: Buffelgrass and Alfa: Alfalfa.
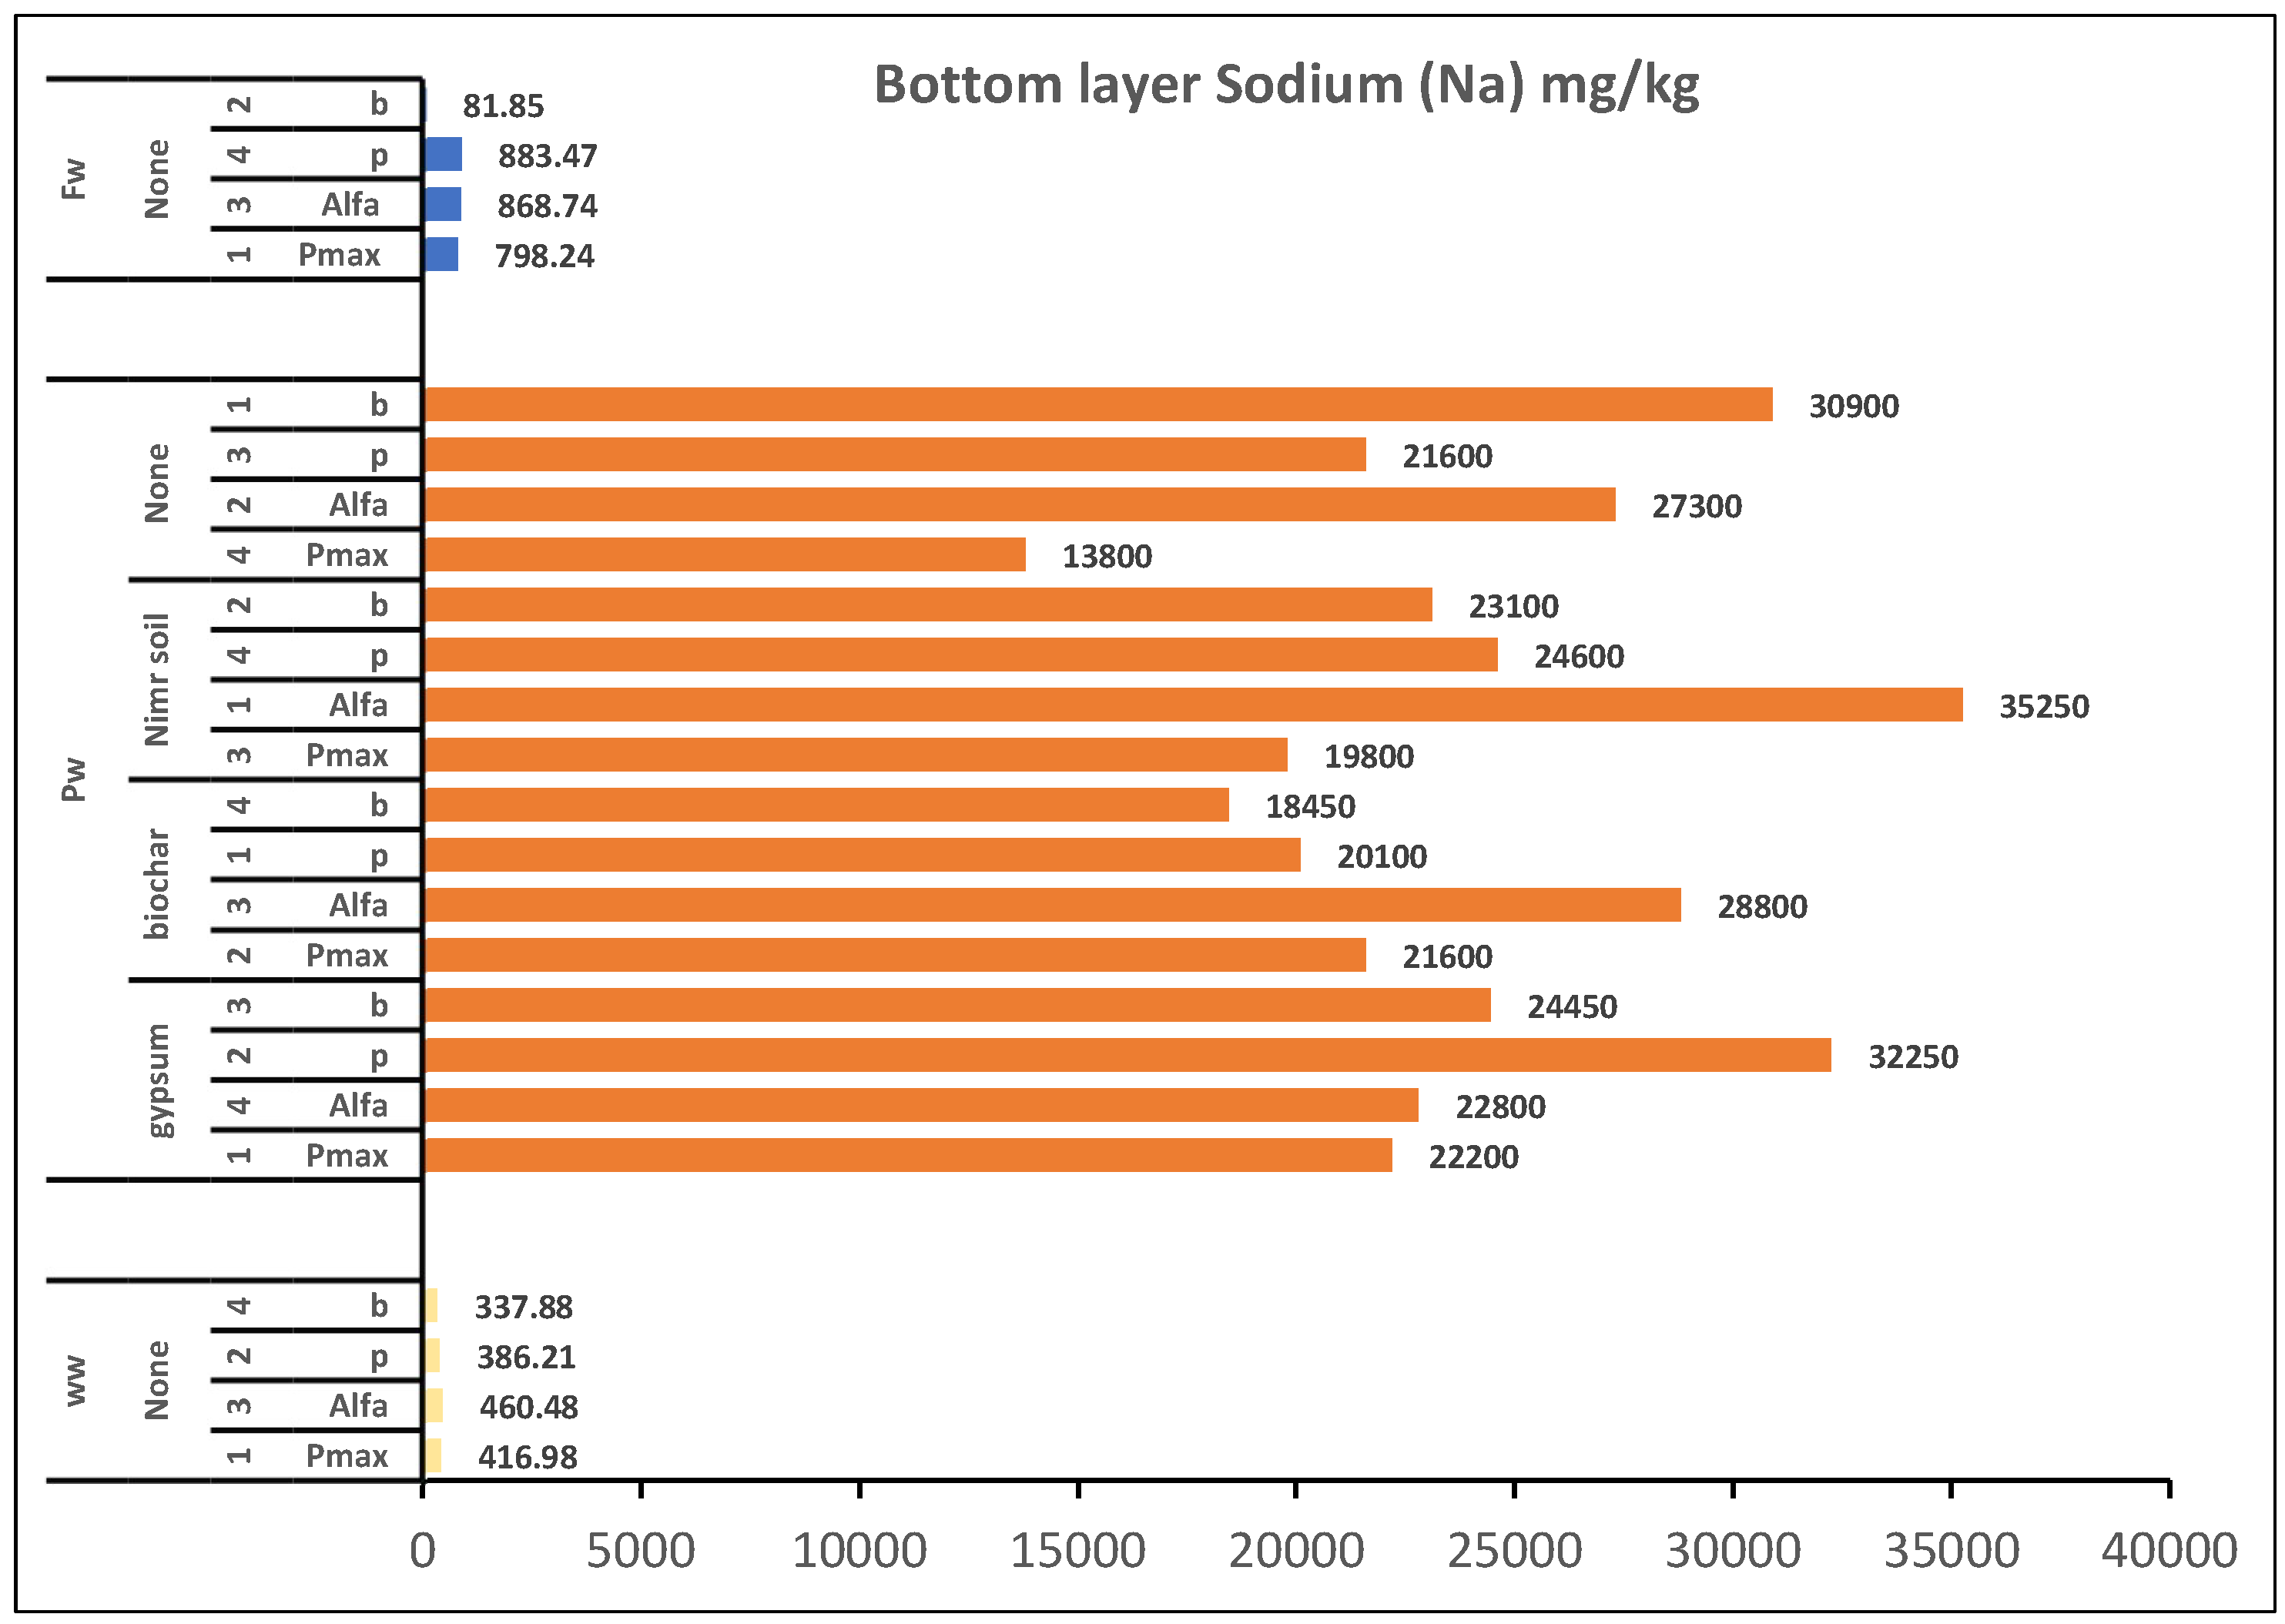
Figure 5.
Overall effect of irrigation water Levels and factors treatment on plant top and bottom soil concentration of Boron, well: Ground Water, PW: produced water, pmax: Panicum Maximum, p: Panicum, b: Buffelgrass, N: No germination, R:RO water germination and W: ground Well Water germination.
Figure 5.
Overall effect of irrigation water Levels and factors treatment on plant top and bottom soil concentration of Boron, well: Ground Water, PW: produced water, pmax: Panicum Maximum, p: Panicum, b: Buffelgrass, N: No germination, R:RO water germination and W: ground Well Water germination.
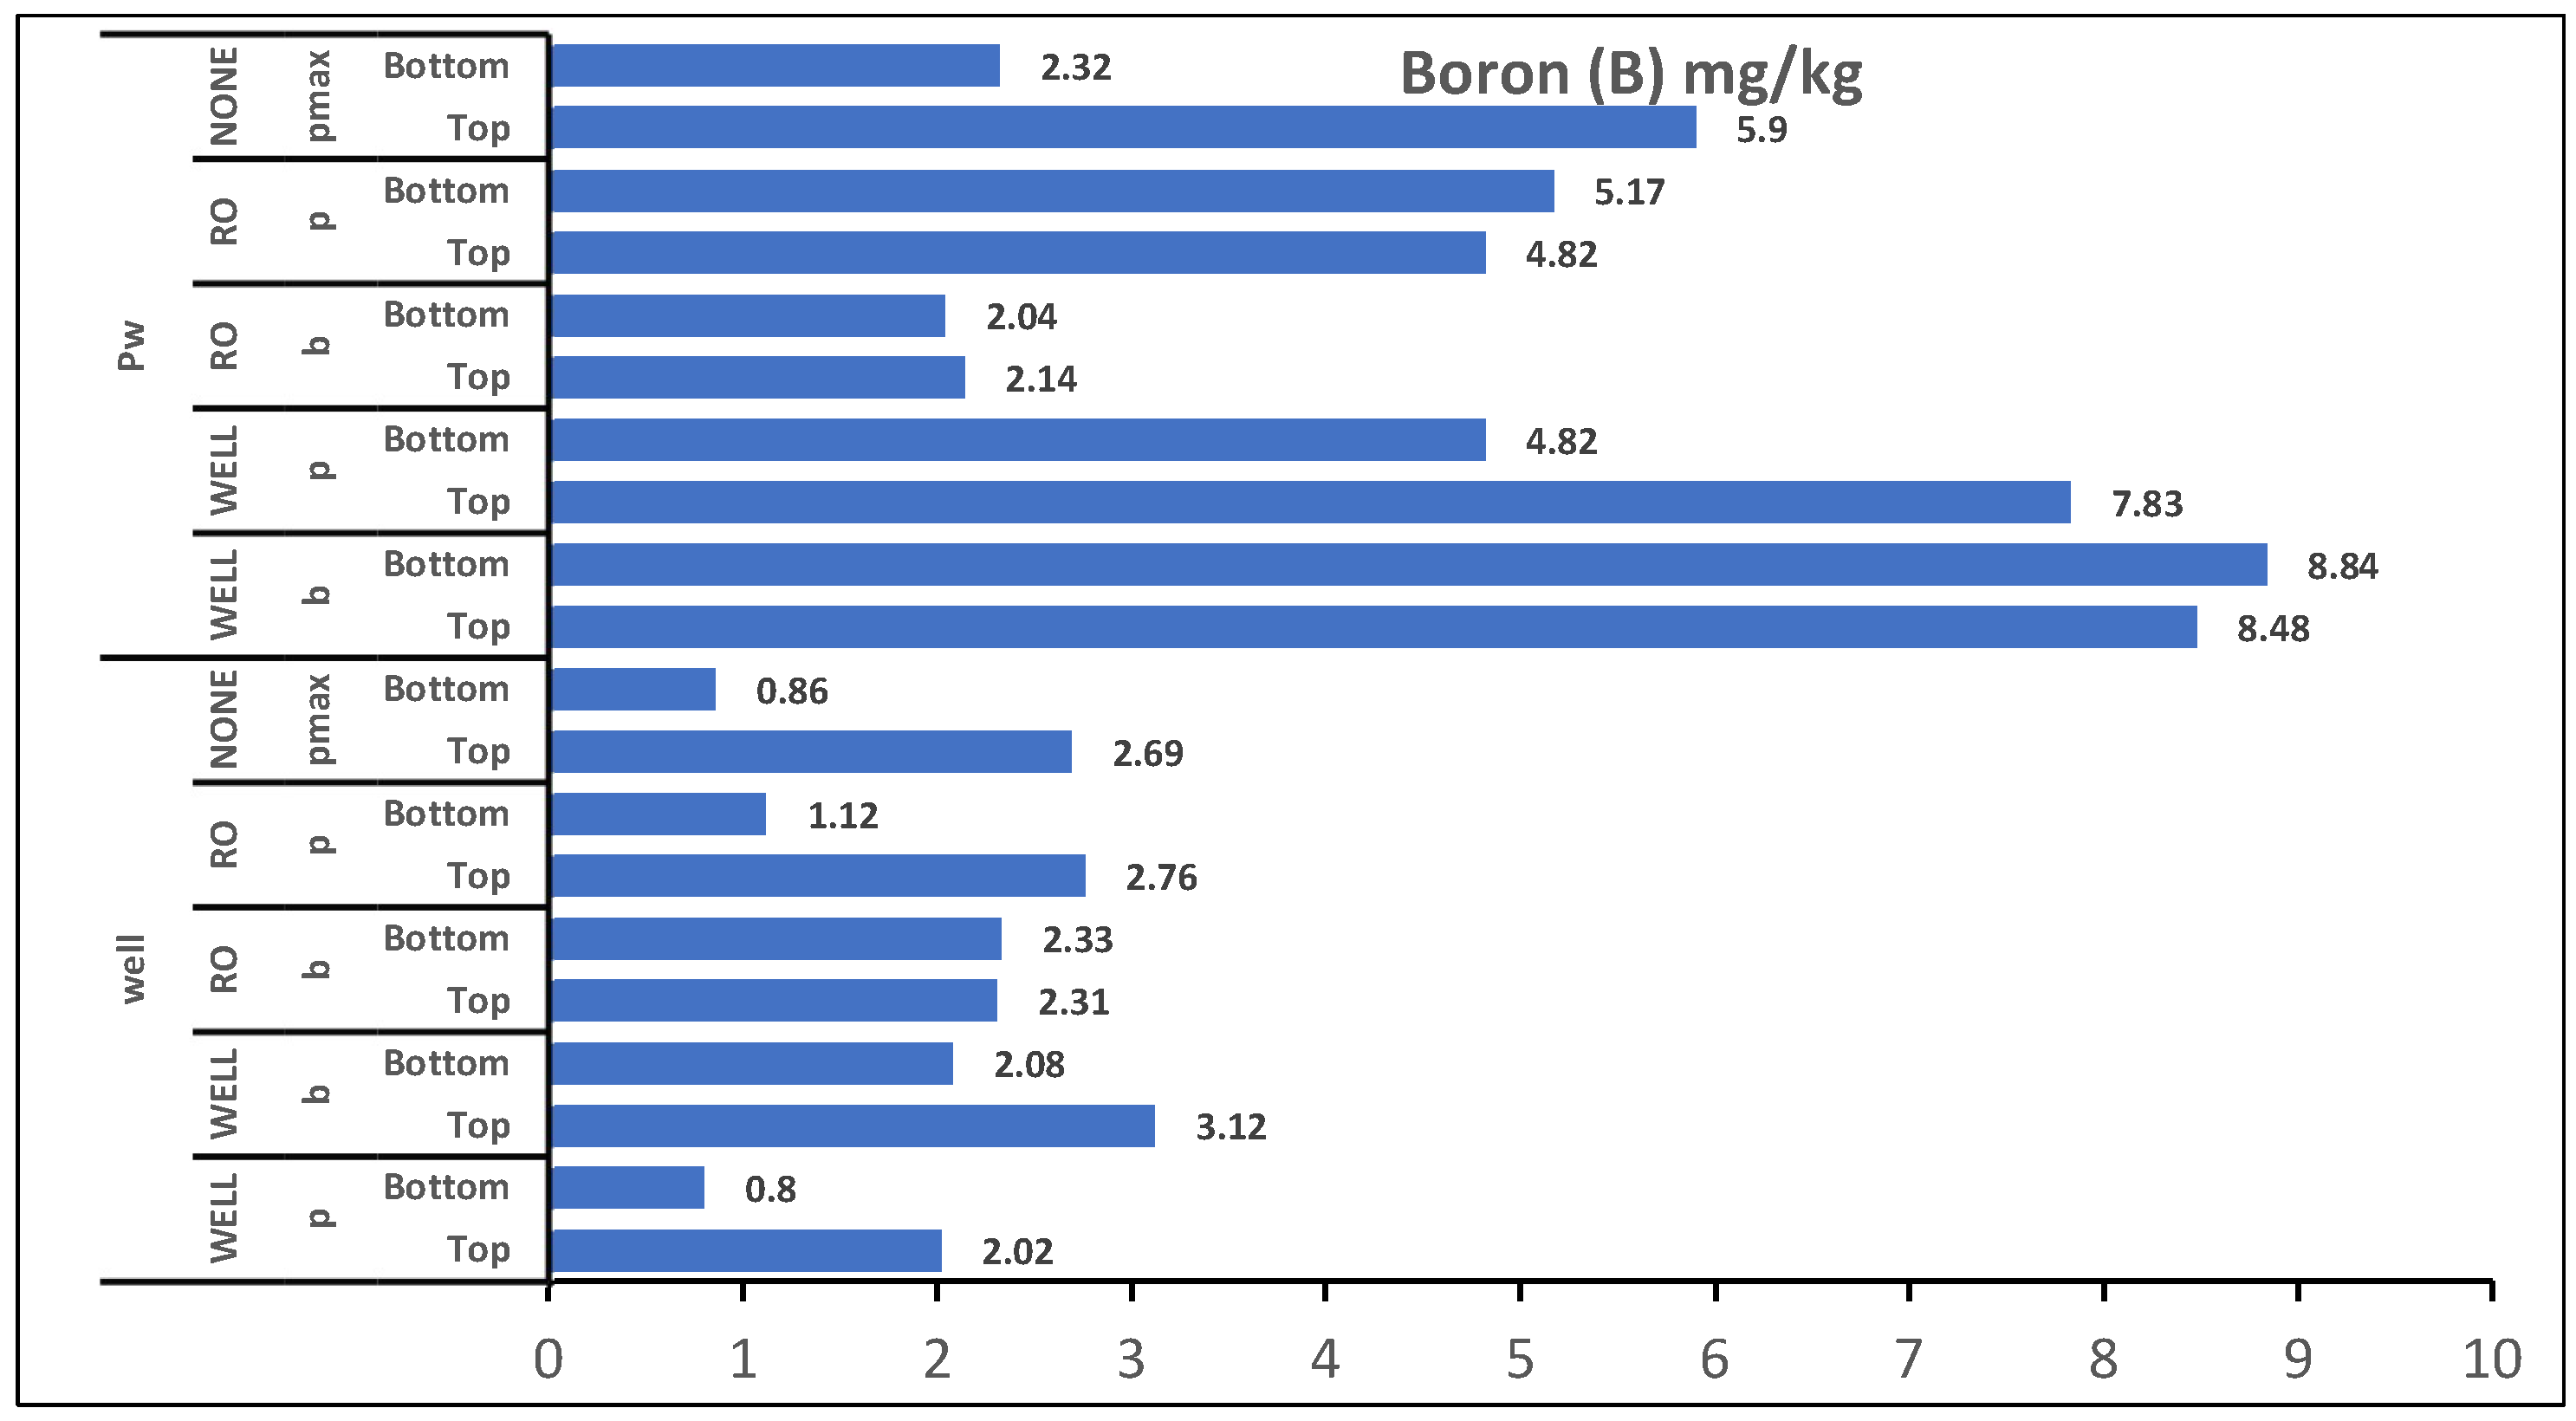
Figure 6.
Overall effect of irrigation water Levels and factors treatment on plant top and bottom soil concentration of Sodium, well: Ground Water, PW: produced water, pmax: Panicum Maximum, p: Panicum, b: Buffelgrass, N: No germination, R:RO water germination and W: ground Well Water germination.
Figure 6.
Overall effect of irrigation water Levels and factors treatment on plant top and bottom soil concentration of Sodium, well: Ground Water, PW: produced water, pmax: Panicum Maximum, p: Panicum, b: Buffelgrass, N: No germination, R:RO water germination and W: ground Well Water germination.
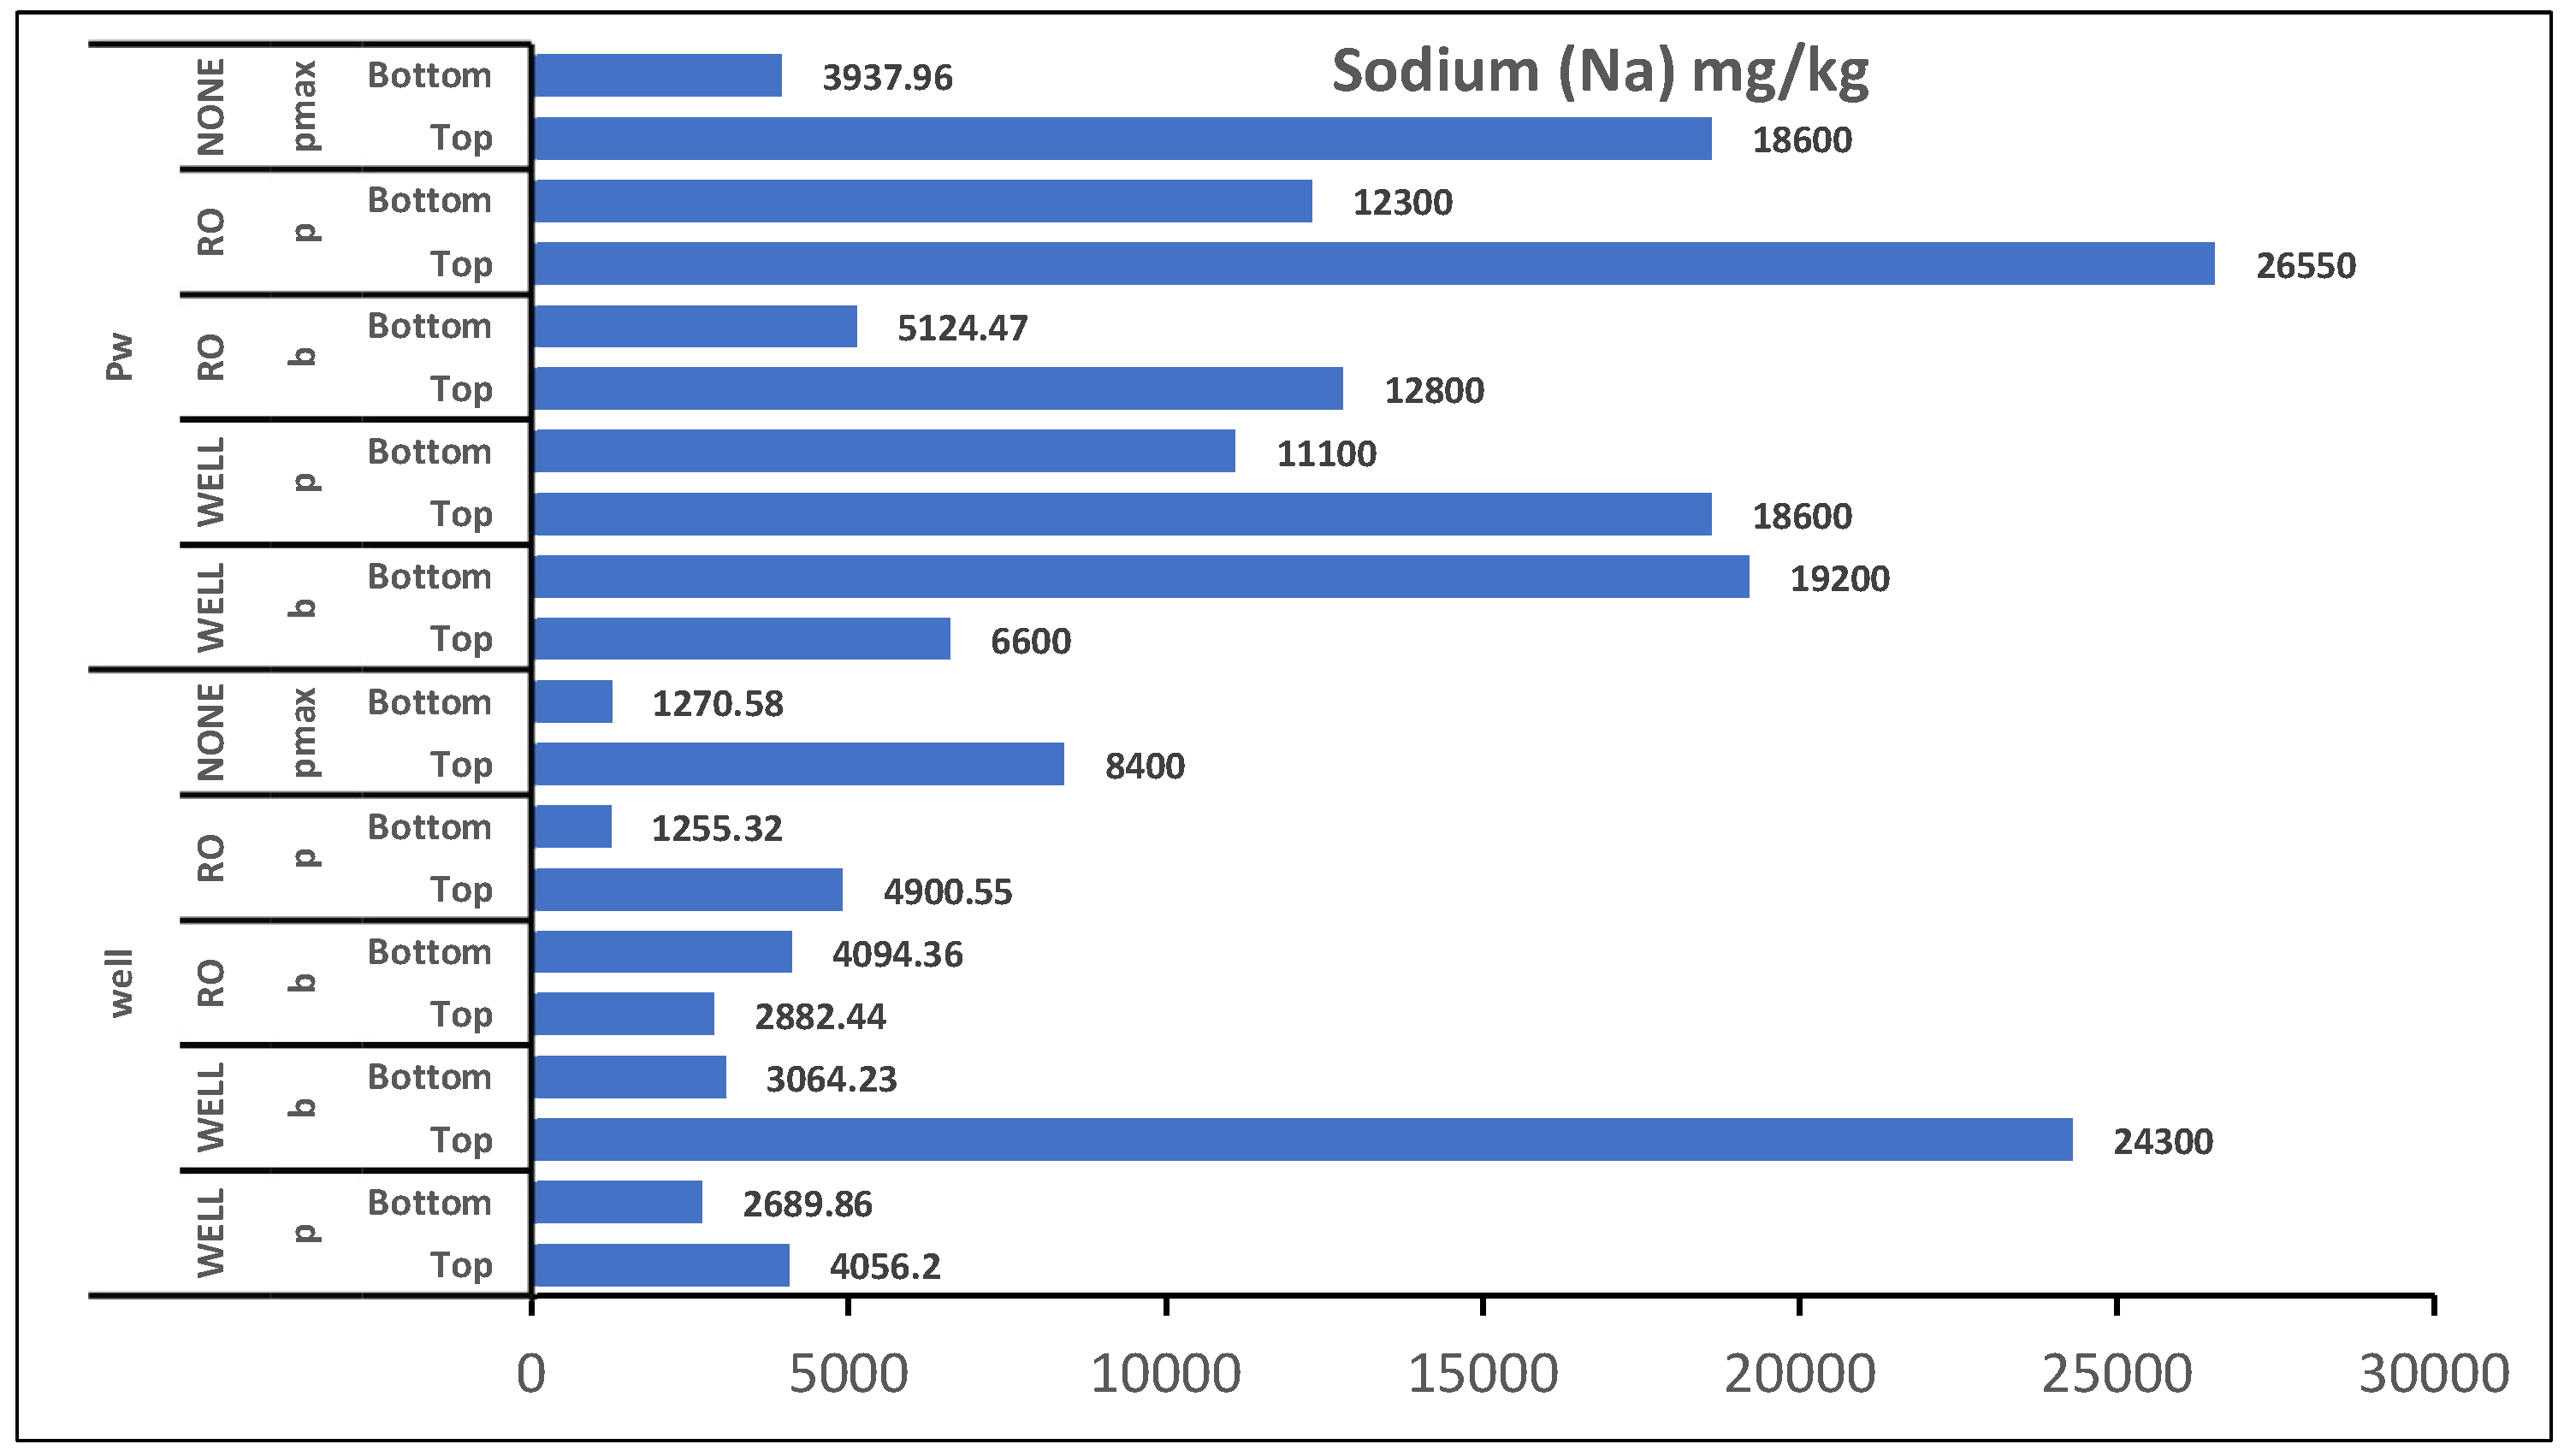
Figure 7.
Plants shoot and roots concentration of Sodium for experiment 1. WW: Wastewater, PW: Produced water, FW: Ground water pmax: Panicum Maximum, p: Panicum, b: Buffelgrass and Alfa: Alfalfa.
Figure 7.
Plants shoot and roots concentration of Sodium for experiment 1. WW: Wastewater, PW: Produced water, FW: Ground water pmax: Panicum Maximum, p: Panicum, b: Buffelgrass and Alfa: Alfalfa.
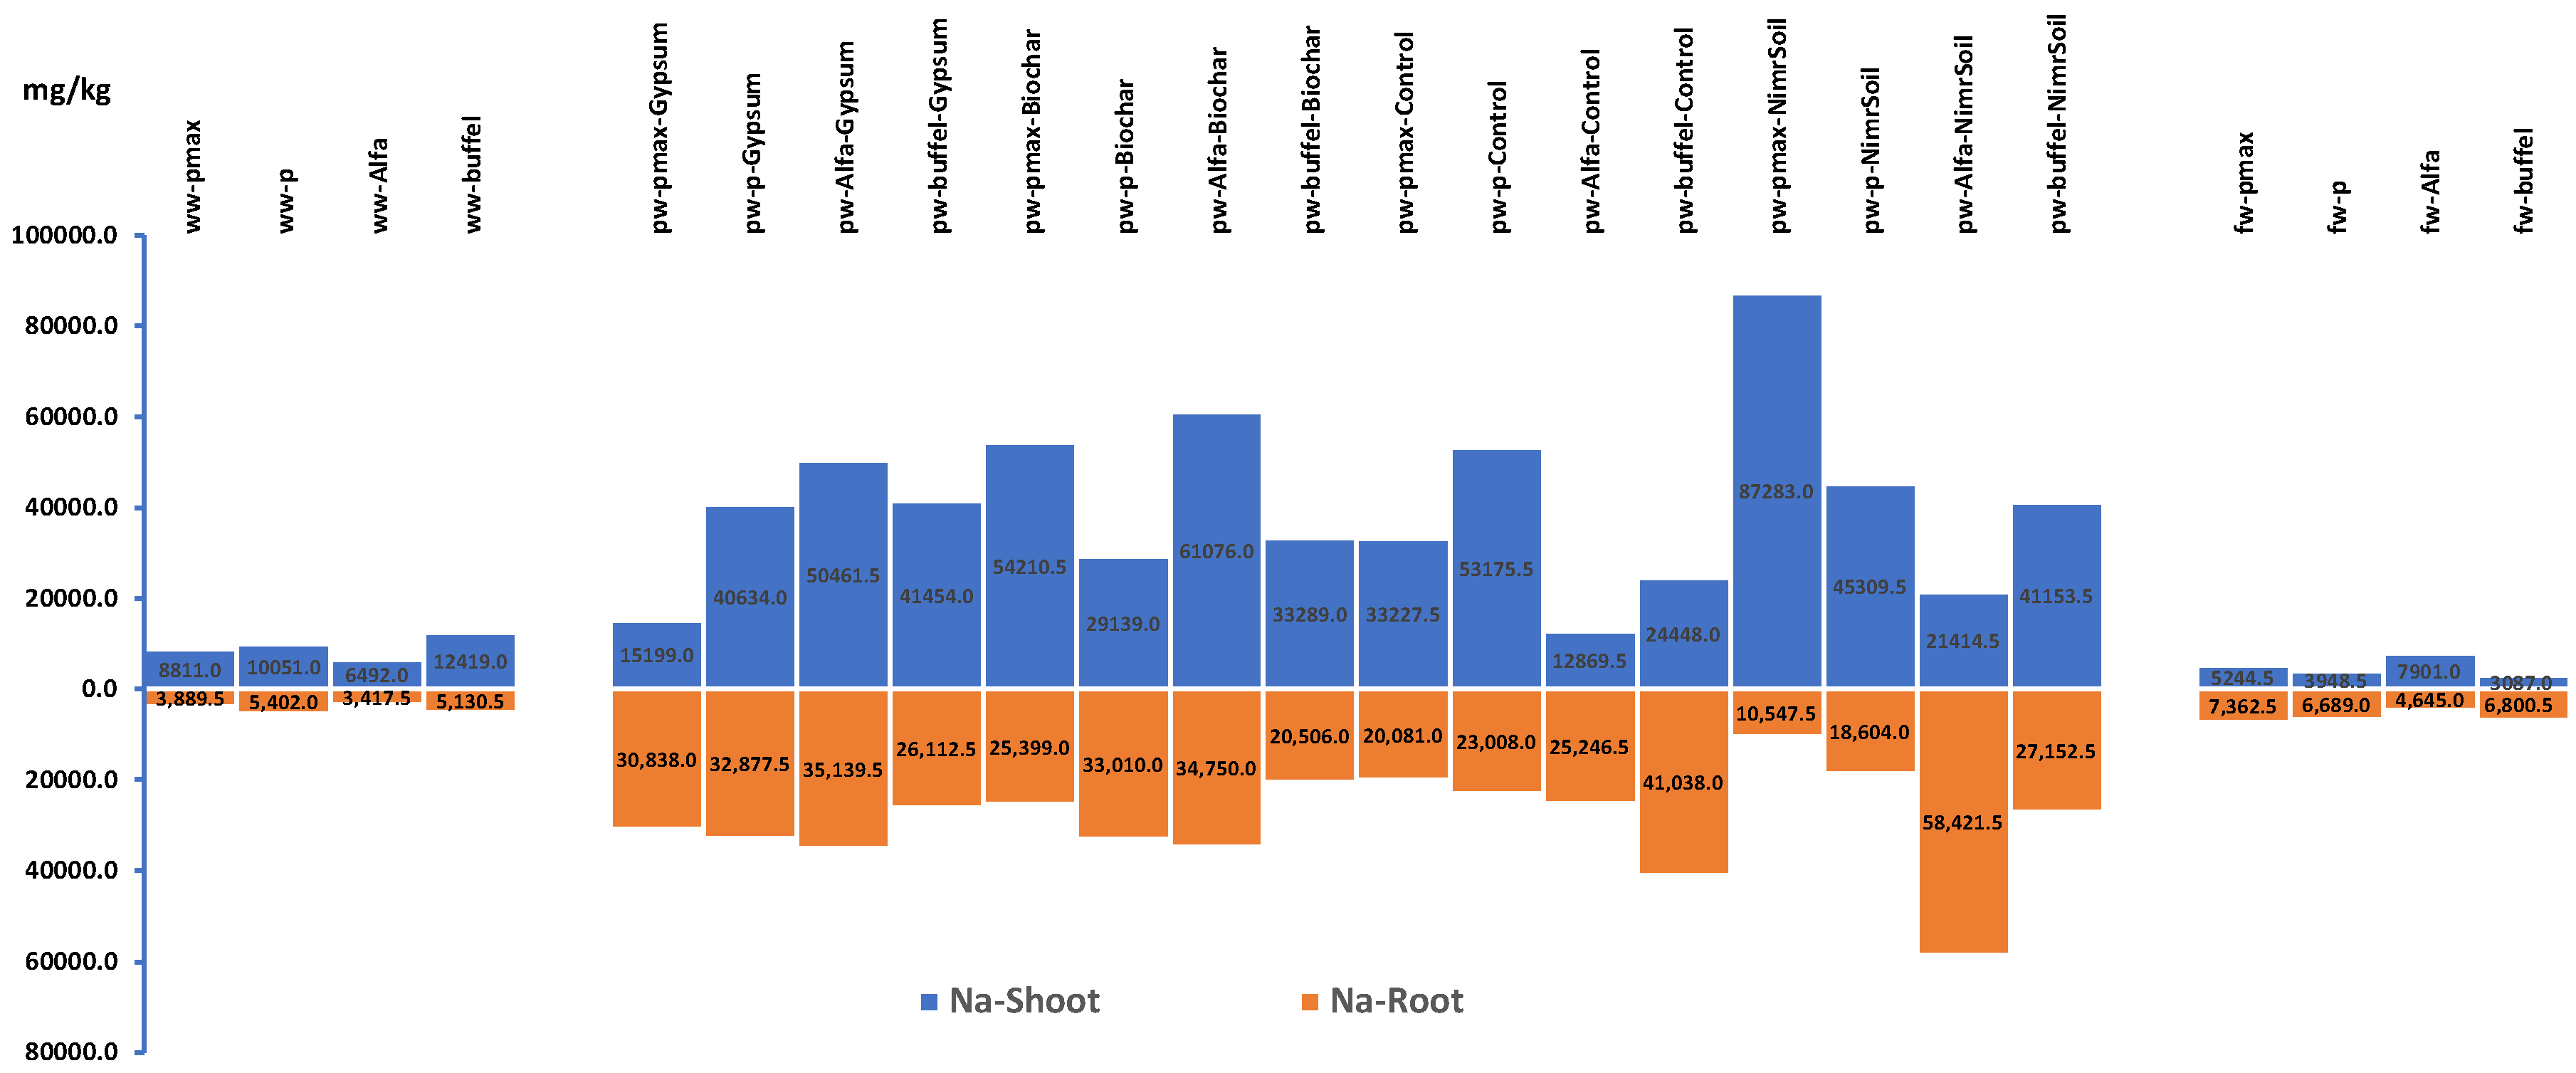
Figure 8.
Plants shoot and roots concentration of Boron for experiment 1. WW: Wastewater, PW: Produced water, FW: Ground water pmax: Panicum Maximum, p: Panicum, b: Buffelgrass and Alfa: Alfalfa.
Figure 8.
Plants shoot and roots concentration of Boron for experiment 1. WW: Wastewater, PW: Produced water, FW: Ground water pmax: Panicum Maximum, p: Panicum, b: Buffelgrass and Alfa: Alfalfa.
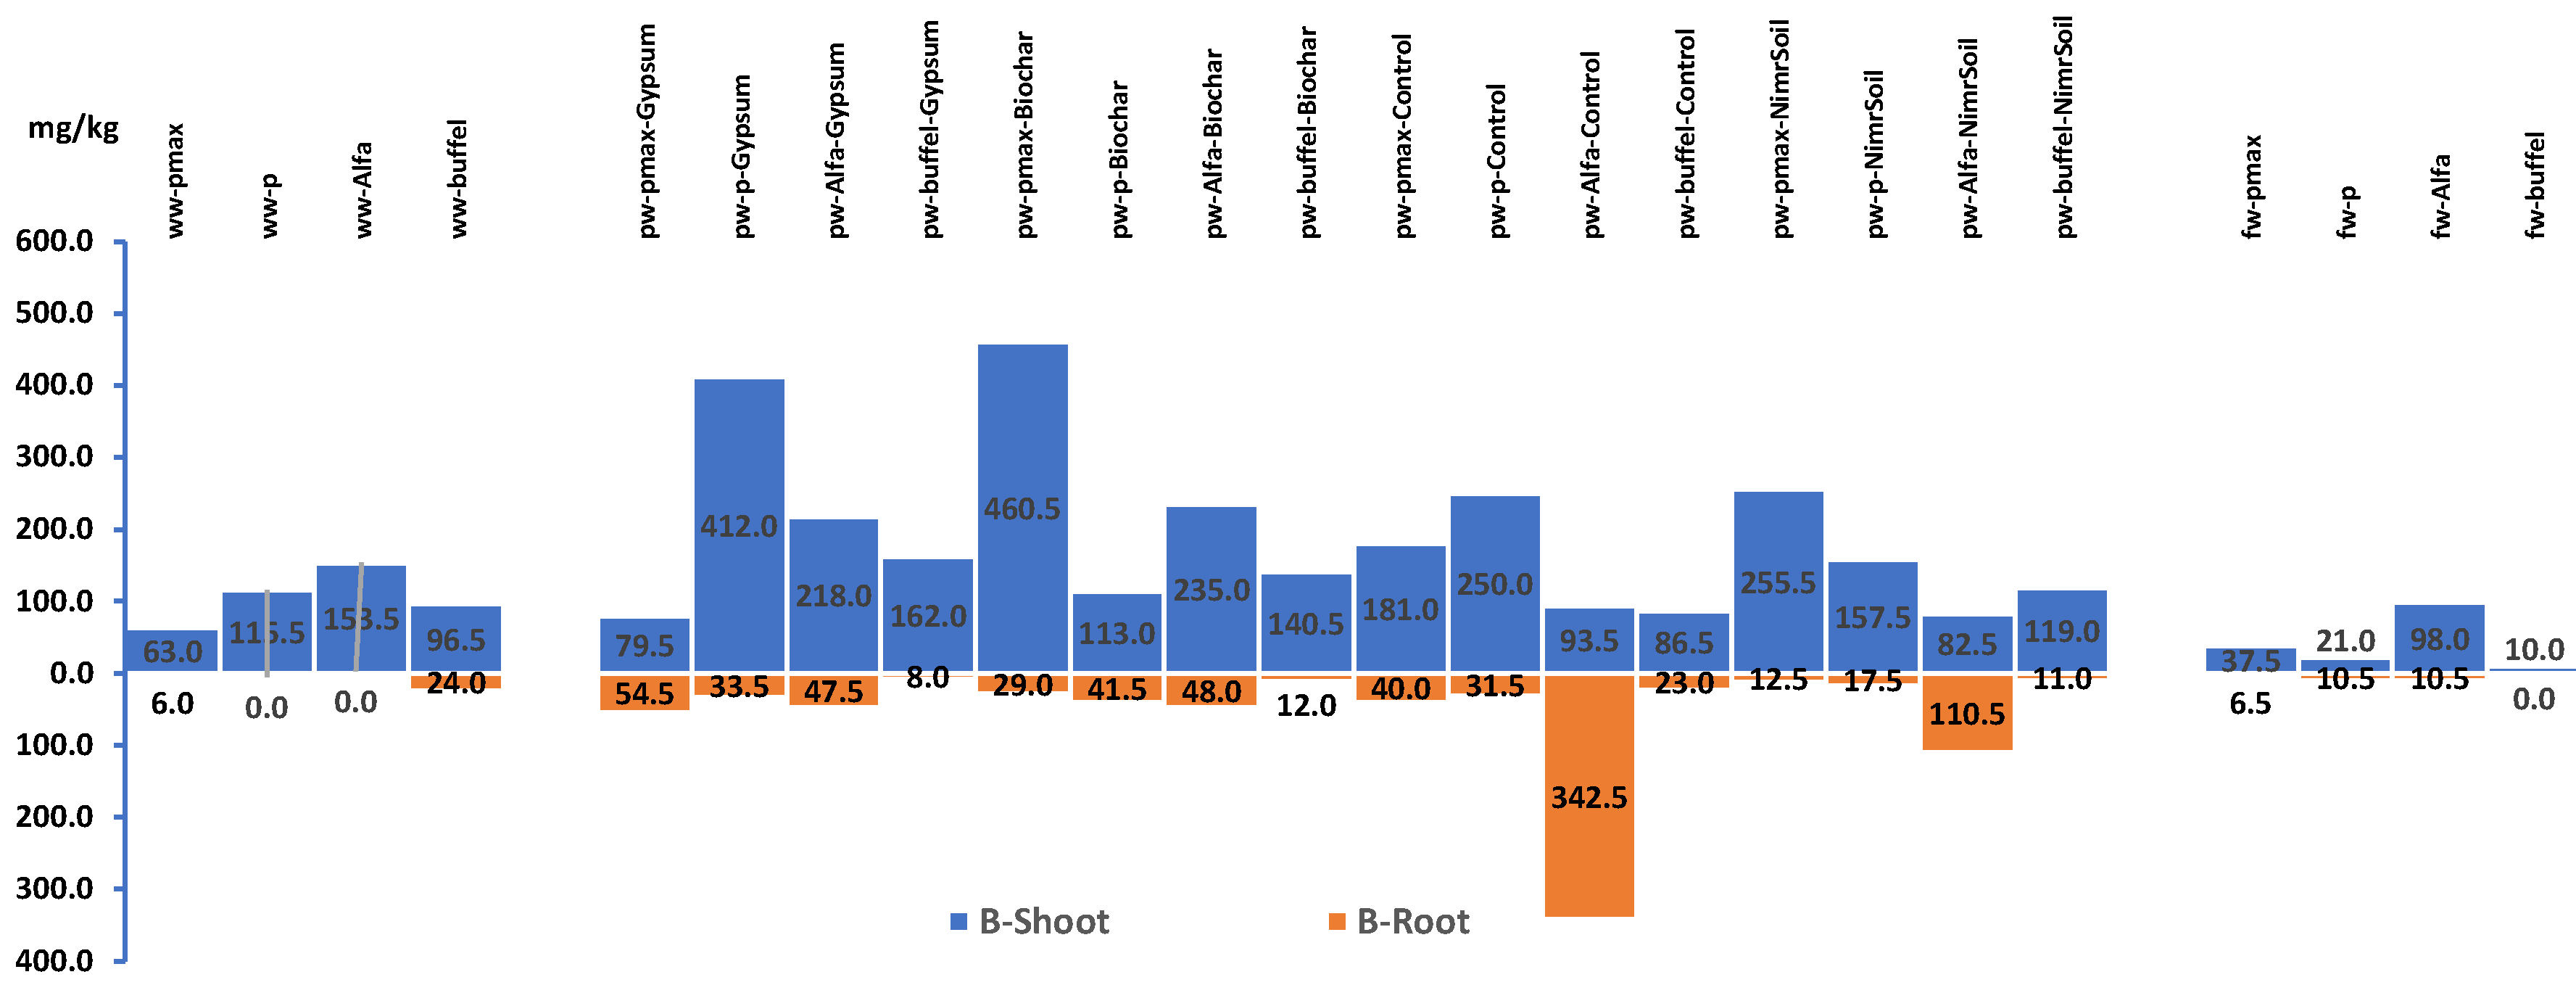
Figure 9.
Plants shoot and roots concentration of Boron for experiment 2. WW: ground Well Water, PW: produced water, pmax: Panicum Maximum, p: Panicum, b: Buffelgrass.
Figure 9.
Plants shoot and roots concentration of Boron for experiment 2. WW: ground Well Water, PW: produced water, pmax: Panicum Maximum, p: Panicum, b: Buffelgrass.
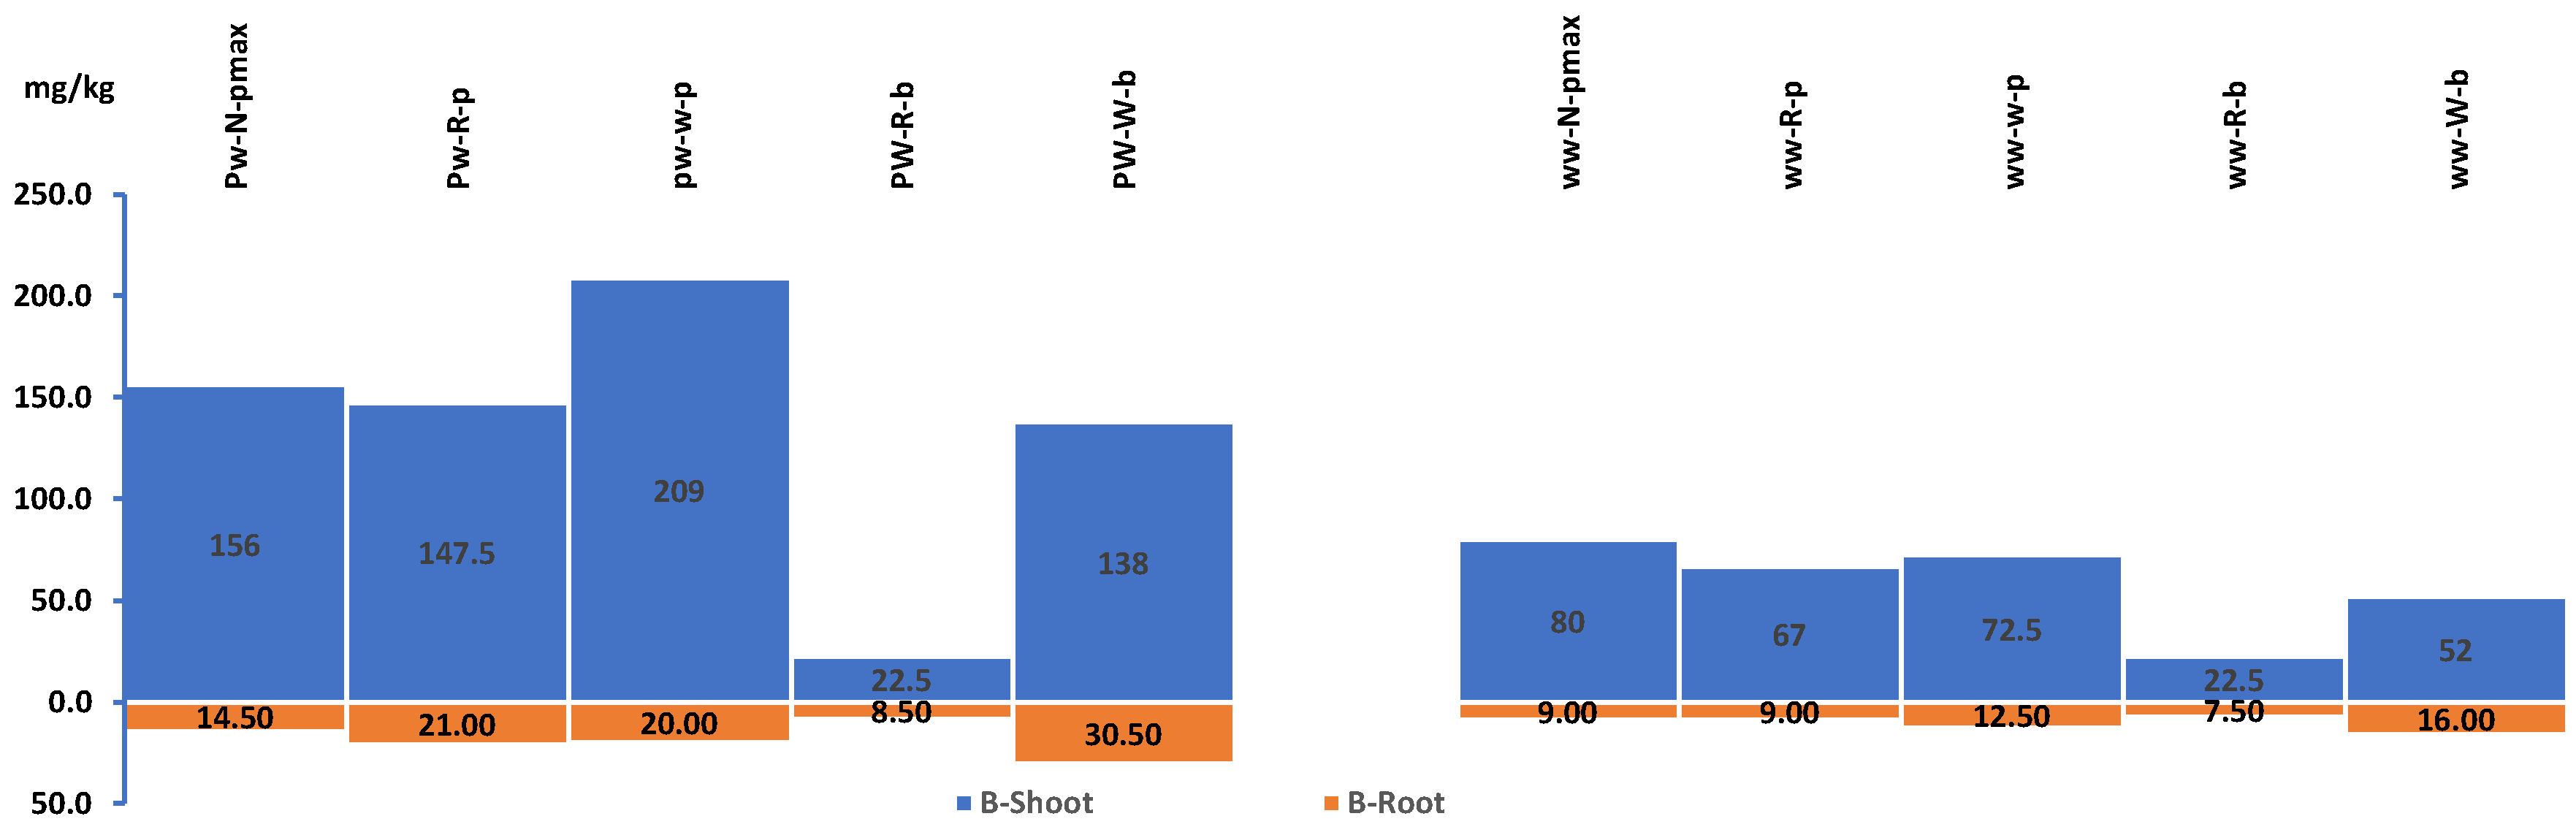

Table 1.
Main characteristic of the soils used in experiment 1.
| Soil characteristics | Nimr Soil | Control Soil |
|---|---|---|
| EC (mS/cm) | 12.39 | 1.96 |
| TDS (g/L) | 8.88 | 1.28 |
| pH | 7.5 | 8.1 |
| MC % | 2.91 | 1.145 |
| Silt % | 6.17 | 0.0 |
| Clay % | 0.0 | 0.0 |
| Sand % | 93.8 | 100 |
| Texture | Sand | Sand |
* EC: electrical conductivity MC: moisture contact, TDS: total dissolved salinity.
Table 2.
Minerals of the soils used in experiment 1 and experiment 2 (ND: not detected).
| Minerals (mg/L) | Nimr Soil | Control Soil |
|---|---|---|
| Zn | 0.15 | 0.15 |
| Fe | 0.04 | 0.07 |
| B | 0.08 | 0.04 |
| Al | 0.26 | 0.13 |
| Na | 2,035.29 | 324.26 |
| K | 1,077.71 | 200.93 |
| Ca | 1,338.72 | 163.22 |
| Mg | 348.21 | 75 |
| As-Pb-Co-Cd-Ni-Hg-Mn-Cr-Cu | ND | ND |
Table 3.
Minerals concertation of the produced water and ground water used at Nimr site experiment 2.
Table 3.
Minerals concertation of the produced water and ground water used at Nimr site experiment 2.
| Water minerals concentration (mg/L) | Produced Water | Ground Well Water |
|---|---|---|
| B | 6.95 | 1.84 |
| Zn | 0.02 | 0.04 |
| Ni | 0.03 | 0.03 |
| Fe | 0.04 | 0.03 |
| Mn | 0.02 | 0.02 |
| Cu | 0.01 | 0.01 |
| Al | 0.16 | 0.28 |
| Mg | 39.87 | 305.44 |
| Ca | 117.76 | 579.3 |
| Na | 5,022.6 | 1,404.0 |
| K | 47.56 | 43.21 |
Table 4.
Minerals concertation of the produced water, treated wastewater and ground water used at SQU-AES experiment 1 water minerals concentration(mg/L).
Table 4.
Minerals concertation of the produced water, treated wastewater and ground water used at SQU-AES experiment 1 water minerals concentration(mg/L).
| Water minerals | Produced water | Treated wastewater | Farm ground water |
|---|---|---|---|
| B | 6.95 | 1.17 | 0.23 |
| Zn | 0.02 | ND | ND |
| Ni | 0.03 | ND | ND |
| Fe | 0.04 | 0.01 | 0.01 |
| Mn | 0.02 | ND | ND |
| Cu | 0.01 | ND | ND |
| Al | 0.16 | 0.07 | 0.09 |
| Mg | 39.87 | 9.36 | 84.33 |
| Ca | 117.76 | 37.67 | 45.27 |
| Na | 5,022.68 | 188.09 | 222.27 |
| K | 47.56 | 10.86 | 8.01 |
Table 5.
Critical soil limits and plant concentrations of elements based on Alloway (1995) and Kabata-Pendias (1992).
Table 5.
Critical soil limits and plant concentrations of elements based on Alloway (1995) and Kabata-Pendias (1992).
| Elements | Critical soil limit (mg/kg) * | Critical plants concentrations (mg/kg) * |
|---|---|---|
| Ag | 2 | - |
| As | 20-50 | 5-20 |
| Cd | 0.1-2.4 | 5-30 |
| Cr | 75-100 | 5-30 |
| Cu | 60-125 | 20-100 |
| Hg | 0.3-5 | 1-3 |
| Mn | 1500-3000 | 300-500 |
| Mo | 2-10 | 10-50 |
| Ni | 100 | 10-100 |
| Pb | 10-400 | 30-300 |
| Zn | 70-400 | 100-400 |
| B | 100 | 283-333(>150 animal feeding) |
| Al | - | 50-3410 |
| Fe | - | >3080 |
| *Data from Kabata-Pendias ,H,Trace Elements in Soil and Plants,2nd edn.CRC Press,Boca Raton, Fla (1992) | ||
Table 6.
Reed grass dry mass metal’s concentration values.
| Detected Elements | Fe | B | Mn | Al | Na | K | Ca | Mg | Pb-Co-Cd-Ni-Hg-Cr-Cu |
| (mg/kg) | 232 | 58.5 | 143 | 156.5 | 4,899.5 | 4,903.5 | 4,924 | 995 | ND |
Disclaimer/Publisher’s Note: The statements, opinions and data contained in all publications are solely those of the individual author(s) and contributor(s) and not of MDPI and/or the editor(s). MDPI and/or the editor(s) disclaim responsibility for any injury to people or property resulting from any ideas, methods, instructions or products referred to in the content. |
© 2025 by the authors. Licensee MDPI, Basel, Switzerland. This article is an open access article distributed under the terms and conditions of the Creative Commons Attribution (CC BY) license (http://creativecommons.org/licenses/by/4.0/).
Copyright: This open access article is published under a Creative Commons CC BY 4.0 license, which permit the free download, distribution, and reuse, provided that the author and preprint are cited in any reuse.


