1. Introduction
With the expansion of non-dispatchable renewable electricity generation projects such as wind farms and solar PV installations electricity there is a need to invest in complementary technologies in order maintain a reliable electricity service. This is particularly the case in developing countries where a national electricity transmission grid is not well developed. Usually, the reliability of the service is provided by either simple cycle or diesel electricity generators.
In some areas there might already exist a seasonal storage hydropower plant, or there is the potential to build one. A seasonal storage dam in this article is referring to a hydropower dam that is designed to capture and store enough water during the rainy season(s) of the year so that it can generate electricity at any time but with a specified planned capacity factor for the year. In such situations the possibility exists to configure such a hydro power plant so that it can generate electricity to provide reliability to wind and/or solar PV facilities. Many studies have investigated methods for maintaining electricity service reliability using pumped hydro storage. However, the financial and economic aspects of integrating solar PV fields with seasonal storage dams, particularly in Africa, have yet to be thoroughly examined.
Four key variables are evaluated that affect such a system’s levelized cost (LC) of electricity generation. These include the initial capital costs of the solar PV system and hydropower plant, whether the hydropower-solar PV generation is off-grid or on-grid, the costs of alternative methods for maintaining service reliability when expanding solar PV generation, and the financial and economic cost of capital (discount rates) faced by a country.
This investigation begins by developing a financial and economic cost-effectiveness framework for the appraisal of an integrated solar photovoltaic (PV) electricity generation plant and a seasonal hydropower dam. The levelized cost (LC)s per mwh of electricity generated is estimated for each of these plants if operated separately and if their operations are integrated to provide a reliable electricity service throughout the year. For economic analysis purposes, this integrated project is in Ghana.
The second factor studied is the impact on the LC where the analysis is conducted in the context of an off-grid or alternatively an on-grid system. In both situations, the cost of maintaining reliability is critical in determining the LC of a reliable supply of electricity. A feature of the first scenario is that when the solar PV generation is added to the hydropower generation it is lumpy investment and hence not all the electricity generated by the combined system can be immediately consumed by the community. It will only be totally consumed when the demand for electricity has grown sufficiently. In the second situation if there is a grid connection or if there is excess demand for electricity in the community, all the electricity generated by the integrated generation system in a year can be consumed during that year.
Two alternative options for maintaining reliability are considered in this article. Either additional generation capacity needs to be added to the hydropower plant, or a simple cycle thermal peaking plant must be added to the system. These plants must be built to operate in parallel with solar PV generation to provide the capacity to stabilize the solar energy system. The financial and economic LCs of the system are estimated in terms of both the average costs of the total supply of the system as well as the LC of the incremental electricity consumed when the Solar PV field is added the system.
The financial and economic cost of investible funds is vastly different for low-income countries as compared to industrialized countries. This article investigates the impact of the cost of funds in determining the LC of these systems. The significant impact that this variable should have on the design of appropriate renewable energy policies for low-income countries has often been ignored.
This article contributes to the literature by explicitly studying the incremental costs of supplying electricity by solar PV systems when the reliability of the electricity system is maintained by additional investment in capacity in hydro power generation or thermal power generation. In each case the cost of the incremental electricity generated by the solar PV system is substantially greater than the levelized cost of the stand-alone system without reliability. Furthermore, the economic cost of funds has a major impact on the cost of providing a reliable electricity service using solar PV systems.
Section 2 of the paper provides a brief review of the literature that has studied the cost of electricity storage to provide electricity reliability in the context of the expansion of non-dispatchable renewable electricity generation systems.
Section 3 describes the analytical framework for the financial and economic analysis of the integration of solar PV with hydropower storage dams.
Section 4 describes the case application that is to be studied.
Section 5 contains the analysis of both the financial and economic costs of the various scenarios considered in this investigation. Section 6 contains the conclusions of the study and outlines the implications for the policies guiding electricity system expansions in less developed countries.
2. Literature Review
Variable renewable electricity generation technologies come with intermittent and grid stability challenges. The system operator must always be able to balance the supply and demand for electricity to provide a reliable electrical system [
1,
2] The growth in variable renewable energy, such as solar and wind energy, necessitates combining these technologies with other types of generation that can provide flexibility and reliability to the power grid [
3]
Several strands of literature have introduced concepts regarding mechanisms capable of delivering cost-effective renewable system solutions. Energy storage, demand response and management, end-user and generation flexibility, flexible transmission technologies, and smart grid solutions are some of the ways that power production from wind and solar energy can potentially be tailored to meet the pattern of electricity consumption over time [
4]
The studies on energy storage have emphasized how energy storage technologies may be used to counteract the intermittent nature of the output produced by renewable energy sources [
5,
6,
7]. Solar PV can charge batteries during the day so that electricity is available in the evening. Nevertheless, the challenge is how the electricity demand will be met when it is cloudy for a prolonged period. A critical issue to consider is the size and cost of the batteries needed to maintain the reliable delivery of electricity during days of reduced sunshine.
Presently, these storage facilities are costly when used to provide reliability for wind and solar plants over periods longer than one or two days. Globally, pump storage is considered the most reliable and the most widely used energy storage technology, especially when integrated with other renewables [
8,
9,
10]. However, pumped storage is only cost-effective if energy needs to be stored for a few days.
Wind and solar are highly variable over the seasons of the year. Bahamian [
11] showed that the uncertainty associated with wind or solar energy over time requires larger reservoirs, raising the cost of the integrated systems. Despite much advocacy of pump storage, it requires a double investment to complement solar PV [
12]. Pumped hydro storage consumes more energy than it generates, and its pumping capacity limits its storage flow.
Integrating seasonal dam storage with solar PV systems has the potential to be more cost-effective for maintaining electricity service than the commonly suggested storage options [
13,
14,
15]. A seasonal hydropower dam can store water without having to be pumped into a storage facility. Furthermore, a certain amount of generation capacity exists as an essential element of the hydropower dam.
When solar energy generates electricity, the seasonal storage dam can conserve water by reducing its generation to below the level it would otherwise operate. At other times, when the solar PV system is not generating electricity, the seasonal dam storage can be relied upon to meet the electricity demand. While the additional penstocks, turbines, and generators required are greater than if it remained a stand-alone hydro storage dam, these additional integration costs, might be less costly than other means of providing reliability. Furthermore, hydropower is the most efficient method of maintaining the instantaneous balance of supply with demand in an electrical system.
Countries such as Ghana, Zambia, Kenya, Uganda, and Mozambique have many seasonal or multiyear storage dams and extensive electricity grids. With some enhancement in generation capacity, these seasonal storage dam facilities could potentially serve as a backup for non-dispatchable renewable generation technologies. Industrialized countries have long exploited the lowest-cost sites for hydropower generation. In contrast, many developing economies, particularly in Africa and the Himalayas, remain undeveloped [
16]
3. Analytical Framework for the Financial and Economic Analysis of Integration of Solar PV with Hydropower Storage Dams
A major challenge in the countries of Sub-Sahara Africa is the lack of a national grid that connects the various regions of a country to the country’s electricity system. Often the investment cost of build grid connectivity to distant regions is too great relative to the potential number of consumers to be added to make such projects an immediate priority. Hence, the analysis begins by considering a situation where there is a hydropower station development that is not connected to a national grid. It is initially the sole supplier of electricity to the immediate region through a local distribution network. It is further assumed that the capacity factor of the dam will be sufficient to meet the initial peak demand and the energy requirements of the surrounding communities.
Over time, this community’s demand for electricity is expected to grow. To meet this increased demand for electricity, it is proposed that a solar field be added at the time the dam is completed to provide an available supply of energy to meet this growth in demand. However, additional generation capacity in terms of turbines and generators will need to be added to the hydro dam, to maintain the reliability of electricity service. Alternatively, a diesel or simple cycle thermal peak generator could be added to this isolated electricity system to meet the increase in peak demand for electricity. The costs of both options for maintaining electricity service reliability are evaluated in this article.
The analysis begins by using the capital and operating costs for a small seasonal storage hydropower dam with a 70 MW generation capacity that has sufficient water flow and storage capacity to maintain a 34 percent capacity factor over the year. The hydropower facility is then combined with the actual proposed capital and operating cost for a 50 MW solar PV field with radiation specifications that are typical for a region like northern Ghana. The economic life of the dam component of the hydropower plant is assumed to be 100 years while the economic life of its power plant component, (generators, turbines and penstocks) is taken to be 30 years. A 30-year economic life is assumed for both the solar field and the simple cycle thermal generation plant.
The financial cost of the solar and hydropower plant and solar fields, along with their capacity factors, will determine the levelized cost of supplying electricity from each project separately. The initial estimation of the levelized cost of the energy from the stand-alone solar PV field only reflects the unit cost of the energy produced over its 30-year lifetime and does not include the cost of maintaining the reliability of the electricity service. On the other hand, when one estimates the levelized cost of the electricity generated by the hydropower plant over 30 years, one is considering an electricity service with a high degree of reliability.
After estimating the levelized cost of each of these plants separately, they are then integrated so that they operate in a manner that maintains the reliability of the combined electricity service. The reliability of the service is maintained following alternative strategies. First, the hydropower plant costs (penstocks, turbines, and generators) are increased proportionally to increase the ability of the hydropower system to meet the increased system peak demand until the time when both the energy produced by the dam and the solar field are fully consumed. Second, instead of increasing the generation capacity of the hydropower system, an additional simple cycle thermal generation plant using heavy fuel oil is added to address the need to meet the growing peak demand and to assist in stabilizing the electricity service.
The financial and economic analysis components are specified and quantified using equations 1 to 9 below. The analysis is carried out for each plant separately, followed by the integration of both plants. System 1 refers to the hydropower plant alone, and system 2 denotes the solar plant alone. System 3 represents the integration of both hydropower and solar PV when the system is not connected to the electricity grid for the country. System 4 refers to a situation where the initial seasonal hydropower dam is operated along with the solar plant, and in addition, additional thermal generation capacity is built to supply electricity to meet the growing peak electricity demand. Again, in this case the integrated system is not connected to the electricity grid for the country.
System 5 is the same combination of technologies as system 3 but in this case all the electricity can be used immediately by the consumers either by evacuation through an interconnected grid or because there exists a large enough excess demand for electricity by the surrounding community. With system 6 the stability of the system is maintained both by the hydro storage system and a small simple cycle thermal generation plant. Furthermore, in this case (as in case 5) all the electricity can be consumed as soon as the integrated system is operational.
The discount rate used in the financial analysis is denoted as , while is the discount rate used in the economic analysis, and t is the year of the financial or economic operation of the system.
3.1. Financial Levelized Cost
3.1.1. Hydropower Plant
The present value as of year 1 of the electricity generated (
) over the hydropower plant’s lifetime is found using equation 1.
where
is the amount of electricity generation produced by the hydropower plant in year
t,
t= (5…34). It is assumed that the hydropower plant will take 4 years to construct and only begin production in year 5. All the electricity potentially produced by the hydro dam is fully consumed in the years following its construction. The evaluation is carried out for an operational period of 30 years.
The incurred financial cost in year
t is:
The financial value of costs () here incorporates the financial capital cost () and operation and maintenance costs () of plant in year t.
The present value as of year 1 of the financial cost of the system (
) is estimated according to equation (3):
where
t= (1…35). In year 35 the residual value of the dam is reported as a negative cost.
The financial LC (
) per MWh can be expressed using (equation (3)/equation (1)):
where, the LC of an electric hydro power generating unit is the ratio of its total discounted costs of supplying the power to the total discounted quantity of electricity generated during the lifetime of the facility [
17]
3.1.2. Solar PV Plant
The present value as of year 1 of the electricity generated (
) over the solar plant’s lifetime is estimated by:
where
is the amount of electricity generated in year
t, t= (5…34). It is assumed in this case that all the electricity generated by the solar field will be fully consumed, beginning in the year after the solar installation is completed.
The financial costs incurred for the solar plant in year
t are:
The financial value of costs (
) here incorporates the financial capital cost (
) and the operation and maintenance costs (
) of the plant in year
t. The plant will be constructed in year 4 to begin generating in year 5. The present value as of year 1 of the financial cost of the capital, operating and maintenance costs of the solar plant (
) is estimated according to equation 7:
where
t= (4…34).
The
financial LC (
) per MWh for the solar plant can be expressed using the expression (equation (7)/equation (5)):
where the LC of an electric power generating unit is the ratio of its total discounted costs of supplying power over the lifetime by the solar PV plant to the total discounted quantity of electricity generated over the operating life of the plant.
3.1.3. Integrated System of Solar-Hydropower and Solar-Hydropower-Thermal
In as similar manner as Equations (1) to (8) the levelized cost of each of the integrated generation systems are estimated. In each case the present values of the specific capital cost components plus the operating costs of electricity generation for the specific technologies over a period of 34 years are divided by the present value of the electricity consumed.
3.2. Economic Levelized Cost
The financial analysis estimates the financial costs involved in the production of electricity and the operation of the plants. However, the economic analysis of a project focuses on the project’s economic costs. The calculations of all the economic costs associated with this project are derived by converting each financial expenditure into economic costs to reflect their value to society. Commodity specific conversion factors (CSCFs) convert the financial prices of the project’s inputs to their economic values. In estimating these conversion factors, all the taxes, subsidies, and foreign exchange premiums that might cause the financial price of a good or service to diverge from its economic value are accounted for.
Once the financial cost of each item has been adjusted by its CSCFs, the economic costs incurred in the year are then discounted to the base year of analysis. In this case, the base year is year 1, and the discount rate is the economic opportunity cost of capital.
Using the economic values of the costs for each of the four situations described in the equations for the financial analysis above, the levelized economic costs (
) of each scenario are expressed by Equation (9). They are estimated as the present value of the economic costs (
) over the lifetime of the system divided by the present value of the energy generated (
).
where i = (1…6). Both the present value of the costs as well as the electricity generated are discounted using the economic opportunity cost of capital for the country.
4. Case Application
To provide an initial point of reference, the levelized cost of electricity supply is estimated for a representative stand-alone seasonal storage hydropower dam. Such seasonal storage hydropower dams have a wide range of levelized costs; hence, this case should be considered as simply a representative hydropower plant to evaluate how the electricity system’s financial and economic levelized costs change when a solar facility is integrated with it.
The cost per megawatt (MW) of the proposed 70 MW installed power station is presented in 2020 constant US dollar (USD) prices. The cost estimates used for the hydropower plant were obtained from the feasibility study for the Pwalugu Multipurpose Dam Project [
18] Because this multipurpose project had other components, including irrigation, the capital costs used in this report are adjusted to include only the components including the dam plus the costs associated with the powerhouse generation. These components come to an adjusted total investment cost of USD 230.5 million. Of this amount, USD 176.40 million is the cost of the dam civil works and other items associated with the dam construction, and USD 54.40 million is the hydropower plant costs including generating turbines, penstocks and associated construction costs. The total costs of the dam and hydro powerplant results in a total capital cost of USD 3.29 million/MW.
The study by Awojobi and Jenkins examined cost issues associated with a portfolio of 58 dams financed by the World Bank [
19]
. In their analysis, the average project size (MW) is significantly lower in Africa than in the other continents. After adjusting their construction costs to the 2020 price level, the historical costs of dam construction in Africa were USD 2.82 million/MW. There are significant economies of scale in the construction of hydro dams. Hence, the cost structure of the dam considered here is comparable to the historical cost of small dams financed by the World Bank built in remote locations in Africa.
The detailed breakdown of costs of the representative seasonal storage hydro dam used in this analysis as well as its technical operating parameters are presented in
Table A1 of
Appendix A.
It is proposed that the energy generated in the system be supplemented by a 50 MW solar PV plant. The cost of generating electricity by solar PV in combination with a storage dam to maintain reliability will provide an estimate of the generation costs of providing reliable electricity from such a hybrid facility. The cost information for the solar PV plant was provided for a 50MW solar hybrid project in the Northeast Region of Ghana, [
20]
The solar PV plant is considered to have a generation capacity of 50 MW with an estimated stand-alone total investment cost of USD55.6 million, or USD1.1 million/MW. As reported by Lazard, the estimated investment costs of community
solar PV systems are from USD1.3 million/MW to 1.5 million/MW in 2020. Hence, the costs proposed for this solar PV field are relatively low. However, the real prices of such
solar PV systems have fallen, and by 2023 it is reported by Lazard that the lower bound of
solar PV investment costs had fallen to USD1.2 million/MW [
21]. Given that in this analysis, the solar PV field is to be built four years after the dam’s construction is initiated, this estimate of the investment costs for the solar PV project of USD1.1 million/MW would appear to be a reasonable estimate The detailed cost breakdown of the solar PV system is presented in
Table A2 of the Appendix.
Another option for integration of the hydropower dam and solar PV is to introduce a small single cycle thermal generation plant to supply electricity during the periods peak demand.
The cost and technical parameters for the small single-cycle gas turbine thermal generation plant were obtained from Lazard [
21]. These costs and technical specifications of this plant are reported in
Table A3 of
Appendix A.
With this cost information, the estimates of the LC of electricity generated by each of the two project components and for the four combined hydropower and solar PV options can be made.
4.1. Analysis of Levelized Costs
In the analysis that follows the financial levelized cost of electricity generation is estimated for each of the 6 scenarios followed by the estimation of the economic levelized cost of each.
4.1.1. Financial Analysis Results
The first step in the analysis is to consider the hydropower dam operating alone. Construction of the hydropower plant extends from the beginning of year 1 through year 4. It will begin producing electricity in year 5 and will generate electricity from years 5 to 34. It is designed to have a maximum generation capacity of 70 MW with a generation capacity factor of 34 percent. Using equation 1, the present value of the electricity generated in MWh over the hydro dam’s 30 operating years is discounted back to the first year of the hydropower plant’s construction. In the base case an 8% real discount rate is used to discount both the quantities of electricity generated over time as well as the outflows of costs to the initial year of construction, year 1. This discount rate reflects the real (net of inflation) weighted average cost of capital for private electricity generation companies in Ghana. The present value of the electricity generated, when discounted back to the initial year of implementation, is estimated to be 1,844,584 MWh (
Table 1, row 1, column 1).
Equation 3 estimates the present value of the total generation costs (capital costs plus variable costs) over the 30-year operating life of the hydropower dam. This USD 220.10 million value is reported in
Table 1, row 1, column 2. Using equation 4, one can now estimate the financial LC for the stand-alone hydropower dam project. This is reported in
Table 1, row 1, column 3, as USD119.32/MWh, or about 12.0 cents/kWh. This estimated levelized cost is primarily a function of the costs of construction of the hydropower facility, water availability, and the capacity factor it operates at to meet the demand of its customers.
Table 1.
Financial levelized cost of electricity in 2020 prices, USD/MWh.
Table 1.
Financial levelized cost of electricity in 2020 prices, USD/MWh.
| Row no. |
Components of financial appraisal |
Net present value of energy generation (MWh) |
Net present value of energy cost (USD) |
Levelized cost @8%
(USD/MWh) |
Levelized cost @8% of incremental energy
(USD/MWh) |
| |
|
1 |
2 |
3 |
4 |
| 1 |
Hydropower plant |
1,844,584 |
220.10 |
119.32 |
- |
| 2 |
Solar |
638,447 |
52.83 |
82.74 |
- |
| |
Off-grid |
|
|
|
|
| 3 |
Integrated 1 (Hydro & Solar) |
2,337,045 |
288.80 |
123.57 |
139.50 |
| 4 |
Integrated 2 (Hydro, Solar & Thermal) |
2,448,117 |
314.39 |
128.42 |
156.23 |
| |
On-Grid |
|
|
|
|
| 5 |
Integrated 3 (Hydro &Solar with immediate full utilization of solar generated electricity) |
2,483,031 |
288.80 |
116.31 |
107.60 |
| 6 |
Integrated 4 (Hydro &Solar & Thermal with immediate full utilization of solar generated electricity) |
2,594,103 |
314.39 |
121.19 |
125.80 |
Now, we turn to the second situation with a stand-alone 50 MW solar PV field. It is expected to have an average capacity factor over the year of 17.22 percent. This is set to be built in year 4 and will start generating in year 5, the same period the hydropower dam would have begun generating. The solar PV field is expected to produce electricity for 30 years. In this initial analysis the operation of the solar PV field is not integrated with the hydropower dam. In present value terms (as of the first year of hydro dam construction), using an 8 percent discount rate the solar PV plant is estimated to generate 638,775 MWh of electricity over its useful life (
Table 1, row 2, column 1). Using equations 6 and 7, the present value of all the investment and operating costs over the life of the solar project are estimated to be USD 52.83 million. Using equation 8, the LC for the solar is USD 82.74/MWh or 8.3 cents/kWh (
Table 1, row 2, column 3).
The LC for solar appears to be substantially lower than the generation of electricity by the hydro dam. However, a comparison of the LC of solar PV with hydropower or thermal generation on this basis is highly misleading. This cost does not include the cost of maintaining the reliability of the electricity service with the non-dispatchable solar PV system. The cost of maintaining the reliability of electricity service in the presence of solar PV systems needs to be included in this estimation of the LC of solar PV electricity generation.
To maintain the reliability of the electricity service, it is proposed in the third scenario that additional investment be made in penstocks, turbines, and generators to increase the generation capacity of the hydropower plant. By doing so during the hours of peak demand and times when there is no solar PV generation there will be enough hydropower generation capacity to meet the demand. The solar PV system is expected to increase the quantity of electricity generated by approximately 35 percent of the quantity generated by the hydropower plant alone. If the peak demand for electricity grows at the same percentage as the total demand for energy, then the peak electricity generation capacity would have to be increased by 25 MW to maintain the quality of the electricity service. The solar PV system is to be built in year 4, and at the same time, an additional 25 MW of generation equipment is added to the hydro power plant so that it will have a generation capacity of 95 MW.
It is assumed that this cost of expanding the power station of the hydropower complex by 25 MW of generation capacity is approximately linear from the base cost of 54.40 million for 70 MW of generation capacity. While the cost of seasonal storage dam construction varies widely per MW depending on the geology of the site, the cost of the power station per MW of generation capacity is much less variable. Hence, the estimated capital cost of adding 25 MW of generation capacity to the dam to stabilize the electricity service with the introduction of the solar PV field is approximately USD 20 million. The solar PV will generate electricity from year 5 to year 34 in tandem with the generation from the hydropower dam, which will generate electricity from years 5 to 34 (
Table 1, row 3). With an annual growth rate in the demand for electricity of 7 percent the potential electricity generation by both the dam and the solar plants will be fully utilized after 4 years of operation. When the demand for electricity grows beyond the capacity of these two plants it is assumed that it will be supplied by a further expansion of the electricity generation system.
The amount of electricity generated by the combined solar and hydropower plants is estimated annually. It is discounted to the first year of the hydro dam construction and is reported as 2,337,045 MWh in
Table 1, row 3, column 1. The integration of the solar PV system with the augmented hydropower dam capacity increases the present value of the amount of electricity generated by 27%. The present value of the costs of this combined system (integrated case 1) is now USD288.80 million. Hence, to maintain the reliability of the electricity service, the overall average cost of production of the integrated hydropower- solar PV electricity system increases from USD119.32/MWh to USD123.57/MWh or 3.6 percent of the average system production cost (
Table 1, row 3, column 3). While a solar PV field alone may appear to have a lower LC than the hydropower plant, once the cost of maintaining the reliability of the system is included, the average cost of the integrated hydro-solar PV system becomes more expensive than the stand-alone hydropower plant described here.
The estimates of the LC reported in
Table 1, column 3 are average LCs that combine the generation and costs of both the hydropower and the solar PV projects. To minimize the total system costs, it is crucial to minimize the cost of each incremental addition to the electricity supply. This LC of the incremental energy produced is estimated by the ratio of the difference in the present value of total cost between the integrated system and the hydropower plant alone over the present value of the incremental amount of electricity generated between the two situations. In this case, the incremental levelized cost of the electricity increased to USD 139.50/MWh (
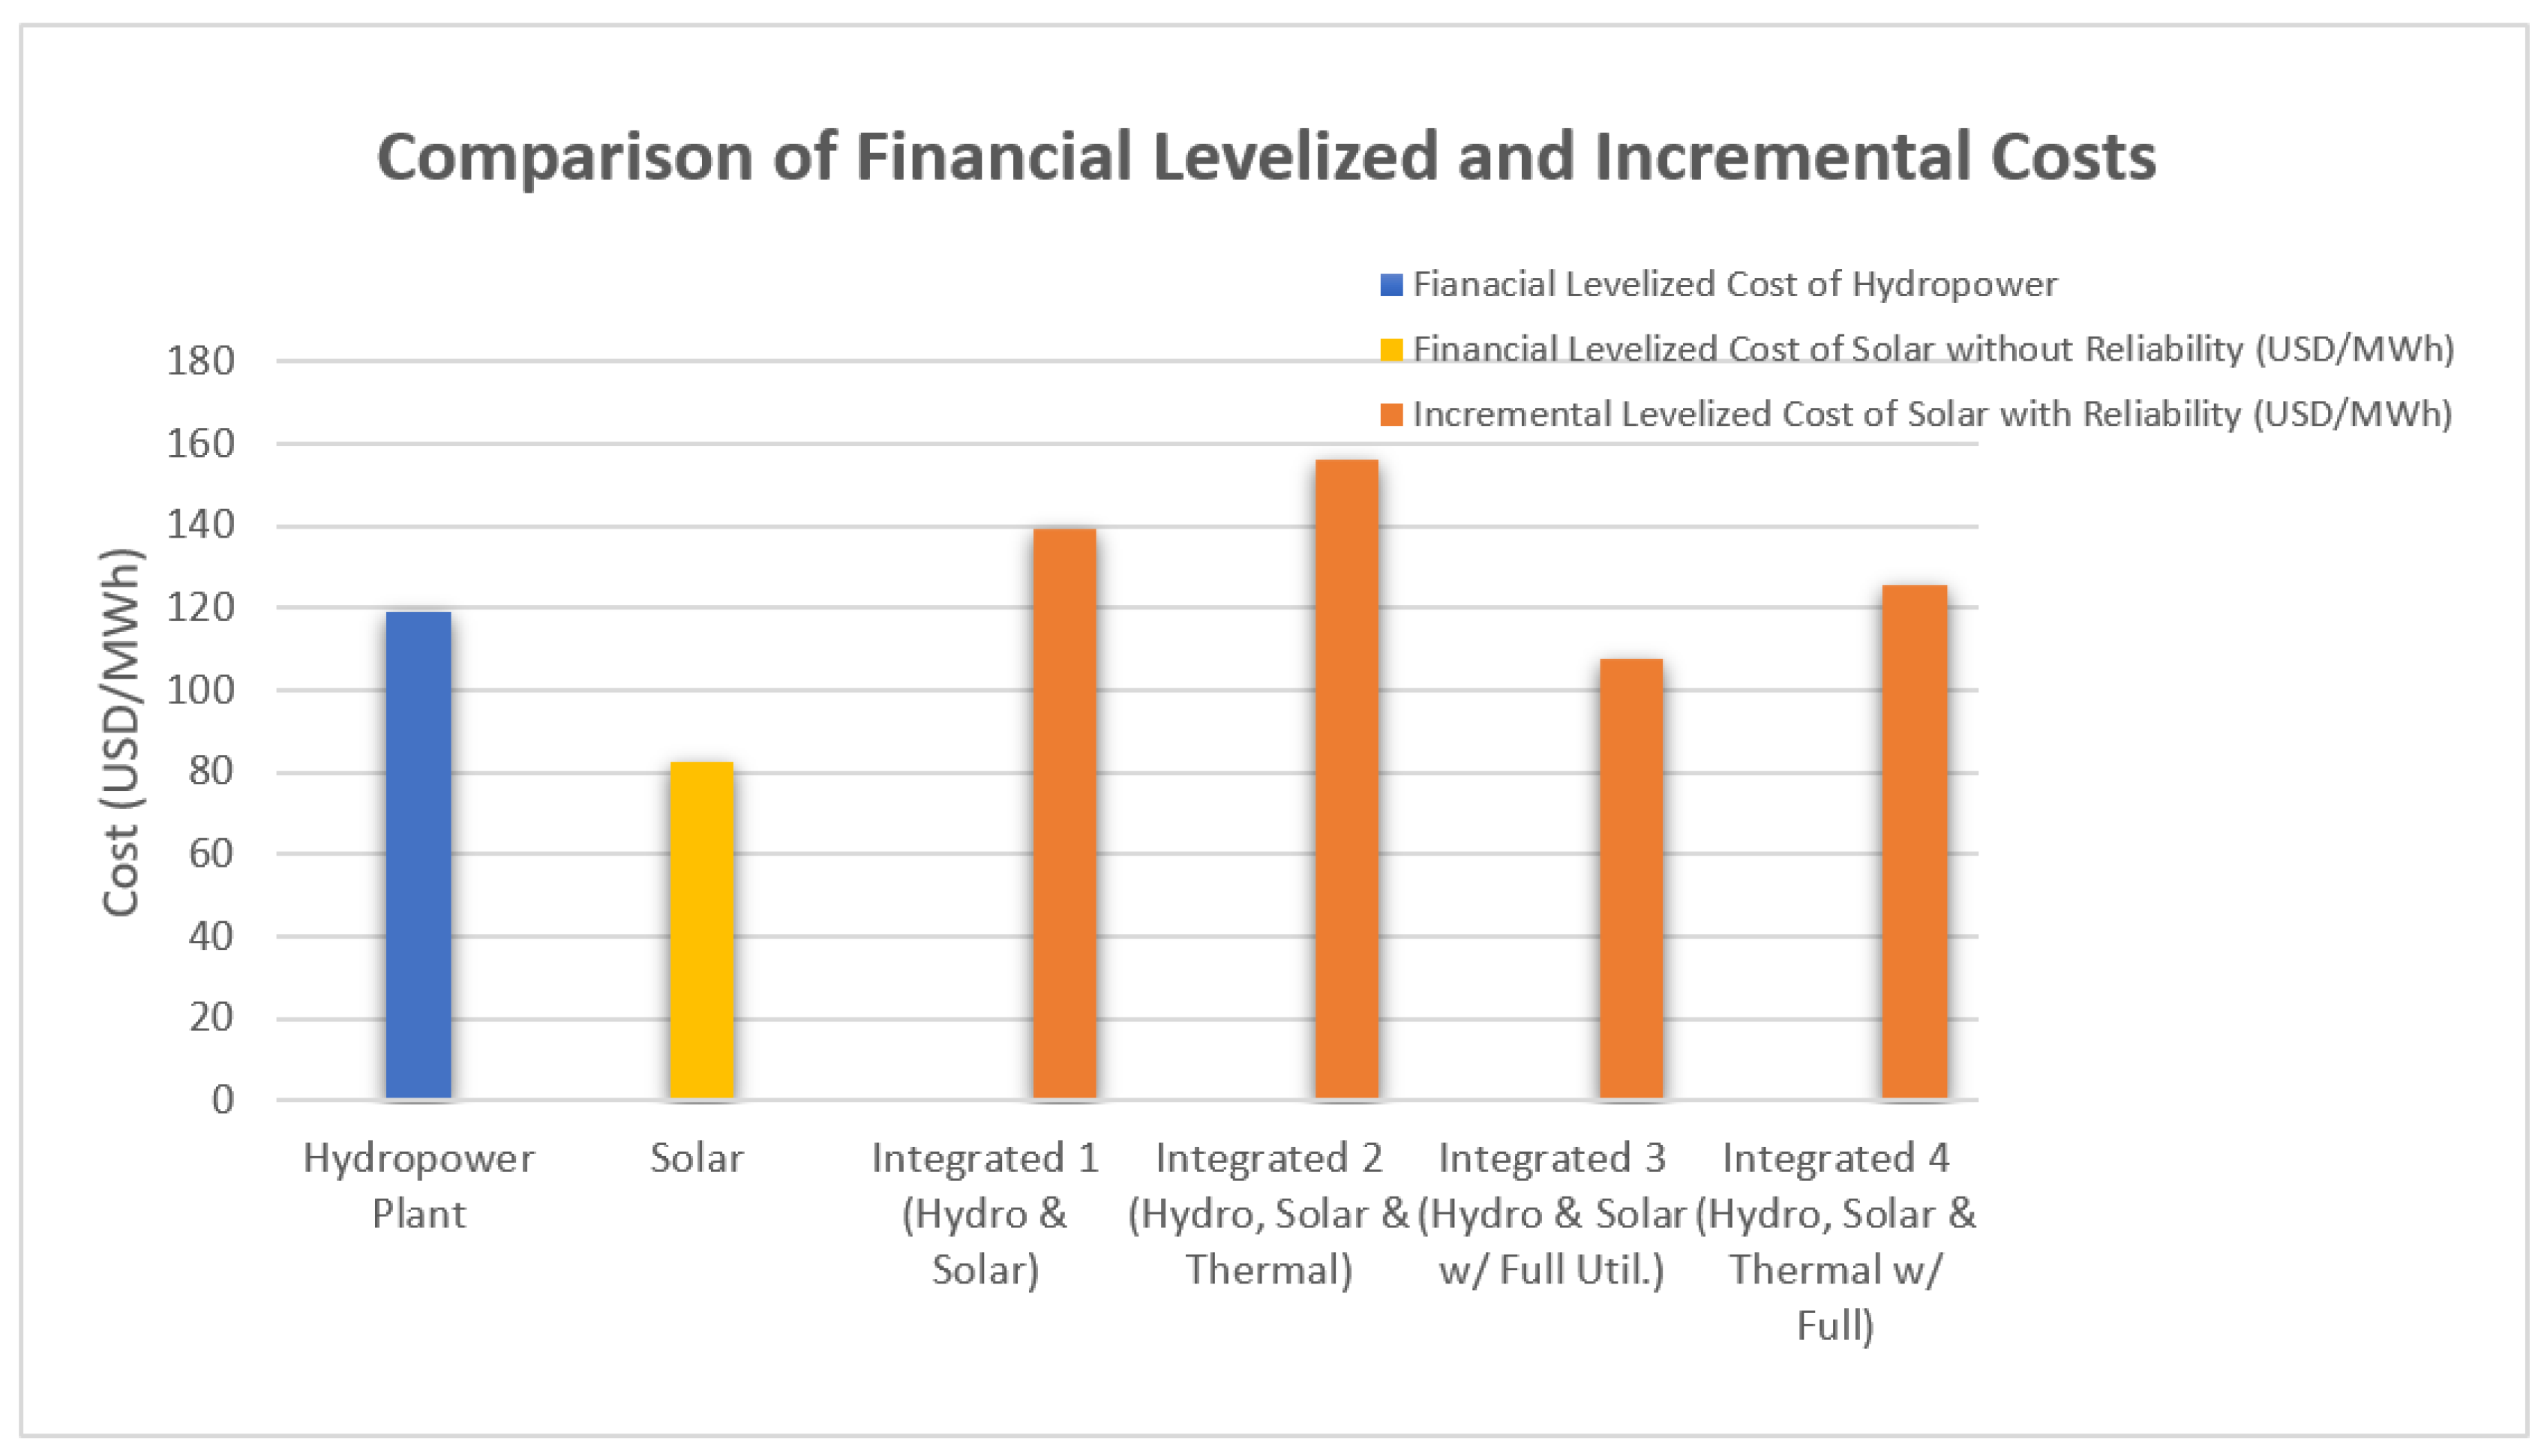
Table 1, row 3, column 4) or an increase of 68.6% above the cost of the production of electricity with solar but without reliability. These results are also shown in
Figure 1.
There are two factors that can cause the LC of the incremental electricity to be greater than either the average cost of the stand-alone solar PV or the average LC for the combined system. First, there is the additional capital costs that must be added to the generation costs of the system to maintain the reliability of the electricity service. These additional capital costs should be allocated only to the incremental electricity that is coming from the operation of Solar PV system. Second, in the case where the system is not integrated with a wider electricity grid not all the electricity generated by the solar PV plant will be consumed in the initial years of its operation. For this reason, the incremental LC electricity consumed will greater than the average LC for the entire integrated system. When these generation plants are connected to a wider grid that has an excess demand for electricity, this second cause for there being a higher-than-average incremental LC will not be present.
In this third scenario, it was assumed that not all the electricity supplied by the combined system could be used immediately. It was not until the fourth year of production when all the energy produced by the combined generation system could be consumed. Because of the lack of demand by the community some of the electricity generation would have to be curtailed. This would be descriptive of a system that was operating off grid from the rest of the country.
The fourth scenario the integration of the solar PV field with the original 70 MW hydro dam is accompanied by the inclusion of a 25 MW simple cycle thermal generation plant powered by heavy fuel oil (HFO). The thermal plant replaces the cost of the investment in additional generation capacity that was added to the hydropower plant that was a component of the third scenario. As it will be used primarily for generation during the peak hours it is assumed that its capacity factor will be 10 percent.
Again, in this scenario the demand for electricity in the community is equal to the production of the hydro dam’s first year of operation. Subsequent years the demand for electricity is assumed to grow by 7 percent a year. The growth rate in the demand for peak generation capacity is also set equal to the growth in demand for energy. Hence, when the demand for energy has grown sufficiently to absorb the total amount of electricity, the full amount of the additional 25MW of thermal generation capacity will be needed to be added to the generation system to maintain the reliability of the electricity service. With these parameter values, the demand for electricity will fully absorb all the potential electricity generated 5 years after its initial start of generation.
The amount of electricity generated by the solar- hydropower-thermal system is estimated annually for the case where there is this growth in the demand for energy. When discounted to the first year of the construction of the dam the present value of the electricity generated is 2,448,117 MWh (
Table 1, row 4, column 1). The present value of the costs of the combined system (integrated case 2) is now USD 314.39 million, yielding an LC of USD 128.42 MWh or 12.84 US cents/kWh (
Table 1, row 4, column 3). In this case, the LC with the integrated system is substantially higher than the USD119.32/MWh for the hydropower plant alone and much higher than the USD 82.74 cost of the stand-alone solar field. The integration of the solar PV system with the augmented power generation plant raises the present value of the quantity of electricity generated by 33%. However, maintaining the reliability of the electricity supply comes at a cost. The overall average cost of production of the integrated hydropower-solar PV electricity system increases from USD 119.32/MWh to USD 128.42/MWh or 7.6 percent of the production costs of electricity for the system (
Table 1, row 4, column 3).
In this case the LC of the incremental electricity generated by this system is increased to USD 156.23/MWh, (
Table 1, row 4 column 4). This is 89 percent greater than the LC of the stand-alone solar plants of USD82.74/MWh. The relative size of the LC of the incremental electricity provided by the solar PV with reliability to the LC of the stand-alone solar PV is shown in
Figure 1.
In the fifth and sixth scenario, however, the limit on the amount of energy demanded is removed. In this case all the energy by the combined hydropower and solar PV plants could be consumed immediately by the customers on the system.
In the fifth scenario the 30 years of operation of the combined hydropower and solar PV generation would produce in present value terms a total of 2,483,031 MWh (
Table 1, row 5, column 1). Given the present value of the total capital and operating cost of system for 30 years of USD 288.80 million the LC of the integrated system is USD 116.31/ MWh (
Table 1, row 5 col 3). When we consider the incremental cost of the electricity generated by the solar PV system when reliability is being maintained by the hydropower plan the LC is USD 107.60 or 30 percent greater than the LC of the electricity produce by solar PV (
Table 1, row 5, col 4).
In the sixth scenario the demand for electricity is sufficiently large so that all the electricity can be utilized immediately from the hydropower station, solar PV field and the thermal peaking plant (operating with a capacity factor of 10%). In this case the present value of the amount of electricity generated and consumed is increased to 2,594,103 MWh which results in an average LC is USD 121.19 with the LC of the incremental electricity generated of USD 125.80/MWh. This LC of the incremental electricity generated is 52 percent higher than the LC cost of the stand-alone solar PV plant without reliability.
When the results of scenarios 3 and 5 are compared with 4 and 6, the results show that it is much less expensive to expand the generation capacity of the hydropower station than to add a simple cycle thermal electricity generator to maintain reliability of the electricity service of the system. The range of LCs for the incremental electricity generation by the solar PV field is from 30% to 68% higher than the stand-alone solar PV field when the reliability is provided by increasing the generation capacity of the hydropower plant. However, when reliability is provided by introducing a simple cycle HFO fired thermal plant the range of incremental LCs is from 52 percent to 89 percent greater than the LC for a stand-alone solar PV plant operating without reliability. The results of this case study are shown as the two right bars in
Figure 1. They illustrate the substantial costs associated with providing reliability to solar PV systems. At the same time, it illustrates the potential cost saving from integrating solar PV systems with seasonal storage hydropower dams, (if they are available) rather than provide reliability through simple cycle thermal plants.
4.2. Economic Cost
To undertake an economic analysis of the LC for the hydropower dam, the solar PV field, and the integrated systems, one needs to convert all the financial prices used in estimating the financial costs of this system into their economic values. The commodity specific conversion factors (CSCFs) for many goods and services in Ghana have been estimated and published on the website of the Ministry of Finance of Ghana [
22]. The CSCFs used in this study were multiplied by each of the financial costs to estimate each of the economic costs obtained from this source. The quantitative values of the CSCFs used are reported in
Appendix A,
Table A1. The results of this analysis are reported in
Table 2, rows 1 to 6.
The main factors driving a wedge between the financial and economic values of the various cost components are the various taxes and import duties that cause the economic costs to be lower than the financial costs. One such factor is the substantial tax rate of 10 percent levied on the imports of HFO into Ghana. Partially offsetting these taxes and import duties is the foreign exchange premium, which tends to increase the economic cost of such imported components.
4.2.1. Economic Analysis Results
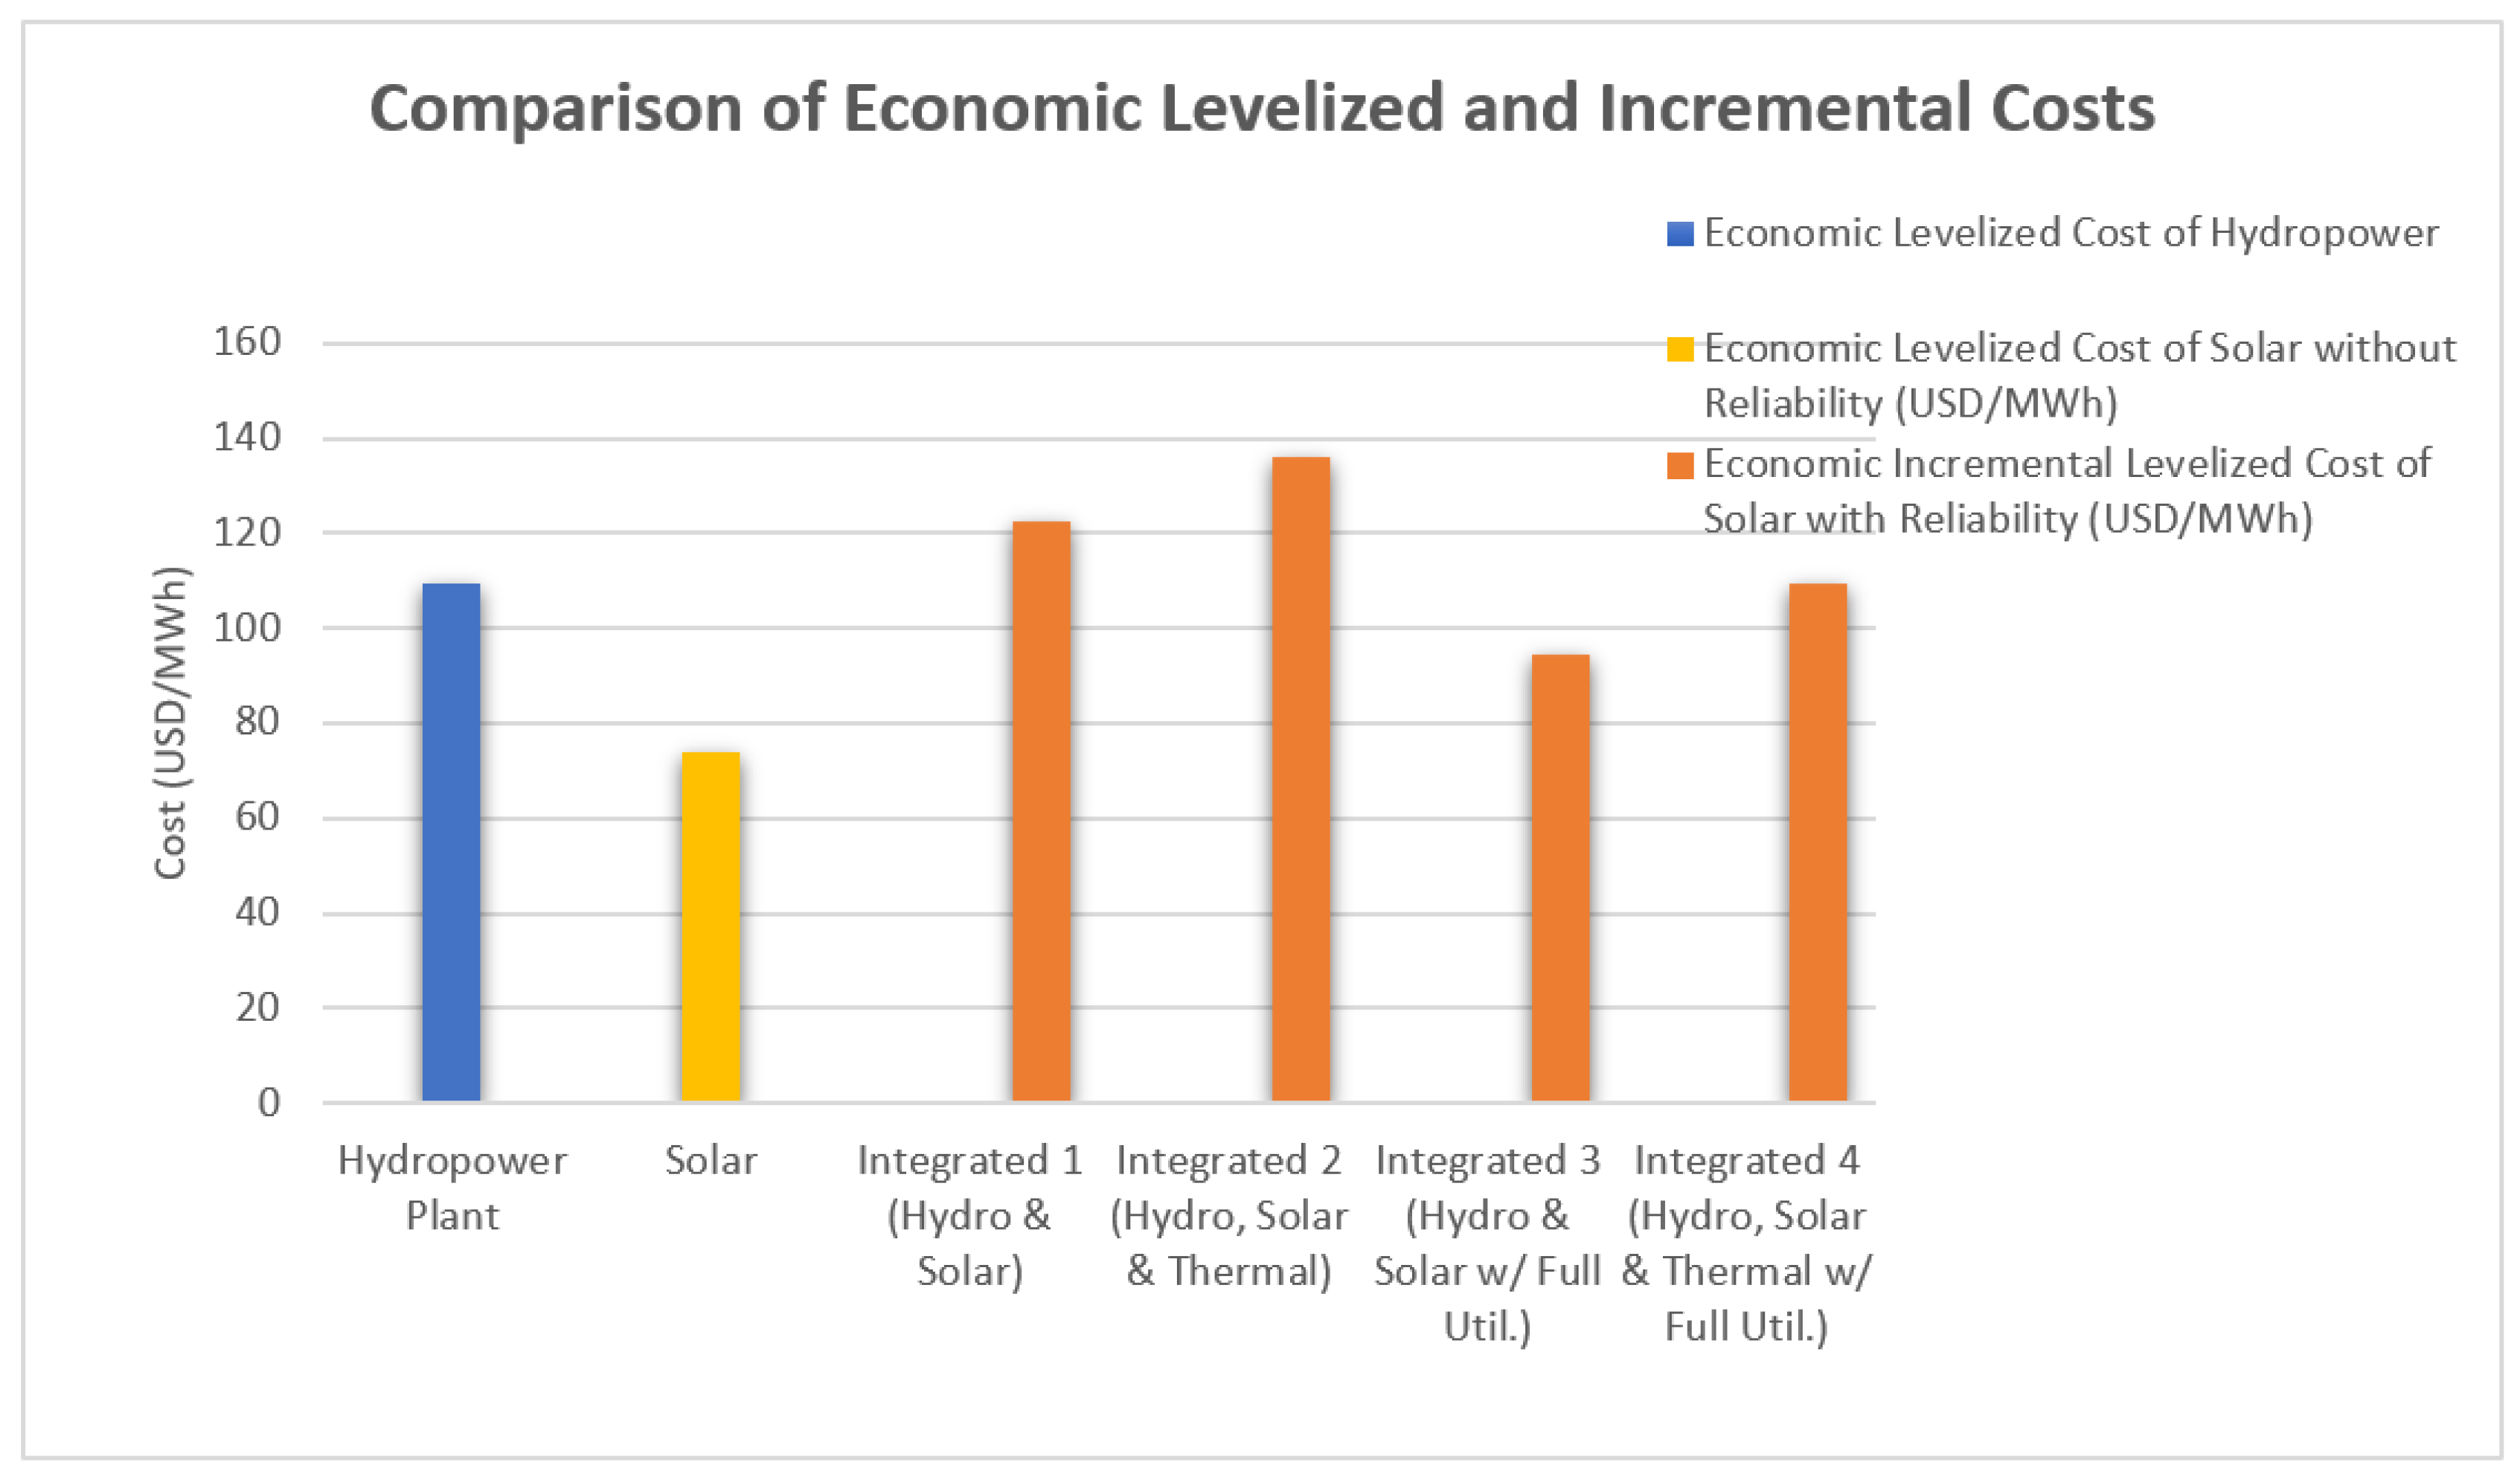
When employing a discount rate of a real 8 percent, the economic LC costs of generating electricity from the hydropower dam alone are approximately (8.1%) lower than their financial cost (USD109.65/MWh versus USD119.32/MWh), while for the solar PV system, the economic costs are approximately (10.8%) lower than their financial costs. When the two systems are integrated, the LC falls to USD112.33/MWh for the hydro dam-solar system and is only slightly higher at USD116.18/MWh if the hydro dam-solar-thermal peaking system is implemented. These values are again approximately 10 percent lower than their counterpart financial values (
Table 2, row 4 column 3).
When the demand for electricity constrains the immediate utilization of the electricity generated by the solar PV field, the economic LC costs of the incremental output generated by the integrated systems ranges from USD122.40/MWh to USD136.16/MWh (
Table 2, column 4, rows 3 and 4). For the case when all the electricity generated can be immediately consumed by the demand facing the electricity system then LCs of the incremental electricity generated by the integrated systems ranges from USD 94.41 to USD 109.64 /MWh. Considering the integration of the hydropower plant and the solar PV the LCs of the incremental electricity generated ranges from 28 percent to 66 percent higher than the LC of the stand-along solar PV system. For the case of the integration of the hydropower plant, solar field and peaking thermal plant the LCs of the incremental electricity utilized by the system ranges from 49 percent to 85 percent higher than the LC of the stand-alone solar system. These results are given in
Table 2 and illustrated in
Figure 2.
From a global perspective the economic costs of the incremental electricity generated using a simple cycle thermal plant for maintaining service reliability is understated in this study. In this analysis the additional economic environmental cost of carbon emissions from the thermal plants generation has not been included.
Table 2.
Economic levelized cost of electricity in 2020 prices.
Table 2.
Economic levelized cost of electricity in 2020 prices.
| Row no. |
Components of financial appraisal |
Net present value of energy generation (MWh) |
Net present value of energy cost (USD) |
Levelized cost @8%
(USD/MWh) |
Levelized cost @8% of incremental energy
(USD/MWh) |
| |
|
1 |
2 |
3 |
4 |
| 1 |
Hydropower plant |
1,844,584 |
202.25 |
109.65 |
- |
| 2 |
Solar |
638,447 |
47.12 |
73.80 |
- |
| |
Off-grid |
|
|
|
|
| 3 |
Integrated 1 (Hydro & Solar) |
2,337,045 |
262.53 |
112.33 |
122.40 |
| 4 |
Integrated 2 (Hydro, Solar & Thermal) |
2,448,117
|
284.43
|
116.18
|
136.16
|
| |
On-Grid |
|
|
|
|
| 5 |
Integration 3 (Hydro & Solar with full utilization of solar generated electricity) |
2,483,031 |
262.52
|
105.73
|
94.41
|
| 6 |
Integration 4 (Hydro, Solar & Thermal with full utilization of solar generated electricity) |
2,594,103 |
284.43 |
110.28
|
109.64 |
As in the financial analysis the results of the economic analysis of this case study illustrate the substantial economic costs associated with providing reliability to solar PV systems. At the same time, it illustrates the potential economic cost savings from integrating solar PV systems with seasonal storage hydropower dams rather than provide reliability through simple cycle thermal plants. However, these results are very much determined by the cost of the solar PV system, the costs of adding more generation capacity to the hydropower dam, or alternatively, the capital and operating costs of a simple cycle thermal generation plant.
Figure 2.
Comparison of Economic Levelized and Incremental Costs.
Figure 2.
Comparison of Economic Levelized and Incremental Costs.
4.3. Assessing the Impact of the Financial and Economic Cost of Project Finanacing
The crisis in the Electricity Sector in Sub Sahara Africa has been clearly identified as being one of a shortage of investment funds [
23,
24]. This problem has been further exacerbated by the reluctance of the international financial institutions to finance thermal electricity generation in favour of renewable generation technologies. These technologies are the most capital intensive and apart from hydropower provide no reliability of service. Without the assistance from the multilateral financial institutions for traditional thermal generation, the countries of Sub Sahara Africa face extremely restrictive financing at much higher costs than the developed countries are required to pay.
This section investigates the sensitivity of the levelized cost of electricity generation on the opportunity cost of the funds used in the financial and economic analysis. In each of the integrated situations examined the analysis is carried out using cases three and four. In these cases, the additional electricity from the solar PV field is not fully consumed for the initial 4 or 5 years of its initial operating life.
Because renewable generation technologies, both hydropower and solar PV, are highly capital-intensive with minimal operating costs, the cost of funds, both financial and economic, are critical parameters. In the base case, the analysis of the LC has so far been carried out using an 8% real discount rate. The following analysis shows how any estimate of the levelized cost of renewable electricity generation is critically determined by the financial and economic cost of the funds used to finance the investment.
The impact of the cost of funds used to finance capital investments on the average LC of energy produced is tested for discount rates from 2% to 11.5%. Increasing the discount rate from 2 to 8 percent has the effect of increasing the financial LC of the hydropower dam alone by approximately 145 percent,, from USD 48.67/MWh to USD 119.32/MWh. A further increase of the real discount rate from 8% to 11.5% raises the financial LC to USD 169.18/MWh, or a further 42 percent (
Table 3, row 1).
In the case of the stand-alone solar PV field increasing, the discount rate from 2% to 8% increases the LC from USD 49.46/MWh to USD 82.74/MWh, or an increase of 67 percent. When a 11.50 real discount rate is used the LC will rise a further 28 percentto USD 105.62/MWh.
For the integrated hydropower plus solar PV system, the impact of the increase in the discount rate from 2% to 8% will raise the LC of the generated electricity over the lifetime of the project by 129 percent or from USD 53.92/MWh to USD 123.57/MWh. When the discount rate is further increased to 11.5%, the financial LC is increased by a further 41 percent to USD 174.15/MWh (
Table 3, row 3).
For the integrated system of hydropower-solar PV with additional thermal plant for meeting peak demands, the impact of the increase in the discount rate from 2% to 8% will raise the LC of the generated electricity over the lifetime of the project by 109 percent or from USD 61.49/MWh to USD 128.42/MWh. When the opportunity cost of capital is raised to 11.5% the LC will increase a further 38 percent to USD 177.57/MW (
Table 3, row 3).
From these estimates of the financial LC, policies to lower the private cost of finance either through measures to reduce private sector risk or perhaps subsidized finance from high income countries is critical in making such renewable generation facilities affordable in low-income countries.
Table 3.
Financial and economic sensitivity analysis for a range of discount rates.
Table 3.
Financial and economic sensitivity analysis for a range of discount rates.
| Row no. |
|
Levelized cost
@2%
($/MWh)
|
Levelized cost
@4%
($/MWh) |
Levelized cost
@6%
($/MWh) |
Levelized cost
@8%
($/MWh)
|
Levelized cost
@10%
($/MWh) |
Levelized cost
@11.50%
($/MWh) |
| |
|
1 |
2 |
3 |
4 |
5 |
6 |
| |
Financial analysis |
|
|
|
|
|
|
| 1 |
Hydropower plant |
48.67 |
70.21 |
93.73 |
119.32 |
147.02 |
169.18 |
| 2 |
Solar plant |
49.46 |
59.46 |
70.62 |
82.74 |
95.60 |
105.62 |
| 3 |
Integrated 1 (Hydro & Solar) |
53.92 |
74.77 |
97.97 |
123.57 |
151.58 |
174.15 |
| 4 |
Integrated 2 (Hydro, Solar & Thermal)
|
61.49 |
81.41 |
103.70 |
128.42 |
155.60 |
177.57 |
| |
Economic analysis |
|
|
|
|
|
|
| 5 |
Integrated 1 (Hydro & Solar) |
48.68 |
67.73 |
88.93 |
112.33 |
137.94 |
158.58 |
| 6 |
Integrated 2 (Hydro, Solar & Thermal)
|
55.01 |
73.21 |
93.58 |
116.18 |
141.03 |
161.14 |
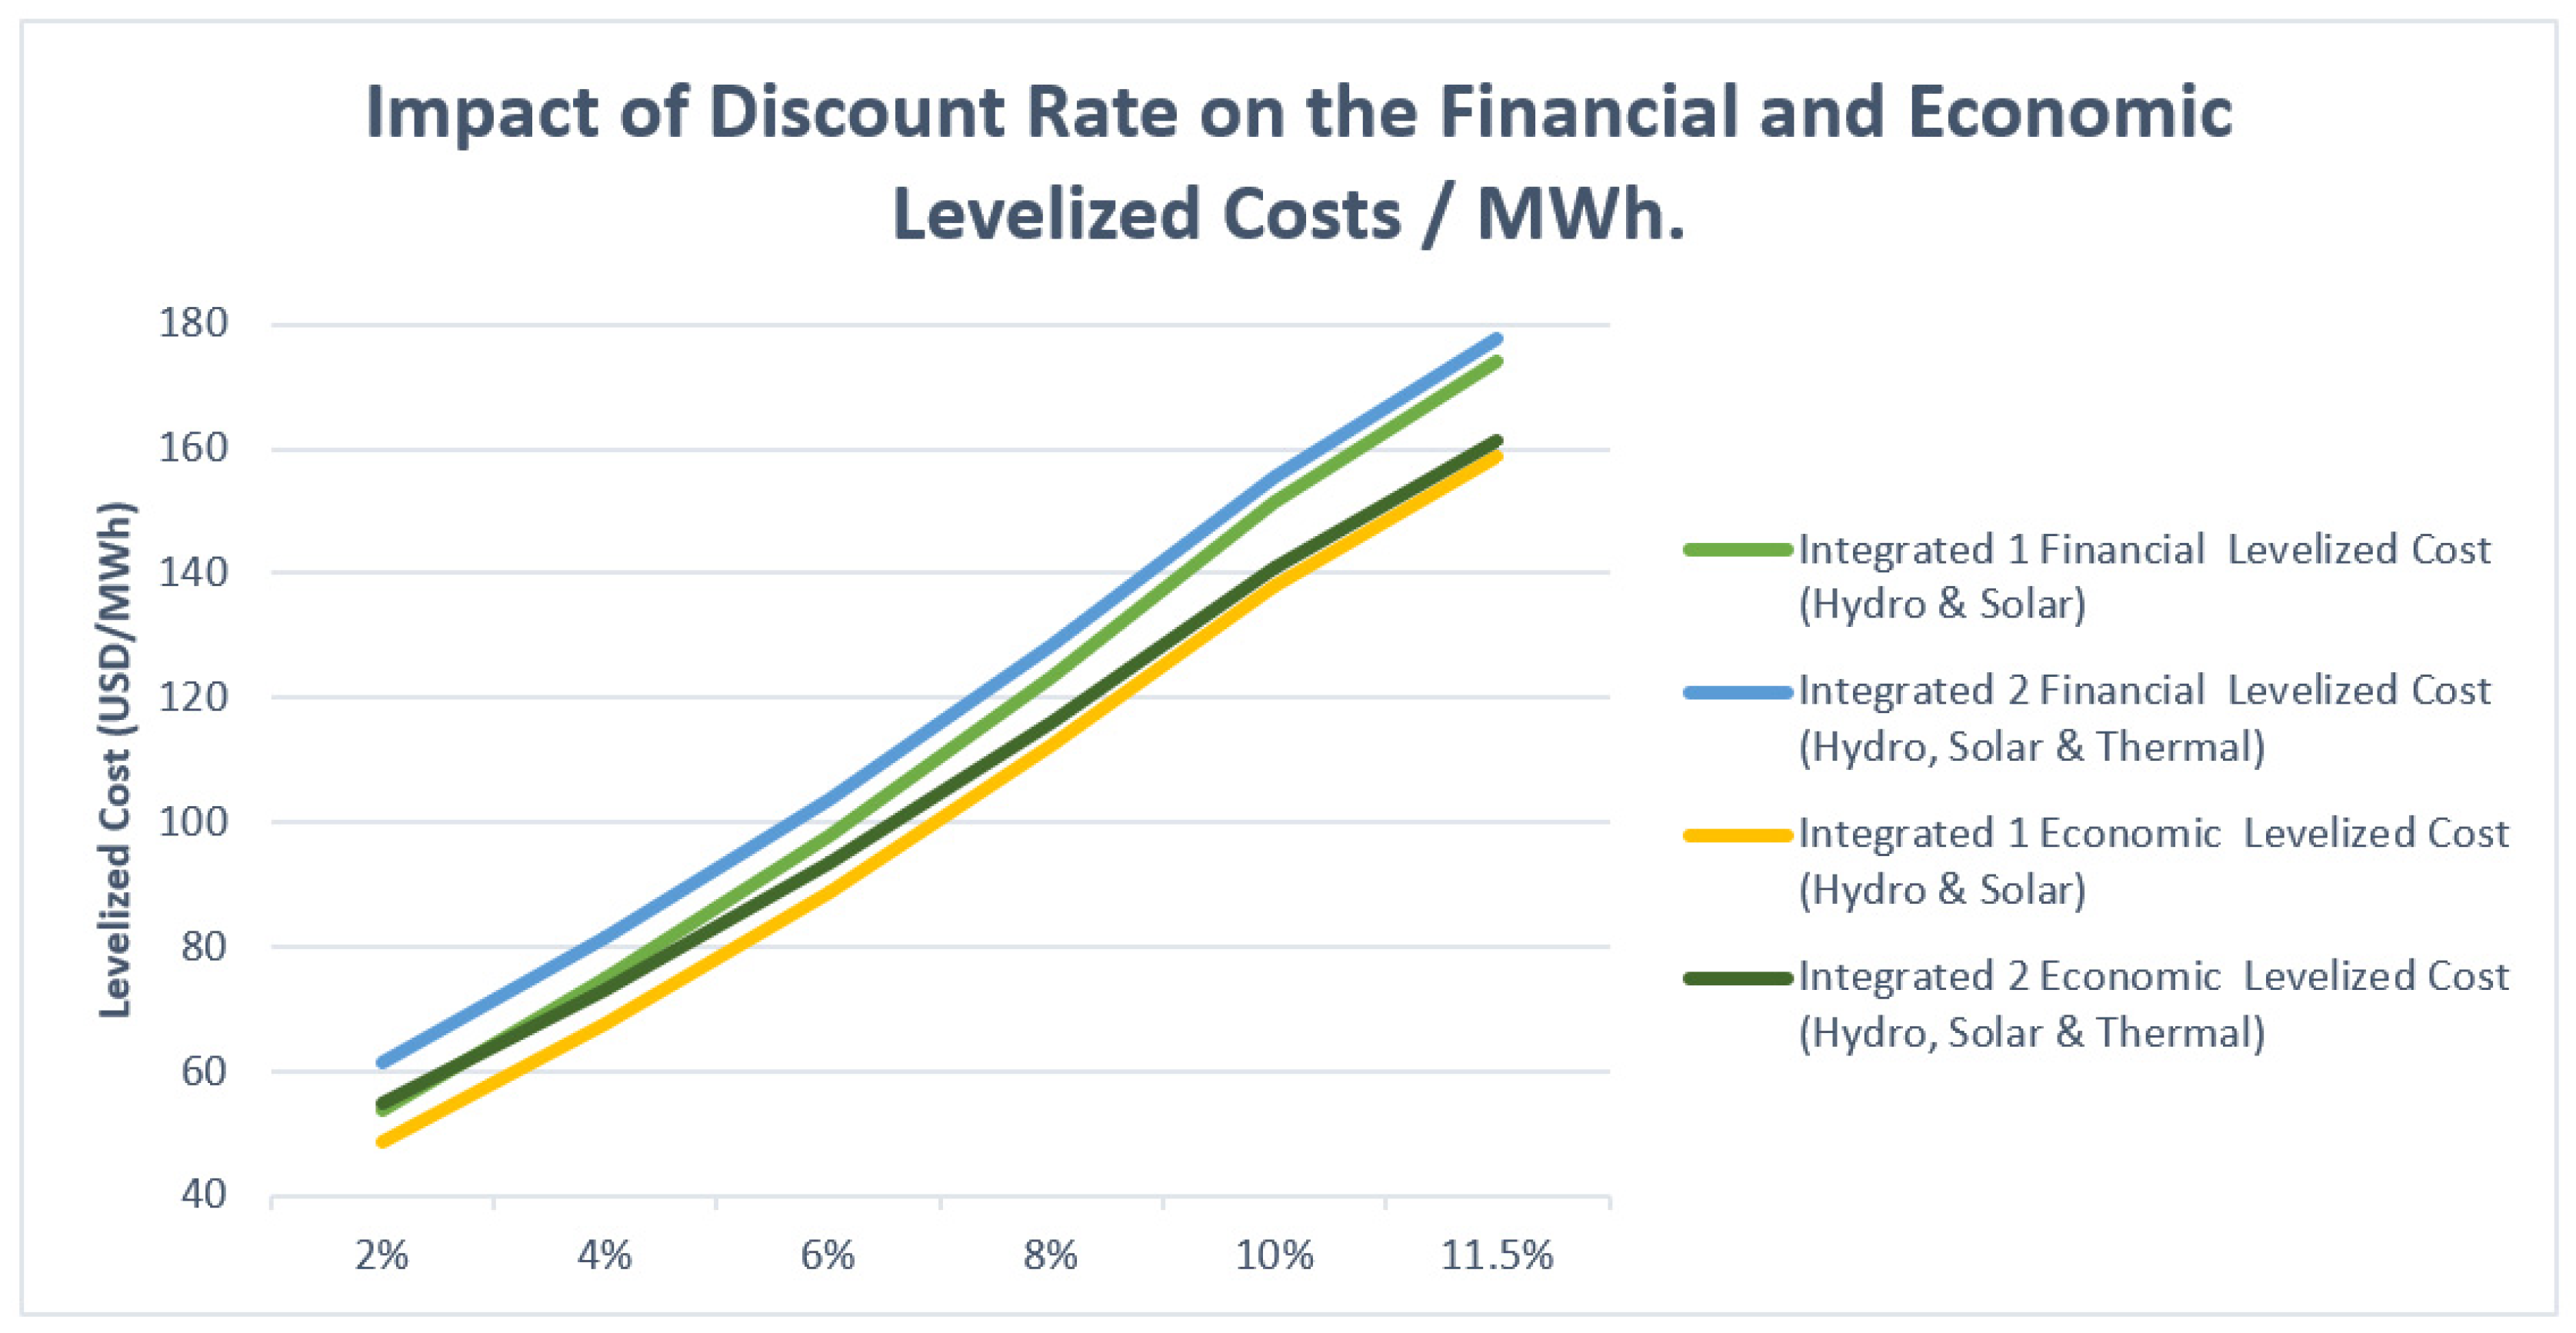
In Ghana, the official recommended discount rate to use when conducting an economic appraisal of an investment project is a real rate of 11.5% (The Ghanaian National Parameters and CSCFs Database). This has important implications for project selection in Ghana’s electricity generation sector. The impact of increasing the discount rate to 8% and 11.5% increases the economic LC of the integrated system of hydropower and solar from USD112.33/MWh to USD158.58/MWh or by 41percent. For the integrated system 2 with the combination of hydropower
—solar PV plus a small thermal plant to augment the system during peak periods, when the economic discount rate is raised from 8% to 11.5%, the LC is raised from USD116.18 /MWh to USD 161.14/MWh or percent% (
Table 3, rows 4 and 5). The impact on the discount rate on the financial and economic LC of the two integrated system is illustrated in
Figure 3.
These results show that for developing countries with high opportunity costs for investable funds, the cost of investing in renewable electricity generation is significantly more expensive than for industrialized countries with greater access to much lower financing costs. Hence, when the policies of donor countries and international financial institutions urge developing countries to invest exclusively in renewable generation technologies to mitigate global climate change, significant financial assistance from developed countries is warranted. Only minimal benefits will accrue to these countries from their efforts to bring about a reduction in their GHG emissions.
Otherwise, the push by the high-income countries of the world for developing countries to generate electricity using only renewable technologies will result in a very heavy financial and economic burden on the electricity consumers of poor countries.
5. Conclusions and Implications for Policy
These findings lead to the conclusion that where a reasonably low-cost site is suitable for a seasonal storage dam, consideration should be given to designing it so that it can be integrated with one or more solar PV fields. By combining a solar PV field with a seasonal storage hydropower dam, the overall system can potentially generate more electricity in a cost-effective manner to meet the rising demand for electricity while maintaining the reliability of the service. Such a favourable outcome depends heavily on the capital costs associated with increasing the generation capacity of the hydropower dam facility. Alternatively, it depends on the capital and fuel costs of operating a small thermal generator to stabilize the system as the quantity of solar generation increases.
From these estimates of LC, expanding the generation capacity of the hydro power plant might be more cost effective than relying on single cycle or diesel generation to meet the additional peak demand needs for such a system. The incremental financial LC of a hydropower-solar PV integrated system using an 8 percent cost of capital is quite competitive ranging from 10.7 to 14 cents/kWh. The corresponding economic LCs range from 9.4 to 12.2 cents/kwh. For an integrated system including hydropower, solar PV and simple cycle thermal the incremental financial LCs range from 12.5 to 15.6 cents/kWh while the economic LCs for the incremental energy produced and consumed ranges from 10.9 to 13.6 cents/kWh.
However, the LCs of these renewable electricity generation technologies are critically determined by the financial and economic cost of capital. Low estimates of the levelized cost of electricity are fundamentally linked to low-cost sources of financing
A further attraction of using hydropower storage dams operating in collaboration with solar and wind renewable energy generation technologies is that these systems eliminate the physical and political difficulties of contracting for the purchase and transportation of the fuel supplies required by thermal plants to remote regions. Unfortunately, for low-income countries facing high economic opportunity costs of capital, the policy of generating significant quantities of electricity by such renewable technologies might be prohibitively expensive, given the extreme capital intensity of these technologies.
Author Contributions
Conceptualization, G.P.J. and M.M.; methodology, J.N.A.A., M.R., M.M., G.P.J.; formal analysis, J.N.A.A.; data curation, M.M; writing—original draft preparation, J.N.A.A.; writing—review and editing, G.P.J. and M.R.; supervision, M.R.; All authors have read and agreed to the published version of the manuscript.
Funding
This research received no external funding
Data Availability Statement
The financial and economic excel models are available upon request from the corresponding author.
Acknowledgments
The assistance of David Shobowale at the initial stages of this study is greatly appreciated. The comments from the participants at the presentations of this research in seminars at the Center for Applied Research in Business, Economics and Technology, at Cyprus International University, were very helpful.
Conflicts of Interest
The authors declare no conflicts of interest.
Appendix A
Table A1.
Hydropower generation dam: Technical parameters and capital expenditure (USD million, 2020).
Table A1.
Hydropower generation dam: Technical parameters and capital expenditure (USD million, 2020).
| Row no. |
Type |
Estimated cost |
| Dam costs |
| 1 |
Dam civil works |
122.45 |
| 2 |
Hydro-mechanical equipment |
11.30 |
| 3 |
Engineering and supervision |
10.70 |
| 4 |
Owner’s costs |
2.70 |
| 5 |
Resettlement and land acquisition |
22.50 |
| 6 |
Emergency preparedness plan |
0.20 |
| 7 |
Environmental management plan |
6.25 |
| 8 |
Total capital cost of dam |
176.10 |
| Hydropower plant costs |
| 9 |
Hydropower plant civil works |
8.60 |
| 10 |
Hydropower plant equipment |
40.80 |
| 11 |
Engineer and supervisor |
4.00 |
| 12 |
Owner’s costs |
1.00 |
| 13 |
Total capital cost of hydropower plant |
54.40 |
| 14 |
Total capital cost dam and hydropower plant |
230.50 |
| 15. |
Annual operation and maintenance costs—dam and hydropower plant |
2.40 |
| Technical specifications |
| 16 |
Construction period |
4 years |
| |
Length of life of Dam |
100 years |
| |
Length of life of hydropower plant |
30 years |
| 17 |
Operational period |
5–34 years |
| 18 |
Liquidation period |
Year 35 |
| 19 |
Initial installed capacity |
70 MW |
20
21 |
Added capacity if integrated with solar for reliability
Expected annual generation in year 5 |
25 MW
206,403.12 MWh |
| 22 |
Capacity factor |
34% |
Table A2.
Solar PV—Technical parameters and capital expenditure (USD million, 2020).
Table A2.
Solar PV—Technical parameters and capital expenditure (USD million, 2020).
| Row no. |
Type |
Estimated cost |
| 1 |
Land |
0.35 |
| 2 |
Modules |
16.28 |
| 3 |
Inverters |
3.38 |
| 4 |
Balance of system electrical (interconnection) |
9.11 |
| 5 |
Balance of system structural |
6.78 |
| 6 |
Civil works |
2.66 |
| 7 |
Labor |
8.41 |
| 8 |
Soft costs |
0.81 |
| 9 |
Other, contingency and margin |
7.85 |
| 10 |
Total investment cost (no hydropower plant augmentation) |
55.60 |
| 11 |
Cost of additional 24.6 MW of hydropower plant |
20.00 |
| 12 |
Total investment cost (hydropower plant augmentation) |
75.60 |
| 13 |
Annual total operating cost—Solar PV |
0.97 |
| Technical specifications |
| 14 |
Construction period |
1 year |
| 15 |
Operational period |
Years 5–34 |
| 16 |
Liquidation period |
Year 35 |
| 17 |
Installed capacity |
50 MW |
18
19 |
Total number of modules
Expected Annual Generation in year 5 |
172,753
75,423.60 MWh |
| 20 |
Capacity factor |
17.22% |
| 21 |
Annual generation degradation |
0.60% |
Table A3.
Thermal Plant—Capital Costs and Technical parameters (2020).
Table A3.
Thermal Plant—Capital Costs and Technical parameters (2020).
| Row no. |
Type |
Estimated cost |
| 1 |
Total investment cost of 25 MW thermal plant 0.7 million USD/ MW |
$17.50 |
| 2 |
Annual Fixed Cost |
15,000.00 USD/MW |
| 3 |
Variable cost |
4.25 USD/MWh |
| 4 |
Real Cost of HFO inclusive of taxes (average 2010-2020) |
571.00 USD/Ton |
| |
|
|
| Technical specifications |
|
| 5 |
Construction period |
1 year |
| 6 |
Operational period |
Years 5–34 |
| 7 |
Liquidation period |
Year 35 |
| 8 |
Installed capacity |
25 MW |
| 9 |
Capacity factor |
10% |
| 10 |
Energy Content of HFO |
11.11 MWh/Ton |
| 11 |
Plant Efficiency |
43% |
Table A4.
Commodity-specific conversion factors used.
Table A4.
Commodity-specific conversion factors used.
Item
Conversion factor |
|---|
Hydropower plant
|
|
| Capital cost |
|
| Residual Value |
0.9166 |
| Dam civil works |
0.9166 |
| Dam and hydro-mechanical equipment |
0.9030 |
| Dam engineering and supervision |
1.0660 |
| Dam owner’s costs |
1.0660 |
| Resettlement and land acquisition |
1.0000 |
| Dam emergency preparedness plan |
1.0660 |
| Environmental management plan |
1.0660 |
| Hydropower plant civil works |
0.9166 |
| Hydropower plant equipment |
0.8273 |
| Hydropower plant engineering and supervision |
1.0660 |
| Hydropower plant owner’s costs |
1.0660 |
| Operation and maintenance cost |
|
Annual operation and maintenance cost—dam and hydropower plant
|
0.8651 |
| Solar Plant |
|
| Capital cost |
|
| Extra generation cost |
0.8289 |
| Land |
1.0000 |
| Modules |
0.8690 |
| Inverters |
0.8690 |
| Balance of system structural |
0.9166 |
| Balance of system electrical (interconnection) |
0.8690 |
| Civil works |
0.9166 |
| Labor |
0.9200 |
| Soft costs |
0.8941 |
| Other, contingency and margin |
0.8941 |
| |
|
| Operation and maintenance cost |
|
| Spare parts/maintenance CAPEX |
0.8690 |
| Cleaning/washing |
0.8400 |
| Annual plant inspection |
0.8923 |
| Administration |
0.8923 |
| Security |
0.8941 |
| Vegetation management |
0.8941 |
| Inverter maintenance/replacement |
0.8690 |
| |
|
| Other operation and maintenance |
|
| Employees |
0.9200 |
| Environmental/social costs |
0.8941 |
| Insurance |
1.0660
|
Thermal Plant
Capital Cost
|
0.8289 |
Operation and maintenance cost
|
|
| Fixed O&M |
0.9200 |
| Variable O&M |
0.9200 |
| Heavy Fuel Oil |
0.8420 |
References
- Lacerda, J.S.; Van Den Bergh, J.C.J.M. Mismatch of wind power capacity and generation: Causing factors, GHG emissions and potential policy responses. J. Clean. Prod. 2016, 128, 178–189. [CrossRef]. [CrossRef]
- Brown, T.W.; Bischof-Niemz, T.; Blok, K.; Breyer, C.; Lund, H.; Mathiesen, B.V. Response to ‘Burden of Proof: A Comprehensive Review of the Feasibility of 100% Renewable-Electricity Systems.’ Renew. Sustain. Energy Rev. 2018, 92, 834–847. [CrossRef]. [CrossRef]
- Van Kooten, G.C. FELLOWS ADDRESS California Dreaming: The Economics of Renewable Energy. Can. J. Agric. Econ. 2017, 65, 19–41. [CrossRef]. [CrossRef]
- Harby, A.; Schäffer, L.E.; Arnesen, F.; Bauhofer, P.; Beckitt, A.; Bockenhauer, S.; Botterud, A. et al. “Flexible hydropower providing value to renewable energy integration.” White Paper. IEA Hydropower, Annex IX, 2019; Available online: https://www.ieahydro.org/media/51145259/IEAHydroTCP_AnnexIX_White%20Paper_Oct2019.pdf (accessed on 31 January 2025).
- Bélanger, C.; Gagnon, L. Adding wind energy to hydropower. Energy Policy 2002, 30, 1279–1284. [CrossRef]. [CrossRef]
- Korpaas, M.; Holen, A.T.; Hildrum, R. Operation and sizing of energy storage for wind power plants in a market system. Int. J. Electr. Power Energy Syst. 2003, 25, 599–606. [CrossRef]. [CrossRef]
- Bermúdez, J.M.; Ruisánchez, E.; Arenillas, A.; Moreno, A.H.; Menéndez, J.A. New concept for energy storage: Microwave-induced carbon gasification with CO2. Energy Convers. Manag. 2014, 78, 559–564. [CrossRef]. [CrossRef]
- Spyrou, I.D.; Anagnostopoulos, J.S. Design study of a stand-alone desalination system powered by renewable energy sources and a pumped storage unit. Desalination 2010, 257, 137–149. [CrossRef]. [CrossRef]
- Saini, P.; Gidwani, L. Study on energy storage system applications, allocation, and challenges. In Proceedings of the 2020 IEEE International Conference on Power Electronics, Drives and Energy Systems (PEDES); IEEE: Jaipur, India, 16 December 2020; pp. 1–7. [CrossRef].
- Das, P.; Das, B.K.; Mustafi, N.N.; Sakir, Md.T. A review on pump-hydro storage for renewable and hybrid energy systems applications. Energy Storage 2021, 3, e223. [CrossRef]. [CrossRef]
- Bahramian, P. Integration of wind power into an electricity system using pumped storage: Economic challenges and stakeholder impacts (No. 1480). Queen’s Economics Department Working Paper 2022. [CrossRef].
- Gustavsson, J. Energy storage technology comparison: A knowledge guide to simplify selection of energy storage technology, 2016. Available online: https://www.diva-portal.org/smash/get/diva2:953046/FULLTEXT01.pdf (accessed on 1 July 2024).
- Canales, F.A.; Beluco, A.; Mendes, C.A.B. A comparative study of a wind hydro hybrid system with water storage capacity: Conventional reservoir or pumped storage plant? J. Energy Storage 2015, 4, 96–105. [CrossRef].
- Hunt, J.D.; Byers, E.; Riahi, K.; Langan, S. Comparison between seasonal pumped-storage and conventional reservoir dams from the water, energy, and land nexus perspective. Energy Convers. Manag. 2018, 166, 385–401. [CrossRef]. [CrossRef]
- Yüksel, I. Hydropower for sustainable water and energy development. Renew. Sustain. Energy Rev. 2010, 14, 462–469. [CrossRef]. [CrossRef]
- Hafner, Manfred, and Giacomo Luciani, eds. The Palgrave Handbook of International Energy Economics. Cham: Springer International Publishing, 2022. [CrossRef].
- Nuclear Energy Agency; International Energy Agency; Organization for Economic Co-operation and Development. Projected Costs of Generating Electricity 2015; 2015 edition.; OECD Publishing: Paris, 2015; ISBN 9789264244436. Available online: https://iea.blob.core.windows.net/assets/c9bae6ac-0f4c-4a4b-8b46-f7d4cca4d53b/ElecCost2015.pdf (accessed on 31 January 2025).
- Volta River Authority. “Pwalugu Multipurpose Dam Project , Feasibility Study”, 2020a.
- Awojobi, O.; Jenkins, G.P. Were the hydro dams financed by the World Bank from 1976 to 2005 worthwhile? Energy Policy 2015, 86, 222–232. [CrossRef].
- Volta River Authority. Pwalugu Multipurpose Dam Project, 50 MW Solar Hybrid Project, 2020b. Available online: https://www.vra.com/media/2021/50%20MW%20Solar%20Hybrid%20-PMPDP%20-Scoping%20Report%20-%20Final%20Report_online.pdf (accessed on 31 January 2025).
- Lazard’s Levelized Cost of Energy Analysis-Version 16.0. Lazard, April 2023. Available online: https://www.lazard.com/media/typdgxmm/lazards-lcoeplus-april-2023.pdf (accessed on 31 January 2025).
- The Ghanaian National Parameters and CSCFs database. Available online: https://national-parameters.mofep.gov.gh/ (accessed on 31 January 2025).
- African Energy Chamber. Africa energy outlook 2021. Johannesburg: African Energy Chamber, 2020 [online]. Available online: https://www.whyafrica.co.za/wp-content/uploads/2020/11/AEC-Outlook-2021.pdf (accessed on 31 January 2025).
- Eberhard, Anton; Foster, Vivien; Briceño-Garmendia, Cecilia; Ouedraogo, Fatimata; Camos, Daniel, and Shkaratan, Maria. “Underpowered: The State of the Power Sector in Sub-Saharan Africa”, Africa Infrastructure Country Diagnostic, World Bank, Background Paper 6. 2008. Available online: https://openknowledge.worldbank.org/server/api/core/bitstreams/104f8cd2-b127-551d-8724-46de4a913ccb/content (accessed on 31 January 2025).
|
Disclaimer/Publisher’s Note: The statements, opinions and data contained in all publications are solely those of the individual author(s) and contributor(s) and not of MDPI and/or the editor(s). MDPI and/or the editor(s) disclaim responsibility for any injury to people or property resulting from any ideas, methods, instructions, or products referred to in the content. |
© 2025 by the authors. Licensee MDPI, Basel, Switzerland. This article is an open access article distributed under the terms and conditions of the Creative Commons Attribution (CC BY) license (http://creativecommons.org/licenses/by/4.0/).