Submitted:
18 February 2025
Posted:
18 February 2025
You are already at the latest version
Abstract
We explored the response of photosynthetic capacity to nitrogen (N) deposition among Larix gmelinii trees in different crown classes (e.g. suppressed, intermediate, and dominant trees) in a 12-year field experiment in a forest in the Greater Khingan Mountains in Northeast China. Four N-addition treatments were established: control (CK), low N (LN), medium N (MN), and high N (HN) (0, 25, 50, and 75 kg N·ha−1·year−1, respectively). Photosynthesis and its influencing factors were measured in 2023. Nitrogen addition significantly increased the maximum net photosynthetic rate (Pmax), maximum carboxylation rate (Vcmax), and maximum electron transport rate (Jmax) of suppressed and intermediate trees. The suppressed trees showed maximum Pmax and Vcmax in MN and HN, and maximum Jmax in HN. The intermediate trees showed maximum Pmax, Vcmax, and Jmax in MN. For dominant trees, Pmax was increased in LN and MN and decreased in HN, and Vcmax was increased by N addition and peaked in MN. Nitrogen addition significantly increased the leaf N content (Nmass), chlorophyll content (Chlm), ratio of N to phosphorous (N:P), and photosynthetic enzyme activities in all crown classes. Nmass had significant nonlinear relationships with Pmax, Vcmax, and Jmax. Enzyme activity and Chlm positively affected the photosynthetic capacity of suppressed and intermediate trees, and N:P negatively affected the photosynthetic capacity of dominant trees. The promoting effect of N addition on photosynthetic capacity was stronger in suppressed and intermediate trees than in dominant trees. Therefore, crown class should be considered when studying the effect of N deposition on boreal forest.
Keywords:
photosynthesis
; nitrogen deposition
; crown class
; boreal forest
1. Introduction
Photosynthesis is the most fundamental process of material production and energy metabolism in trees and is typically positively associated with the leaf nitrogen (N) content [1,2]. Anthropogenic N deposition has increased N availability in forests, potentially influencing the photosynthetic capacity of trees [3,4,5]. A number of studies have examined the effect of N addition on the photosynthetic capacity of trees and have obtained diverse results, ranging from a promoting effect [6,7,8] to an inhibiting effect [9]. This may be because when the N supply exceeds the biological N demand, trees change from an N-limited to an N-saturated state. This change in N status can affect their photosynthetic capacity [10,11]. Some studies have shown that key photosynthetic enzymes are affected by N supply, and there is a critical point in the response of photosynthesis to N addition [12,13]. Prior N-addition studies have mainly focused on standard trees and ignored differences among trees of the same species [14,15,16]. Especially in natural forests, trees of the same species are present in a range of crown classes because of the influence of succession and competition. Dominant trees are more competitive than suppressed trees for light, water, and other resources. The addition of N may alleviate the resource competition pressure on suppressed trees, thereby changing forest structure. The results of studies on the effects of N addition on the photosynthetic capacity of trees in different crown classes in natural forests are inconclusive. Exploring the responses of trees in different crown classes to N addition can not only provide ideas for forest management, but also reveal the impact of N deposition on forest structure.
Boreal forests account for about 30% of the global forest area [17], and are among the ecosystems that are seriously N-limited [18]. Dahurian larch (Larix gmelinii) is a widely distributed and dominant species in Eurasian boreal forests. At the time of publication of the China Forest Resources Report (2014–2018), the area and stock volume of natural L. gmelinii forest was 7.08 million ha and 766 million m3, accounting for 5.76% and 5.61% of the total in China, respectively [19]. Therefore, the effects of N enrichment on the photosynthesis of L. gmelinii needs to be evaluated.
To date, the response of L. gmelinii’s photosynthetic capacity to N addition has mainly been studied in plantations and seedlings [20,21]. Although a few studies have focused on natural forests, none has discriminated among trees in different crown classes [22,23]. Research on the effects of N addition on the photosynthetic capacity of trees in different crown classes is still lacking. In 2011, according to the atmospheric N deposition rate in northern China (25 kg N·ha−1·year−1) [24], we established four N addition treatments (0, 25, 50, 75 kg N·ha−1·year−1) to simulate increases in atmospheric N deposition by 0, 1, 2, and 3 times. Twelve years later, in 2023, we examined the responses of photosynthetic capacity to N addition and explored the variations in responses among trees in different crown classes. We tested the following hypotheses: 1) N addition will enhance photosynthetic capacity by increasing leaf N content and enzyme activity; 2) The effects of N addition on photosynthetic capacity will vary significantly among crown classes, and suppressed trees will respond positively to N addition.
2. Results
2.1. Comparison of photosynthetic characteristics
Nitrogen addition significantly (P < 0.05) affected the Pmax, Vcmax, Jmax, and PNUE (Table 1), and the interaction between N addition and crown class was significant for all these indexes. Nitrogen addition significantly (P < 0.05) increased the Pmax, Vcmax, Jmax, and PNUE of suppressed and intermediate trees (Figure 1, Table 1). The Pmax, Vcmax, Jmax, and PNUE of suppressed trees as well as the PNUE of intermediate trees increased as the amount of added N increased (Figure 1). The Pmax, Vcmax, and Jmax of intermediate trees exhibited a trend of first rising and then falling as the amount of added N increased, and the maximum value was in the MN treatment (Figure 1a–c). For dominant trees, the Pmax and PNUE was significantly higher (P < 0.05) in the LN and MN treatments and significantly lower in (P < 0.05) in the HN treatment, compared with CK (Figure 1a,d). Nitrogen addition significantly (P < 0.05) increased the Vcmax of dominant trees, and the maximum value was in the MN treatment (Figure 1b). However, N addition did not affect the Jmax of dominant trees (Figure 1c). The maximum values of Pmax for suppressed, intermediate, and dominant trees were 4.63 μmol·m⁻²·s⁻¹ (HN), 8.79 μmol·m⁻²·s⁻¹ (MN), and 6.44 μmol·m⁻²·s⁻¹ (MN), respectively (Figure 1a).
In CK, the Pmax, Vcmax, Jmax, and PNUE of suppressed trees were significantly (P < 0.05) lower than those of intermediate and dominant trees (Figure 1). The differences in Pmax, Vcmax, Jmax, and PNUE between suppressed trees and dominant trees gradually decreased as the amount of added N increased. Especially in the HN treatment, the Pmax, Vcmax, Jmax, and PNUE of suppressed trees were significantly (P < 0.05) higher than those of dominant trees (Figure 1).
Both intermediate and dominant trees showed large increases in Pmax, Vcmax, Jmax, and PNUE in the MN treatment (Figure 1). Suppressed trees showed large increases in Pmax, Vcmax, Jmax, and PNUE in the HN treatment (Figure 1). The HN treatment had an inhibitory effect on the Pmax and PNUE of dominant trees (Figure 1a,d). The Pmax of suppressed trees was increased by 26.09%, 52.31% and 55.73% in the LN, MN, and HN treatments, respectively, compared with CK; and the Pmax of intermediate trees was increased by 15.98%, 72.35% and 54.71% in LN, MN, and HN treatments, respectively, compared with CK (Figure 2). The Pmax of dominant was trees increased by 23.89% and 41.26% in the LN and MN treatments, respectively, and decreased by 11.83% in the HN treatment, compared with CK (Figure 2).
2.2. Comparison of factors related to photosynthetic capacity
The interaction between N addition and crown class was significant for Chlm, Nmass, and N:P (P < 0.01, Table 1). Nitrogen addition significantly (P < 0.01) increased the Chlm, Nmass, and N:P for all crown classes. As the amount of added N increased, the Chlm, Nmass, and N:P increased for all crown classes, except the Chlm of intermediate and dominant trees (Figure 3a,b,d). Nitrogen addition did not significantly affect Pmass in all the crown classes (Figure 3c).
In CK, there were significant (P < 0.05) differences in Chlm, Nmass, and N:P among crown classes, and suppressed trees had lower values of these indexes (Figure 3a). In the LN, MN and HN treatments, among the crown classes, suppressed trees had higher Chlm values, and dominant trees had higher Nmass and N:P values (Figure 3b,d). There were no significant differences in Pmass among crown classes in each N addition treatment (Figure 3c).
Nitrogen addition significantly affected the activities of RubisCO, GS, GLO, and PEPC (P < 0.01, Table 1). For suppressed trees, the activities of RubisCO, GS, and GLO increased as the amount of added N increased, and PEPC activity was increased in the MN and HN treatments (Figure 4). For intermediate trees, RubisCO activity was increased in the HN treatment (Figure 4a), GS activity and GLO activity were increased in the LN, MN, and HN treatments (Figure 4b,c), and PEPC activity was increased in the MN and HN treatments (Figure 4d). For dominant trees, RubisCO activity and PEPC activity were significantly increased in the MN and HN treatments (Figure 4a,d), GS activity was increased in the HN treatment (Figure 4b), and GLO activity was increased in the LN treatment (Figure 4c).
There were no significant differences in RubisCO activity and GS activity among crown classes within each N addition treatment (Figure 4). The GLO activity differed significantly between CK and the LN treatment, and was higher in dominant trees than in suppressed and intermediate ones (Figure 4c). The PEPC activity showed significant differences between CK and the MH and HN treatments, and was higher in suppressed trees than in dominant and intermediate ones (Figure 4d).
2.3. Relationships between photosynthetic capacity and its influencing factors
Across all the experimental groups, as the Nmass increased, the Pmax, Vcmax, and Jmax first increased and then decreased (Figure 5). The results of the PLSPM showed that Nmass positively affected enzyme activity, Chlm, and N:P in suppressed trees and intermediate trees. There were direct positive effects of enzyme activity and Chlm on photosynthetic capacity in suppressed trees and intermediate trees (Figure 6a,b). However, Nmass positively affected N:P and negatively affected enzyme activity, which had a direct negative impact on the photosynthetic capacity of dominant trees (Figure 6c).
3. Discussion
3.1. Effects of N addition on the photosynthetic capacity of suppressed trees
Nitrogen addition increases the concentration of inorganic N in the soil, which promotes N absorption by roots and leads to an increase in leaf Nmass [25,26,27]. Subsequently, this impacts the photosynthetic capacity. Consistent with our hypothesis, N addition significantly increased the Pmax, Vcmax, and Jmax of suppressed trees, with Pmax increasing by 26%, 52%, and 56% in the LN, MN, and HN treatments, respectively, compared with CK (Figure 1 and Figure 2). This result is related to the significant increase in leaf Nmass after N addition. About 60% of N in the leaf is allocated to photosynthetic proteins, and more than 70% of N is located in the chloroplasts of mesophyll cells [28,29,30]. This localization of N can promote the photosynthetic capacity [31]. Our results show that as the amount of added N increased, the Chlm had a similar increasing trend as Pmax, Vcmax, and Jmax in suppressed trees (Figure 3). Furthermore, the PLSPM results showed that Chlm exerted the strongest influence on photosynthetic capacity (Figure 6).
An increase in leaf Nmass can affect photosynthetic enzymes, thereby influencing photosynthetic capacity [32,33]. In our study, the N addition treatments resulted in significant increases in the activities of RubisCO, GS, GLO, and PEPC in the leaves of suppressed trees (Figure 4). Increased activity of RubisCO and PEPC is beneficial for catalyzing photosynthetic carbon assimilation reactions [34,35]. The conversion of glycolic acid to glyoxylic acid is catalyzed by GLO [36,37]. Increased GLO activity can enhance the protective role of photorespiration, thereby contributing to the stability of photosynthetic capacity. Glutamine synthetase catalyzes the synthesis of glutamine from glutamate and ammonium ions (NH4+). Higher GS activity promotes the transformation of inorganic N, while the substantial synthesis of glutamine can prevent NH4+ from accumulating to toxic levels [38]. The PLSPM results showed that N addition indirectly influenced the photosynthetic capacity by directly promoting enzyme activities.
Nitrogen addition had a stronger effect on Pmax than on Nmass, resulting in an increasing trend of PNUE as the amount of added N increased. Notably, there were no significant differences in Pmax, Vcmax, and PNUE between the MN and HN treatments. This indicated that the effect of N addition on the photosynthetic capacity of suppressed trees had a limit. That is, the photosynthetic capacity could only increase to a certain point, and could not increase further with excessive N addition. Appropriate N addition can enhance the photosynthetic capacity of suppressed trees, alleviate their competitive pressure, and improve their growth and survival in the forest community.
3.2. Effects of N addition on the photosynthetic capacity of dominant and intermediate trees
Nitrogen addition significantly impacted the photosynthetic capacity of both intermediate and dominant trees. Contrary to suppressed trees, the Pmax of intermediate and dominant trees initially increased and then decreased as the amount of added N increased. Especially under HN treatment, the Pmax of dominant trees was significantly lower than that of suppressed and intermediate trees. This observation aligns with our hypothesis. One reason for this result is the significant decrease in Chlm of intermediate and dominant trees in the HN treatment. Another reason is that the increased Nmass exceeded the leaf’s tolerance and disrupted N metabolism under HN treatment [39]. Some studies have suggested that excessive N in leaves can lead to the accumulation of free amino acids, especially arginine, which is harmful to leaves [40,41]. Our results showed that Pmax, Vcmax, and Jmax had significant nonlinear relationships with Nmass. As Nmass increased, Pmax, Vcmax, and Jmax first increased and then decreased, with peak values when Nmass was between 37.0 and 37.5 (Figure 5).
Simultaneously, excessive N may disrupt the balance of elemental stoichiometry in the leaf, thereby affecting photosynthesis [42]. The N:P is a critical indicator for measuring the balance of plant elements [43]. When the N:P is lower than 10, plants are restricted by N, and when the N:P is higher than 20, plants are restricted by P [44,45]. Our results show that N addition had no significant impact on Pmass, but significantly increased the Nmass and N:P. Especially in the HN treatment, the N:P of intermediate and dominant trees was 21.27 and 21.74, respectively (Figure 3). The disruption of the balance between N and P in the leaf may be one of the reasons for the decrease in photosynthetic capacity [46,47]. The PLSPM results showed that N addition indirectly limited the photosynthetic capacity by promoting N:P. This indicates that intermediate trees and dominant trees may be restricted by P in the HN treatment.
Changes in the activity of photosynthetic enzymes also contributed to the decrease in photosynthetic capacity in the HN treatment. Our results show that the activities of RubisCO, PEPC, and GS were highest in the HN treatment for all crown classes; the activities of RubisCO and GS did not differ significantly among the crown classes; and the activity of PEPC was lower in dominant trees than in suppressed and intermediate ones (Figure 4). However, in the HN treatment, the Nmass was significantly higher in intermediate and dominant trees than in suppressed trees. This indicates that the increase of Nmass enhanced the activity of photosynthetic enzymes, but when Nmass reached a certain value, this effect was no longer significant or even inhibitory. Moreover, both the GLO activity and Pmax of intermediate trees and dominant trees significantly decreased in the HN treatment. The decrease in GLO activity could potentially attenuate photorespiration, consequently lowering the efficiency of photosystem II, ultimately resulting in decreased photosynthetic capacity [48]. Nitrogen addition can also affect the photosynthetic capacity by affecting the amount of enzymes. In this study, we determined the activity of photosynthetic enzymes, but not their contents. We intend to further explore the effects of N addition on the contents and activities of enzymes in further research.
3.3. Differences in photosynthetic capacity among crown classes
In CK, the photosynthetic parameters (e.g., Pmax, Vcmax, Jmax) of suppressed trees were significantly lower than those of intermediate trees and dominant trees (Figure 1). Suppressed trees are in the lower forest layer and have a weaker ability to compete for soil nutrients. This will result in low leaf Nmass and photosynthetic capacity [49]. Moreover, in CK, there were no significant differences in Pmax, Vcmax and Jmax between intermediate trees and dominant trees. This might be because the intermediate trees had a similar ability to obtain soil nutrients as dominant trees, because the differences in Nmass and Pmass were not significant different between these two crown classes. In addition, dominant trees may be subject to light stress, which would limit their photosynthetic capacity. This may also explain why GLO activity was significantly higher in dominant trees than in intermediate and suppressed ones (Figure 4).
Nitrogen addition had a significant impact on the photosynthetic capacity of trees across all crown classes, but the degree of impact varied. In the LN treatment, the Pmax and Vcmax of each crown class showed similar increases, and suppressed trees showed the largest increase in Jmax (Figure 2). This suggested that the LN treatment strongly affected the regeneration rate of ribulose-1,5-bisphosphate in suppressed trees. Compared with CK, the LN treatment did affect the magnitude of differences in Pmax, Vcmax and Jmax among the crown classes. In the MN treatment, the Pmax, Vcmax and Jmax of intermediate trees were significantly greater than those of suppressed trees and dominant trees. In the HN treatment, the Pmax, Vcmax and Jmax were lower in the dominant trees than in the suppressed and intermediate trees. Overall, N addition altered the magnitude of differences in photosynthetic capacity among crown classes. The PLSPM results also showed that there were differences in the direct pathways by which N affected photosynthetic capacity among the three crown classes. This may be related to the N saturation threshold of the trees in the different crown classes. In CK, the leaf Nmass of suppressed trees did not reach its saturation threshold [10,11,12]. As the amount of added N increased, the leaf Nmass of suppressed trees increased but did not exceed the saturation threshold, allowing the leaves to allocate more N to photosynthetic components [50,51]. In CK, the Nmass in the leaves of intermediate trees and dominant trees were close to their saturation threshold, as the amount of added N increased, the Nmass continued to increase and exceeded the threshold. This may have disrupted the balance of photosynthetic metabolism and inhibited the photosynthetic capacity of intermediate trees and dominant trees [52,53].
These findings deepen our understanding of how N addition affects the photosynthetic capacity of L. gmelinii, which will be useful for clarifying the effect of atmospheric N deposition on boreal forest. Suppressed trees grow slowly and have a low survival rate in the forest, but N deposition can increase their photosynthetic capacity, which is beneficial for their growth and survival. This helps to maintain the stability and enhance the carbon sequestration of forest ecosystems. Appropriate N deposition can also increase the photosynthetic capacity of intermediate trees and dominant trees. However, excessive N deposition can reduce the increase in photosynthetic capacity of intermediate trees and dominant trees, and even inhibit the photosynthetic capacity of dominant trees [54].
4. Materials and methods
4.1. Site description
The study site was situated within the Nanwenghe National Nature Reserve in the Greater Khingan Mountains (51°05′−51°39′N, 125°07′−125°50′E). This region features a cold temperate continental monsoon climate, with an average annual temperature of −2.7°C, a lowest temperature of −48°C, and a highest temperature of 36°C. The average annual precipitation during the study period was 500 mm, with an accumulated temperature of about 1500°C for temperatures ≥10°C, and a frost-free period of 90 – 100 days. The soil type was brown coniferous forest soil.
The vegetation at the study site was natural secondary forest that had regenerated after logging. The dominant tree species was L. gmelinii, and the associated tree species was Betula platyphylla. The main understory herbaceous plants included Pyrola asarifolia, Maianthemum bifolium, Eguisetum sylvalicum, and Carex tristachya. During sampling in 2023, the growth density at the site was 2852±99 trees·ha–1, the average diameter at breast height (DBH) was 9.38 ±0.99 cm, the maximum tree age was 42 years, and the canopy density was 0.76 ± 0.30.
4.2. Experimental design
The experiment was established with a randomized complete block design, consisting of three blocks. Each block contained four 20 m × 20 m plots with a 10 m buffer in between. Four levels of N addition were established in the four plots: control (CK, 0 Kg N·ha –1·yr–1), low N (LN, 25 Kg N·ha –1·yr–1), medium N (MN, 50 Kg N·ha–1·yr–1), and high N (HN, 75 Kg N·ha–1·yr–1). The N addition levels were chosen to simulate future N deposition of 1–3 times the current N deposition level in the study region (25 kg N·ha–1·yr–1)[24] .The N addition experiment was started in May 2011. In each plot, N addition was carried out five times from early May to early September each year. For each N addition level, the corresponding amount of NH4NO3 was dissolved in 32 L water and evenly sprayed on the forest floor using a sprayer. To eliminate the effect of differences in water supply, the control plots were sprayed with the same amount of pure water.
4.3. Measurements of leaf gas exchange
The leaf gas exchange measurements were conducted in late July 2023. First, the DBH of all trees in each plot was measured, and the trees were categorized into three crown classes: suppressed trees (3 cm < DBH ≤ 6 cm), intermediate trees (6 cm < DBH ≤ 16 cm), and dominant trees (16 cm < DBH ≤ 25 cm). In each plot, three sample trees were selected from each crown class. One wood core (5.15 mm in diameter) per sample tree was collected from the trunk at breast height to confirm the sample trees were of a similar age. Three standard branches were cut from the middle canopy of each sample tree, and the needles from the 2–3 cm portion at the end of three short shoots of each standard branch were used for gas exchange measurements. The light response curves and CO2 response curves were measured with a portable infrared gas analyzer (LI-6800, Li-Cor Inc., Lincoln, NE, USA). The maximum net photosynthetic rate (Pmax), maximum carboxylation rate (Vcmax), and maximum electron transport rate (Jmax) were calculated using empirical equations [55].
4.4. Measurements of leaf traits
The needles sampled for gas exchange measurements were harvested and placed in a cooler at 4°C. In the laboratory, the needles were scanned, dried, and then weighed to calculate the specific leaf area (SLA = leaf area/leaf dry mass).
About 100 g needles on the short shoot of each branch were sampled, randomly divided into three portions, and placed in liquid N. In the laboratory, one portion was used to measure the activity of ribulose-1,5-bisphosphate carboxylase (RubisCO), glutamine synthetase (GS), glycolate oxidase (GLO), and phosphoenolpyruvate carboxylase (PEPC) using RubisCO kit, GS kit, GLO kit and PEPC kit (Keming Biotechnology Inc., Suzhou, China), respectively. The absorbance of the reaction mixtures was measured using a spectrophotometer (Evolution 300, Thermo Fisher Scientific Inc., Waltham, MA, USA). Another portion was dried at 65°C to a constant weight (accuracy 0.0001 g). The dried samples were then ground, sieved, and pressed into a tablet for analyses of N content per unit mass (Nmass) and phosphorus content per unit mass (Pmass) using a laser spectral elemental analysis system (J200 Tandem LA-LIBS Instrument, Applied Spectra, Fremont, CA, USA). The N:P was calculated by dividing the Nmass by Pmass. The leaf N concentration per unit area (Narea) was obtained by dividing the Nmass by SLA. The photosynthetic N-use efficiency (PNUE) was obtained by dividing Pmax by Narea [56]. The third portion was used to determine the contents of photosynthetic pigments [57]. The needles were ground, extracted with a 1:1 mixture of acetone and ethanol, and then the absorbance of the solvent was determined at 645 nm and 663 nm using a spectrophotometer (Evolution 300, Thermo Fisher).
4.5. Data analyses
All statistical analyses were conducted using R software (version 4.4.2, The R Foundation for Statistical Computing, Vienna, Austria). Data were subjected to analysis of variance (ANOVA) to test the main effects (N addition treatment, crown class) on photosynthetic characteristics and related needle traits with the “agricolae” package. The data were tested for normal distribution and homogeneity of variance before ANOVA. Multiple comparisons of photosynthetic characteristics and related needle traits were conducted with the “multcomp” package. A regression model was applied to explore potential relationships between photosynthetic characteristics and needle traits with the “car” package. Partial least squares path models (PLSPMs) were applied to analyze the driving factors of photosynthetic capacity with the “lavaan” package.
For each crown class, the difference in photosynthetic characteristics in each N addition treatment compared with the control was calculated as follows:
where Xaddition and Xcontrol represent each variable (e.g., Pmax, Vcmax, Jmax, PNUE) measured in the N addition treatment and control (CK), respectively, and i is the crown class.
ΔXi = (Xi-addition − Xi-control)/Xi-control × 100% (1)
5. Conclusion
Nitrogen addition significantly affected the photosynthetic capacity of L. gmelinii, and the effect varied with the amount of added N and the crown class. Nitrogen addition resulted in significant increases in the Pmax, Vcmax and Jmax of suppressed trees and intermediate trees. For suppressed trees, the maximum values of Pmax and Vcmax were in the MN and HN treatments, while the maximum Jmax was in the HN treatment. For intermediate trees, the maximum values of Pmax, Vcmax and Jmax were in the MN treatment. For dominant trees, the Pmax and Vcmax were significantly increased in the LN and MN treatments and had the maximum values in the MN treatment. However, the HN treatment resulted in a significant decrease in the Pmax of dominant trees, and N addition did not significantly affect Jmax. Overall, the MN treatment was most beneficial for the photosynthetic capacity of L. gmelinii. The changes in leaf Nmass, Chlm, and photosynthetic enzyme activities under N addition contributed to the variations in photosynthetic capacity among trees in different crown classes. The photosynthetic capacity of suppressed trees and intermediate trees benefitted most from N addition, and this altered the magnitude of differences in photosynthetic capacity among the crown classes. For example, the suppressed trees had the minimum Pmax in CK and the dominant trees had the minimum Pmax in the HN treatment. Therefore, the crown class should be considered when studying the effect of N deposition on boreal forest.
Author Contributions
Methodology, conceptualization, Q.W.; funding acquisition, conceptualization, C.W.; investigation, J.W. and R.Z.; writing—original draft preparation, formal analysis, R.C.; writing—review and editing, supervision, funding acquisition, project administration, resources, data curation, X.Q. All authors have read and agreed to the published version of the manuscript.
Funding
This research was funded by the National Key Research and Development Program of China (No. 2021YFD220040107).
Data Availability Statement
The data presented in this study are available on request from the corresponding author.
Acknowledgments
We thank Guancheng Liu and many colleagues for their assistance conducting fieldwork and Jennifer Smith, PhD, from Liwen Bianji (Edanz) (www.liwenbianji.cn/), for editing the English text of a draft of this manuscript. We sincerely thank the editors and reviewers for their valuable comments, which improved the manuscript.
Conflicts of Interest
The authors declare no conflicts of interest.
References
- Takashima, T.; Hikosaka, K.; Hirose, T. Photosynthesis or persistence: nitrogen allocation in leaves of evergreen and deciduous Quercus species. Plant, Cell & Environment 2004, 27, 1047–1054. [Google Scholar] [CrossRef]
- Hikosaka, K.; Hanba, Y.; Hirose, T.; Terashima, I. Photosynthetic nitrogen-use efficiency in leaves of woody and herbaceous species. Funct. Ecol. 1998, 12, 896–905. [Google Scholar] [CrossRef]
- Bai, Y.; Wu, J.; Clark, C. M.; Naeem, S.; Pan, Q.; Huang, J.; Zhang, L.; Han, X. Tradeoffs and thresholds in the effects of nitrogen addition on biodiversity and ecosystem functioning: evidence from inner Mongolia Grasslands. Global Change Biol. 2010, 16, 358–372. [Google Scholar] [CrossRef]
- Yu, G.; Jia, Y.; He, N.; Zhu, J.; Chen, Z.; Wang, Q.; Piao, S.; Liu, X.; He, H.; Guo, X. Stabilization of atmospheric nitrogen deposition in China over the past decade. Nat. Geosci. 2019, 12, 424–429. [Google Scholar] [CrossRef]
- Wen, Z.; Xu, W.; Li, Q.; Han, M.; Tang, A.; Zhang, Y.; Luo, X.; Shen, J.; Wang, W.; Li, K. Changes of nitrogen deposition in China from 1980 to 2018. Environ. Int. 2020, 144, 106022. [Google Scholar] [CrossRef]
- Tatarko, A. R.; Knops, J. M. Nitrogen addition and ecosystem functioning: Both species abundances and traits alter community structure and function. Ecosphere 2018, 9, e02087. [Google Scholar] [CrossRef]
- Liang, X.; Zhang, T.; Lu, X.; Ellsworth, D. S.; BassiriRad, H.; You, C.; Wang, D.; He, P.; Deng, Q.; Liu, H. Global response patterns of plant photosynthesis to nitrogen addition: A meta-analysis. Global Change Biol. 2020, 26, 3585–3600. [Google Scholar] [CrossRef]
- Sun, L.; Yang, G.; Zhang, Y.; Qin, S.; Dong, J.; Cui, Y.; Liu, X.; Zheng, P.; Wang, R. Leaf functional traits of two species affected by nitrogen addition rate and period not nitrogen compound type in a meadow grassland. Front. Plant Sci. 2022, 13, 841464. [Google Scholar] [CrossRef]
- Hu, M.; Wan, S. Effects of fire and nitrogen addition on photosynthesis and growth of three dominant understory plant species in a temperate forest. J. Plant Ecol. 2019, 12, 759–768. [Google Scholar] [CrossRef]
- Zhang, D.; Peng, Y.; Li, F.; Yang, G.; Wang, J.; Yu, J.; Zhou, G.; Yang, Y. Trait identity and functional diversity co-drive response of ecosystem productivity to nitrogen enrichment. J. Ecol. 2019, 107, 2402–2414. [Google Scholar] [CrossRef]
- Song, W.; Loik, M. E.; Cui, H.; Fan, M.; Sun, W. Effect of nitrogen addition on leaf photosynthesis and water use efficiency of the dominant species Leymus chinensis (Trin.) Tzvelev in a semi-arid meadow steppe. Plant Growth Regul. 2022, 98, 91–102. [Google Scholar] [CrossRef]
- Yang, G.; Zhang, Z.; Zhang, G.; Liu, Q.; Zheng, P.; Wang, R. Tipping point of plant functional traits of Leymus chinensis to nitrogen addition in a temperate grassland. Front. Plant Sci. 2022, 13, 982478. [Google Scholar] [CrossRef] [PubMed]
- Nakaji, T.; Takenaga, S.; Kuroha, M.; Izuta, T. Photosynthetic response of Pines densiflora seedlings to high nitrogen load. Environmental Sciences 2002, 9, 269–282. [Google Scholar]
- Liu, H.; Yin, D.; He, P.; Cadotte, M. W.; Ye, Q. Linking plant functional traits to biodiversity under environmental change. Biological Diversity 2024, 1, 22–28. [Google Scholar] [CrossRef]
- Yu, J.; Shi, P.; Zong, N.; Song, M.; Miao, Y.; Huang, X.; Chen, X.; Hei, H. Responses of Intraspecific and Interspecific Trait Variations to Nitrogen Addition in a Tibetan Alpine Meadow. Plants 2024, 13, 1764. [Google Scholar] [CrossRef] [PubMed]
- Zhang, X.; Li, B.; Peñuelas, J.; Sardans, J.; Cheng, D.; Yu, H.; Zhong, Q. Resource-acquisitive species have greater plasticity in leaf functional traits than resource-conservative species in response to nitrogen addition in subtropical China. Sci. Total Environ. 2023, 903, 166177. [Google Scholar] [CrossRef] [PubMed]
- Vitousek, P. M.; Cassman, K.; Cleveland, C.; Crews, T.; Field, C. B.; Grimm, N. B.; Howarth, R. W.; Marino, R.; Martinelli, L.; Rastetter, E. B. Towards an ecological understanding of biological nitrogen fixation. Biogeochemistry 2002, 57-58, 1–45. [Google Scholar] [CrossRef]
- Randerson, J. T.; Liu, H.; Flanner, M. G.; Chambers, S. D.; Jin, Y.; Hess, P. G.; Pfister, G.; Mack, M.; Treseder, K.; Welp, L. The impact of boreal forest fire on climate warming. science 2006, 314, 1130–1132. [Google Scholar] [CrossRef]
- Forestry, N.; Administration, G. China forest resources report (2014–2018). China Forestry Publishing House Beijing, China: 2019.
- Zhao, Q.; Liu, X.; Hu, Y.; Zeng, D. Effects of nitrogen addition on nutrient allocation and nutrient resorption efficiency in Larix gmelinii. Scientia Silvae Sinicae 2010, 46, 14–19. [Google Scholar] [CrossRef]
- Guo, S.; Yan, X.; Bai, B.; Yu, S. Effects of nitrogen supply on photosynthesis in larch seedlings. Acta Ecol. Sin. 2005, 25, 1291–1298. [Google Scholar] [CrossRef]
- Liu, G.; Yin, Z.; Yan, G.; Liu, S.; Wang, X.; Xing, Y.; Wang, Q. Effects of long-term nitrogen addition on the δ15N and δ13C of Larix gmelinii and soil in a boreal forest. Ecol. Processes 2022, 11, 37. [Google Scholar] [CrossRef]
- Zhang, X.; Su, J.; Ji, Y.; Zhao, J.; Gao, J. Nitrogen deposition affects the productivity of planted and natural forests by modulating forest climate and community functional traits. For. Ecol. Manage. 2024, 563, 121970. [Google Scholar] [CrossRef]
- Liu, X.; Zhang, Y.; Han, W.; Tang, A.; Shen, J.; Cui, Z.; Vitousek, P.; Erisman, J. W.; Goulding, K.; Christie, P. Enhanced nitrogen deposition over China. Nature 2013, 494, 459–462. [Google Scholar] [CrossRef]
- Huang, W.; Zhou, G.; Liu, J.; Zhang, D.; Xu, Z.; Liu, S. Effects of elevated carbon dioxide and nitrogen addition on foliar stoichiometry of nitrogen and phosphorus of five tree species in subtropical model forest ecosystems. Environ. Pollut. 2012, 168. [Google Scholar] [CrossRef] [PubMed]
- Shi, B.; Ling, X.; Cui, H.; Song, W.; Gao, Y.; Sun, W. Response of nutrient resorption of Leymus chinensis to nitrogen and phosphorus addition in a meadow steppe of northeast China. Plant Biol. 2020, 22, 1123–1132. [Google Scholar] [CrossRef]
- Lü, X. T.; Reed, S.; Yu, Q.; He, N. P.; Wang, Z. W.; Han, X. G. Convergent responses of nitrogen and phosphorus resorption to nitrogen inputs in a semiarid grassland. Global Change Biol. 2013, 19, 2775–2784. [Google Scholar] [CrossRef] [PubMed]
- Jiang, S.; Wei, L.; Yang, S.; Xiao, D.; Wang, X.; Hou, J. Short term responses of photosynthetic pigments and nonstructural carbohydrates to simulated nitrogen deposition in three provenances of Pinus tabulaeformis Carr. seedlings. Acta Ecol. Sin. 2015, 35, 7061–7070. [Google Scholar] [CrossRef]
- de Ávila Silva, L.; Condori-Apfata, J. A.; Marcelino, M. M.; Tavares, A. C. A.; Raimundi, S. C. J.; Martino, P. B.; Araújo, W. L.; Zsögön, A.; Sulpice, R.; Nunes-Nesi, A. Nitrogen differentially modulates photosynthesis, carbon allocation and yield related traits in two contrasting Capsicum chinense cultivars. Plant Sci. 2019, 283, 224–237. [Google Scholar] [CrossRef]
- Carrión, C. A.; Martínez, D. E.; Costa, M. L.; Guiamet, J. J. Senescence-associated vacuoles, a specific lytic compartment for degradation of chloroplast proteins? Plants 2014, 3, 498–512. [Google Scholar] [CrossRef]
- Wei, X.; Han, L.; Xu, N.; Sun, M.; Yang, X. Nitrate nitrogen enhances the efficiency of photoprotection in Leymus chinensis under drought stress. Front. Plant Sci. 2024, 15, 1348925. [Google Scholar] [CrossRef]
- Evans, J. R.; Clarke, V. C. The nitrogen cost of photosynthesis. J. Exp. Bot. 2019, 70, 7–15. [Google Scholar] [CrossRef] [PubMed]
- Liu, B.; Gao, D.; Chang, Q.; Liu, Z.; Fan, X.; Meng, D.; Bai, E. Leaf enzyme plays a more important role in leaf nitrogen resorption efficiency than soil properties along an elevation gradient. J. Ecol. 2022, 110, 2603–2614. [Google Scholar] [CrossRef]
- Evans, J. R. Photosynthesis and nitrogen relationships in leaves of C3 plants. Oecologia 1989, 78, 9–19. [Google Scholar] [CrossRef] [PubMed]
- Chandler, J.; Dale, J. Nitrogen deficiency and fertilization effects on needle growth and photosynthesis in Sitka spruce (Picea sitchensis). Tree Physiol. 1995, 15, 813–817. [Google Scholar] [CrossRef]
- Foyer, C. H.; Bloom, A. J.; Queval, G.; Noctor, G. Photorespiratory metabolism: genes, mutants, energetics, and redox signaling. Annu. Rev. Plant Biol. 2009, 60, 455–484. [Google Scholar] [CrossRef]
- Li, X.; Chen, L.; Zeng, X.; Wu, K.; Huang, J.; Liao, M.; Xi, Y.; Zhu, G.; Zeng, X.; Hou, X. Wounding induces a peroxisomal H2O2 decrease via glycolate oxidase-catalase switch dependent on glutamate receptor-like channel-supported Ca2+ signaling in plants. The Plant Journal 2023, 116, 1325–1341. [Google Scholar] [CrossRef]
- Leng, X.; Wang, H.; Cao, L.; Chang, R.; Zhang, S.; Xu, C.; Yu, J.; Xu, X.; Qu, C.; Xu, Z. Overexpressing GLUTAMINE SYNTHETASE 1; 2 maintains carbon and nitrogen balance under high-ammonium conditions and results in increased tolerance to ammonium toxicity in hybrid poplar. J. Exp. Bot. 2024, 75, 4052–4073. [Google Scholar] [CrossRef]
- PEI, H.; GAO, W.; FANG, J.; YE, K.; ZHU, Y.; HUANG, F.; LI, Q. Effects of simulated nitrogen deposition on growth and photosynthetic characteristics of one-year-old Toona sinensis seedlings. Chinese Journal of Eco-Agriculture 2019, 27, 1546-1552. [CrossRef]
- Lu, X.; Mo, J.; Peng, S.; Fang, Y.; Li, D.; Lin, Q. Effects of simulated N deposition on free amino acids and soluble protein of three dominant understory species in a monsoon evergreen broad-leaved forest of subtropical China. Acta Ecol. Sin. 2006, 26, 743–753. [Google Scholar]
- van Dijk, H. F.; Roelofs, J. G. Effects of excessive ammonium deposition on the nutritional status and condition of pine needles. Physiol. Plant. 1988, 73, 494–501. [Google Scholar] [CrossRef]
- Zou, A.-L.; Li, X.-P.; Ni, X.-F.; Ji, C.-J. Responses of tree growth to nitrogen addition in Quercus wutaishanica forests in mount Dongling, Beijing, China. Chin. J. Plant Ecol. 2019, 43, 783–792. [Google Scholar] [CrossRef]
- Zhang, G.; Zhang, L.; Wen, D. Photosynthesis of subtropical forest species from different successional status in relation to foliar nutrients and phosphorus fractions. Sci. Rep. 2018, 8, 10455. [Google Scholar] [CrossRef] [PubMed]
- Li, L.; Liu, B.; Gao, X.; Li, X.; Li, C. Nitrogen and phosphorus addition differentially affect plant ecological stoichiometry in desert grassland. Sci. Rep. 2019, 9, 18673. [Google Scholar] [CrossRef] [PubMed]
- Wang, Z.; Wang, J.; Wu, H.; Yang, T.; An, Y.; Zhang, Y.; Bian, J.; Li, Y.; Ren, H.; Lkhagva, A. Nitrogen addition alters aboveground C:N:P stoichiometry of plants but not for belowground in an Inner Mongolia grassland. J. Plant Ecol. 2024, 17, rtad041. [Google Scholar] [CrossRef]
- Menge, D. N.; Field, C. B. Simulated global changes alter phosphorus demand in annual grassland. Global Change Biol. 2007, 13, 2582–2591. [Google Scholar] [CrossRef]
- Chen, F.-S.; Niklas, K. J.; Liu, Y.; Fang, X.-M.; Wan, S.-Z.; Wang, H. Nitrogen and phosphorus additions alter nutrient dynamics but not resorption efficiencies of Chinese fir leaves and twigs differing in age. Tree Physiol. 2015, 35, 1106–1117. [Google Scholar] [CrossRef] [PubMed]
- Dusenge, M. E.; Duarte, A. G.; Way, D. A. Plant carbon metabolism and climate change: elevated CO2 and temperature impacts on photosynthesis, photorespiration and respiration. New Phytol. 2019, 221, 32–49. [Google Scholar] [CrossRef] [PubMed]
- Ye, X.; Bu, W.; Hu, X.; Liu, B.; Liang, K.; Chen, F. Species divergence in seedling leaf traits and tree growth response to nitrogen and phosphorus additions in an evergreen broadleaved forest of subtropical China. J. For. Res. 2023, 34, 137–150. [Google Scholar] [CrossRef]
- Elvir, J. A.; Wiersma, G. B.; Day, M. E.; Greenwood, M. S.; Fernandez, I. J. Effects of enhanced nitrogen deposition on foliar chemistry and physiological processes of forest trees at the Bear Brook Watershed in Maine. For. Ecol. Manage. 2006, 221, 207–214. [Google Scholar] [CrossRef]
- Liu, N.; Zhang, S.; Huang, Y.; Wang, J.; Cai, H. Canopy and understory additions of nitrogen change the chemical composition, construction cost, and payback time of dominant woody species in an evergreen broadleaved forest. Sci. Total Environ. 2020, 727, 138738. [Google Scholar] [CrossRef]
- Xing, H.; Zhou, W.; Wang, C.; Li, L.; Li, X.; Cui, N.; Hao, W.; Liu, F.; Wang, Y. Excessive nitrogen application under moderate soil water deficit decreases photosynthesis, respiration, carbon gain and water use efficiency of maize. Plant Physiol. Biochem. 2021, 166, 1065–1075. [Google Scholar] [CrossRef]
- Sperling, O.; Karunakaran, R.; Erel, R.; Yasuor, H.; Klipcan, L.; Yermiyahu, U. Excessive nitrogen impairs hydraulics, limits photosynthesis, and alters the metabolic composition of almond trees. Plant Physiol. Biochem. 2019, 143, 265–274. [Google Scholar] [CrossRef] [PubMed]
- Liu, G.; Yan, G.; Chang, M.; Huang, B.; Sun, X.; Han, S.; Xing, Y.; Wang, Q. Long-term nitrogen addition further increased carbon sequestration in a boreal forest. European Journal of Forest Research 2021, 140, 1113–1126. [Google Scholar] [CrossRef]
- Sharkey, T. D. What gas exchange data can tell us about photosynthesis. Plant, Cell & Environment 2015, 39, 1161-1163. [CrossRef]
- Qin, J.; Yue, X.; Fang, S.; Qian, M.; Zhou, S.; Shang, X.; Yang, W. Responses of nitrogen metabolism, photosynthetic parameter and growth to nitrogen fertilization in Cyclocarya paliurus. For. Ecol. Manage. 2021, 502, 119715. [Google Scholar] [CrossRef]
- Ritchie, R. J. Consistent sets of spectrophotometric chlorophyll equations for acetone, methanol and ethanol solvents. Photosynth. Res. 2006, 89, 27–41. [Google Scholar] [CrossRef]
Figure 1.
Effects of N addition on (a) maximum net photosynthetic rate (Pmax), (b) maximum carboxylation rate (Vcmax), (c) maximum electron transfer rate (Jmax), and (d) photosynthetic nitrogen use efficiency (PNUE) of trees in different crown classes. Error bars represent standard errors (n = 3), different capital letters indicate significant differences among crown classes in the same N addition treatment (α = 0.05), and different lowercase letters indicate significant differences among N addition treatments within the same crown class (α = 0.05). CK: control, LN: low N addition treatment, MN: middle N addition treatment, HN: high N addition treatment.
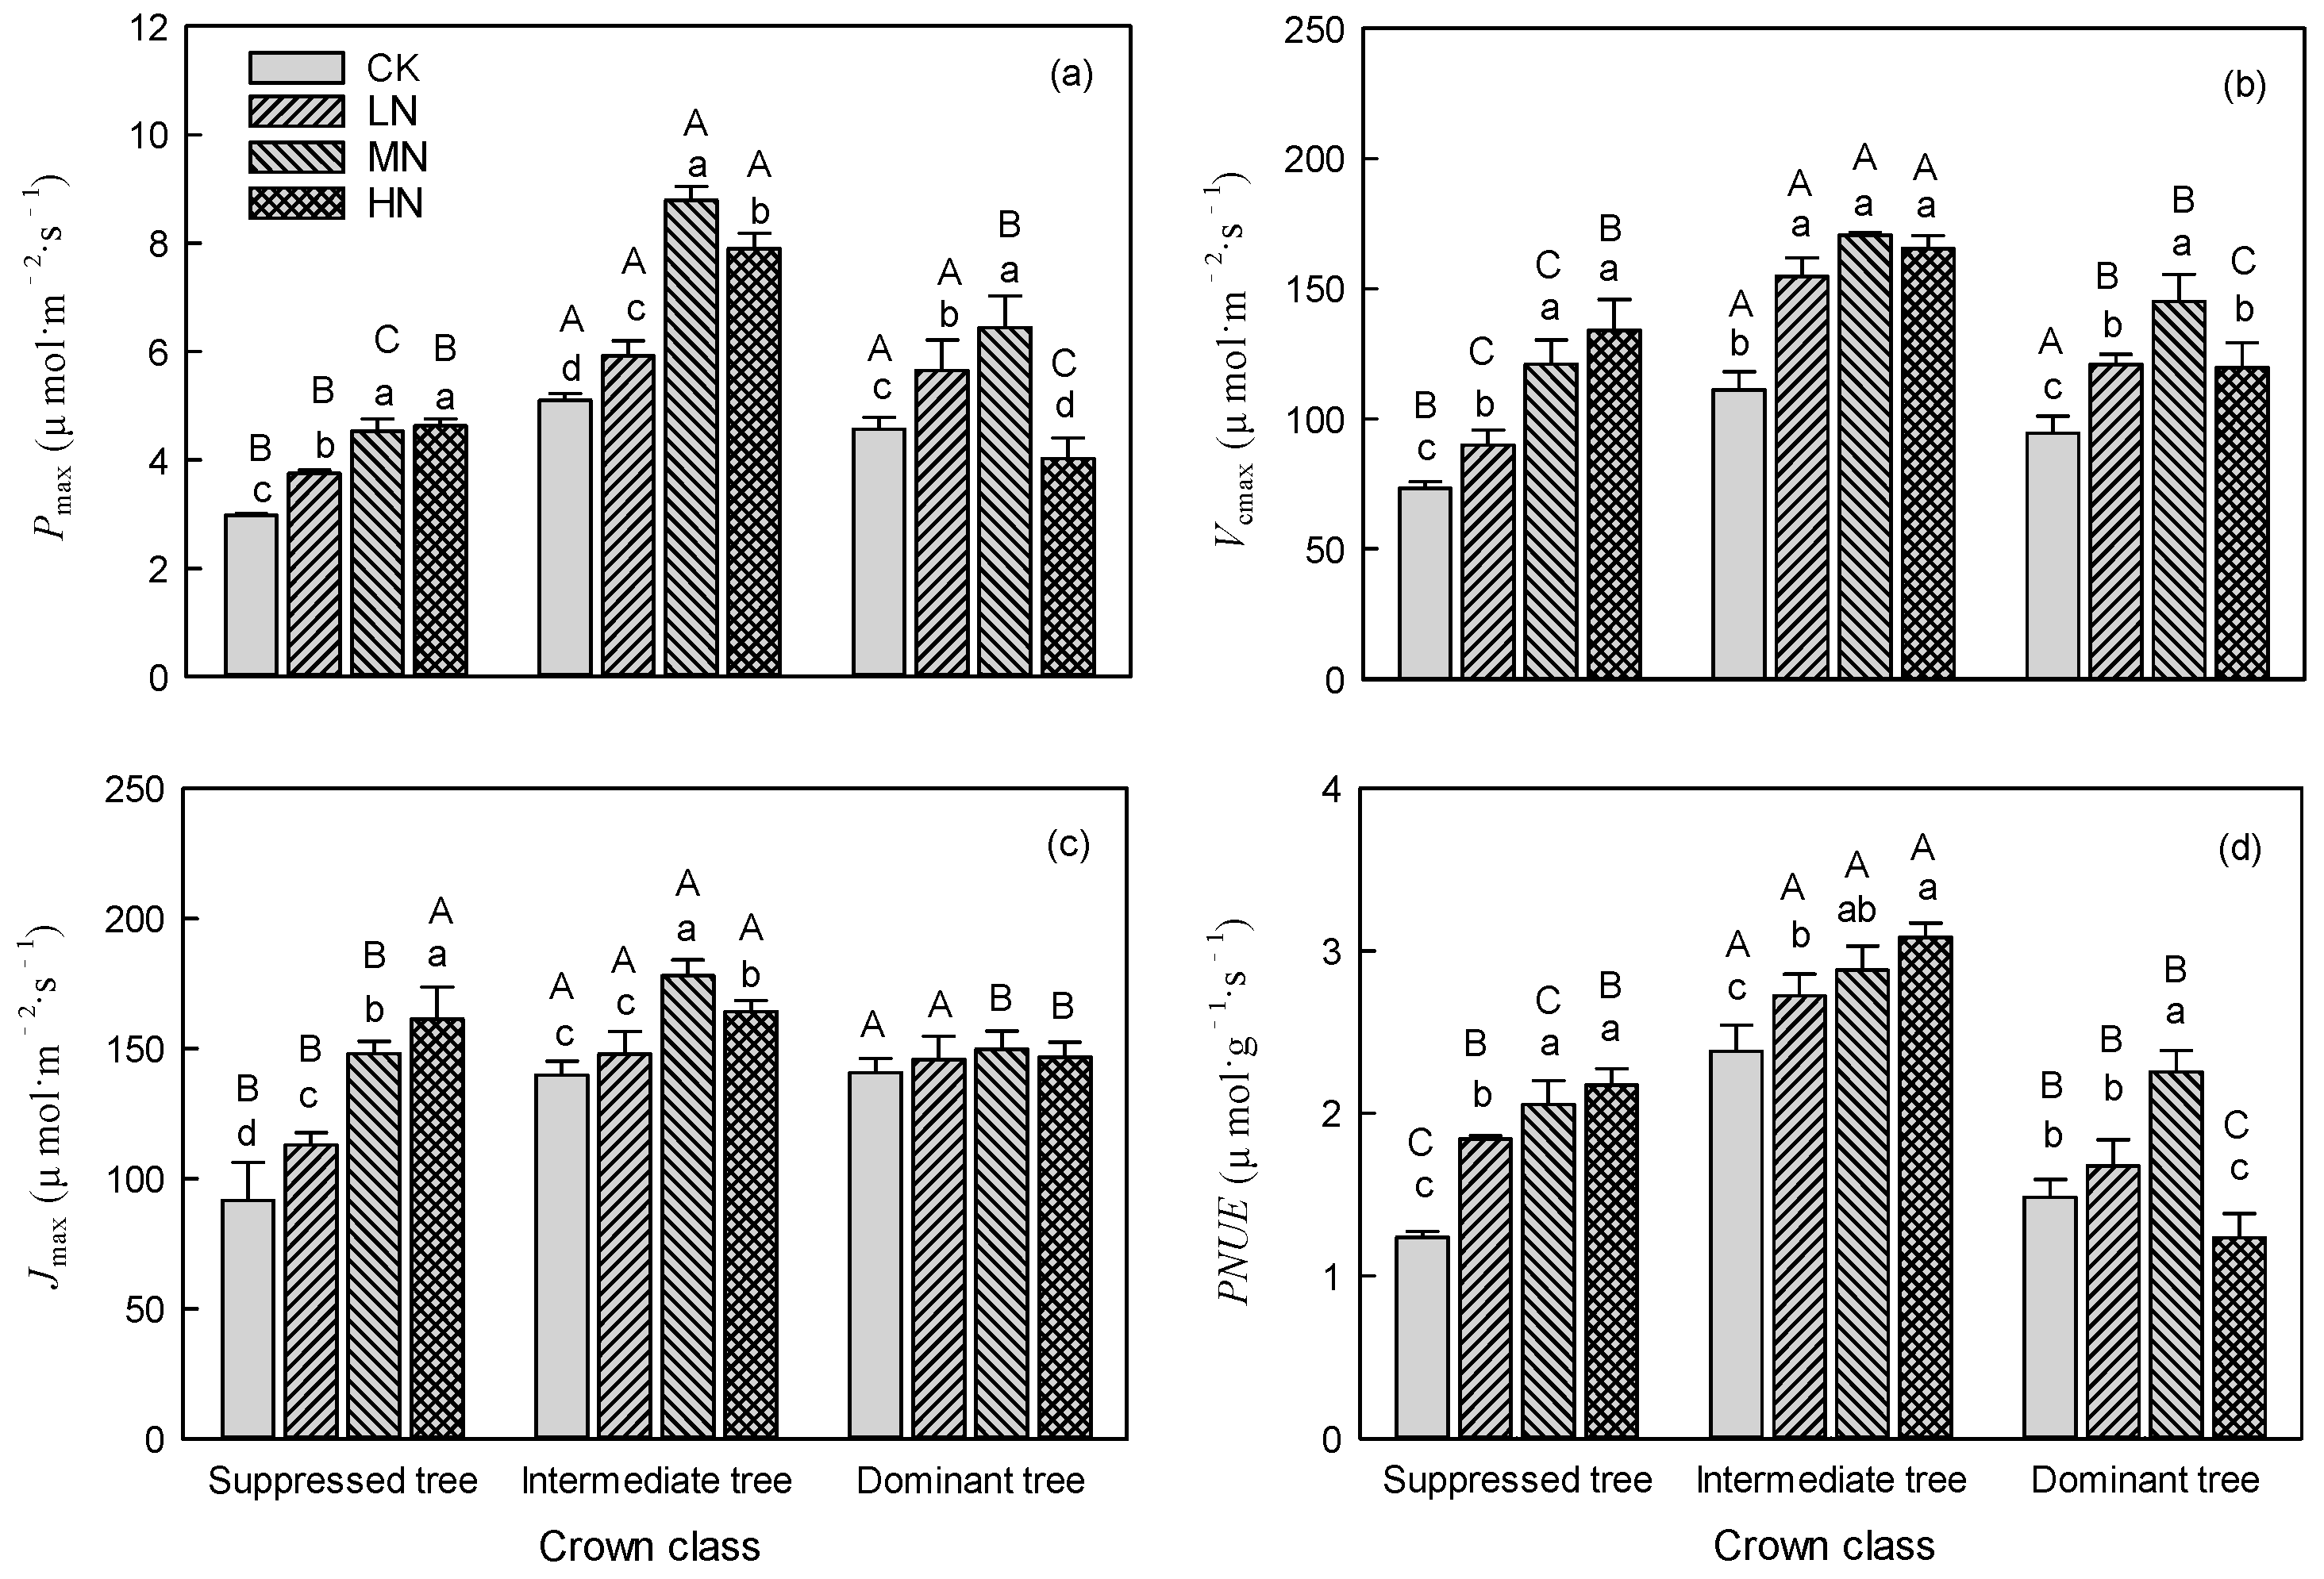
Figure 2.
Differences in (a) maximum net photosynthetic rate (Pmax), (b) maximum carboxylation rate (Vcmax), (c) maximum electron transfer rate (Jmax), and (d) photosynthetic nitrogen use efficiency (PNUE) among trees in different crown classes in the same N addition treatments. CK: control, LN: low N addition treatment, MN: middle N addition treatment, HN: high N addition treatment.
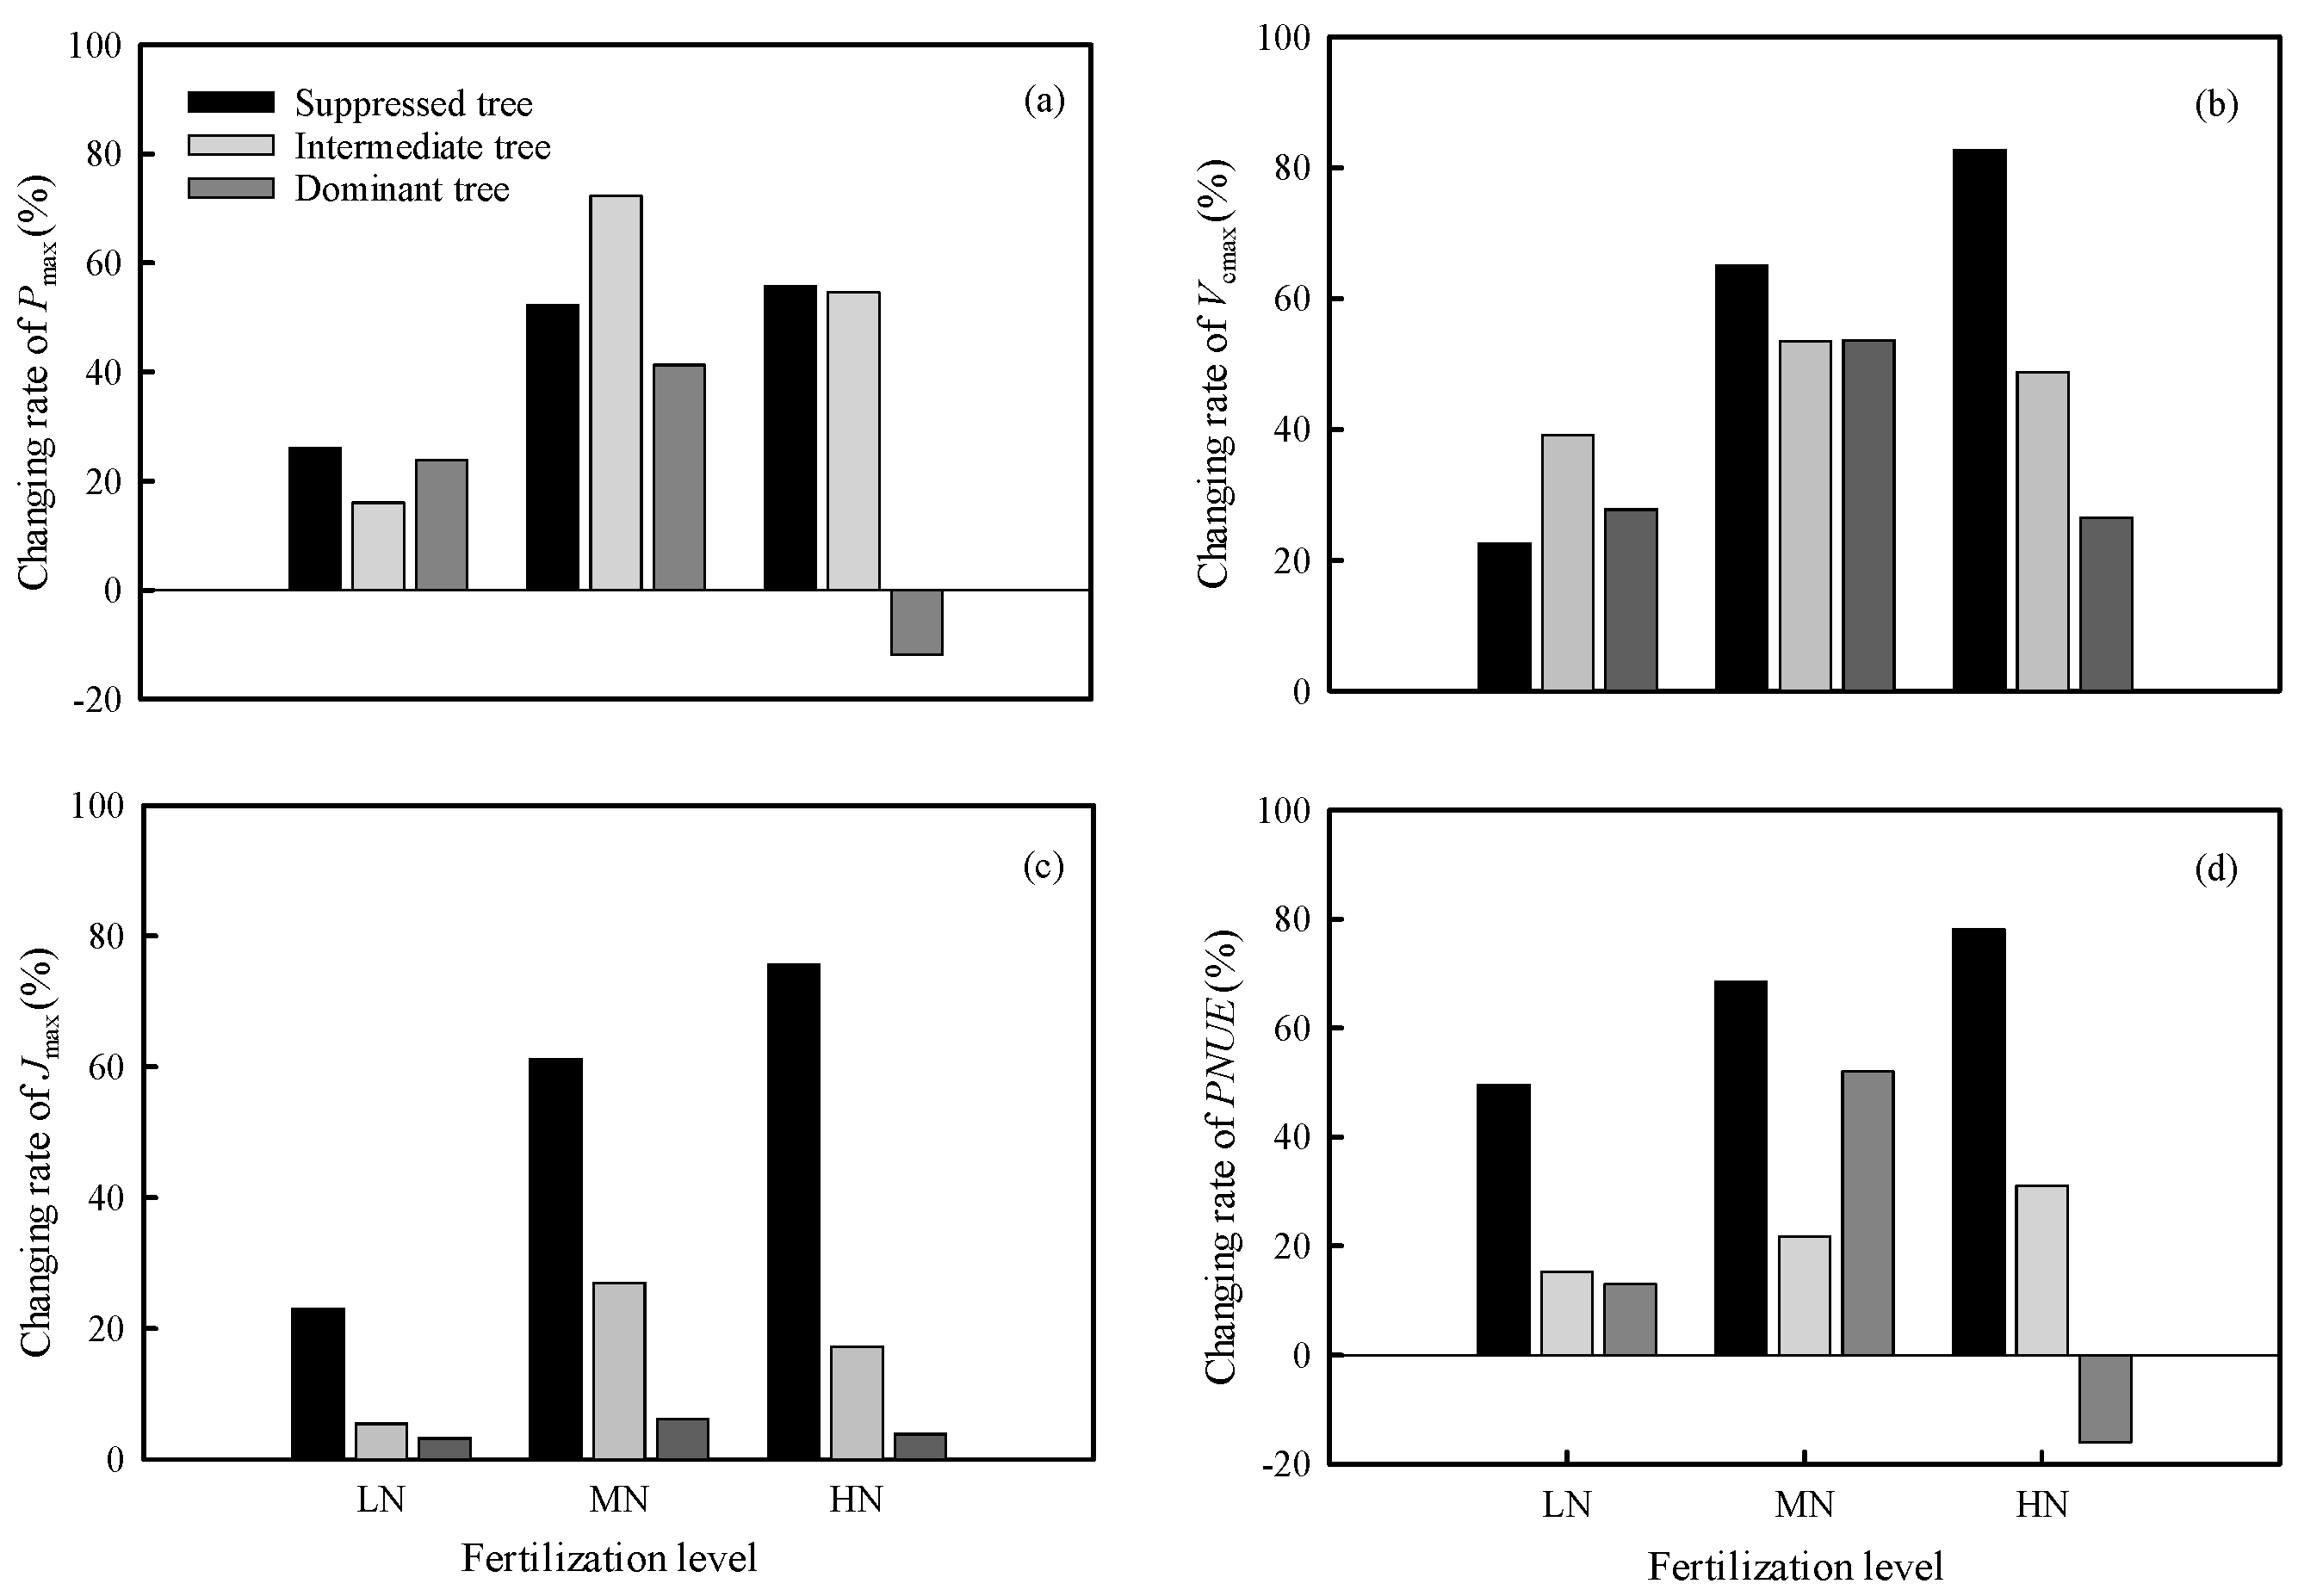
Figure 3.
Effects of N addition on (a) chlorophyll content (Chlm), (b) nitrogen content (Nmass), (c) phosphorous content (Pmass), and (d) ratio of nitrogen to phosphorous (N:P) in trees in different crown classes. Error bars represent standard errors (n = 3), different capital letters indicate significant differences among crown classes under the same N addition treatment (α= 0.05), and different lowercase letters indicate significant differences among N addition treatments within the same crown class (α = 0.05). CK: control, LN: low N addition treatment, MN: middle N addition treatment, HN: high N addition treatment.
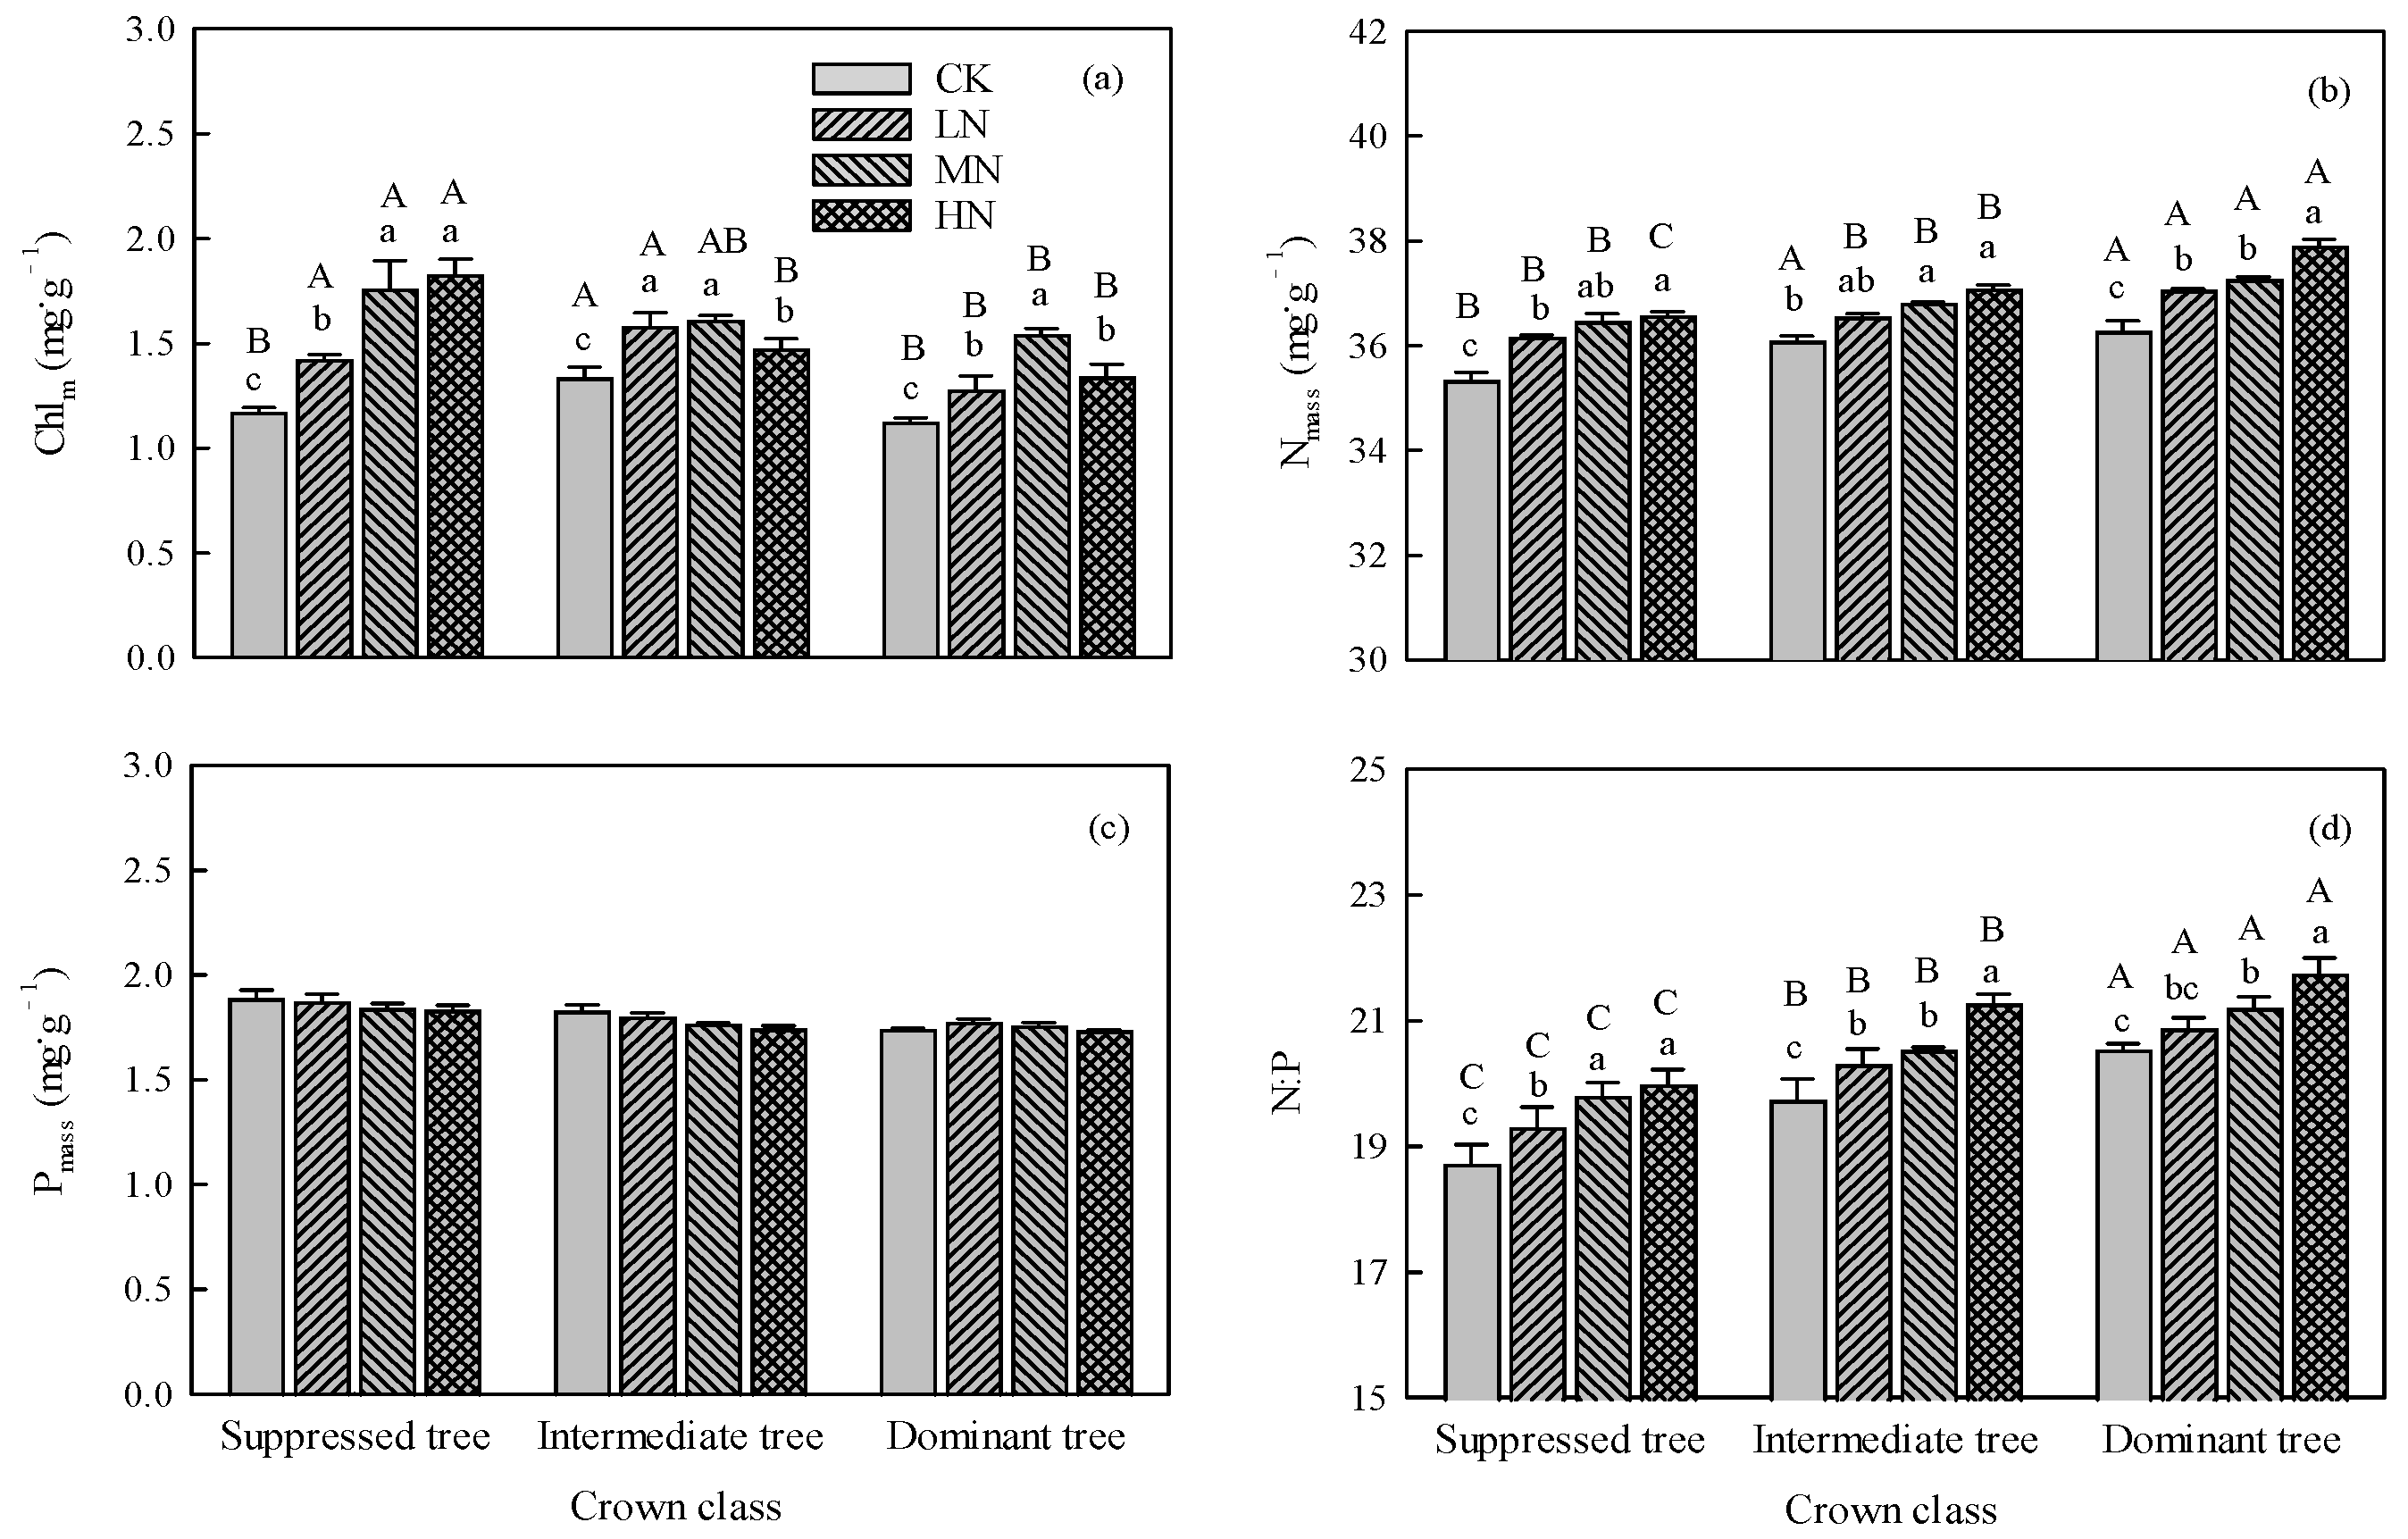
Figure 4.
Effects of N addition on activity of (a) 1, 5-ribulose bisphosphate carboxylase (RubisCO), (b) glutamine synthetase (GS), (c) glycolate oxidase (GLO), and (d) phosphoenolpyruvate carboxylase (PEPC) in trees in crown classes. Error bars represent standard errors (n = 3), different capital letters indicate significant differences among crown classes in the same N addition treatment (α= 0.05), and different lowercase letters indicate significant differences among N addition treatments within the same crown class (α = 0.05). CK: control, LN: low N addition treatment, MN: middle N addition treatment, HN: high N addition treatment.
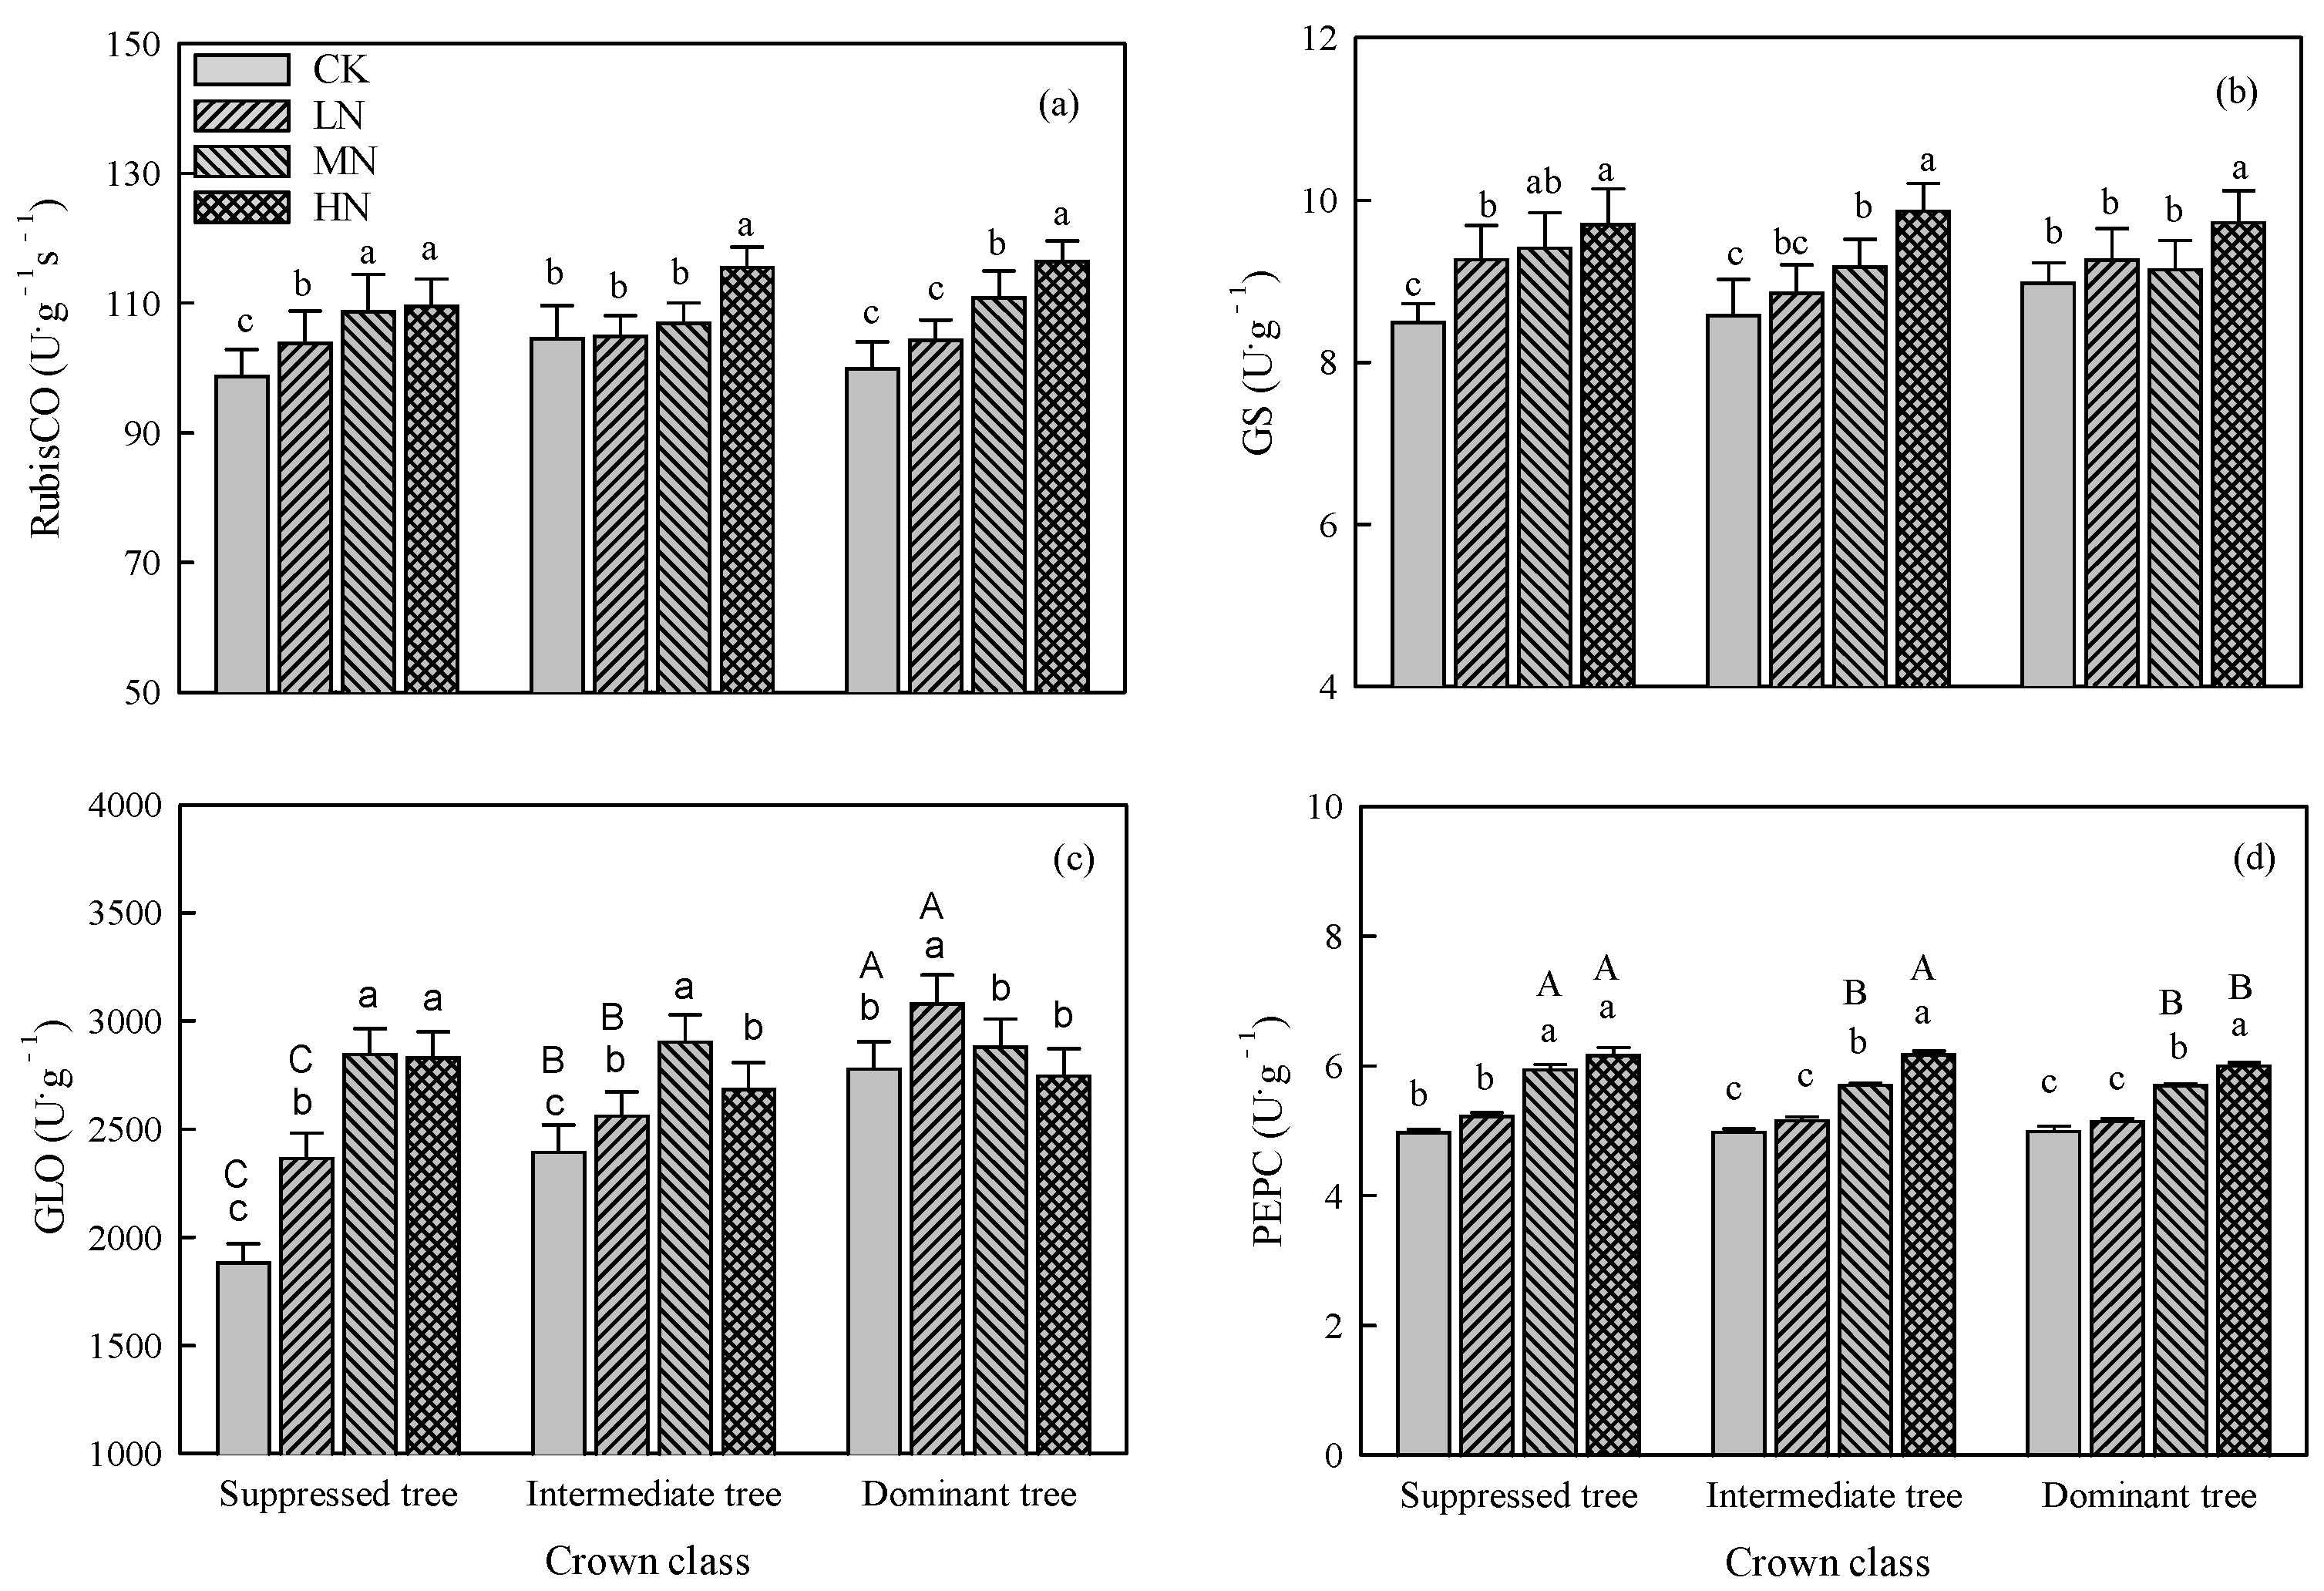
Figure 5.
Relationships between nitrogen content (Nmass) and maximum net photosynthetic rate (Pmax) (left), maximum electron transport rate (Jmax) (middle), and maximum carboxylation rate (Vcmax) (right).
Figure 5.
Relationships between nitrogen content (Nmass) and maximum net photosynthetic rate (Pmax) (left), maximum electron transport rate (Jmax) (middle), and maximum carboxylation rate (Vcmax) (right).
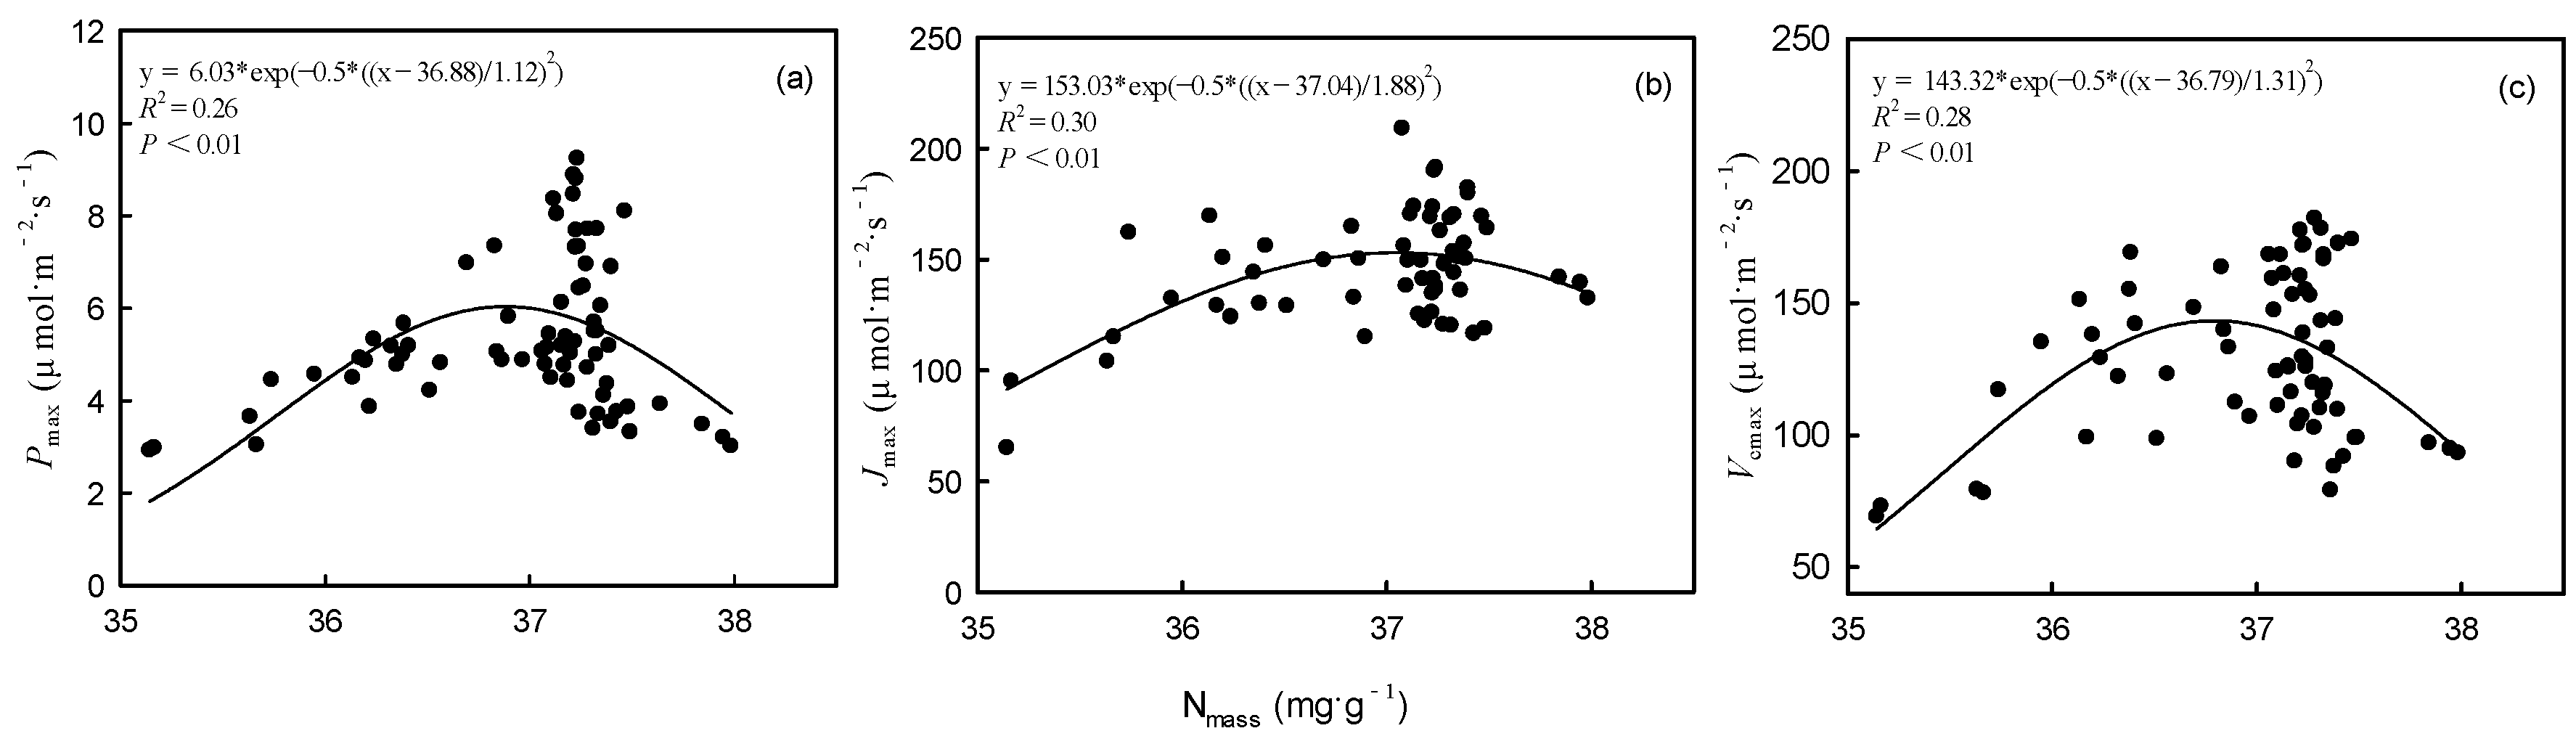
Figure 6.
Partial least squares path modeling to demonstrate major pathways of the influences of Nmass, photosynthetic enzyme activities, nitrogen-phosphorus ratio (N:P), and chlorophyll (Chlm) on the photosynthetic capacity of L. gmelinii for (a) suppressed trees, (b) intermediate trees, (c) dominant trees. Solid and dashed arrows represent significant effect and no significant effect, respectively. Red and black arrows indicate positive and negative effects, respectively. Line thickness represents the strength of the causal relationship. Values near arrows indicate standardized coefficients for each causal path and covariance (*, P < 0.05; **, P < 0.01; ***, P < 0.001). Values of R2 represent amount of variation explained in response variables. GOF indicates the goodness of fit of the entire model.
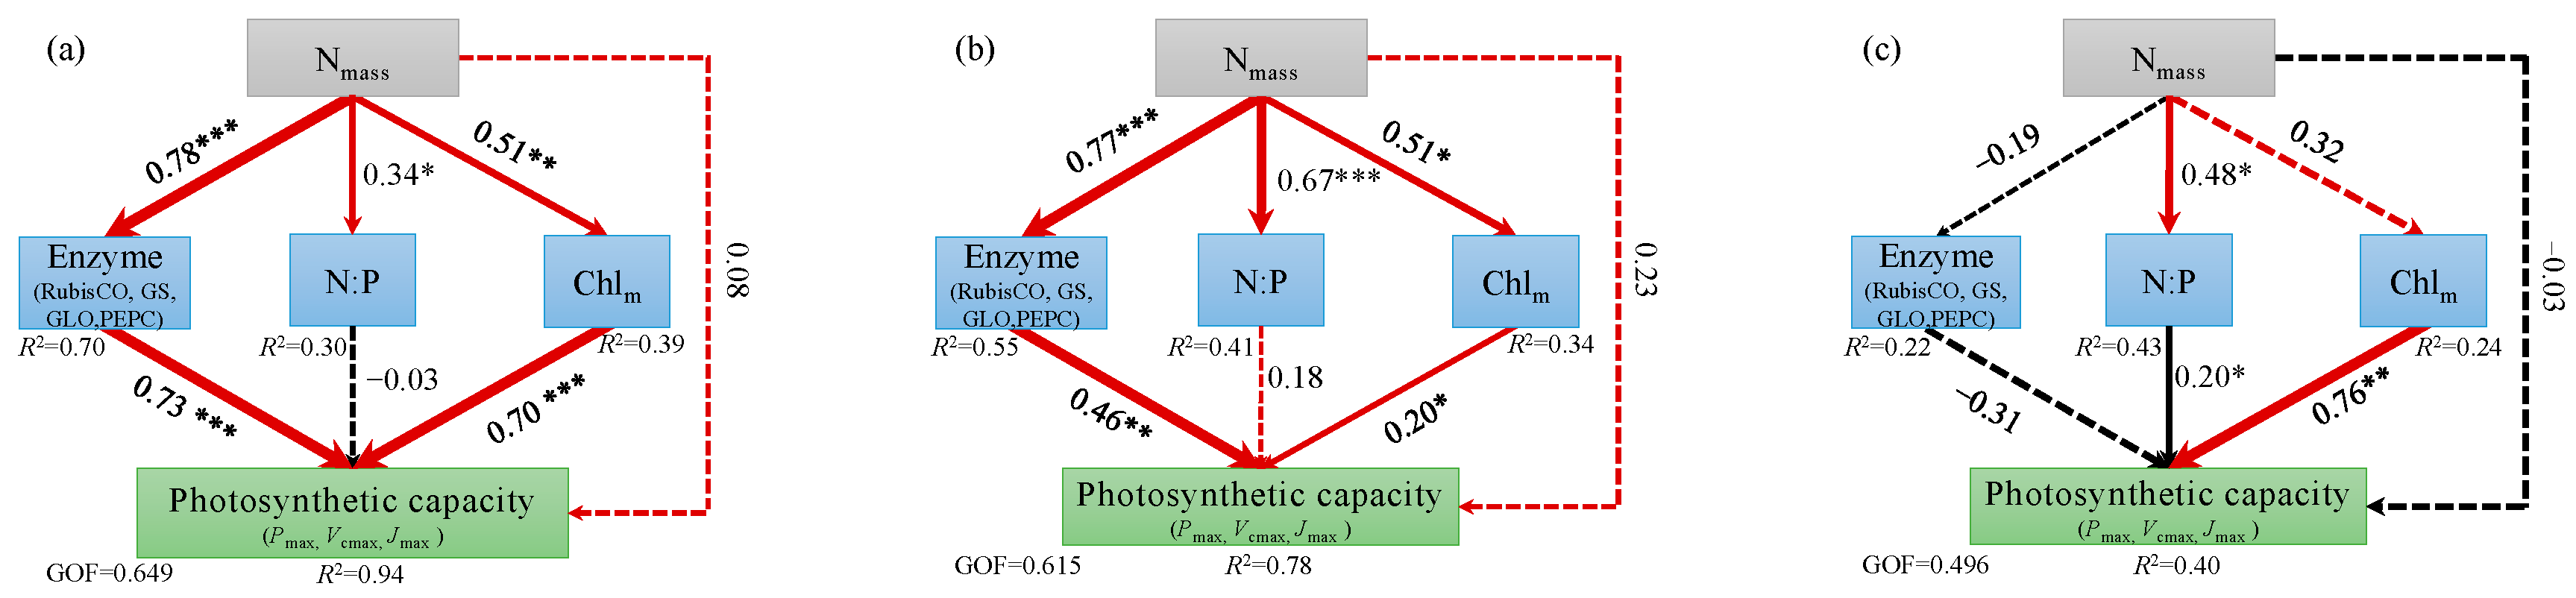

Table 1.
ANOVA results for larch leaf traits*.
| Variable | Crown class | Nitrogen addition |
Crown class × Nitrogen addition | |||
|---|---|---|---|---|---|---|
| F | P | F | P | F | P | |
| Pmax | 50.85 | < 0.01 | 17.37 | < 0.01 | 6.67 | < 0.01 |
| Vcmax | 32.63 | < 0.01 | 14.93 | < 0.01 | 3.26 | < 0.01 |
| Jmax | 8.96 | < 0.01 | 9.14 | < 0.01 | 2.48 | 0.04 |
| Nmass | 8.31 | < 0.01 | 17.79 | < 0.01 | 3.92 | < 0.01 |
| Pmass | 17.44 | < 0.01 | 1.64 | 0.19 | 0.79 | 0.58 |
| N:P | 28.00 | < 0.01 | 6.78 | < 0.01 | 2.32 | 0.05 |
| PNUE | 56.84 | < 0.01 | 9.17 | < 0.01 | 4.12 | < 0.01 |
| Chlm | 11.54 | < 0.01 | 15.97 | < 0.01 | 3.37 | < 0.01 |
| SLA | 47.50 | < 0.01 | 1.84 | 0.15 | 6.18 | < 0.01 |
| RubisCO | 6.38 | < 0.01 | 59.42 | < 0.01 | 2.69 | 0.02 |
| GS | 1.72 | 0.13 | 41.97 | < 0.01 | 3.99 | 0.02 |
| GLO | 5.29 | 0.10 | 1.72 | 0.18 | 2.30 | 0.05 |
| PEPC | 7.95 | < 0.01 | 199.04 | < 0.01 | 3.41 | < 0.01 |
*Pmax: maximum net photosynthetic rate; Vcmax: maximum carboxylation rate; Jmax: maximum electron transfer rate; Nmass: mass-based nitrogen content; Pmass: mass-based phosphorus content; N:P: ratio of nitrogen to phosphorous; PNUE: photosynthetic nitrogen-use efficiency; Chlm: chlorophyll content; SLA: specific leaf area; RubisCO: 1, 5-ribulose bisphosphate carboxylase; GS: glutamine synthetase; GLO: glycolate oxidase; PEPC: phosphoenolpyruvate carboxylase. The same below.
Disclaimer/Publisher’s Note: The statements, opinions and data contained in all publications are solely those of the individual author(s) and contributor(s) and not of MDPI and/or the editor(s). MDPI and/or the editor(s) disclaim responsibility for any injury to people or property resulting from any ideas, methods, instructions or products referred to in the content. |
© 2025 by the authors. Licensee MDPI, Basel, Switzerland. This article is an open access article distributed under the terms and conditions of the Creative Commons Attribution (CC BY) license (http://creativecommons.org/licenses/by/4.0/).
Copyright: This open access article is published under a Creative Commons CC BY 4.0 license, which permit the free download, distribution, and reuse, provided that the author and preprint are cited in any reuse.


