1. Introduction
This research focuses on the study of pH-CSTR (Continuous Stirred Tank Reactor) because it is very used in the chemical industries and waste water processing stations. [
1]. The ph-CSTR is used to neutralize an acidic inlet liquid stream by mixing it with an alkali liquid stream in order to obtain a neutral liquid stream having a pH equal or close to 7. The incoming acidic liquid stream feeding the reactor can be a liquid process or a liquid resulting of a waste water processing unit [
1,
2,
3]. Indeed, a liquid stream must be processing in order to have a neutral pH before being released in the environment. These considerations motivate the need of investigating the dynamic and control of a pH CSTR system. For this purpose, the dynamic mathematical model of a pH-CSTR was set and solved using the data related to a nominal operating point. Afterwards, the performance of a PID controller was assessed in regulation and tracking mode of the pH inside the reactor.
2. The pH CSTR Unit
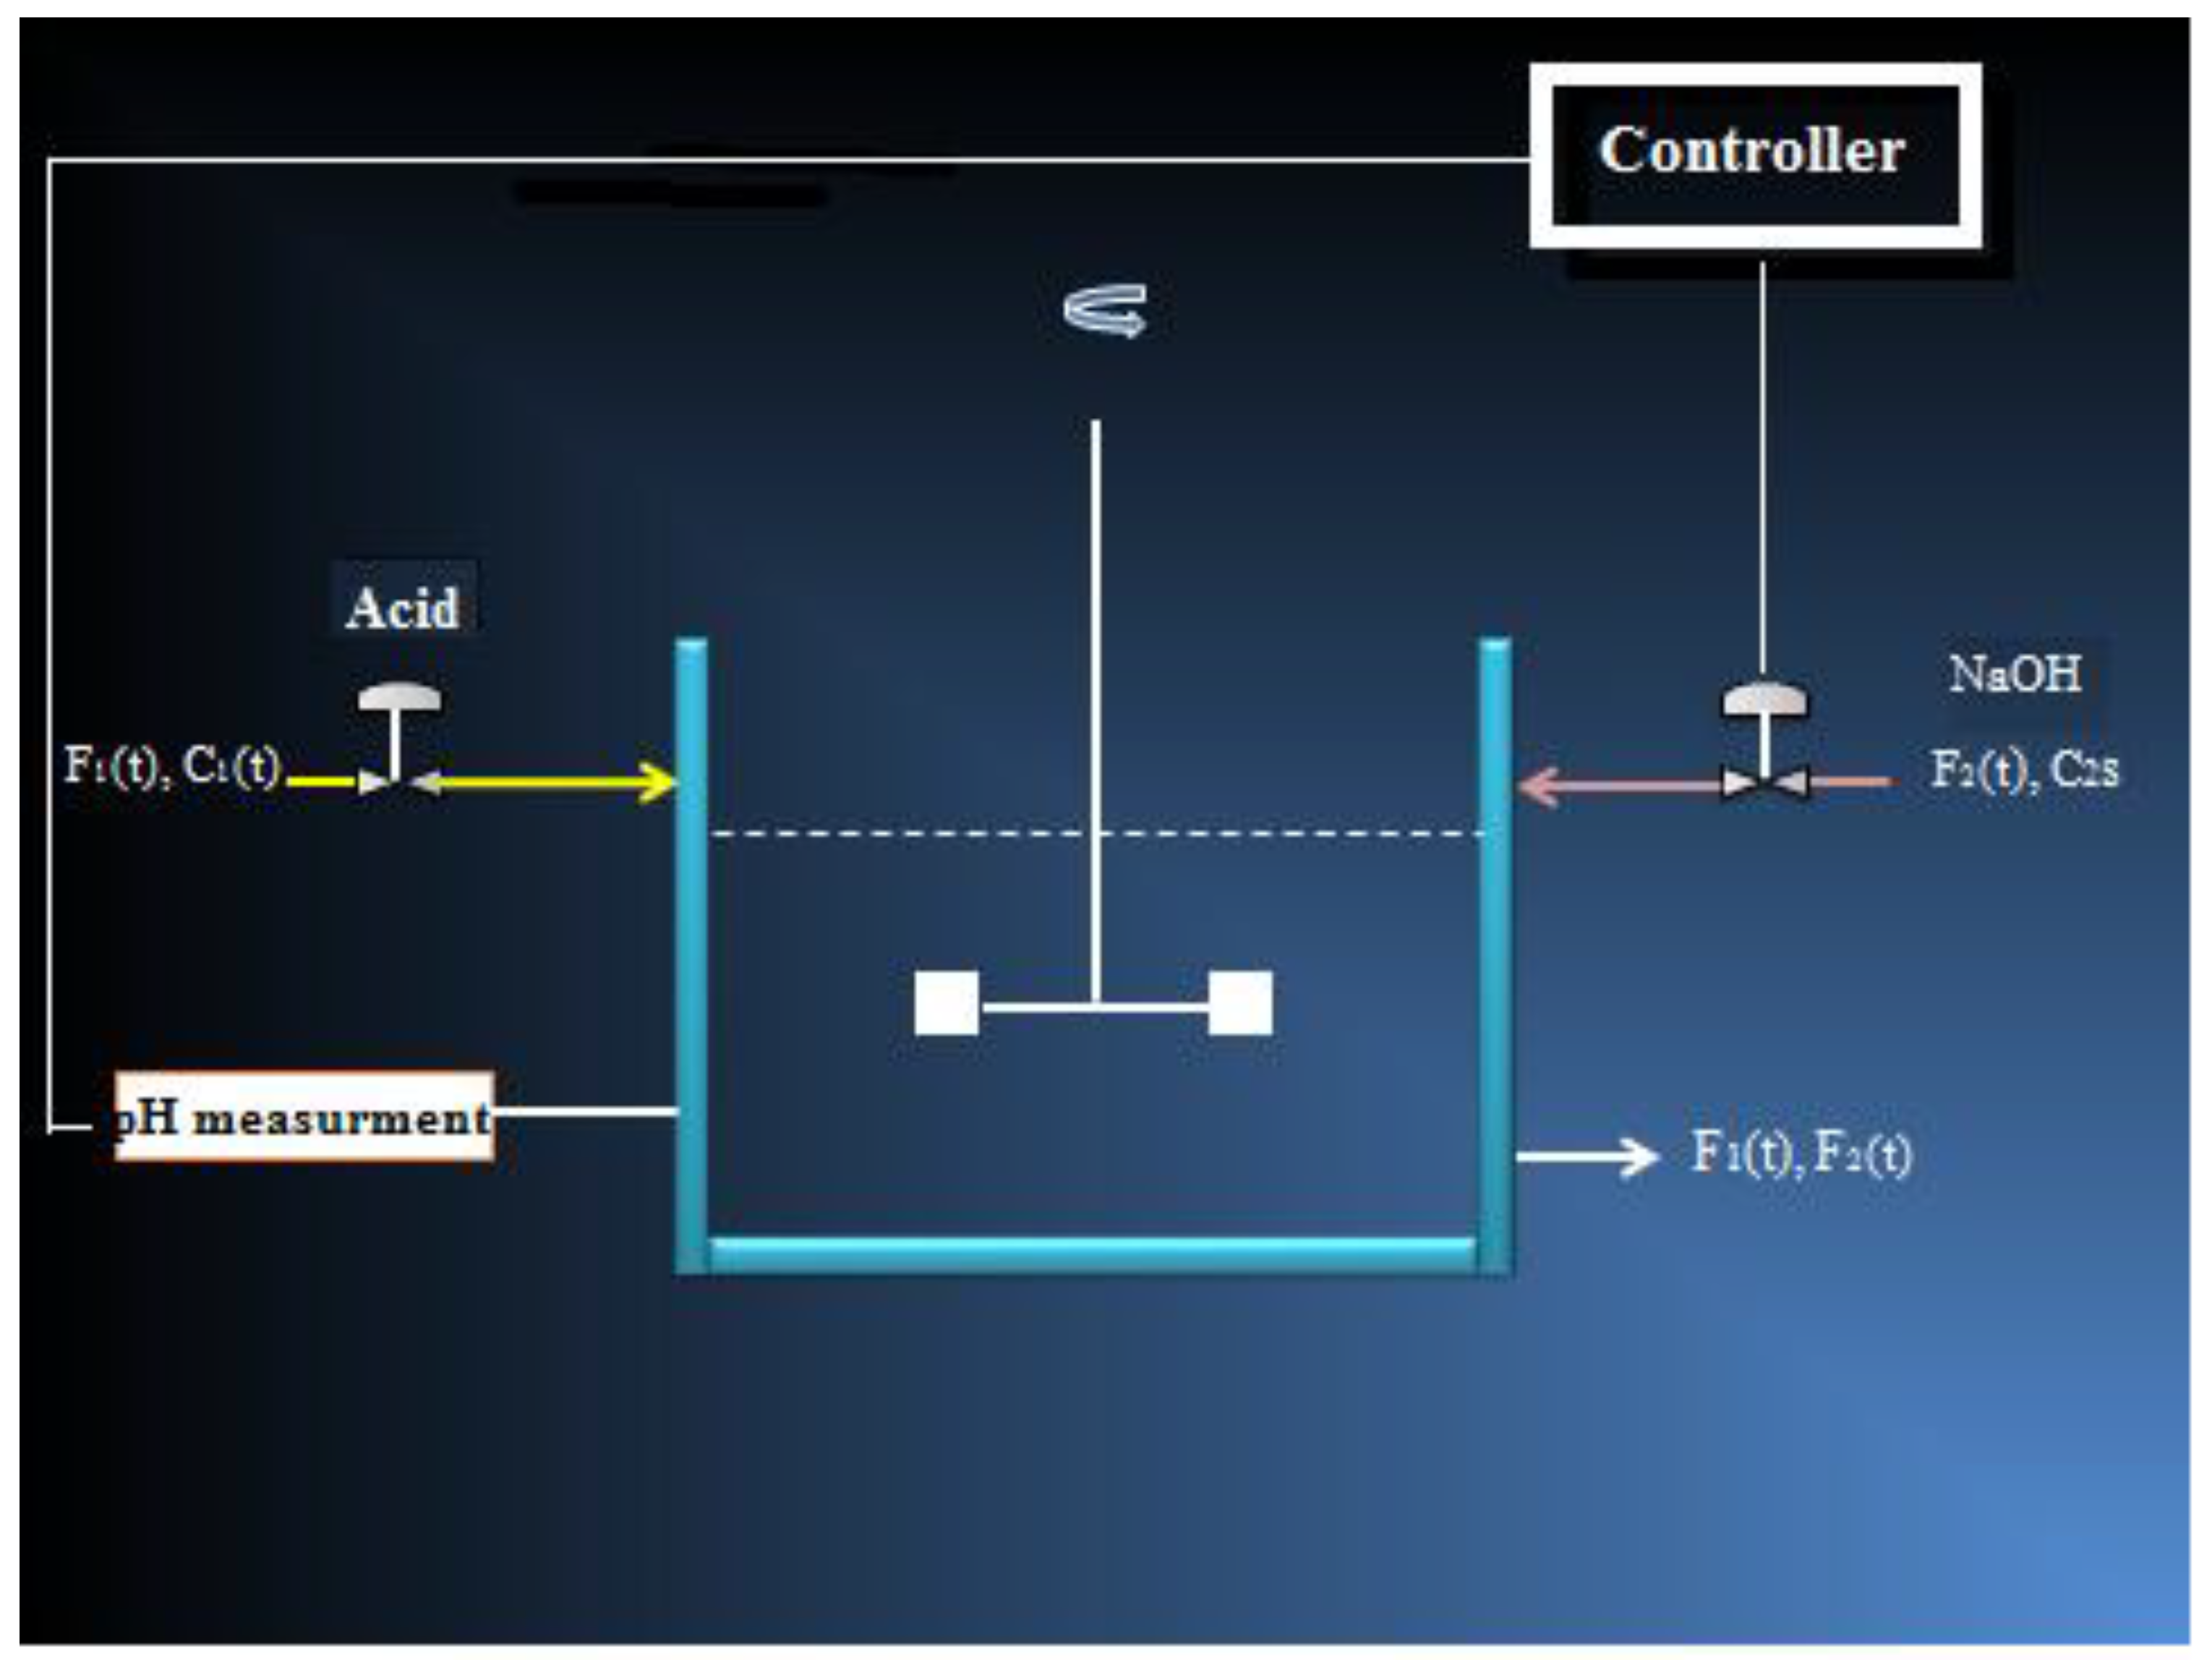
A flowsheet of pH-CSTR unit is presented in
Figure 1 [
1]. This unit consists mainly of a continuous stirred tank reactor. The feed entering the reactor is an acidic liquid. The controller manipulates an alkali liquid stream flowrate by mixing it with the inlet liquid inside the reactor. At the exit of the reactor, the effluent liquid must have a neutral pH.
Table 1 gives additional parameter values related to the studied process.
3. Model Assumptions
The main model assumptions are listed below:
- -
neutralization of weak acid (acetic acid) with strong alkali (NaOH) ;
- -
isothermal operation (constant temperature in the reactor);
- -
perfect mixing in the reactor;
- -
the dynamics of the pH sensor and valve are neglected;
- -
any delay time or dead time is neglected in the process;
- -
the concentration C2s is supposed constant;
- -
F2 is considered as the manipulative variable;
- -
disturbances are related to the acid flowrate F1 or the acid concentration C1.
4. Dynamic Mathematical Model and Method of Resolution
The dynamic mathematical model can be either used for studying the parametric sensivity of a process [
4] or for control purpose [
5]. The pH-CSTR dynamic model process is presented as follows.
Molar balance for the acid
Molar balance for the alkali
Equation of the electric neutrality
equation (1), gives :
the substitution of equation (7a) in equation (3), lead to :
the equation (3a) gives :
Finally, the substitution of equation (3b) in equation (3a) lead to a third order algebraic equation relatively to
[H+] :
The resolution of the dynamic model can be resumed by the following steps:
- 1.
Compute ξ (t), from the following equation, by using Euler method
- 2.
Compute ζ (t), from the following, equation by using Euler method
- 3.
Compute the concentration [H+], from the following equation, by using Newton-Raphson method:
- 4.
Compute pH from the following equation:
5. Results and Discussion
5.1. Study of Dynamic of the Process in Open Loop Mode (Without Control)
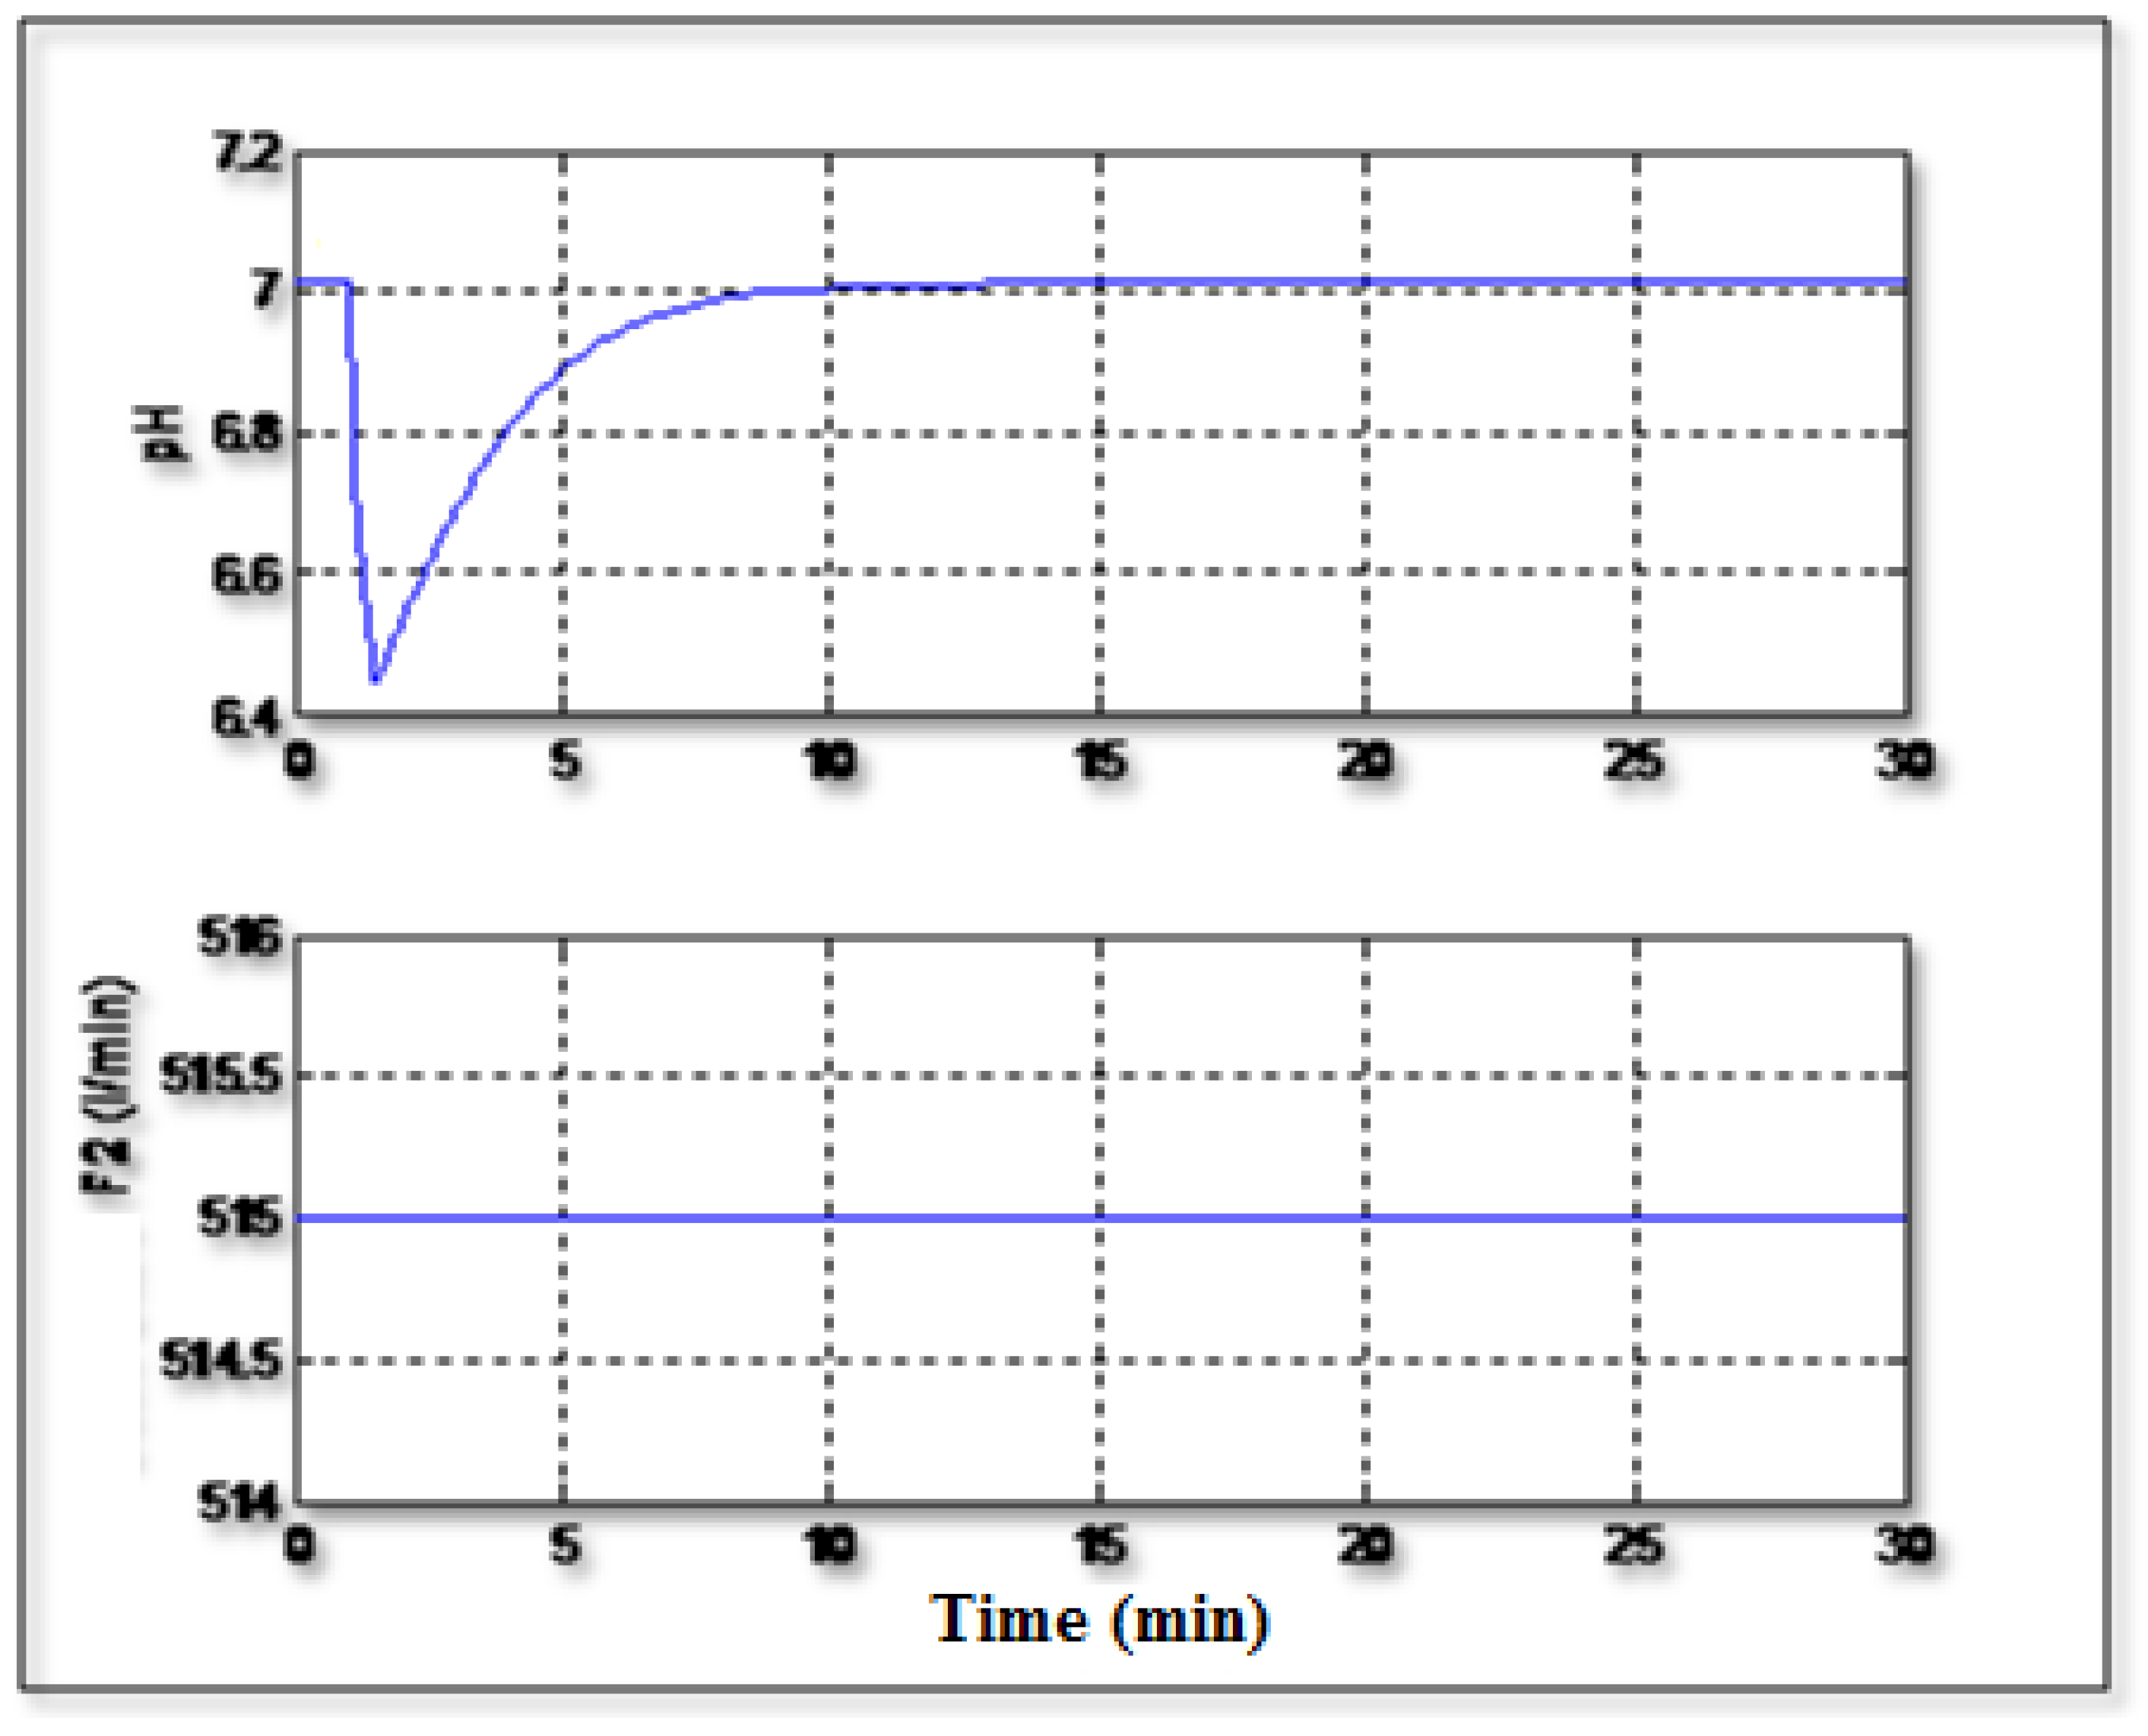
Figure 2 show the variation of the pH in case of an occurrence of a disturbance related to C1, injected at 1 minute, equal to +10 %, during 10 seconds.. It can be seen that the system is very sensitive to the concentration of the incoming acidic flowrate; this effect can be explained by the fact that the increase of the acid concentration induces a decrease of the pH because the mixture inside the reactor becomes more acidic. Furthermore, it can be seen from
Figure 2 that after the disturbance has disappeared, the pH return to its initial value. That last fact means that the system is naturally stable and it possesses a certain tendency to auto-regulate or auto-control itself.
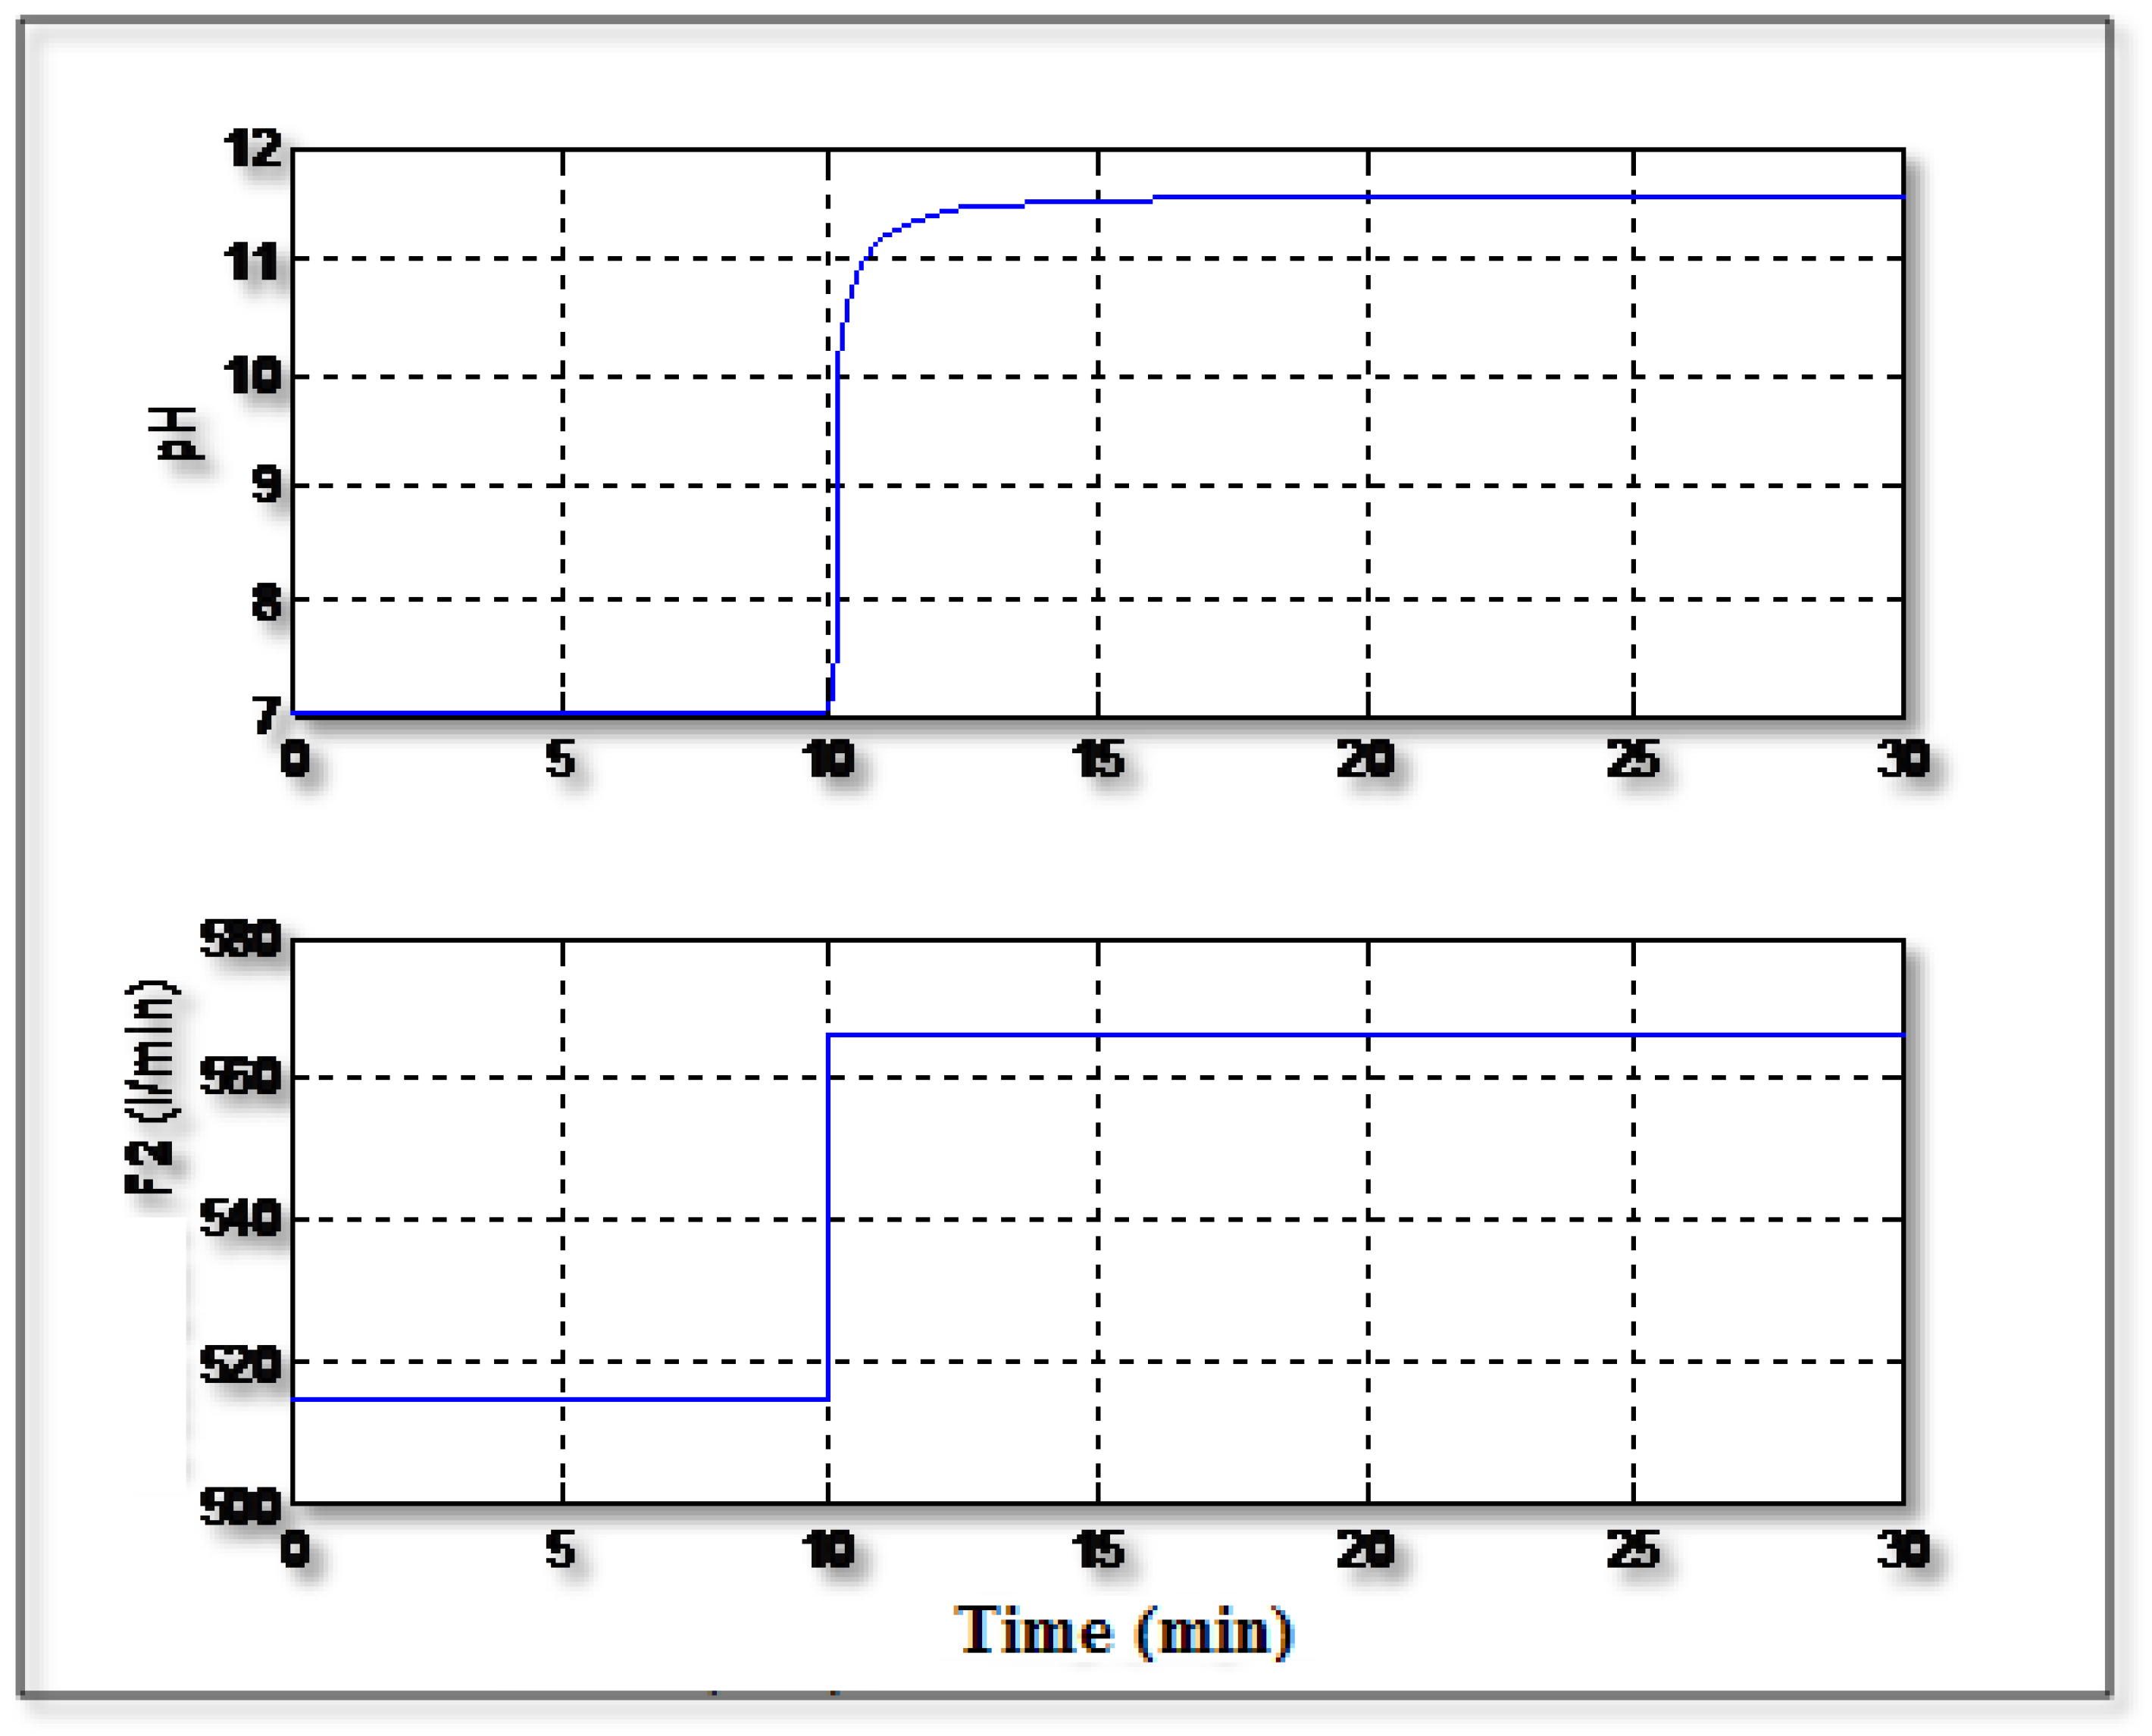
Figure 3 show the variation of the pH in case of an occurrence of a step variation related to F2, injected at 10 minute, equal to +10 %.. It can be seen that the system hasn’t a dead time and he has a sigmoid response, which denotes that it is a first order process. So, from data obtained in
Figure 3, the transfer function of the process was: H(p) = K/ (1+τ.p) = 0.087/(1+0.06p)
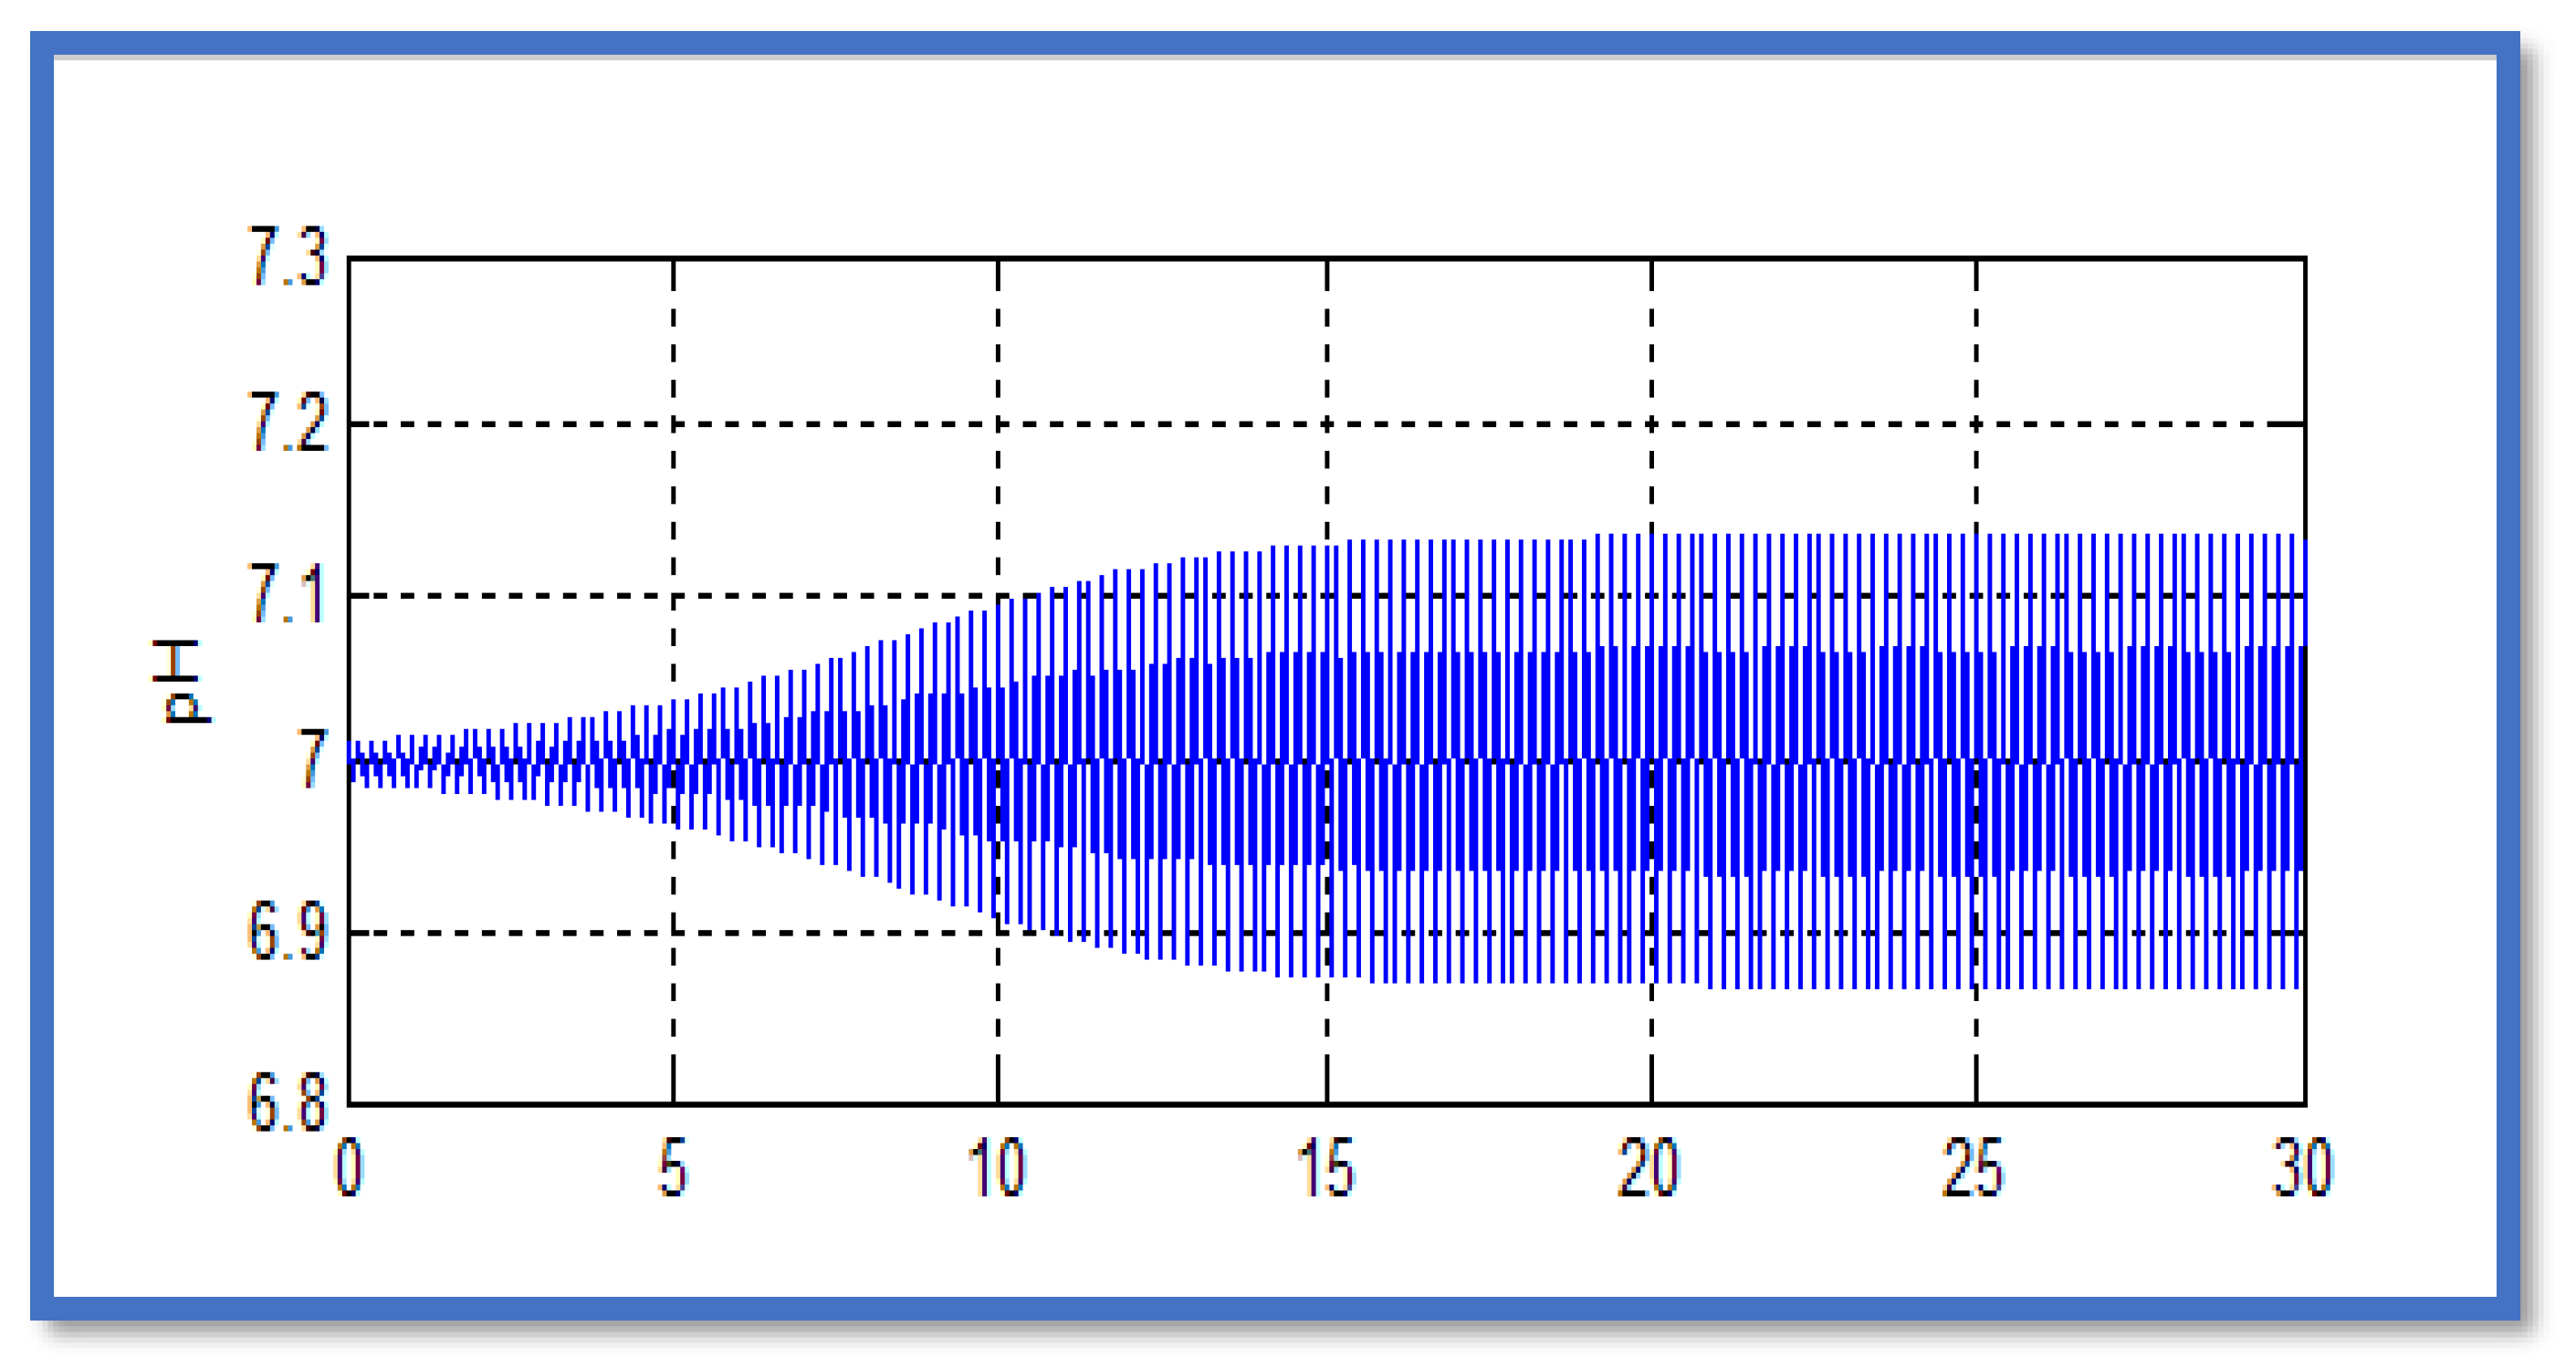
The parameters of the controller were determined according to Ziegler-Nichols method by occurring continuous oscillations related to the pH in order to determine the period of the oscillations Tz . From
Figure 4, the value of Tz was found to be equal to 0.2 min. Therefore, the parameters of the PID controller were found as follows : kc = 232; τ
I = 0.1 min; τ
D = 0.025 min.
5.1. Study of Dynamic of the Process in Closed Loop Mode (With Control)
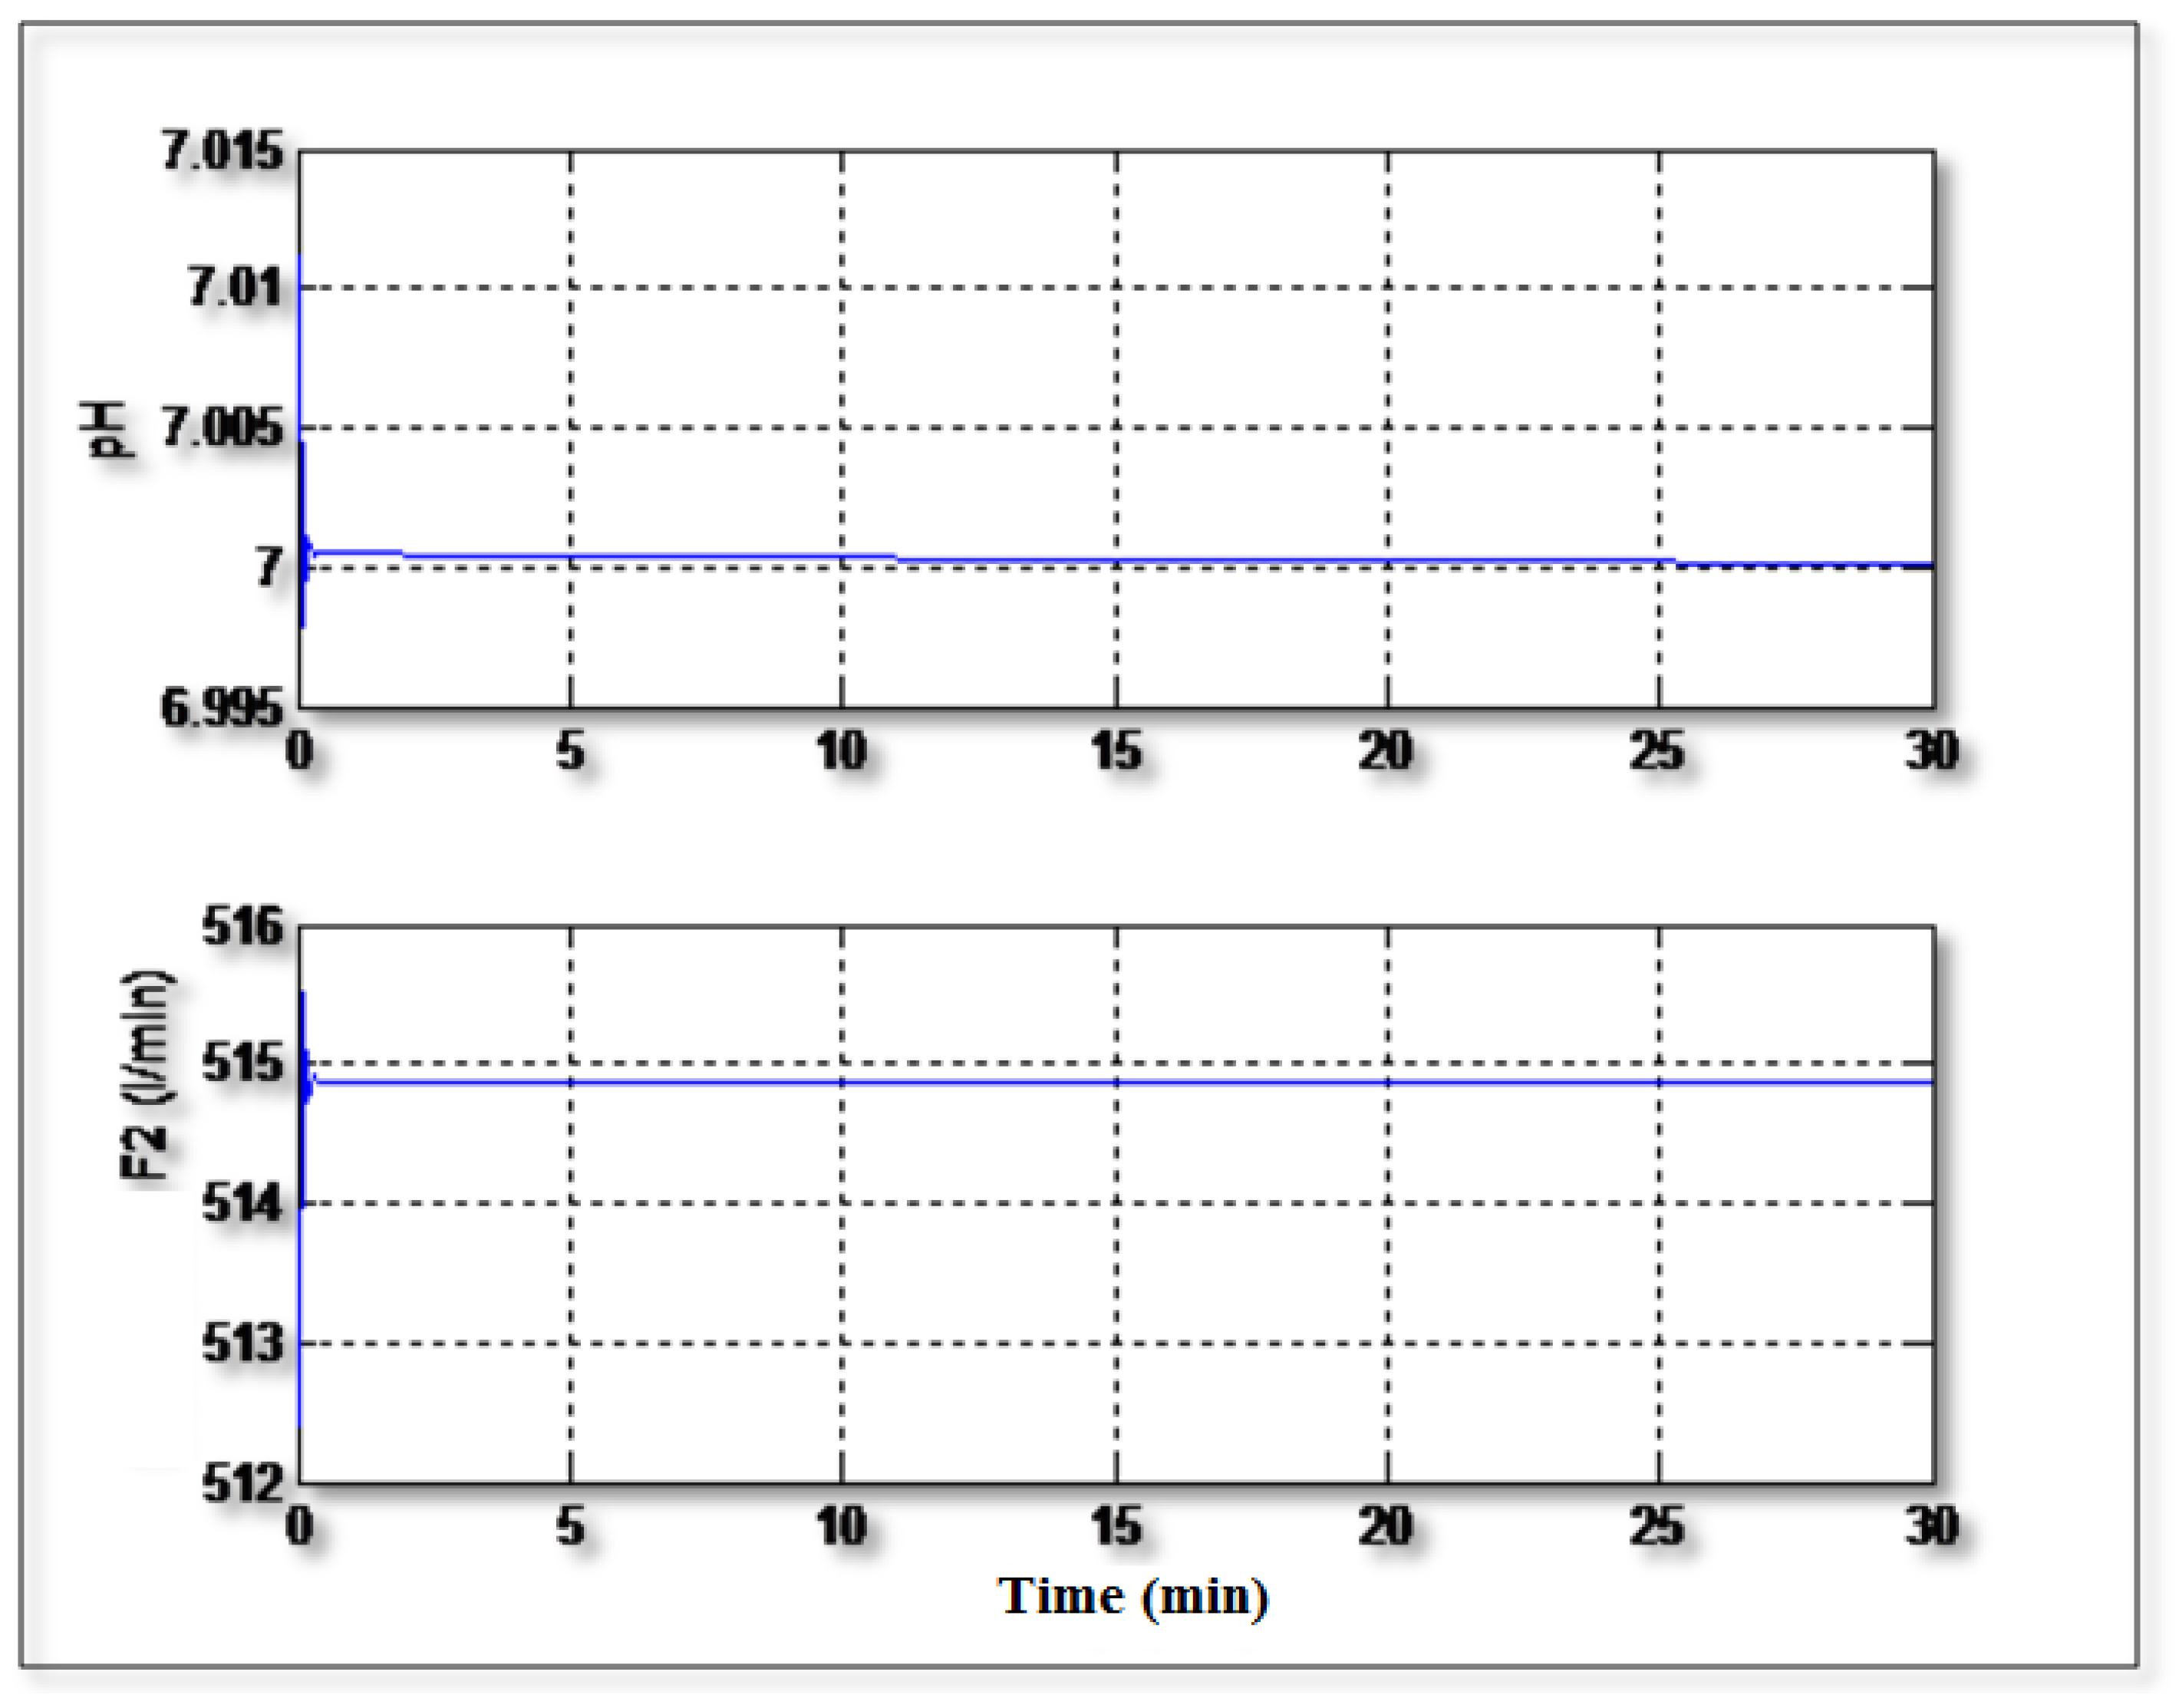
Figure 5 shows the regulation of the pH to the setpoint value (pH =7) without occurrence of any disturbances. It can be seen from this figure that the controller can control the pH rapidly and with a good precision. The control signal (F
2) varies regularly and doesn’t show excessive and dangerous peaks.
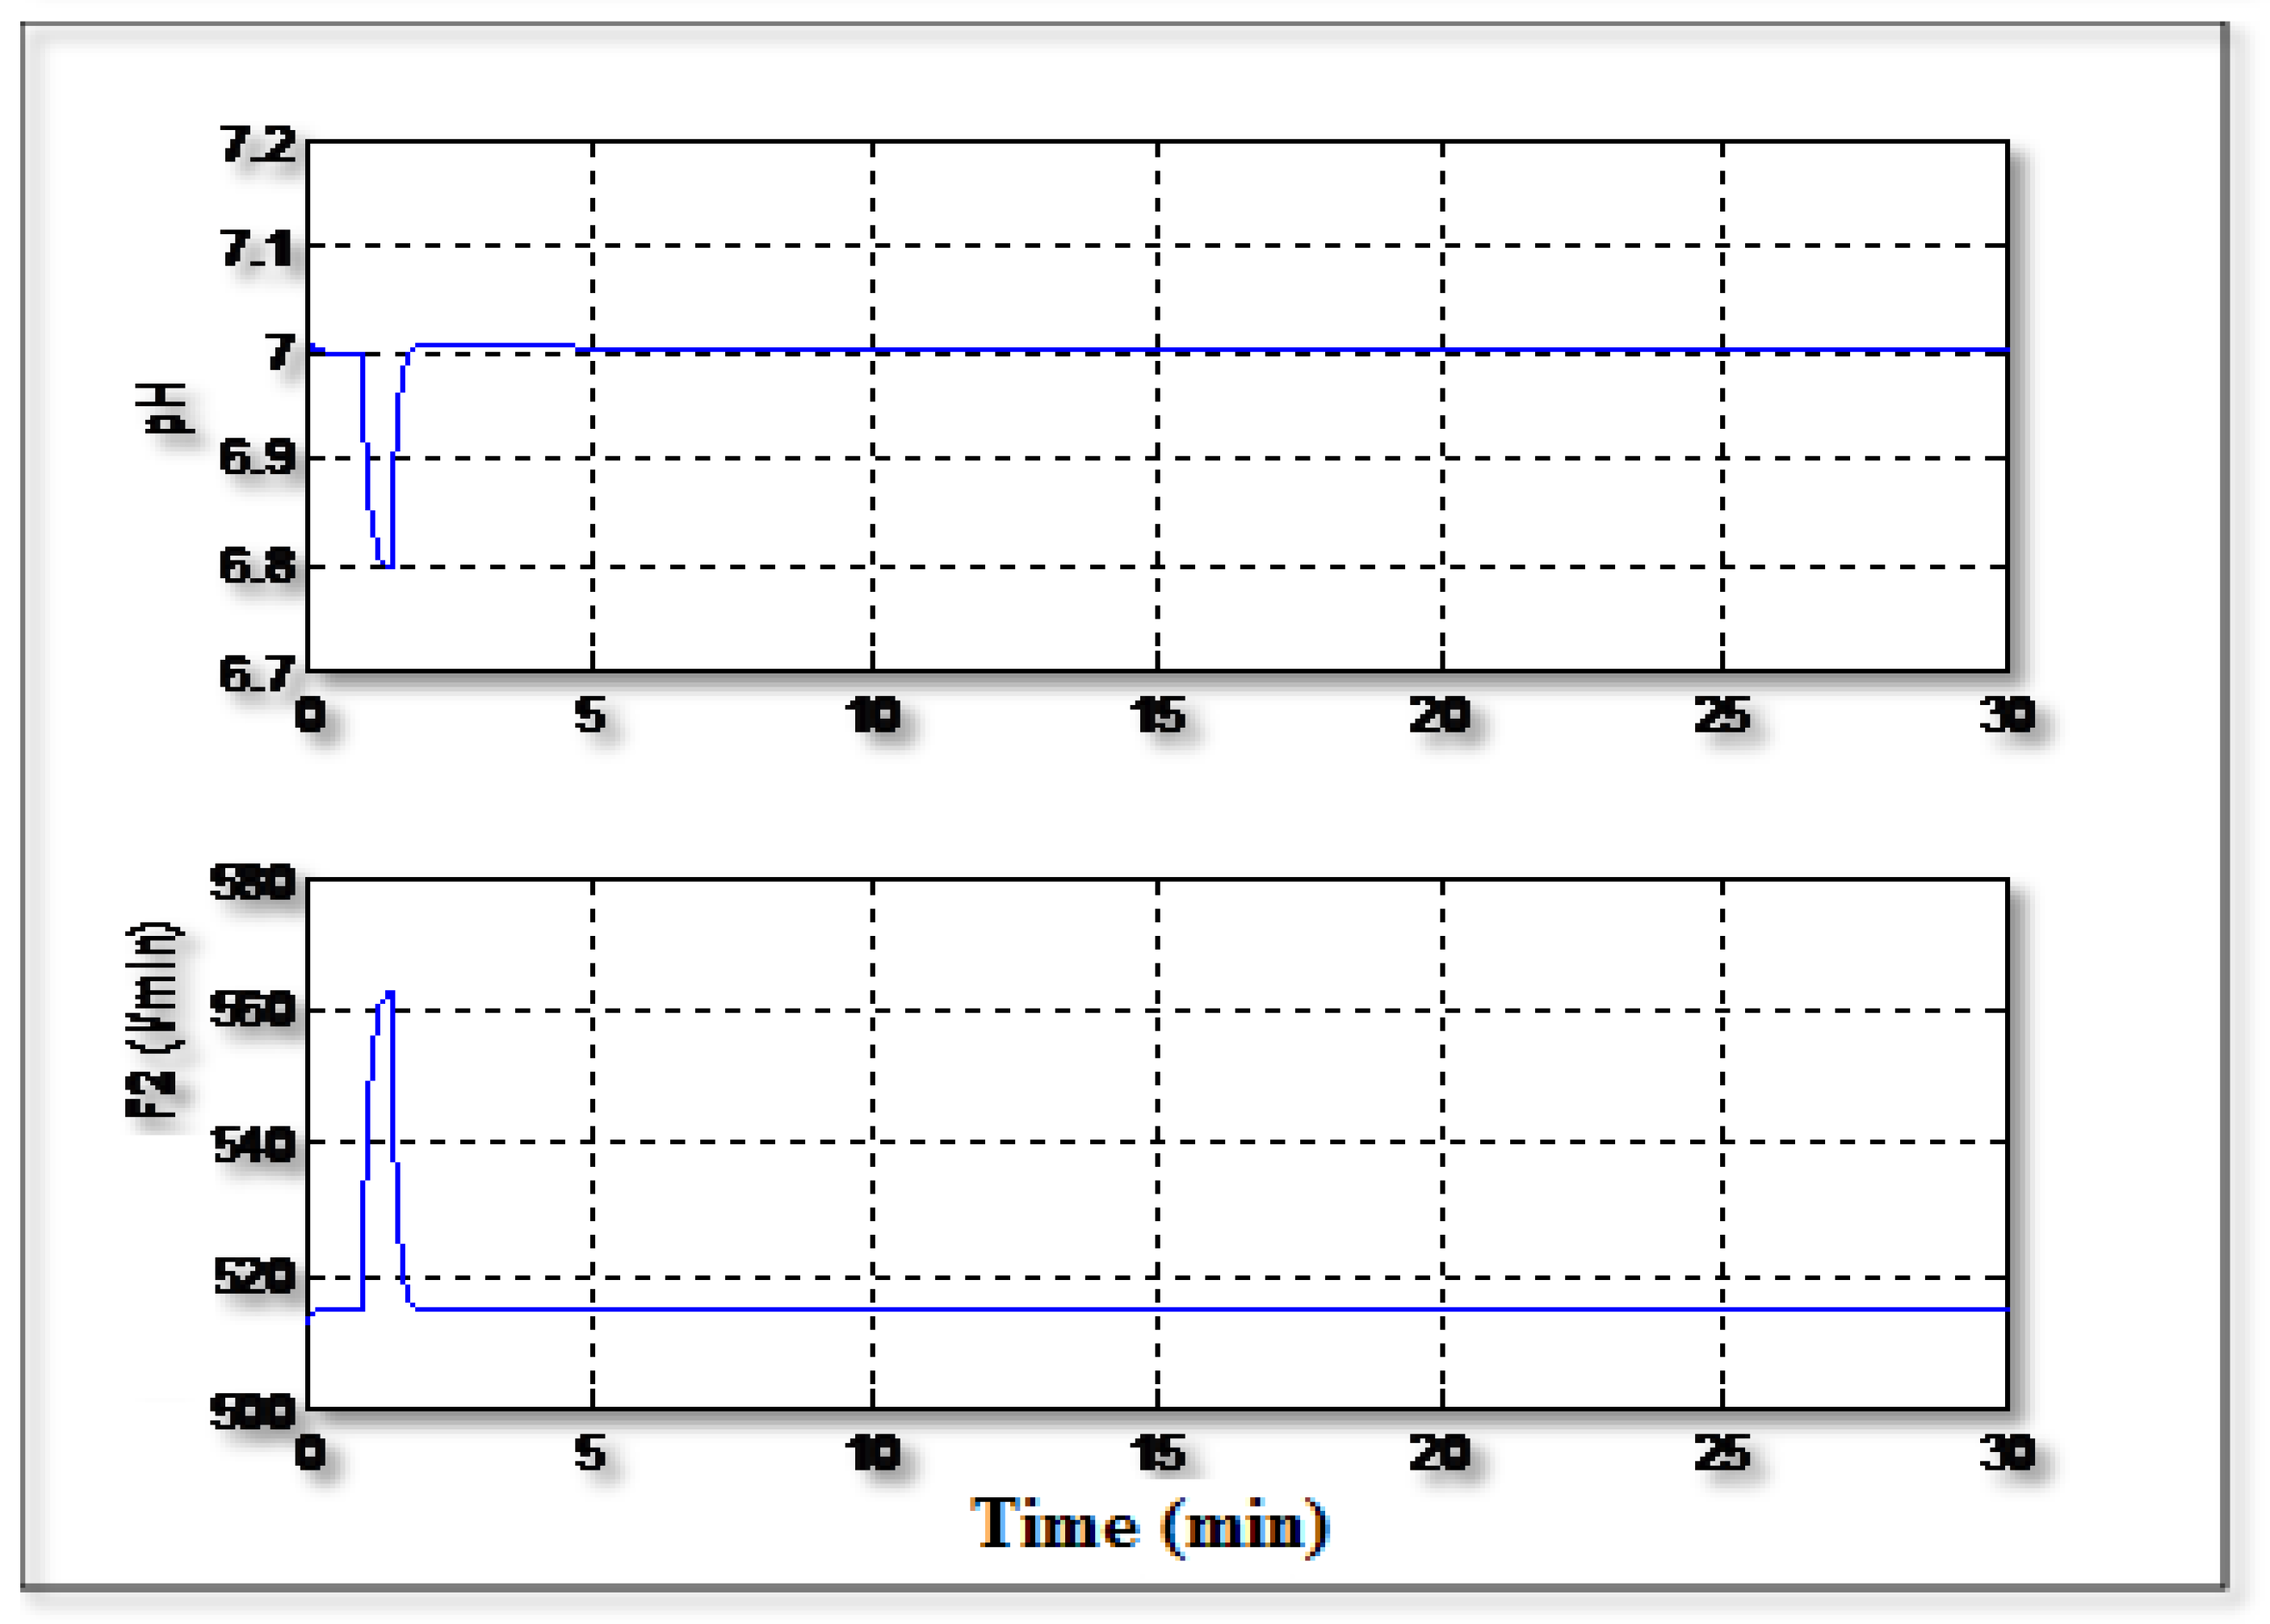
Figure 6 shows the regulation of the pH to the setpoint value (pH =7) with occurrence of a disturbance related to the concentration C
1. It can be seen that the controller can handle the disturbance and it can regulate the pH to its serpoint value and the signal control varies regularly without excessive activity.
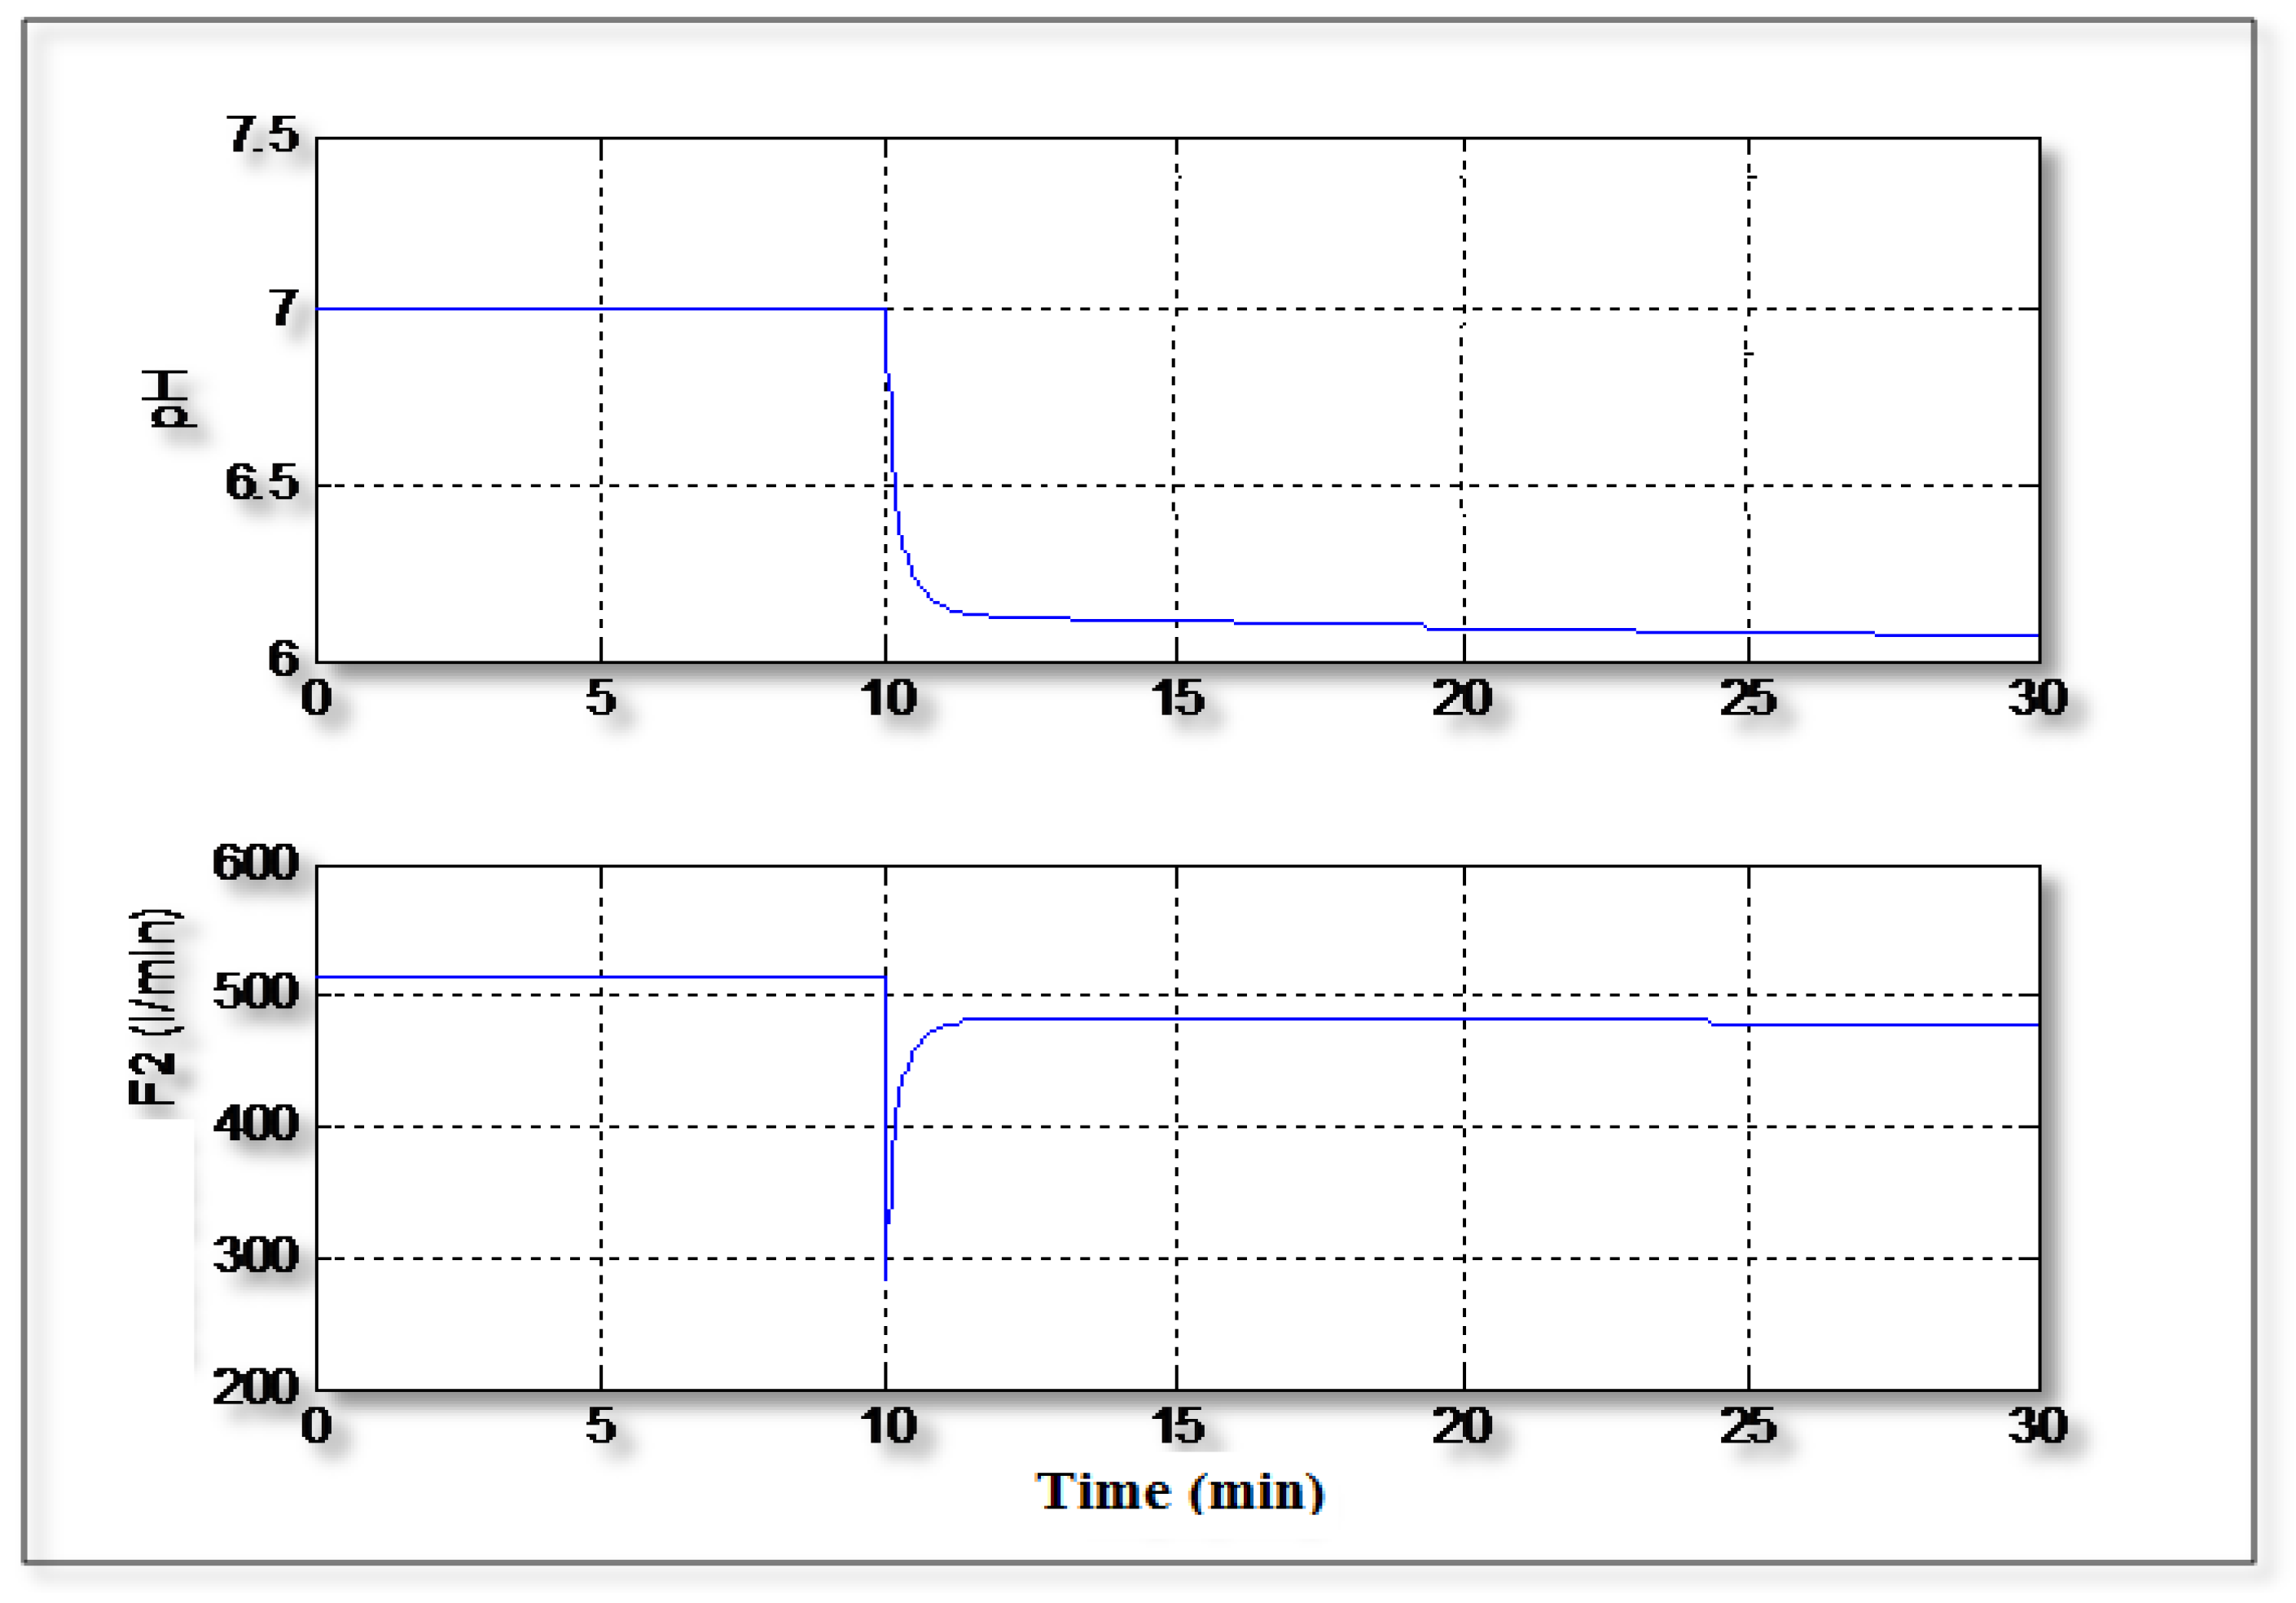
Figure 7 shows the control of the pH in tracking mode where the value of the setpoint changes from 7 to 6. It can be seen that the controller can handle easily the variation of the setpoint value and the signal control varies regularly without excessive variations.
6. Conclusions
This research studied the dynamic and the control of a non-linear pH-CSTR process. The obtained results showed that for the studied process is a first order kind without dead time. Furthermore, the studied process is naturally stable, i.e. it has a certain capacity to regulate itself. The controller can handle the disturbance and it can regulate the pH to its setpoint value and the signal control varies regularly without excessive activity. Furthermore, the controller can handle easily the variation of the setpoint value, in tracking mode, and the signal control varies regularly without excessive variations. This study highlighted the design of a PID controller who was able to regulate the pH despite the occurrence of a high disturbance and the controller was also able to operate in asservissement or tracking mode.
References
- Robert H.Perry , “Perry’s Chemical Engineering Handbook”, 1997.
- Ai-Poh Loh,, Dhruba Sankar De, and P. R. Krishnaswamy, “pH and Level Controller for a pH Neutralization Process”, Ind. Eng. Chem. Res., 2001, 40 (16), 3579–3584. [CrossRef]
- Teenu Jose, Rahul Antony, Samson Isaac, pH neutralization in cstr using modelreference neural network and fuzzy logic adaptive controlling schemes, Int J Adv Res Tech, 2(1),2013.
- Bendjaouahdou C (2024) Parametric study of a ternary batch distillation column, Research Square 1 (1), 14. [CrossRef]
- Bendjaouahdou C, Bendjaouahdou M H (2013) Control of the hot spot temperature in an industrial SO2 converter, Energy Procedia, 36, 428-443. [CrossRef]
|
Disclaimer/Publisher’s Note: The statements, opinions and data contained in all publications are solely those of the individual author(s) and contributor(s) and not of MDPI and/or the editor(s). MDPI and/or the editor(s) disclaim responsibility for any injury to people or property resulting from any ideas, methods, instructions or products referred to in the content. |
© 2025 by the author. Licensee MDPI, Basel, Switzerland. This article is an open access article distributed under the terms and conditions of the Creative Commons Attribution (CC BY) license (https://creativecommons.org/licenses/by/4.0/).