
Submitted:
18 February 2025
Posted:
18 February 2025
You are already at the latest version
Abstract
A static modulated Fourier transform spectrometer has advantages such as rapid evaluation and immunity to vibration over a dynamic modulated Fourier transform spectrometer. However, addressing the trade-off between spectral resolution and signal-to-noise ratio remains a challenge. In this paper, an approach to enhance both spectral resolution and signal-to-noise ratio is introduced, and its effectiveness is verified through the theoretical analysis. The spectrometer is comprised of a modified Sagnac interferometer with stepped mirrors. Enhancement is achieved by combining two different interferograms. Its detailed procedure, involving an application based on the spectral reconstruction, is outlined in this study. By combining interferograms acquired with mirror displacements of 1 mm and 5 mm, the spectral width is 128.3 cm^−1. It is 66% narrower than the spectral width at 1 mm mirror displacement and 0.3% broader than at 5mm mirror displacement. The standard deviation representing signal-to-noise ratio is 2034. It is 216% improvement compared to the 1 mm mirror displacement, and 485% improvement compared to the 5 mm mirror displacement. This approaching method also shows the potential of the static modulated Fourier transform spectrometer for applications in low signal-to-noise conditions such as Raman scattering detection and remote-sensing.
Keywords:
interferogram
; stepped mirrors
; static modulation
; reconstruction
; spectral resolution
; Fourier-transform
; signal-to-noise ratio
1. Introduction
Fourier-transform spectrometers are valuable tools in various applications including material science, chemistry, environmental surveillance, medical and food industries, and scientific research [1,2,3]. Their popularity is primarily due to their multiplexing and throughput advantages over other spectrometers, particularly based on diffractive optical elements. These spectrometers feature bulky and complex mechanical system, which leads to high maintenance costs and requiring skilled operators. Acquiring spectral information with these spectrometers requires scanning mechanisms, which are susceptible from distortion caused by vibrations. To mitigate this issue, they must be operated under strictly controlled conditions. Additionally, sample acquisition is necessary, and if the substances are toxic, it poses potential safety risks [4].
Spectrometers capable of remote sensing with a compact structure have been interested as a solution to overcome drawbacks of conventional spectrometers such as bulkiness, susceptibility to vibrations, and the need for strictly controlled conditions. To address these challenges, various studies have proposed innovative designs, including modified Sagnac interferometers [5,6], Wollaston prism-based interferometers [7,8], Savart plate-based interferometers [9,10], single mirror-based interferometer [11], orthogonally aligned stepped mirror array [12], and micro-electromechanical system (MEMS)-based interferometers [4,13,14], Fabry-Perot interferometers [15,16]. Additionally, they have demonstrated effectiveness in various application including biomedical detection [4,17], environmental detection [11], and material science [18].
These proposed structures are based on a spatial modulation of which do not involve any moving parts, leading to rapid measurements and compactness. However, their performance is severely limited by various parameters related to the spectroscopic system, such as the number of pixels, the size of optical elements, material characteristics regarding temperature dependence and refractive indices. The performance typically defined by a spectral resolution which is inversely proportional to a maximum optical path difference. In most interferometers [4,7,8,9,10,11,12,13,14], Performance optimization remains relatively complex, because the optical path difference is influenced on the material properties, including the temperature and wavelength. Although Fabry-Perot interferometers exhibit superior spectral resolution compared to other designs, their spectral range is severely limited due to higher orders. MEMS interferometers also have superior spectral resolution, but their operation requires strictly controlled conditions.
The performance limitation is overcome through either mechanical modifications or algorithmic approaches. Algorithmic techniques such as signal padding [19] and spectral reconstruction [20] are proposed to enhance performance without requiring structure modifications. However, these approaches often involve relatively complex optimization processes. On the other hand, as an approach to enhance performance by employing structural modifications, warping technique [9], retarder array [21], two birefringent prisms [22], stepped mirror array [23], and dispersive optical elements [24,25] are proposed. The structural modifications are implemented by incorporating additional optical elements into the system.
The modified Sagnac interferometer, one of the popular candidates for a static modulated Fourier-transform spectrometer, consists of a beamsplitter and two mirrors. Its performance relies on the optical path difference which is readily modulated by displacing one of the mirrors, allowing for relatively easy performance optimization. However, performance enhancement through structural modifications involving additional optical elements is complicated, since the sampling frequency varies along with the displacement.
In this paper, a new concept for a modified Sagnac interferometer is introduced. Unlike previous studies [19,20], the performance is enhanced through structural modification. Specifically, one of mirrors is replaced with stepped mirrors, enabling the simultaneous acquisition of multiple interferograms at different mirror displacements. The interferogram with a short mirror displacement exhibits a short maximum optical path difference, leading to poor spectral resolution but high signal-to-noise ratio (SNR). On the contrary, the interferogram with a long mirror displacement exhibits a long maximum optical path difference, leading to better spectral resolution but low SNR. By combining these two interferograms to leverage the advantages of each, a new interferogram is reconstructed with enhanced characteristics. However, the variation in sampling frequency with mirror displacement remains a problem.
To overcome this issue, the generation of interferogram is thoroughly investigated, and the variation of sampling frequency, along with its relationship to the maximum wavenumber of a possible measurement range is analyzed. Subsequently, the combination procedure is discussed in detail, allowing for the identification of optimal conditions that provide the best improvements in SNR and spectral resolution. The combination procedure of two interferograms that obtained by different optical path lengths enables the spectrometer to obtain spectral information with both a highest SNR and a narrow spectral width. As a result, the proposed approach not only effectively addresses the intrinsic trade-off between the spectral resolution and SNR but also serves as a promising solution for advanced performance of static modulated Fourier-transform spectrometers.
2. Methodology
The proposed performance enhancement requires the acquisition of multiple interferograms with difference optical path differences. Prior to discussing the proposed approach, optical layout and working principle of a modified Sagnac interferometer should be discussed. As shown in Figure 1, it consists of one beam splitter inclined at 45° to the optical axis and two mirrors inclined at 22.5° and 67.5° to the optical axis, respectively. The light emitted from the source is split into two beams at the beam splitter. The reflected beam at the beam splitter travels to mirror1 and then mirror2, and the transmitted beam goes to mirror 2 and then mirror 1. These two beams are subsequently recombined at the beam splitter. Associated with the condition two mirrors are placed at equidistance from the beam splitter, there is no optical path difference between these beams, and interferences do not occur. However, if one of two mirrors is displaced from its equidistance position as indicated in Figure 1, the centers of two beams are separated when they returns to the beam splitter. Since the measured spectral resolution depends on the mirror displacement, its expected performance to achieve the desired performance can be preoptimized. On the other hand, the optical path difference in other spectrometers relies on the characteristics of optical component, such as refractive indices. The modification of the material characteristics is challenging, making optimization less straightforward.
In the modified Sagnac interferometer, the visibility of an interferogram depends on the minimal spacing of the optical path difference. As the spacing increases, the visibility decreases, and vice versa. High visibility indicates low spectral resolution, leading to imprecise spectral information. Conversely, low visibility corresponds to better spectral resolution, providing more precise spectral information but decreased SNR, which can cause distortion. Nevertheless, a combination of two features enables the spectrometer to achieve enhanced spectral characteristics.
In this paper, a mirror2 is replaced with stepped mirrors consisting of the mirrors 2 and a submirror. The stepped mirrors are aligned along the y-axis and positioned perpendicular to the direction of generated interferogram. Thus, multiple interferograms with various optical path differences can be obtained simultaneously. The optical path difference modulated by the stepped mirrors is given by the following:
where represents an optical path difference, is an integer indicating a mirror position in the stepped mirrors, represents a pixel pitch in the horizontal direction, is an effective focal length, and is the distance between two beams separated at a beam splitter and is proportional to and a mirror displacement, , from a symmetrical position where the optical path difference between two beams become zero.
In the proposed design, the optical path difference varies along the direction, , perpendicular to the interferogram axis, . The interferogram changes with this direction and is expressed as follows:
where represents an interferogram, is an integer representing a pixel position in horizontal direction, is a pixel pitch in the vertical direction, is a wavenumber, and is spectral information.
In conventional spectrometers based on a Michelson interferometer, the signal is sampled at zero-crossing points of the reference source, which results in a constant sampling frequency. However, the sampling frequency of the spectrometer is inversely proportional to its minimum optical path difference. Associated with Nyquist sampling theorem, the sampling frequency should satisfy the following equation:
where represents a sampling frequency, is a maximum wavenumber of a possible measurement range, is a minimum optical path difference, is the length of the detector in horizontal pixel, which is given by multiplying the number of horizontal pixels to a pixel pitch, . In static modulated Fourier-transform spectrometers, the spectral resolution is inversely proportional to the minimum optical path difference. Achieving better spectral resolution requires a larger separation, which decreases the sampling frequency. The sampling frequency must be at least twice the maximum wavenumber , which limits the measurable spectral range.
Associated with Figure 1, the proposed design is capable of simultaneously producing interferograms with both small and larger separations. Combining the interferograms can result in better spectral characteristics. Since each interferogram has a different sampling frequency, compensating for this difference is crucial for effective integration.
Figure 2 shows the procedure for enhancing spectral characteristics. This procedure begins with the acquisition of interferograms. To achieve enhanced characteristics leading to accurate spectral information, the procedure consists of three distinct stages. The first stage, referred to as the conversion stage, compensates for the difference in sampling frequency which varies along the separation, prior to the combination of two interferograms. In this step, pixel numbers are converted into their corresponding optical path differences. Subsequently, in this paper, an approach to estimating an interferogram from spectral information is proposed to compensate the difference in the sampling frequency. The interferogram is a linear combination of the transfer function of the spectrometer and the spectral information, written as:
where represents an interferogram, is an integer representing a pixel position in the horizontal direction, is a pixel pitch in the vertical direction, is an integer indicating a mirror position in a stepped mirror array, represents a pixel pitch in the horizontal direction, is an effective focal length, and is the distance between two beams separated at a beam splitter, is spectral information in a discrete form, is a wavenumber, and is an integer representing spectral components. The spectral information is obtained by applying Fourier-transform to the acquired interferogram. The shape of the transfer function depends on structural parameters including the focal length of the lens, the mirror displacement, and the pixel pitch. The interferogram, even for a single pixel, results from the summation of all spectral components. In the transfer function, a pixel pitch can be adjusted to be smaller than the physical pixel pitch. Hence, using Eq. 4, the interference signal corresponding to a desired pixel position can be estimated. As a result, the interferogram is reconstructed with the desired sampling frequency. In the combination stage, characteristics such as maximum optical path difference and amplitude are investigated. Reconstructed interferograms are then combined to extend the maximum optical path difference while preserving signal-to-noise ratio. Performing Fourier-transform on the combined interferogram yields the spectral information with enhanced characteristics.
Figure 3 shows the simulated interferograms and their corresponding spectral information based on the proposed methodology. In the proposed design depicted in Figure 1, the stepped mirrors allow the spectrometer to produce multiple interferograms with different separations. The resultant interferograms are shown in Figure 3(a). The obtained interferogram corresponding to the small separation, denoted by , has characteristics of high visibility and poor spectral resolution. Conversely, the one corresponding to a larger separation, denoted by , has characteristics of low visibility and better spectral resolution. Although they are simultaneously acquired, the fringe periods appear different due to the variations in sampling frequency.
To compensate for this discrepancy, the interferogram must be reconstructed during the conversion stage. The first step involves converting pixel numbers into optical path differences. Subsequently, an equivalent period can be observed in both interferograms. However, the difference in sampling frequency still remains, and needs to be compensated. The sampling frequency is closely related to the interval of the optical path difference. Equation 4 is effectively used to adjust this interval and compensate for the sampling frequency. The spectral information and pixel pitch are required to obtain the desired sampling frequency. The spectral information can be derived by performing a Fourier-transform on the interferogram. The interferogram that requires compensation is selected based on the one corresponding to a low sampling frequency. Additionally, the pixel pitch is calculated by Eq. (3). As a result, the reconstructed interferogram is obtained, as shown in Figure 3(b). The effectiveness of this proposed approach is not only comparable to the interpolation but also results in significantly lower residual error.
In the combination stage, two interferograms are compared, as shown in Figure 3(c). The interferogram corresponding to the small separation, denoted as has a short maximum optical path difference but has a high SNR around the zero optical path difference. Conversely, the interferogram corresponding to the larger separation, denoted as has a long maximum optical path difference. This interferogram has a low SNR near the zero optical path difference but a high SNR farther from the zero optical path difference.
By combining the interferogram corresponding to in the range of higher optical path difference and the interferogram corresponding to in a range near zero optical path difference, the combined interferogram takes advantages of characteristics of both interferograms. Consequently, by performing Fourier-transformation, the spectrum with enhanced characteristics is obtained as indicated by Combination in Figure 3(d).
3. Results and Discussions
The proposed approach is investigated through theoretical analysis. The important parameters contributing to the generation of the interferogram include the characteristics of the detector, the focal length of the lens, and the mirror displacement. The detector has a pixel pitch of 7.4 × 10⁻⁴ cm, with 659 pixels in the horizontal direction and 494 pixels in the vertical direction. These specifications are based on the detector available in the laboratory. The source is assumed to be a laser diode with a spectral width of 10 nm at a center wavelength of 660 nm, obtained using a monochromator. The effective focal length of the lens is 160 mm. Additionally, the transmittance of the beam splitter is assumed to be 0.5.
The spectral characteristics and the interferograms of the spectrometer are investigated in relation to the mirror displacement, as depicted in Figure 4. Figure 4(a) shows the interferograms on the optical path difference scale, along with the mirror displacement. As the mirror displacement increases, the maximum optical path difference also increases. Notably, the interferogram obtained from the 5 mm mirror displacement appears slightly different compared to the other interferograms. This is expected as the systematic condition of the spectrometer is getting closer to the limit of Nyquist sampling criterion.
Figure 4(b) shows a variation in the spectral resolution with respect to the mirror displacement. The spectral resolution is 235.4 cm−1 at the mirror displacement of 1 mm. The spectral resolution improves as the mirror displacement increases. However, the mirror displacement is limited to 5 mm to prevent aliasing. Hence, the best achievable spectral resolution is 47.1 cm−1.
The spectral information with respect to the mirror displacement is shown in Figure 4(c) and (d). For reference, the spectral width and center wavenumber are 124.3 cm⁻1 and 15,151.5 cm⁻1, respectively, corresponding to a spectral width of 10 nm at a center wavelength of 660 nm. At the mirror displacement of 1 mm, the spectral width appears 290.9 cm−1, as shown in Figure 4(c). At the mirror displacement of 5 mm, the spectral width appears 127.9 cm⁻1, as shown in Figure 4(d). As the spectral resolution is enhanced, the spectral width decreases.
The interferogram corresponding to the short mirror displacement has characteristics of high visibility and poor spectral resolution. Conversely, the interferogram corresponding to a long mirror displacement has characteristics of low visibility and better spectral resolution. As mentioned earlier, enhanced spectral characteristics would be achieved by combining these two interferograms. To verify the effectiveness of this approach, two cases are considered: the combination of interferograms obtained at 1 mm and 3 mm, and at 1 mm and 5 mm.
The sampling frequency varies along with the mirror displacement, as defined by Eq. (3). The reconstruction is applied to the interferograms obtained at mirror displacements of 3 mm and 5 mm, respectively, to match the sampling frequency of the interferogram obtained at a mirror displacement of 1 mm. Figure 5 shows analysis of characteristics of interferograms and spectra in relation to the reconstruction. The sampling frequency is related to the interval of the optical path difference. At a mirror displacement of 1 mm, the interval is 6.4 × 10⁻⁶ cm. When the mirror displacement is 3 mm, the interval becomes 1.9 × 10⁻⁶ cm.
To compensate for this difference, the reconstruction approach is applied using Eq. (4). The spectrum is obtained by performing a Fourier-transform on the interferogram. The focal length of the lens and the mirror displacement remain constant. The pixel pitch of the detector needs to be calculated to achieve the desired interval. Using Eq. (3), the result is determined to be 2.5 × 10⁻⁴ cm. Figure 5(a) shows the original interferogram depicted as a black solid line and reconstruction interferogram depicted as a grey solid line. The number of sampling points for the original interferogram is 659. After applying the reconstruction, the number of sampling points is 1974.
Figure 5(b) shows the spectra corresponding to Figure 5(a). A black rectangle represents the spectrum corresponding to the original interferogram. A hollow circle represents the spectrum corresponding to the reconstructed interferogram. The spectral resolution is 78.5 cm−1 under both conditions. The difference in a spectral shape arises from the pixel pitch. The same approach applied to the interferogram obtained at a mirror displacement of 5 mm. The interval appears 3.2 × 10⁻⁶ cm. The pixel pitch for obtaining the desired interval is calculated to be 1.5 × 10⁻⁴ cm.
Figure 5(c) shows the interferograms. The number of sampling points of the reconstructed interferogram is 3290. The original interferogram depicted as a black solid line appears as if two light sources interfere with each other. This is expected, because the folded spectral line becomes closer to the other. However, this issue is removed by employing the reconstruction algorithm. Figure 5(d) shows the spectra corresponding to Figure 5(c). The spectral resolution is 47.1 cm−1. The spectral shape corresponding to the reconstructed interferogram is slightly different from that of the original interferogram. As previously mentioned, this difference arises from the variation in the pixel pitch. In other words, it can be regarded as if the reconstructed interferogram is obtained from the detector with a smaller pixel pitch. Additionally, in the spectrum corresponding to the original interferogram, the two spectral lines appear closer together. However, in the case of the reconstructed interferogram, a single spectral line is visible within the given spectral range. This phenomenon can be interpreted as an extension of the spectral range.
To obtain spectral information with enhanced characteristics, two combined interferograms are obtained. Figure 6 shows analysis of the combined interferograms and corresponding spectra. The first combined interferogram is obtained from interferograms acquired at mirror displacement of 1 mm and 3 mm, as shown in Figure 6(a).
The range of the maximum optical path difference for the interferogram obtained at 1 mm is from –2.1 × 10⁻³ cm to 2.1 × 10⁻³ cm. The range of the maximum optical path difference corresponding to the combined interferogram is from –6.4 × 10⁻³ cm to 6.3 × 10⁻³ cm, which coincides with that corresponding to a mirror displacement of 3 mm. Within the range from –2.1 × 10⁻³ cm to 2.1 × 10⁻³ cm, the combined interferogram incorporates the interferogram obtained at a mirror displacement of 1 mm. Outside this range, the combined interferogram incorporates the interferogram obtained at a mirror displacement of 3 mm.
The spectrum corresponding to the combined interferogram is shown in Figure 6(b). The spectral resolution corresponding to the combined case is 78.6 cm−1, representing a 66% improvement compared to the case with a mirror displacement of 1 mm. The spectral width appears 130.4 cm−1, which is 66% narrower than that at a mirror displacement of 1 mm and 28% narrower than that a mirror displacement of 3 mm.
The second combined interferogram, obtained from interferograms obtained at mirror displacement of 1 mm and 5 mm, is shown in Figure 6(c). Within the range from –2.1 × 10⁻³ cm to 2.1 × 10⁻³ cm, the combined interferogram incorporates the interferogram obtained at a mirror displacement of 1 mm. Outside this range, the combined interferogram incorporates the interferogram obtained at a mirror displacement of 5 mm. The range of the maximum optical path difference for the combined interferogram is from –10.6 × 10⁻³ cm to 10.6 × 10⁻³ cm, which coincides with that corresponding to a mirror displacement of 5 mm.
The spectrum corresponding to the combined interferogram as depicted in Figure 6(c) is shown in Figure 6(d). The spectral resolution corresponding to the combined case is 47.2 cm−1, representing an 80% improvement compared to the case with a mirror displacement of 1 mm. The spectral width appears 128.3 cm−1, which is 66% narrower than that at a mirror displacement of 1 mm and 0.3% broader than that a mirror displacement of 5 mm.
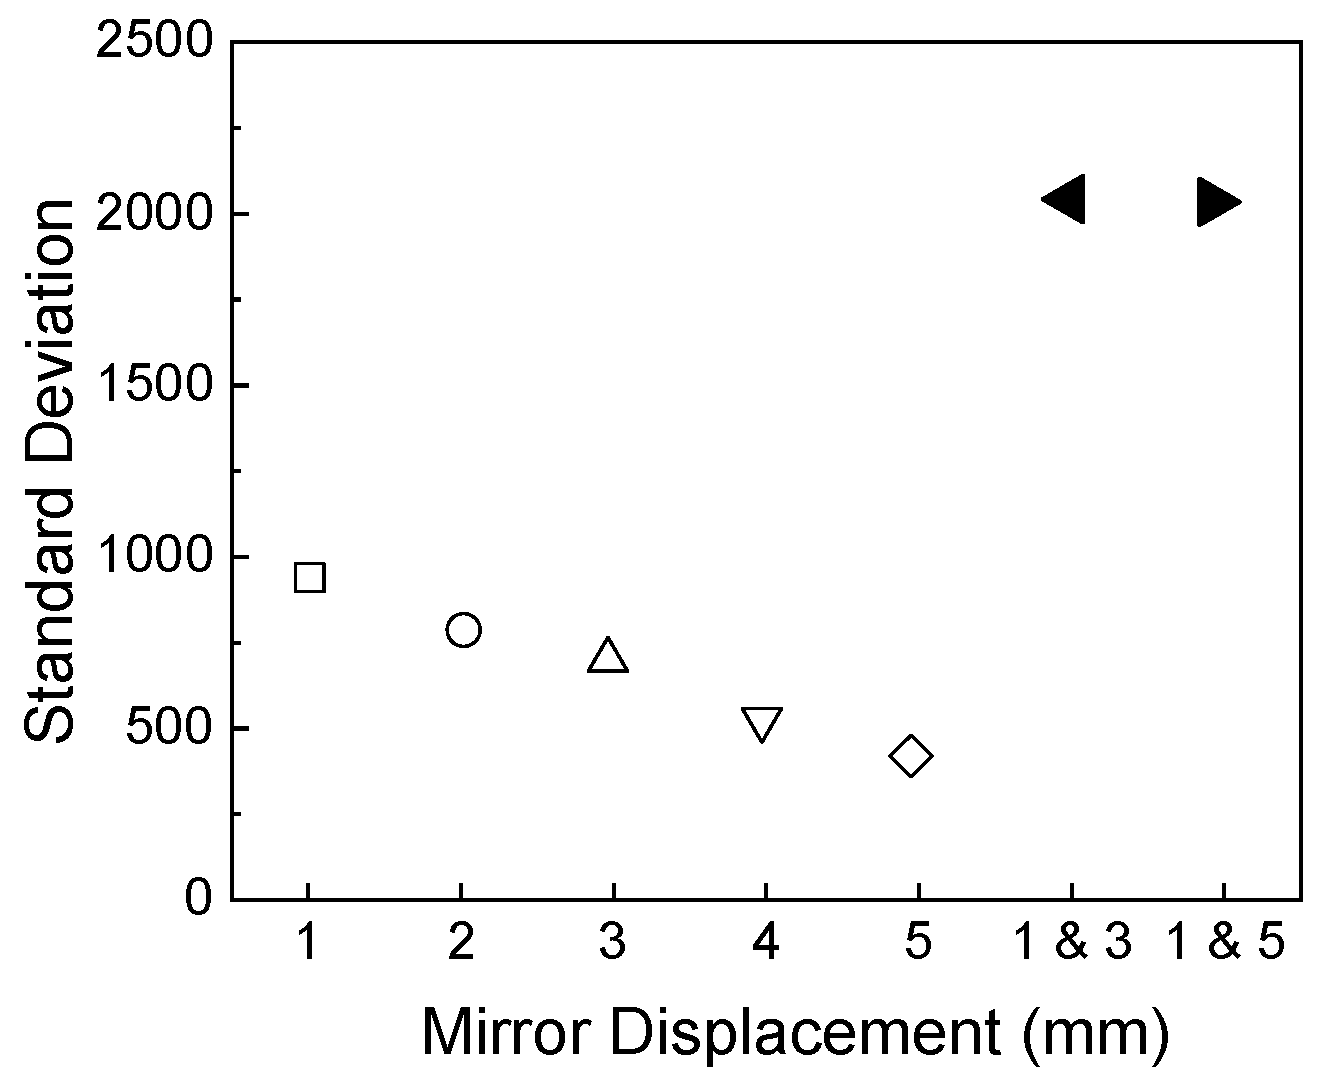
In order to evaluate the variation of SNR, the standard deviation of spectral line is investigated as shown in Figure 7. As mirror displacement increases, the standard deviation decreases. Specifically, the standard deviation varies from 939 to 419 when mirror displacement is changed from 1 mm to 5 mm.
When interferograms obtained at mirror displacements of 1 and 3 mm are combined, the standard deviation becomes 2042, which is 217% improvement compared to that at 1 mm mirror displacement, and 487% improvement compared to that at 5 mm mirror displacement. Similarly, when interferograms obtained at mirror displacements of 1 mm and 5 mm, the standard deviation is 2034, which is 216% improvement compared to that at 1 mm mirror displacement, and 485% improvement compared to that at 5 mm mirror displacement.
5. Conclusions
A modified Sagnac interferometer with stepped mirrors is proposed for a static modulated Fourier-transform spectrometer. This concept is based on two-dimensional spatial modulation. Through this approach, a static modulated Fourier-transform spectrometer can simultaneously acquire multiple interferograms with different mirror displacements. The working principle, including optical path difference, sampling frequency, and generation of interferograms are thoroughly investigated. As an application, an approach to improving spectral characteristics is proposed. This improvement is achieved by combining two interferograms obtained from different mirror displacements. The detailed procedure is also discussed. One of the key techniques, reconstruction of the interferogram, enables obtaining a constant sampling frequency across all obtainable interferograms.
The methodology is verified through theoretical analysis. When the combination is performed using interferograms obtained at mirror displacements of 1 mm and 3 mm, the highest standard deviation for the spectral line and the narrowest spectral width are achieved. The second combined interferogram, obtained from interferograms obtained at mirror displacement of 1 mm and 5 mm, provides the highest standard deviation and the narrower spectral width compared to that at a mirror displacement of 1 mm, and a spectral width similar to that at a mirror displacement of 5 mm.
The combination procedure enables the spectrometer to achieve the highest standard deviation and a narrow spectral width. In other words, although a static modulated Fourier-transform spectrometer has trade-off between a spectral resolution and SNR, this limitation can be overcome through the combination procedure, which leverages characteristics of two interferograms. Additionally, this technique would be useful for analyzing gas samples that require superior resolution to detect narrow spectral features as well as for detecting Raman signals that have low throughput and are highly susceptible to noise.
Author Contributions
“Conceptualization, J.Y.C. and W.K.J.; methodology, J.Y.C., S.L., and W.K.J.; software, J.Y.C. and W.K.J.; validation, J.Y.C., S.L. and W.K.J.; formal analysis, J.Y.C. and W.K.J.; investigation, J.Y.C. and W.K.J.; resources, W.K.J.; data curation, J.Y.C.; writing—original draft preparation, J.Y.C. and W.K.J.; writing—review and editing, J.Y.C., S.L. and W.K.J.; visualization, J.Y.C. and W.K.J.; supervision, S.L. and W.K.J.; project administration, J.Y.C. and W.K.J.; funding acquisition, J.Y.C. and W.K.J. All authors have read and agreed to the published version of the manuscript.
Funding
This research was supported by Basic Science Research Program through the National Research Foundation of Korea(NRF) funded by the Ministry of Education(NRF-2021R1I1A3052065; RS-2023-00248760)
Institutional Review Board Statement
Not applicable.
Informed Consent Statement
Not applicable.
Data Availability Statement
The data presented in this study are available by the corresponding author on request.
Acknowledgments
We thank the anonymous referees for their useful suggestion.
Conflicts of Interest
The authors declare no conflicts of interest.
References
- Jacquemart, D.; Borkov, Yu.G.; Lyulin, O.M.; Tashkun, S.A.; Perevalov, V.I. Fourier transform spectroscopy of CO2 isotopologues at 1.6 mm: Line positions and intensities. Spectrosc. Radiat. Transf. 2015, 160, 1–9. [Google Scholar] [CrossRef]
- Abbas, M.A.; Jahromi, K.E.; Nematollahi, M.; Krebbers, R.; Liu, N.; Woyessa, G.; Bang, O.; Huot, L.; Harren, F.J.M.; Khodabakhsh, A. Fourier transform spectrometer based on high-repetition-rate mid-infrared supercontinuum sources for trace gas detection Opt. Express 2021, 29, 22315–22330. [Google Scholar] [CrossRef] [PubMed]
- Baker, M.; Trevisan, J.; Bassan, P.; Bhargava, R.; Butler, H.J.; Dorling, K.M.; Fielden, P.R.; Fogarty, S.W.; Fullwood, N.J.; Heys, K.A.; Hughes, C.; Lasch, P.; Martin-Hirsch, P.L.; Obinaju, B.; Sockalingum, G.D.; Sulé-Suso, J.; Strong, R.J.; Walsh, M.J.; Wood, B.R.; Gardner, P.; Martin, F.L. Using Fourier transform IR spectroscopy to analyze biological materials. Nat. Protoc. 2014, 9, 1771–1791. [Google Scholar] [CrossRef] [PubMed]
- Fadlelmoula, A.; Pinho, D.; Carvalho, V.H.; Catarino, S.O.; Minas, G. Fourier Transform Infrared (FTIR) Spectroscopy to Analyse Human Blood over the Last 20 Years: A Review towards Lab-on-a-Chip Devices. Micromachines 2022, 13, 187. [Google Scholar] [CrossRef]
- Zhao, J.; McCreery, R.L. Multichannel FT-Raman Spectroscopy: Noise Analysis and Performance Assessment. Appl. Spectrosc. 1997, 51, 1687–1697. [Google Scholar] [CrossRef]
- Tang, Y.; Qin, L.; Gao, H.; Zhu, C.; Wang, D. Instrument forward model of the modified Sagnac interferometer for atmospheric wind measurement. Opt. Commun. 2011, 284, 2672–2677. [Google Scholar] [CrossRef]
- Okamoto, T.; Kawata, S.; Minami, S. A Photodiode Array Fourier Transform Spectrometer Based on a Birefringent Interferometer. Appl. Spectrosc. 1986, 40, 691–695. [Google Scholar] [CrossRef]
- Lin, X.; Zhou, F.; Li, H.; Zhao, H. Static Fourier-transform spectrometer based on Wollaston prism. Optik 2014, 125, 3482–3484. [Google Scholar] [CrossRef]
- Watanabe, A.; Furukawa, H. High-resolution and high-throughput multichannel Fourier transform spectrometer with two-dimensional interferogram warping compensation. Opt. Commun. 2018, 413, 8–13. [Google Scholar] [CrossRef]
- Hashimoto, M.; Kawata, S. Multichannel Fourier-transform infrared spectrometer. Appl. Opt. 1992, 31, 6096–6101. [Google Scholar] [CrossRef]
- Köhler, M.H.; Schardt, M.; Rauscher, M.S.; Koch, A.W. Gas Measurement Using Static Fourier Transform Infrared Spectrometers. Sensors 2017, 17, 2612. [Google Scholar] [CrossRef] [PubMed]
- Gao, J.; Liang, Z.; Liang, J.; Wang, W.; Lü, J.; Qin, Y. Spectrum Reconstruction of a Spatially Modulated Fourier Transform Spectrometer Based on Stepped Mirrors. Appl. Spectrosc. 2017, 71, 1348–1356. [Google Scholar] [CrossRef]
- Li, J.; Lu, D.-F.; Qi, Z.-M. A Prototype Stationary Fourier Transform Spectrometer for Near-Infrared Absorption Spectroscopy. Appl. Spectrosc. 2015, 69, 1112–1117. [Google Scholar] [CrossRef]
- Fathy, A.; Sabry, Y.M.; Nazeer, S.; Bourouina, T.; Khalil, D.A. On-chip parallel Fourier transform spectrometer for broadband selective infrared spectral sensing. Microsyst Nanoeng 2020, 6, 10. [Google Scholar] [CrossRef]
- Pisani, M.; Zucco, M. Compact imaging spectrometer combining Fourier transform spectroscopy with a Fabry-Perot interferometer. Opt. Express 2009, 17, 8319–8331. [Google Scholar] [CrossRef]
- Al-Saeed, T.A.; Khalil, D.A. Fourier transform spectrometer based on Fabry–Perot interferometer. Appl. Opt. 2016, 55, 5322–5331. [Google Scholar] [CrossRef] [PubMed]
- Furukawa, H. Real-time multi-channel Fourier transform spectroscopy and its application to non-invasive blood fat measurement. Sens. Bio-Sens. Res. 2016, 8, 55–58. [Google Scholar] [CrossRef]
- Chatterijee, S.; Kumar, Y.P. White light differential interference contrast microscope with a Sagnac interferometer. Appl. Opt. 2014, 53, 296–300. [Google Scholar] [CrossRef]
- Cho, J.Y.; Lee, S.H.; Jang, W.K. Improvement of spectral resolution by signal padding method in the spatially modulated Fourier transform spectrometer based on a Sagnac interferometer. Appl. Opt. 2019, 58, 6755–6761. [Google Scholar] [CrossRef]
- Cho, J.Y.; Lee, S.; Jang, W.K. Performance-Enhanced Static Modulated Fourier Transform Spectrometer with a Spectral Reconstruction. Sensors 2023, 23, 2603. [Google Scholar] [CrossRef]
- Li, J.; Qu, C.; Wu, H.; Qi, C. Spectral resolution enhanced static Fourier transform spectrometer based on a birefringent retarder array. Opt. Express 2019, 27, 15505–15517. [Google Scholar] [CrossRef] [PubMed]
- Bai, C.; Li, J.; Xu, Y.; Yuan, H.; Liu, J. Compact birefringent interferometer for Fourier transform hyperspectral imaging. Opt. Express 2018, 26, 1703–1725. [Google Scholar] [CrossRef] [PubMed]
- Köhler, M.H.; Schardt, M.; Müller, M.; Kienle, P.; Wang, K.; Dong, X.; Giebeler, C.; Wiesent, B.R.; Jakobi, M.; Koch, A.W. Static Fourier transform mid-infrared spectrometer with increased spectral resolution using a stepped mirror. OSA Contin. 2020, 3, 2134–2142. [Google Scholar] [CrossRef]
- Yang, Q. First order design of compact, broadband, high spectral resolution ultraviolet-visible imaging spectrometer. Opt. Express 2020, 28, 5587–5601. [Google Scholar] [CrossRef]
- Kudenov, M.W.; Jungwirth, M.E.L.; Dereniak, E.L.; Gerhart, G.R. White-light Sagnac interferometer for snapshot multispectral imaging. Appl. Opt. 2010, 49, 4067–4076. [Google Scholar] [CrossRef]
Figure 1.
Optical layout of a modified Sagnac interferometer with stepped mirrors.
Figure 2.
Overview of the approach to enhance spectral characteristics through the combination of two interferograms with different characteristics.
Figure 2.
Overview of the approach to enhance spectral characteristics through the combination of two interferograms with different characteristics.
Figure 3.
Example of the approach to enhance spectral characteristics through the combination of two interferograms with different characteristics: (a) obtained interferograms, (b) same interferograms with the optical path difference scale, (c) a resultant interferogram after the combination, and (d) a comparison of spectra.
Figure 4.
Analysis of spectral characteristics: (a) Interferograms along with variety of the mirror displacement, (b) variation of spectral resolution along the mirror displacement, and spectral information for (c) a 1 mm mirror displacement and (d) a 5 mm mirror displacement, respectively.
Figure 4.
Analysis of spectral characteristics: (a) Interferograms along with variety of the mirror displacement, (b) variation of spectral resolution along the mirror displacement, and spectral information for (c) a 1 mm mirror displacement and (d) a 5 mm mirror displacement, respectively.
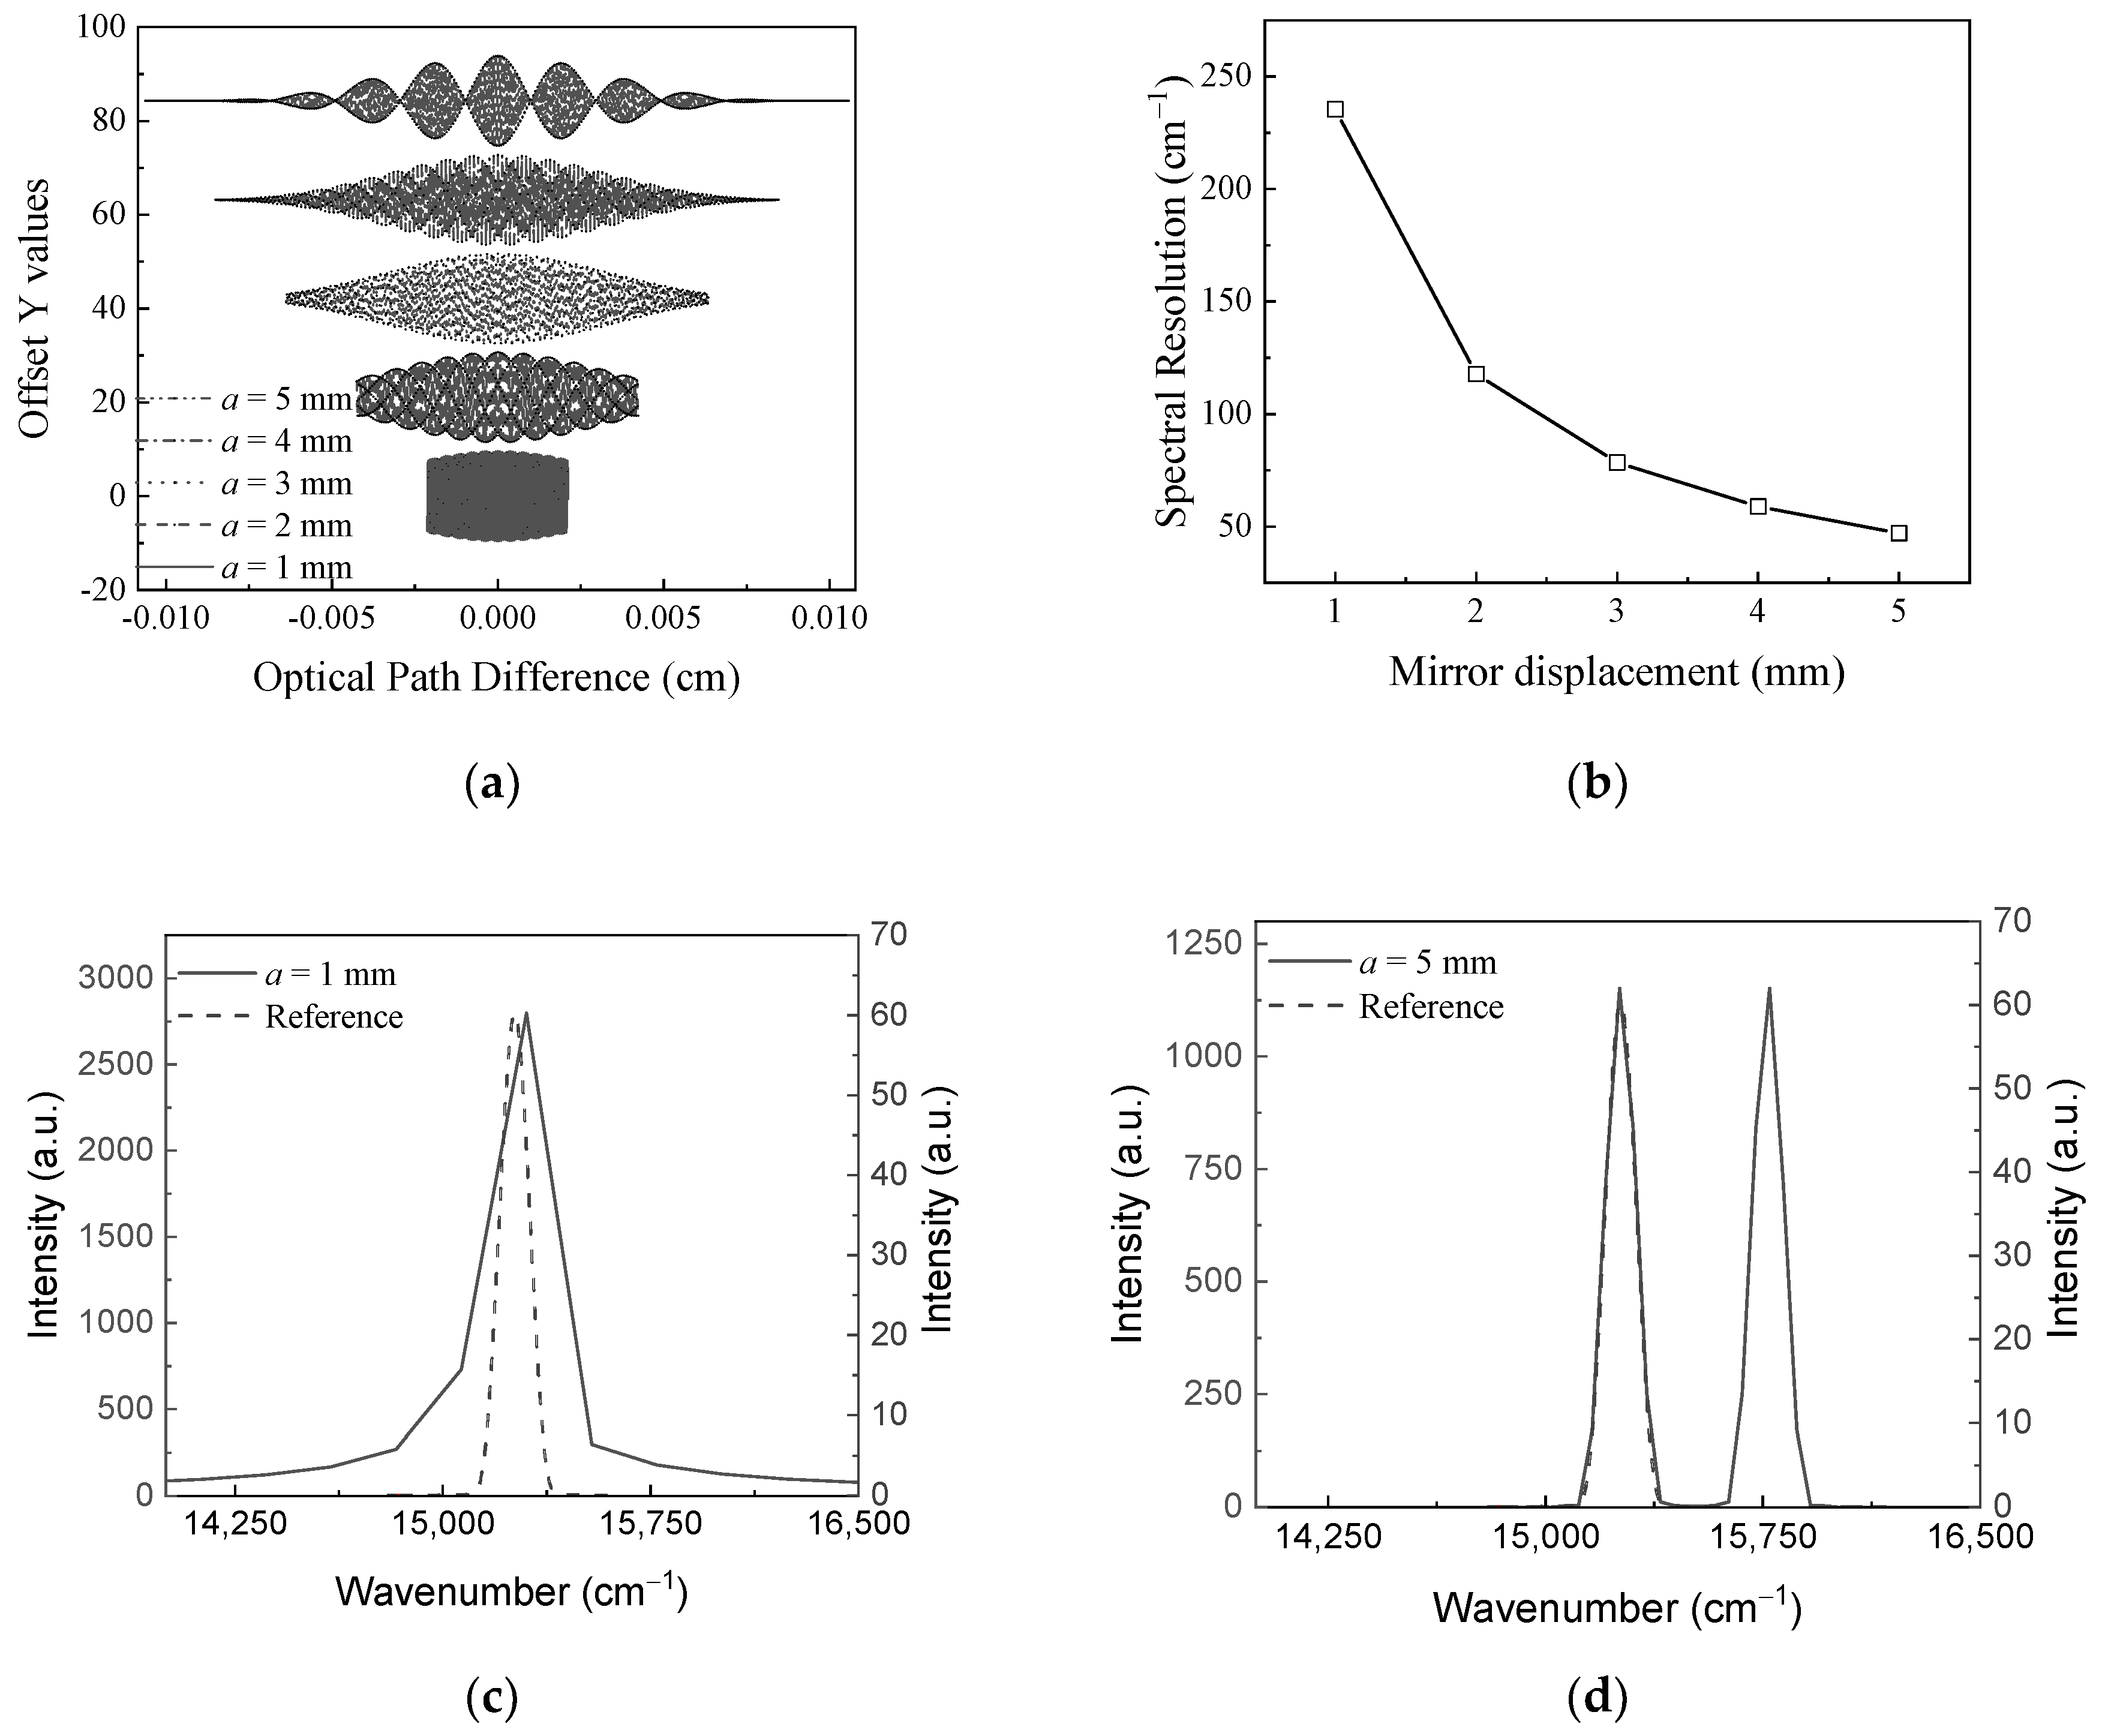
Figure 5.
Analysis of characteristics of the interferograms and spectra with regard to the reconstruction: (a) the original interferogram and the reconstruction interferogram, for a mirror displacement of 3 mm, (b) spectra corresponding to (a), (c) the original interferogram and the reconstructed interferogram, for a mirror displacement of 5 mm, (d) corresponding to (c).
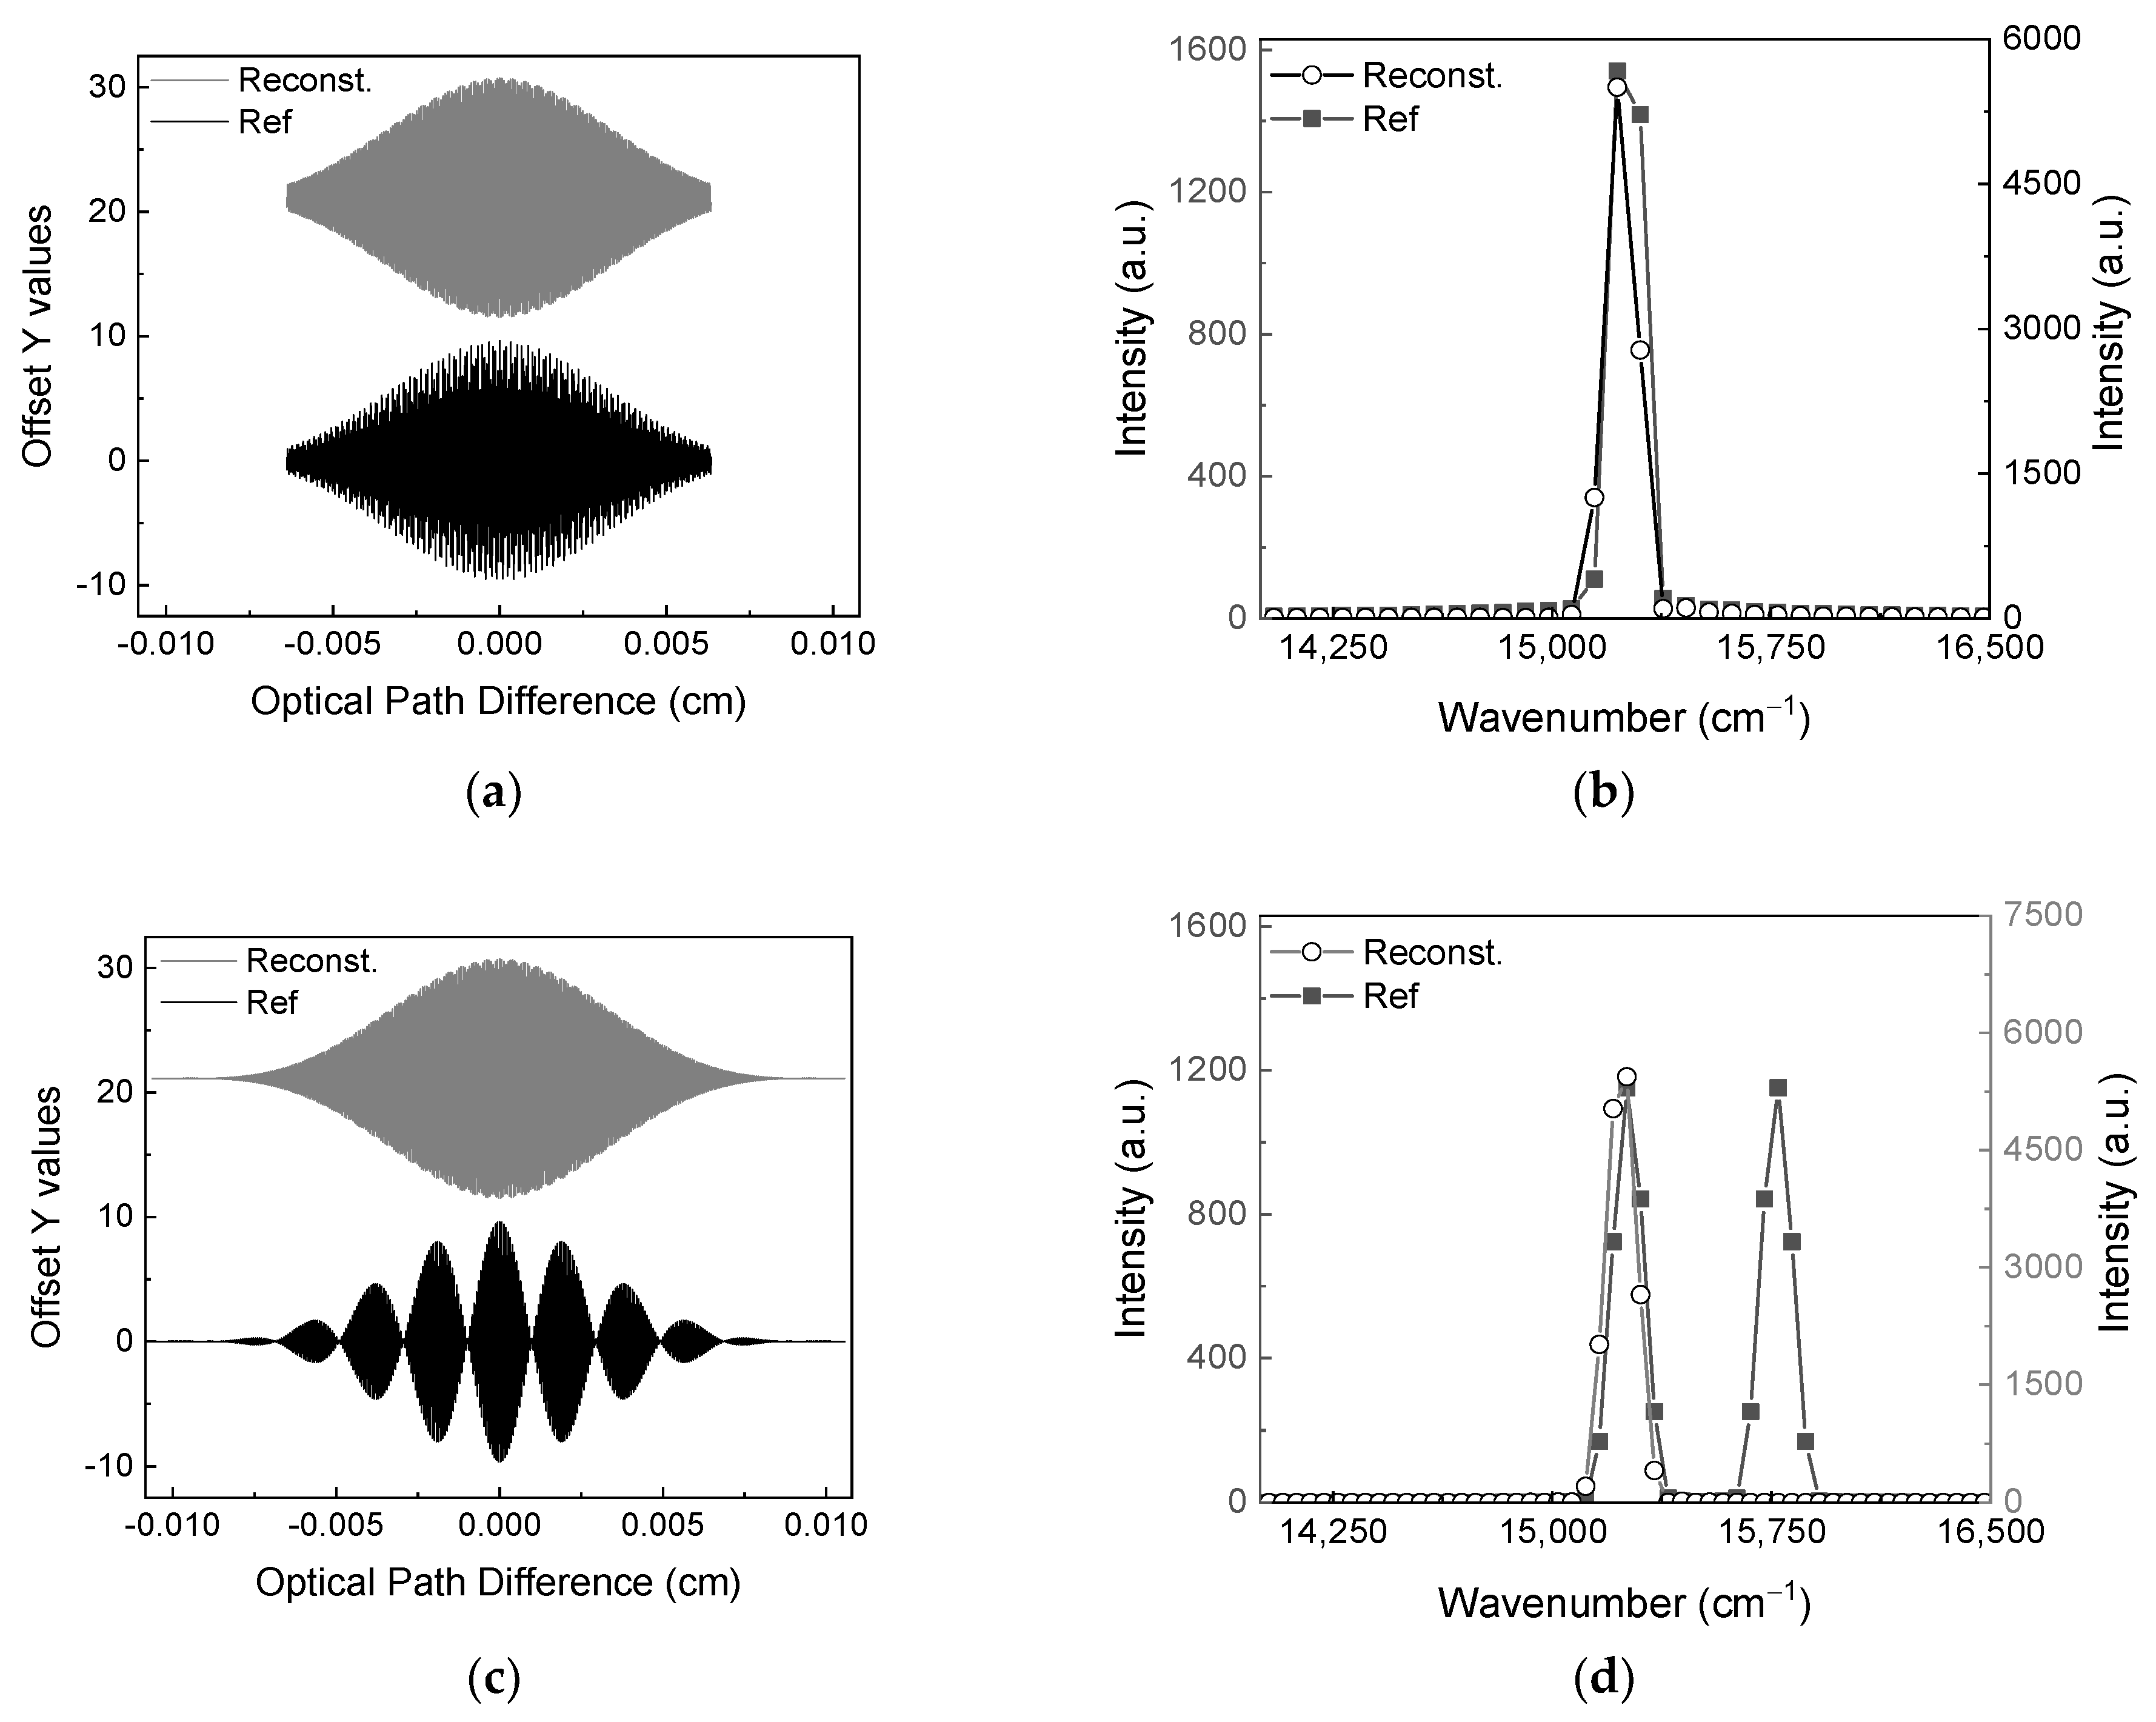
Figure 6.
Analysis of characteristics of the interferograms and spectra with regard to the combination: (a) the combined interferogram from interferograms obtained at mirror displacements of 1 mm and 3 mm, (b) spectra corresponding to (a), (c) the combined interferogram from interferograms obtained at mirror displacements of 1 mm and 5 mm, (d) corresponding to (c).
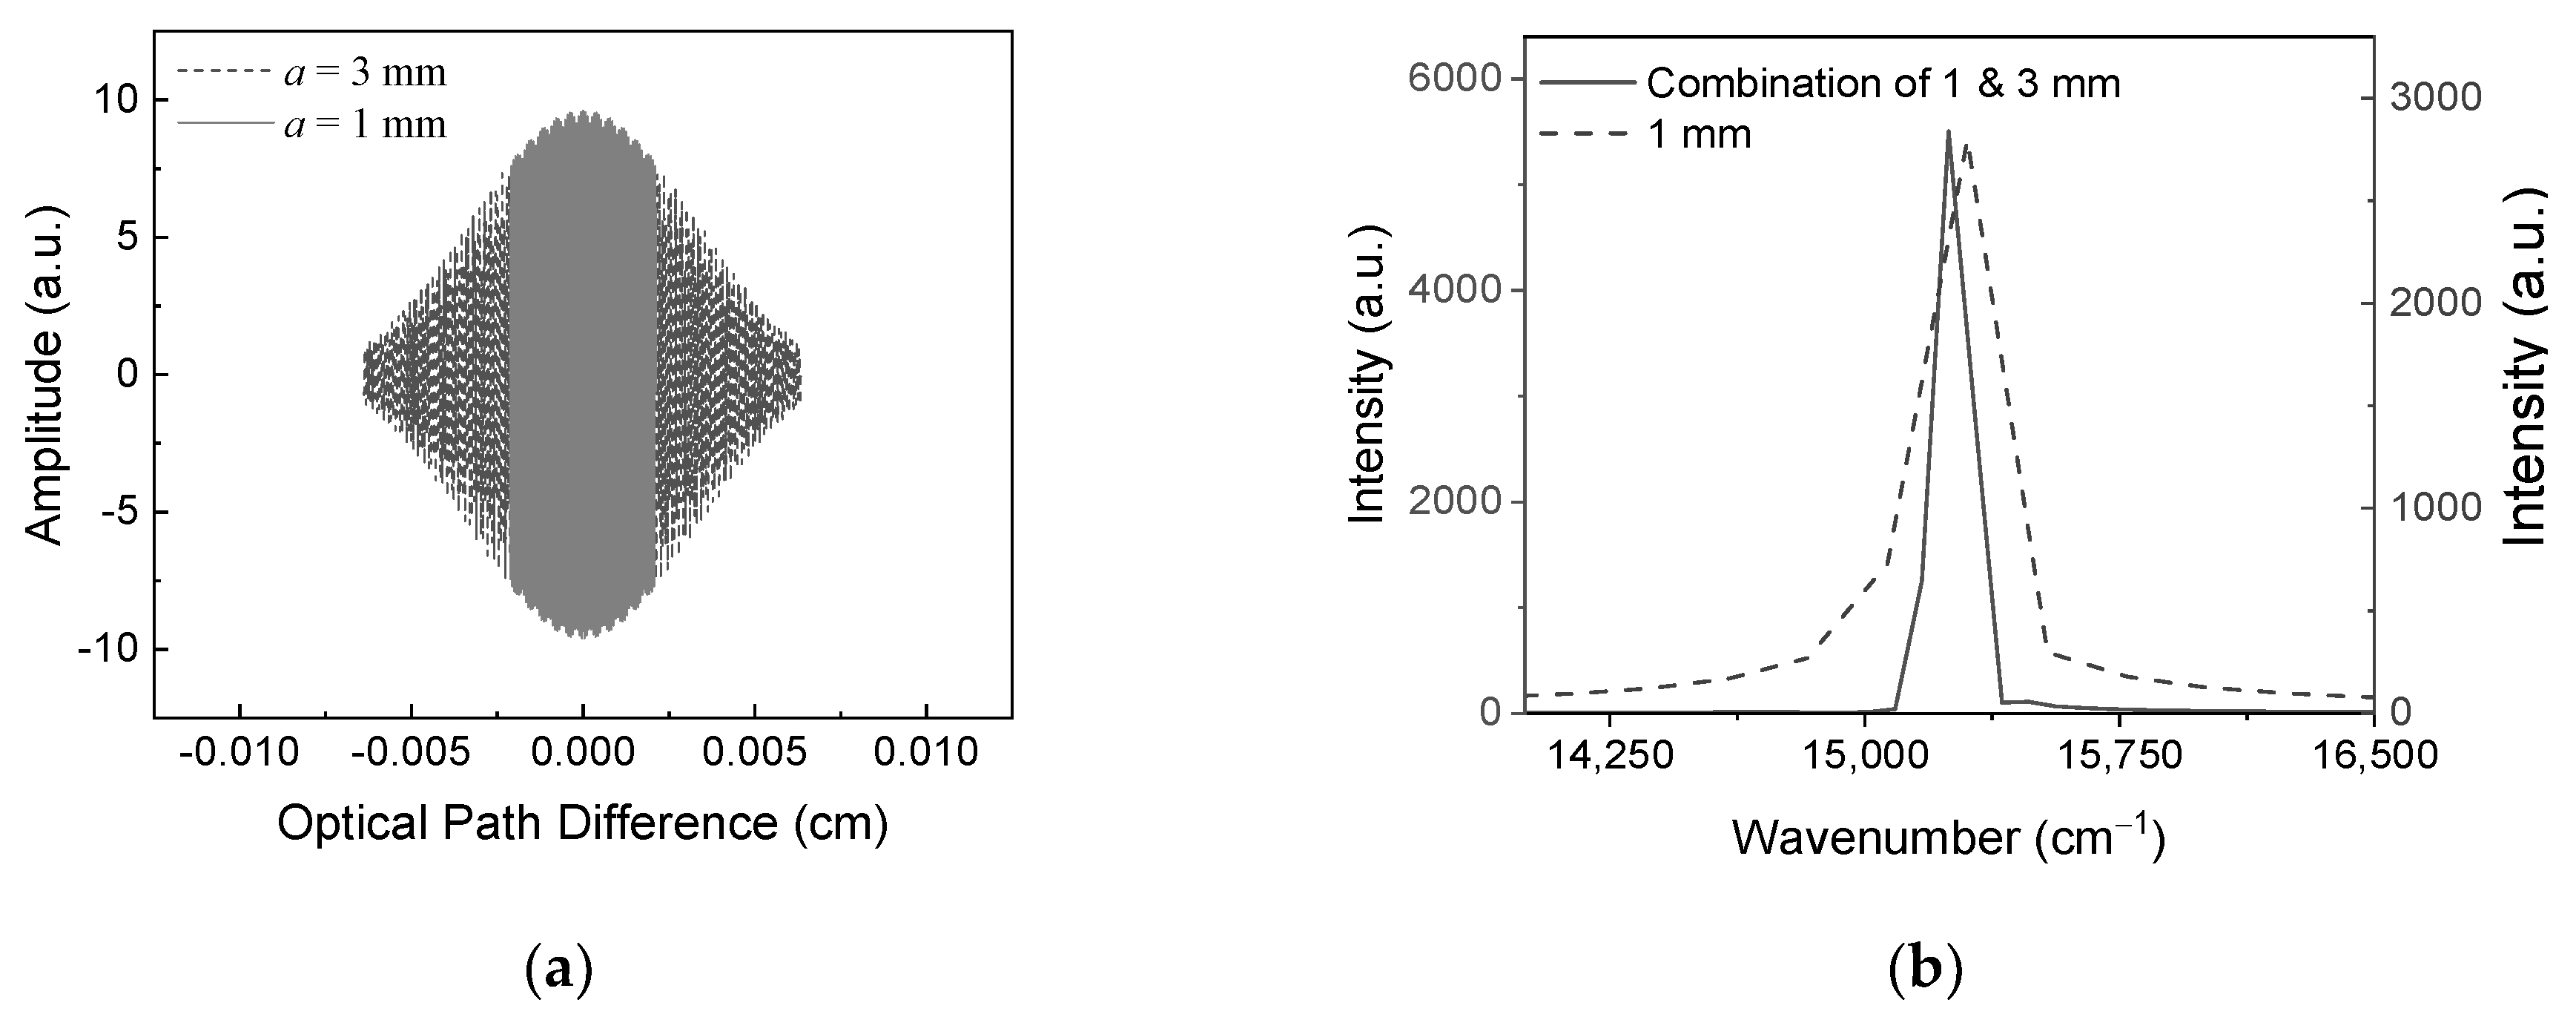
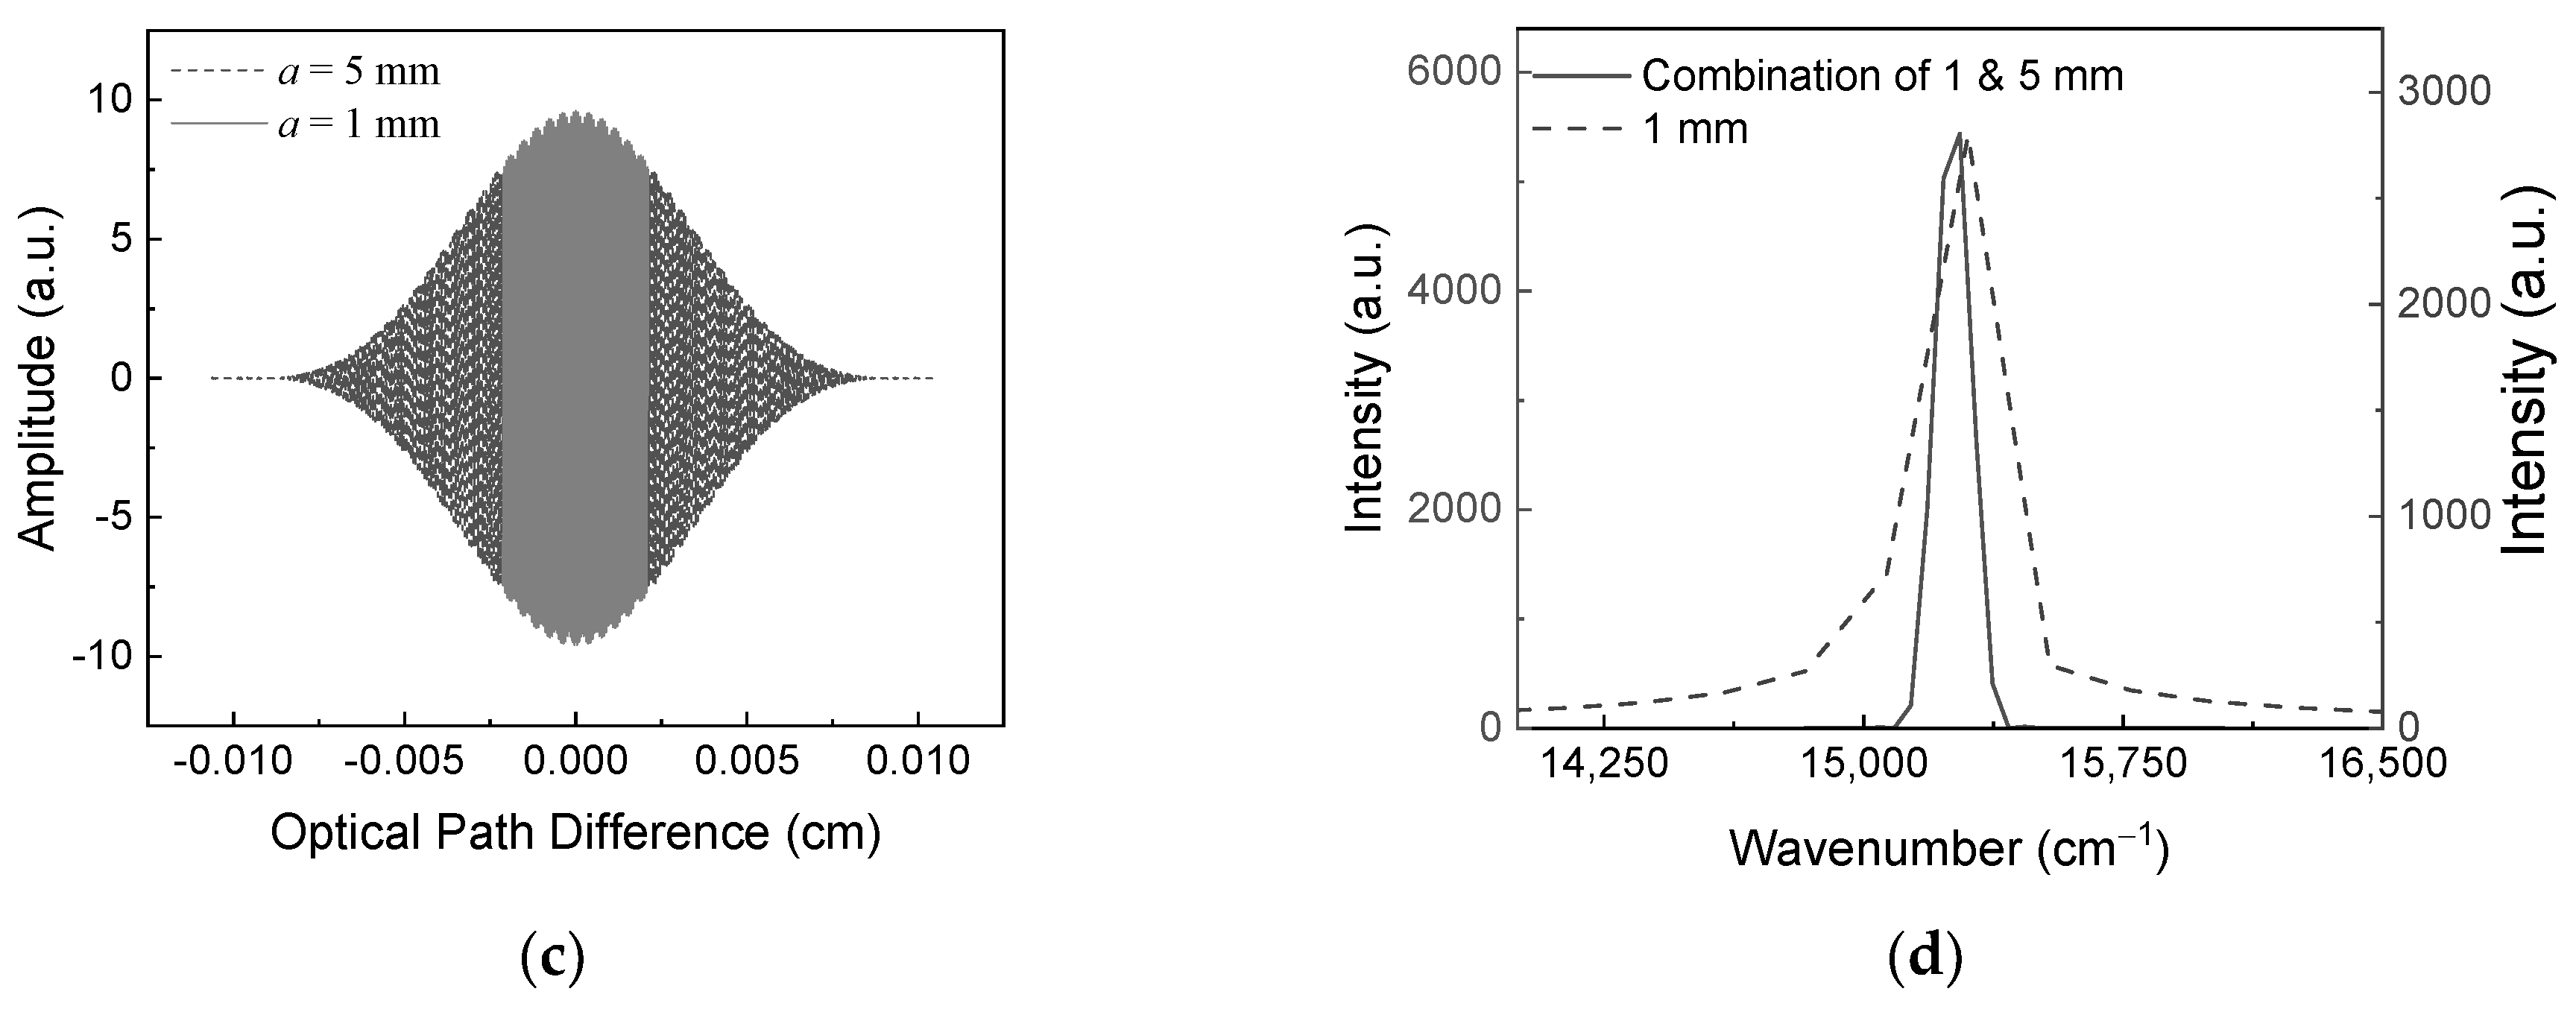
Figure 7.
The variation of standard deviation of spectral line, representing SNR, along mirror displacements.
Figure 7.
The variation of standard deviation of spectral line, representing SNR, along mirror displacements.
Disclaimer/Publisher’s Note: The statements, opinions and data contained in all publications are solely those of the individual author(s) and contributor(s) and not of MDPI and/or the editor(s). MDPI and/or the editor(s) disclaim responsibility for any injury to people or property resulting from any ideas, methods, instructions or products referred to in the content. |
© 2025 by the authors. Licensee MDPI, Basel, Switzerland. This article is an open access article distributed under the terms and conditions of the Creative Commons Attribution (CC BY) license (http://creativecommons.org/licenses/by/4.0/).
Copyright: This open access article is published under a Creative Commons CC BY 4.0 license, which permit the free download, distribution, and reuse, provided that the author and preprint are cited in any reuse.


