
Submitted:
17 February 2025
Posted:
18 February 2025
You are already at the latest version
Abstract
This paper investigates the seismic performance of Reduced Web Section (RWS) connections in steel moment frames. To be able to evaluate the performance of RWS, a well-established concept involving strategic weakening of beam sections. This paper employs advanced machine learning and deep learning techniques to predict the Ibarra-Medina-Krawinkler (IMK) Bilin parameters for RWS connections across various configurations. A database of 154 specimens from experimental and finite element studies was analysed, focusing on non-composite RWS connections. The study develops and compares multiple predictive models, including Random Forest, Neural Networks, Support Vector Regression, Gradient Boosting, XGBoost, and Deep Learning, to predict IMK Bilin parameters with high accuracy. XGBoost consistently demonstrated superior performance across various metrics. Feature importance analysis revealed complex interactions between geometric properties and connection behaviour, with web slenderness and span-to-depth ratio playing critical roles. Moreover, pushover analyses were conducted on 2-, 4-, 8-, 12-, and 20-story benchmark frames to associate the global seismic behaviour of frames with RWS and RBS connections. Results indicate that RWS connections often provide higher strength and comparable or superior ductility to RBS connections, especially in low to mid-rise structures. All RWS configurations achieved interstory drifts exceeding 4%, meeting ANSI/AISC and EC8 performance targets. This research further contributes to the adoption of RWS connections for retrofitting purposes and provides a robust tool for structural engineers to incorporate these connections into performance-based seismic design.
Keywords:
Reduced Web Section
; Steel Moment Frames
; Seismic Performance
; Machine Learning
; Ibarra-Medina-Krawinkler Model
1. Introduction
Reduced Web Section (RWS) connections are characterised by non-standard opening shapes within the web of steel beams and have shown promising structural behaviour under seismic loads. This paper aims to develop an accurate and efficient methodology for predicting the Ibarra-Medina-Krawinkler (IMK) Bilin parameters for RWS connections using advanced machine learning and deep learning techniques. By enhancing the understanding of RWS connection behaviour under seismic loading, this research provides structural engineers with a robust tool for incorporating these connections into performance-based seismic design.
The research encompasses a comprehensive analysis of all publicly available experimental and finite element studies of RWS connections, followed by the calibration of IMK Bilin model parameters using OpenSees software. Building on this foundation, the study employs various machine learning and deep learning algorithms to predict IMK Bilin parameters, with a focus on identifying the most effective predictive models for each parameter. The study further seeks to validate these developed models against existing data, ensuring their reliability and applicability. Ultimately, this work intends to bridge the gap between current knowledge and practical application by providing evidence-based recommendations for incorporating RWS connections into seismic design codes. By doing so, the study contributes to the ongoing efforts to enhance the seismic resilience of steel structures, addressing a crucial need in the field of structural engineering.
2. Moment Frames and Connections
2.1. Evolution of Steel Moment Frame Design
The evolution of steel moment frame design has been significantly influenced by major seismic events, particularly the 1994 Northridge earthquake. This event exposed critical vulnerabilities in beam-to-column connections of steel moment-resisting frames (MRFs), leading to the development of performance-based design methodologies [1,2,3]. Northridge and Kobe earthquakes revealed unexpected brittle failures in steel moment connections, particularly in the welded flange-bolted web detail. These failures were characterised by rapid crack propagation, primarily in the beam tension flange fusion zone of the weld root, extending into the column flange [1,2,3]. These observations have led to significant changes in design approaches, emphasising the need for improved ductility, energy dissipation, and overall seismic performance in steel MRFs.
In the aftermath of the Kobe and Northridge earthquakes, engineers and researchers recognized the need for more robust steel moment connections. This led to the development of Reduced Beam Section (RBS) connections, which were designed to control the location of plastic hinging and improve the overall seismic performance of steel structures [4,5]. As research progressed, new variations such as Reduced Web Section (RWS) connections emerged, offering additional benefits in terms of steel usage optimization and utility integration [6,7].
2.2. Advancements in Modelling Techniques
The Ibarra-Krawinkler (IMK) model has become a cornerstone in the finite element modelling of steel moment connections. This model, initially developed for various structural components, was later modified to address the specific needs of steel beams with RBS [8]. The modified IMK model incorporates multiple modes of deterioration, including strength, post-capping strength, unloading stiffness, and accelerated reloading stiffness deterioration [8,9]. This advancement has allowed for more accurate simulations of the complex hysteretic behaviour observed in steel moment connections under cyclic loading [8].
2.3. Integration of Machine Learning
A notable development in recent years has been the application of deep learning neural networks to generate modified-Ibarra-Krawinkler (mIK) model parameters for various RBS geometries. This approach addresses the limitations of traditional mathematical equations and offers a more efficient and accurate method for predicting the non-linear cyclic response of RBS connections [5]. The Deep Learning (DL) models have achieved high accuracy levels, reaching up to 98% in some cases, which represents a significant improvement over previous methods [5].
2.4. Experimental Investigations and Numerical Modelling
Researchers have conducted extensive experimental and numerical studies on both RBS and RWS connections. These investigations have provided valuable insights into the behaviour of these connections under various loading conditions, particularly in seismic scenarios. Studies on demountable steel-concrete composite RWS connections have demonstrated their ability to achieve interstory drifts larger than 4%, meeting performance targets set by ANSI/AISC and EC8 standards [10,11,12].
2.5. Future Directions
The field is now moving towards more comprehensive modelling approaches that can capture the full range of behaviours exhibited by steel moment connections. There is a growing emphasis on developing practical tools that can predict IMK parameters and global seismic behaviour for connections with arbitrary geometries. This trend is likely to involve extensive parametric studies and the further integration of Machine Learning (ML) techniques. However, gaps in knowledge still exist, particularly in the comprehensive modelling of RWS connections using IMK model parameters for various geometries.
3. Methodology
3.1. Data Collection and Preprocessing
Building on the RWS database provided by Almutairi [13], this paper applies machine learning and deep learning approaches to estimate the Ibarra-Medina-Krawinkler (IMK) Bilin parameters for various RWS connection configurations. The RWS database [13] encompasses data from 14 experimental and finite element (FE) studies, including:
- 251 specimens and 247 FE models of RWS connections
- 14 solid webbed-beam connections as benchmarks
- Both bare steel and composite RWS connections
- Various connection types (welded and bolted extended end-plate)
- Different test setups (cantilever, cruciform, and frame arrangements)
The study primarily analyses 154 specimens utilising cantilever test setups of non-composite RWS connections. This focus was chosen due to several advantages:
- Isolation of connection behaviour
- Clear insights into local effects of web openings
- Simplified data interpretation
Integrated Methodology
Cantilever setups are valuable for studying RWS connections due to their ability to isolate connection behaviour, focusing on a single beam-to-column connection and minimizing external influences. These setups offer clear insights into stress distributions, deformation patterns, and failure modes specifically associated with web openings. The reduced complexity of cantilever arrangements facilitates more straightforward analysis and interpretation of results, particularly regarding moment-rotation relationships and energy dissipation capabilities. By providing a controlled environment for examining RWS connections, cantilever setups enable researchers to gain precise and detailed understanding of their performance and characteristics. The Cantilever setup has limitations in representing full structural frame behaviour. To address this, the study recommends incorporating the Gupta and Krawinkler approach for panel zone representation in full-frame modelling scenarios [14,15].
The study combines:
- Detailed local behaviour data from cantilever tests
- Broader frame behaviour modelled through the Gupta and Krawinkler approach
This integrated methodology aims to provide a comprehensive understanding of RWS connection performance in real-world applications, considering both localised effects of web openings and broader structural implications within complete frame systems.

Table 1.
Non-composite RWS Database.
| Reference | Study | Connection | Number of Sections | Total Number of Considered Tests |
|---|---|---|---|---|
| Tsavdaridis et al. [16] | FE | Welded | 1 | 3 |
| Tsavdaridis and Papadopoulos | FE | BEEP-3-R | 1 | 1 |
| Zhang et al. [17] | Experiment | Welded | 1 | 1 |
| Boushehri et al. [18] | FE | Welded | 4 | 48 |
| Nazaralizadeh et al. [19] | FE | BEEP-4-R | 1 | 1 |
| Xu et al. [20] | Experiment | Welded | 1 | 5 |
| Almutairi and Tsavdaridis [13] | FE | BEEP-4-R | 1 | 95 |
| Total Number of FE/Experimental tests | 154 | |||
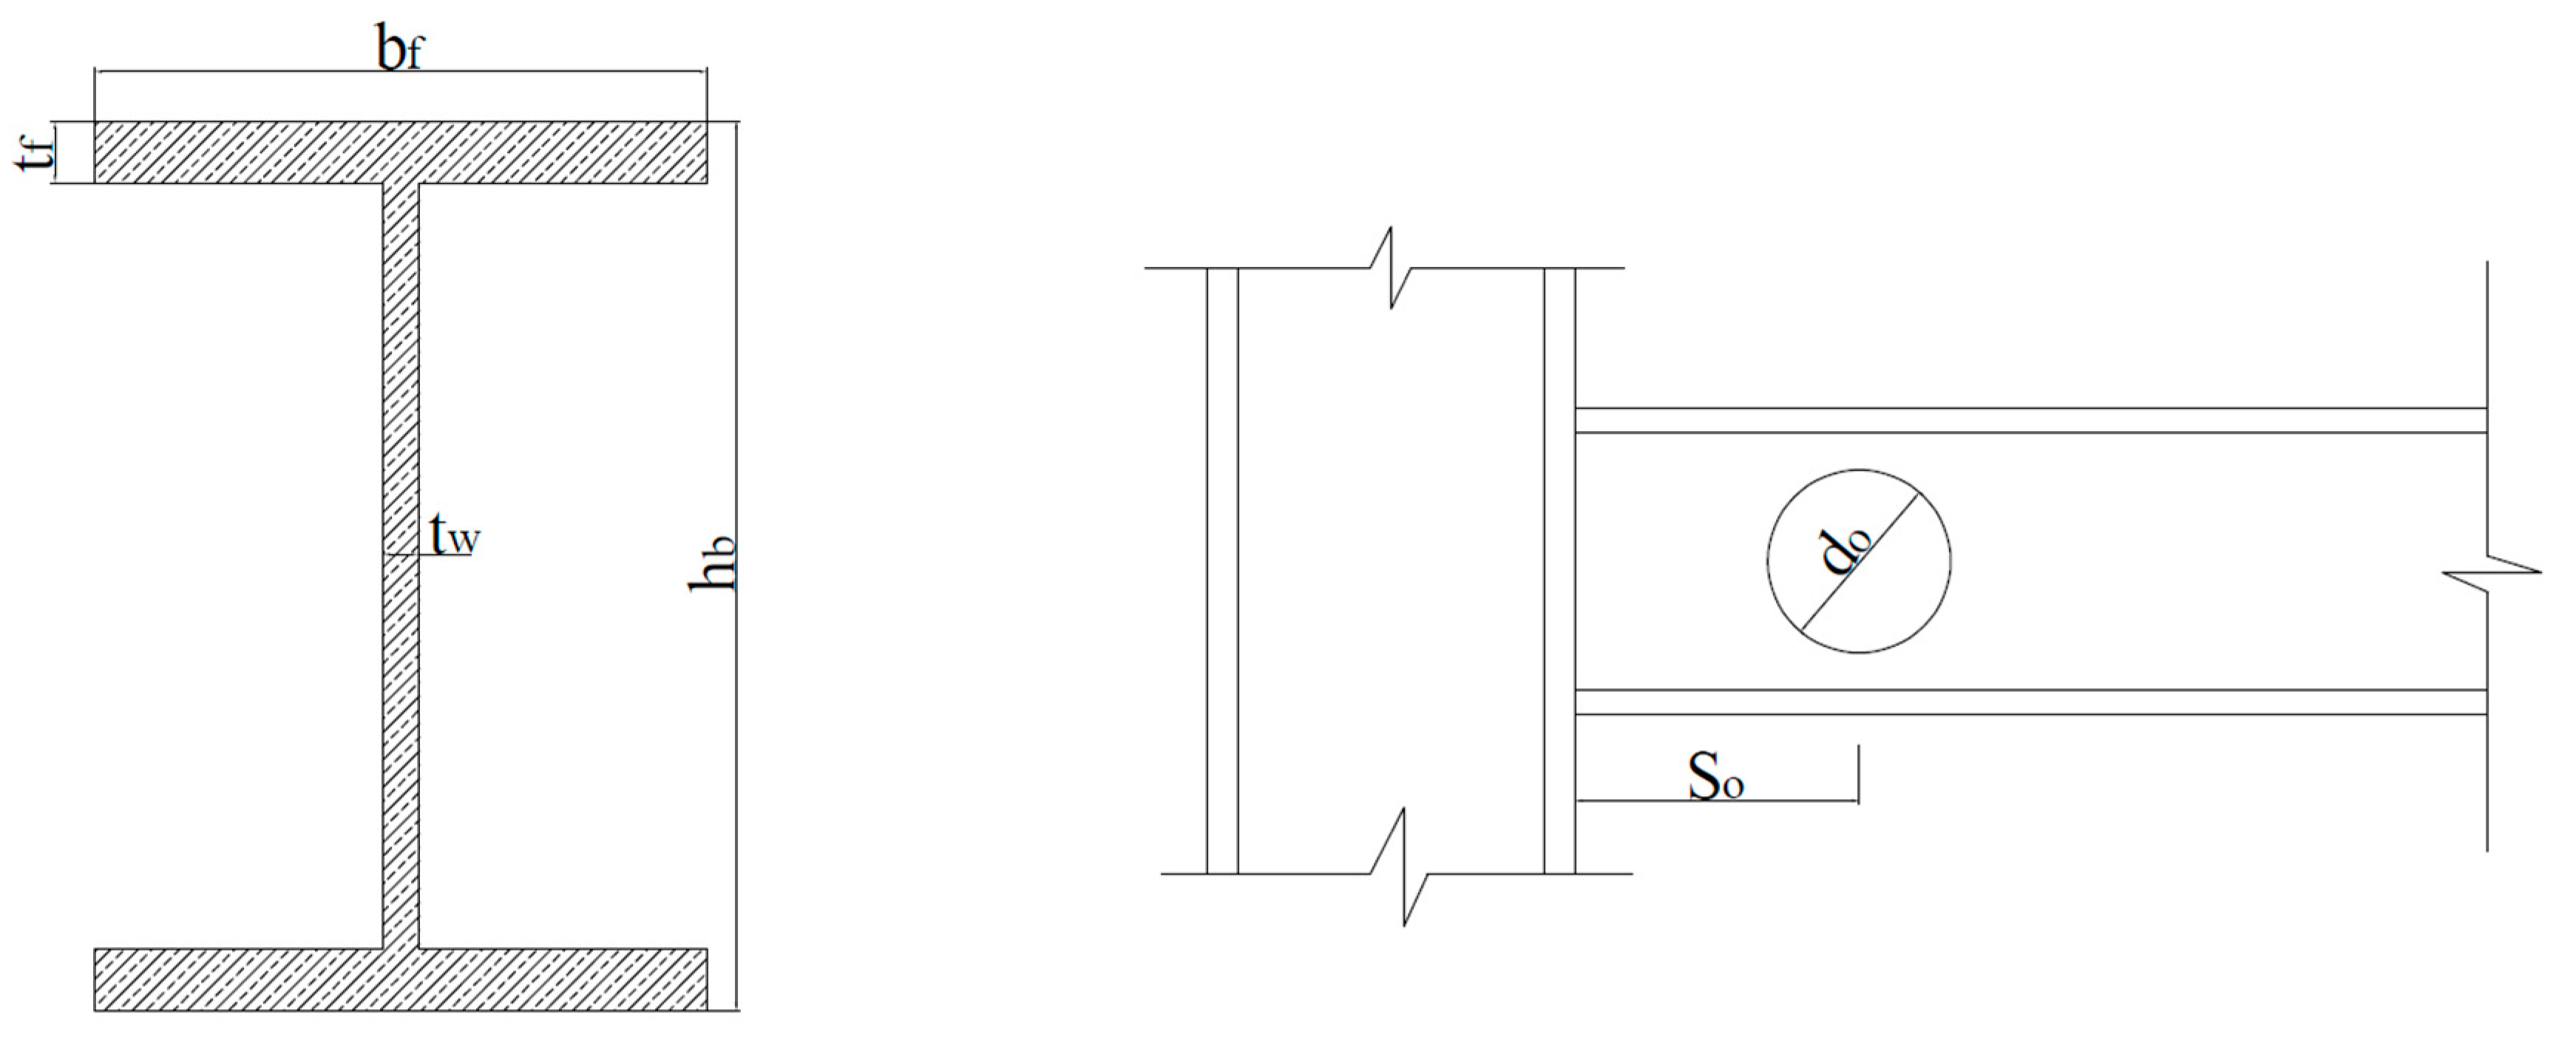
This approach highlights the importance of multi-faceted research in structural engineering, where localised component testing is complemented by system-level considerations to ensure the practical applicability of innovative connection designs like RWS in seismic-resistant structures. Key geometric and material properties were identified as input features, including the total height of section is , thickness of web is tw, flange width is , and thickness of flange is . The yield strength is denoted as , while represents the length of beam. Additionally, indicates the diameter of web opening and indicates distance from the web opening centreline to the edge of the column. These parameters collectively define the geometric and material properties essential for characterising the Reduced Web Section (RWS) connection.
Figure 1.
RWS connection parameters.
These features were normalised and analysed for correlations to ensure optimal model performance.
3.2. Calibration of IMK Bilin Parameters
The calibration process for the Reduced Web Section (RWS) database studies using the bilinear modified Ibarra-Krawinkler (mIK) model in OpenSees was conducted to develop simplified models capable of representing the strength degradation of RWS connections. This approach is similar to that used for Reduced Beam Section (RBS) connections in previous studies [21].
Key aspects of the calibration process include:
3.2.1. Model Setup
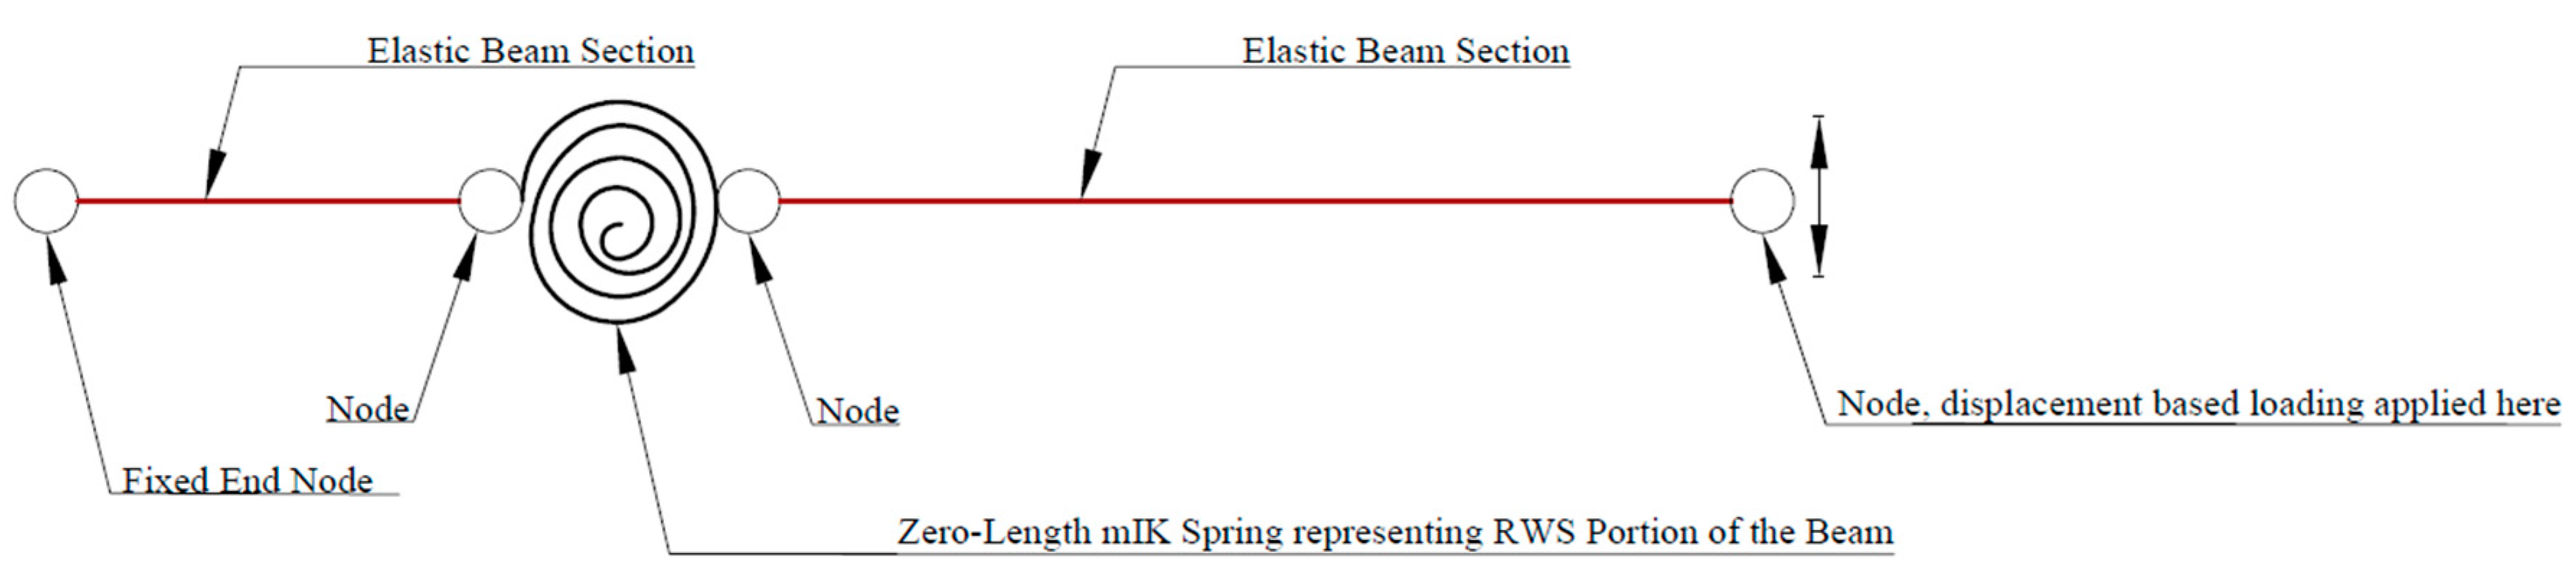
Each RWS connection in the database was modelled in OpenSees. The model consisted of an elastic beam section with properties matching the respective Finite Element (FE) model and experimental test setup. A zero-length mIK Bilinear Spring was used to represent the RWS portion of the beam.
3.2.2. Loading Conditions
Cyclic displacement-based loading was applied up to 0.05 radians and some of tests 0.06 rad. The seismic performance of beam-to-column connections is evaluated using a standardised cyclic loading protocol. This protocol, as outlined in the AISC Seismic Provisions [22], simulates earthquake-induced deformations through a series of controlled displacement cycles. The key aspects of this protocol are:
- Control Parameter: The story drift angle (θ) is used as the primary control parameter.
-
Loading Sequence:
- ○
- Initial cycles: 6 cycles each at θ = 0.00375, 0.005, and 0.0075 rad
- ○
- Intermediate cycles: 4 cycles at θ = 0.01 rad
- ○
- Higher deformation cycles: 2 cycles each at θ = 0.015, 0.02, 0.03, and 0.04 rad
- Continued loading: Increments of θ = 0.01 rad, with 2 cycles per step
- Boundary conditions matched those used in the FE models and Experimental tests.
Figure 2.
The equivalent zero-length spring model in OpenSees simulating FE and Experimental tests of database.
Figure 2.
The equivalent zero-length spring model in OpenSees simulating FE and Experimental tests of database.
3.2.3. Calibration Method
The least squares optimisation method is employed in this study to calibrate OpenSees model against FEA or test results. This approach is widely adopted in structural engineering research, particularly for the analysis of structural behaviour under seismic loads [23,24]. In Python, a bilinear material model is defined in OpenSees, representing a modified Ibarra-Medina-Krawinkler deterioration model with a bilinear hysteretic response. A SAC loading protocol is applied to the OpenSees model, simulating cyclic loading conditions typical in seismic analysis. The results from this simulation are then compared with reference data, which is loaded from an Excel file. The comparison focuses on the moment-rotation relationship of the connection, a critical aspect of structural behaviour under seismic loads. An objective function is defined to calculate the error between the OpenSees model output and the reference data. This error is what the least squares method aims to minimise. The optimisation process is carried out using SciPy's least_squares function, which iteratively adjusts the model parameters to minimize the discrepancy between the OpenSees model output and the reference data.
The parameters being optimised include:
- Cyclic deterioration parameters for strength and post-capping strength (Lamda_S, Lamda_C)
- Cyclic deterioration parameter for unloading stiffness (Lamda_K)
- Strain-hardening ratios (as_Plus, as_Neg)
- Post-capping rotations (theta_pc_Plus, theta_pc_Neg)
3.2.4. Analysis and Post-Processing
The OpenSees code employs static analysis with displacement control, implementing a SAC cyclic loading protocol. The SecantNewton algorithm and energy-based convergence criteria are utilised to ensure solution stability and accuracy in the presence of significant non-linearities.
The analysis outputs node displacements and element forces are post-processed to derive the moment-rotation relationship.
3.2.5. Model Accuracy
The calibration used the actual cyclic response from validated FE models and tests rather than predicting the cyclic envelope from monotonic behaviour. This approach leads to more reliable and accurate models for non-linear dynamic analysis, especially for elements exhibiting stiffness and strength degradation.
3.2.6. Database Scope
The calibration process was applied to a range of RWS configurations, varying in different beam sections geometry, web opening diameter and distance from the column face. This calibration process enables the creation of simplified yet accurate models of RWS connections for use in larger structural analyses. By capturing the cyclic behaviour directly from FE results, these models provide a more robust representation of RWS connection behaviour under seismic loading conditions.
3.2.7. Results of Calibration
The analysis of the Modified Ibarra-Medina-Krawinkler (IMK) Deterioration Model with Bilinear Hysteretic Response, implemented as the Bilin material in OpenSees, reveals complex interactions between web opening characteristics, beam length, and structural behaviour. The key findings encompass the effects of web opening size, position, and beam length.
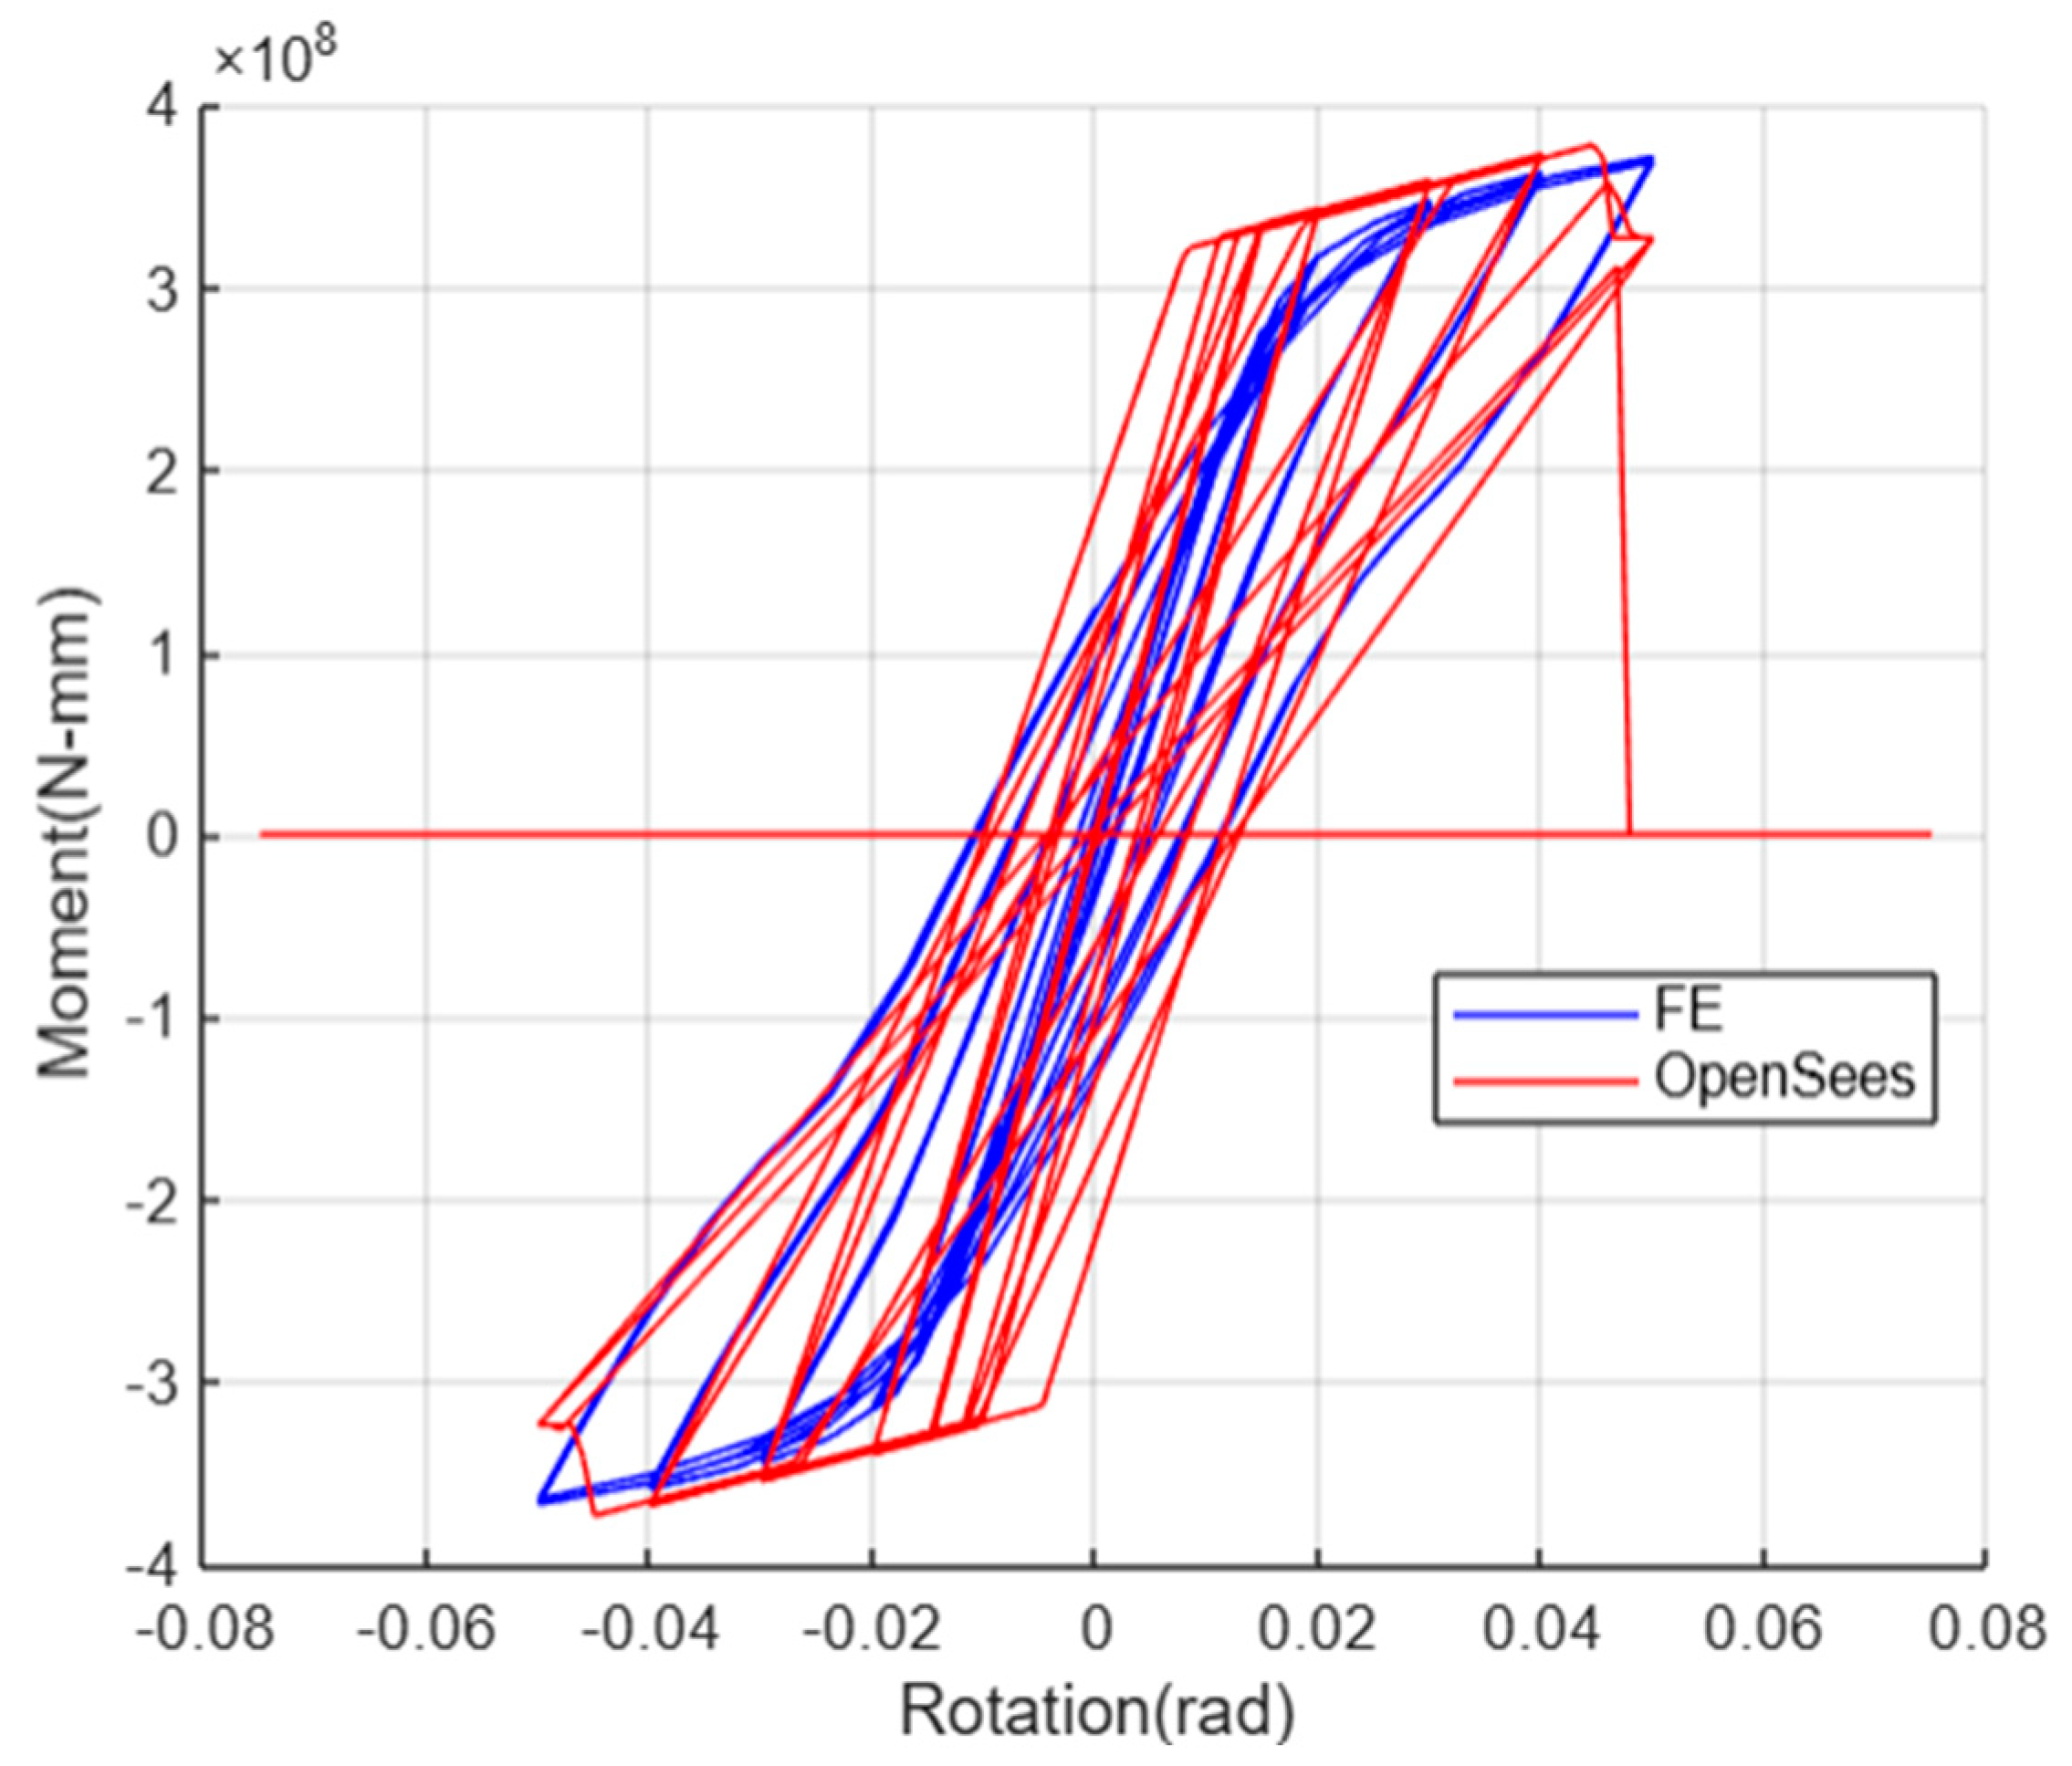
- Web Opening Size Effect
For relatively small and regular web opening sizes the following observations were made:
- Stiffness Degradation: Noticeable degradation in stiffness is observed, primarily controlled by the parameter.
- Strength Preservation: No significant degradation in strength occurs, suggesting limited influence of the parameter.
- Absence of Post-Capping Phase: The analysis does not show the development of a post-capping phase, indicating minimal influence of the parameter.
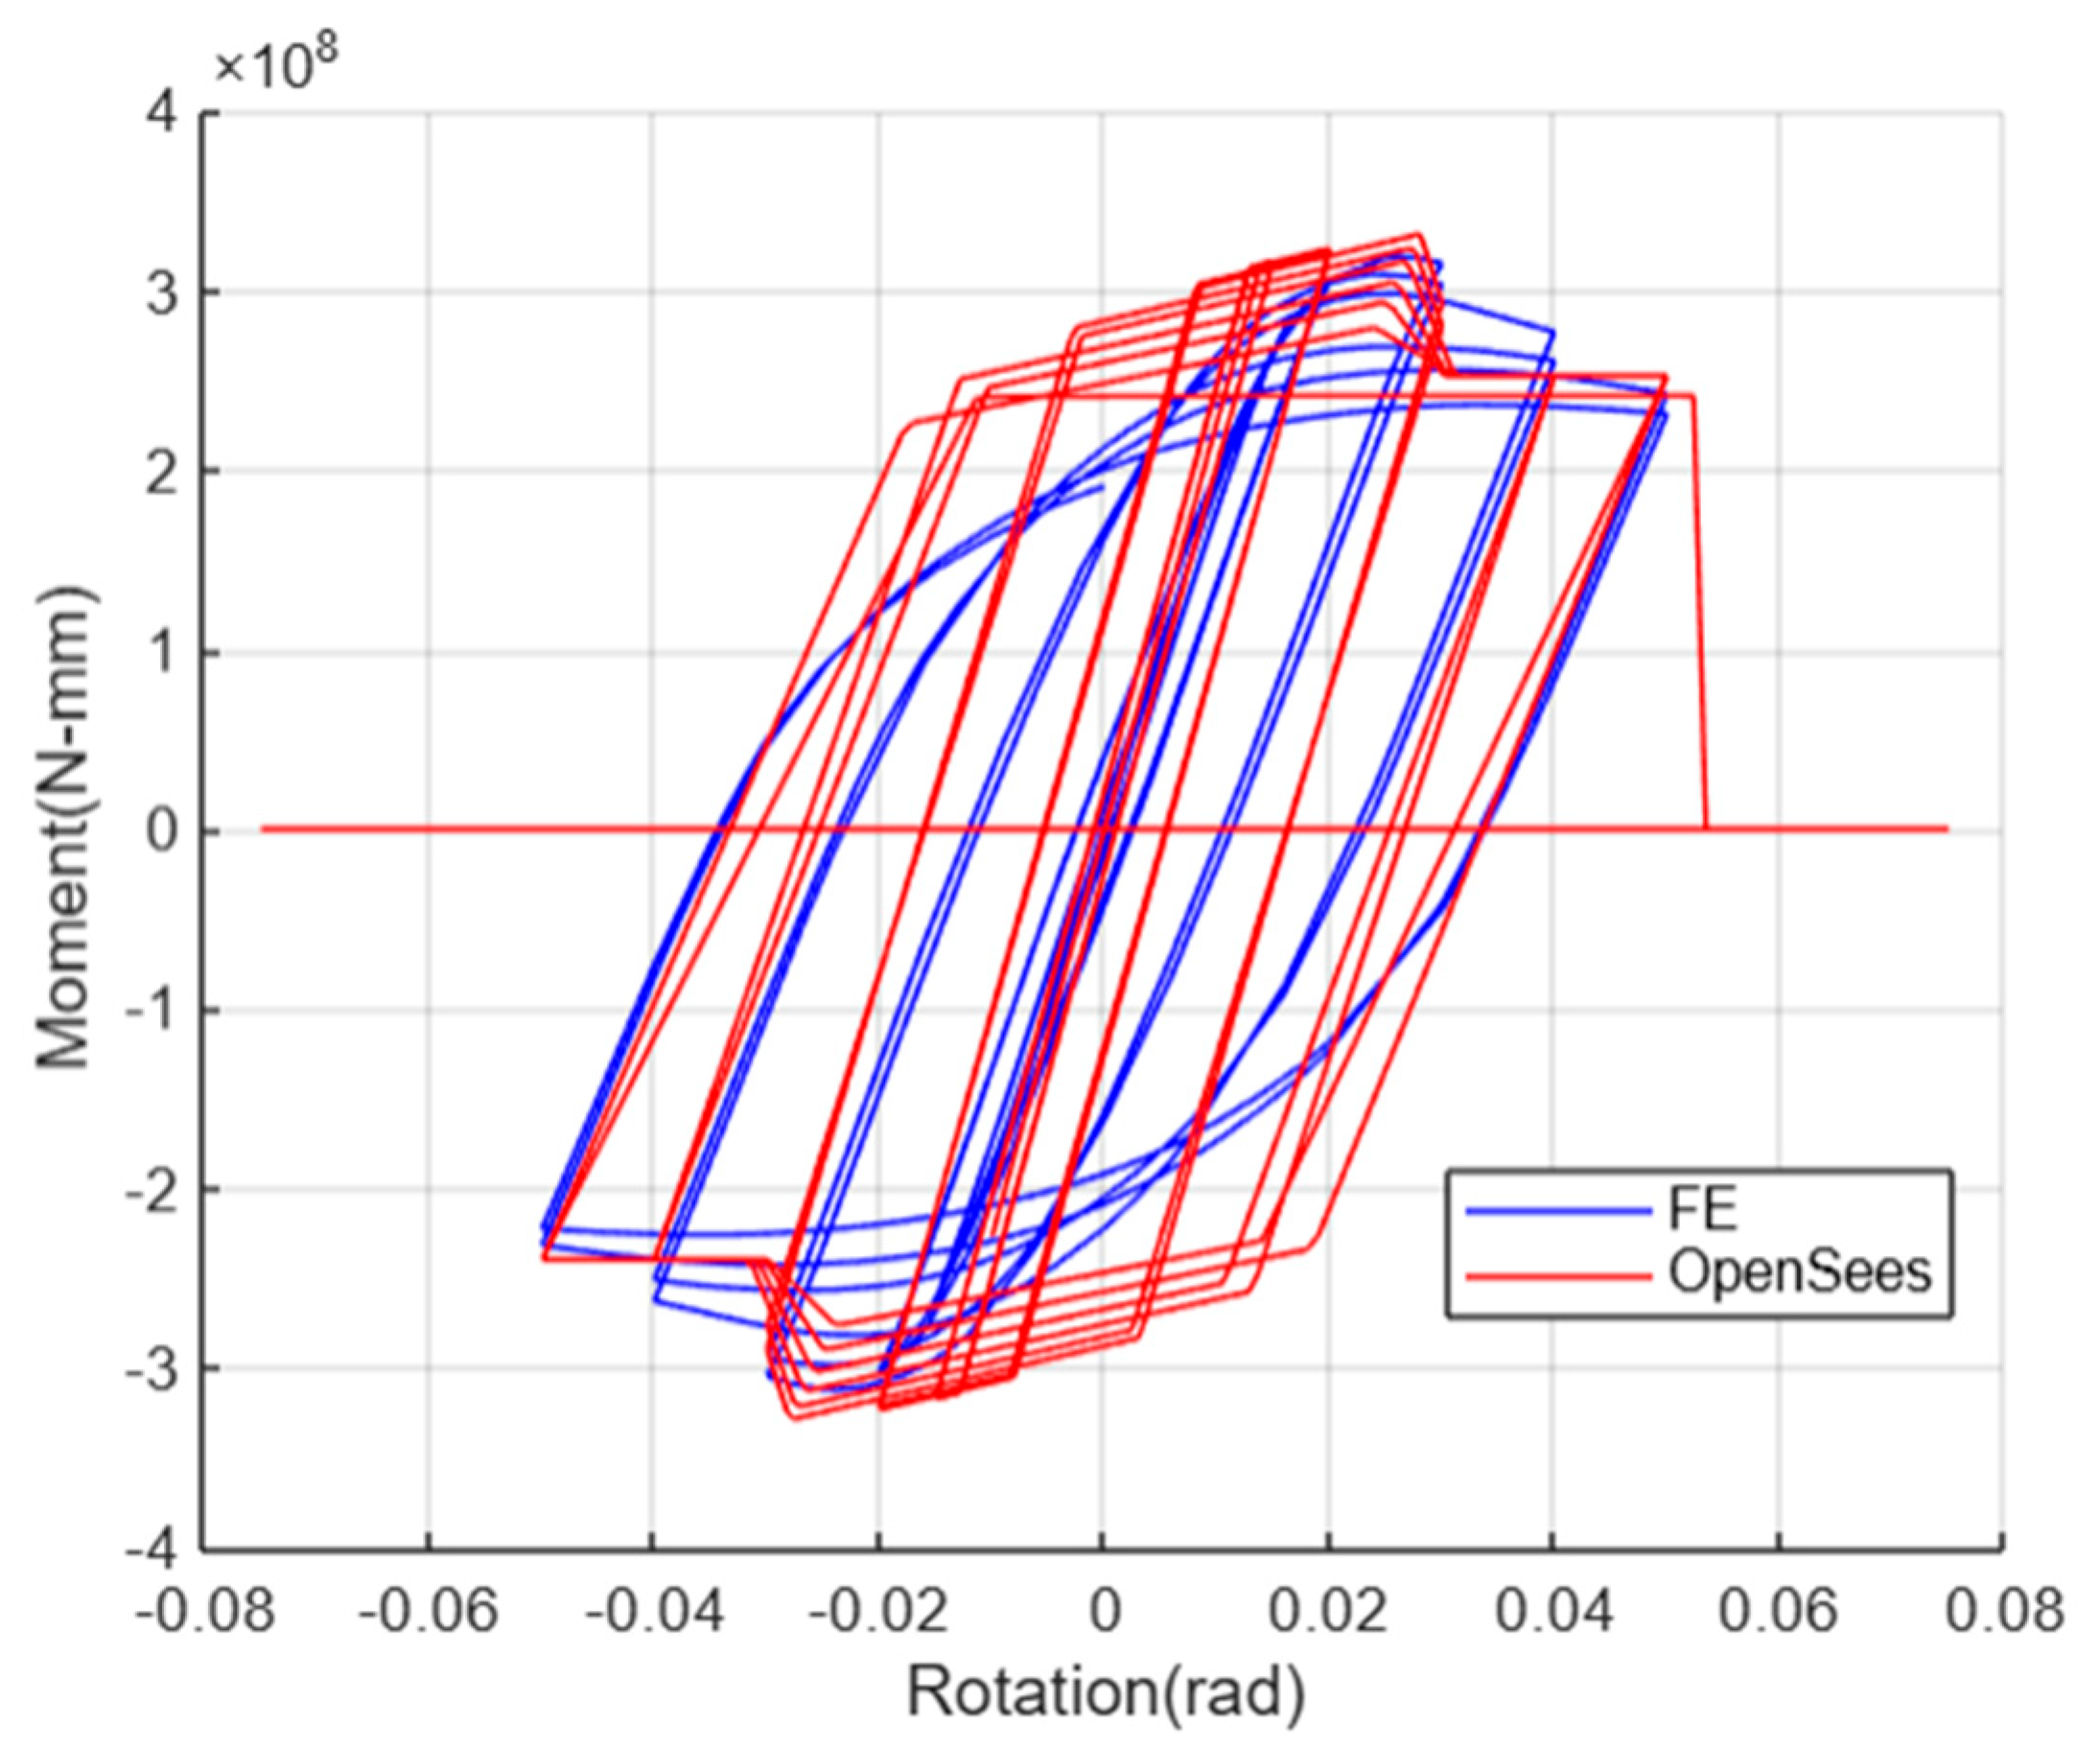
Figure 3.
Calibration with FE Study [13] (web opening size): 50% of overall height of beam – (Distance of web opening centreline from face of column): 80% of overall height of beam.
Figure 3.
Calibration with FE Study [13] (web opening size): 50% of overall height of beam – (Distance of web opening centreline from face of column): 80% of overall height of beam.
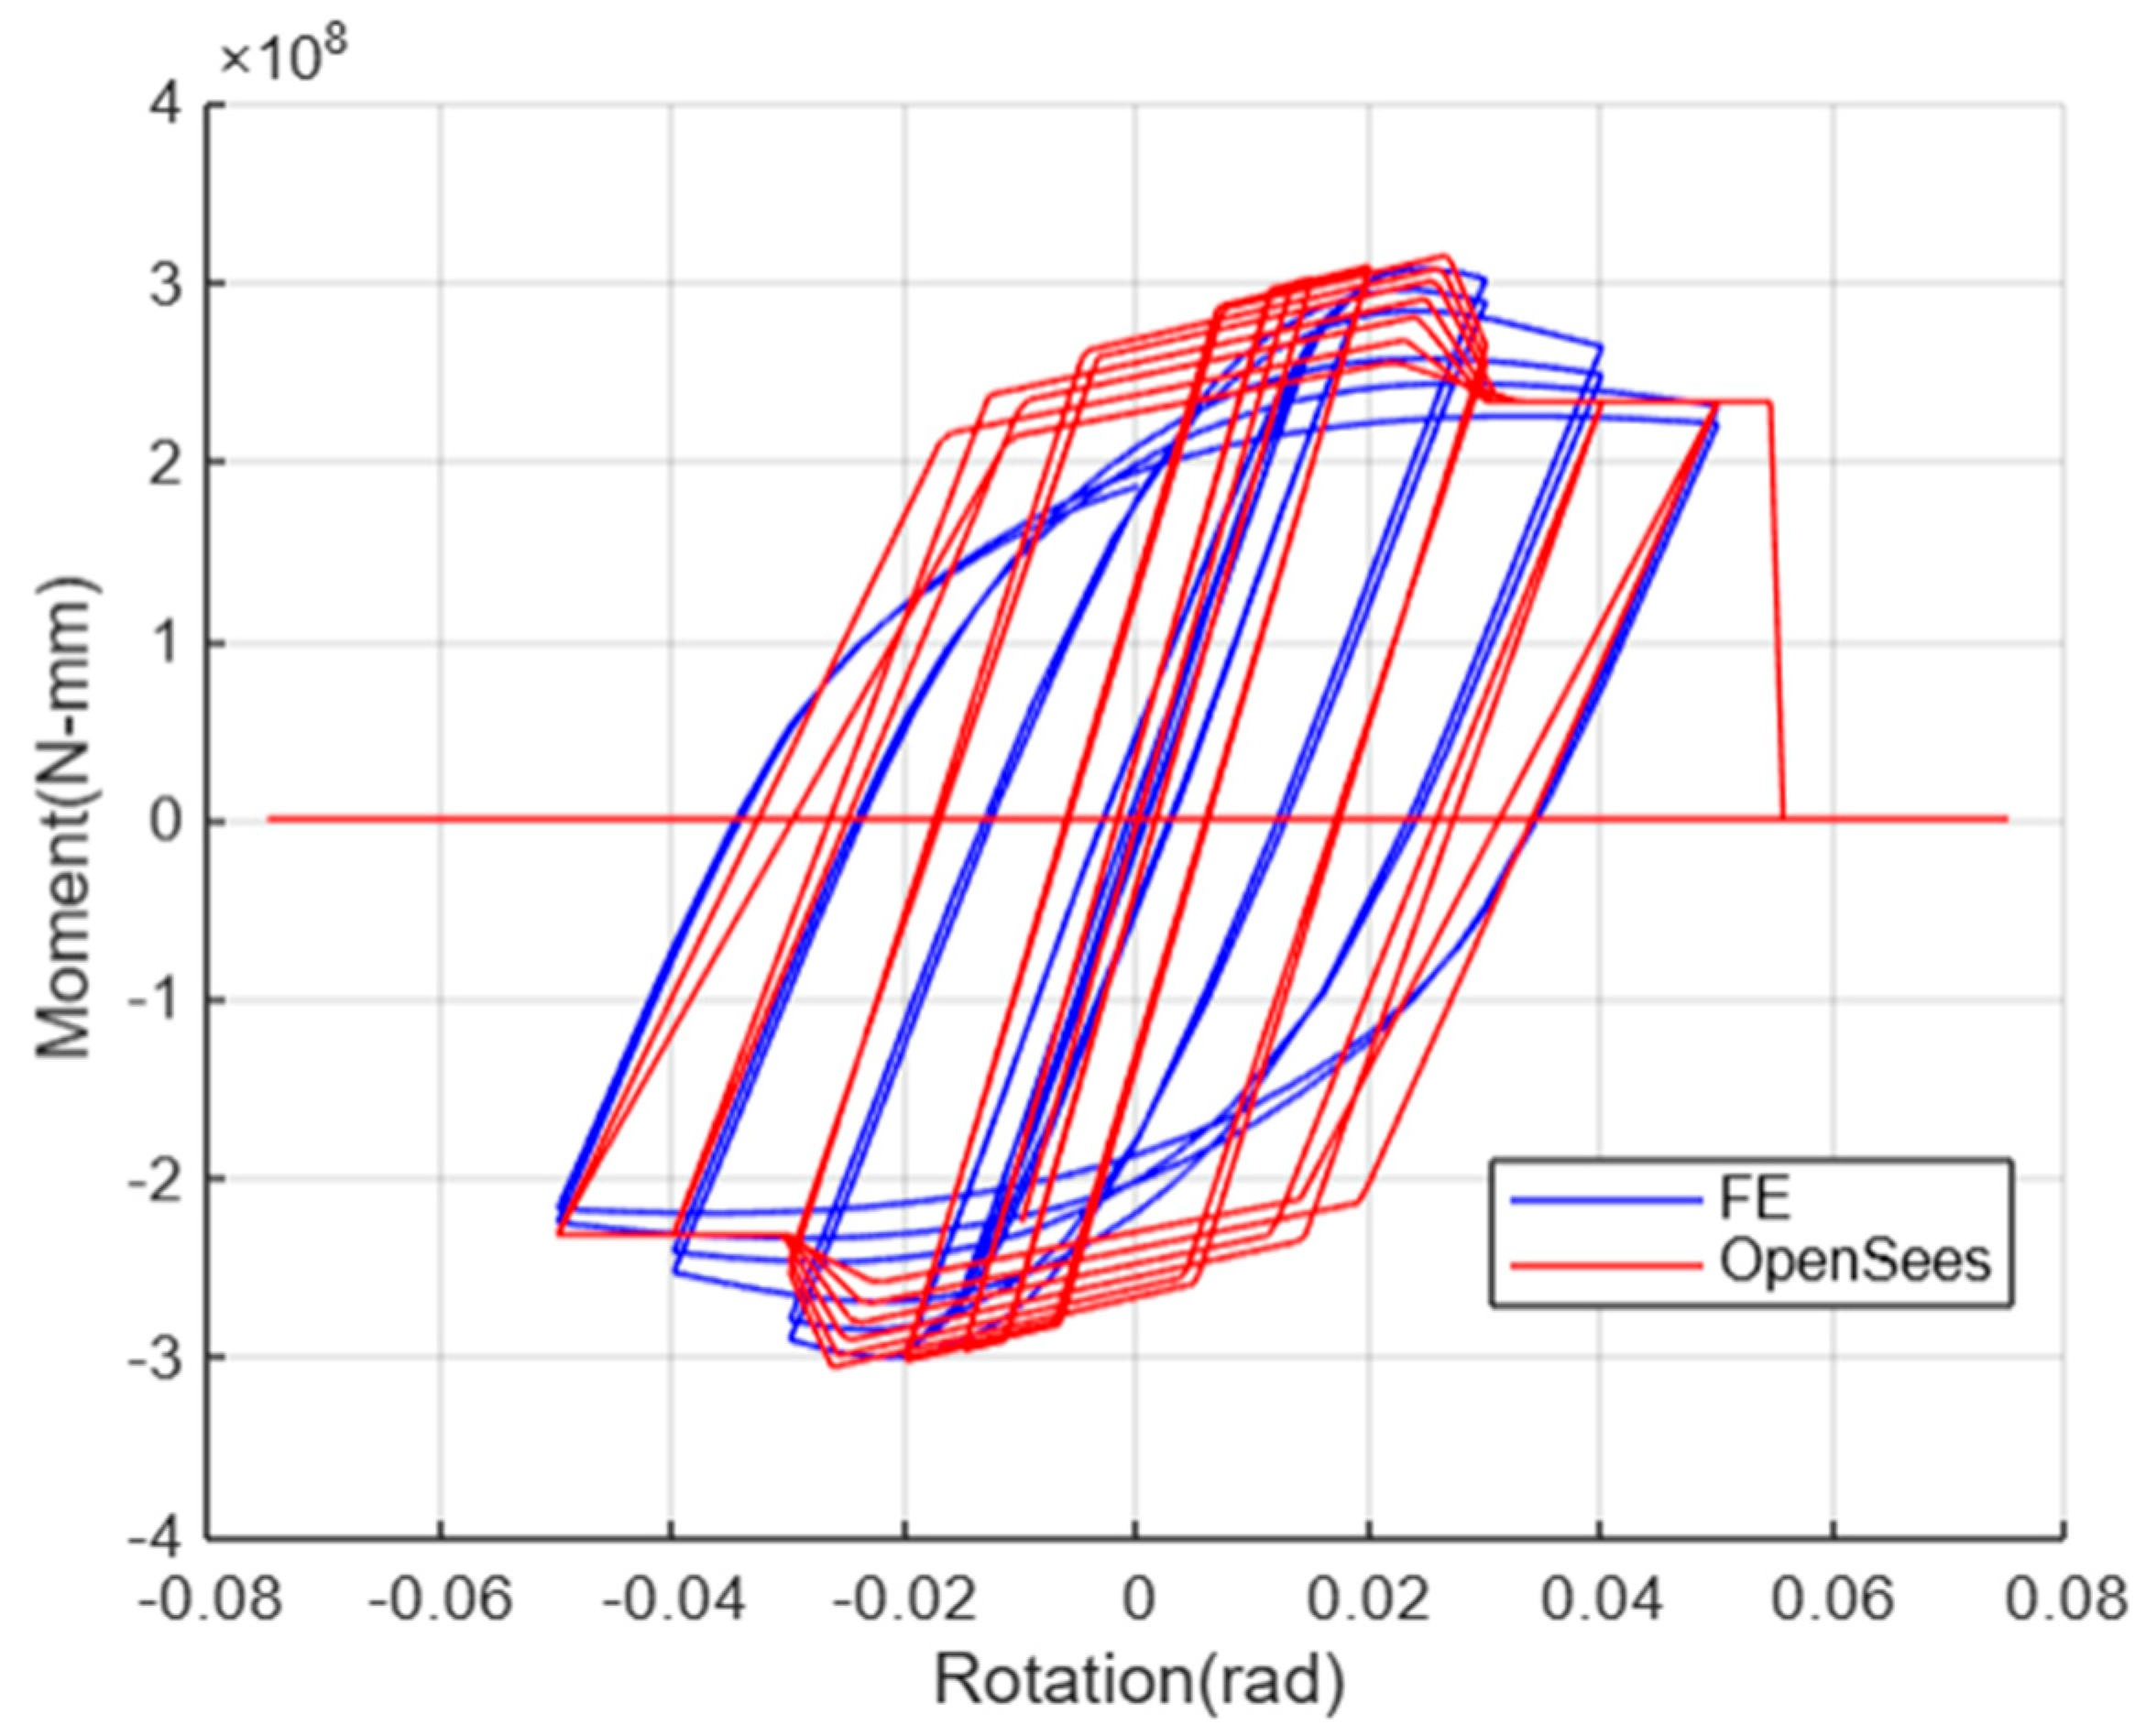
For large web opening sizes the following observations were made:
- Post-Capping Phase: A distinct post-capping phase is observed, characterised by significant strength decrease after reaching maximum capacity.
- Enhanced Energy Dissipation: Larger hysteresis loops indicate higher energy dissipation during cyclic loading.
- More Pronounced Deterioration: All three lambda parameters (, , and ) play significant roles in shaping the structural response.
Figure 4.
Calibration with FE Study [13] (web opening size): 80% of overall height of beam – (Distance of web opening centreline from face of column): 80% of overall height of beam.
Figure 4.
Calibration with FE Study [13] (web opening size): 80% of overall height of beam – (Distance of web opening centreline from face of column): 80% of overall height of beam.
- Web Opening Position Effect
A clear trend is observed in relation to the distance of the web opening centerline from the column face:
- Strain Hardening Ratio: As the distance of the centreline of the web opening from the column face increases, the strain hardening ratio decreases.
Figure 5.
Calibration with FE Study [13] (web opening size): 80% of overall height of beam – (Distance of web opening centreline from face of column): 120% of overall height of beam.
Figure 5.
Calibration with FE Study [13] (web opening size): 80% of overall height of beam – (Distance of web opening centreline from face of column): 120% of overall height of beam.
This relationship suggests that the position of the web opening significantly influences the post-yield behaviour of the beam, potentially affecting its ductility and energy dissipation capabilities.
- Beam Length Effect
As illustrated in Figure 7, the length of the beam has significant impact on its structural behaviour:
- Energy Dissipation: As the beam length increases from 3 meters to 15 meters, there is a noticeable decrease in energy dissipation. This is likely reflected in smaller hysteresis loops for longer beams.
- Stiffness: The increase in beam length is accompanied by a significant decrease in stiffness. This relationship between length and stiffness is consistent with fundamental beam theory, where stiffness is inversely proportional to the length.
- Performance Implications: The reduction in both energy dissipation and stiffness with increased length suggests that longer beams may be more susceptible to larger deformations and potentially reduced energy dissipation performance.
Figure 6.
Effect of length of beam on decreasing energy dissipation and stiffness (Calibration with FE Study [18].
Figure 6.
Effect of length of beam on decreasing energy dissipation and stiffness (Calibration with FE Study [18].
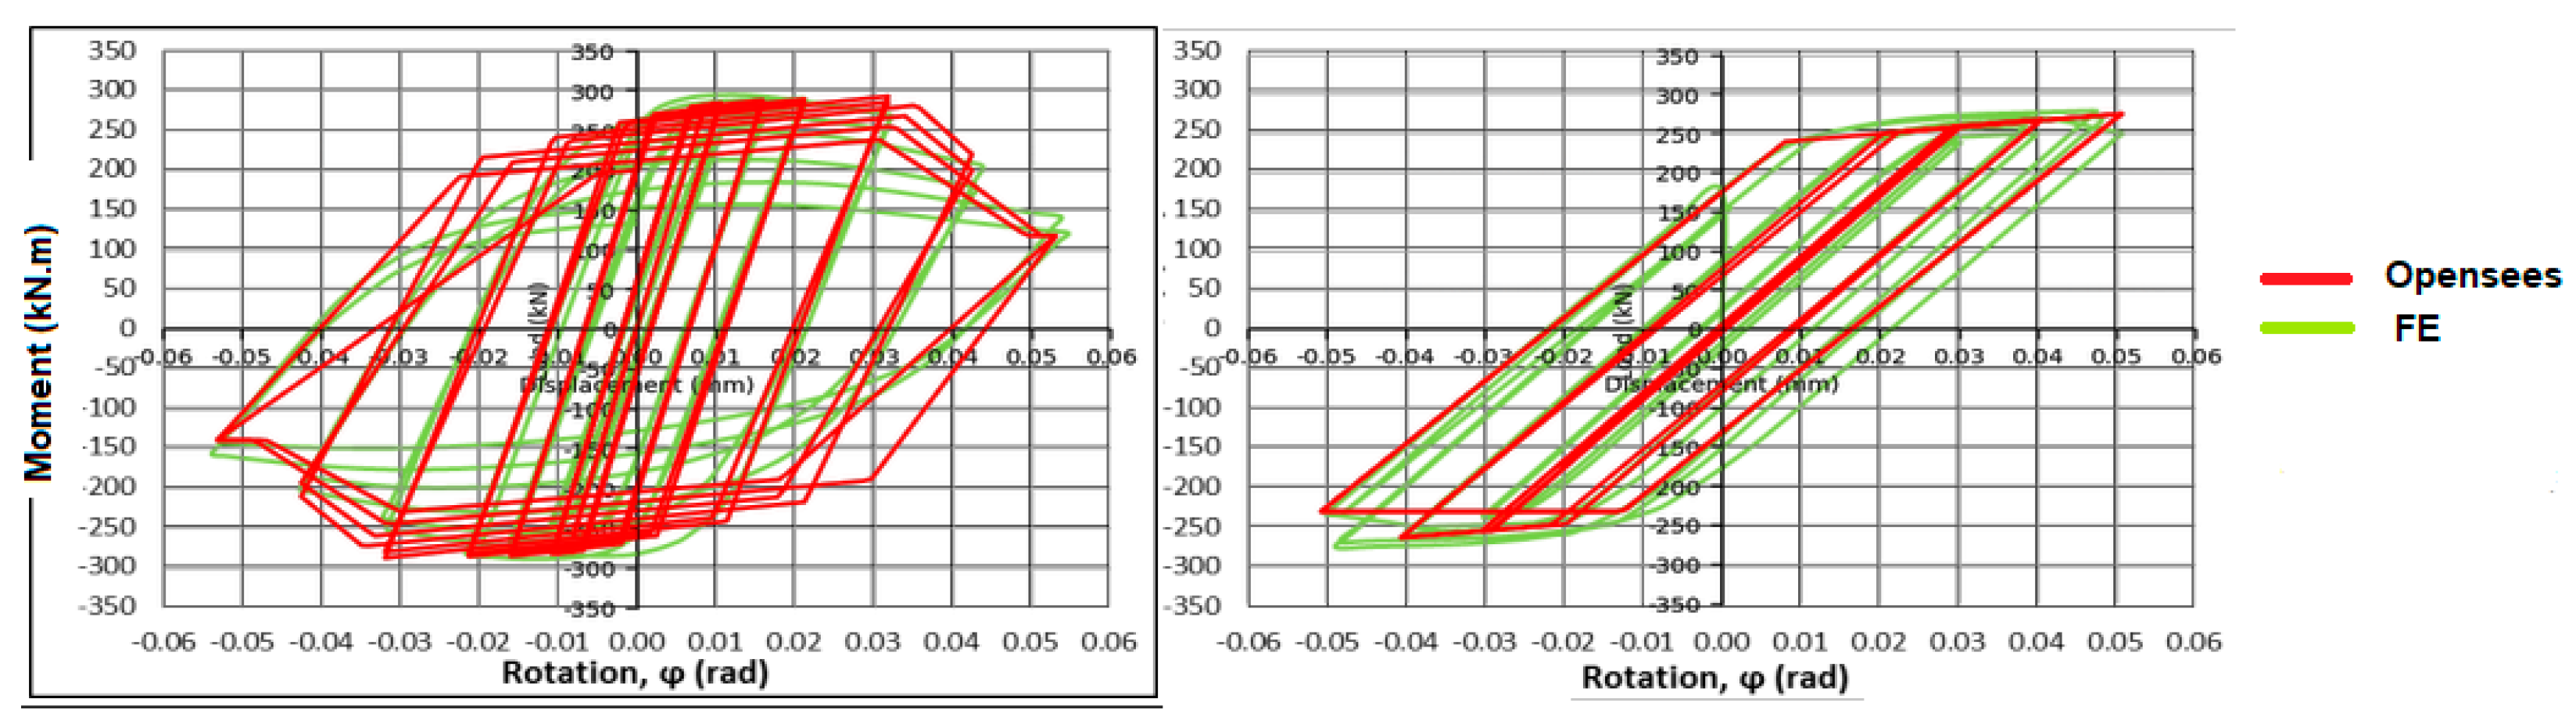
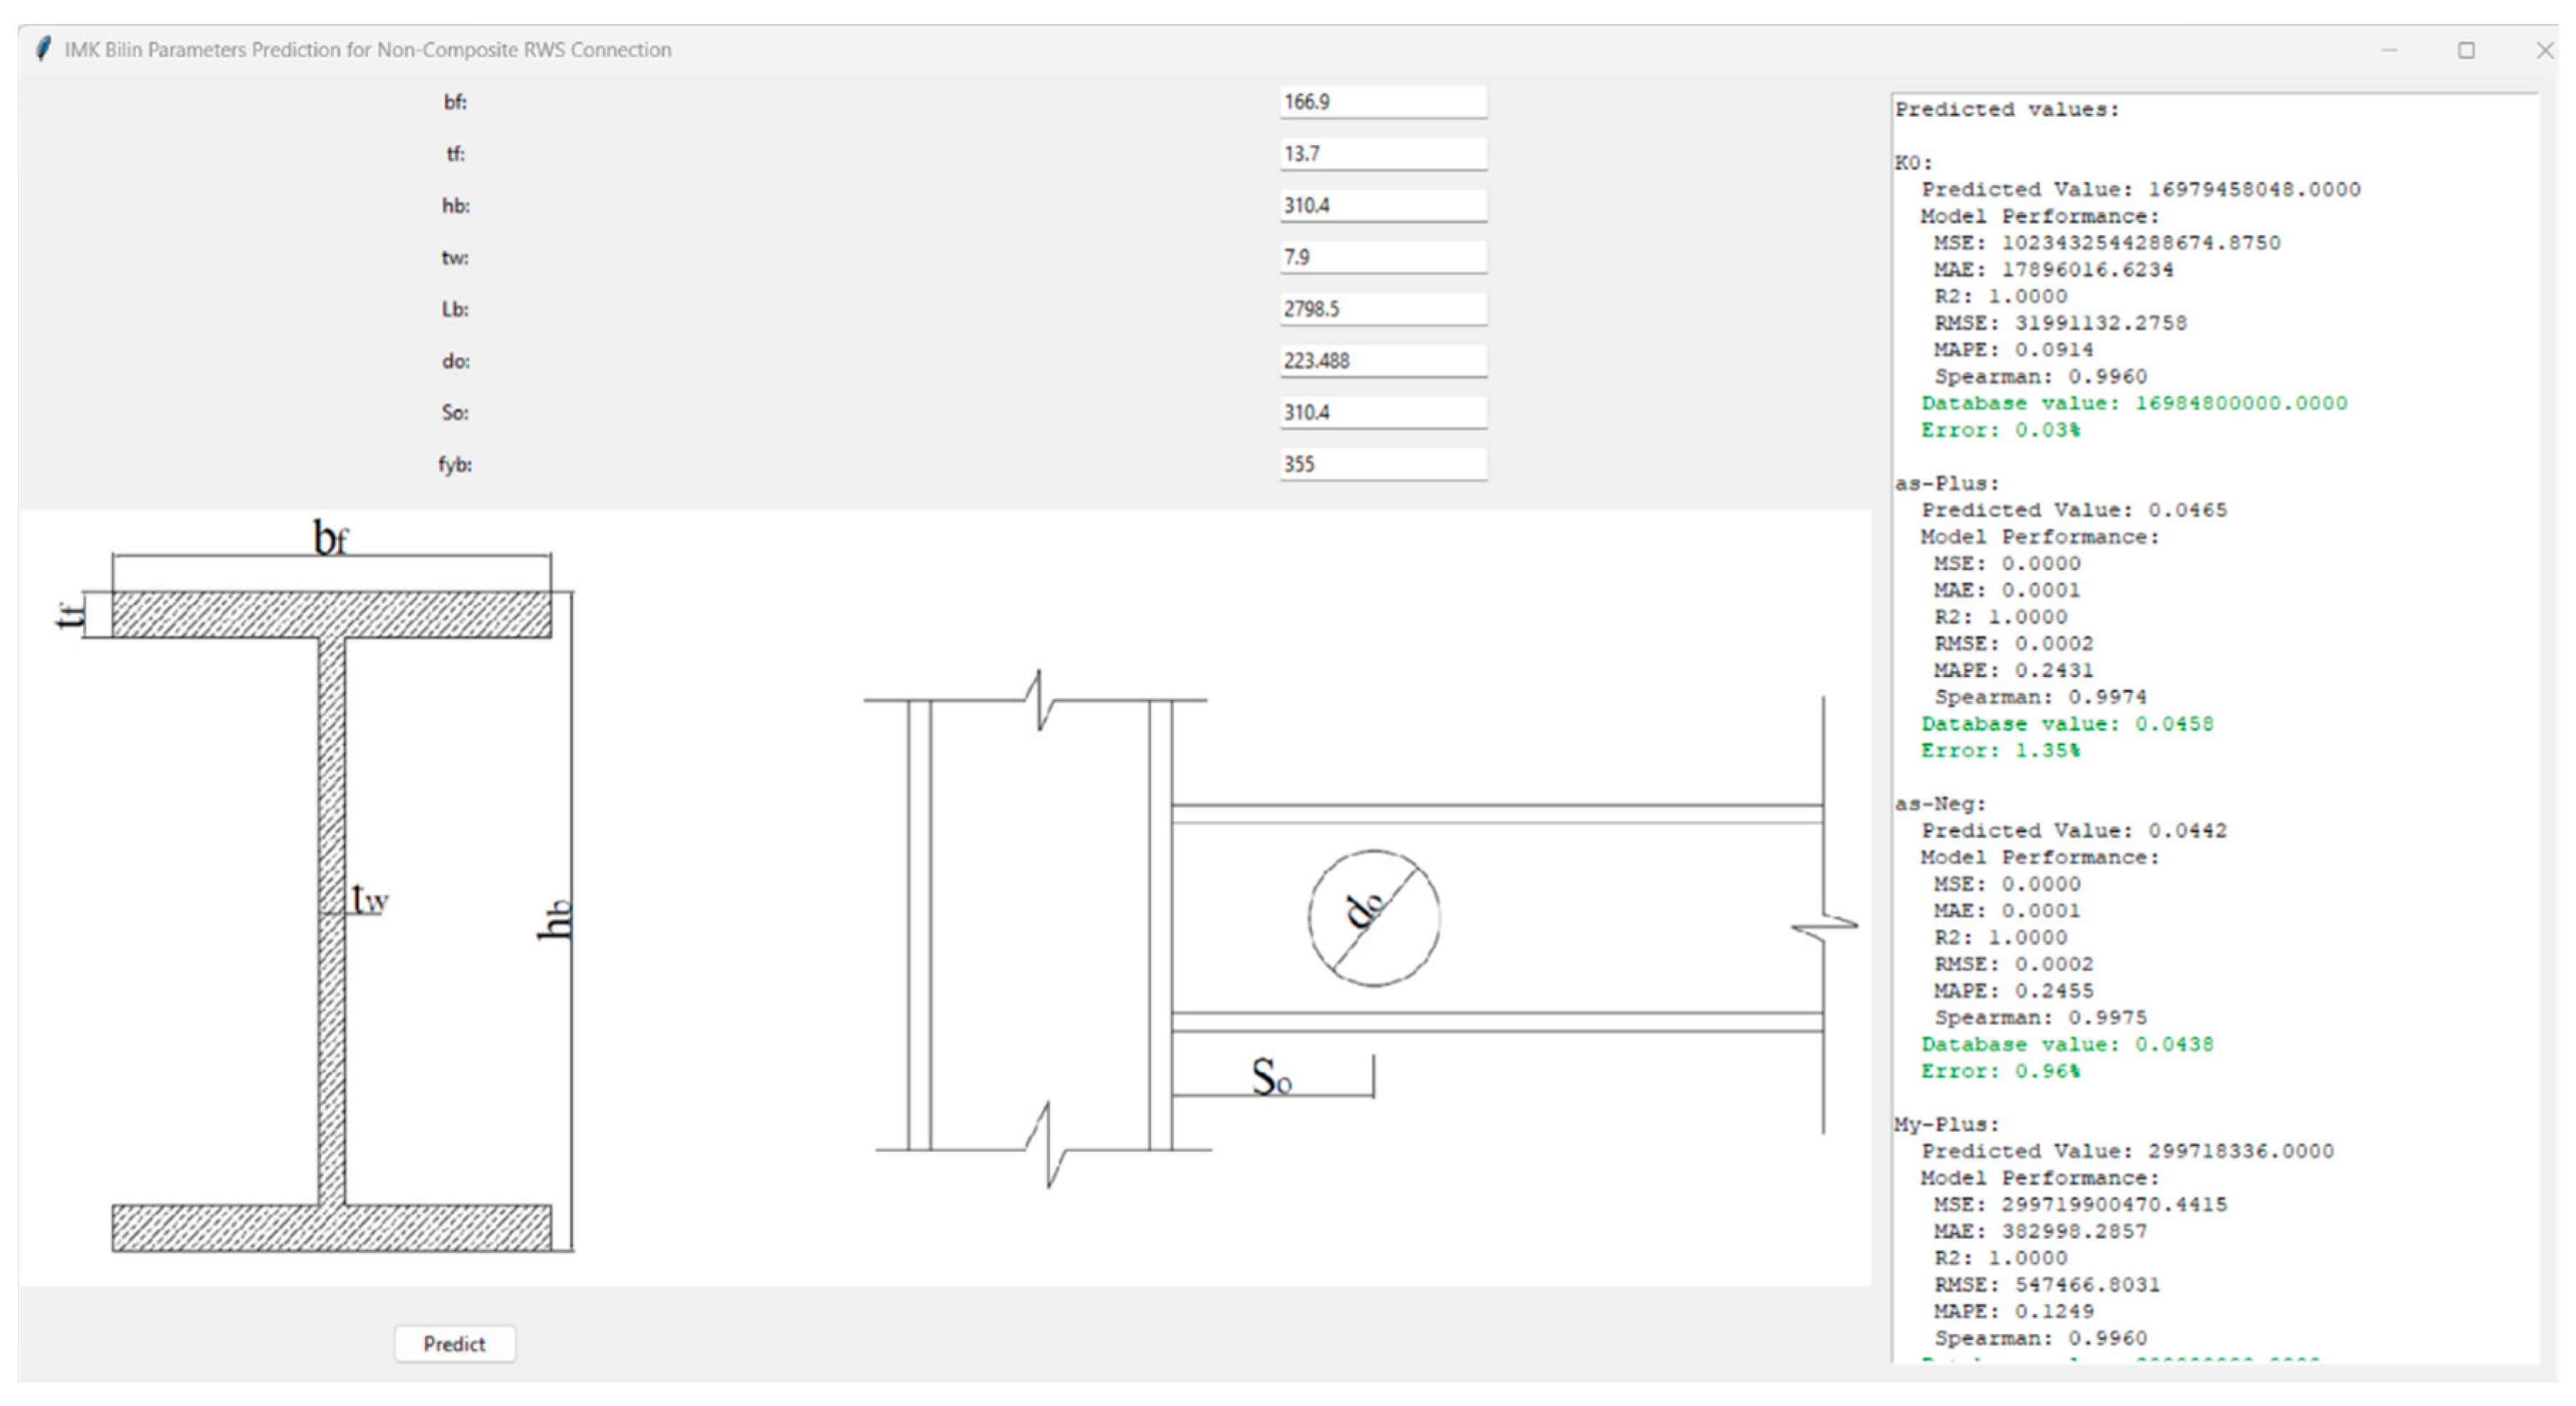
Figure 7.
GUI For IMK Bilin Parameters Prediction for Non-Composite RWS Prediction.
These observations highlight the complex interplay between various geometric parameters of RWS joints:
- Web Opening Size: Influences the overall deterioration pattern and energy dissipation capacity.
- Web Opening Position: Affects the strain hardening behaviour, potentially impacting the beam's post-yield response.
- Beam Length: Directly impacts the beam's stiffness and energy dissipation capabilities, with longer beams exhibiting reduced performance in these aspects.
The interplay of these factors allows for a nuanced representation of structural behaviour under cyclic loading. By carefully considering the web opening size, position, and beam length, along with the calibration of lambda values, the model can accurately capture various mechanisms observed in real structures. These mechanisms include local deformations around openings, changes in load transfer paths, and the global effects of beam geometry.
This comprehensive understanding is particularly valuable in performance-based seismic design and assessment of structures with web openings. It enables engineers to model and predict the complex non-linear behaviour of structural elements under earthquake loading more accurately, accounting for the specific effects of web openings, and beam length on the overall structural response and energy dissipation capabilities.
3.3. Machine Learning and Deep Learning Implementation
Accurate prediction of RWS connection behaviour is considered crucial for evaluating the global seismic behaviour of buildings utilising such connections and for incorporating them into seismic codes, as it provides essential information on global seismic parameters necessary for comprehensive structural analysis and code development. However, the determination of appropriate IMK Bilin parameters for different RWS connection configurations has remained a challenging task, often necessitating extensive experimental or computational studies.
This research addresses the critical need for a more accurate and versatile method of predicting IMK Bilin parameters across a wide range of RWS connection configurations. Specifically, the focus is placed on developing predictive models for every section of the RWS connection, considering variations in web opening size and distance from the column face. The traditional approach of utilising nonlinear regression techniques has demonstrated limitations in terms of accuracy, especially when dealing with the complex interactions between various geometric and material properties.
To overcome these limitations and achieve higher prediction accuracy, advanced Machine Learning (ML) and Deep Learning (DL) algorithms have been employed in this study. The adoption of these computational techniques is motivated by their ability to capture intricate, nonlinear relationships within large datasets without being constrained by predefined mathematical formulations. Unlike traditional regression methods, which often struggle to encapsulate the full complexity of structural behaviour, ML and DL approaches can adapt to subtle patterns and interactions in the data, potentially leading to more accurate and robust predictions.
By leveraging these advanced algorithms, a comprehensive predictive framework is aimed to be developed that can rapidly and accurately estimate IMK Bilin parameters for a wide array of RWS connection configurations. This approach not only promises enhanced accuracy but also offers the flexibility to accommodate diverse structural scenarios without the need for case-specific equation development. The resulting models are expected to provide structural engineers with a powerful tool for efficient design and analysis of RWS connections, particularly in the context of performance-based seismic design.
Consequently, this study employed a comprehensive approach to predict Ibarra-Medina-Krawinkler (IMK) Bilin parameters for non-composite RWS welded and bolted end-plate connections. The implementation was carried out in Python, leveraging popular libraries such as scikit-learn, XGBoost, and TensorFlow. The following methods were utilised
- Random Forest (RF),
- Neural Network (NN) / Multi-Layer Perceptron (MLP) Regressor,
- Support Vector Regression (SVR),
- Gradient Boosting (GB),
- XGBoost (XGB), and
- Deep Learning (DL).
Code Structure and Implementation:
The Python code was structured to handle the following key steps:
- Overview:
This code implements a sophisticated machine learning approach to predict various parameters related to steel structural behaviour. It utilises multiple regression models, including traditional ML/DL algorithms, to analyse and predict IMK Bilin Parameters based on input geometry and material characteristics.
- Data Preparation and Feature Engineering:
The code begins by loading data from an Excel file, which contains test and FE results of steel structural elements.
Key input variables are derived from basic structural parameters:
- : Web slenderness ratio
- : Flange slenderness ratio
- : related to Lateral-torsional buckling slenderness
- : Opening height ratio
- : Edge distance ratio
- : Yield strength
- Model Development:
The code implements multiple regression models for each output parameter:
- Random Forest Regressor
- Neural Network (MLPRegressor)
- Support Vector Regression (SVR)
- Gradient Boosting Regressor
- XGBoost Regressor
- Deep Learning model (using TensorFlow/Keras)
This multi-model approach allows for comprehensive comparison and selection of the best-performing model for each IMK Bilin parameter.
- Model Training and Evaluation:
The code uses cross-validation techniques to ensure robust model performance.
- Cross-validation techniques:
- Purpose: To ensure the model's performance is robust and generalisable.
- Implementation: The code uses K-Fold cross-validation (with 5 folds).
-
Process:
- ○
- The data is split into 5 subsets.
- ○
- The model is trained on 4 subsets and tested on the remaining one.
- ○
- This process is repeated 5 times, with each subset serving as the test set once.
- Advantage: This approach provides a more reliable estimate of the model's performance on unseen data, reducing the risk of overfitting.
- Understanding Evaluation Metrics: R² vs. Database Error:
It is crucial to understand why different evaluation metrics like R² and database error can yield varying results, even when R² is near perfect. This understanding is vital for accurate prediction.
Metric diversity in structural analysis:
- R² quantifies how well the model captures overall trends in connection behaviour.
- Database error focuses on the accuracy of predictions for specific RWS connection geometry and configuration scenarios.
Holistic vs. Specific evaluations:
- R² provides a comprehensive view of the model's performance across various seismic scenarios.
- Database error highlights the model's accuracy for RWS connection configurations.
Systematic biases in IMK Bilin predictions: High R² values can occur even if the model consistently over- or under-predicts IMK Bilin Parameters, which is critical for safety considerations.
Scale considerations: R² remains constant regardless of units, while error measurements can vary based on the magnitude of IMK Bilin Parameters.
- Multi-Metric Approach to Model Assessment:
A range of performance metrics are calculated, including MSE, MAE, R2 score, RMSE, MAPE, and Spearman correlation.
- MSE (Mean Squared Error): Measures the average squared difference between predicted and actual values.where n is the total number of FE or Experimental tests, yᵢ is the actual value, and ŷᵢ is the predicted value.
- MAE (Mean Absolute Error): Measures the average absolute difference between predicted and actual values.
- R2 Score: Indicates the proportion of variance in the dependent variable predictable from the independent variable(s).where ȳ is the mean of the actual values.
- RMSE (Root Mean Squared Error): The square root of MSE, providing a metric in the same units as the target variable.
- MAPE (Mean Absolute Percentage Error): Measures the percentage difference between predicted and actual values.
- Spearman Correlation: Assesses how well the relationship between predicted and actual values can be described using a monotonic function.where dᵢ is the difference between the ranks of corresponding values of yᵢ and ŷᵢ.
These diverse metrics provide a comprehensive view of each model's performance, capturing different aspects of prediction accuracy. The best model for each parameter is selected based on a composite score of these metrics.
- Best Model Selection:
Composite Score: The code creates a composite score combining all these metrics.
Metrics like MSE, MAE, RMSE, and MAPE are normalised (lower number indicates more accurate performance). R2 and Spearman correlation are also normalised (higher number indicates more accurate performance). This detailed evaluation ensures that the selected model performs well across various criteria, which is crucial where both accuracy and reliability are paramount.
The use of multiple metrics addresses different aspects of prediction quality:
- MSE and RMSE are sensitive to large errors, crucial for avoiding significant underestimations in structural capacity.
- MAE provides a straightforward measure of average error magnitude.
- R2 and Spearman correlation ensures the model captures the overall trends in the data.
- MAPE gives a percentage view of errors, useful for comparing across different scales of output.
The normalisation procedure transforms various performance metrics into a standardised scale, typically ranging from 0 to 1. This transformation ensures that each metric, regardless of its original scale or unit, contributes equitably to the overall assessment of model performance. The process is particularly valuable when dealing with an array of metrics such as Mean Squared Error (MSE), R-squared (R2), and Mean Absolute Percentage Error (MAPE).
For metrics where a lower value indicates superior performance (e.g., MSE, MAPE), the normalisation is achieved using the formula Eq. (7):
Conversely, for metrics where higher values signify better performance (e.g., R2, Spearman correlation), the formula is adjusted to Eq. (8):
This approach ensures that across all metrics, a normalised score closer to 1 consistently represents superior performance. The normalised scores are then aggregated to form a composite performance indicator. This composite score provides a holistic measure of each model's efficiency, balancing various aspects of predictive accuracy. The composite score is calculated by summing these normalised values. The model with the highest composite score for each structural parameter is chosen as the best model.
- Prediction and Application:
The trained models are saved and can be loaded for making predictions on new RWS connection configurations.
A graphical user interface (GUI) is implemented, allowing easy input of structural parameters and display of predictions. Also, the online tool is presented at https://rws-predictor-132303566239.us-central1.run.app/
- Engineering Significance:
The code predicts several critical structural parameters:
- Initial stiffness (K0)
- Yield moments (My-Plus, My-Neg)
- Various lambda factors (Lamda-S, Lamda-C, Lamda_A, Lamda_K)
- Rotation capacities (theta_p_Plus, theta_p_Neg, theta_pc_Plus, theta_pc_Neg)
- Ultimate rotations (theta_u_Plus, theta_u_Neg)
- Ductility factors (D_Plus, D_Neg)
- Practical Implementation:
The GUI allows practising engineers to quickly estimate non-composite RWS welded and bolted end-plate connection behaviour without running complex finite element analyses, potentially streamlining the design process.
The accuracy of predictions depends on the quality and range of the training data. The model's applicability outside the range of training data should be carefully considered.
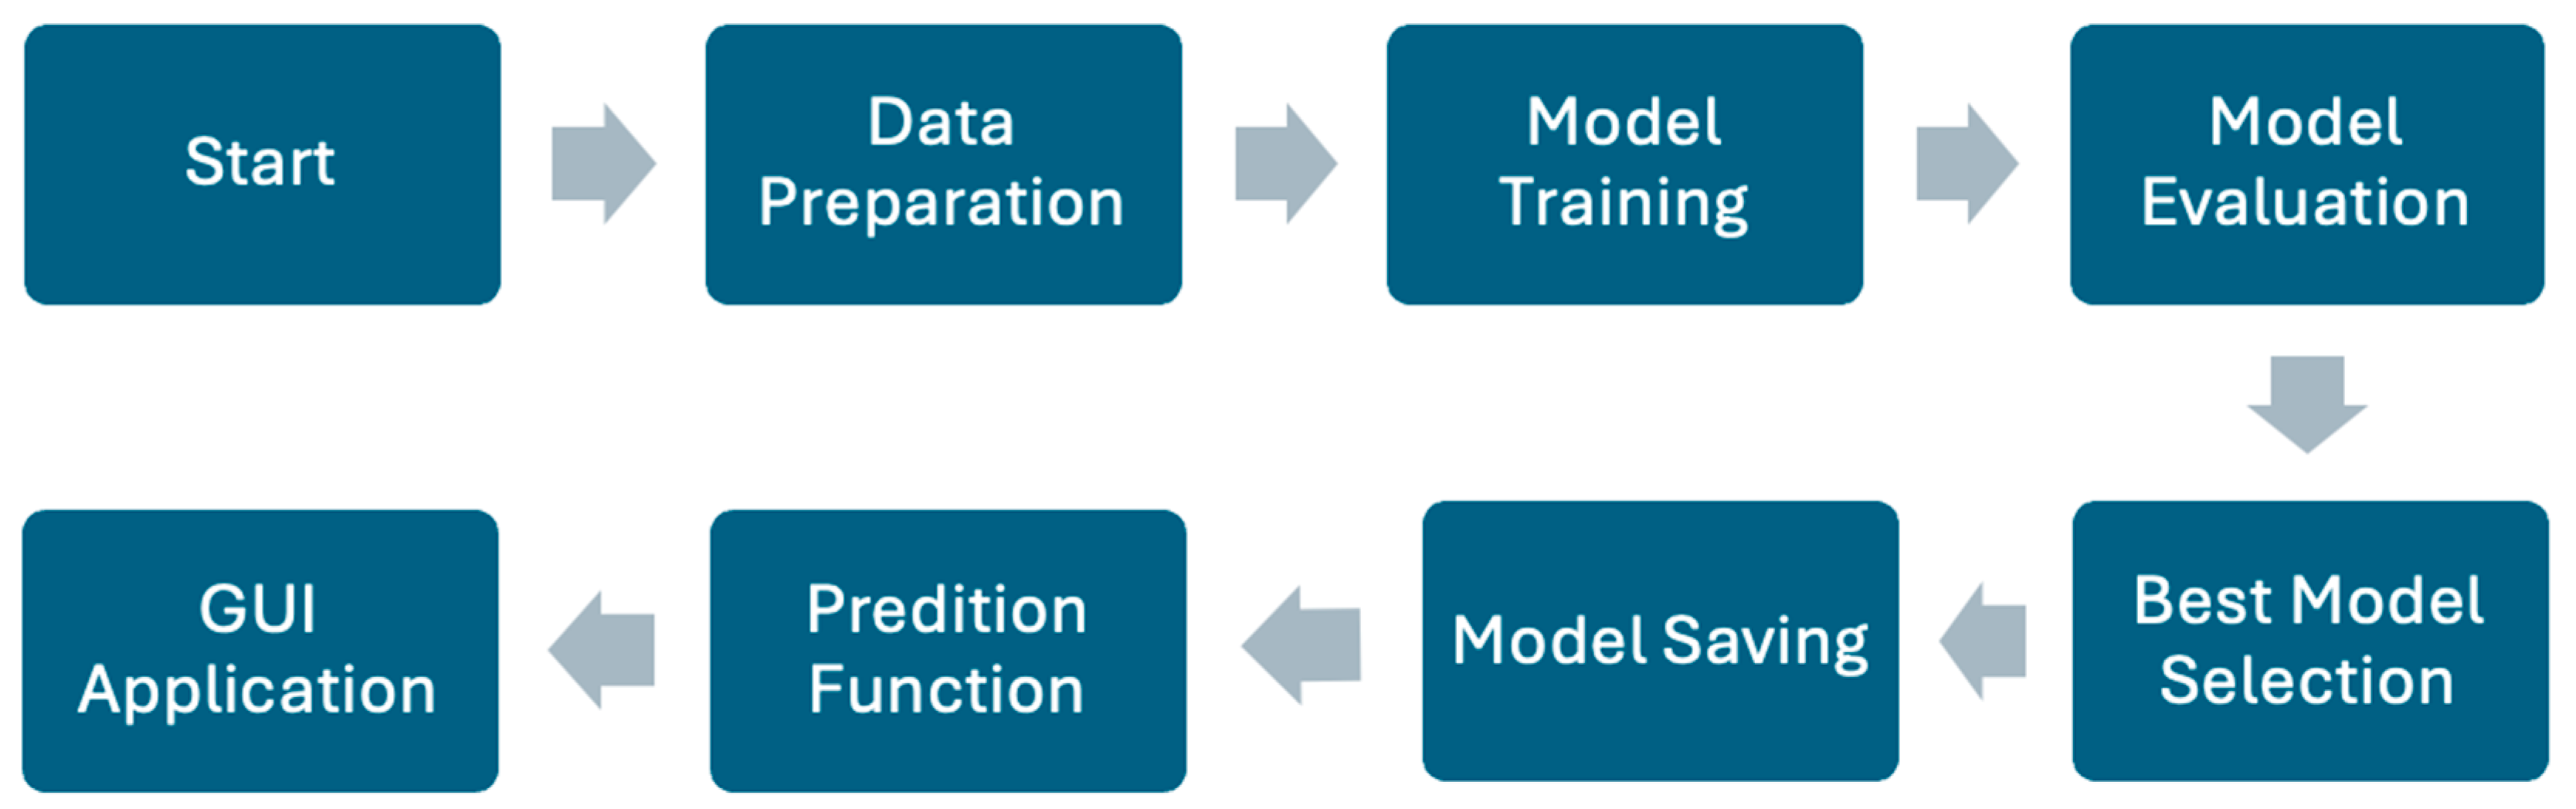
Figure 8.
Python code structure overview for choosing the best prediction model.
3.4. Results
3.4.1. Model Performance Overview
The plots compare the performance of six different models: Random Forest (RF), Neural Network (NN), Support Vector Regression (SVR), Gradient Boosting (GB), XGBoost (XGB), and Deep Learning (DL) across various error metrics.
3.4.2. MAE (Mean Absolute Error) Analysis
- XGBoost consistently shows the lowest MAE across most parameters, indicating it has the best overall accuracy.
- SVR and DL models generally have higher MAE values, suggesting they may be less suitable for this specific prediction task.
- Parameters like Lamda-C and Lamda-S show higher MAE across all models, indicating these may be more challenging to predict accurately.
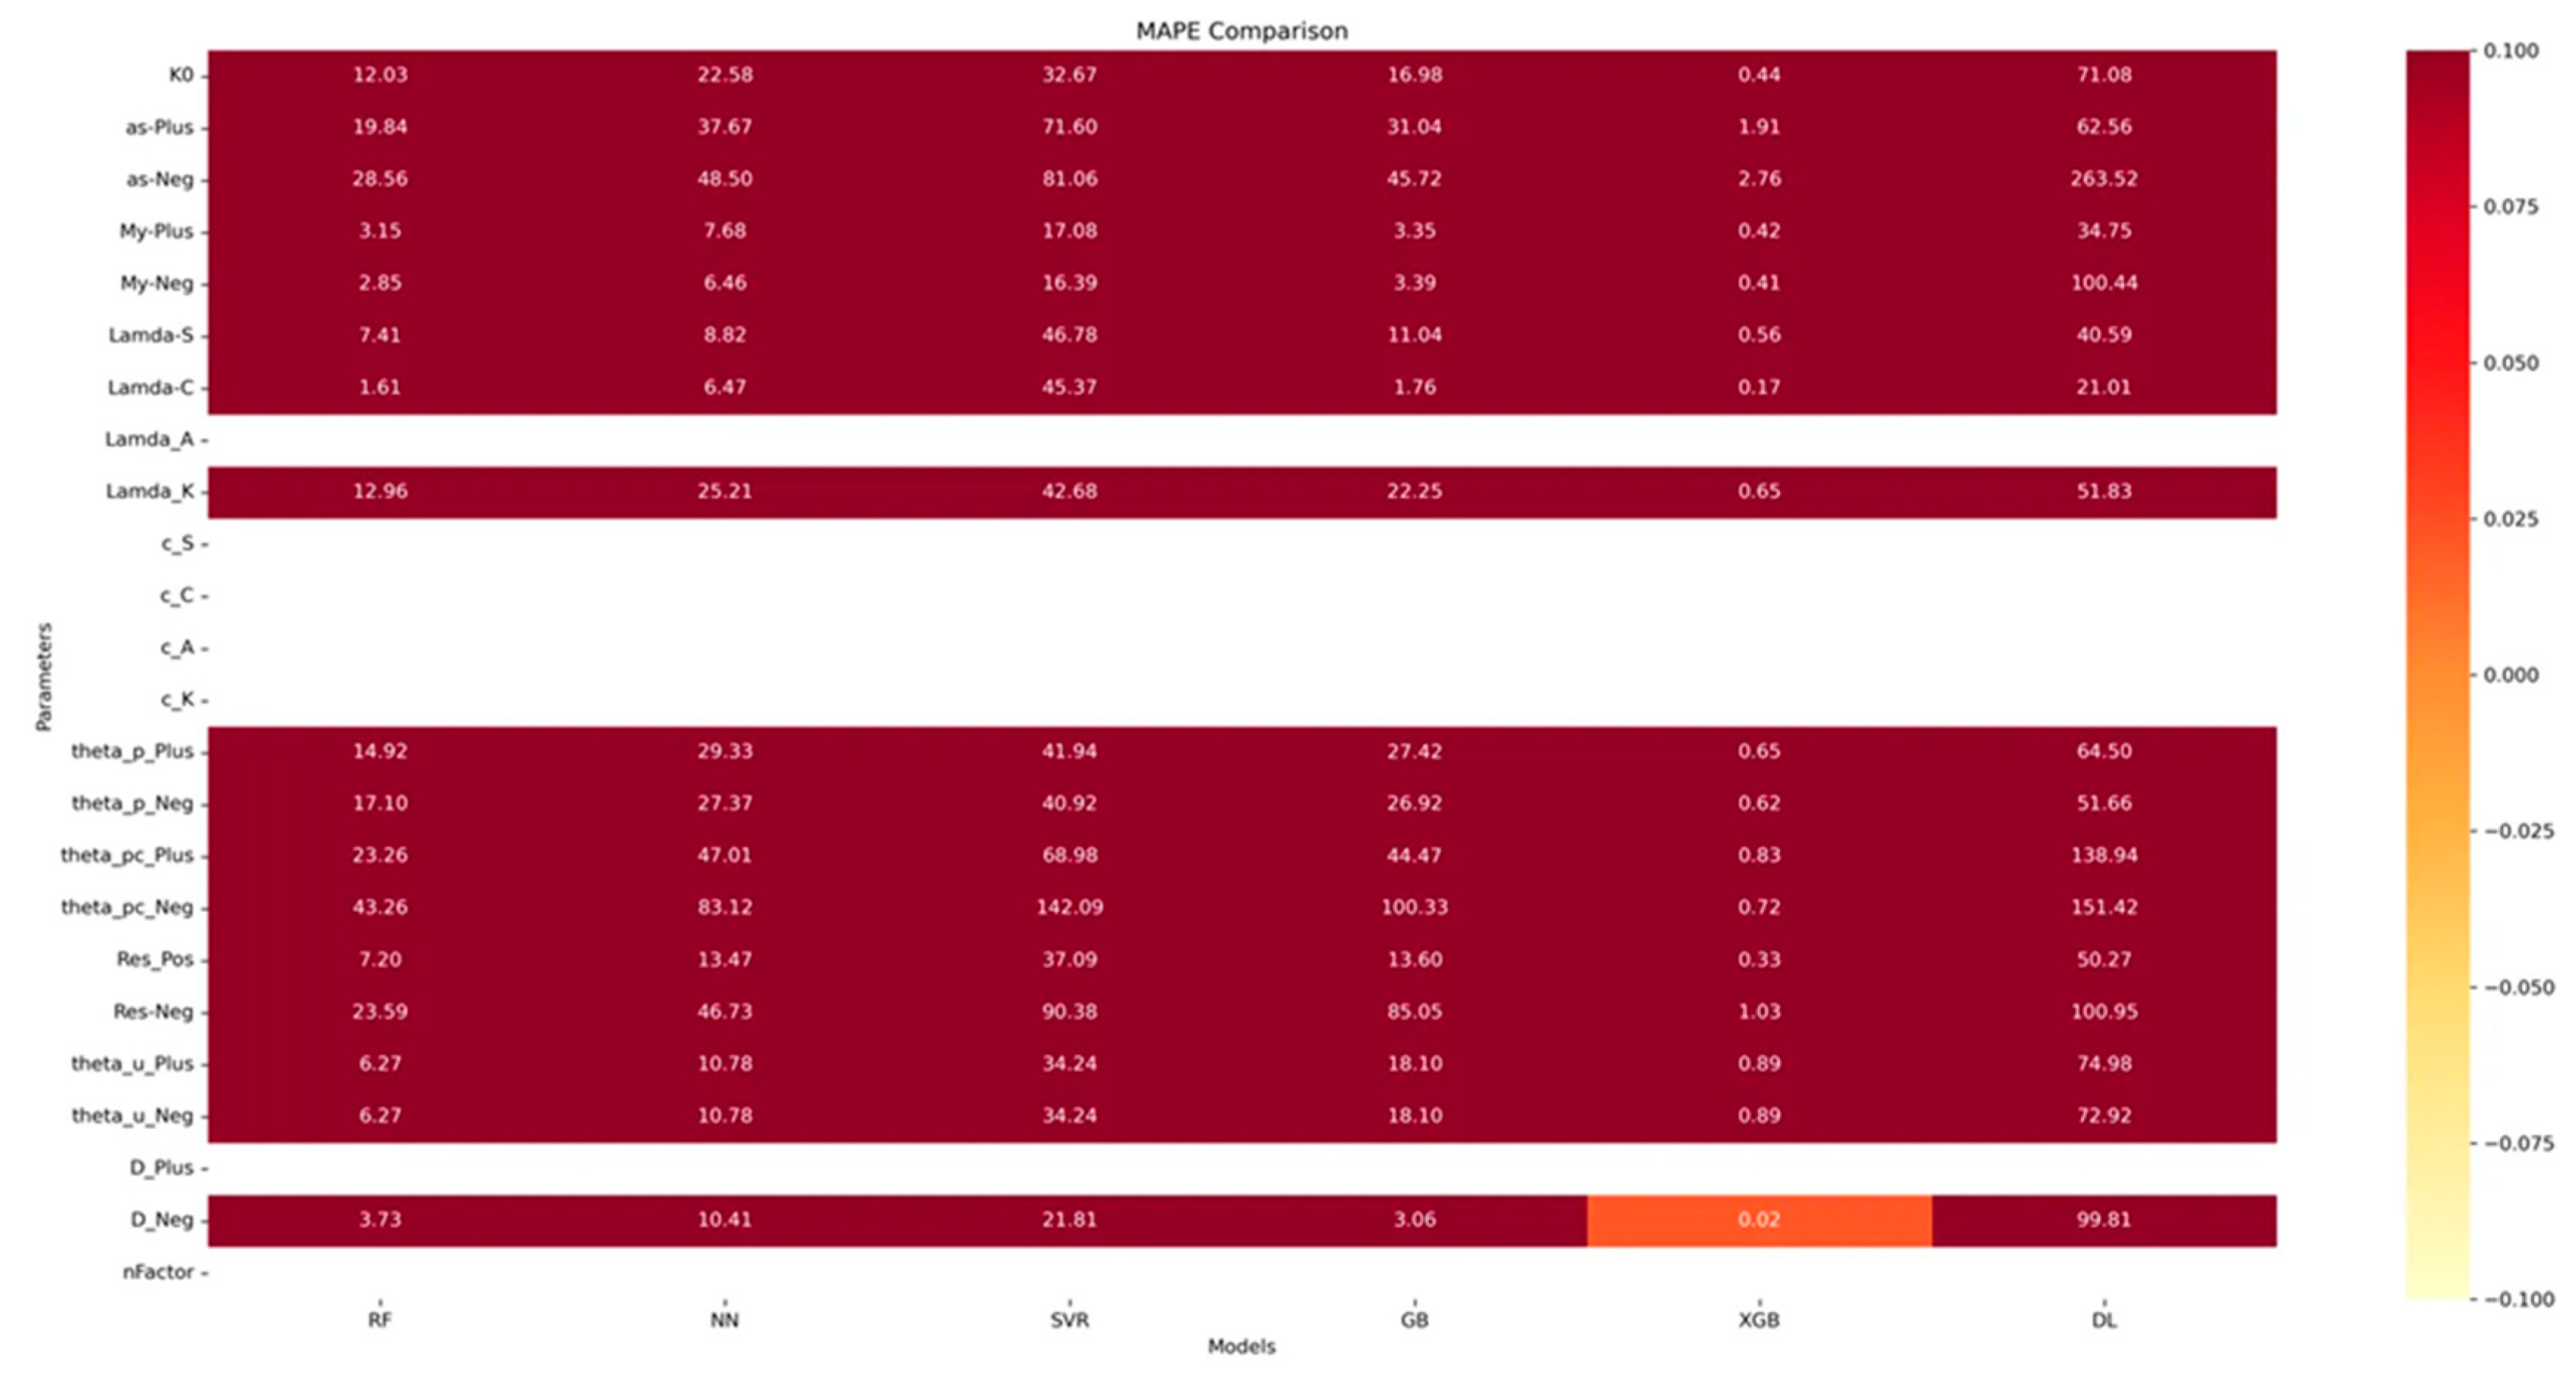
3.4.3. MAPE (Mean Absolute Percentage Error) Insights
- XGBoost again performs exceptionally well, with very low MAPE values for most parameters.
- There's significant variability in MAPE across different parameters, with some (e.g., theta_pc_Neg) showing very high errors across all models.
- The DL model shows inconsistent performance, excelling in some parameters but performing poorly in others.
3.4.4. MSE (Mean Squared Error) Observations
- The MSE plot reinforces XGBoost's superior performance, showing consistently low errors.
- SVR shows notably high MSE for certain parameters (e.g., Lamda-C, D_Neg), indicating potential outlier sensitivity.
- RF and GB models show stable performance across parameters, suggesting good generalisation.
3.4.5. R2 Score Analysis
- Most models achieve high R2 scores (close to 1) for many parameters, indicating good fit overall.
- XGBoost consistently achieves R2 scores of 1 or very close to 1, suggesting excellent predictive power.
- Some parameters (e.g., Lamda-S, D_Neg) show lower R2 scores across models, hinting at inherent difficulty in their prediction.
3.4.6. RMSE (Root Mean Square Error) Evaluation
- The RMSE plot largely mirrors the MSE plot but provides a more interpretable scale of error.
- XGBoost maintains its superior performance with consistently low RMSE values.
- Certain parameters (e.g., theta_u_Plus, theta_u_Neg) show higher RMSE across all models, suggesting these are more challenging to predict accurately.
3.4.7. Spearman Correlation Analysis
- XGBoost (XGB) consistently shows the highest Spearman correlation values across most parameters, often reaching perfect correlation (1.0). This indicates that XGBoost excellently captures the rank-order relationships between predicted and actual values.
- Random Forest (RF) follows closely, demonstrating very high correlations for most parameters.
- Traditional machine learning models (RF, NN, GB, XGB) generally outperform SVR and DL in terms of Spearman correlation.
- The Deep Learning (DL) model shows more variability in its performance across different parameters compared to other models.
- Most parameters show high correlations (>0.8) across all models, indicating generally good predictive performance.
- Lamda-C and Lamda-S show lower correlations, especially for SVR and DL models, suggesting these parameters are more challenging to predict accurately.
- The D_Neg parameter stands out with notably lower correlations across all models, indicating it might be the most difficult parameter to predict accurately.
The Spearman correlation results largely align with the observations from other error metrics (MAE, MAPE, MSE, R2, RMSE), reinforcing the overall performance ranking of the models.
Figure 9.
MAE (Mean Absolute Error) comparison across all ML and DL methods.
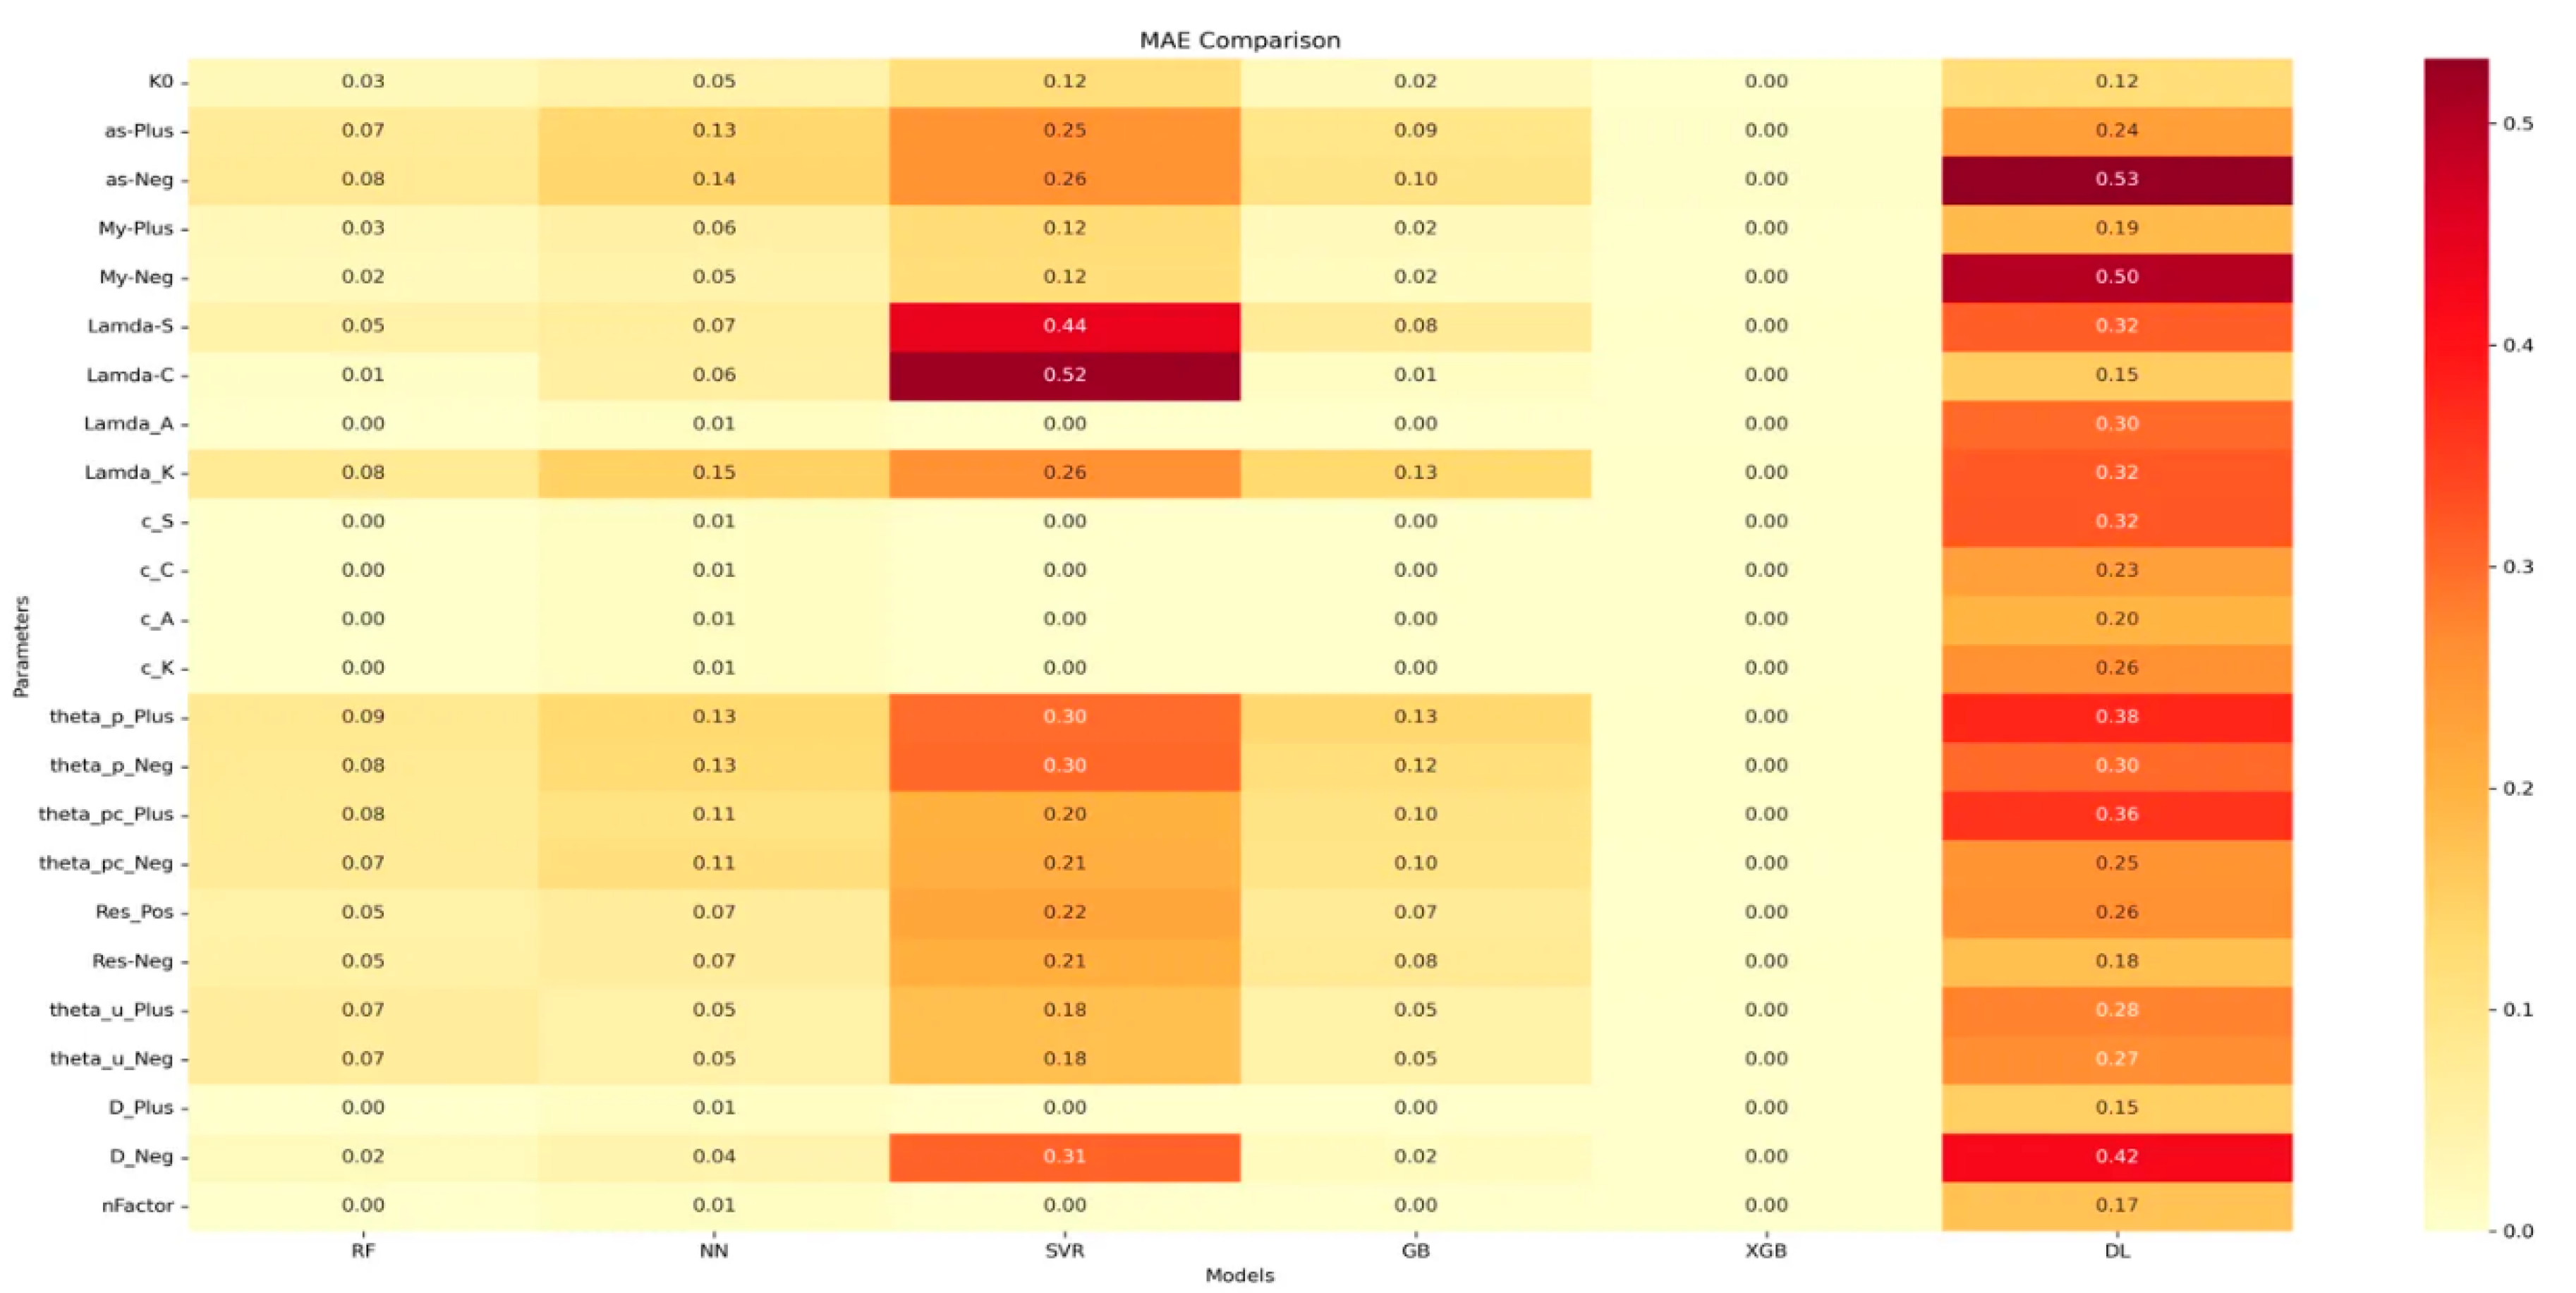
Figure 10.
MSE (Mean Squared Error) comparison across all ML and DL methods.
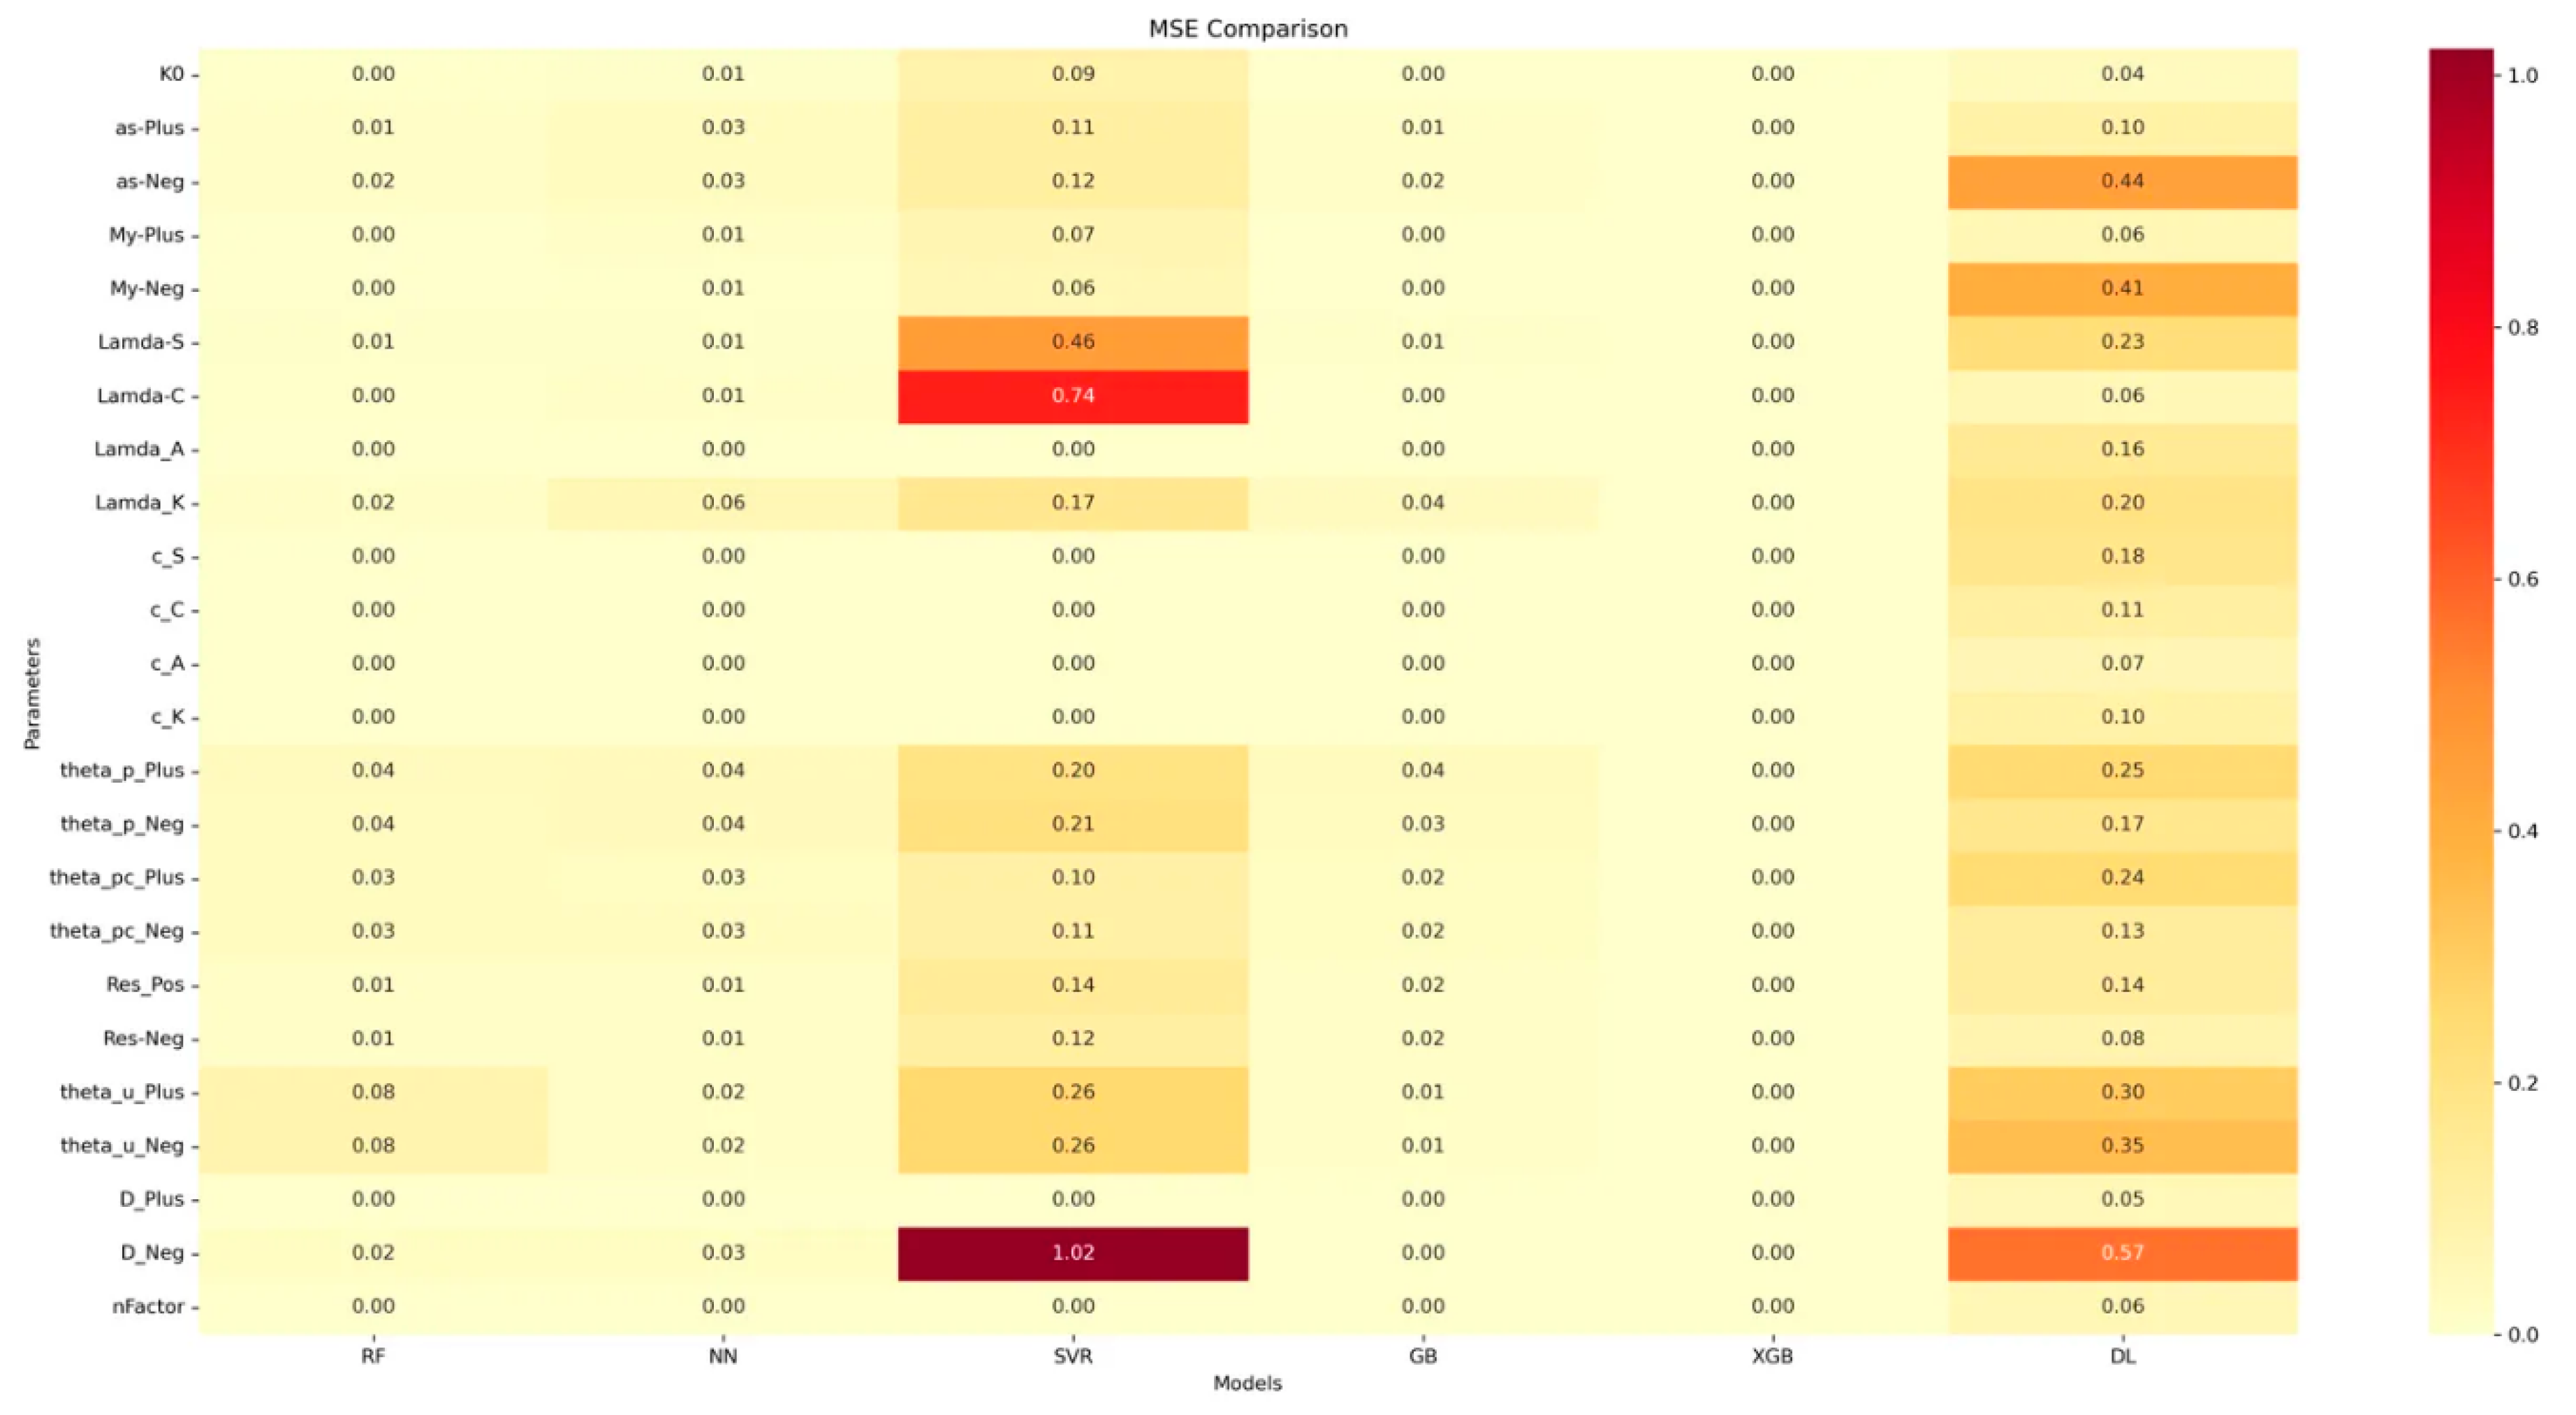
Figure 11.
R2 Comparison across all ML and DL methods.
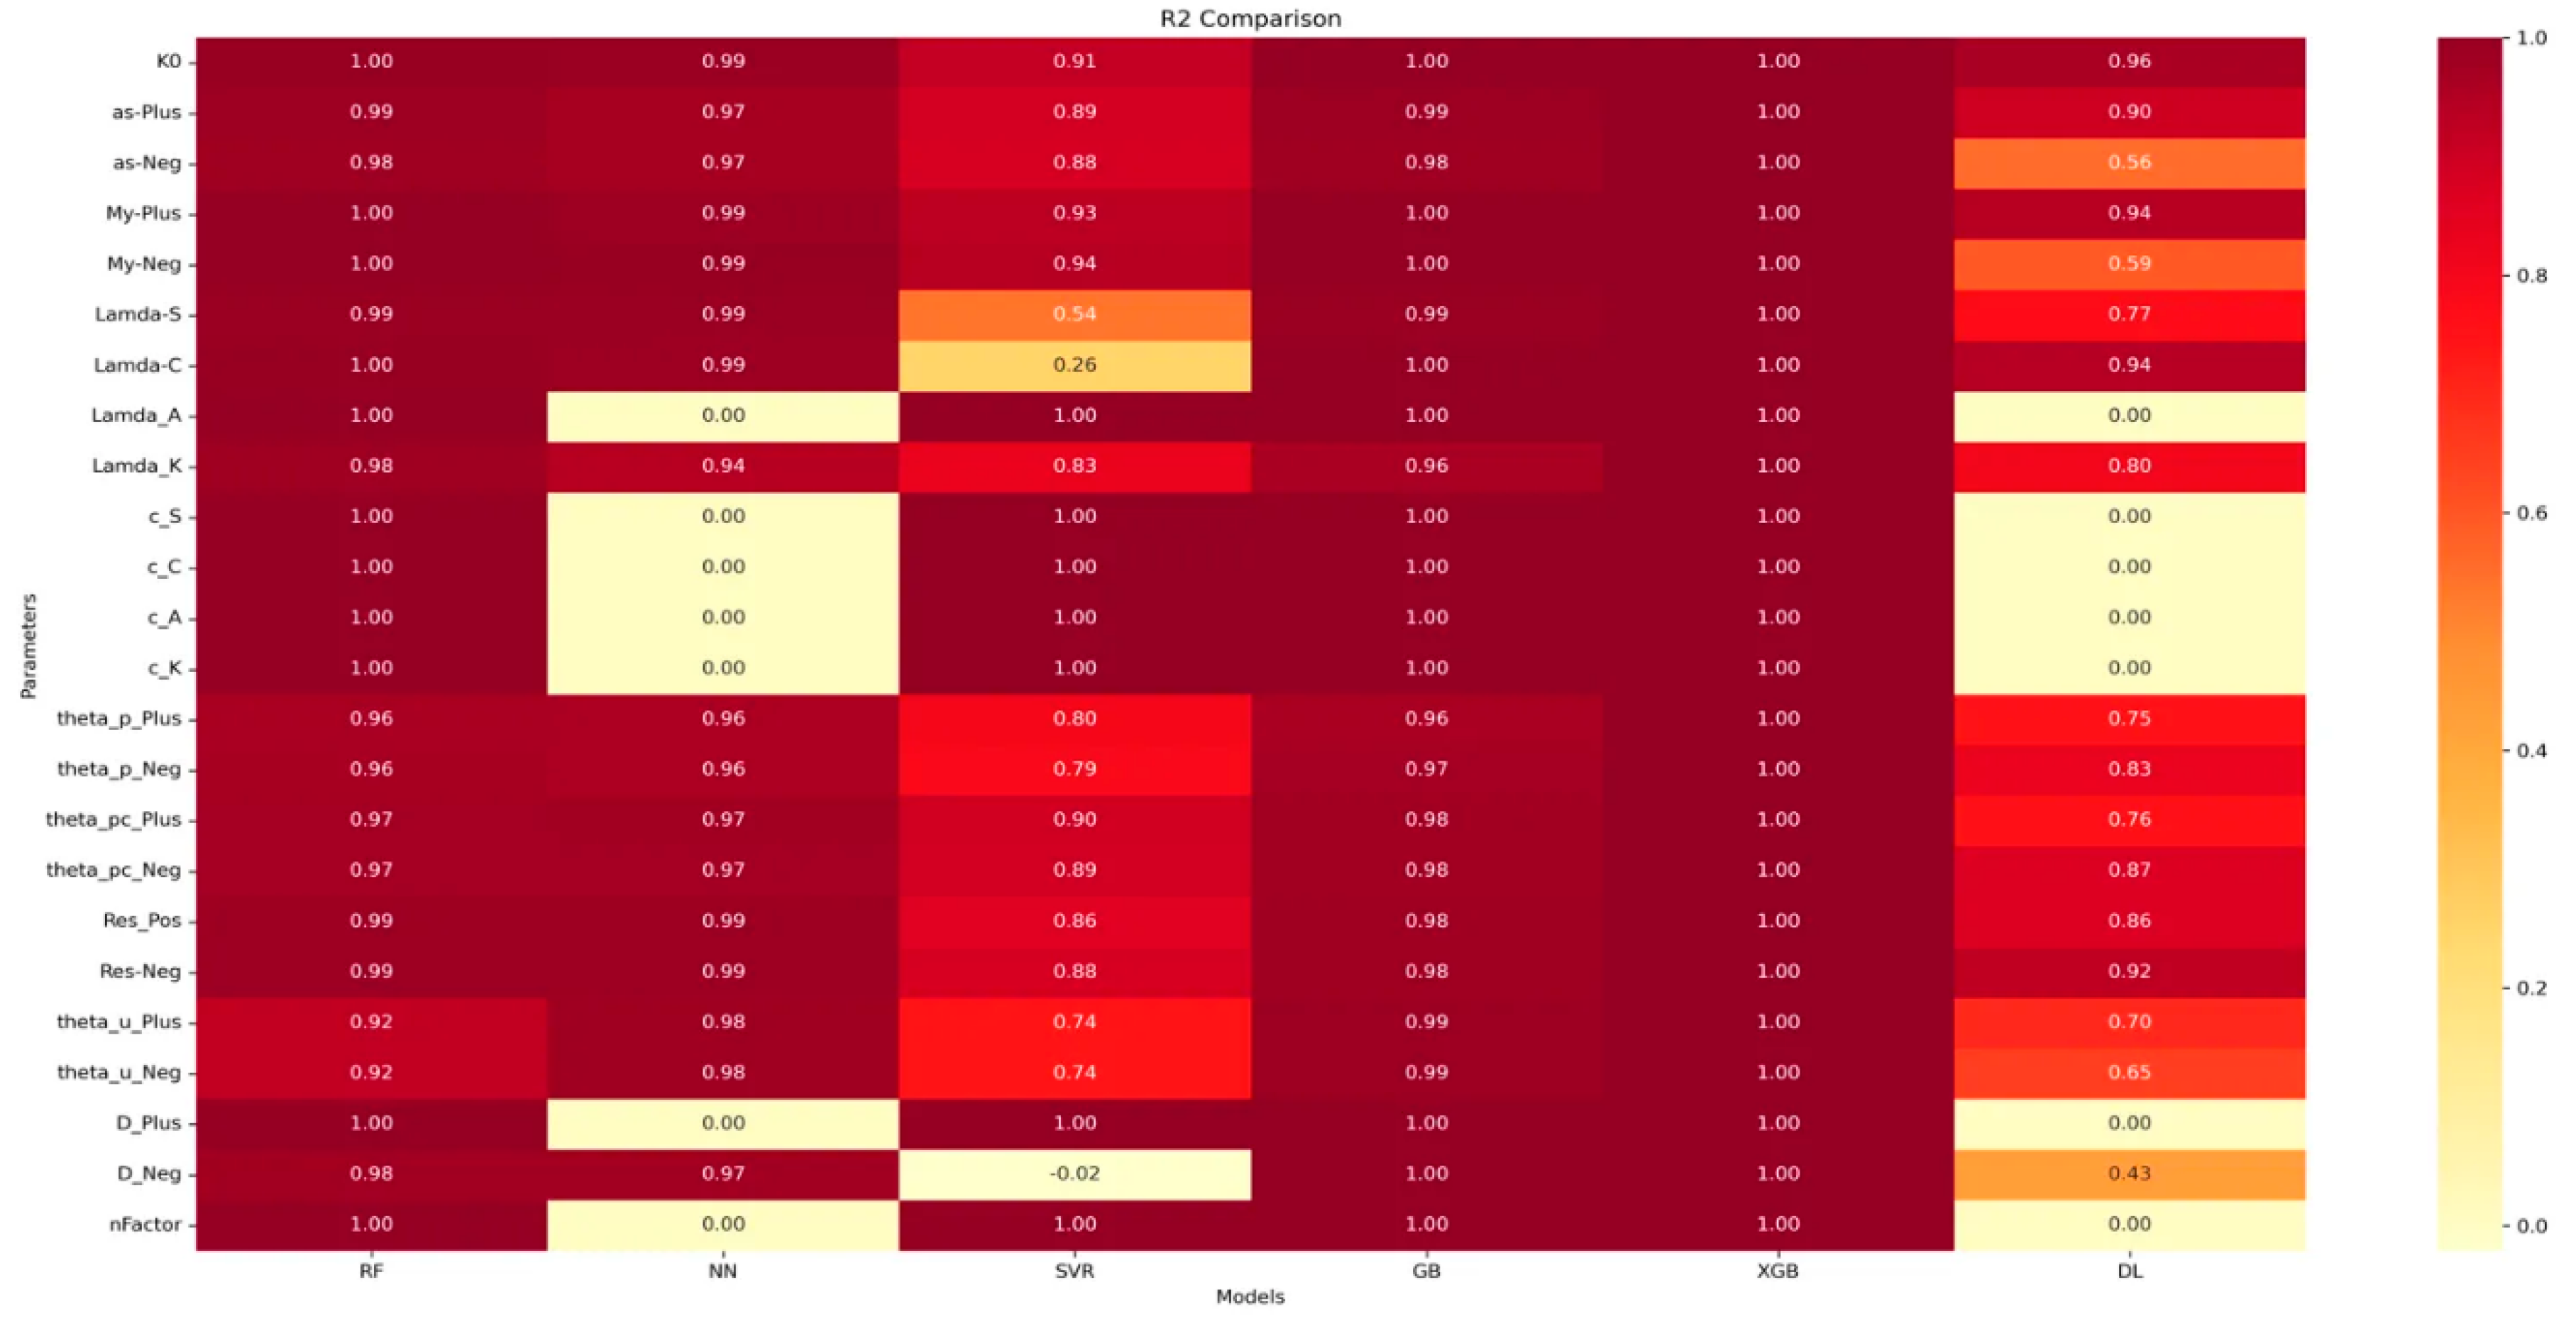
Figure 12.
RMSE (Root Mean Square Error) comparison across all ML and DL methods.
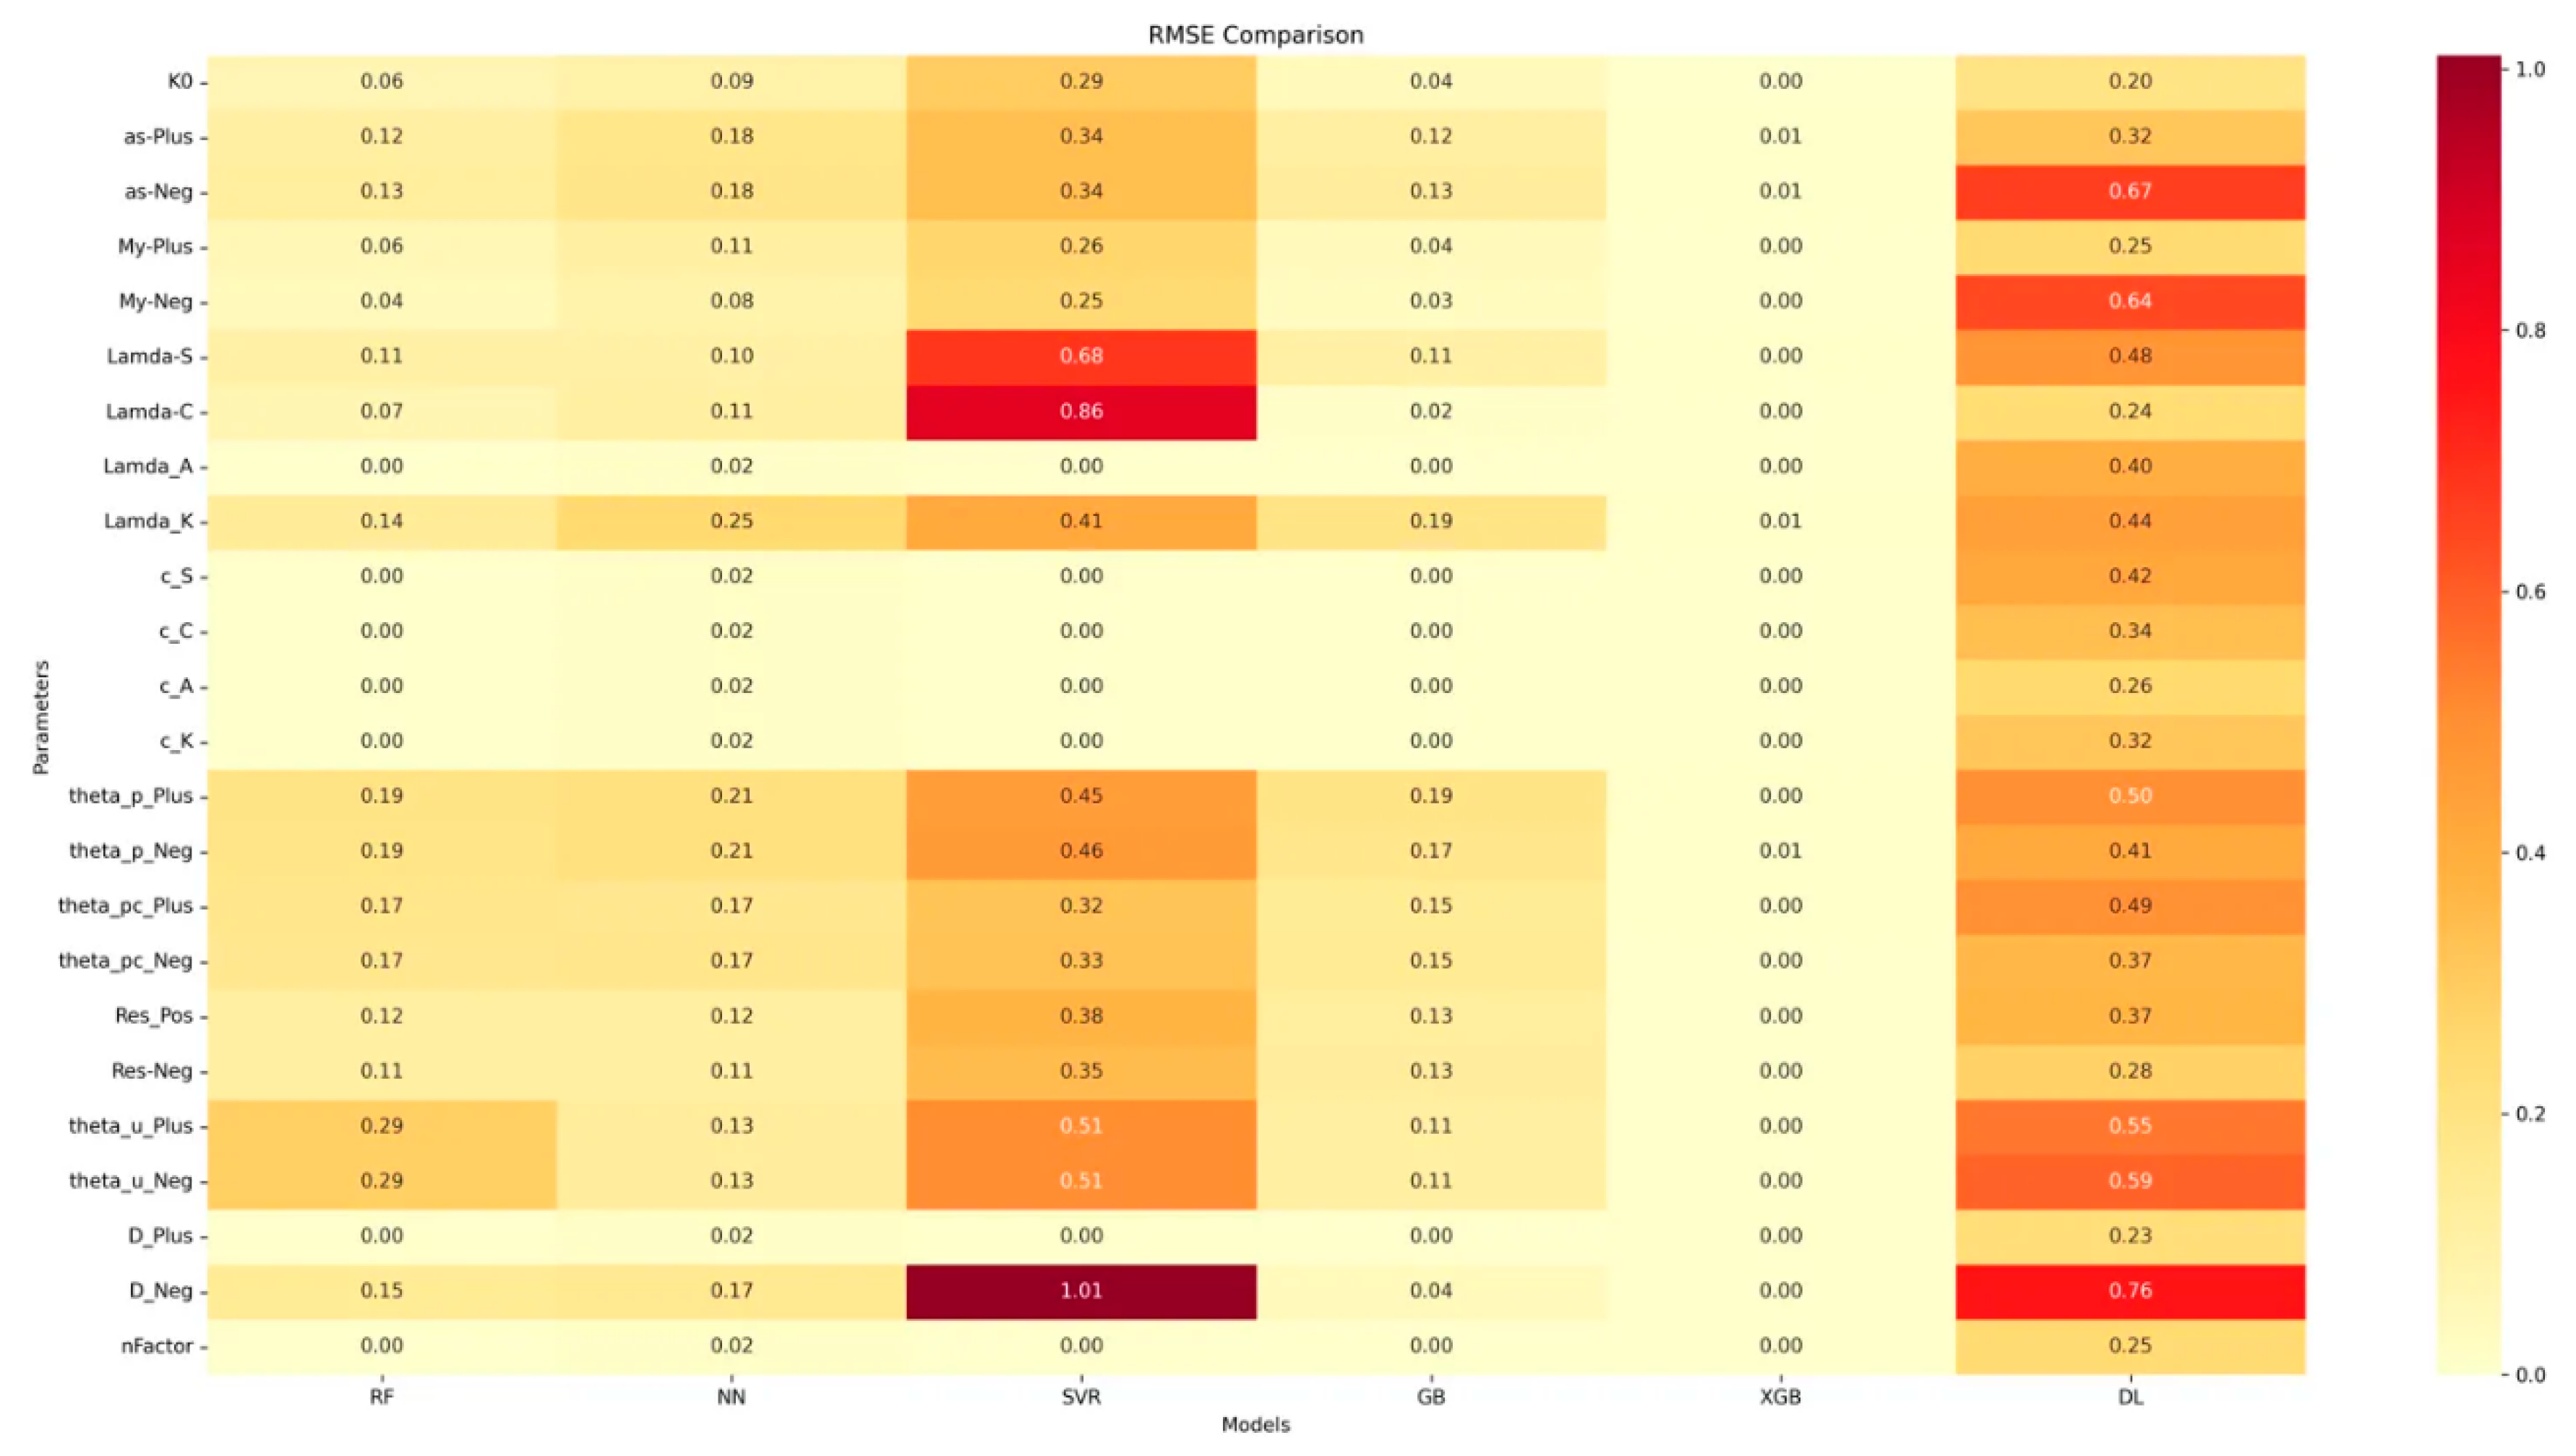
Figure 13.
Spearman correlation comparison across all ML and DL methods.
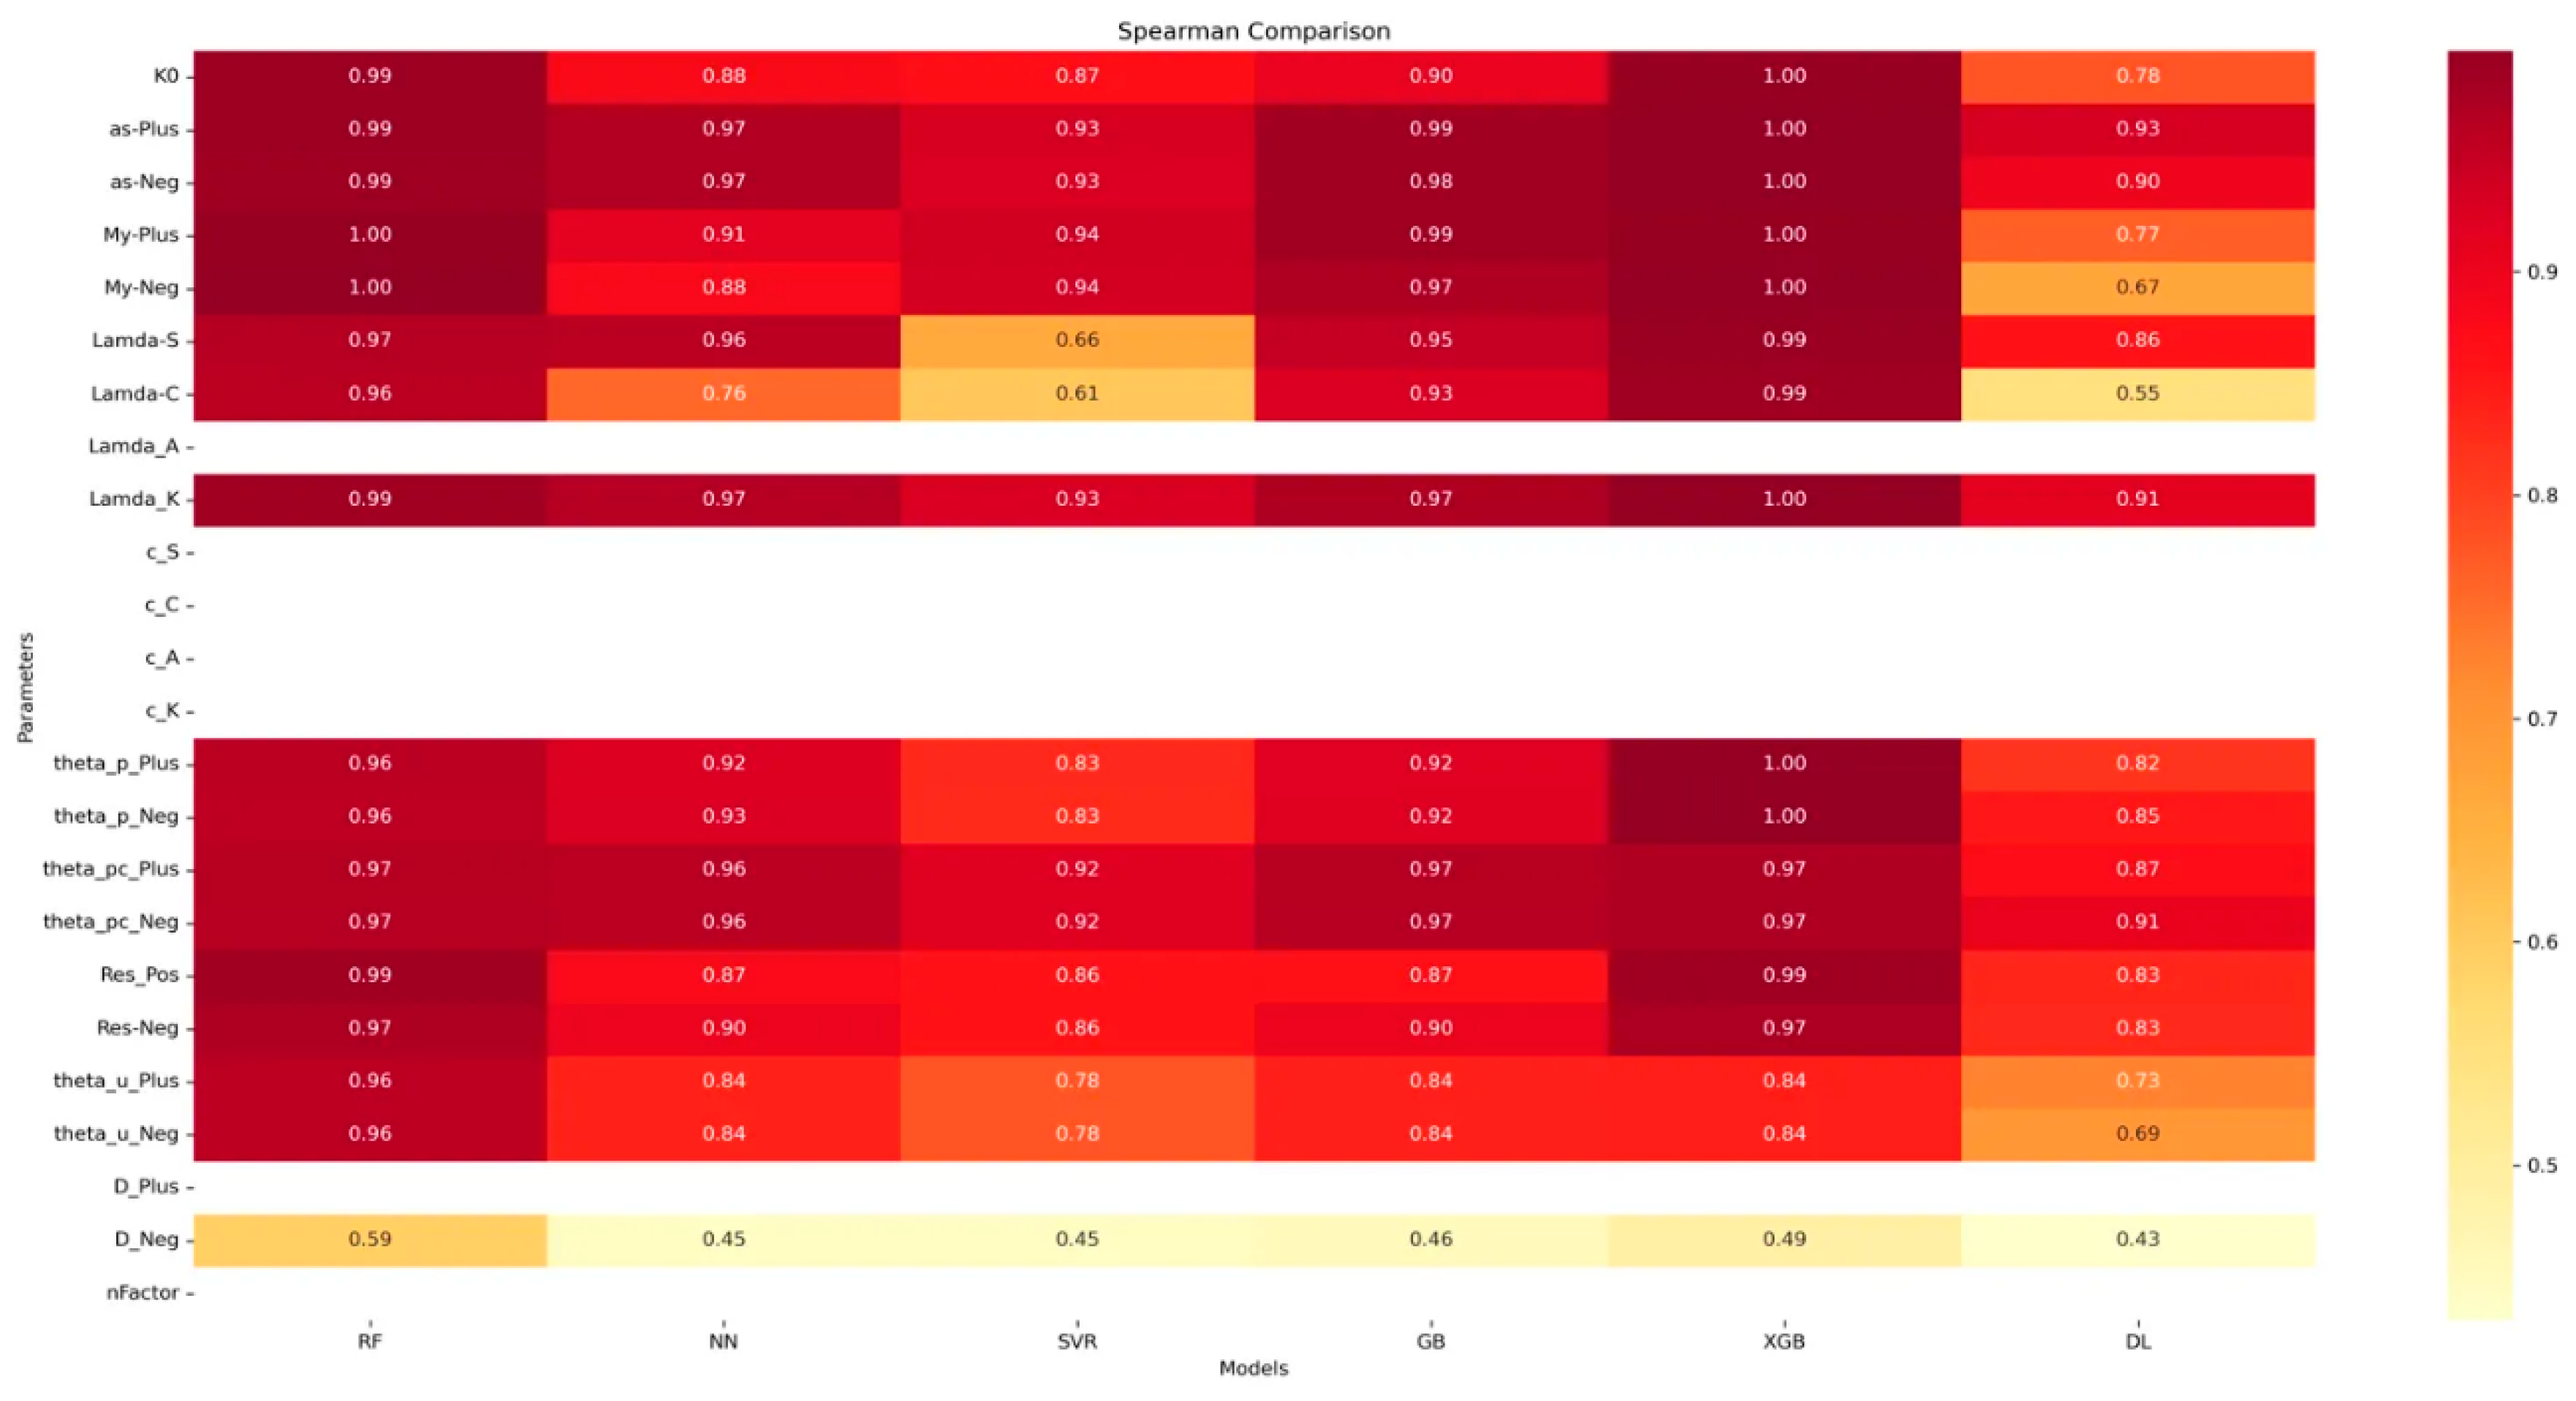
Figure 14.
MAPE (Mean Absolute Percentage Error) comparison across all ML and DL methods.
3.5. Analysis Results
Model Robustness: XGBoost and Random Forest consistently demonstrate high performance across all metrics, including Spearman correlation. This suggests these ensemble methods are particularly well-suited for capturing both the magnitude and rank-order relationships in IMK parameter predictions.
Monotonic Relationships: The high Spearman correlations for most parameters indicate that even when the models might not perfectly predict the exact values (as shown by other error metrics), they generally capture the correct trends and relative ordering of the data points.
Challenging Parameters: The consistently lower performance across all models for certain parameters (e.g., Lamda-C, Lamda-S, D_Neg) in Spearman correlation and other metrics suggests inherent complexity or variability in these parameters that makes them difficult to predict accurately.
Deep Learning Considerations: The DL model's inconsistent performance across different parameters and metrics, including Spearman correlation, suggests that for this specific problem, simpler tree-based models might be more reliable and easier to implement effectively.
Comprehensive Evaluation: The addition of Spearman correlation to our analysis provides a more complete picture of model performance, emphasising the importance of considering both error magnitude and rank-order accuracy in evaluating prediction models for IMK parameters.
Practical Implications: The high Spearman correlations suggest that even if exact values are not always perfectly predicted, the models (especially XGBoost and RF) can reliably indicate the relative performance or behaviour of RWS connections across different configurations.
3.5.1. Feature Importance Graphs
Feature importance is a measure that indicates the relative significance of each input variable (feature) in predicting the target variable in a machine learning model.
The importance of feature importance analysis:
- It helps identify which geometric or material properties have the most significant influence on each aspect of RWS connection behaviour.
- It provides insights into the underlying mechanics of RWS connections, potentially revealing relationships that are not immediately apparent from traditional analytical methods.
- It guides the focus of design considerations, highlighting which parameters engineers should prioritise when designing RWS connections for specific performance criteria.
- It can inform future research directions by identifying areas where the connection behaviour is particularly sensitive to certain properties.
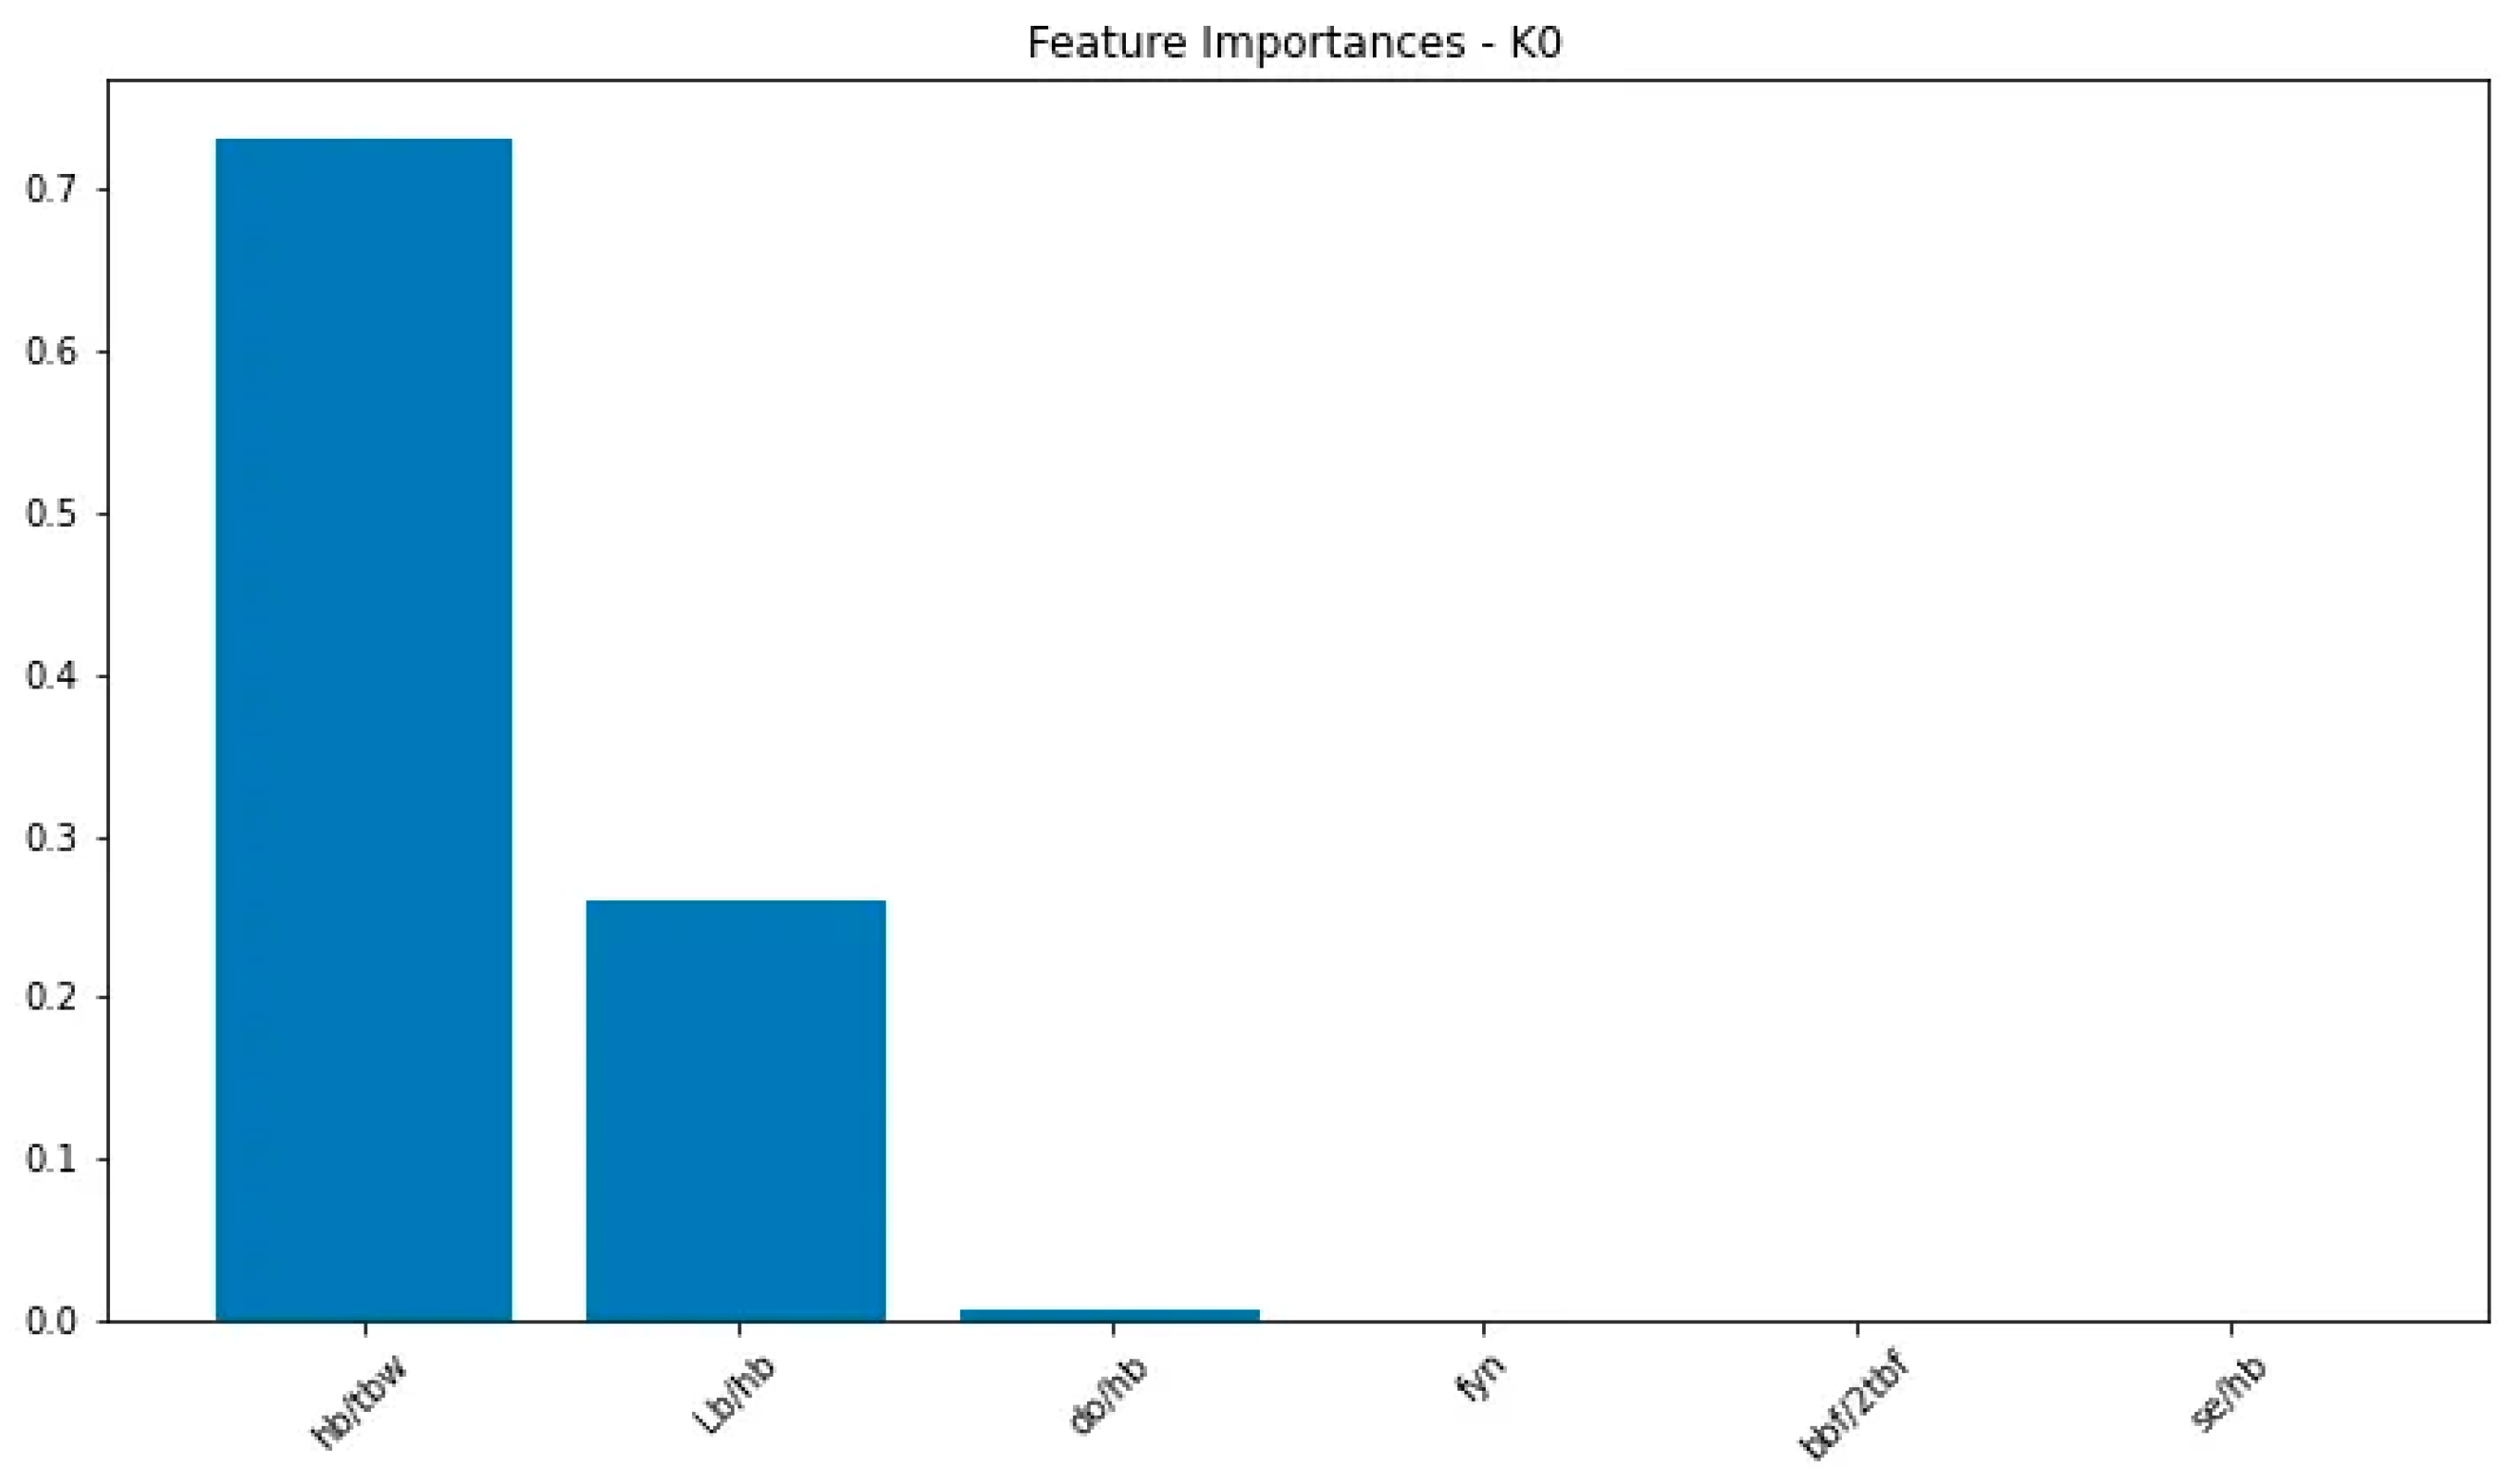
1. Initial Stiffness (K0):
- Web slenderness () is the dominant factor, followed by the span-to-depth ratio ().
- This suggests that the initial elastic behaviour of RWS connections is primarily controlled by the web properties and overall beam geometry.
2. Yield Moments (My-Plus, My-Neg):
- Web slenderness () is overwhelmingly the most important feature for both positive and negative yield moments.
- Flange properties and material yield strength have minor contributions.
- This aligns with beam theory, emphasizing the critical role of the web in determining yield capacity.
3. Post-yield Stiffness Ratios (as-Plus, as-Neg):
- Web slenderness () and span-to-depth ratio () are the most significant factors.
- The opening height ratio also plays a notable role.
- This indicates that post-yield behaviour is influenced by both local (web) and global (beam) geometries.
Figure 15.
Feature importance graph for initial stiffness (K0).
4. Strength and Stiffness Deterioration (Lamda-S, Lamda-C, Lamda_K):
- The opening-to-beam height ratio is the most crucial factor for these parameters.
- Web slenderness and span-to-depth ratio also contribute significantly.
- This highlights the importance of the RWS geometry in determining the connection's degradation characteristics under cyclic loading.
5. Plastic Rotation Capacities (theta_p_Plus, theta_p_Neg):
- Material yield strength is the dominant factor.
- Geometric properties like span-to-depth ratio, flange slenderness, and opening height ratio have secondary importance.
- This emphasises the critical role of material properties in determining the ductility of RWS connections.
6. Post-capping Rotation Capacities (theta_pc_Plus, theta_pc_Neg):
- Span-to-depth ratio () and flange slenderness are the most important features.
- The opening-to-beam height ratio also plays a significant role.
- This suggests that the post-peak behaviour is more influenced by global section properties than local web characteristics.
7. Ultimate Rotation Capacities (theta_u_Plus, theta_u_Neg):
- Span-to-depth ratio () is the dominant factor, followed by web slenderness ().
- This indicates that the ultimate deformation capacity is primarily determined by the overall beam geometry.
8. Residual Strength Ratios (Res_Pos, Res_Neg):
- Web slenderness () is the most important feature, followed closely by span-to-depth ratio () .
- The opening-to-beam height ratio also contributes significantly.
- This suggests that post-yield strength retention is a function of both local and global geometries.
3.5.2. Key Observations
- ○
- Different aspects of RWS connection behaviour are influenced by different geometric and material properties, highlighting the complex nature of these connections.
- ○
- Web slenderness and span-to-depth ratio consistently play significant roles across multiple parameters, emphasising their fundamental importance in RWS connection design.
- ○
- The opening-to-beam height ratio, which is unique to RWS connections, is crucial for many parameters, particularly those related to strength and stiffness degradation.
- ○
- The material yield strength, while not always the most important factor, plays a critical role in determining plastic rotation capacities, underlining the importance of material selection in achieving desired ductility.
These findings provide valuable insights for the design and analysis of RWS connections, offering a data-driven approach to understanding their complex behaviour under seismic loading. It can be concluded prioritising certain geometric and material properties to achieve specific performance objectives in RWS connection design.
4. Integration with Structural Analysis
4.1. Pushover Analysis
To evaluate the performance of RWS connections in a broader structural context, pushover analyses were conducted on 2-, 4-, 8-, 12-, and 20-story benchmark frames. These analyses compared the global seismic behaviour of frames with RWS and reduced beam section (RBS) connections, focusing on key performance metrics such as initial stiffness, yield strength, ultimate capacity, and ductility.
Benchmark frames are chosen from the literature [8,25] for comparing the global seismic behaviour of frames with different RWS configurations, as predicted by ML and DL methods. The comparison will focus on two RWS configurations: one with a web opening diameter of 50% and edge distance of 50% of the beam’s height, and another with a web opening diameter of 80% and edge distance of 80% of the beam’s height. By applying the newly predicted IMK parameters for these RWS configurations to the archetype frames, it will be possible to assess how the connections under investigation influence the overall seismic performance of the structures.
In this study sophisticated modelling techniques for steel special moment frames (SMFs) have been used, focusing on two key approaches: (i) panel zone modelling and (ii) equivalent gravity frame (EGF) modelling. Such methods aim to capture complex structural behaviours more accurately than simpler models.
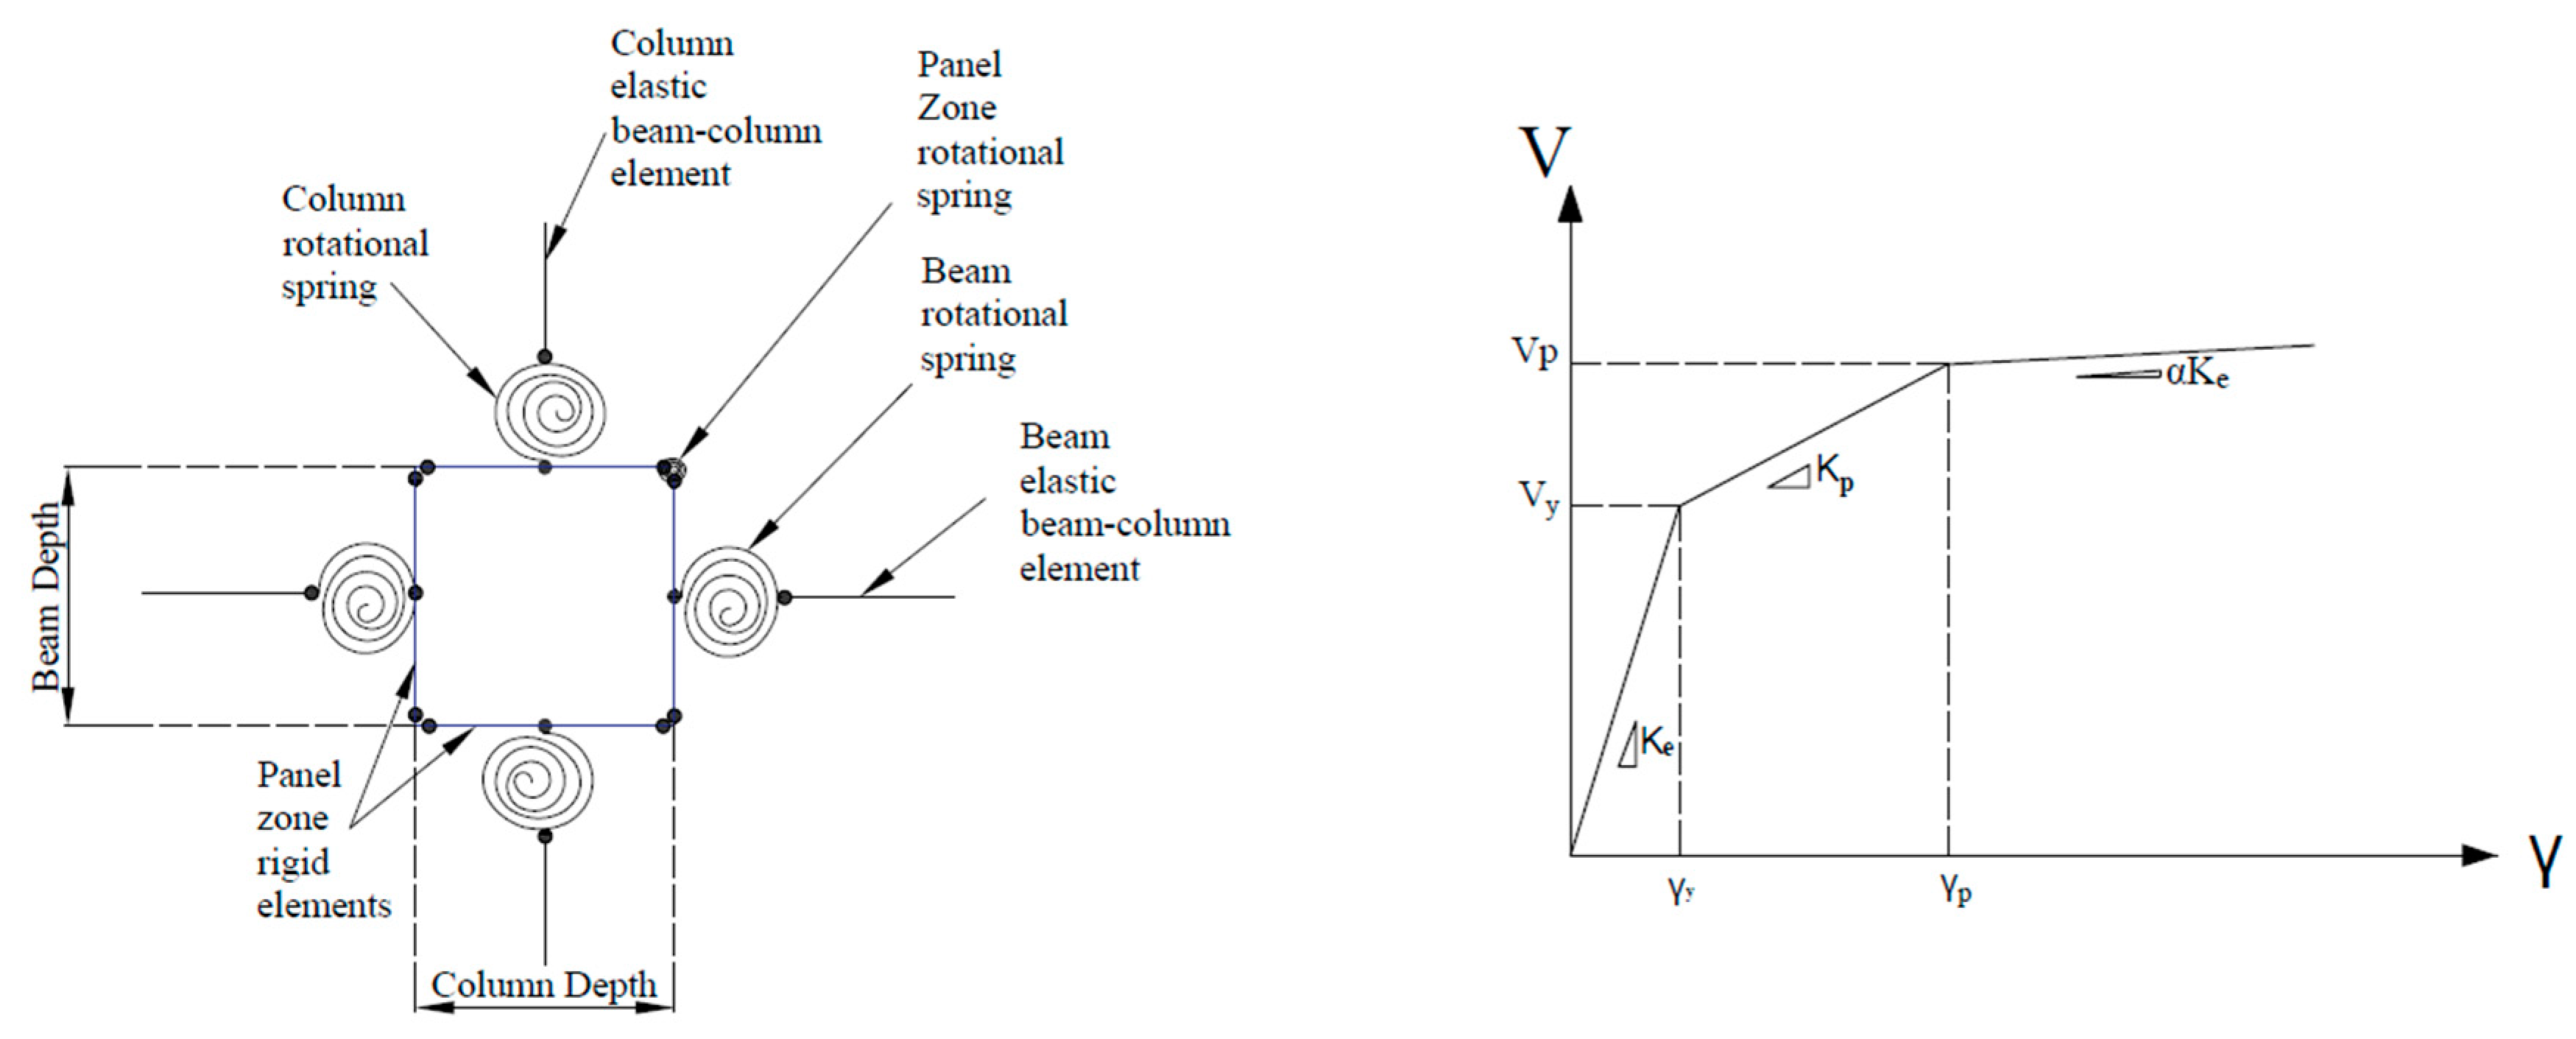
4.1.1. Panel Zone Modelling
Panel zone modelling is based on the Gupta and Krawinkler parallelogram model, which consists of rigid elements connected with flexural hinges at three corners and a nonlinear rotational spring at the fourth corner. The behaviour is characterised by a trilinear backbone curve proposed by Krawinkler, comprising:
- Elastic region: Defined by yield shear force (Vy), elastic shear stiffness (Ke), and yield rotation (γ_y)
- Post-yield region: Accounts for strength contribution from surrounding elements, characterised by post-yield stiffness (Kp)
- Post-capping region: Represents behaviour after reaching full plastic shear resistance (Vp) at a shear distortion angle (γ_p) equal to four times (γ_y), with a second post-yielding slope (Ksh)
Figure 16.
Panel zone modelling.
4.1.2. Equivalent Gravity Frame (EGF) Modelling
EGF modelling simplifies the representation of interior gravity framing to capture its contribution to the structure's lateral strength and stiffness. This approach accounts for the gravity framing system's impact on lateral resistance. It applies gravity loads to EGF columns to accurately capture P-Delta effects and captures additional overstrength provided by the gravity system. Moreover, it influences the distribution of lateral forces and deformations throughout the structure.
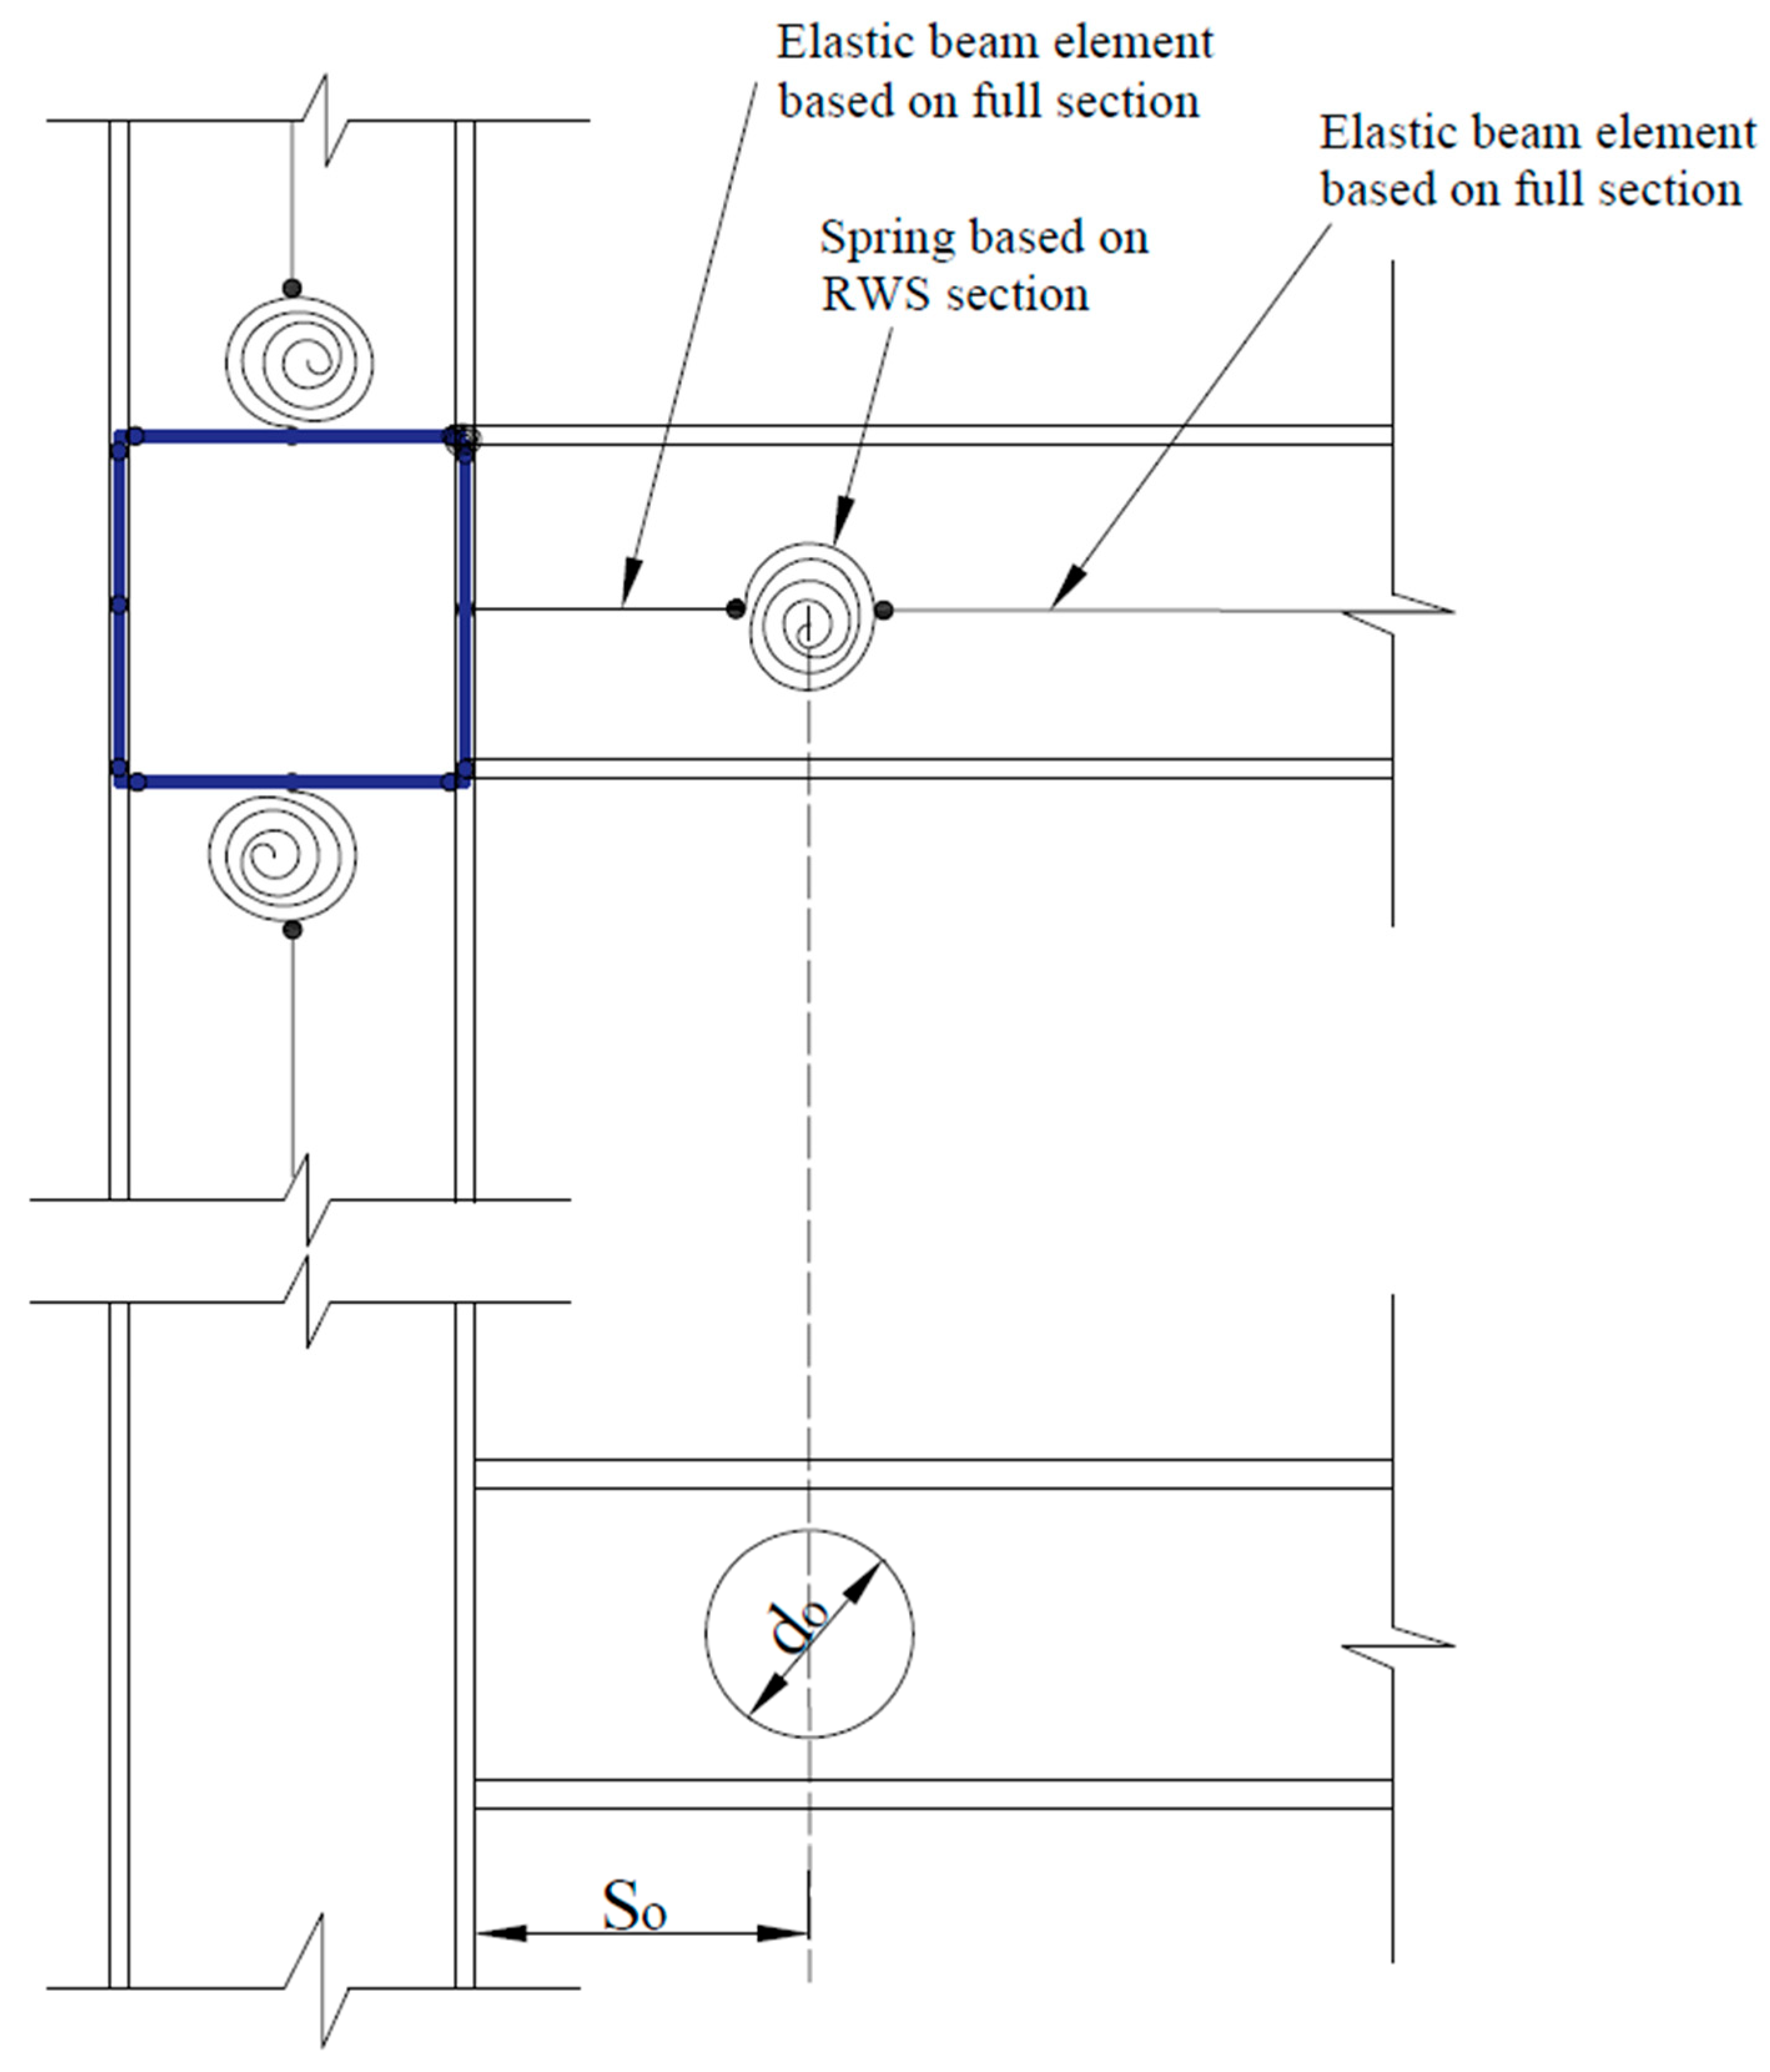
4.1.3. Integration of Modelling Techniques
The study incorporates both panel zone and EGF modelling techniques to assess the seismic performance of steel SMFs with reduced web section (RWS) connections. The IMK Bilin material is used in rotational springs to represent RWS connection behaviour. By combining these advanced modelling approaches, the research aims to provide more comprehensive and accurate predictions of structural response and collapse capacity under seismic loading, capturing important behavioural aspects that might be overlooked in simpler models.
Figure 17.
EGF modelling.
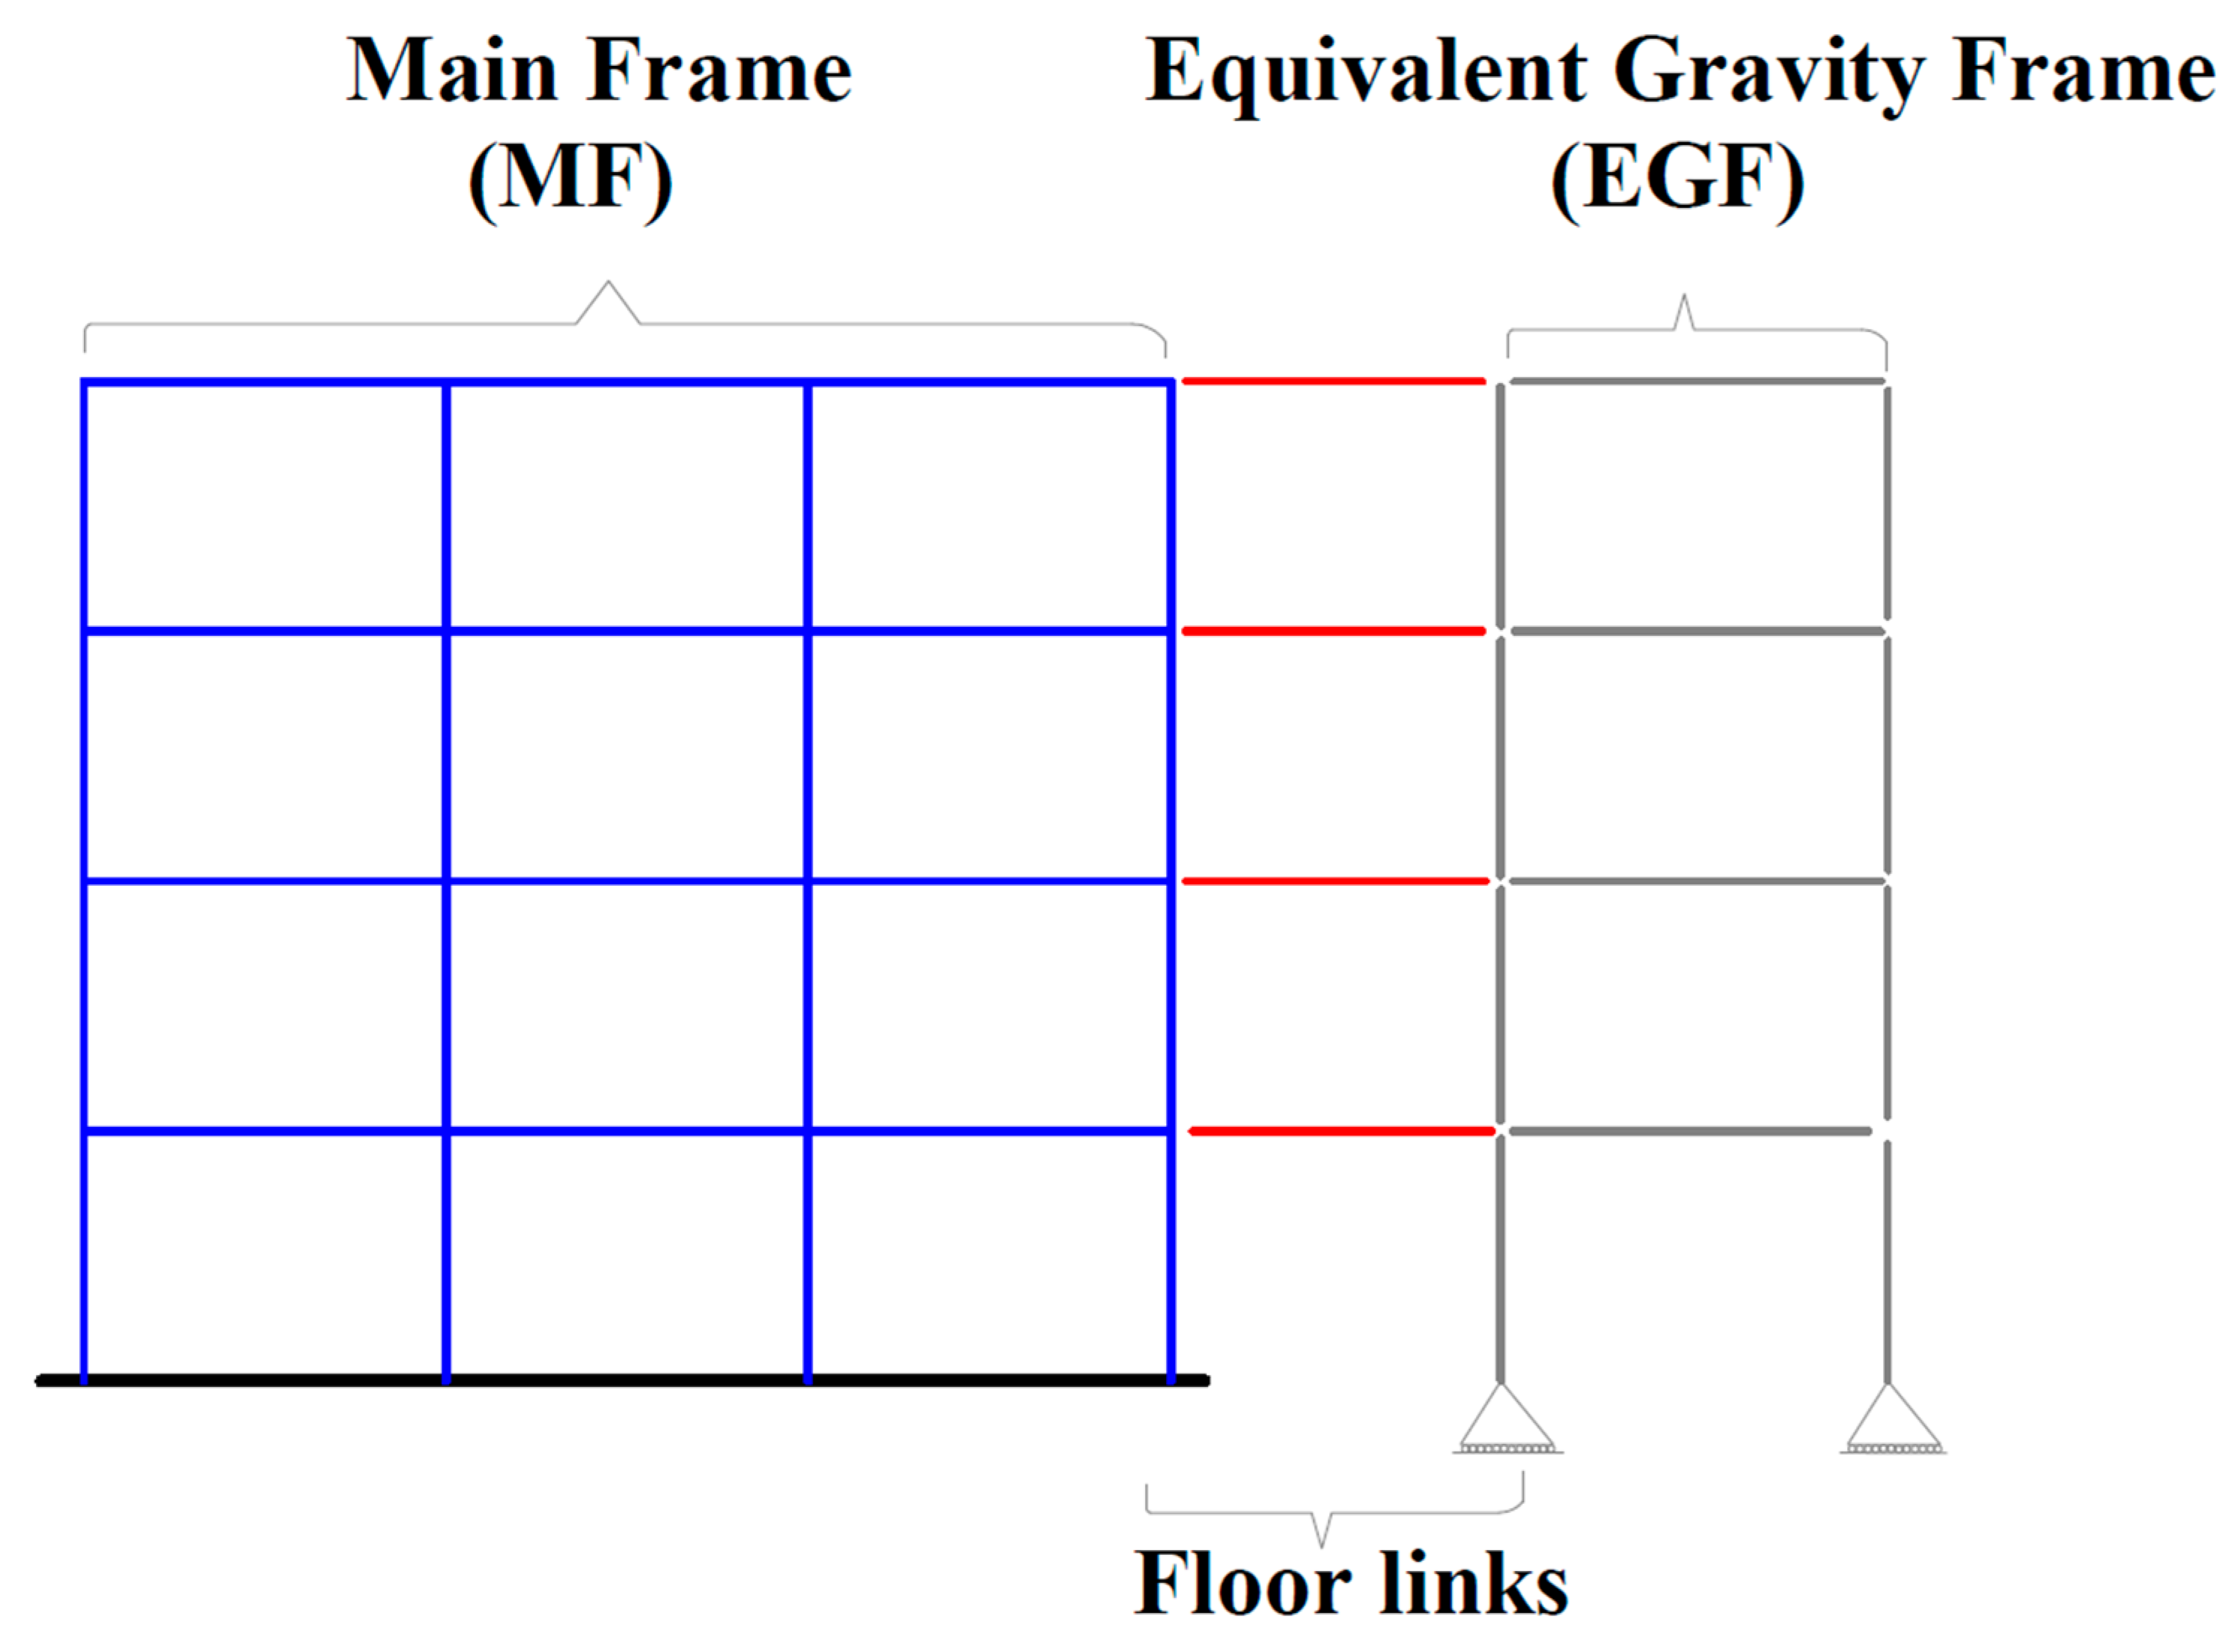
Figure 18.
RWS modelling approach in frame.
4.2. Pushover Analysis Results
The pushover curves demonstrate the comparative performance of Reduced Beam Section (RBS) connections and two configurations of Reduced Web Section (RWS) connections: one with a web opening diameter of 50% of the overall height of the beam and edge distance of 50% of the overall height of the beam (RWS-do=50%-So=50%), and another with a web opening diameter of 80% of the overall height of the beam and edge distance of 80% of the overall height of the beam (RWS-do=80%-So=80%).
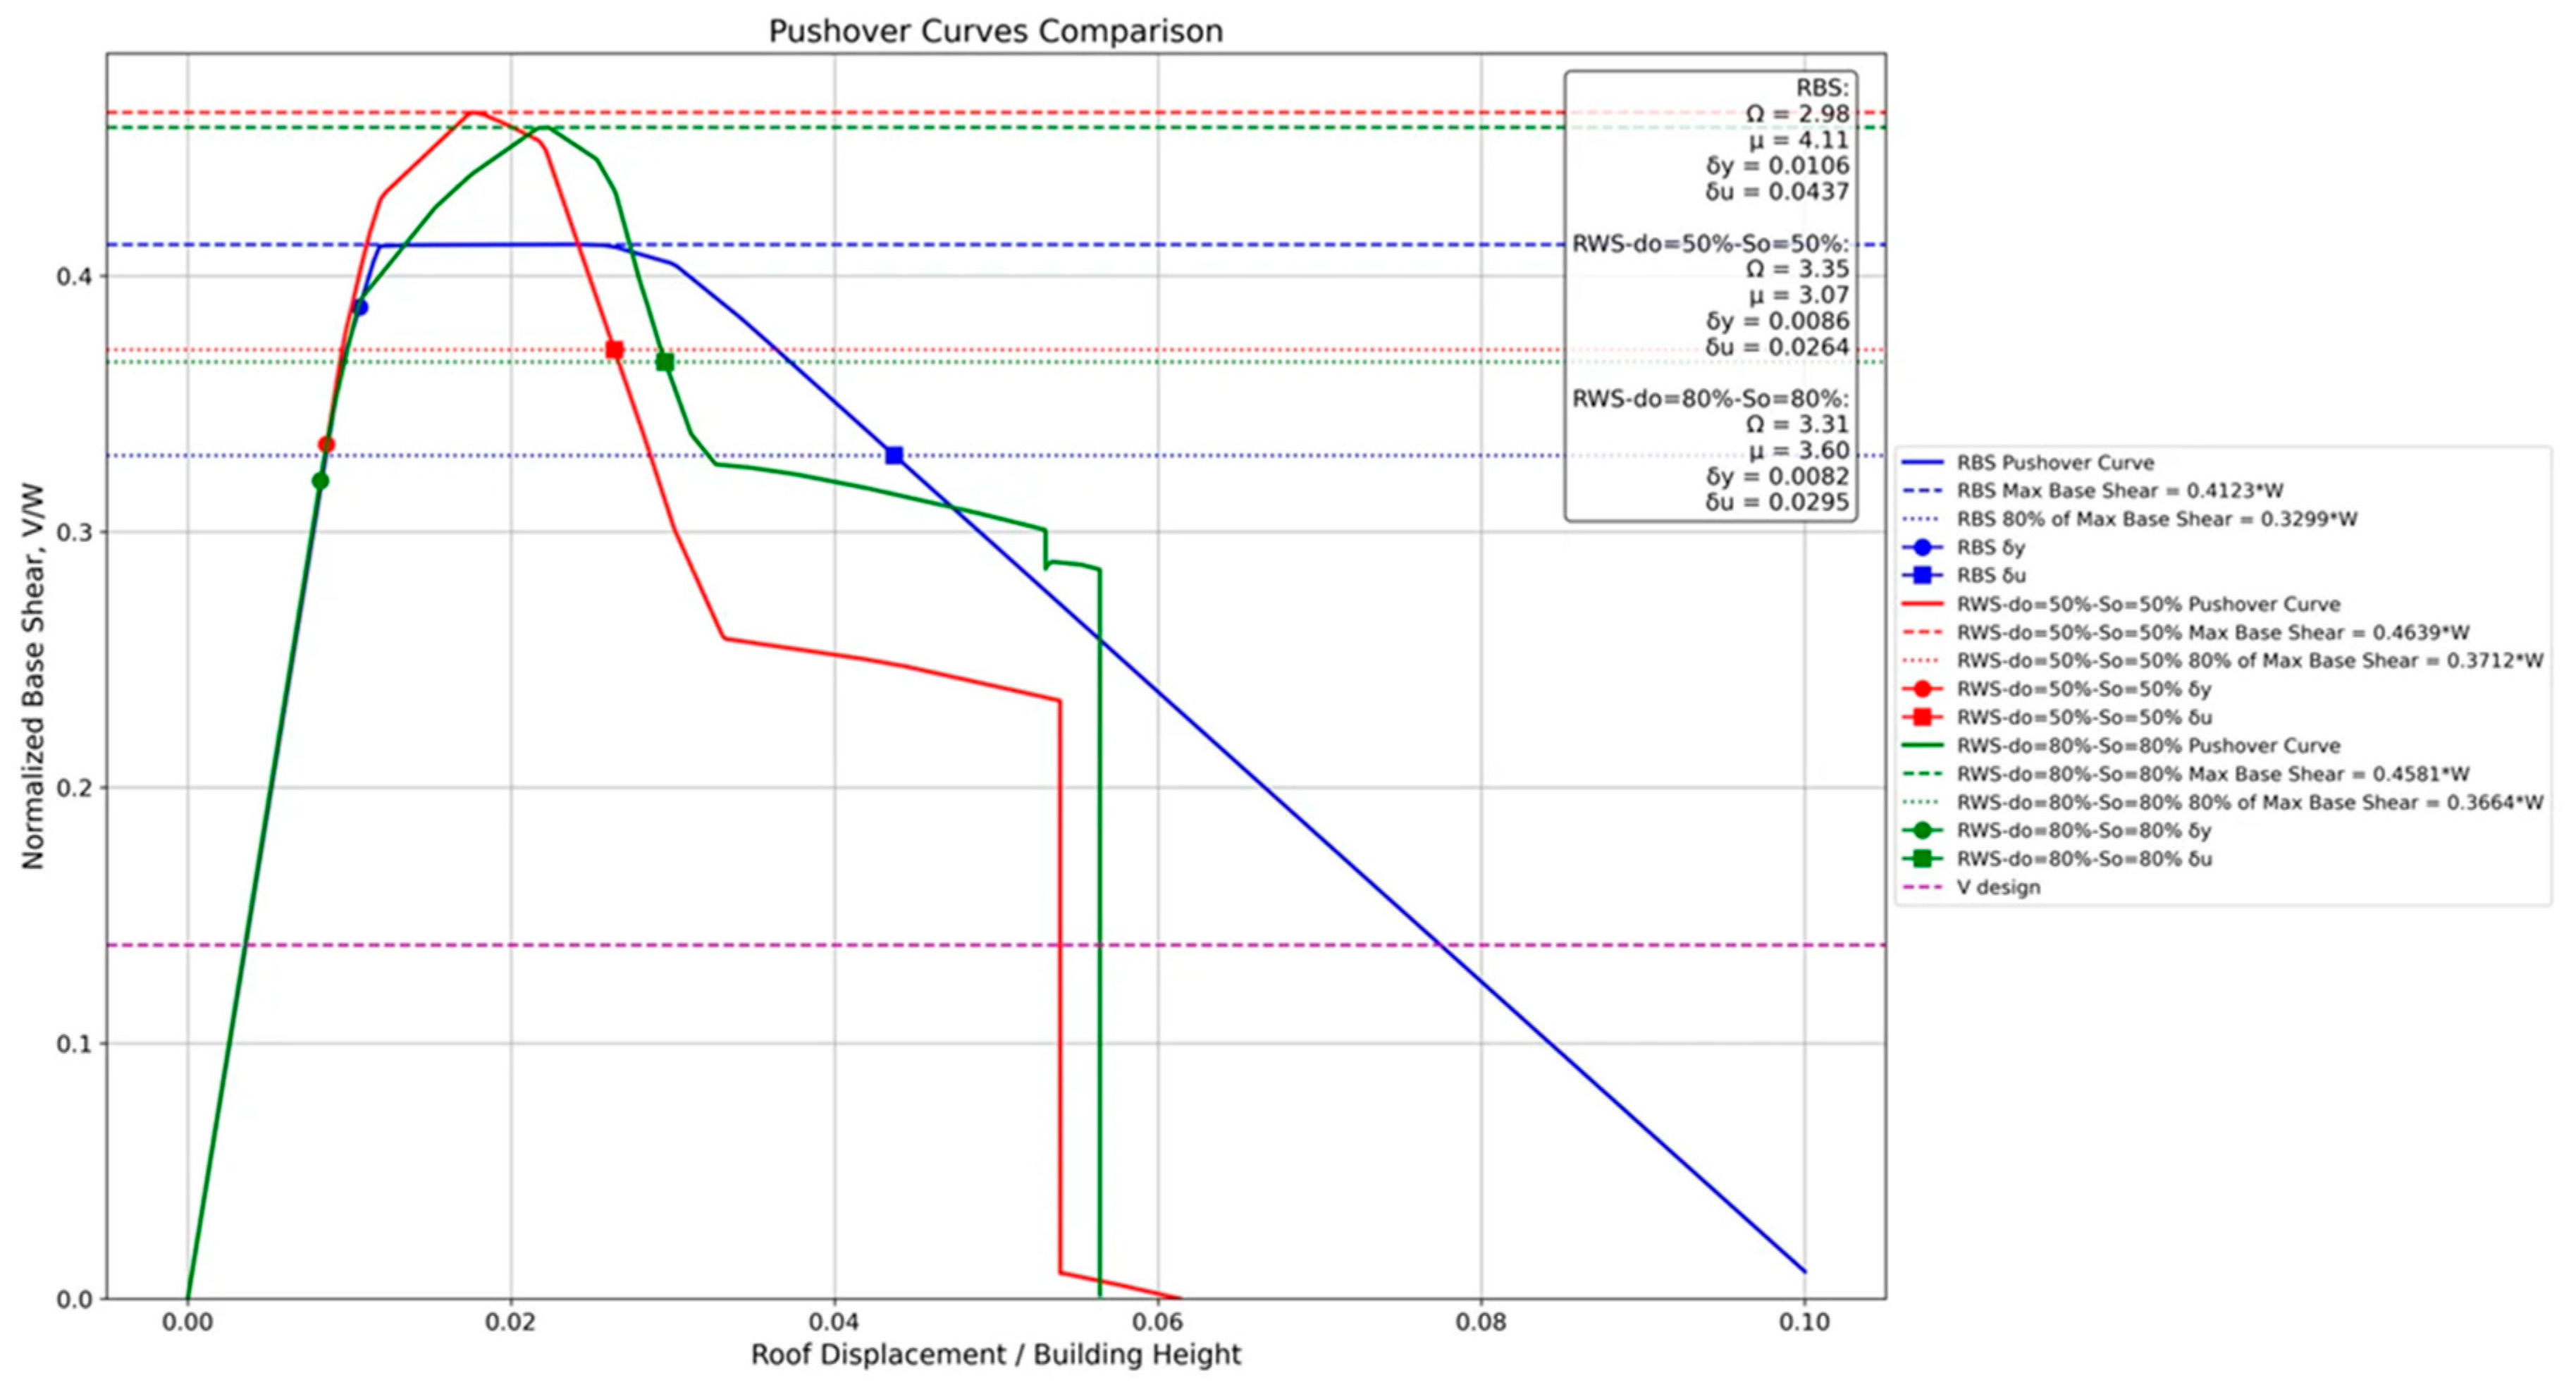
4.2.1. 2-Story Frame
RWS connections exhibited higher initial stiffness and peak strength compared to the RBS connections. RWS configurations also showed higher overstrength factors (Ω = 3.35 and 3.31) compared to RBS (Ω = 2.98).
Moreover, they demonstrated earlier strength degradation, but this is due to the imposed ultimate rotation limit of 0.05, while RBS connections continue to 0.2. The ductility (μ) of RWS connections is lower than RBS but still exceeds the minimum required performance.
Figure 19.
2-story frame pushover analysis curves.
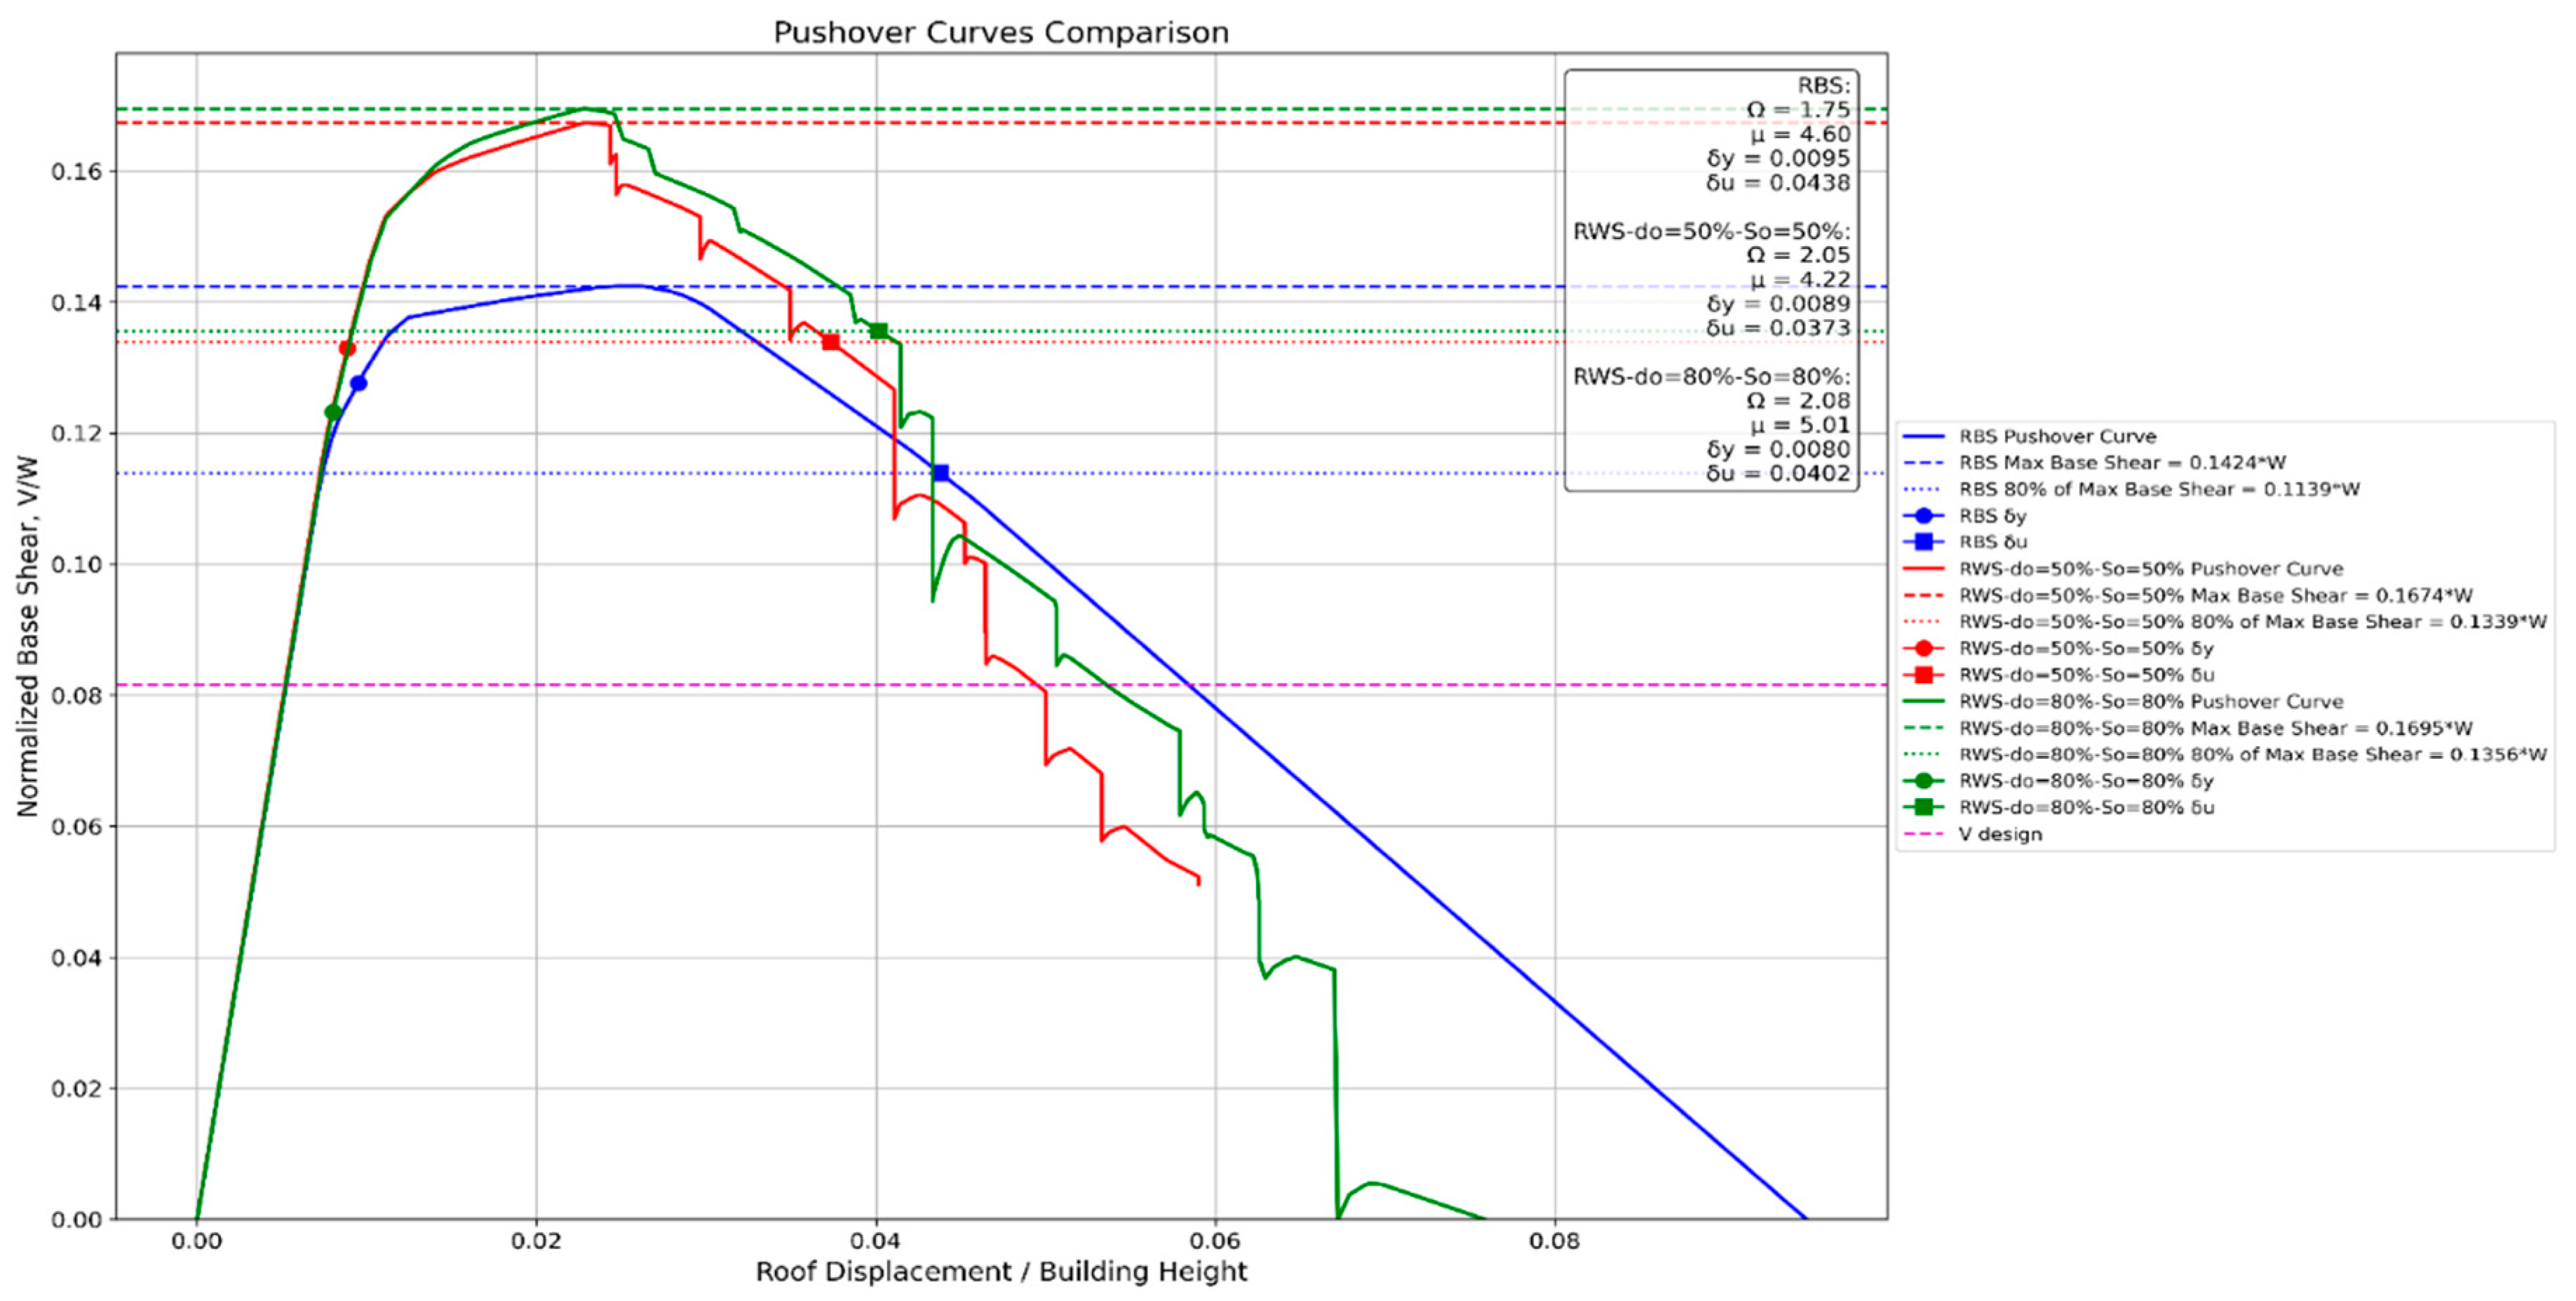
4.2.2. 4-Story Frame
For these frames, all connection types show similar initial stiffness, but RWS configurations achieved higher peak strength. The overstrength factors for RWS (Ω = 2.05 and 2.08) were higher than RBS (Ω = 1.75). RWS connections also exhibited more pronounced post-peak behaviour, indicating potential for energy dissipation.
Figure 20.
4-story frame pushover analysis curves.
4.2.3. 8-Story Frame
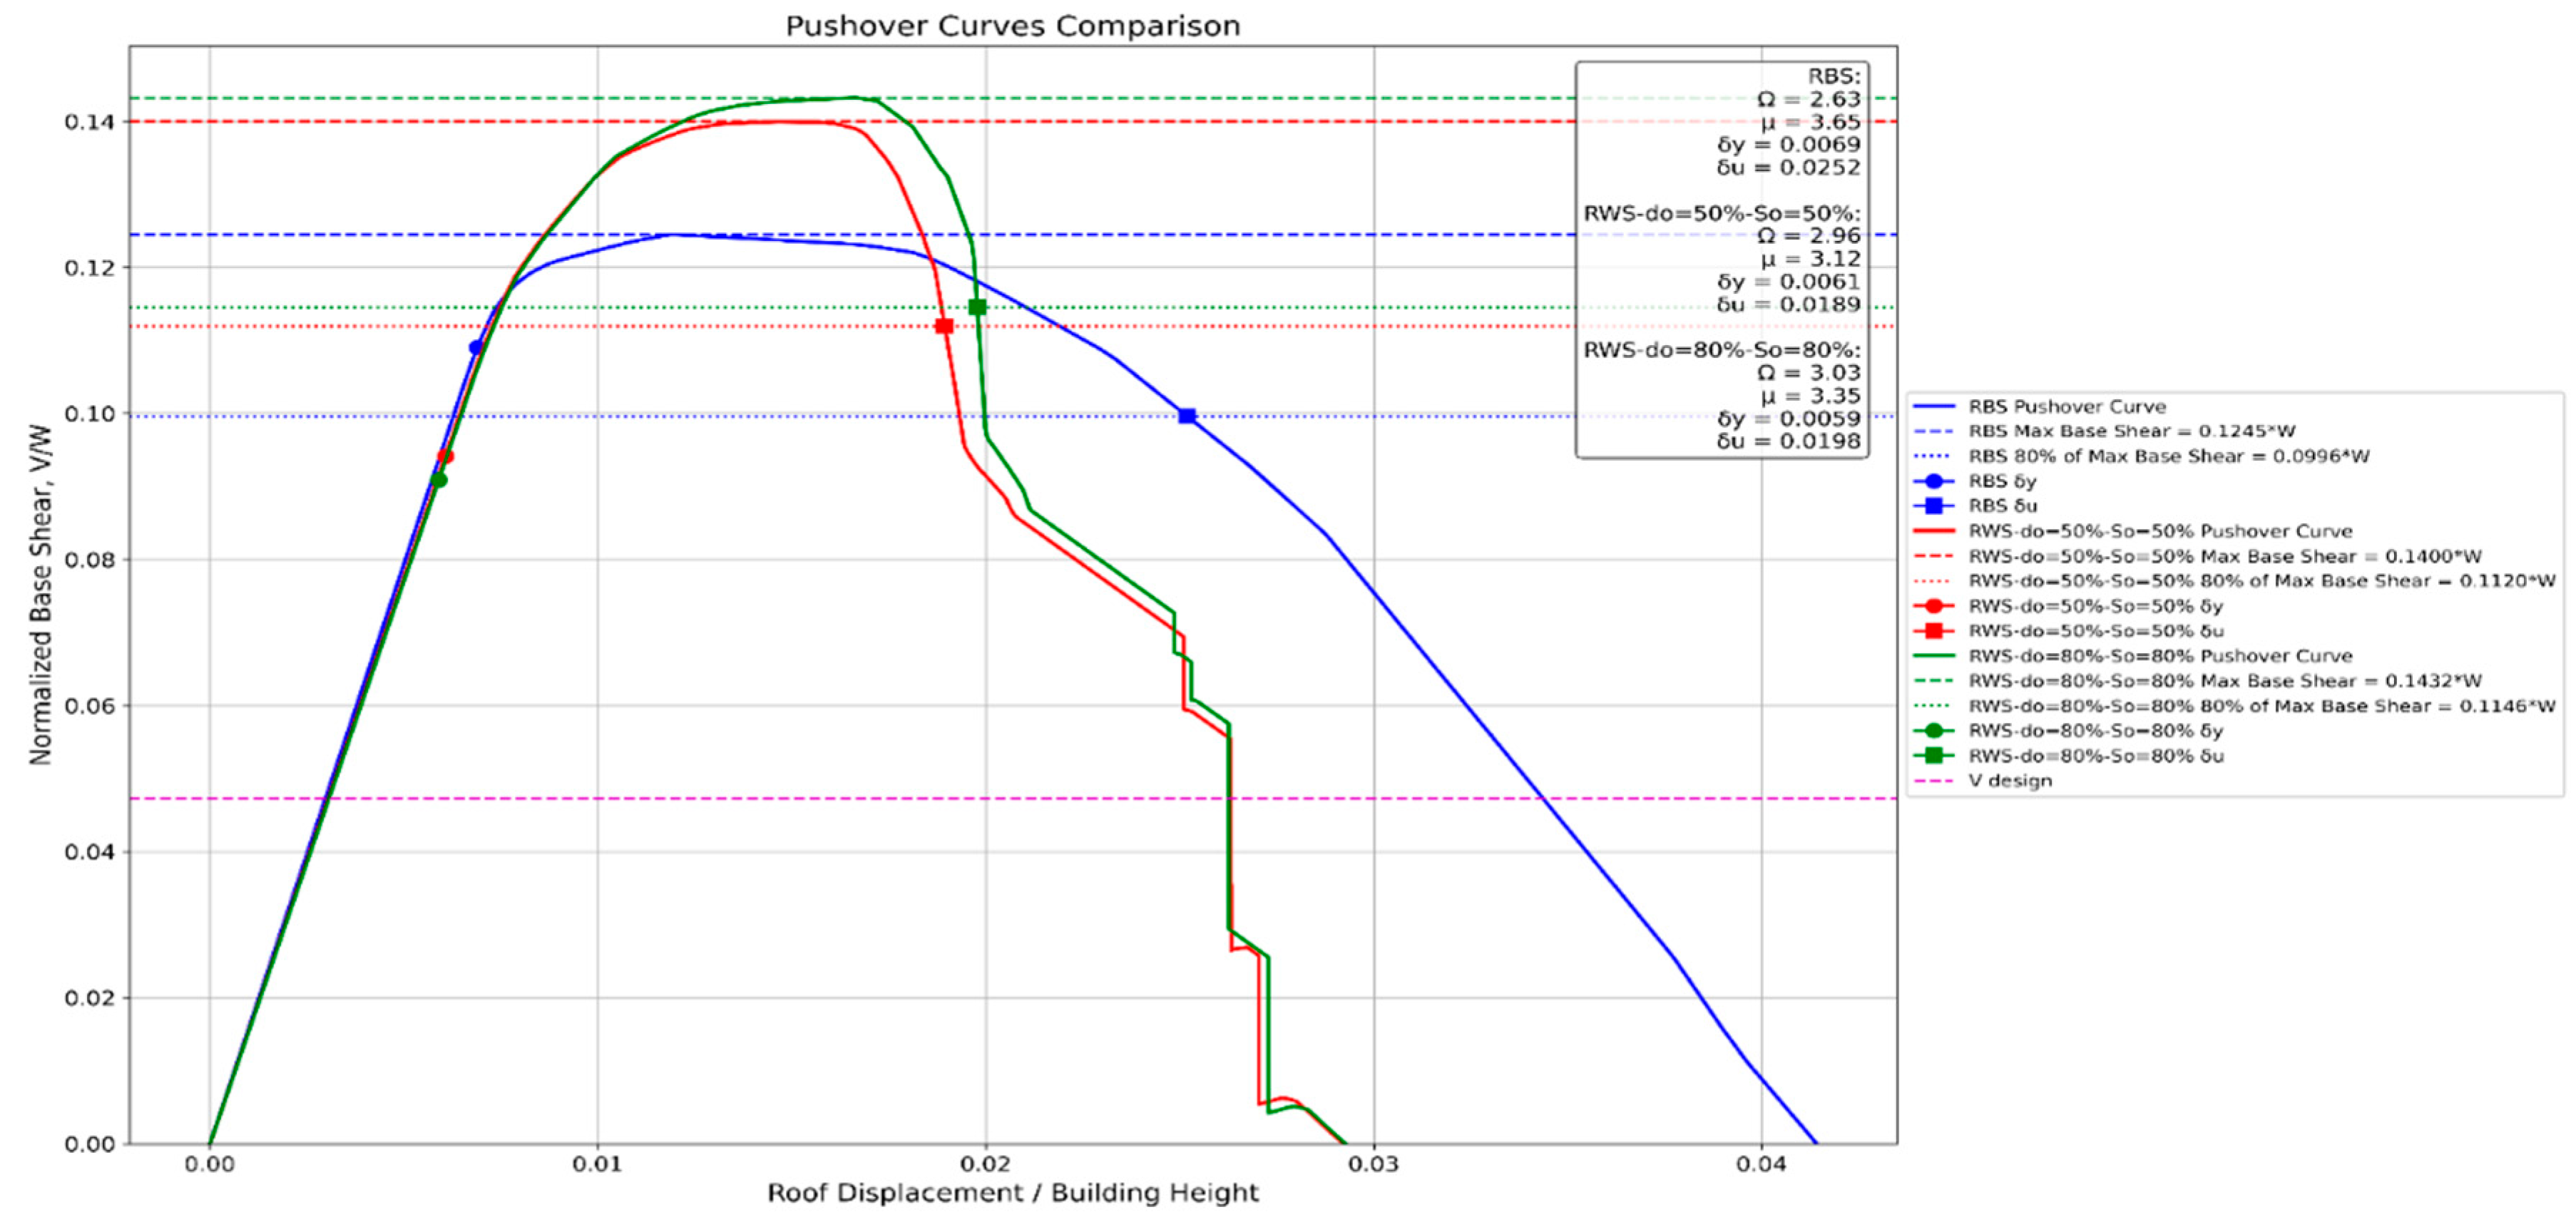
RWS connections demonstrated higher peak strength and overstrength factors compared to RBS connections. The post-peak behaviour of RWS connections showed more rapid strength degradation, but this is influenced by the imposed rotation limit. Despite earlier strength loss, RWS connections have maintained ductility ratios (μ = 3.12 and 3.35) comparable to RBS (μ = 3.65).
Figure 21.
8-story frame pushover analysis curves.
4.2.4. 12-Story Frame
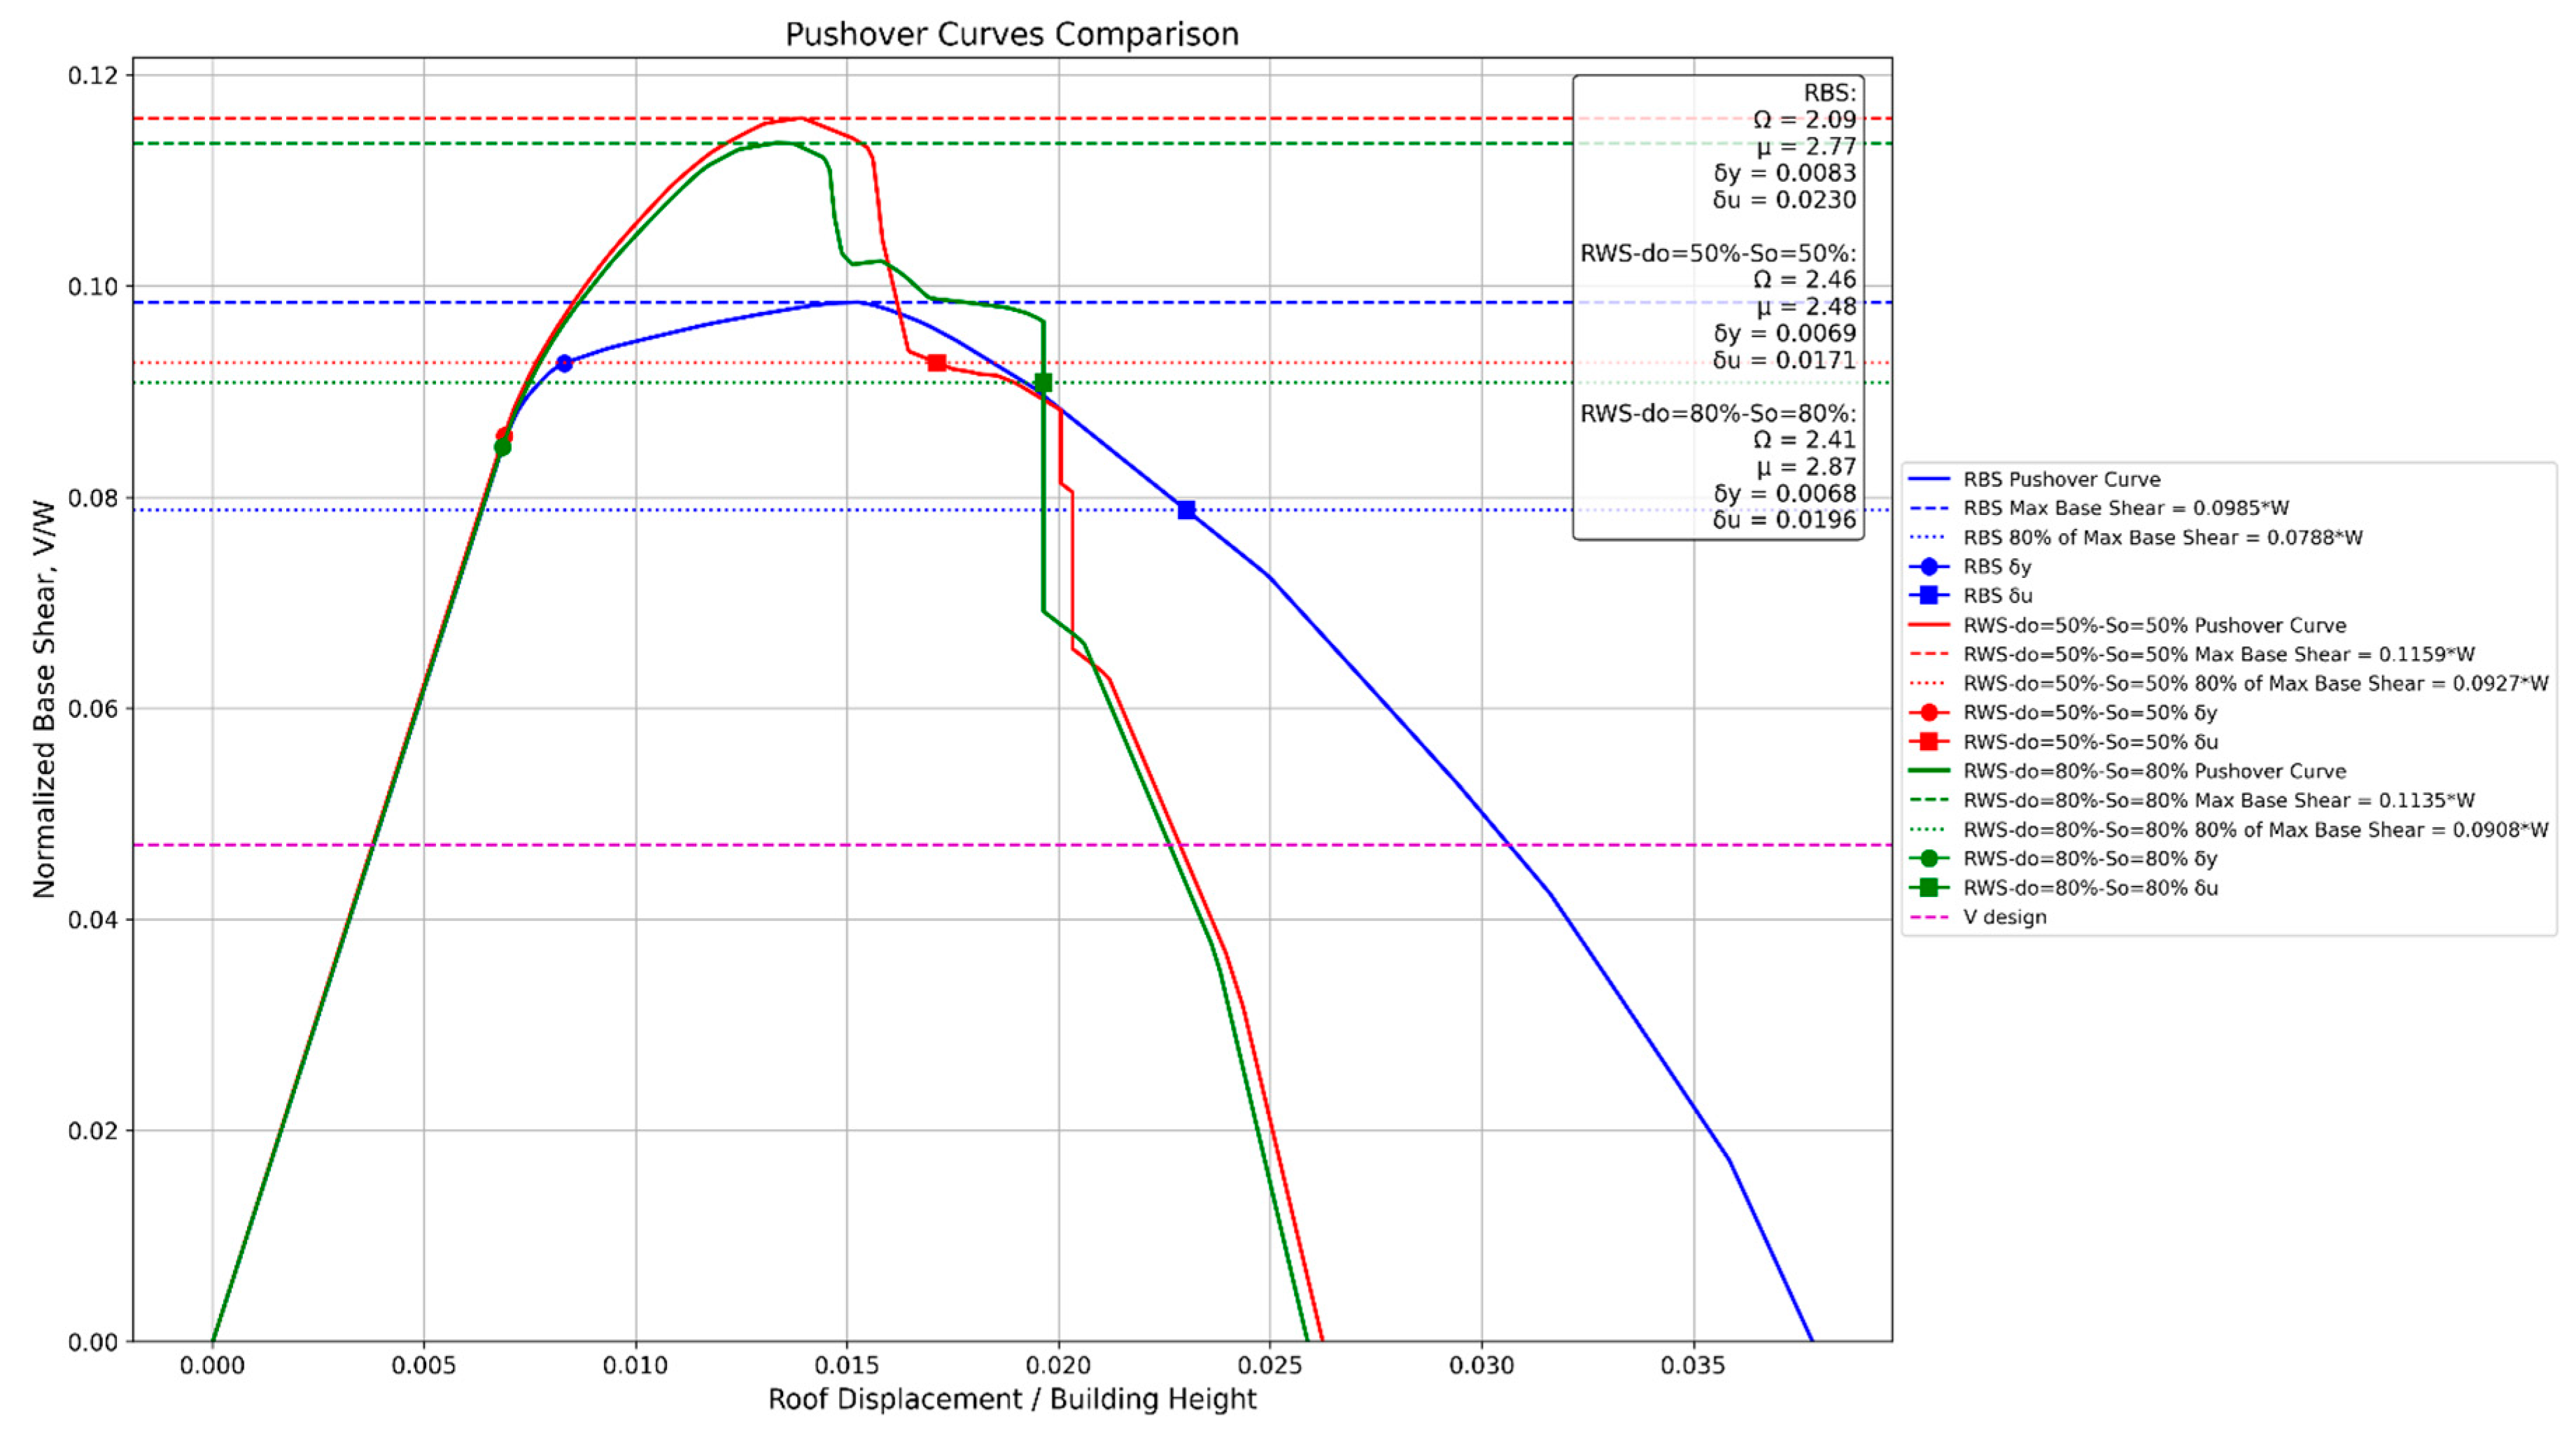
RWS connections continued to show higher peak strength and overstrength factors. The difference in ductility between RWS and RBS configurations was less pronounced in taller structures. All connection types demonstrated adequate performance, with ductility ratios exceeding 2.0.
Figure 22.
12-story frame pushover analysis curves.
4.2.5. 20-Story Frame
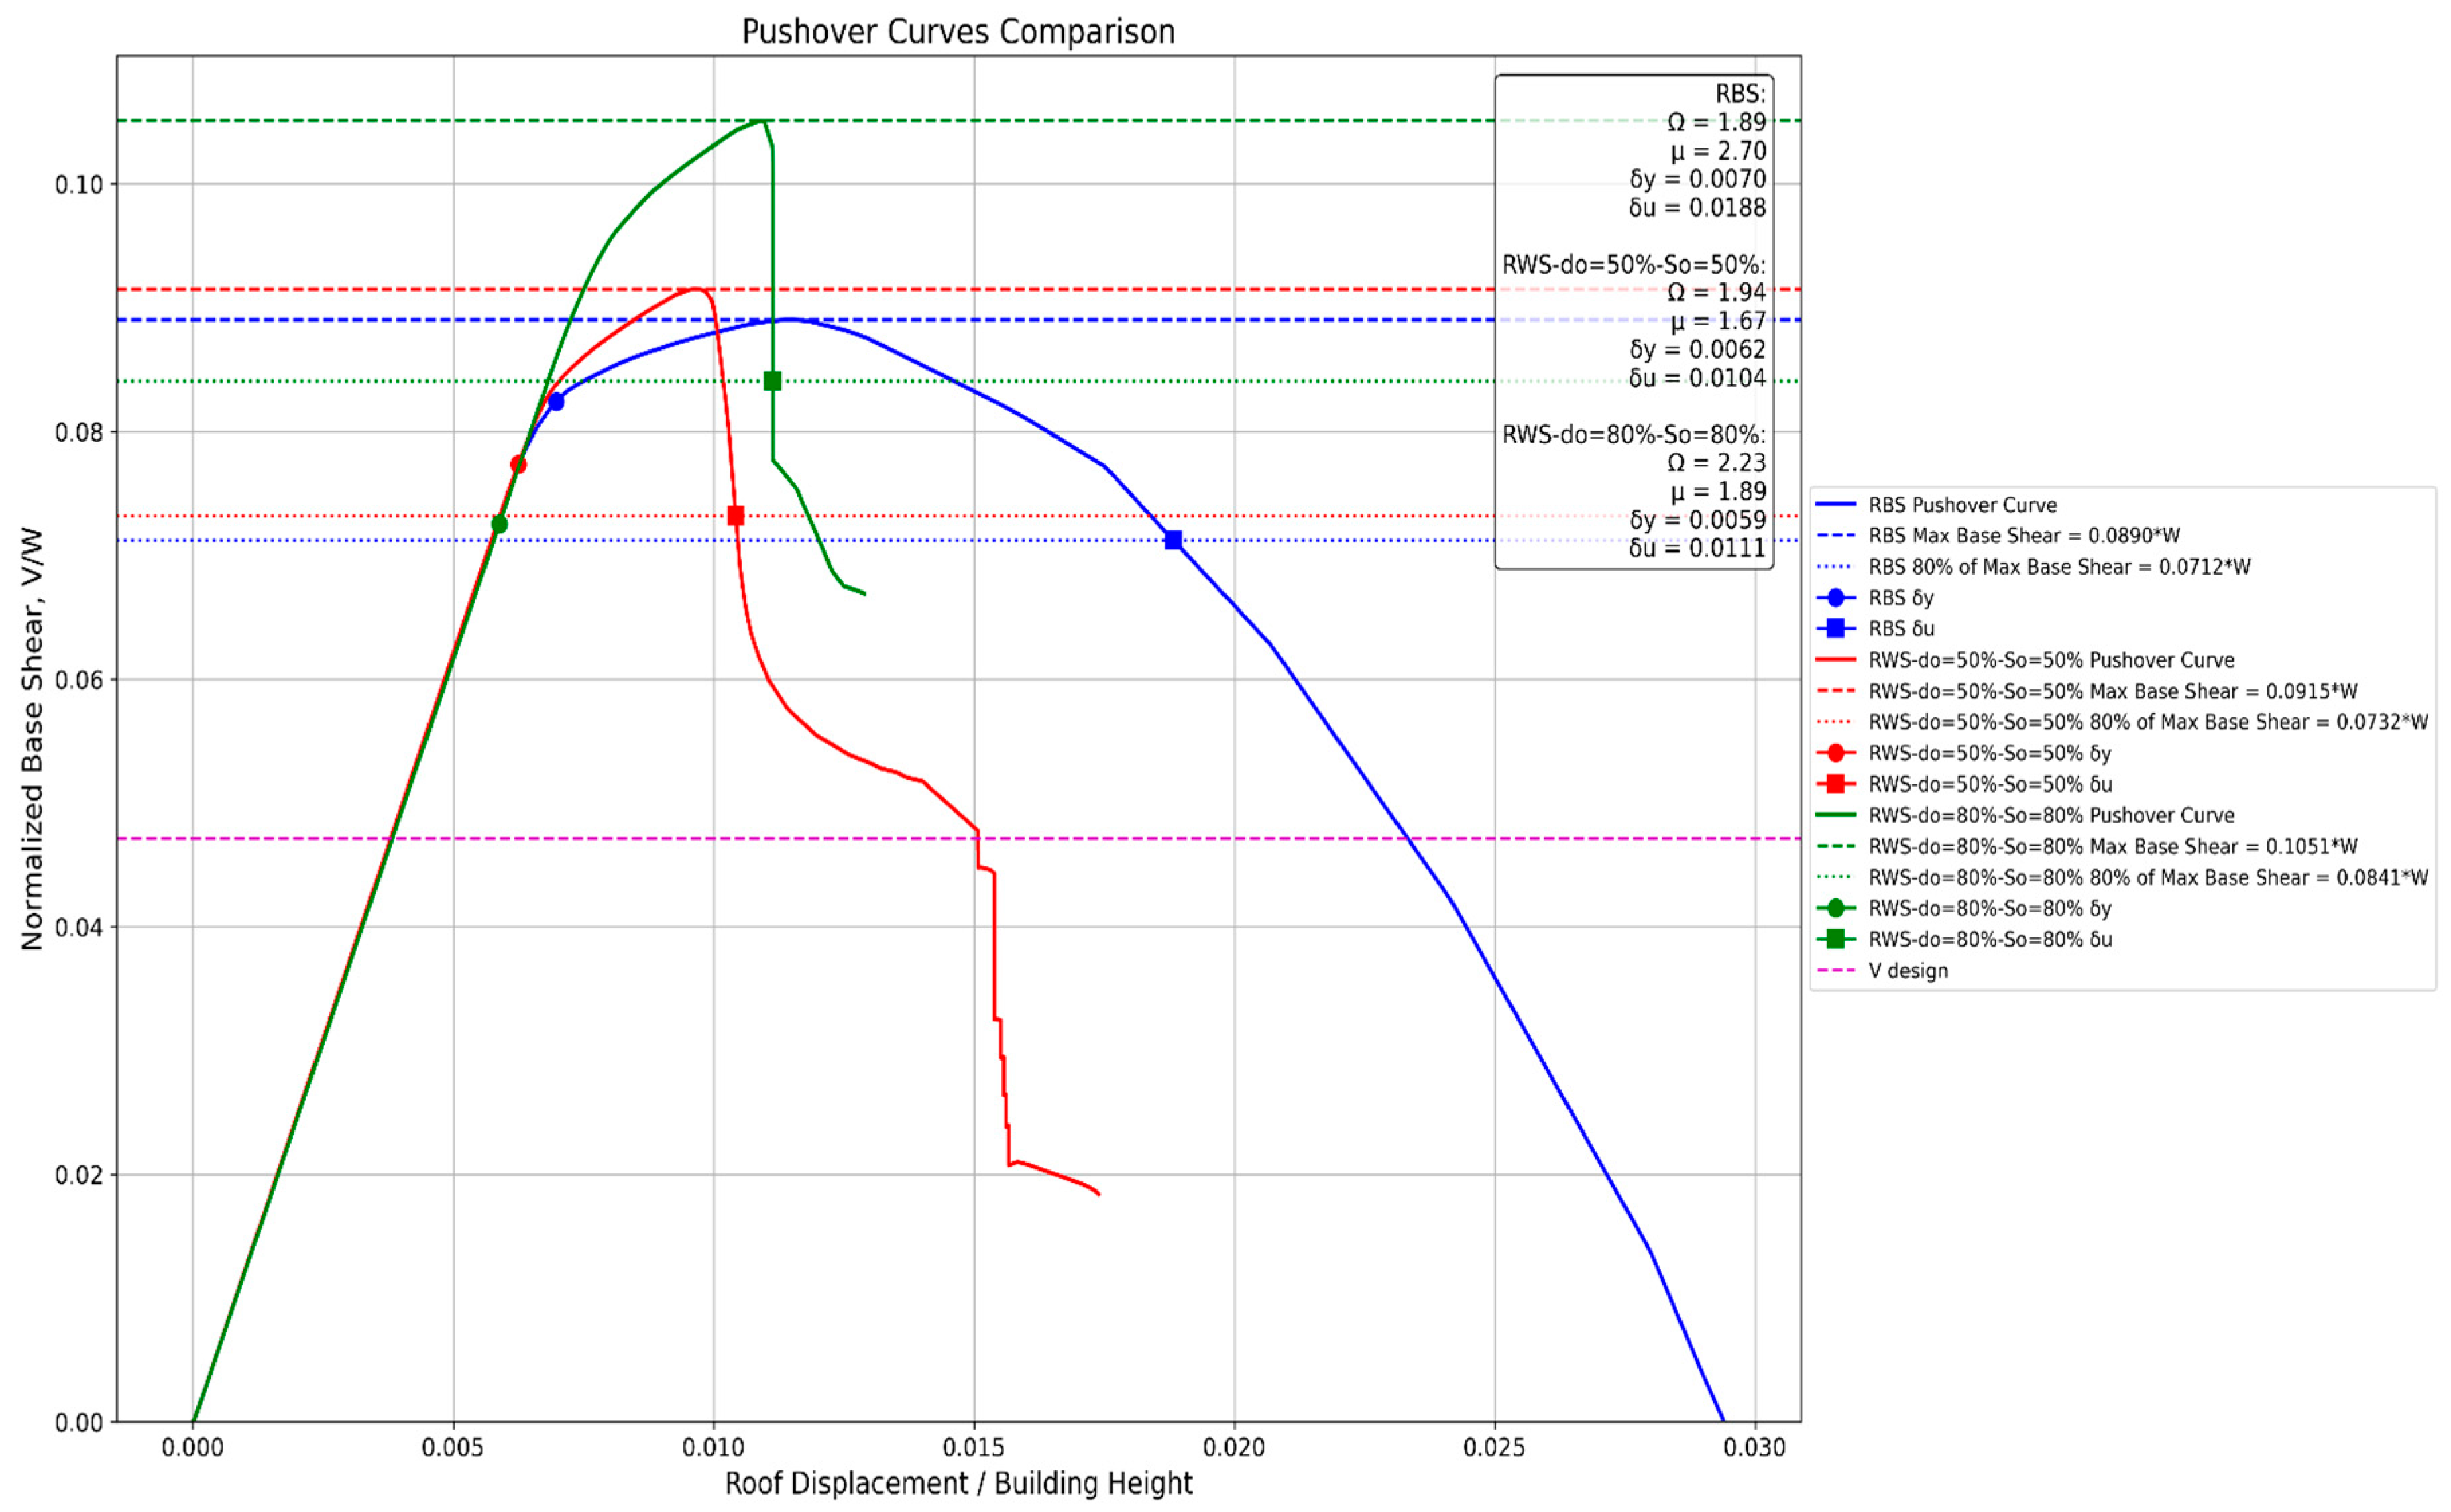
For the latter frames studied, the performance gap between RWS and RBS connections narrowed. RWS connections with do=80% and So=80% showed the highest overstrength factor (Ω = 2.23), but lower ductility compared to the RBS connection. All connection types maintained acceptable performance levels, meeting code requirements.
It is important to note that the apparent earlier strength degradation in RWS connections is primarily due to the imposed ultimate rotation limit of approximately 0.05, while RBS connections are allowed to rotate up to 0.2. This limitation was set to control damage to the building, but it does not reflect an inherent lack of capacity in RWS connections [10]. In fact, all RWS connections demonstrated the ability to achieve interstory drifts larger than 4%, thereby complying with performance targets set in ANSI/AISC 358-16, ANSI/AISC 341-16, and EC8 [11,12,26].
The results indicate that RWS connections, particularly the ‘80%-80%’ (i.e. do=80% and So=80%) configuration, often provides higher strength and comparable or superior ductility to RBS connections, especially in low to mid-rise structures. This suggests that RWS connections could be a viable and potentially advantageous alternative to RBS connections in steel moment frames, offering enhanced structural performance while potentially simplifying fabrication and reducing costs [7,27].
Figure 23.
20-story frame pushover analysis curves.
5. Conclusions
This paper significantly advances the understanding of Reduced Web Section (RWS) connections in steel moment frames through the application of machine learning (ML) and deep learning (DL) prediction modelling and the application of the results in different steel frames. The study analysed 154 specimens from experimental and finite element studies, focusing on non-composite welded and bolted end-plate connections, and employed advanced calibration techniques using the Ibarra-Medina-Krawinkler (IMK) Bilin model in OpenSees. Multiple ML algorithms, including Random Forest, Neural Networks, Support Vector Regression, Gradient Boosting, XGBoost, and DL, were systematically evaluated using a robust cross-validation framework and comprehensive performance metrics. The research revealed complex interactions between web opening characteristics and structural behaviours, with web slenderness and span-to-depth ratios emerging as crucial parameters. The study's findings demonstrate that RWS connections often provide higher strength and comparable or superior ductility to RBS connections, particularly in low to mid-rise structures, with all RWS configurations achieving interstory drifts exceeding 4%, meeting ANSI/AISC and EC8 performance targets. This research not only contributes valuable insights into RWS connection behaviour under seismic loading but also provides structural engineers with a practical tool for implementing these connections in performance-based seismic design.
The following conclusions can be drawn:
- RWS connections demonstrate viable and often superior performance compared to traditional RBS connections in steel moment frames, particularly in low to mid-rise structures.
- RWS connections consistently exhibit higher initial stiffness, peak strength, and overstrength factors compared to RBS connections across various frame heights (2 to 20 stories).
- The apparent earlier strength degradation in RWS connections is primarily due to the imposed ultimate rotation limit of 0.05 radians, which was set to control building damage. Despite this limitation, RWS connections still achieve interstory drifts larger than 4%, meeting performance targets set by ANSI/AISC and EC8 standards.
- ML and DL techniques, particularly XGBoost and Random Forest algorithms, demonstrate high accuracy in predicting Ibarra-Medina-Krawinkler (IMK) Bilin parameters for RWS connections, offering a powerful tool for efficient design and analysis.
- The study reveals complex interactions between web opening characteristics, beam length, and structural behaviour in RWS connections, providing valuable insights for optimising connection design.
- Feature importance analysis highlights that different aspects of RWS connection behaviour are influenced by various geometric and material properties, with web slenderness and span-to-depth ratio consistently playing significant roles across multiple parameters.
- The developed predictive models offer a rapid and accurate method for estimating IMK Bilin parameters across a wide range of RWS connection configurations, potentially streamlining the design process for structural engineers.
Future research should focus on extending the database to include a wider range of geometric configurations and loading conditions, while priority should be given to the experimental one. Also, the long-term performance and fatigue behaviour of RWS connections should be further investigated. Ultimately, the design guidelines for RWS connections based on the insights gained from this study should be further developed [28,29].
Consequently, this paper contributes significantly to the understanding of RWS connection behaviour under seismic loading and provides a foundation for their wider adoption in seismic-resistant steel structures.
Acknowledgments
The authors would like to pass their special thanks to Dr Fahad Falah Almutairi, from the International University of Kuwait, who has kindly shared a data collection on RWS and RBS connections.
References
- F. M. Mazzolani, “Steel Structures in Seismic Zones,” in Seismic Resistant Steel Structures, F. M. Mazzolani and V. Gioncu, Eds., Vienna: Springer Vienna, 2000, pp. 1–17.
- A. Astaneh-Asl, “Post-earthquake stability of steel moment frames with damaged connections,” Connections in Steel Structures III, pp. 391–402, Jan. 1996. [CrossRef]
- J. O. Malley, “Performance of moment resisting steel frames in the january 17, 1994 northridge earthquake,” Connections in Steel Structures III, pp. 553–561, Jan. 1996. [CrossRef]
- C. E. Sofias and D. T. Pachoumis, “Assessment of reduced beam section (RBS) moment connections subjected to cyclic loading,” J Constr Steel Res, vol. 171, p. 106151, Aug. 2020. [CrossRef]
- T. A. Horton, I. Hajirasouliha, B. Davison, Z. Ozdemir, and I. Abuzayed, “Development of more accurate cyclic hysteretic models to represent RBS connections,” Eng Struct, vol. 245, p. 112899, Oct. 2021. [CrossRef]
- D. T. Naughton, K. D. Tsavdaridis, C. Maraveas, and A. Nicolaou, “Pushover analysis of steel seismic resistant frames with reduced web section and reduced beam section connections,” Front Built Environ, vol. 3, Oct. 2017. [CrossRef]
- K. D. Tsavdaridis and T. Papadopoulos, “A FE parametric study of RWS beam-to-column bolted connections with cellular beams,” J Constr Steel Res, vol. 116, pp. 92–113, Jan. 2016. [CrossRef]
- A. Elkady and D. G. Lignos, “Modeling of the composite action in fully restrained beam-to-column connections: Implications in the seismic design and collapse capacity of steel special moment frames,” Earthq Eng Struct Dyn, vol. 43, no. 13, pp. 1935–1954, Oct. 2014. [CrossRef]
- D. Lignos and H. Krawinkler, “SIDESWAY COLLAPSE OF DETERIORATING STRUCTURAL SYSTEMS UNDER SEISMIC EXCITATIONS,” 2012. [Online]. Available: http://blume.stanford.edu.
- F. F. Almutairi, K. D. Tsavdaridis, A. Alonso-Rodriguez, and I. Hajirasouliha, “Experimental investigation using demountable steel-concrete composite reduced web section (RWS) connections under cyclic loads,” Bulletin of Earthquake Engineering, Feb. 2023. [CrossRef]
- “EN 1998-1: Eurocode 8: Design of structures for earthquake resistance – Part 1: General rules, seismic actions and rules for buildings,” 2004.
- “Prequalified Connections for Special and Intermediate Steel Moment Frames for Seismic Applications,” 2016. [Online]. Available: www.aisc.org.
- F. F. Almutairi and K. D. Tsavdaridis, “Capacity design assessment of composite reduced web section (RWS) connections,” Eng Struct, vol. 316, Oct. 2024. [CrossRef]
- A. Gupta and H. Krawinkler, “SEISMIC DEMANDS FOR PERFORMANCE EVALUATION OF STEEL MOMENT RESISTING FRAME STRUCTURES,” 1999. [Online]. Available: http://blume.stanford.edu.
- L. F. Ibarra and H. Krawinkler, “GLOBAL COLLAPSE OF FRAME STRUCTURES UNDER SEISMIC EXCITATIONS,” 2005. [Online]. Available: http://blume.stanford.edu.
- K. D. Tsavdaridis, F. Faghih, and N. Nikitas, “Assessment of perforated steel beam-to-column connections subjected to cyclic loading,” Journal of Earthquake Engineering, vol. 18, no. 8, pp. 1302–1325, 2014. [CrossRef]
- X. Zhang, S. Zheng, and X. Zhao, “Seismic performance of steel beam-to-column moment connections with different structural forms,” J Constr Steel Res, vol. 158, pp. 130–142, Jul. 2019. [CrossRef]
- K. Boushehri, K. D. Tsavdaridis, and G. Cai, “Seismic behaviour of RWS moment connections to deep columns with European sections,” J Constr Steel Res, vol. 161, pp. 416–435, Oct. 2019. [CrossRef]
- H. Nazaralizadeh, H. Ronagh, P. Memarzadeh, and F. Behnamfar, “Cyclic performance of bolted end-plate RWS connection with vertical-slits,” J Constr Steel Res, vol. 173, p. 106236, Oct. 2020. [CrossRef]
- Q. Xu, H. Chen, W. Li, S. Zheng, and X. Zhang, “Experimental investigation on seismic behavior of steel welded connections considering the influence of structural forms,” Eng Fail Anal, vol. 139, p. 106499, Sep. 2022. [CrossRef]
- W. By, : Thomas, and A. Horton, “Predicting Reduced Beam Section (RBS) Connection Performance in Steel Moment Frames”.
- Fema, “FEMA 350 - Recommended Seismic Design Criteria for New Steel Moment-Frame Buildings.” [Online]. Available: www.seaoc.org.
- C. G. Deng, O. S. Bursi, and R. Zandonini, “A hysteretic connection element and its applications,” Comput Struct, vol. 78, no. 1–3, pp. 93–110, Nov. 2000. [CrossRef]
- D. Patsialis, A. P. Kyprioti, and A. A. Taflanidis, “Bayesian calibration of hysteretic reduced order structural models for earthquake engineering applications,” Eng Struct, vol. 224, p. 111204, Dec. 2020. [CrossRef]
- A. Elkady and D. G. Lignos, “Effect of gravity framing on the overstrength and collapse capacity of steel frame buildings with perimeter special moment frames,” Earthq Eng Struct Dyn, vol. 44, no. 8, pp. 1289–1307, Jul. 2015. [CrossRef]
- “Seismic Provisions for Structural Steel Buildings Supersedes the Seismic Provisions for Structural Steel Buildings,” 2016. [Online]. Available: www.aisc.org.
- S. M. A, T. K. Daniel, and Y. Satoshi, “Comprehensive FE Study of the Hysteretic Behavior of Steel–Concrete Composite and Noncomposite RWS Beam-to-Column Connections,” Journal of Structural Engineering, vol. 144, no. 9, p. 04018150, Sep. 2018. [CrossRef]
- S. S. Fares, P. Eng, J. Coulson, and D. W. Dinehart, “Castellated and Cellular Beam Design 31 Steel Design Guide,” 2016.
- D. Darwin, “Steel Design Guide Series Steel and Composite Beams with Web Openings Design of Steel and Composite Beams with Web Openings,” 2003.
Disclaimer/Publisher’s Note: The statements, opinions and data contained in all publications are solely those of the individual author(s) and contributor(s) and not of MDPI and/or the editor(s). MDPI and/or the editor(s) disclaim responsibility for any injury to people or property resulting from any ideas, methods, instructions or products referred to in the content. |
© 2025 by the authors. Licensee MDPI, Basel, Switzerland. This article is an open access article distributed under the terms and conditions of the Creative Commons Attribution (CC BY) license (http://creativecommons.org/licenses/by/4.0/).
Copyright: This open access article is published under a Creative Commons CC BY 4.0 license, which permit the free download, distribution, and reuse, provided that the author and preprint are cited in any reuse.


