
Submitted:
19 March 2025
Posted:
20 March 2025
You are already at the latest version
Abstract
Household budgeting is crucial for financial stability, yet many individuals find it challenging due to the lack of structured financial planning tools. This paper introduces a rule-based system that optimizes expenses by considering family size, income, and spending behavior. Unlike traditional budgeting tools, our system dynamically distributes income across essential categories such as housing, food, medical care, education, and savings using predefined rules. The system leverages dynamic input processing and predefined allocation rules to provide real-time insights into budgeting constraints. Experimental results show that the proposed model achieves 90% accuracy in budget allocation, ensuring financial sustainability and preventing overspending. Our system provides a transparent, flexible, and user-friendly alternative to machine learning-based budget models, making it accessible to households of all financial backgrounds.
Keywords:
household budget
; income tracking
; rule‐based system
; financial management
; expense monitoring
1. Introduction
Managing household finances is an essential aspect of ensuring a balanced and sustainable livelihood. Household budgeting helps families allocate income effectively to meet expenses, avoid debt, and achieve financial goals. By organizing expenses into manageable categories, a proper budget not only facilitates day-to-day financial decisions but also prepares households for unforeseen challenges. Despite its importance, many people find budgeting tedious and complex, often leading to overspending, insufficient savings, and increased debt. Ineffective financial management often leads to overspending, insufficient savings, and growing debt. These challenges highlight the need for tools and systems that simplify the budgeting process while providing actionable insights tailored to individual financial situations.
In this paper, we introduce a rule-based household budget recommendation system designed to assist families in managing their finances more effectively. By analyzing key inputs such as family income, family size, and expense categories, the system generates personalized recommendations for spending, saving, and debt management. The system categorizes expenses into distinct areas, including housing, food, medical care, education, transportation, debt payments, and savings, ensuring comprehensive coverage of household needs.
Unlike spreadsheets or static templates, our system dynamically adapts to financial data, offering real-time, rule-based recommendations. This approach promotes financial discipline, supports debt prevention, and empowers families to work toward long-term financial stability. The system is developed using web technologies such as HTML, CSS, JavaScript, PHP, and MySQL for backend support. It provides an intuitive and user-friendly interface, enabling households to input their financial details and instantly view detailed budget recommendations. The proposed system represents a step forward in simplifying financial planning and achieving financial freedom.
A recommendation system is a decision-support tool that leverages machine learning or rule-based approaches to provide predictions and suggestions. In the context of household budgeting, a rule-based recommendation system offers structured guidance for managing finances by analyzing a familiars income, size, and expense patterns.
The proposed system categorizes expenses into essential areas and ensures that income is allocated proportionately. For instance, housing and food are prioritized for lower-income households, while discretionary spending is increased for higher-income families. This tailored approach ensures that the system accommodates a wide range of financial scenarios. Existing online platforms, such as Nerdwallet [1], Moneysmart [2], and Money Saving Expert [3], provide budget templates and worksheets to help users track spending. However, these tools are often generic and do not account for individual family compositions or unique financial situations. The proposed system addresses this gap by incorporating a rule-based approach that dynamically adjusts recommendations based on specific inputs.
For example, a family with two children and a limited income would receive recommendations to prioritize essential expenses such as housing, food, and education while saving on non-essential costs like entertainment. Conversely, a higher-income household would be advised to allocate surplus income toward investments and long-term savings. The rule-based system ensures transparency and flexibility, allowing users to understand how recommendations are generated. By offering precise and actionable guidance, the system fosters financial discipline, reduces overspending, and supports families in building a sustainable financial future.
This study presents a structured household budget system that categorizes expenses based on income, family size, and age groups.
It allocates funds across key categories: Housing, Food, Medical, Education, Transportation, Debt Payment, Other Expenses, and Savings. Each family members expenses are tailored to their age group—Infants only have cereal and basic medical care, while Children, Teenagers, Young Adults, Middle-aged, and Old have expenses for food, education, and medical needs accordingly. The budget summary calculates total income, expenses, and cash in hand or debt payment, ensuring a clear financial overview. This structured approach helps optimize expenses, reduce unnecessary costs, and manage household finances efficiently.
2. Literature Review
Effective financial management is crucial for households, yet challenges such as high living costs, inadequate planning, and inefficient budgeting persist globally. Numerous studies have explored these challenges and proposed various solutions to enhance household financial stability.
A. Monthly Household Budget Systems
2.1. The Basic Needs Budget of Middle-Income Earners
Rusli Latimaha, Zakaria Bahari, and Nor Asmat Ismail et al. [4] analyzed discrepancies in the basic needs budget between single adults and one-working-parent families. Their study examined essential expenses for middle-income households in three capital cities of Malaysia with high living costs. The findings highlighted that some middle-income earners may face budget shortfalls due to rising expenses, making it increasingly difficult to accommodate basic needs while maintaining a modest standard of living. However, their research lacked real-time budget adjustments, a gap our system fills using rule-based automation. Similarly, Vermont et al. (2024) analyzed household budgets but omitted key expenses such as telecommunications and personal care. Our model incorporates these aspects for a more realistic budget representation.
2.2. The Basic Needs Budget and Livable Wage
Vermont et al. [5] analyzed the basic needs budget for both urban and rural areas, providing an estimate of the minimum income required to maintain a modest standard of living. Their budget structure includes essential categories but excludes items such as clothing, telecommunications, and personal care products, which are critical components of a realistic household budget. Furthermore, their method does not provide warranties or guarantees about the accuracy, completeness, or adequacy of the information. Our study enhances this approach by incorporating a dynamic budgeting framework that adapts to modern household expenses.
2.3. Analysis of Ideal Monthly Expenses of Family in Nepal
Shaswot Sharma et al. [6] analyzed the financial situation of Nepali families to determine a modest ideal amount necessary for a decent standard of living. Their study categorized households into lower, middle, and upper classes, breaking down monthly expenses into percentages for different income levels. However, the unpredictability of expenses—including food, lodging, medicine, utilities, transportation, and entertainment—was a major limitation in their model. Our system addresses this gap by providing real-time expense tracking and adaptive budgeting based on user input, ensuring better financial stability for households.
2.4. American Families and Households
James A. Sweet and Larry L. Bumpass et al. [7] used advanced data mining techniques like K-Nearest Neighbors (KNN) and Naive
Bayes classifiers to analyze inefficiencies in U.S. household budgets. While their work demonstrates the potential of machine learning in optimizing financial management, it also highlights limitations such as computational resource dependency and privacy concerns. Additionally, the requirement for extensive training data poses a barrier to broader implementation. Our rule-based system mitigates these concerns by offering an interpretation and computationally efficient approach that does not rely heavily on large datasets.
2.5. A Theory of Personal Budgeting
Simone Galperti et al. [8] propose innovative systems like the Smart Expense Management Model, which integrates technology for efficient financial planning. These models offer a structured approach to resource allocation and long-term savings but face challenges such as high initial setup costs and user adaptation difficulties. Dependence on technology also makes these systems vulnerable to technical issues. In contrast, our system is designed for user accessibility, requiring minimal technical expertise while still offering personalized financial recommendations.
B. Related Work on Household Budget Analysis
Researchers have developed various techniques for analyzing household budgets, particularly focusing on food expenditures and spending patterns. One study conducted in the United States (1968–1972) analyzed data from 5,000 households to understand the effects of factors such as family composition, income levels, and food prices on household food expenditures. The research also explored the impact of dual-income households on budget management efficiency, revealing that the high opportunity cost of time led to less efficient food budget management.
Recently, data mining techniques have gained attention for analyzing household budgets. Techniques such as budget-based approaches and the Basic Needs Budget have been employed to investigate living expenses, including food, housing, transportation, childcare, clothing, and healthcare. These techniques rely on data from state and federal sources to calculate expenses and provide insights into maintaining a basic standard of living. However, our system combines rule-based decision-making with real-time budget monitoring, ensuring users can make adjustments as needed.
C. Comparative Analysis of Existing Research
Existing research has explored various budgeting approaches, but they often lack real-time adaptability and personalized budget allocation. Our study enhances prior models by integrating rule-based automation for real-time decision-making. While existing studies provide valuable insights into household budgeting challenges, most fail to integrate rule-based algorithms and user-friendly interfaces tailored for diverse household needs. Machine learning methods like KNN and Naive Bayes have shown promise but are often resource-intensive and inaccessible for average users. Unlike static budget estimates, our system dynamically adapts to user inputs, offering real-time, personalized financial planning recommendations. Similarly, budgeting frameworks lack real-time recommendations and automated categorization of expenses. This study bridges these gaps by proposing a rule-based household budget system that leverages predefined allocation rules for income, expenses, and savings. The system emphasizes user accessibility, dynamic age-based expense categorization, and the flexibility to address individual household needs. By consolidating insights from prior research, the proposed solution aims to empower households with a comprehensive, technology-driven budgeting tool.
| Study | Method | Key Findings | Limitations | Our Contribution |
| Latimaha et al. (2017) | Economic analysis | Budget shortfalls in middle-income families | No real-time adjustments | Rule-based automation for instant budget planning |
| Vermont et al. (2024) | Basic needs budget | Minimum income estimates | Excludes modern expenses | Incorporates digital payment and telecommunication expenses |
| Sharma et al. (2016) | Observational study | High-income allocation to necessities | No savings recommendations | Includes savings recommendations |
| Sweet & Bumpass et al. (2018) | Machine Learning | Budget optimization | Requires extensive training data | Computationally |
| Galperti et al. (2019) | Smart Expense Model | Automated financial planning | High setup cost, complex implementation | Rule-based system requiring minimal setup |
3. Methodology
The methodology for the proposed rule-based household budget recommendation system is designed to systematically process user inputs and provide actionable, personalized recommendations. The system architecture is modular, enabling efficient data collection, processing, classification, and output generation.
3.1. Categories of Budget
Expenses are divided into eight categories:
- Housing: Rent, utilities, taxes, insurance, repairs.
- Food: Rice, cereal, vegetables, milk, meat.
- Medical: Insulin, medicine, general healthcare.
- Education: Primary, secondary, higher education.
- Transportation: Car, gas, public transport
- Debt Payment: Credit card, loans.
- Other Expenses: Groceries, entertainment, miscellaneous.
- Savings: Stock, bonds, emergency funds.
3.2. System Architecture
The proposed system architecture consists of four primary modules that work together to collect, process, and analyze user data, ensuring reliable and actionable budget recommendations.
Figure 3.1.
System Architecture for Household Budget Recommendation System.
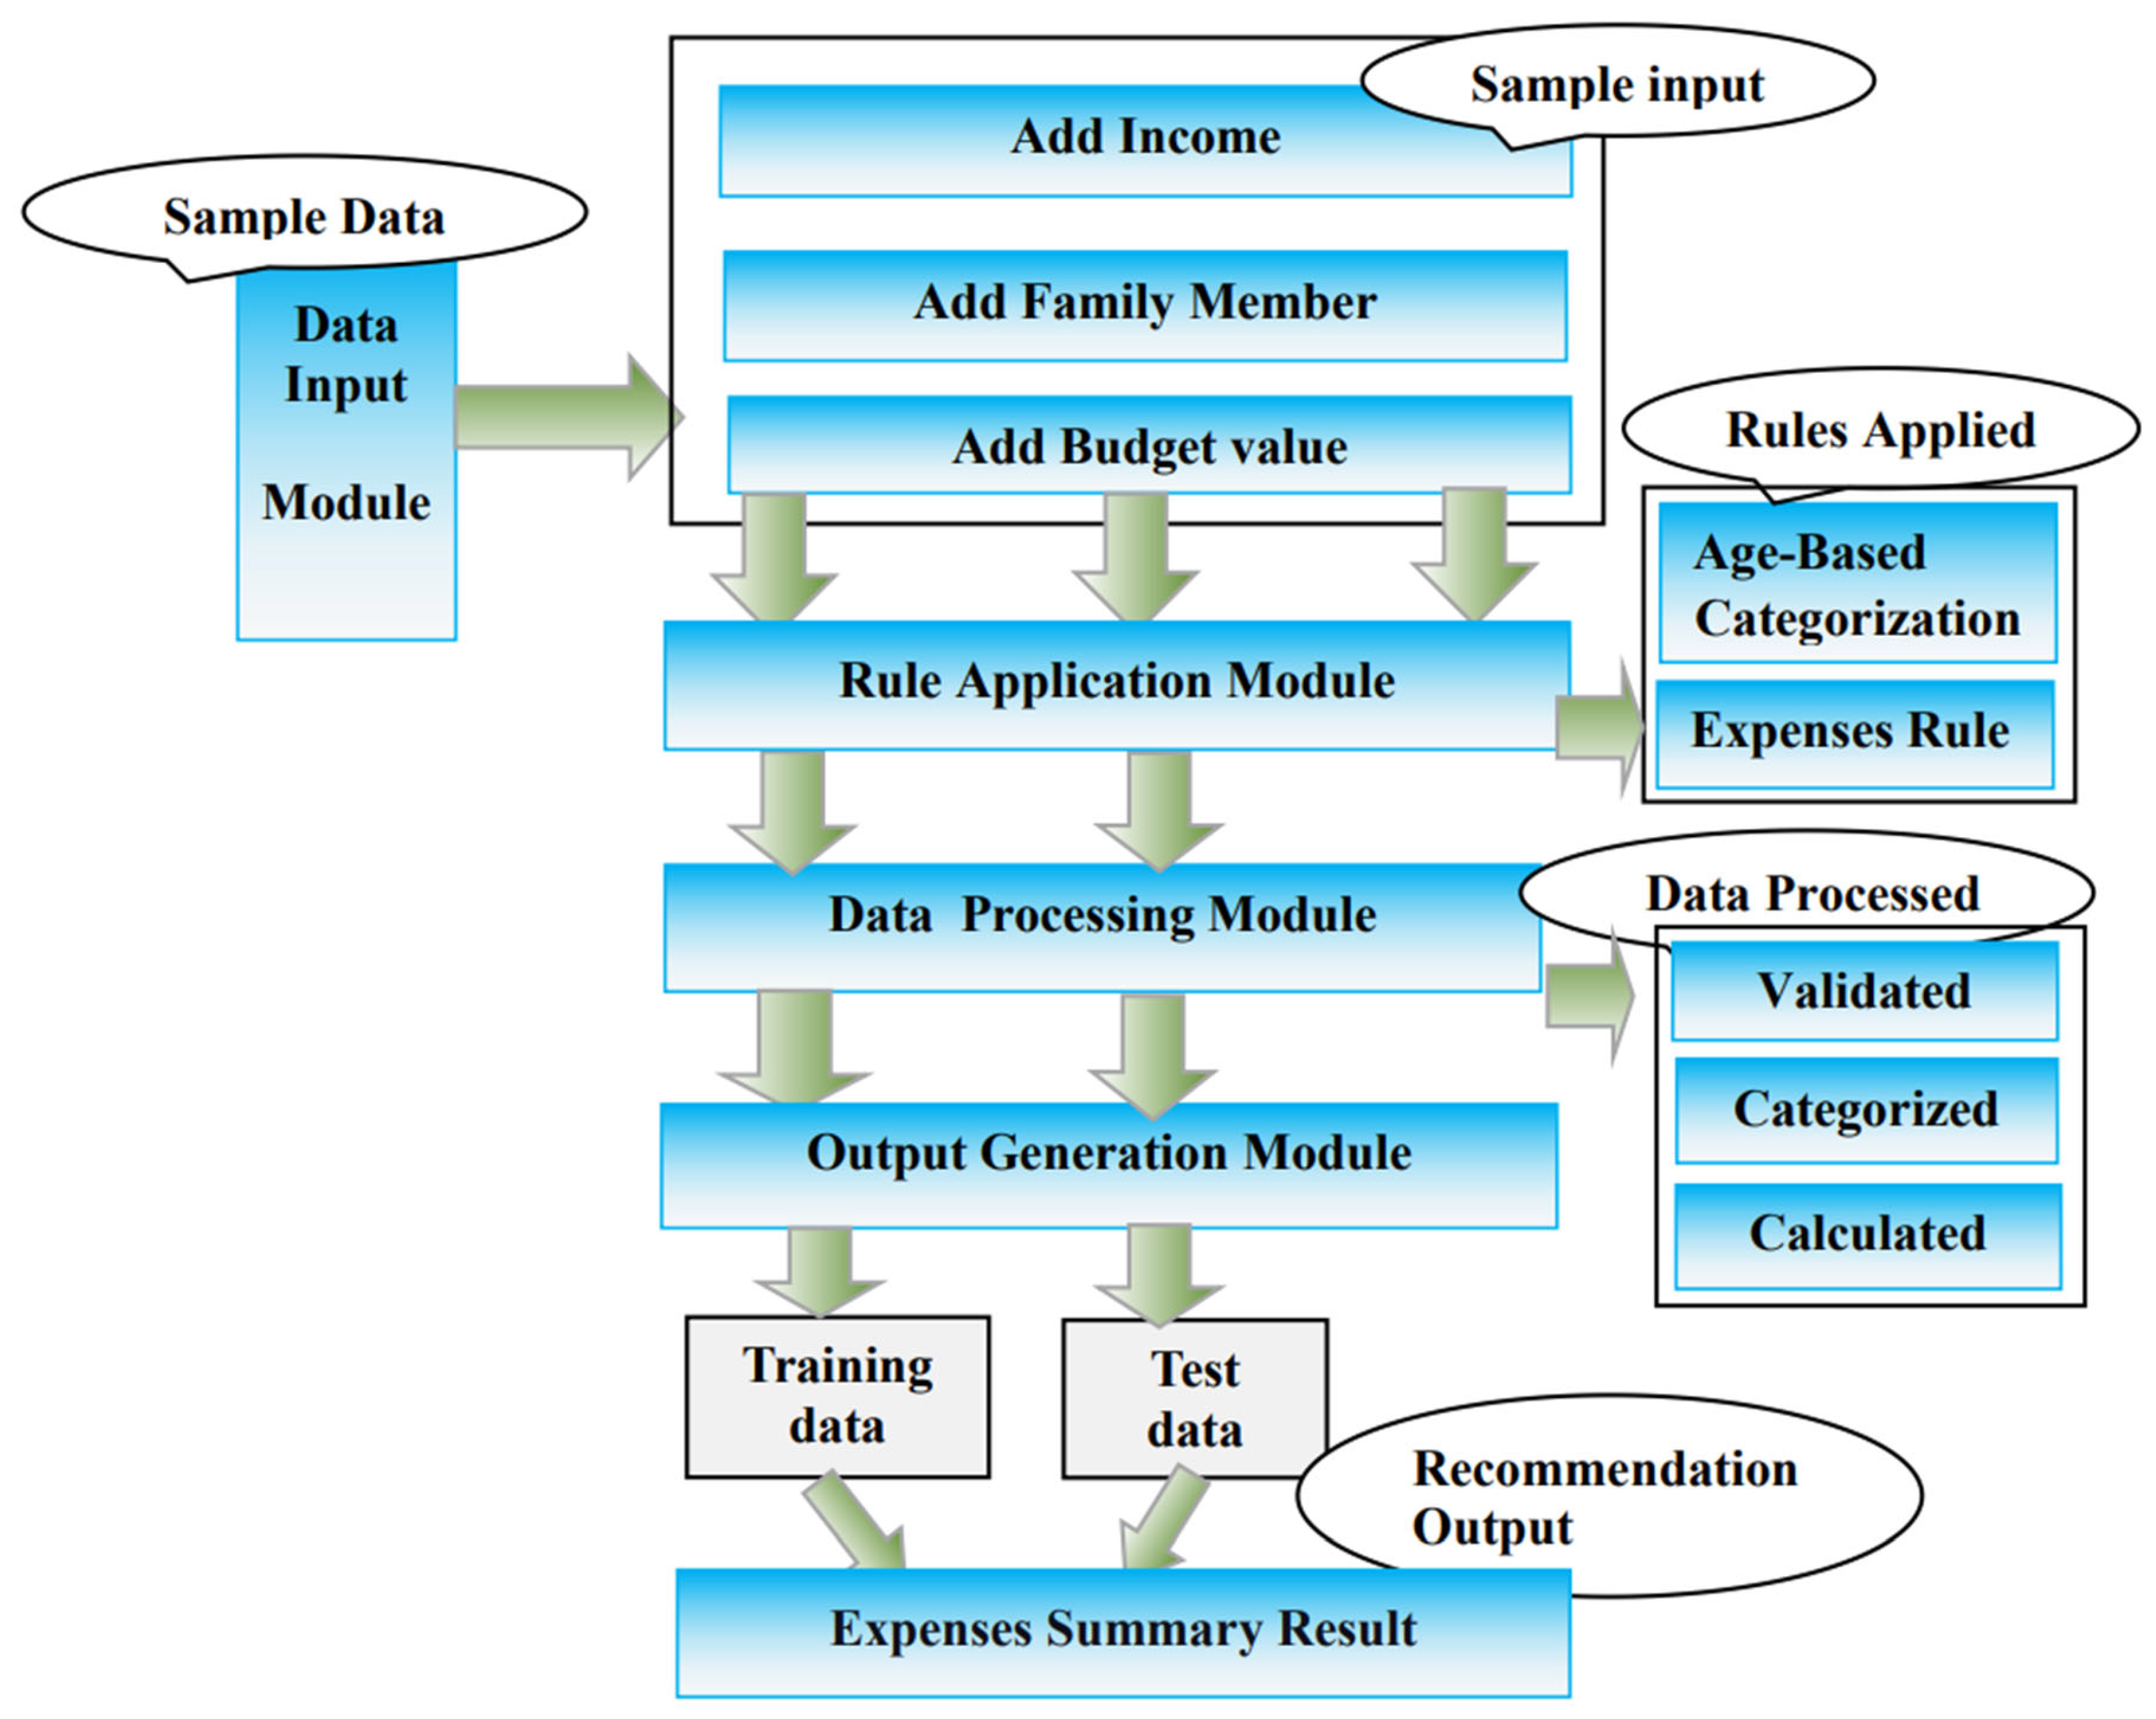
The system architecture consists of four primary modules:
- Data Input Module: Users enter income, family size, and budget details.
- Rule Application Module: Allocates expenses dynamically based on predefined rules.
- Data Processing Module: Validates and categorizes expenses.
- Output Generation Module: Displays financial summaries, recommendations, and budget status (cash in hand or debt payment).
The system ensures real-time budget tracking and dynamic allocation, making financial planning more accessible to users.
3.2.1. Data Input Module
Purpose: This module serves as the entry point for user data. It collects essential information from the user, such as:
- Income.
- Family details (number of members, their ages).
- Budget.
- Function: The collected data is sent to the next module for processing. This module ensures that the user can input necessary details easily and in an organized manner.
3.2.2. Rule Application Module
-
Purpose: This module applies predefined rules to dynamically allocate expenses. It determines how to distribute the users budget among different categories based on:
- Income levels
- Family members age groups
- The specific needs of each age group (e.g., housing, food, medical, education expenses).
- Function: The rules ensure that each category gets the appropriate allocation. For example, it will apply a rule that assigns a fixed percentage of income for housing, food, transportation, etc., or tailor certain expenses like education for children and insulin for adults and the elderly.
3.2.3. Data Processing Module
Purpose: This module performs the necessary validation and categorization of user input data. It processes the input to ensure that all the fields are filled correctly and that the rules are applied properly.
- Function: It checks for any inconsistencies or missing data and categorizes the input according to the predefined expense categories (housing, food, education, medical, etc.). This module makes sure that all expenses are correctly attributed to the respective family members and age groups.
3.2.4. Output Generation Module
Purpose: After processing the data and applying rules, this module generates and displays the final output.
-
Function: It presents the user with a detailed breakdown of their household budget. This includes:
- Recommendations based on the income and budget (e.g., whether the income covers the expenses).
- Financial summaries such as total expenses, cash in hand, or debt payment.
- A clear display of the expenses for each family member categorized by their age group (infant, child, teenager, adult, etc.).
- A visual representation of the data in colorful, easy-to-read tables.
1) Data Flow:
- From Input to Output: The data starts in the Data Input Module and flows through the Rule Application and Data Processing Modules before reaching the Output Generation Module.
- Validation & Categorization: Data is validated and categorized in the Data Processing Module, while the Rule Application Module ensures the correct allocation of budget to different expense categories.
- Output Display: Finally, the Output Generation Module displays the financial information in a user-friendly format.
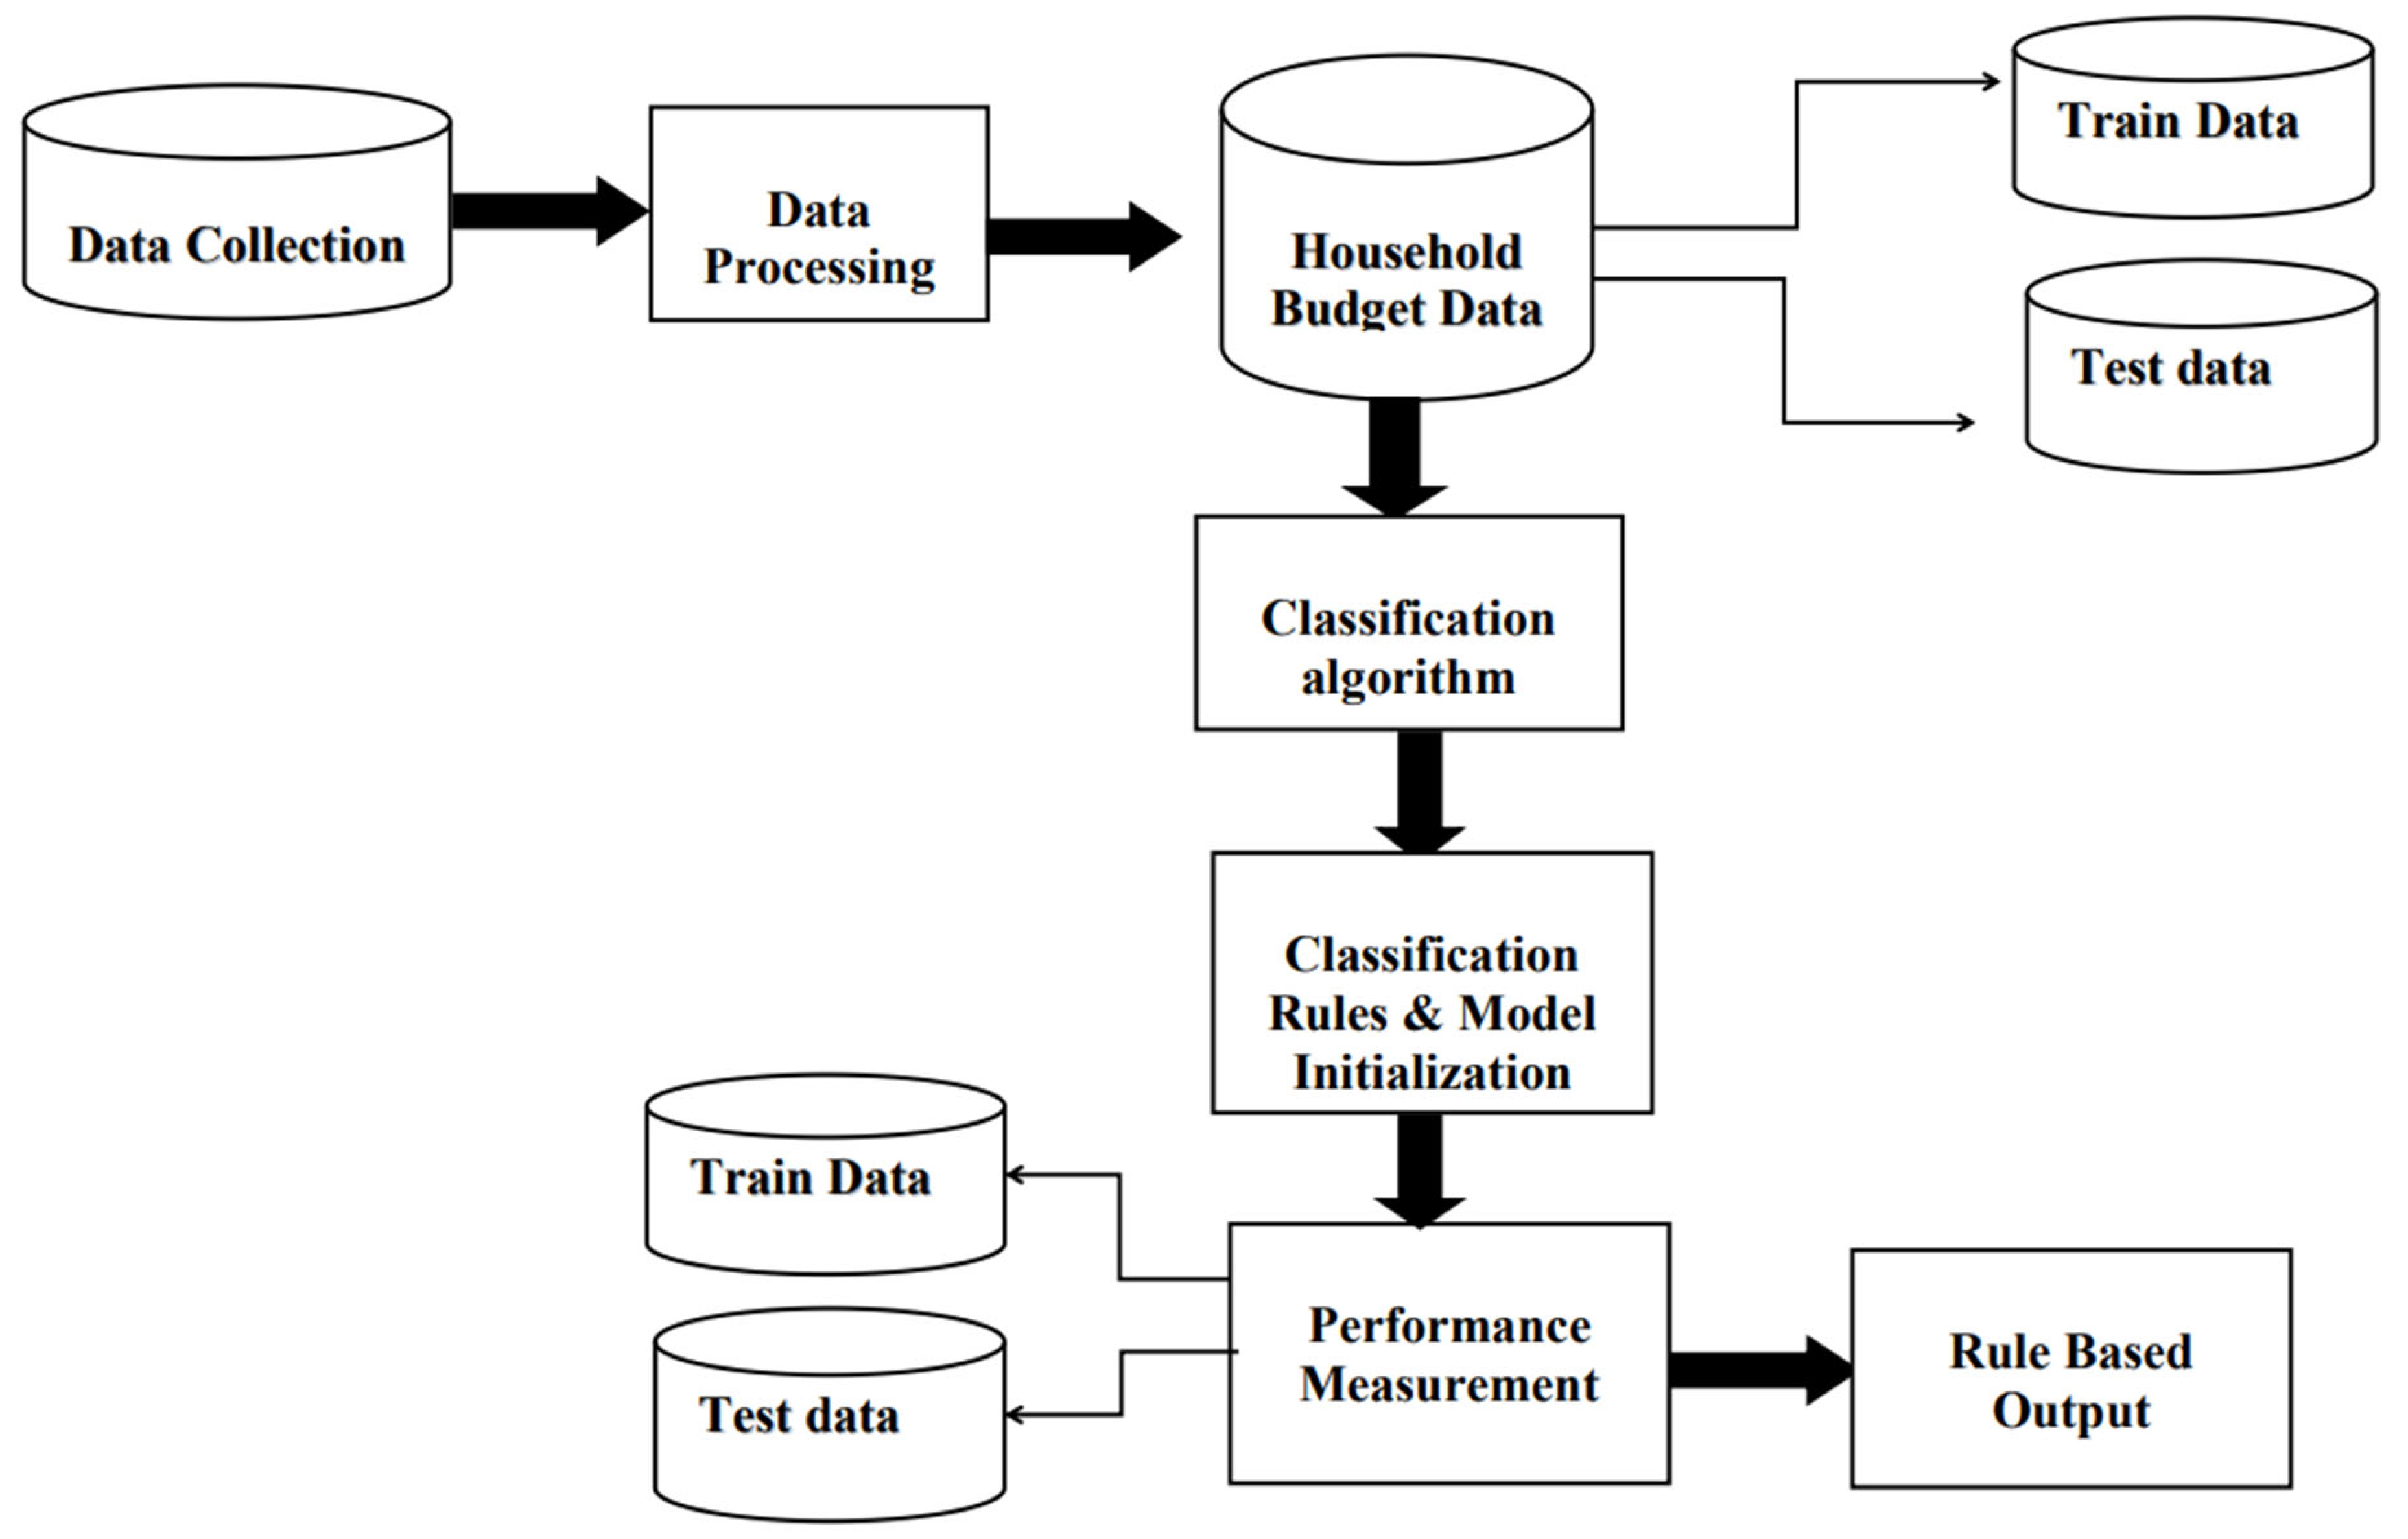
Below is a figure that outlines the steps for creating a rule-based household budget. The process begins with data collection, followed by data processing, which involves managing input and output using technologies such as HTML, CSS, and JavaScript. Next, three classification models are employed: Naive Bayes, K-Nearest Neighbors (KNN), and Rule-Based Initialization. These models are evaluated using training and test datasets to ensure accuracy and efficiency. Finally, the system generates a rule-based output, providing personalized recommendations for household budgeting.
Figure 3.2.
Steps for Creating a Rule-Based Household Budget.
3.3. Collecting Datasets Description
A household budget template is available online for free. Our thesis work can be accessed in Writer, Presentation, and Spreadsheet (WPS) formats. One such template can be found at http://www.wps.com/academy/the-best-family-budget-excel-template-for-free-download-quick-tutorials-1867631/. We downloaded a datasets containing 41,545 data entries from Kaggle, including 520 secondary data entries, along with additional primary data obtained from family members. For the development of this project, we used PHP, JavaScript, jQuery, AJAX, HTML, and CSS for both the front-end and back-end. Simple SQL queries were used for data retrieval, resulting in a total of 1,000 entries processed from CSV files imported into a MySQL database. These records were then used for further processing.
The data storage module is responsible for storing and processing information in a MySQL database. The front-end uses JavaScript for management, while PHP is utilized for data retrieval from the back-end and displaying results on the front-end.
3.4. Data Processing Module
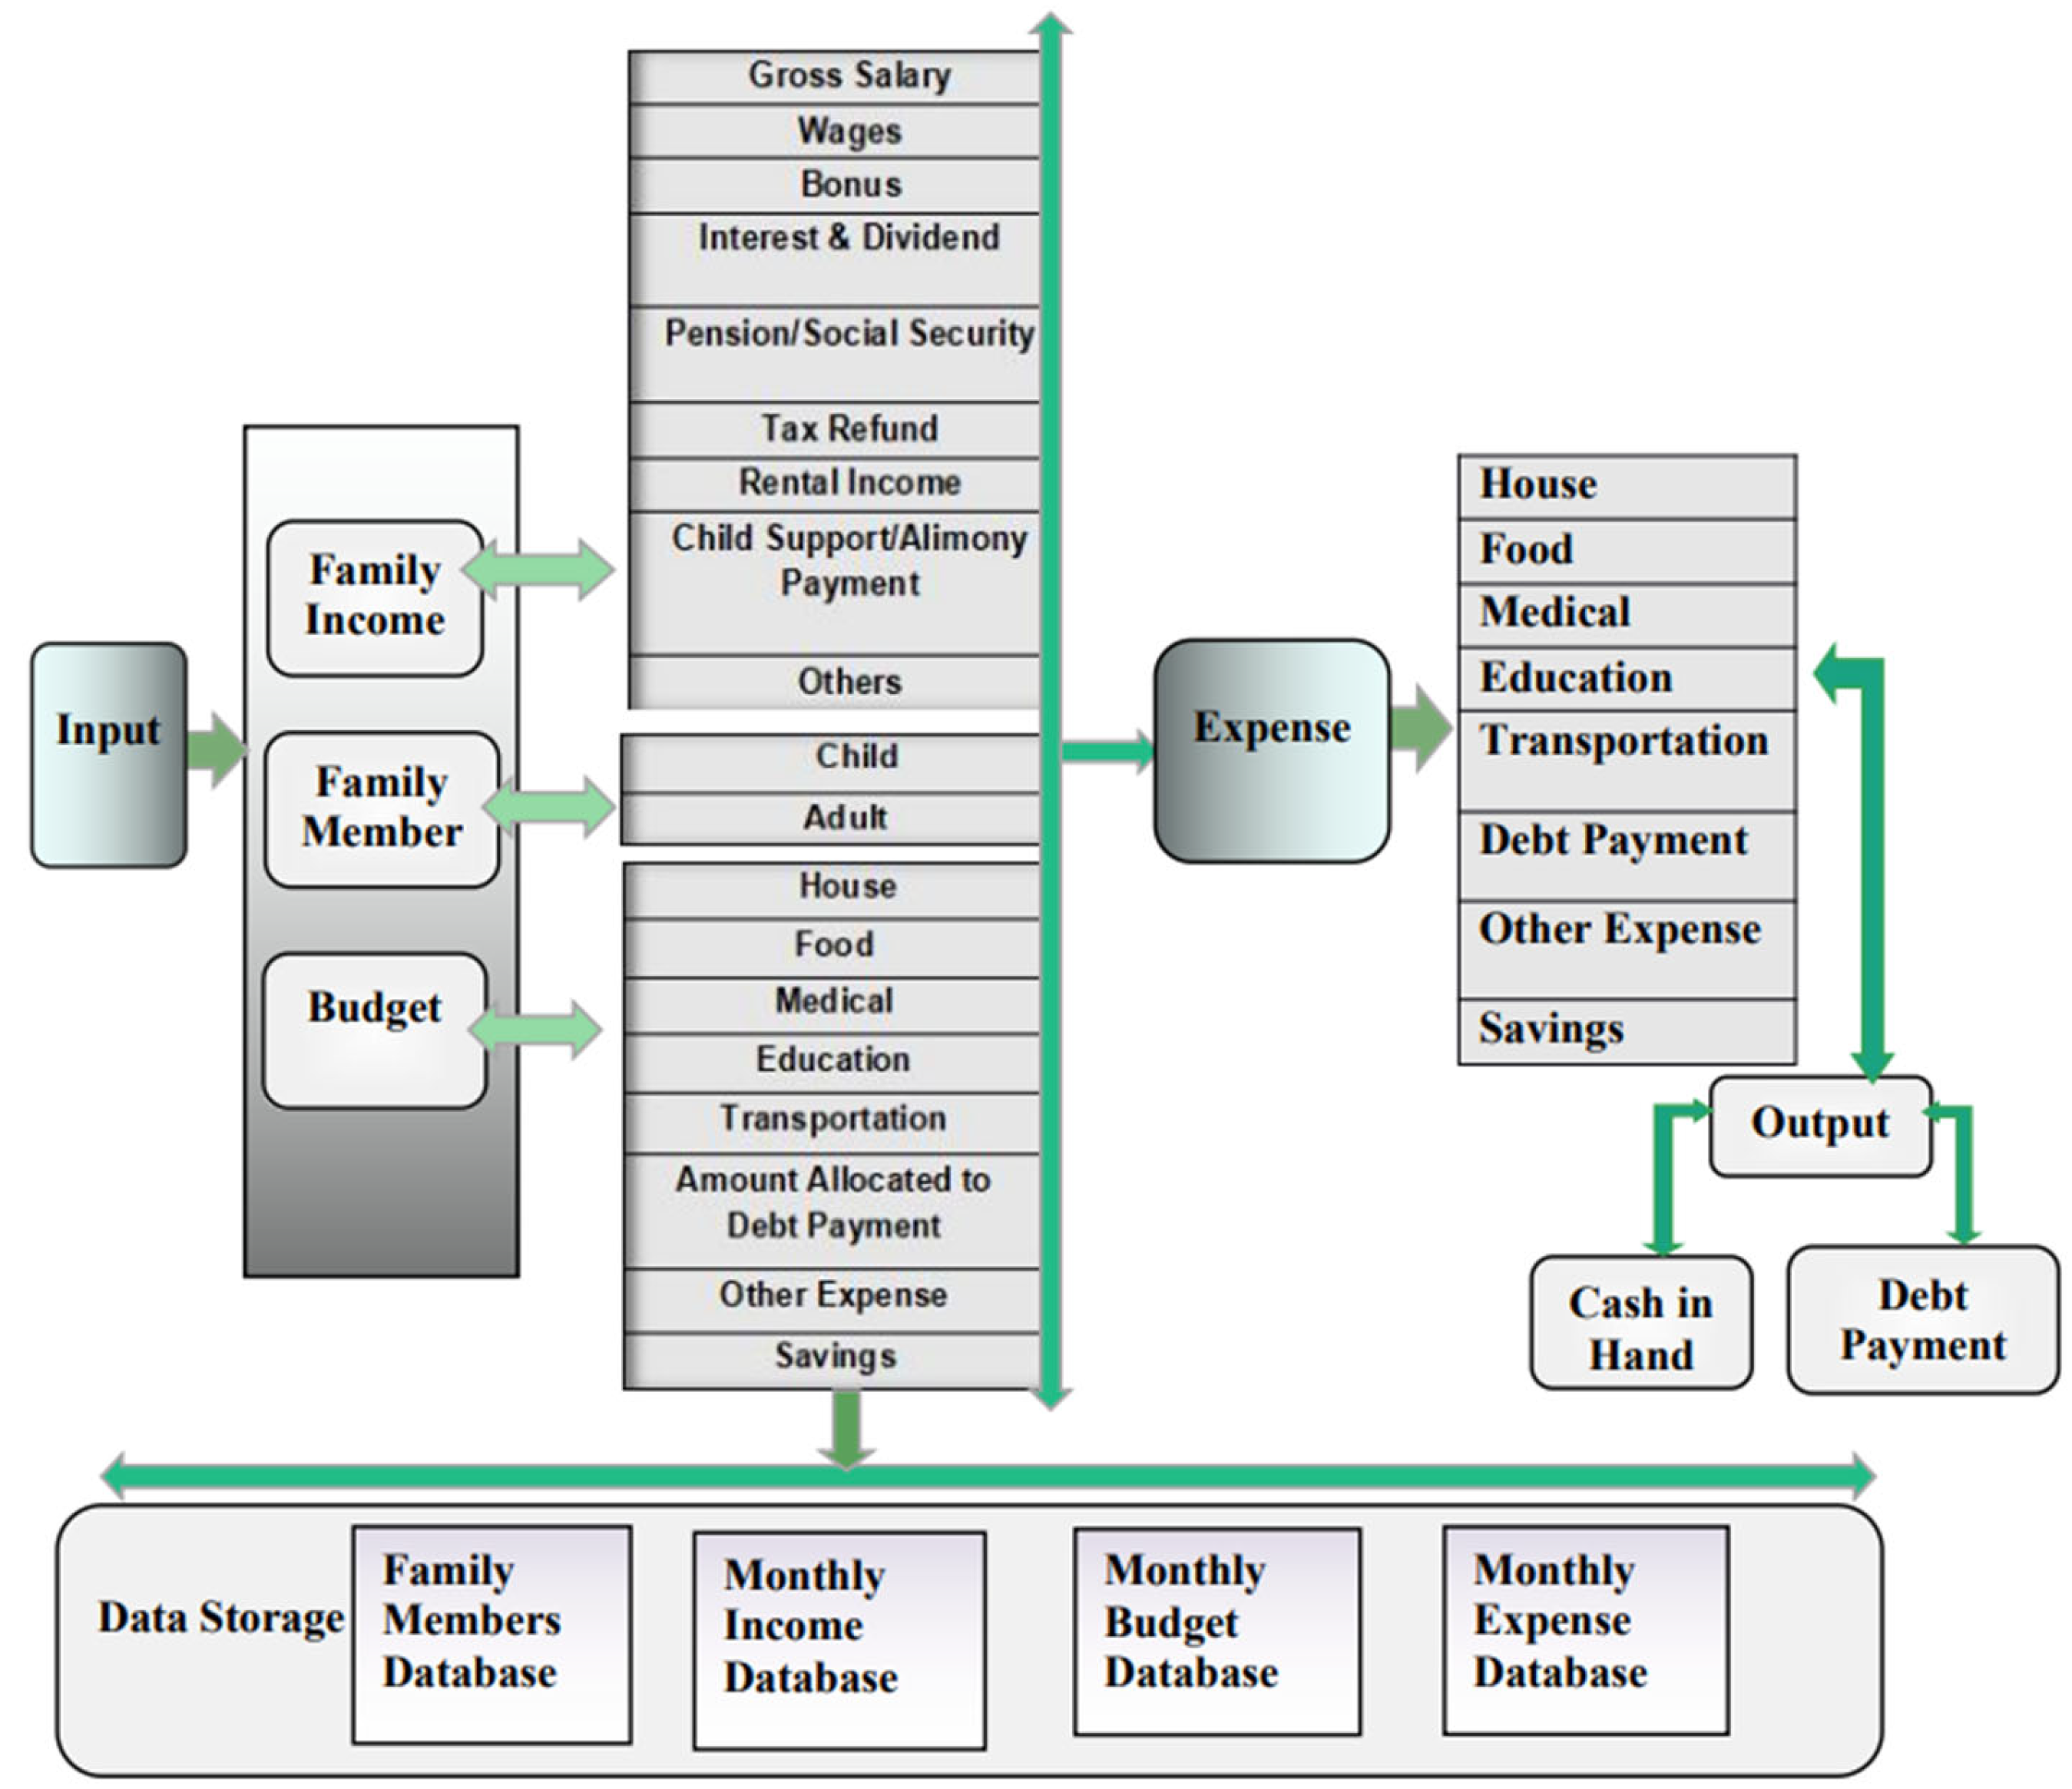
A processing module is essential for designing a household budget that balances income, expenses, and the number of family members. As depicted in Figure 3.3, the system architecture ensures the budget remains balanced across the categories:
- Housing.
- Food.
- Medical.
- Education.
- Transportation.
- Debt Payment.
- Other Expenses.
- Savings.
Single-directional arrows indicate the sequence of operations within each subcategory, while double-directional arrows highlight the relationships between them. Algorithm 2, detailed below, is designed to help users calculate an appropriate household budget by considering factors such as income, family size, and budget.
Data processing involves transforming raw input data into outputs suitable for analysis. The first step is data collection, which includes gathering information about family members, their income sources, and monthly budgets. The process also tracks all expenses across categories to determine monthly expenditures. After collection, the raw data is transformed into a format compatible with data mining and machine learning models. In this stage, databases are prepared to ensure the data is ready for analysis and subsequent processing.
We use HTML, CSS, and JavaScript to create the web page interface. For interaction with a MySQL server, we use PHP for server-side functionality. Using jQuery AJAX methods, we can retrieve data in formats such as text, HTML, XML, or JSON from a remote server through HTTP GET or POST requests. This data is dynamically loaded into the HTML elements of our web page.
For database management, we use Sublime Text as our text editor to write code. We display the output results via the XAMPP server, which is compatible with all Windows operating systems. XAMPP simplifies the setup of the MySQL database through phpMyAdmin, a process that only takes a few minutes. For data analysis, we employ Jupyter Notebook to train and test our datasets. It allows easy access to all databases and facilitates the necessary computations and model training.
When developing a rule-based system to recommend a household budget, our goal is to design an effective budget framework that provides personalized recommendations. This will help family members understand their spending habits and guide them toward a debt-free life by optimizing their expenses.
Figure 3.3.
Details of the Processing Module for the Household Budget Recommendation System.
3.5. Establish Three Classification Models for Comparison
In the section below, describe the three classifiers: K-nearest neighbor, Naive Bayes and rule-based classifiers. Try to determine which one is the best for household budget recommendation based on their rules. This will help establish which classifier is most suitable for recommending a household budget.
3.5.1. K Nearest Algorithm
The K-Nearest Neighbor (KNN) algorithm is a simple and widely-used technique in Machine Learning that relies on Supervised Learning. It classifies new data points based on their similarity to existing data. The underlying principle is that data points with similar attributes are likely to belong to the same category or have similar values.
During the training phase, the KNN algorithm stores the entire training datasets as a reference. When making predictions, it calculates the distance between the input data point and all training examples using a chosen distance metric, such as Euclidean Distance.
Formula for Euclidean Distanc
Let a and n be two n-dimensional vectors. The Euclidean Distance between a and n is defined as:
where:
- a represents the input data point.
- n represents a data point from the training set.
In our case, the following features are used to calculate distances:
- Income (Xincome): Family members income.
- Food Expenditure (Xfood): Monthly spending on food.
- Medical Expenditure (Xmedical): Monthly medical costs.
- Other Expenditure (Xother): Spending on non-essential or miscellaneous items.
We use a training dataset containing the following attributes:
- Family income.
- Family size (number of members and their age group).
- Budget.
- Housing expenditures.
- Food expenditures.
- Medical expenditures.
- Education expenditures.
- Transportation.
- Other expenditures.
- Debt expenditures.
- Savings.
Workflow of KNN for Household Budget
-
Training Phase:
- Store the entire training datasets, including income, family size, and various expenditures.
-
Distance Calculation:
- For a new data point, calculate its distance to every data point in the training set using the Euclidean Distance formula.
-
Neighbor Selection:
- Identify the k nearest neighbors based on the calculated distances.
-
Majority Voting:
- Determine the class of the new data point by taking the majority class among its k nearest neighbors.
-
Classification Output:
- Assign the new data point to the category predicted by majority voting (e.g., "lower-middle," "middle," "rich").
1) Step 1: Training Phase
The training datasets is provided, and we store all data points with their features. Features: Family Members, Budget, Housing Cost, Food Cost, Medical Cost, Education Cost, Transport Cost, Debt Cost, Other Cost, Saving. Target (class label): Family Income classification (e.g., "Low," "Middle," "High").

Table 3.1.
Sample value for calculating K NearesNeighbour.
| Family Income |
Family Members |
Budget |
Housing Cost |
Food Cost |
Medical Cost |
Education Cost |
Transport Cost |
Debt Cost |
Other Cost |
Saving |
| 18395 | 11 | 18000 | 4446 | 15798 | 0 | 3452 | 2049 | 200 | 0 | 0 |
| 25800 | 11 | 25000 | 3780 | 21781 | 74 | 129 | 0 | 0 | 987 | 0 |
| 26765 | 11 | 26000 | 11610 | 66174 | 46 | 75 | 55904 | 24 | 0 | 0 |
| 30721 | 10 | 30000 | 5790 | 16450 | 1168 | 468 | 0 | 0 | 1845 | 5000 |
| 48802 | 6 | 48000 | 8766 | 24141 | 0 | 3120 | 2405 | 180 | 15000 | 0 |
| 49437 | 7 | 49000 | 9750 | 16703 | 7724 | 1176 | 0 | 3000 | 1084 | 10000 |
| 50102 | 11 | 50000 | 5484 | 37111 | 210 | 1290 | 0 | 0 | 6007 | 0 |
| 105200 | 10 | 105000 | 13000 | 73299 | 812 | 2440 | 850 | 0 | 14281 | 0 |
| 500000 | 12 | 500000 | 85080 | 213816 | 19320 | 25800 | 85 | 0 | 112120 | 50000 |
| 600000 | 11 | 600000 | 93780 | 306132 | 22880 | 11600 | 180 | 0 | 107482 | 50000 |
| 740110 | 11 | 740000 | 84000 | 181926 | 11060 | 2000 | 0 | 0 | 158129 | 0 |
| 10518 | 13 | 105000 | 67740 | 238375 | 28910 | 45000 | 0 | 120 | 133418 | 500000 |
Table 3.2.
Distance Calculation of all attributes.
| Family Income | Family Members | Budget | Housing Cost | Food Cost | Medical Cost | Education Cost | Transport Cost | Debt Cost | Other Cost | Saving | Distance |
| 18395 | 11 | 18000 | 4446 | 15798 | 0 | 3452 | 2049 | 200 | 0 | 0 | 52315.80 |
| 25800 | 11 | 25000 | 3780 | 21781 | 74 | 129 | 0 | 0 | 987 | 0 | 56720.16 |
| 30721 | 10 | 30000 | 5790 | 16450 | 1168 | 468 | 0 | 0 | 1845 | 5000 | 56768.42 |
| 49437 | 7 | 49000 | 9750 | 16703 | 7724 | 1176 | 0 | 3000 | 1084 | 10000 | 66945.35 |
| 48802 | 6 | 48000 | 8766 | 24141 | 0 | 3120 | 2405 | 180 | 15000 | 0 | 70097.15 |
| 50102 | 11 | 50000 | 5484 | 37111 | 210 | 1290 | 0 | 0 | 6007 | 0 | 75731.87 |
| 26765 | 11 | 26000 | 11610 | 66174 | 46 | 75 | 55904 | 24 | 0 | 0 | 96345.30 |
| 105200 | 10 | 105000 | 13000 | 73299 | 812 | 2440 | 850 | 0 | 14281 | 0 | 132601.06 |
| 500000 | 12 | 500000 | 85080 | 213816 | 19320 | 25800 | 85 | 0 | 112120 | 50000 | 559003.51 |
| 10518 | 13 | 105000 | 67740 | 238375 | 28910 | 45000 | 0 | 120 | 133418 | 500000 | 579903.63 |
| 600000 | 11 | 600000 | 93780 | 306132 | 22880 | 11600 | 180 | 0 | 107482 | 50000 | 684722.14 |
| 740110 | 11 | 740000 | 84000 | 181926 | 11060 | 2000 | 0 | 0 | 158129 | 0 | 779111.05 |
Step 2: Distance Calculation
Here is how i can calculate the distance for the row as an example:
When Attributes: {18395,11,18000,4446,15798,0,3452,2049,200,0,0}
- i.
- Square each attribute:
18395^2 + 11^2 + 18000^2 + 4446^2 + 15798^2 + 0^2 + 3452^2 + 2049^2 + 200^2 + 0^2 + 0^2
· 183952=338,355,025
· 112=12111^2 = 121112=121
· 180002=324,000,00018000^2 = 324,000,000180002=324,000,000
· 44462=19,756,9164446^2 = 19,756,91644462=19,756,916
· 157982=249,755,60415798^2 = 249,755,604157982=249,755,604
· 02=00^2 = 002=0
· 34522=11,906,9043452^2 = 11,906,90434522=11,906,904
· 20492=4,199,0012049^2 = 4,199,00120492=4,199,001
· 2002=40,000200^2 = 40,0002002=40,000
· 02=00^2 = 002=0
· 02=00^2 = 002=0
- ii.
- Add the squares:
338,355,025+121+324,000,000+19,756,916+249,755,604+0+11,906,904+4,199,001+40 =5233155
- iii.
- Take the square root:
3. Nearest Neighbors (k=3)
The 3 closest data points (smallest distances):
Table 3.3.
Smallest Distance Calculation of all attributes.
| Family Income | Family Members | Budget | Housing Cost | Food Cost | Medical Cost | Education Cost | Transport Cost | Debt Cost | Other Cost | Saving | Distance |
| 18395 | 11 | 18000 | 4446 | 15798 | 0 | 3452 | 2049 | 200 | 0 | 0 | 52315.80 |
| 25800 | 11 | 25000 | 3780 | 21781 | 74 | 129 | 0 | 0 | 987 | 0 | 56720.16 |
| 30721 | 10 | 30000 | 5790 | 16450 | 1168 | 468 | 0 | 0 | 1845 | 5000 | 56768.42 |
4. Majority Voting
Among the selected rows:
- Row 3: Family Income = 30721, Distance = 56768.42
- Row 0: Family Income = 18395, Distance = 52315.8
- Row 1: Family Income = 25800, Distance = 56720.16
Since all have equal frequency, we choose the one with the smallest distance: 18395.
5. Classification Output
Predicted Family Income = 18395.
We will now use New Entry 1 (Income: 100,000) and New Entry 2 (Income: 200,000) to calculate the KNN classification.
Step 1: Training Data Table
Table 3.4.
Sample value for calculating the K nearest values.
| Family Income | Family Members | Budget | Housing Cost | Food Cost | Medical Cost | Education Cost | Transport Cost | Debt Cost | Other Cost | Saving | Distance |
| 18395 | 11 | 18000 | 4446 | 15798 | 0 | 3452 | 2049 | 200 | 0 | 0 | 52315.80 |
| 25800 | 11 | 25000 | 3780 | 21781 | 74 | 129 | 0 | 0 | 987 | 0 | 56720.16 |
| 30721 | 10 | 30000 | 5790 | 16450 | 1168 | 468 | 0 | 0 | 1845 | 5000 | 56768.42 |
| 100000 | 8 | 80000 | 10000 | 30000 | v | v | 3000 | 500 | 1500 | 50000 | 114,857 |
| 200000 | 6 | 150000 | 20000 | 40000 | 3000 | 2000 | 4000 | 1000 | 2000 | 60000 | 13724 |
Step 2: Calculate Distances
Lets calculate the Euclidean distance for two new data entries, 100,000 and 200,000, compared to our existing datasets. For each training data point, we will calculate the squared differences for each attribute and sum them.
Table 3.5.
Sample value for calculating the K nearest values.
| Attribute | Training Data (Row 1) | New Data 1 (100,000) | Squared Difference (Pi−Qi)^2 | Squared Difference(Pi−Qi)^2 |
| Family Income | 18,395 | 100,000 | (18395−100000)^2=6660162025 | (18395 - 200000)^2 = 3303026025 |
| Family Members | 11 | 8 | (11 - 8)^2 =9 | (11 - 6)^2 =25 |
| Budget | 18,000 | 80,000 | (18000−80000)^2=3844000000 | (18000 - 150000)^2 = 12960000000 |
| Housing Cost | 4,446 | 10,000 | ((4446 - 10000)^2 =30714516 | (4446 - 20000)^2 = 225116004 |
| Food Cost | 15,798 | 30,000 | (15798 - 30000)^2 = 201616804 | (15798 - 40000)^2 = 585648004 |
| Medical Cost | 0 | 2,000 | (0 - 2000)^2=4000000 | (0 - 3000)^2 = 9000000 |
| Education Cost | 3,452 | 1,000 | (3452 - 1000)^2 = =6038416 | (3452 - 2000)^2 = 2109024 |
| Transport Cost | 2,049 | 3,000 | (2049 - 3000)^2 =902401 | (2049 - 4000)^2 = 3902001 |
| Debt Cost | 200 | 500 | (200 - 500)^2=90000 | (200 - 1000)^2 = 640000 |
| Other Cost | 0 | 1,500 | (0 - 1500)^2=2250000 | (0 - 2000)^2 = 4000000 |
| Saving | 0 | 50,000 | (0 - 50000)^2 = 2500000000 | (0 - 60000)^2 = 3600000000 |
Euclidean Distance: Sum of Squared Differences for New Data 1 (100,000):
6660162025+9+3844000000+30714516+201616804+4000000+6038416+902401+90000+2250000+2500000000=13179453671
Euclidean Distance for New Data 1 (100,000):
≈114,857
Sum of Squared Differences for New Data 2 (200,000):
3303026025+25+12960000000+225116004+585648004+9000000+2109024+3902001+640000+4000000+3600000000=18821228159
Euclidean Distance for New Data 2 (200,000):
≈13724
Step 3: Sort the Distances and Select Neighbors
After calculating the distances for each training row, we will sort them in ascending order and choose the k-nearest neighbors (e.g., k=3).
a) Sorted Distances for New Data 1 (100,000):
- i.
- Row 1: Distance = 114,857
- ii.
- Row 2: Distance = 25800
- iii.
- Row 3: Distance = 30721
b) Sorted Distances for New Data 2 (200,000):
- i.
- Row 1: Distance = 13,724
- ii.
- Row 2: Distance =25800
- iii.
- Row 3: Distance = 30721
Step 4: Majority Voting (Classification Output)
Lets assume the classification is based on Family Income. The classes are defined as:
- Low Income (L): ≤ 30,000
- Middle Income (M): 30,001 - 100,000
- High Income (H): > 100,000
For New Data 1 (100,000):
- The 3 nearest neighbors: Row 1 (L), Row 2 (L), Row 3 (M).
- Predicted class: Middle Income (M).
For New Data 2 (200,000):
- The 3 nearest neighbors: Row 1 (L), Row 2 (L), Row 3 (M).
- Predicted class: High Income (H).
Table 3.6.
Sample value for calculating class.
| Family Income | Class |
| 18,395 | L |
| 25,800 | L |
| 26,765 | L |
| 30,721 | M |
| 48,802 | M |
| 49,437 | M |
| 50,102 | M |
| 105,200 | H |
| 500,000 | H |
| 600,000 | H |
| 740,110 | H |
Now we have the sorted distances, we can perform majority voting based on the k nearest neighbors.
- For New Data 1 (100,000): After sorting the distances, we check the classes of the 3 nearest neighbors. If most of them belong to the middle class, the predicted class for New Data 1 will be middle.
- Similarly, for New Data 2 (200,000): After sorting the distances, we check the classes of the 3 nearest neighbors. If most of them belong to the middle class, the predicted class for New Data 2 will be high.
3.5.2. Naive Bayes
Naive Bayes assumes that the features (predictors, such as income, food expenditure, etc.) are conditionally independent given the class (in this case, income class). This simplification allows for straightforward calculations of the posterior probability. In this case, the income class (P(A)) would be the class, and features such as household expenditures (P(B)) would be the predictors.
The formula for Bayes Theorem is:
where
P(A|B) is the posterior probability of class A (income class), given the features (expenditures).
P(A) is the prior probability of class A (income class).
P(B)is the evidence or the total probability of the features.
P(B|A) is the likelihood of the features given the class (conditional probability of expenditures given income).
3.5.2.1. Dataset Description
In this study, the expenses of each household in the datasets were distributed and categorized based on their total income. The file contained raw data with various sample attributes, including:
- Total household income.
- Housing expenditure.
- Total food expenditures.
- Education expenditures.
- Medical expenditures.
- Transport expenditures.
- Debt payment expenditures.
- Other expenses.
- Savings.
Table 3.7.
Sample Raw Data.
| Net Income | Family Member | Total Housing Cost | Total Food Cost | Total Medical Cost | Total Education Cost | Total Transport Cost | Total Dept Cost | Other Cost | Saving |
| XX | XX | XX | XX | XX | XX | XX | XX | XX | XX |
| XX | XX | XX | XX | XX | XX | XX | XX | XX | XX |
| XX | XX | XX | XX | XX | XX | XX | XX | XX | XX |
Table 3.10 provides an overview of the attributes in the raw data. Each household in the datasets included information on income, family members, and total expenditures. Income data was classified into classes, with the original annual household income converted into a monthly equivalent by dividing it by 12.
3.5.2.2. Feature Selection and Data Transformation
- Feature Selection:
Predictors: Expenditures (Housing Cost, Food Cost, etc.)
Target Variable: Income class (categorized into ranges: Low, Middle, High)
b. Data Transformation: We can categorize Family Income into classes, for example:
- Low Income (L): ≤ 30,000
- Middle Income (M): 30,001 - 100,000
- High Income (H): > 100,000
Table 3.8.
Monthly Income Range and Income Class.
| Monthly Income Range | Income Class |
| P5000-8000 | Lower |
| P9000-11000 | Lower |
| P10000-20000 | Lower |
| P20011-30000 | Lower |
| P30038-60000 | Middle |
| P60100-80000 | Middle |
| P80600-100000 | Middle |
| P100004-200000 | High |
| P203675-300000 | High |
| P300300-above | High and rich |
3.5.2.3. Empirical Research Design
Managing household budgets involves tracking essential expenditures such as food, housing, utilities, transportation, and medical costs. By analyzing these, families can better plan savings, manage unforeseen expenses, and maintain financial stability.
In this section, we will provide a brief overview of binary classification using the naive Bayes algorithm. The naive Bayes algorithm is a classification algorithm that is based on Bayes rule. It assumes that the income attributes (I1 to In) are independent of each other, given the housing rent attributes (H1 to Hi). This assumption simplifies the representation of P(I/H) significantly.
Given the attributes of income I1...In and food expenses F1...Fi. according to the naive Bayes classification rule as shown in equation (2)
Given the attributes of income I1...In and medical expenses M1...Mi. according to the naive Bayes classification rule as shown in equation (3)
Given the attributes of income I1...In and education expenses E1...Ei. according to the naive Bayes classification rule as shown in equation (4)
Given the attributes of income I1...In and transport expenses T1...Ti. according to the naive Bayes classification rule as shown in equation (5)
Given the attributes of income I1...In and dept payment expenses DP1...DPi. according to the naive Bayes classification rule as shown in equation (6)
Given the attributes of income I1...In and other expenses O1...Oi. according to the naive Bayes classification rule as shown in equation (7)
Given the attributes of income I1...In and saving expenses S1...Si. according to the naive Bayes classification rule as shown in equation (8)
The model presented above provides a summary of a naive Bayes classifier. This classifier assumes that the data for income (variable A) is generated by a mixture of class-conditional, while the variables housing, food, medical, education, transport, debt payment, other expenses, and savings (variable B) are dependent on the value of the class variable.
3.5.2.4. Feature Scores and Interpretation
Table 3.9.
shows the selected features and their scores.
| Features | Scores |
| Total Housing expenditure | 0.0158 |
| Total Food expenditure | 0.0766 |
| Total Education expenditure | 1.117 |
| Total Medical expenditure | 0.00074 |
| Total Transport expenditure | 0.00024 |
| Total Dept Payment expenditure | 0.000135 |
| Total other expenditure | 1.708 |
| Total Saving | 0.00002428 |
Among these, Other Expenditure has the highest score (1.708), making it the most important predictor of income class. This indicates that families should monitor and reduce excessive spending in this category, as it represents a significant portion of their income (44% in this case). Identifying and controlling high-spending areas is essential for effective budget management.
3.5.3. Rule-Based System for Household Budget Recommendations
A rule-based system is a logical framework that uses predefined rules and facts to solve problems and assist in decision-making. This system recommends household budgets by taking into account factors such as income, the number of family members, and transactions. It generates a tailored budget and evaluates expenses, indicating whether the plan is balanced, over budget, or under budget.
3.5.3.1. Components of the Rule-Based System
The rule-based system includes three core components:
- Rules: Logical conditions and actions for budget recommendations.
- Working Memory: Stores facts, user inputs, and intermediate results.
- Inference Engine: Matches rules against facts to draw conclusions.
The inference engine compares input data (income, budget, and expenses) against predefined rules. Based on matches, it outputs recommendations for expense allocation, debt management, and savings.
| Algorithm 1: Backhand_DB |
|
Input: user_name and password Output: Login success or failure message
End. |
The following algorithm are meant to gather written feedback as input, which is then processed to identify the corresponding sub-categories of the household budget. To get started, we will need to enter the number of family members and their income. Based on this information, we will calculate the percentage over budget for the overall budget, giving us a better understanding of the project scope. We will then subtract the total actual expenses from the budgeted amount to determine the difference. A good budget should also include regular allocations for savings, in addition to regular expenses. If the expenses match the budget, the household budget will be balanced. If not, the output will be negative, otherwise it will be positive.
Algorithm 2: Processing Written Feedback for Household Budget
- Input: Number of family members, their income, and the monthly budget.
- Calculate: The total expenses for various categories (e.g., housing, food, medical, transportation).
-
Compare: Budgeted vs. actual expenses.
- If budget ≥ expenses, the household budget is balanced.
- If budget < expenses, display a negative balance and recommend debt payment.
- Allocate: Any remaining budget to savings or debt repayment as needed.
- Output: A summary of budget status, expense categories, and recommendations for savings or adjustments.
| Algorithm 2: Finding a Rule-Based Household Budget |
Input:
Output: Allocation results for expenses, debt payment, and savings.
End. |
3.5.3.2 Modules of the Household Budget System
- a)
- Record Family Income & Budget
-
Input:
- Income Sources (e.g., salaries, rental income, business, etc.).
- Enter the Total Monthly Income.
- Enter the Planned Monthly Budget.
-
System Action:
- The system will calculate the available budget based on income sources and planned budget.
- Display whether income is sufficient or insufficient to meet the budget.
- If income < expenses, suggest cost-cutting or debt management strategies.
- b). Record Family Members
-
Input:
- ◆
- Number of Family Members: User inputs how many members to include.
- ◆
- Age Group of Family Members: The system will categorize family members into age groups such as Infant, Child, Teenager, Adult, Middle-aged, and Old.
-
System Action:
- ◆
- Based on the age group, the system will assign appropriate categories for expenses (e.g., Cereal for Infants, Education for Children, Medical care for the Elderly).
- ◆
- Expenses will be dynamically adjusted based on the age of the member and the assigned category.
- 1)
-
3. Estimate Contingency Expenses
-
Input:
- ◆
- Allocate a fixed or flexible percentage of income to Contingency Fund (e.g., 5% of total income).
-
System Action:
- ◆
- Track unexpected expenses (e.g., urgent repairs, medical emergencies).
- ◆
- Allow the user to adjust the contingency fund for flexibility, ensuring they stay within budget.
- ◆
- The system will also show a progress tracker for achieving financial goals while managing contingency expenses.
-
- 2)
-
4. Track Expenses
-
Input:
- ◆
-
Categorized Expenses:
- ■
- Housing, Food, Education, Medical, Transportation, Debt, Other Expenses, and Savings.
- ■
- Users input the actual spending amounts for each category.
-
System Action:
- ◆
- Monitor and compare actual expenses against the allocated budget.
- ◆
- Show a summary of spending trends, identifying areas of overspending.
- ◆
- The system will generate alerts or recommendations for adjustments (e.g., Reduce Discretionary Spending or Increase Income Sources)
-
Table 3.10.
rules for each age group in our household budget system:.
| Age Group | Food Expenses | Education Expenses | Medical Expenses |
| Infant (Age < 5) | Only cereal is included (no rice, meat, or vegetables). | None | Basic care like vaccinations and check-ups. |
| Child (Age 5–10) | Full range: rice, flour, oil, fish, milk, etc. | Primary education (school fees, books, supplies). | General care for common childhood illnesses. |
| Teenager (Age 10–18) | Full range: rice, flour, oil, fish, meat, vegetables. | Secondary education (tuition, supplies). | Seasonal illnesses or injury treatments. |
| Young Adult (Age 18–25) | Full range, higher consumption of protein (meat, fish). | Higher education (college fees, textbooks). | Regular check-ups, dental care, insulin (if needed). |
| Middle-aged Adult (Age 30–50) | Full range, focus on healthy items (vegetables, fish). | None (unless personal education is pursued). | Regular health maintenance (e.g., blood pressure medicine). |
| Elderly (Age > 50) | Softer food options like vegetables for easier consumption. | None (unless pursuing adult education). | Frequent care for age-related conditions (e.g., insulin, chronic illness medicines). |
- A. Budget Estimate Rule
This component allows users to create a household budget by estimating how much of their income they need to spend each month and allocating that money accordingly. A well-structured budget plays a crucial role in determining how much of the income is available for various expenses and savings. Users input their income and monthly budget. The system analyzes the entered values based on the family members financial situation and evaluates whether the budget is sufficient or needs adjustments.
-
Budget is Adequate: When the allocated amount is less than or equal to income.Cash in hand = Income≤ Budget
-
Budget is Insufficient: When the allocated amount exceeds income.Debt Payment = Income < BudgetWhere:INCOME = the users total incomeCOST = the total amount of the users total periodical expenses.
- B. Expense Estimate
This component provides users with insights into their spending and advises whether they can afford certain expenses. It calculates whether the user’s financial situation is positive (savings available) or negative (expenses exceeding income shows).
Key Calculations:
- ○
-
Available Balance (ABALANCE):
- ■
- ABALANCE = INCOME – COST
- ■
-
Where:
- ■
- INCOME = Total income of the user.
- ■
- COST = Total amount of the user's periodic expenses.
The system shows that whether the plan should be useful according to the rule set shown in Table 3.11 & 3.12.
| Rule | IF | THEN |
| R1 | Income>Budget | The plan is useful. |
| R2 | Income>=Budget | The plan is useful. |
| R3 | Income<Budget | The plan is not useful because income is less than our budget. |
| R4 | Income<Budget | The plan is not useful because income is less than or equal our budget. If income is less or equal budget user may face depth payment. |
| Rule | IF | THEN |
| R1 | Budget>Expense | The plan is useful. |
| R2 | Budget>=Expense | The plan is useful. |
| R3 | Budget<Expense | The plan is not useful because income is less than our budget. |
| R4 | Budget<Expense | The plan is not useful because income is less than or equal our budget. If income is less or equal budget user may face depth payment. |
| R5 | Expense=Positive | When expense is not exceeding then income. The user can purchase which is needed & A budget is created by allowing the user to necessary amount allotted to one more future commitment for the current month, periodic, budget and saving plan. |
| R6 | Expense=Negative | The user cannot afford the purchase Where expense is exceed their income. |
The table provides guidelines that determine an output based on the results of a household budget. We will now use the rule-based system to recommend a household budget and determine whether our system satisfies the rule or not.
Table 3.13.
Budget rule verification.
| Rule | Income | Budget | Expense Status | Household budget status |
| R1 | If income =16000 | Then budget=15000 |
Total expenses=16000 Where income>budget |
So the rule R1 has been fulfilled |
| R2 | If income=26000 | Then budget=25000 | Total expenses=26000 | So the rule R2 has been fulfilled |
| Where income>=budget | ||||
| R3 | If income=100000 | Then budget=110000 | Total expenses=110000 | So the rule R3 has been fulfilled |
| Where income<budget | ||||
| R4 | If income=200000 | Then budget=220000 | Total expenses=220000 | So the rule R4 has been fulfilled |
| Where income<=budget |
Table 3.14.
Budget rule implementation.
|
Rule1: IF income= 16000 AND budget=15000 THEN income>budget |
Rule2: IF income= 26000 AND budget=25000 THEN income>=budget |
|
Rule3: IF income= 100000 AND budget=110000 THEN income<budget |
Rule4: IF income= 200000 AND budget=2200000 THEN income<=budget |
Table 3.15.
Expense rule verification.
| Rule | Income | Budget | Expense | Household budget status |
| R1 | If income =20000 | Then budget=15000 | Total expenses=20000 | So the condition of rule R1 has been met |
| Where expense>budget | ||||
| R2 | If income=16000 | Then budget=16000 | Total expenses=16000 | So The condition of rule R2 has been met. |
| Where expense>=budget | ||||
| R3 | If income=25500 | Then budget=30000 | Total expenses=35266 | So The condition of rule R3 has been met. |
| Where expense<budget | ||||
| R4 | If income=35981 | Then budget=50000 | Total expenses=45981 | So The condition of rule R4 has been met. |
| Where expense<=budget | ||||
| R5 | If income=55000 | Then budget=55000 | Total expenses=55000 | So The condition of rule R5 has been met. |
| Where expense=positive | ||||
| R6 | If income=60000 | Then budget=65000 | Total expenses=70000 | So The condition of rule R6 has been met. |
| Where expense=negative |
Table 3.16.
Expense rule implementation.
|
Rule1: IF income=20000 AND budget=15000 THEN expense>budget |
Rule2: IF income=16000 AND budget=16000 THEN expense>=budget |
Rule3: IF income=25500 AND budget=30000 THEN expense<budget |
|
Rule4: IF income=35981 AND budget=50000 THEN expense<=budget |
Rule5: IF income=55000 AND budget=55000 THEN expense=positive |
Rule6: IF income=60000 AND budget=65000 THEN expense=negative |
The Rule-Based System was designed to operate based on predefined conditions, making it an effective tool for managing household budgets. This system allows users to clearly observe how their income, budget, and expenses align with the established rules, ensuring that all conditions for effective household budget management are met. Rule-based systems offer a straightforward approach to decision-making and are capable of solving problems efficiently. One of the key advantages of rule-based systems is their adaptability. When faced with new challenges or changing conditions, these systems can be customized with ease, making them highly flexible. Additionally, they provide an efficient means of managing data and can handle large datasets effectively.
After comparing the Naive Bayes and K-Nearest Neighbors (KNN) algorithms with the Rule-Based System, we conclude that the Rule-Based System is the most appropriate choice for managing household budgets. Its simplicity, transparency, and ability to provide clear recommendations make it ideal for this application.
However, it is important to note that rule-based systems may not be suitable for every situation, particularly those requiring complex classification tasks. Nevertheless, for the purpose of recommending household budgets, the Rule-Based System proves to be the most effective approach.
Table 3.17.
Comparison of Classification Models.
| Feature | KNN | Naive Bayes | Rule-Based System |
| Ease of Implementation | Moderate (requires tuning and distance calculations). | Moderate (probability-based calculations). | Easy (predefined rules). |
| Interpret ability | Low (black-box model). | Low (complex probabilistic output). | High (transparent and explicit). |
| Accuracy | High (depends on quality of training data). | Moderate (assumes feature independence). | Moderate (depends on rule quality). |
| Real-Time Suitability | Low (computationally expensive). | High (fast probability computation). | High (instant processing). |
| Scalability | Low (slower with large datasets). | High (handles large datasets well). | High (fixed rule set). |
| Practical Usability | Moderate (requires technical understanding). | Low (less intuitive for users). | High (simple and user-friendly). |
4. Implementation and Experimental Results
This section provides details about the implementation process and experimental outcomes of the proposed household budget recommendation system. The system was implemented using a combination of front-end technologies (HTML, CSS, JavaScript) and back-end tools (PHP, MySQL). The experiments were conducted to evaluate the systems performance in terms of accuracy, efficiency, and practical usability.
4.1. Experimental Setup and Environment
The implementation of the system was carried out using a combination of modern hardware and software tools. Below are the specifications used for development:
Hardware:
- Processor: Intel(R) Core(TM) i5-7200U CPU @ 2.50GHz (2 cores, 4 logical processors).
- RAM: 8 GB.
- Operating System: Windows 10 (64-bit).
-
Software Tools:
- phpMyAdmin: For managing MySQL databases.
- Dreamweaver: Used for web design with support for HTML, CSS, and JavaScript.
- Sublime Text: A lightweight text editor for coding.
- XAMPP: Local server environment for testing PHP-based applications.
- Jupyter Notebook: For data analysis and visualization.
-
Programming Languages and Techniques:
- HTML and CSS: For front-end design.
- JavaScript and jQuery: For dynamic behavior and interactivity.
- AJAX: For asynchronous data retrieval.
- PHP: To connect and process data from the MySQL database.
- Data Handling
Data handling involved storing input and output data in MySQL databases, with phpMyAdmin facilitating efficient data backup, import, and export operations.
4.2. Dataset Generation and Characteristics
The datasets used to evaluate the system was derived from both real-world and simulated sources. Key attributes of the datasets include:
- Income Details: Covers gross salary, bonuses, rental income, and other sources.
- Expense Categories: Includes housing, food, education, medical, transportation, debt payments, and savings.
- Demographics: Captures family composition, including member count and age groups.
- Database Structure
Data was organized into a structured input_data table, where each record represents a unique household entry with attributes like income, budget, and family composition. An example structure is shown in Table 4.1.
- total_income: The total household income.
- budget_amount: The budget set by the user for household expenses.
- num_members: The total number of family members.
- age_x: The age of each family member.
- age_group_x: The age group category for each family member (e.g., Infant, Child, Teenager, etc.).
Table 4.1.
input with Sample Data.
| id | total_income | budget_amount | num_members | age_1 | age_group_1 | age_2 | age_group_2 | age_3 | age_group_3 | age_4 | age_group_4 |
| 1 | 150,000 | 120,000 | 3 | 35 | Middle-aged | 10 | Child | 5 | Infant | NULL | NULL |
| 2 | 200,000 | 180,000 | 4 | 40 | Middle-aged | 17 | Teenager | 13 | Teenager | 5 | Infant |
| 3 | 250,000 | 220,000 | 5 | 30 | Middle-aged | 12 | Child | 8 | Young | 3 | Infant |
| 4 | 500,000 | 450,000 | 6 | 45 | Middle-aged | 20 | Young Adult | 18 | Teenager | 15 | Teenager |
| 5 | 1,000,000 | 900,000 | 4 | 50 | Old | 25 | Adult | 22 | Adult | NULL | NULL |
- Explanation of Values:
- id: This is the unique identifier for each entry in the table. In this example, the record is identified as 1.
- total_income: This field stores the total income of the household, which is 150,000 BDT in this example. This income might include wages, rental income, and other sources of earnings.
- budget_amount: The household budget allocated for expenses, which is 120,000 BDT in this case.
- num_members: This value indicates that the family has 3 members.
- age_1: The first family member is 35 years old, classified as "Middle-aged".
- age_group_1: "Middle-aged" is the category this family member falls under based on their age.
- age_2: The second family member is 10 years old, classified as "Child".
- age_group_2: "Child" is the category this family member falls under.
- age_3: The third family member is 5 years old, classified as "Infant".
- age_group_3: "Infant" is the category for the third family member.
The data set dynamically adjusts to family-specific configurations, enabling the system to allocate expenses accurately.
4.3. Rule-Based Budget Recommendation
The system applies predefined rules to allocate household income across various expense categories. Below are the steps involved:
-
a) Input Variables:
- Family Income (Income): Total monthly income.
- Family Members: Number of people in the household, including their age group.
- Budget: User-defined target for total expenses.
-
b) Output Categories:The system calculates expenses across the following categories:
- Housing.
- Food.
- Medical.
- Education.
- Transport.
- Debt Payment.
- Other Expenses.
- Savings.
-
c) Rules for Budget Allocation:The system applies the following allocation logic:1. Housing Allocation:• Rule: Allocate 30-35% of income based on family size.
- If Family Members > 4: Housing = 35% of income.
- Otherwise: Housing = 30% of income.
2. Food Allocation:- Rule: Allocate 20-25% of income for food.
- If Family Members > 4: Food = 25% of income.
- Otherwise: Food = 20% of income.
3. Medical and Education Costs:- Rule: Set to a minimum of 5% of income, adjustable by the user.
4. Transport Costs:- Rule: Allocate 5% of income, adjustable for specific needs.
5. Debt Payment:- Rule: Allocate 5-10% of income based on the debt level.
6. Savings:- Rule: Allocate 10-20% of income, prioritizing higher savings if possible.
7.. Other Expenses:- Rule: Assign the remaining income to discretionary expenses.
4.4 Sample Scenario:
Consider a household with the following inputs:
- Income: 9,111 BDT
- Family Members: 5
- Budget: 9,000 BDT
Table 4.2.
Family Member Age Group Expense Categories.
| Family Member | Age | Age Group | Expense Categories |
| Member 1 | 35 | Middle-aged (30+) | Full expense allocation (Housing, Food, Medical, Education, Transport) |
| Member 2 | 10 | Child (5-10) | Full expense allocation (Housing, Food, Medical, Education, Transport) |
| Member 3 | 5 | Infant (Under 5) | Food (Cereal), Medical (Vaccines), No education expenses |
| Member 4 | 70 | Old (50+) | Full expense allocation (Food, Medical—Insulin, Education if applicable) |
| Member 5 | 30 | Young Adult (25-30) | Full expense allocation (Housing, Food, Medical, Education, Transport) |
Table 4.3.
Output for a Family of 5 with all Expenses.
| Category | Subcategory | Percentage | Amount (BDT) | Family Member 1 (Age 35) | Family Member 2 (Age 10) | Family Member 3 (Age 5) | Family Member 4 (Age 70) | Family Member 5 (Age 30) |
| Housing | Rent/Mortgage | 15% | 1,367 | 1,367 | 1,367 | 1,367 | 1,367 | 1,367 |
| Utilities | 5% | 455 | 455 | 455 | 455 | 455 | 455 | |
| Taxes | 5% | 455 | 455 | 455 | 455 | 455 | 455 | |
| Insurance | 5% | 455 | 455 | 455 | 455 | 455 | 455 | |
| Food | Rice | 6% | 546 | 546 | 546 | 546 | 546 | 546 |
| Cereal | 2% | 182 | 182 | - | 182 | 182 | 182 | |
| Flour | 3% | 273 | 273 | 273 | 273 | 273 | 273 | |
| Milk | 3% | 273 | 273 | 273 | 273 | 273 | 273 | |
| Fish & Meat | 4% | 364 | 364 | 364 | 364 | 364 | 364 | |
| Vegetables | 4% | 364 | 364 | 364 | 364 | 364 | 364 | |
| Medical | Insulin | 2% | 182 | - | - | - | 182 | - |
| Pressure Medicine | 2% | 182 | 182 | 182 | 182 | 182 | 182 | |
| Other Medical Expenses | 1% | 91 | 91 | 91 | 91 | 91 | 91 | |
| Education | Primary Education | 3% | 273 | - | 273 | - | - | - |
| Secondary Education | 2% | 182 | - | - | - | - | - | |
| Transport | Car | 2% | 182 | 182 | 182 | 182 | 182 | 182 |
| Public Transportation | 1% | 91 | 91 | 91 | 91 | 91 | 91 | |
| Debt Payment | Credit Card Payment | 1% | 91 | 91 | 91 | 91 | 91 | 91 |
| Personal Loan Payment | 2% | 182 | 182 | 182 | 182 | 182 | 182 | |
| Other Expenses | Groceries | 2% | 182 | 182 | 182 | 182 | 182 | 182 |
| Phone | 1% | 91 | 91 | 91 | 91 | 91 | 91 | |
| Clothes | 1% | 91 | 91 | 91 | 91 | 91 | 91 | |
| Entertainment | 1% | 91 | 91 | 91 | 91 | 91 | 91 | |
| Miscellaneous | 1% | 91 | 91 | 91 | 91 | 91 | 91 | |
| Savings | Stocks | 10% | 911 | 911 | 911 | 911 | 911 | 911 |
| Bonds | 5% | 455 | 455 | 455 | 455 | 455 | 455 |
4.4. Model Training
The datasets was divided into training (80%) and testing (20%) subsets to evaluate the systems performance. The training set was used to build the models, while the testing set assessed their accuracy, precision, and recall. The system utilized key attributes such as net family income, budget, and expenditures across essential categories like housing, food, medical, and savings.
4.4.1. Key Metrics
- Accuracy: The proportion of correct predictions (True Positives + True Negatives) among total predictions.
- Precision: The proportion of True Positives relative to all positive predictions (True Positives + False Positives), indicating the systems reliability in expense classification.
- Recall: The proportion of True Positives identified out of all actual positives, representing the systems ability to capture all relevant expenses.
4.4.2. Data Structure and Splitting
The datasets contained 10 key features (X), representing household attributes, and a single target variable (y), representing total savings expenditure.
Features (X):
- Net Family Income
- Budget
- Family Members
- Total Housing Expenditure
- Total Food Expenditure
- Total Medical Expenditure
- Total Education Expenditure
- Total Transportation Expenditure
- Total Debt Payment Expenditure
- Other Expense Expenditure
Target Variable (y): Total Savings Expenditure
The datasets was split into:
- Training Set: 80% (648 entries) to build the model.
- Testing Set: 20% (163 entries) to evaluate model performance.
4.4.3. Training Data Example
Both X_train and y_train were used for training, while X_test and y_test evaluated performance. The split was randomized using a fixed random_state of 0 for consistency.
Table 4.4.
X_Train data structure of the household budget.
| Train Data | Net Family Income | Budget | Family Members | Total Housing Cost | Total Food Cost | Total Medical Cost | Total Education Cost | Total Transportation Cost | Total Debt Payment Cost | Other Expense Cost |
| 37 | 24800 | 24800 | 2 | 6252 | 11938 | 1100.00 | 0 | 1762.00 | 0 | 2526 |
| 172 | 87612 | 92612 | 6 | 10638 | 68484 | 266.00 | 200 | 725.00 | 3996 | 5000 |
| 48 | 28321 | 33321 | 4 | 6720 | 12455 | 6000.00 | 0 | 3457.00 | 2514 | 5000 |
| 319 | 18044 | 18844 | 1 | 4626 | 11126 | 2770.00 | 130 | 778.00 | 900 | 0 |
| 623 | 49968 | 49968 | 3 | 10062 | 35206 | 0.00 | 1008 | 0.00 | 0 | 1692 |
| ... | ... | ... | ... | ... | ... | ... | ... | ... | ... | ... |
| 763 | 100015 | 100015 | 11 | 15000 | 62934 | 145.00 | 2520 | 0.00 | 5570 | 10846 |
| 192 | 100000 | 103000 | 6 | 20000 | 25000 | 10000.00 | 15000 | 150.00 | 3000 | 15000 |
| 629 | 50075 | 50075 | 2 | 3906 | 29805 | 0.00 | 720 | 0.00 | 0 | 644 |
| 559 | 49201 | 54201 | 6 | 9930 | 35279 | 318.00 | 8208 | 5000.00 | 0 | 466 |
| 684 | 50561 | 50561 | 1 | 7200 | 21156 | 50.00 | 4020 | 0.00 | 0 | 2135 |
Target Variable (y_train):
Here we explain y_train represents Total Savings Expenditure with a length of 648 and datatype of float64.
Table 4.5.
y_train data structure of the household budget.
| Train Data | Total Savings Expenditure |
| 37 | 2000.00 |
| 172 | 0.00 |
| 48 | 0.00 |
| 319 | 0.00 |
| 623 | 2000.00 |
| ... | ... |
| 763 | 3000.00 |
| 192 | 10000.00 |
| 629 | 15000.00 |
| 559 | 0.00 |
| 684 | 16000.00 |
4.4.4. Testing Data Example
In the Python script, the variables X_test and y_test contain labels for the test set, representing the true values the model aims to predict. When performing the train/test split using test_size=0.2, 20% of the data is set aside for the test set.
Table 4.6.
X_Test data structure of the household budget.
| Test Data | Net Family Income | Budget | Family Member | Total Housing Cost | Total Food Cost | Total Medical Cost | Total Education Cost | Total Transport Cost | Total Debt Payment Cost | Other Expense Cost |
| 613 | 49823 | 49823 | 2 | 13710 | 30839 | 660.00 | 180 | 0.00 | 0 | 2432 |
| 202 | 123015 | 123015 | 4 | 7200 | 73459 | 8060.00 | 610 | 11730.00 | 0 | 6390 |
| 55 | 31400 | 31400 | 2 | 9090 | 10938 | 50.00 | 0 | 75.00 | 0 | 0 |
| 478 | 29174 | 29174 | 1 | 6000 | 16663 | 260.00 | 900 | 0.00 | 0 | 1271 |
| 27 | 17800 | 17800 | 1 | 3090 | 8514 | 274.00 | 0 | 450.00 | 0 | 472 |
| ... | ... | ... | ... | ... | ... | ... | ... | ... | ... | ... |
| 71 | 40000 | 53000 | 3 | 5532 | 19433 | 41.00 | 300 | 570.00 | 13164 | 0 |
| 49 | 29174 | 29174 | 2 | 6000 | 16663 | 260.00 | 0 | 3520.00 | 0 | 3351 |
| 416 | 27000 | 30000 | 7 | 6360 | 23754 | 20.00 | 25 | 3134.00 | 0 | 0 |
| 240 | 173710 | 173710 | 2 | 16560 | 81975 | 0.00 | 0 | 120.00 | 0 | 22000 |
| 116 | 52000 | 52000 | 3 | 8700 | 26414 | 0.00 | 2040 | 128.00 | 0 | 4846 |
Target Variable (y_test):
Here we explain y_test corresponds to Total Savings Expenditure with a length of 163 and a datatype of float64.
Table 4.7.
y_test data structure of the household budget.
| Total Test Data | Total Savings Expenditure |
| 613 | 2000.00 |
| 202 | 20000.00 |
| 55 | 5000.00 |
| 478 | 2000.00 |
| 27 | 5000.00 |
| ... | ... |
| 71 | 0.00 |
| 49 | 2000.00 |
| 416 | 0.00 |
| 240 | 40000.00 |
| 116 | 10000.00 |
| 613 | 2000.00 |
4.4.5. Model Performance
Three classifiers were evaluated: K-Nearest Neighbors (KNN), Naive Bayes, and a Rule-Based System. Results for accuracy, precision, and recall are summarized below:
Table 4.8.
Classification Report for Rule-Based Algorithm.
| Algorithm | Precision | Recall | F1 Score | Accuracy (%) |
| KNN | 0.96 | 0.95 | 0.95 | 96.67 |
| Naive Bayes | 0.90 | 0.93 | 0.91 | 93.00 |
| Rule-Based System | 0.85 | 0.90 | 0.90 | 90.00 |
While KNN achieves the highest accuracy (96.67%), it requires significant computational resources and extensive training data. In contrast, our rule-based system (90% accuracy) offers a simpler, more interpretation, and real-time approach, making it better suited for household budget applications.
4.4.6. Evaluation Metrics
- Precision: High precision (0.96 for KNN) ensures fewer incorrect budget classifications.
- Recall: High recall (0.93 for Naive Bayes) captures all critical expense categories.
- Accuracy: The KNN classifiers 96.67% accuracy makes it the most reliable for predicting expenses.
4.4.7. Confusion Matrix Analysis
The following metrics are important to evaluate the predictive system:
- True Positives (TP): Correct positive predictions.
- True Negatives (TN): Correct negative predictions.
- False Positives (FP): Incorrect positive predictions.
- False Negatives (FN): Incorrect negative predictions.
Table 4.9.
Confusion Matrix.
| Actual / Predicted | Predicted Positive | Predicted Negative |
| Actual Positive | True Positive (647) | False Negative (72) |
| Actual Negative | False Positive (79) | True Negative (13) |
Below we can see the formulas for calculating Precision:
Precision = TP / (TP + FP)
Precision is calculated using this formula, where TP represents the number of true positive predictions, and FP represents the number of false positive predictions. A higher precision rate means that the system is making fewer incorrect positive predictions, making the results more useful.
Recall = TP / (TP + FN)
Recall is calculated using this formula, where FN represents the number of false negative predictions. A higher recall rate means that the system is successfully identifying more of the actual positive cases, which also makes the results more useful.
Lastly, we calculate the Accuracy of the household budget to evaluate the overall performance of the system. Accuracy is the proportion of all correct classifications (both positive and negative) to the total number of predictions. The accuracy formula is described below:
Accuracy = (TP + TN) / (TP + TN + FP + FN)
A higher accuracy indicates that the system is correctly classifying more of the overall predictions.
Below is the data 810 applying Confusion Matrix result in explanation. Fig 4.15 is the confusion
matrix of data used in our model.
Where
· True Positives: 647
· False Positives: 79
· False Negatives: 72
· True Negatives: 13
Below is the figure of the Confusion Matrix for household budget data.
Figure 4.1.
Confusion Matrix for household budget data.
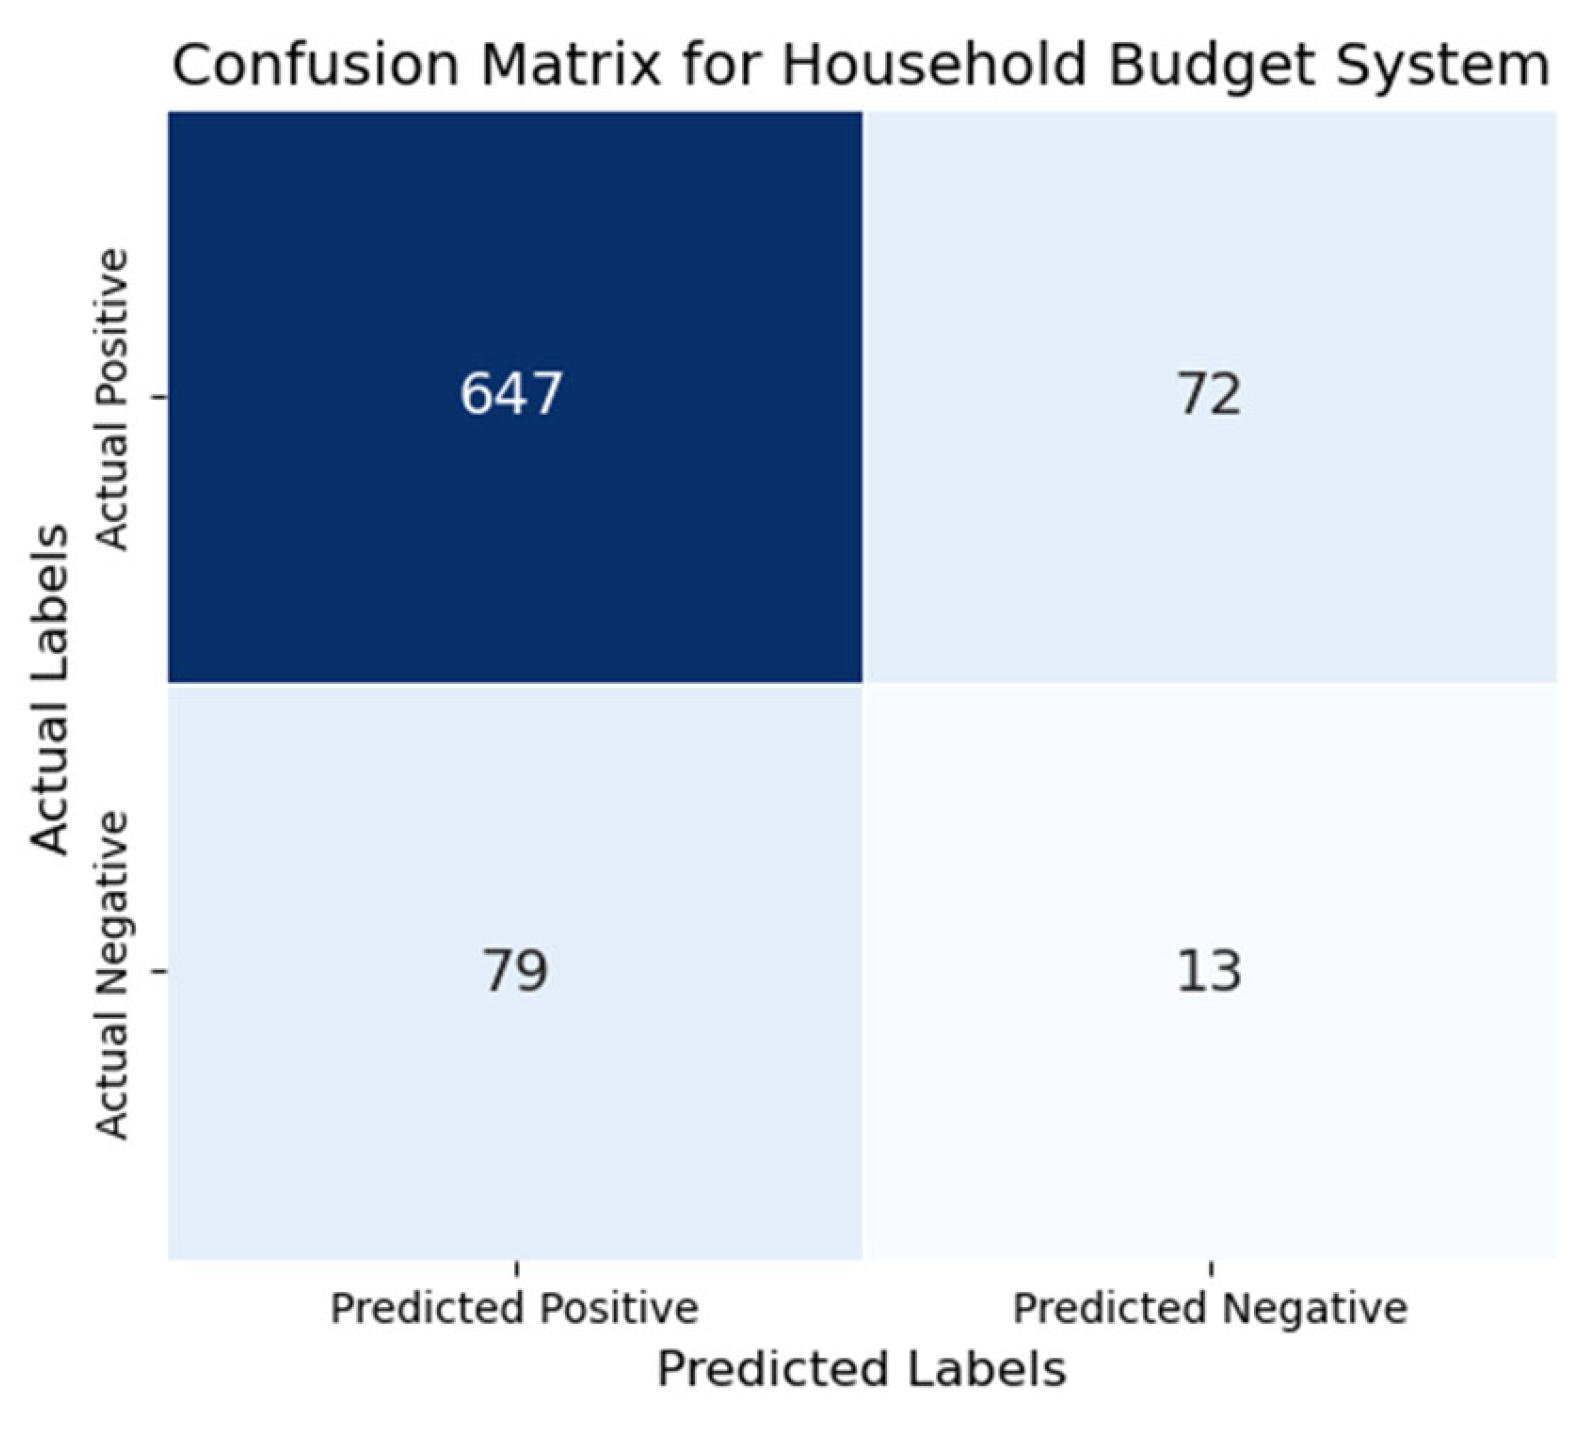
Table 4.10.
Data Frame Description for all Datasets.
|
Data Frame Description |
Net Family Income | Budget | Family Members | Total Housing Cost | Total Medical Cost | Total Education Cost | Total Transport Cost | Total Debt Payment Cost | Other Expense Cost | Total Saving Cost |
| count | 811.00 | 811.00 | 811.00 | 811.00 | 810.00 | 811.00 | 810.00 | 811.00 | 811.00 | 809.00 |
| mean | 76813.17 | 78683.39 | 4.18 | 13208.55 | 2064.63 | 2441.30 | 1840.13 | 978.60 | 10236.35 | 8362.75 |
| std | 106866.43 | 106592.73 | 3.32 | 17893.91 | 9873.24 | 4928.83 | 5395.09 | 2808.48 | 24962.19 | 26086.98 |
| min | 5000.00 | 5500.00 | 1.00 | 824.00 | 0.00 | 0.00 | 0.00 | 0.00 | 0.00 | 0.00 |
| 25% | 28166.50 | 28946.50 | 2.00 | 5610.00 | 70.00 | 150.00 | 0.00 | 0.00 | 1000.00 | 0.00 |
| 50% | 49590.00 | 50040.00 | 3.00 | 8226.00 | 230.50 | 720.00 | 0.00 | 0.00 | 2271.00 | 3000.00 |
| 75% | 87612.00 | 89300.00 | 6.00 | 13200.00 | 896.25 | 2456.00 | 833.25 | 496.00 | 6863.00 | 10000.00 |
| max | 1051758.00 | 1051758.00 | 23.00 | 191856.00 | 205420.00 | 56100.00 | 55904.00 | 27314.00 | 264349.00 | 500000.00 |
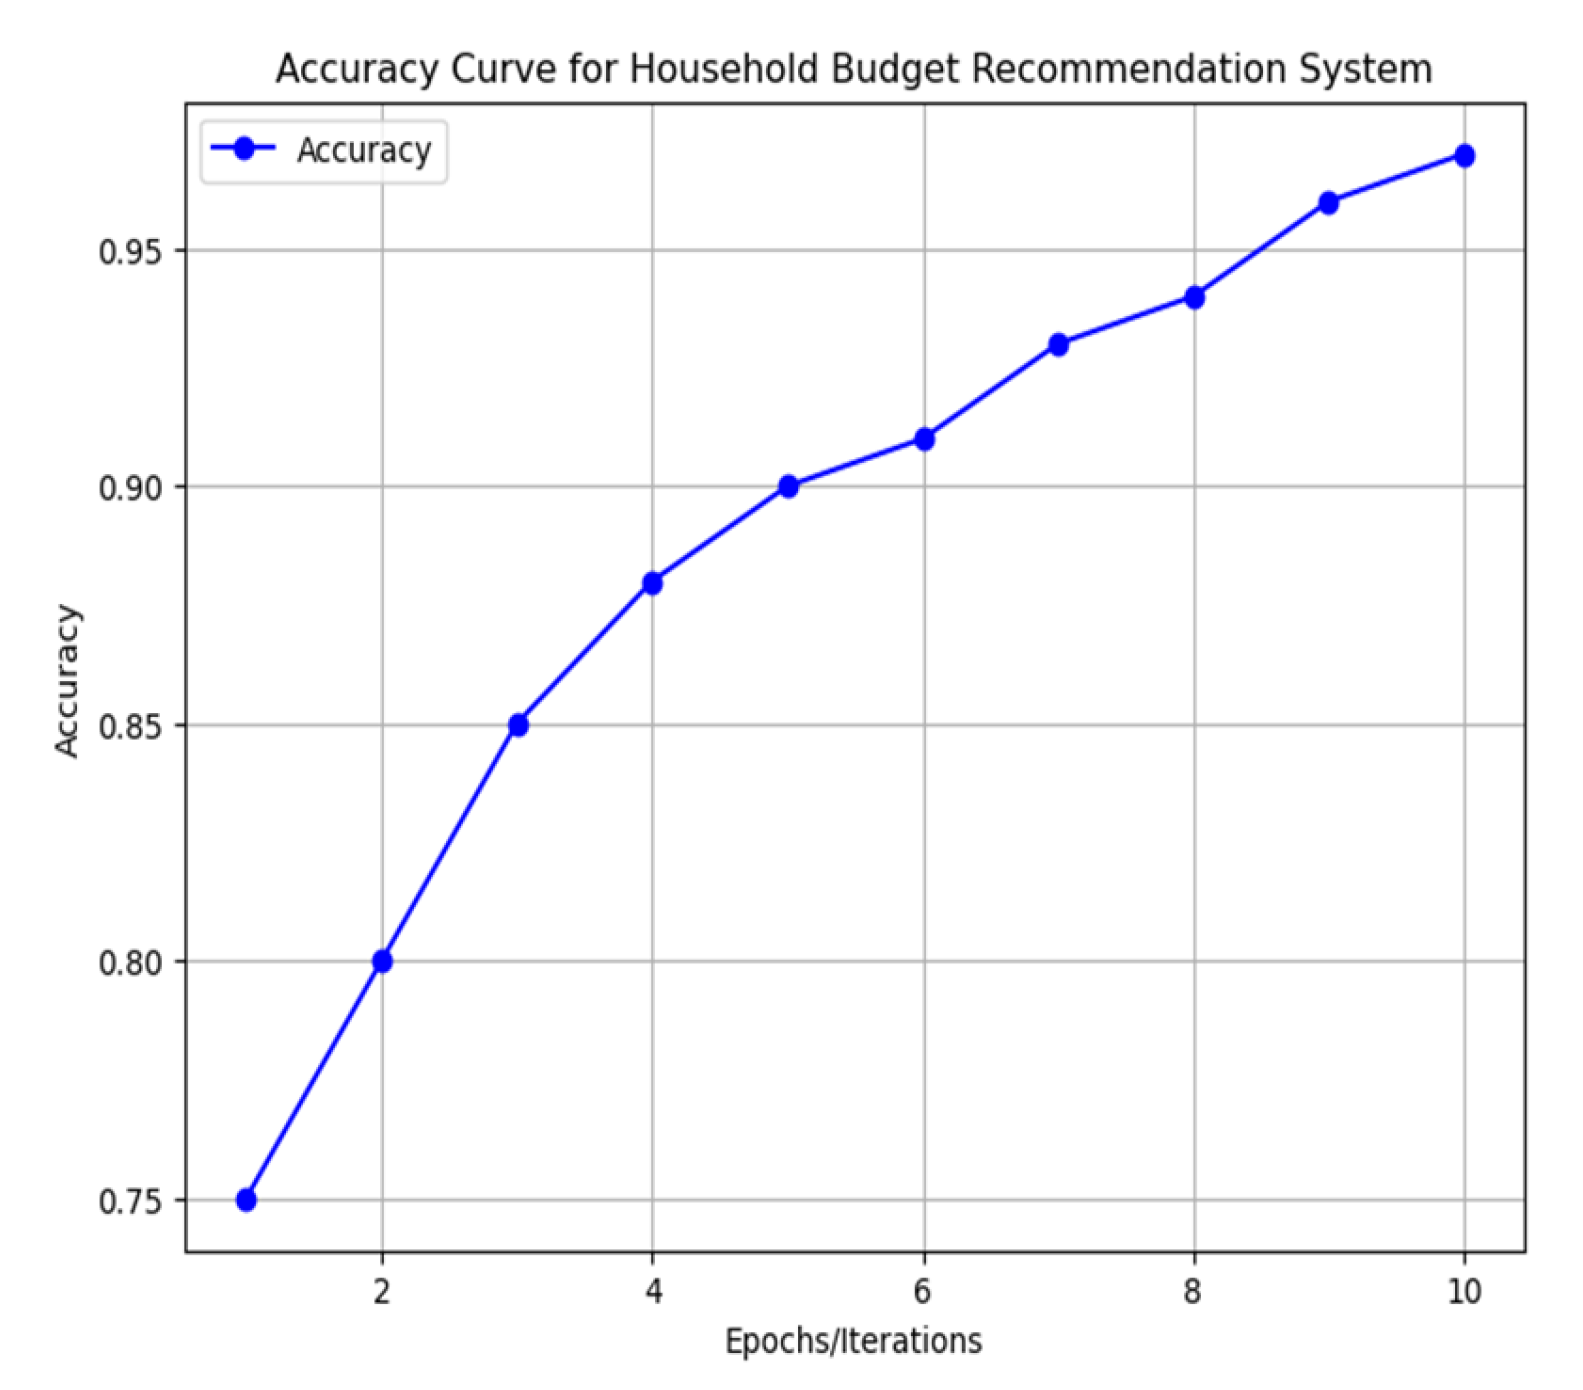
Table 4.24 presents a summary of the data frame of our datasets. This table describes the dispersion and shape of the distribution of the datasets, excluding any NaN values. It provides a concise overview of key statistics, including the count, mean, standard deviation (std), minimum (min), 25th percentile (25%), median (50%), 75th percentile (75%), and maximum (max) values. These statistics are essential for analyzing and understanding the household budget data. From this table, we observe that the accuracy of the model increases as the amount of data grows. The average values for precision, recall, and accuracy are all close to 0.95. Specifically, the precision of the household budget recommendation system is 0.9, which is very close to 1. High precision is significant because it indicates that when the model predicts a successful outcome, it is likely to be correct. In other words, precision reflects the models reliability in predicting positive outcomes.
On the other hand, recall focuses on the models ability to capture as many true positives (1s) as possible. A low recall could mean that some household expenses are mistakenly predicted as negative, missing important categories. Its crucial to find the balance between precision and recall to achieve a comprehensive household budget recommendation system.
Accuracy is one of the most common performance metrics, and in this case, it is very close to 1, measuring 0.93, 0.96, and 0.90 across different tests. This indicates that the model is performing well, with predictions that are mostly correct. Below is the accuracy curve for the household budget recommendation system.
Figure 4.2.
Accuracy for Household Budget Recommendation System.
4.5. Implementation
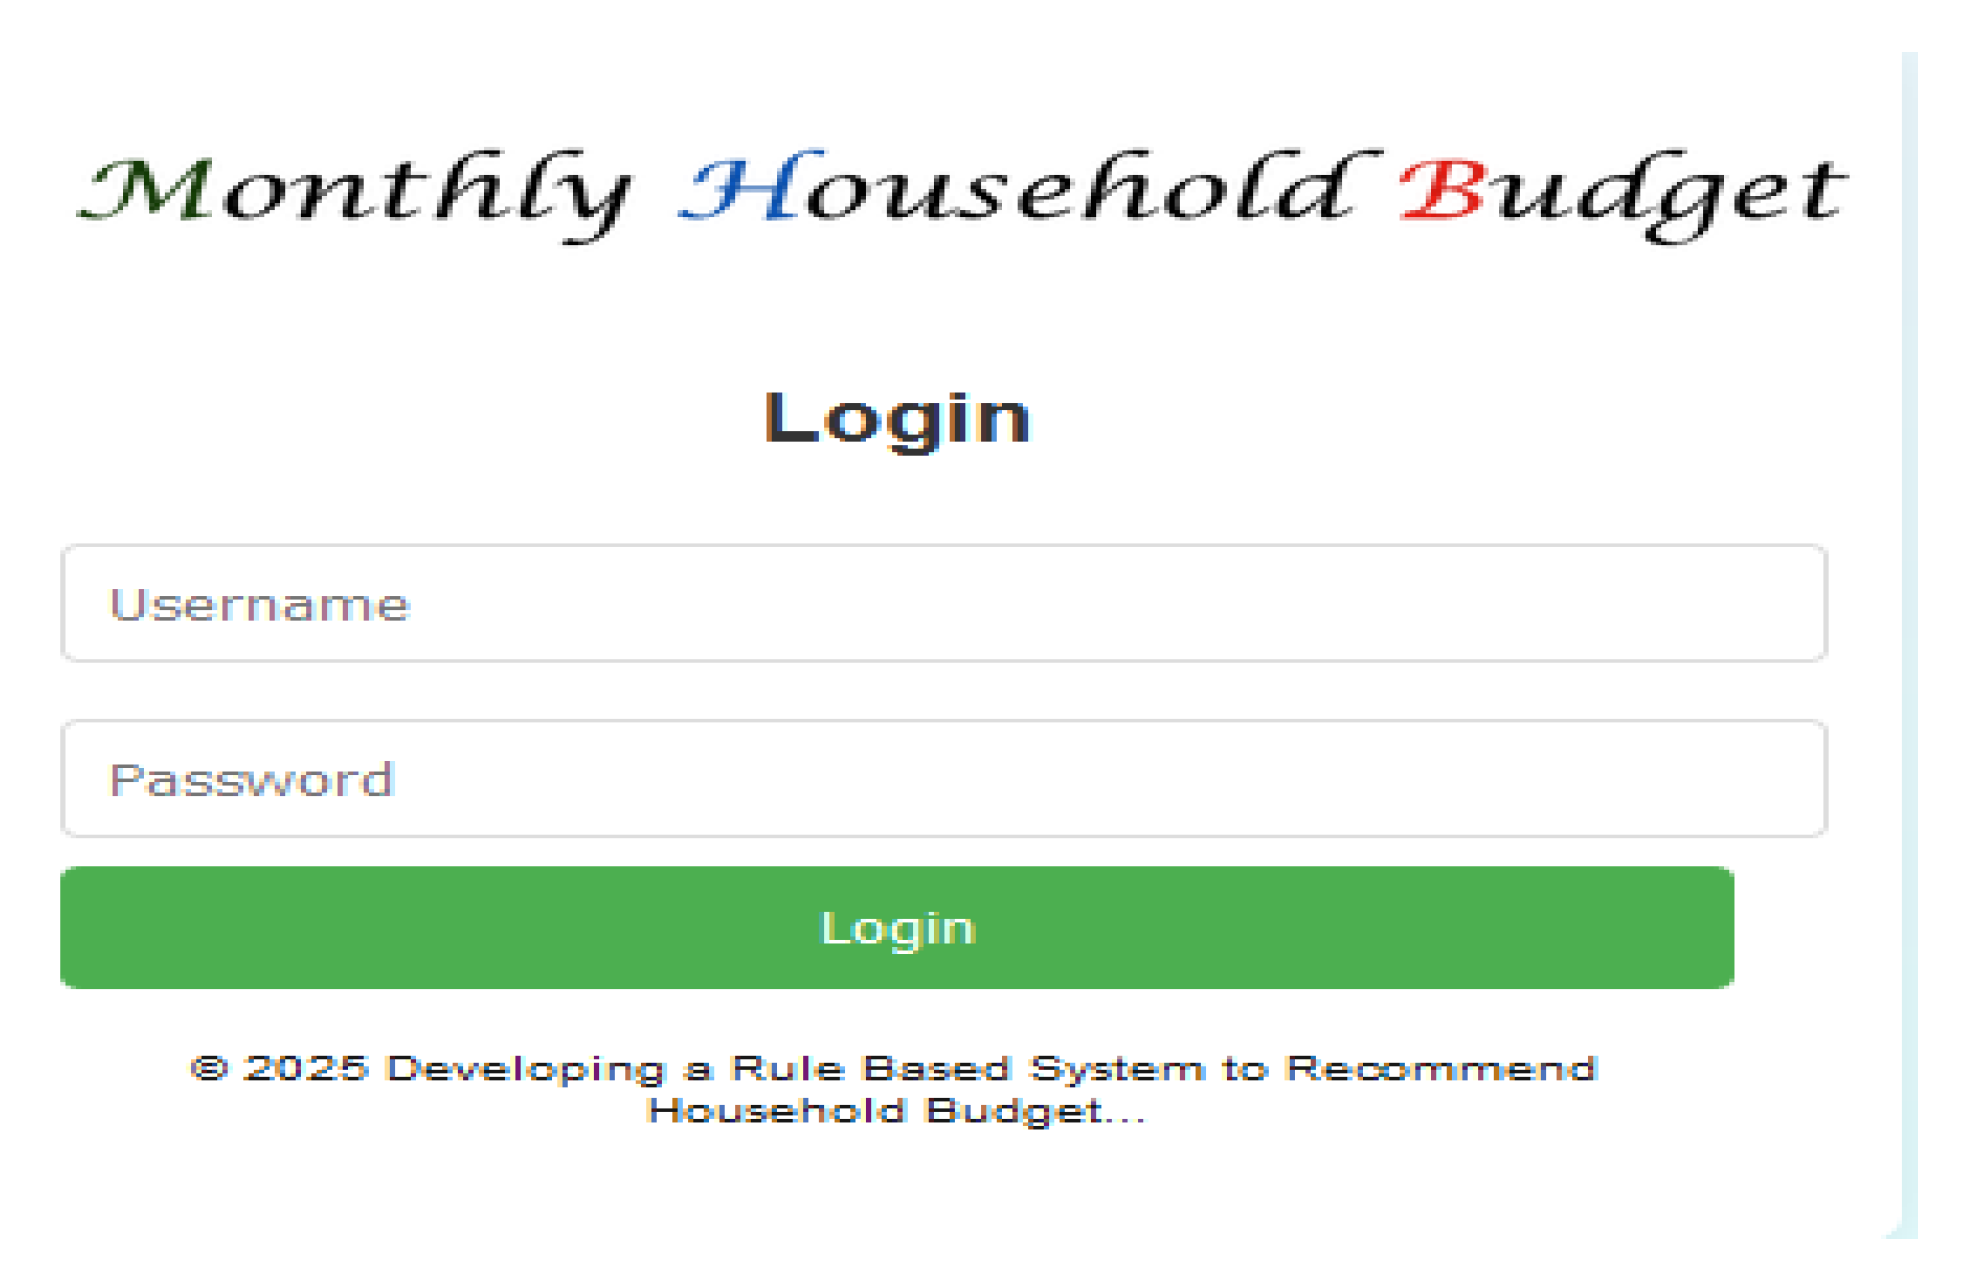
4.5.1. Login Page Explanation
The login page serves as the initial entry point for users to access the Household Budget System. It ensures that only authorized users can proceed to input and view data, safeguarding the integrity and confidentiality of personal budget information. The primary purpose of the login page is to authenticate users before granting access to the system. It acts as a security gateway, ensuring that sensitive financial data and system features are only accessible to legitimate users.
- a)
- Functionality
- I.
-
User Input Fields: The page includes two input fields:
- ◆
- Username: A text field where the user enters their unique identifier.
- ◆
- Password: A password field that masks input for security.
- II.
-
Validation:
- ◆
- The system checks the provided username and password against predefined credentials.
- ◆
- Invalid credentials result in an error message displayed on the same page.
- III.
-
Session Management
- ◆
- Upon successful login, a session is initiated to track the user's authenticated state.
- ◆
- The user is then redirected to the input page (input.php), where they can begin interacting with the system.
- IV.
- Feedback: If the authentication fails, a user-friendly error message is displayed, prompting the user to retry with correct credentials. User feedback is provided via error messages to guide them toward successful authentication.
Figure 4.3.
Login Page.
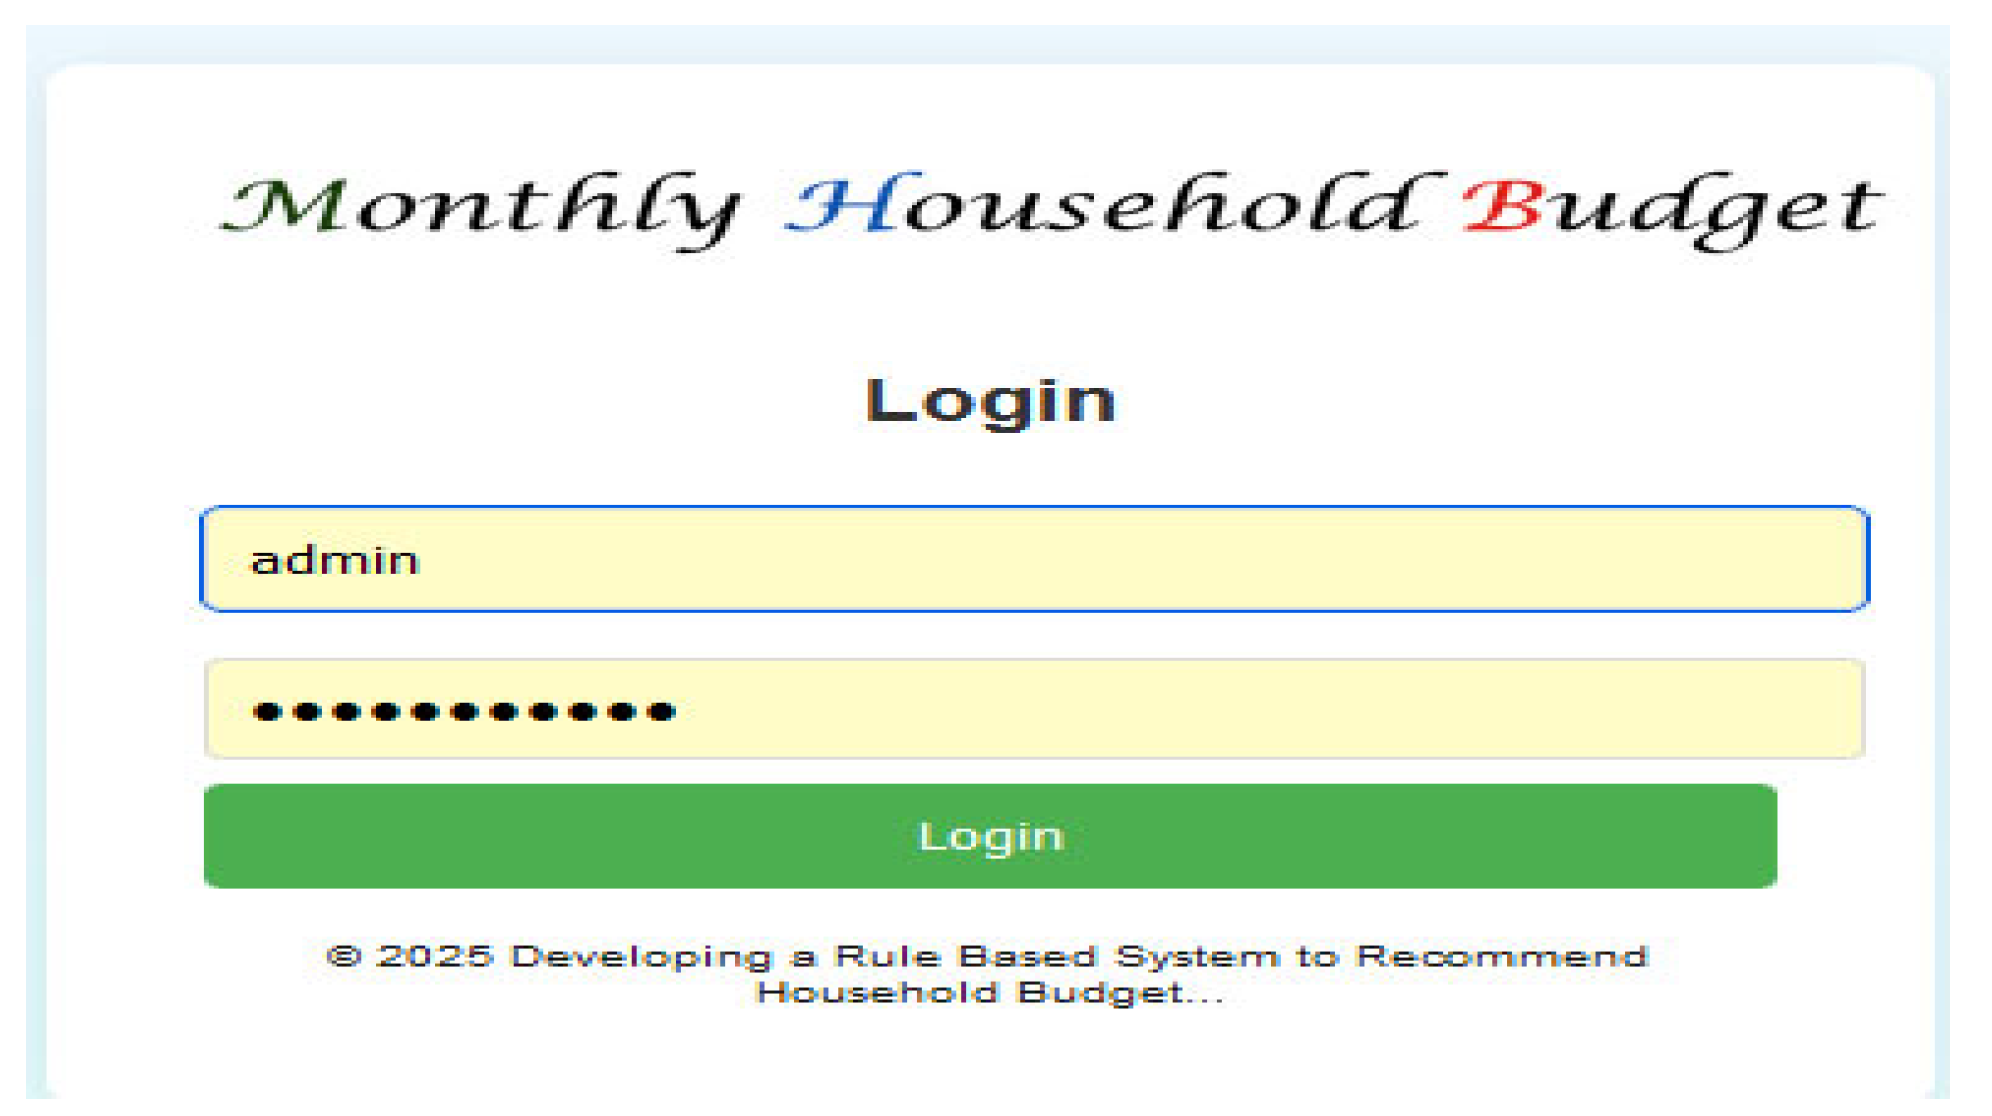
The password is securely validated Sessions ensure that authenticated users remain logged in until explicitly logged out.
Figure 4.4.
User authentication is successful.
Afterwards, the user inputs information for all family members, including their respective incomes. They also need to fill out their necessary monthly budgets.
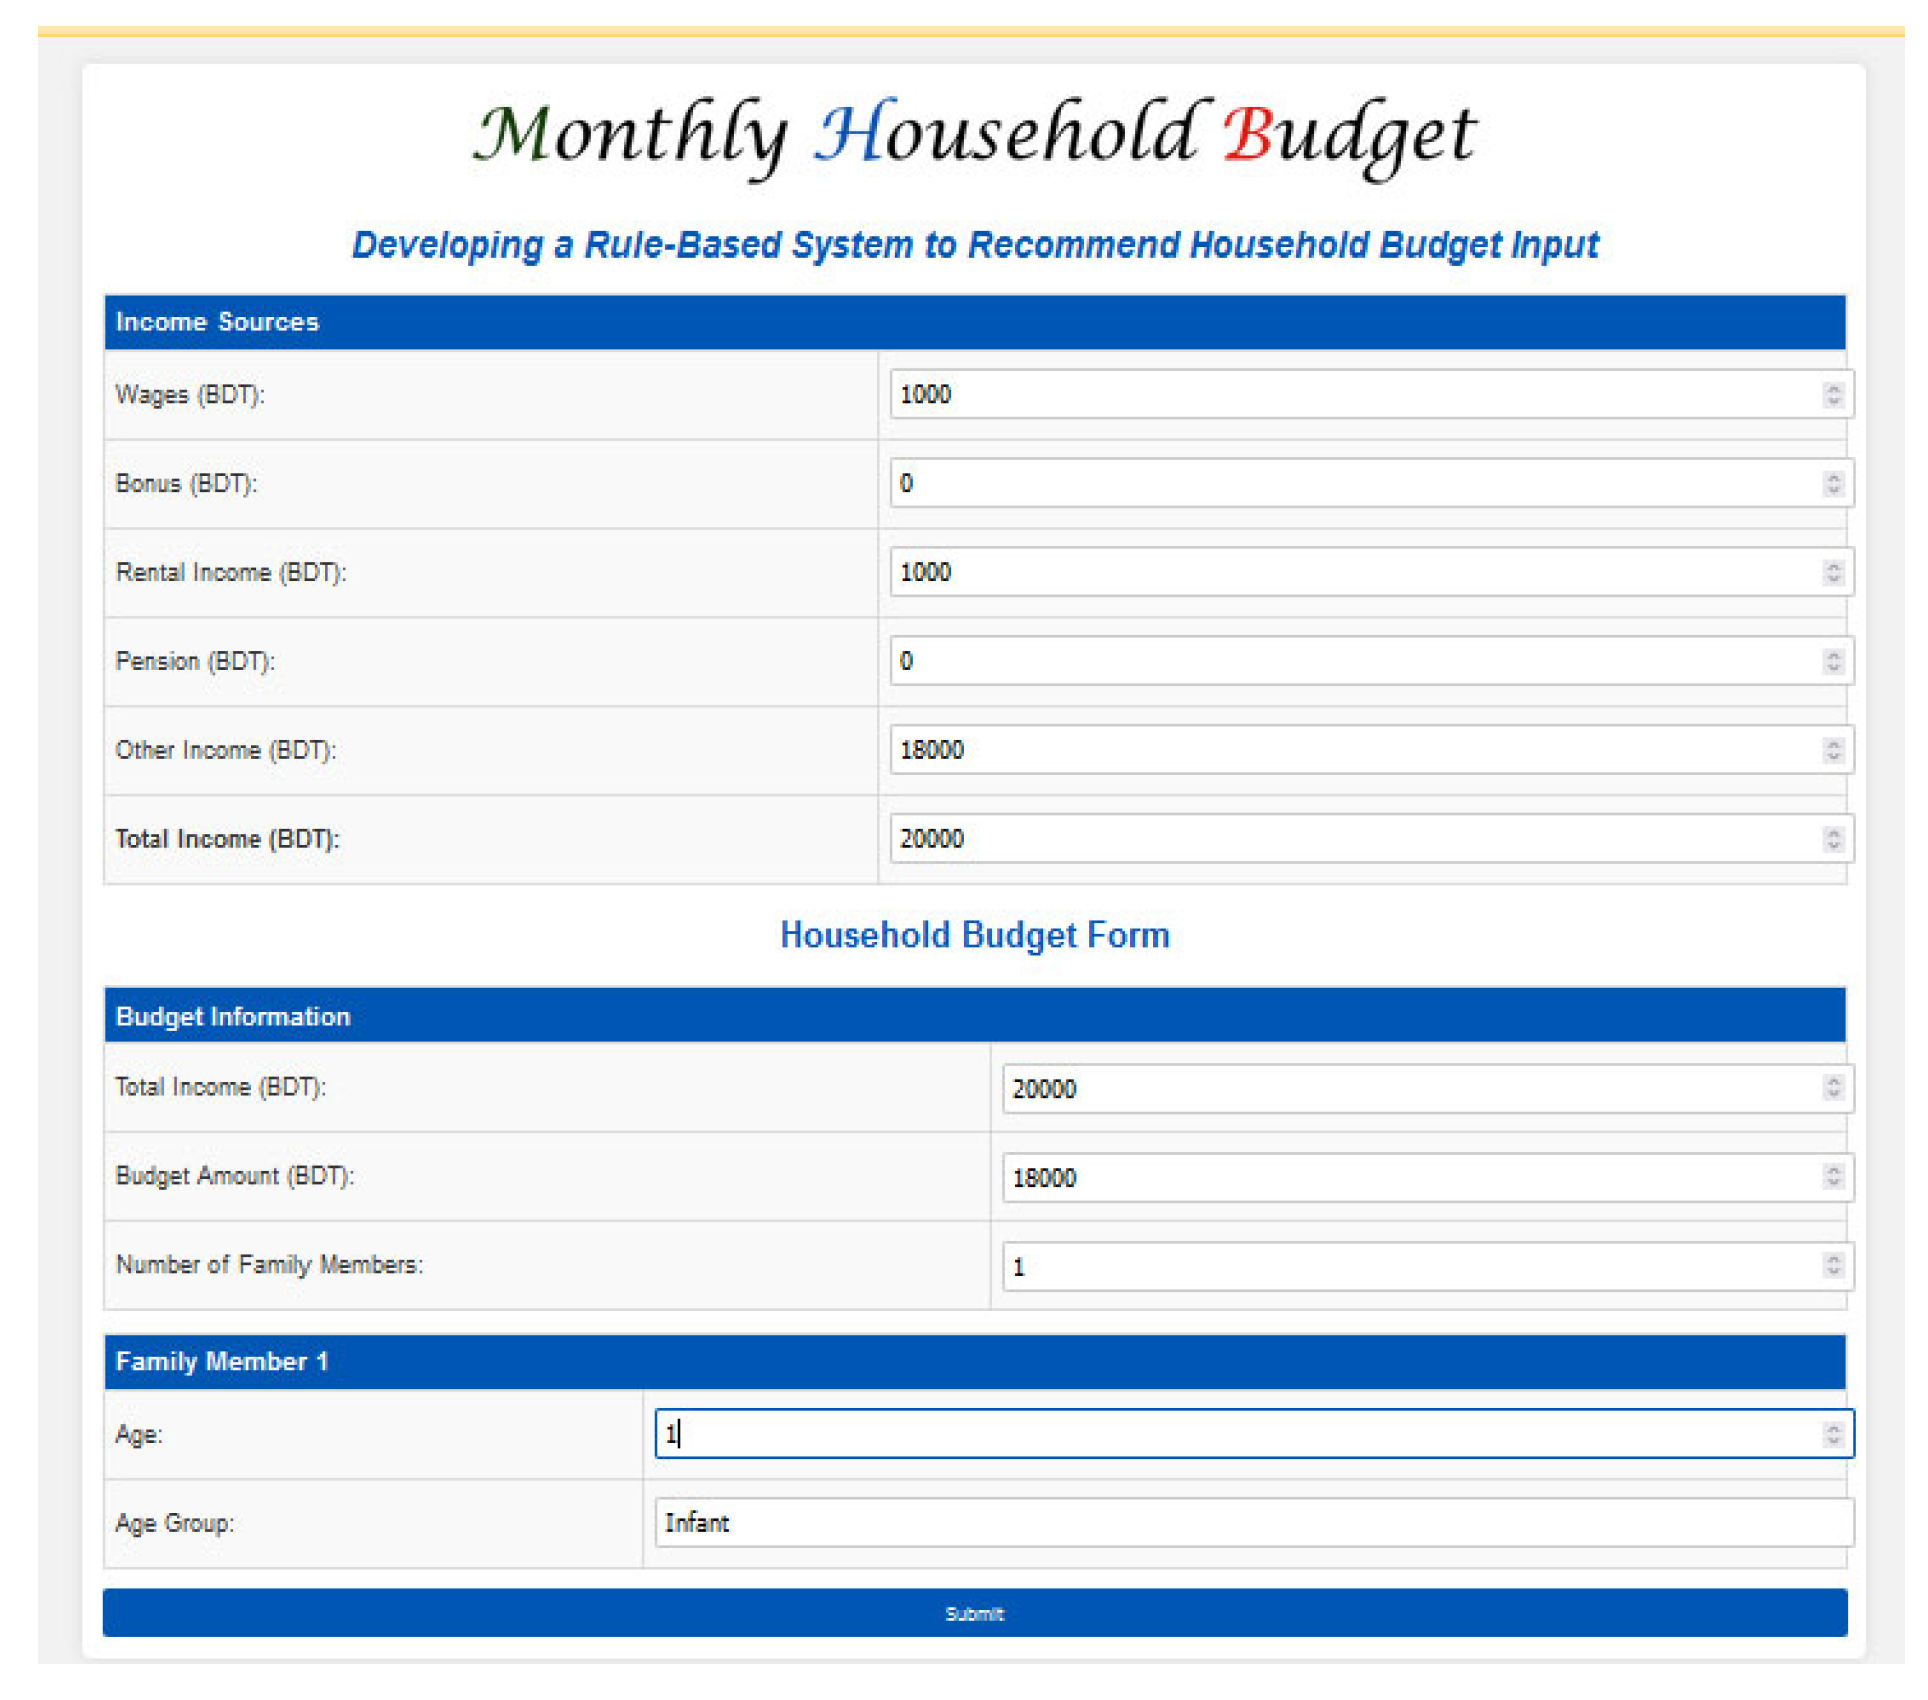
4.5.2. Input Design and Functionality
The input.php file is a key component of the household budget recommendation system. It serves as the interface where users provide the necessary data to calculate and recommend a personalized household budget. The design and functionality of this page ensure user-friendliness and dynamic interaction. Below is a detailed explanation of its components:
- a) Purpose
The primary purpose of the input.php file is to collect input data from users, including:
- Total household income.
- Total budget amount.
- Number of family members.
- Ages of each family member.
This input data is then processed to categorize expenses and calculate an optimized budget for each family member.
- b) Input Fields:
- Total Income Field:
This field allows users to enter their household income in Bangladeshi Taka (BDT).
- Total Budget Amount Field:
This field collects the overall budget amount specified by the user.
- Number of Family Members:
This field prompts users to specify the number of individuals in their household.
- Dynamic Age Inputs:
After specifying the number of family members, the system dynamically generates input fields to collect the ages of each family member. The user will enter the ages, and these values will help determine how to allocate the household income across the relevant expense categories (housing, food, medical, education, transportation, debt payments, other expenses, and savings).
- Expense Calculation:
Once the data is submitted, the system will calculate the recommended expenses for each category (housing, food, medical, education, etc.) based on the user's input. These expenses will be displayed on the output page, along with the remaining money after all expenses are accounted for.
Submit Button:
Upon clicking the submit button, the input data is saved and processed. The user is then redirected to the output page, where they can view a detailed breakdown of their household budget, including calculated expenses, total income, total budget, and any remaining funds.
Figure 4.5.
The page of income,family members and budget.
- c) Detailed Expense Categories and Output
The following categories are used to calculate and display the detailed expenses on the output page:
- Housing Expenses
Includes Rent/Mortgage, Utilities, Taxes, Insurance, Repairs, Improvement, and Others.
- 2.
- Food Expenses
Includes Rice, Cereal, Flour, Oil, Salt & Sugar, Fish & Meat, Milk, Vegetables, Fruits, and Others.
- 3.
- 4.
- Medical Expenses
Includes Insulin, Pressure Medicine, and Other general medical needs.
- 5.
- Education Expenses
Includes Primary Education, Secondary Education, Higher Education, and Others.
- 6.
- Transportation Expenses
Includes Car, Gas, Oil, Parking Fees, Public Transportation, and Other transportation-related expenses.
- 7.
- Debt Payment
Includes Credit Card, Personal Loan, Student Loan, and Other debt-related payments.
- 8.
- Other Expenses
Includes Groceries, Phone, Clothes, Entertainment, Miscellaneous, and Other personal expenses.
- 9.
- Savings
Includes Stock, Bonds, and Other savings or investment options.
- d) Age-Based Categorization
The expenses are categorized based on the family members' age group:
- Infant (age < 5)
- Child (age > 5 & < 10)
- Teenager (age > 10 & < 18)
- Young Adult (age < 25)
- Middle-aged (age > 30)
- Old (age > 50)
-
e) Specific Allocation Rule
- Housing: 30-35% of income, based on family size.
- Food: 20-25% of income, based on family size.
- Medical & Education: Minimum 5% of income.
- Transportation: 5% of income (adjustable for special needs).
- Debt Payment: 5-10% of income, depending on debt levels.
- Other Expenses: Remaining income after essentials.
- Savings: 10-20% of income, depending on goals.
- a) Key Points for Expense Categories Based on Age Groups:
-
Infants (age < 5):
- ▪
- Only cereal is required under food expenses.
- ▪
- No education expenses.
- ▪
- General health care costs are included under medical expenses, but no specific treatments like insulin or pressure medication.
-
Children (age > 5 & < 10):
- ▪
- Full range of food expenses is required (rice, oil, fish, etc.).
- ▪
- Primary Education expenses are required.
- ▪
- Medical expenses may include general health care (e.g., vaccinations, doctor’s visits) but no insulin.
-
Teenagers (age > 10 & < 18):
- ▪
- Full range of food expenses.
- ▪
- Secondary Education expenses are required.
- ▪
- Medical expenses may include treatments for common illnesses, but no insulin.
-
Young Adults (age < 25):
- ▪
- Full range of food expenses.
- ▪
- Higher Education expenses, such as college fees and textbooks, if applicable.
- ▪
- Regular medical expenses, including insulin for diabetes (if applicable), and dental care.
-
Middle-aged (age > 30):
- ▪
- Full range of food expenses.
- ▪
- Typically no education expenses unless they have children.
- ▪
- Regular health maintenance (e.g., blood pressure medicine, chronic condition treatments).
-
Old (age > 50):
- ▪
- Full range of food expenses, with a focus on softer food (more vegetables, etc.).
- ▪
- No education expenses unless they are pursuing adult education.
- ▪
- Frequent medical expenses, including insulin for diabetes, and treatments for age-related conditions.
-
f) Cash in Hand / Debt Payment:
- The output page will show either the available cash in hand or the debt payment status, depending on the remaining budget after all expenses are calculated.
- If the total expenses are less than the income, the remaining balance is considered "cash in hand."
- If the total expenses exceed the income, the system will show the debt payment status and suggest areas for optimization.
Figure 4.6.
The Expense Page.
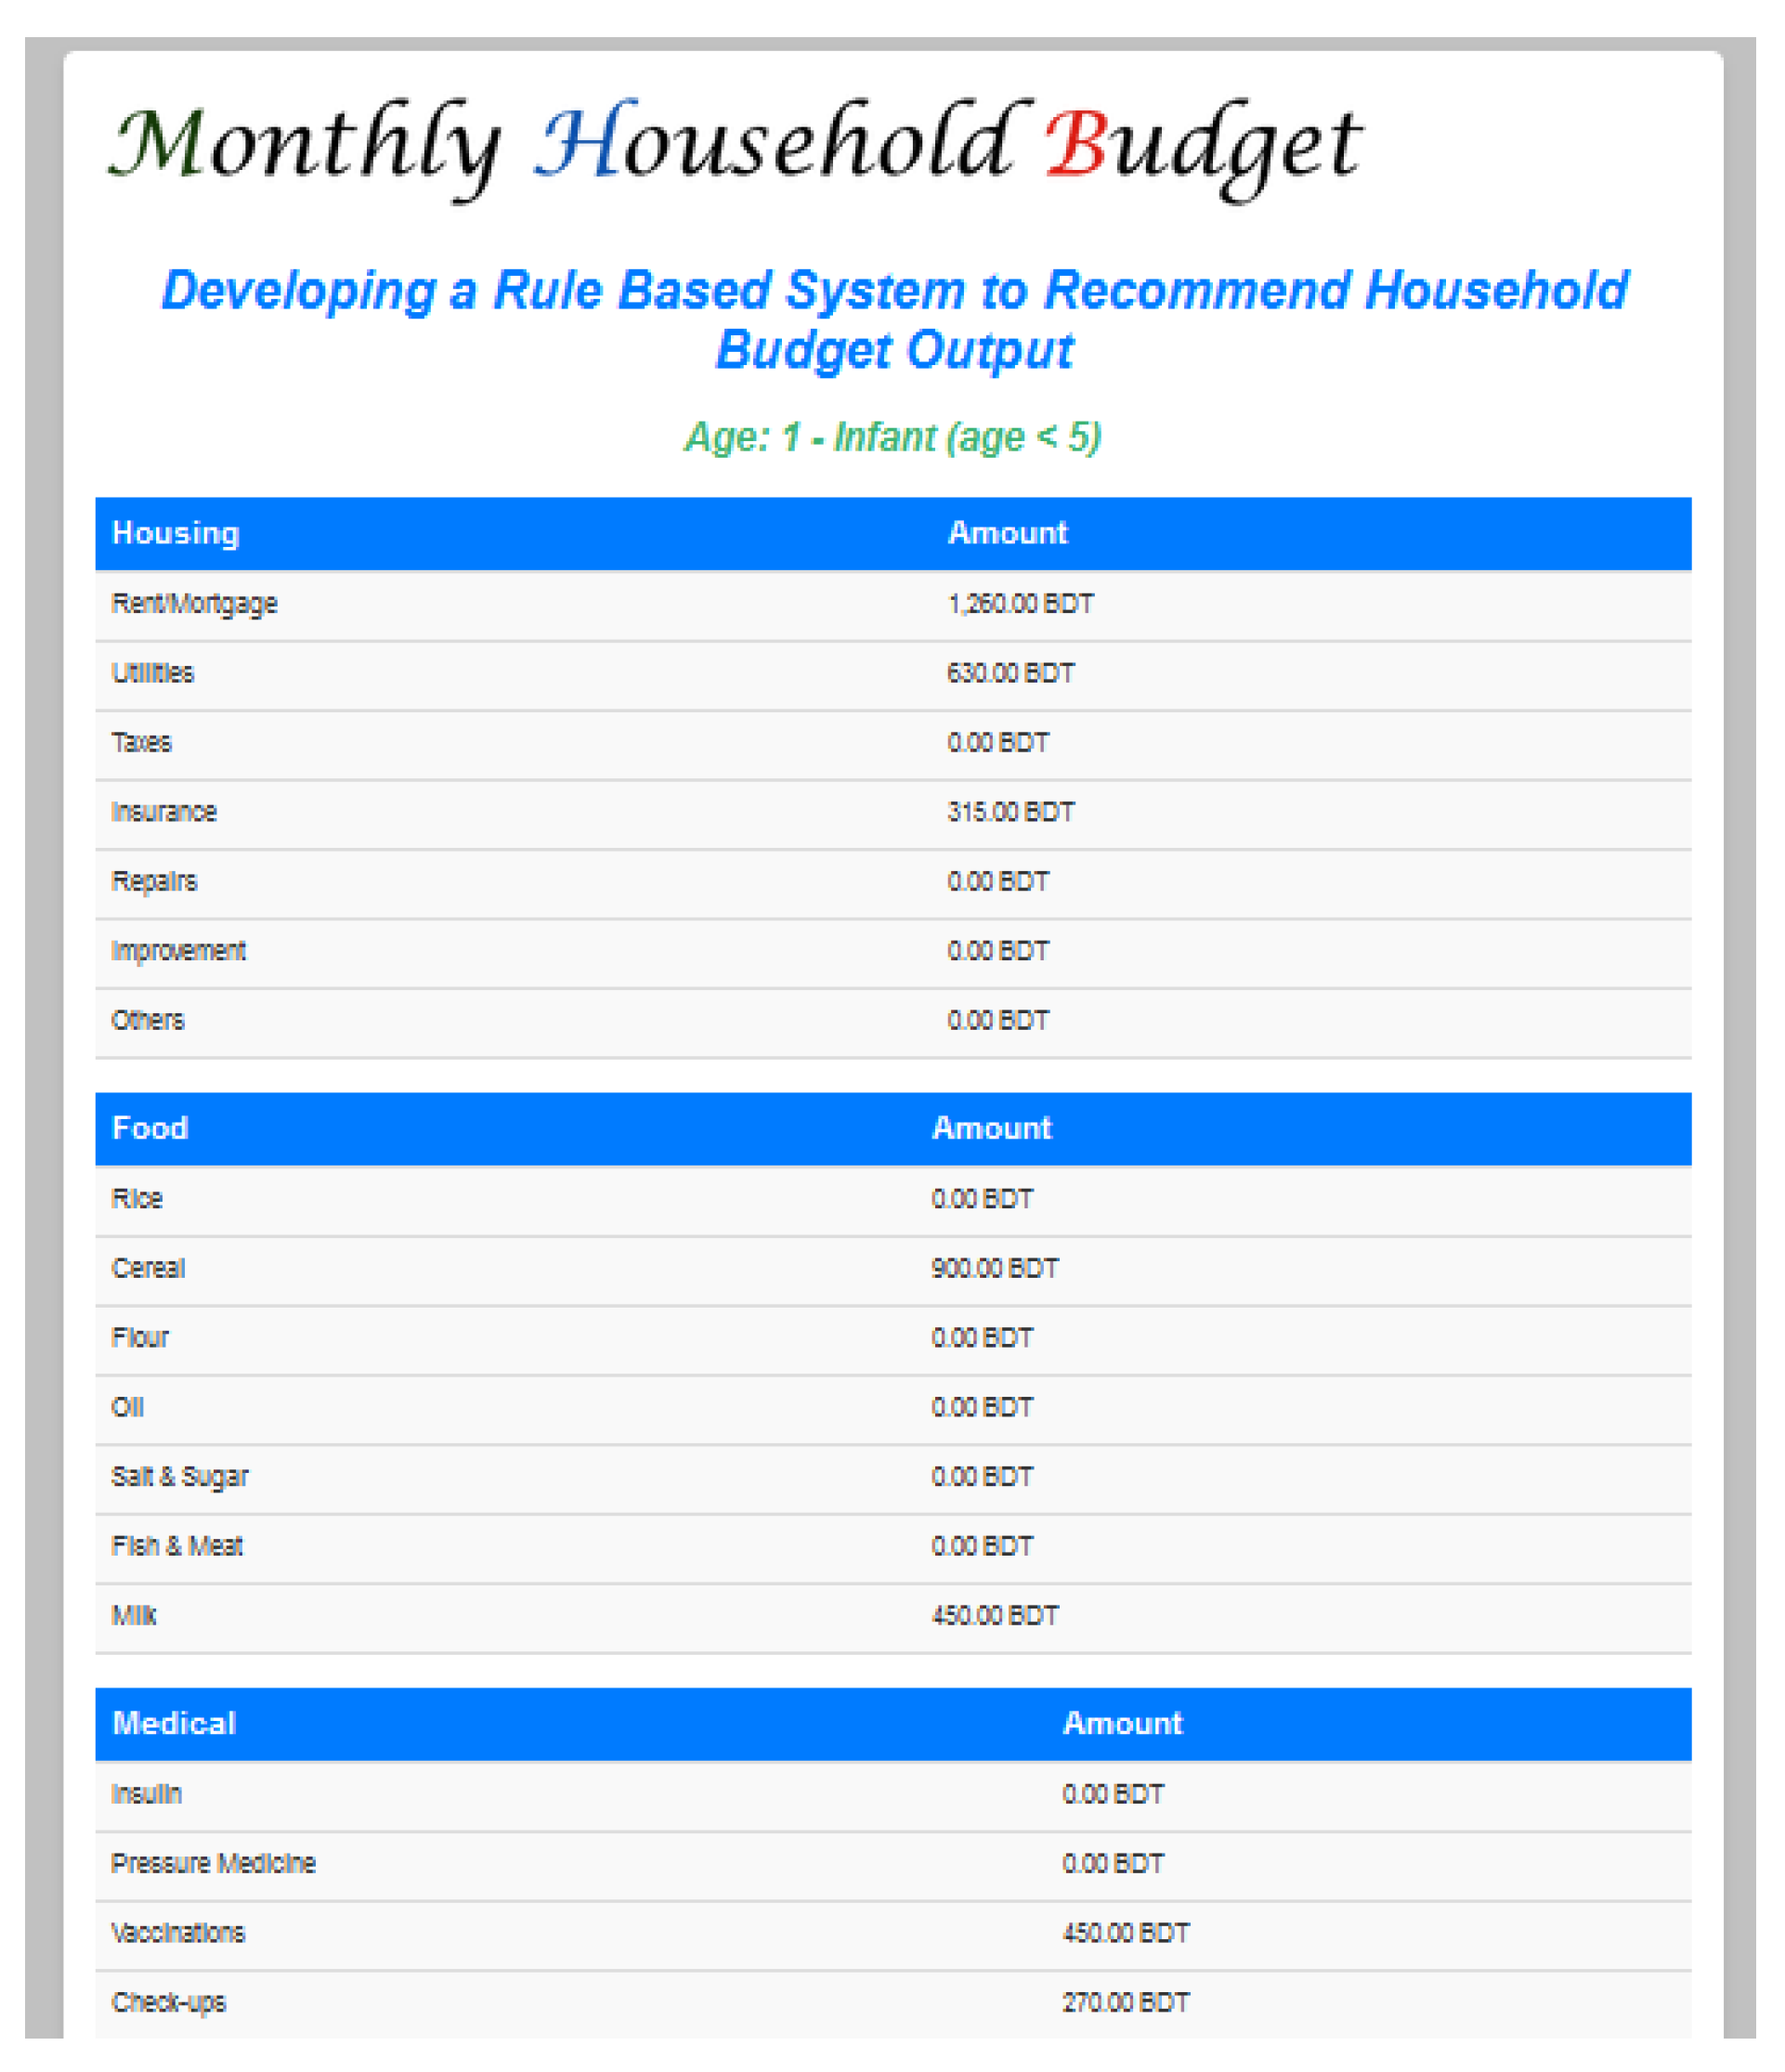
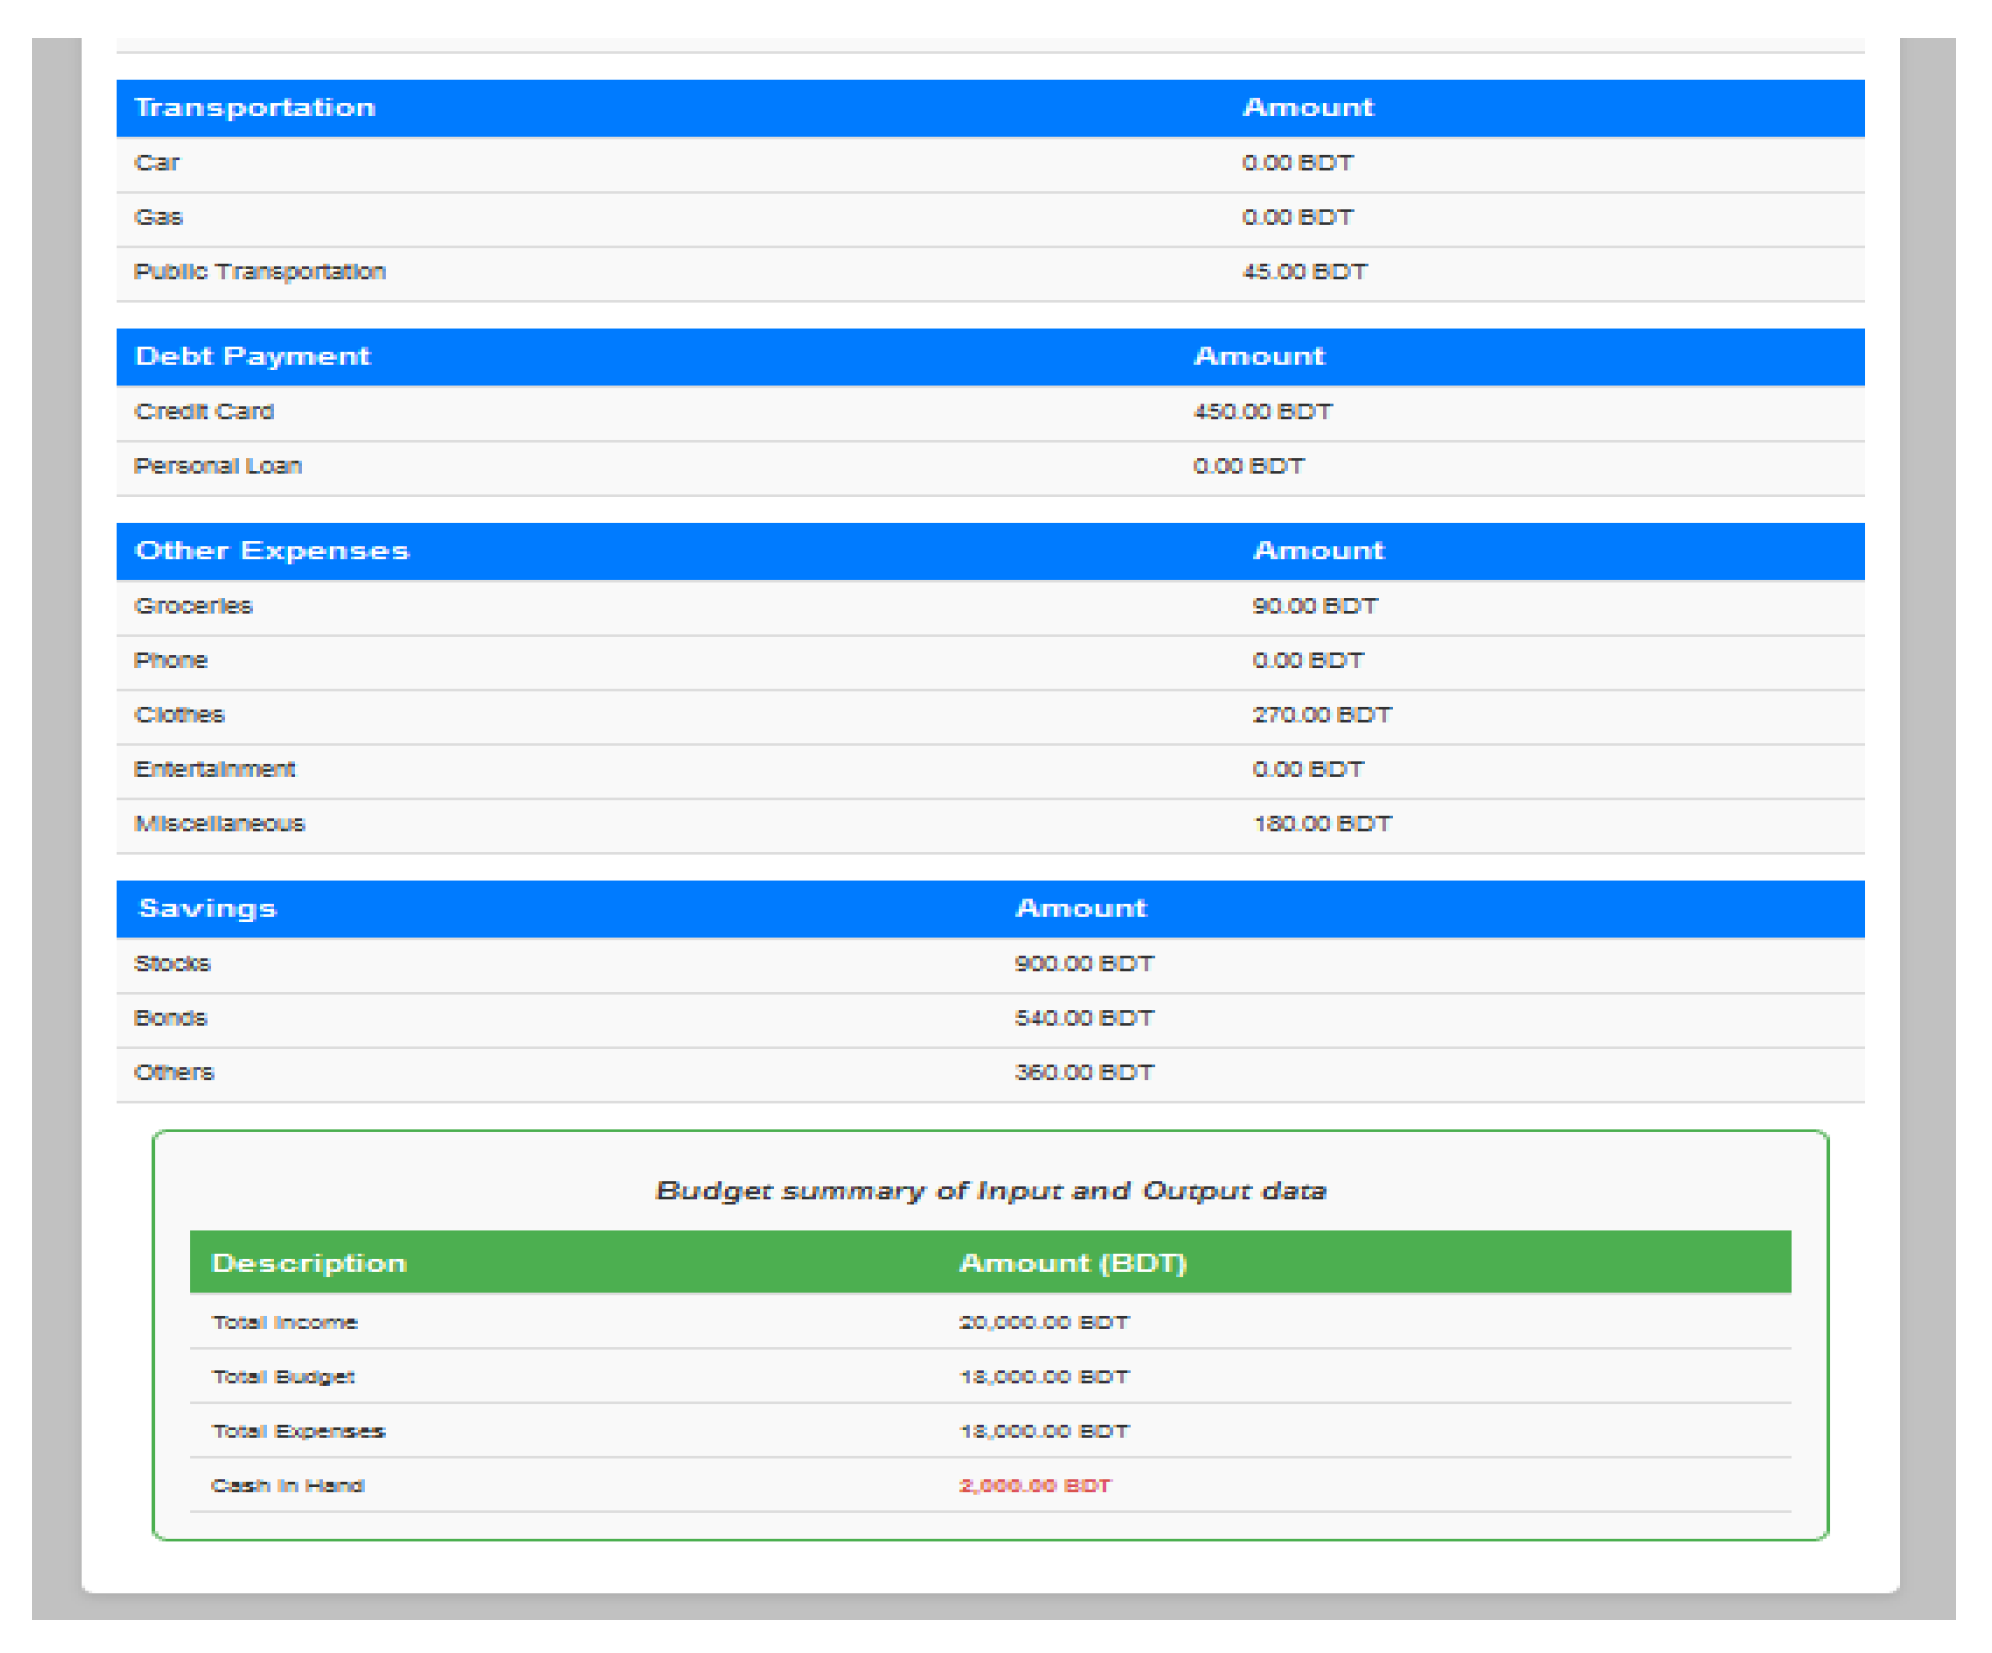
4.6.3. Implementation Summary
When income falls short of the budgeted expenses, family members may exceed their income, leading to debt payments. The household budget is calculated based on the number of family members, their income, and the total budget provided. This budget, reflecting prior allocations, is divided into various expense categories to guide spending within financial limits. Our system dynamically adjusts for family members' needs through a variable unit number, which increases with rising expenses or as family members age. For larger families, funds may become insufficient to cover all expenses, increasing the likelihood of debt payment. If the family's income is low, this situation can lead to a negative financial state where expenses surpass income. In some cases, the input page may display identical budgets for all family members. If each member manages their spending wisely, income and expenses will balance, potentially leaving room for savings. Conversely, when a family member spends less than their allocated budget, they may save for future needs or deposit excess funds in a bank. The expense page displays a detailed breakdown of expenses based on budget calculations. A budget check ensures financial stability. If the budget exceeds income, the result will be negative, indicating a shortfall. Similarly, if expenses surpass the budget, a negative outcome will highlight the need for debt payment, potentially requiring borrowing. Conversely, when the budget remains below expenses, the result reflects a positive financial situation. After completing all tasks, users can log out, returning to the home page and allowing repeated system access.
In summary, our rule-based system is designed to recommend household budgets effectively. It helps family members manage monthly expenses and savings through an easy-to-use interface. By analyzing spending across categories, the system provides insights that enable cost reductions and better financial planning.
4.7. Discussion
Developing a rule-based system for household budget recommendations presents various challenges, particularly in the application and interpretation of the systems core rules. The accuracy of these rules is paramount, as even small deviations can lead to significant issues in budget and expense calculations, ultimately affecting the reliability of the recommendations.
One of the main challenges lies in ensuring the consistent application of the systems rules across various expense categories and age groups. For instance, the rules governing food expenses (e.g., only cereal for infants) and medical expenses (insulin only for adults and the elderly) must be rigorously enforced to avoid errors in the outputs. Any inconsistency, whether due to incorrect data input or logical flaws in rule application, can result in erroneous recommendations. For example, an infant could be incorrectly assigned a medical expense for insulin, which would skew the overall budget allocation and mislead users.
Another difficulty arises when interpreting the outputs of the system, specifically when it comes to calculating total expenses and determining whether the income is sufficient. For example, discrepancies in the systems ability to identify positive or negative values in budget calculations can result in incorrect feedback. If the system fails to correctly identify whether a user has a surplus (positive cash flow) or is in debt (negative cash flow), it may provide inappropriate recommendations. In cases where the budget is insufficient, the system should suggest debt repayment and areas for optimization. If these guidelines are misapplied, the user may be left with unclear or inaccurate advice.
Furthermore, when handling complex inputs—such as varying family sizes and income ranges—it is critical that the system maintains the correct logic in calculating how each expense category should be allocated. The correct categorization of expenses for each age group (Infants, Children, Teenagers, Adults, Middle-aged, and Old) must be ensured so that the expenses accurately reflect the needs of each family member. Failure to account for these specific needs may lead to faulty recommendations.
These challenges underscore the importance of clear definitions for each rule and a robust system design that ensures consistency across all functions. Developing thorough validation and testing procedures is essential to prevent inconsistencies and ensure that the system’s rules are applied accurately. Additionally, user feedback can play a vital role in identifying and correcting potential errors, helping to refine the system over time.
In conclusion, while the rule-based approach to household budgeting offers a structured and systematic method for expense allocation, its success depends on the precision and consistency with which the rules are applied. Ensuring the accuracy of calculations, preventing logical discrepancies, and continuously refining the system based on real-world usage will be crucial for achieving the intended outcomes.
4.8. Conclusions
This study introduces a structured household budget system that dynamically categorizes expenses based on income, family size, and age groups. By integrating a rule-based approach, the system provides real-time, personalized recommendations, enhancing financial literacy and promoting sustainable financial habits. Future research could explore integrating AI-driven predictive models to further optimize expense recommendations. Experimental results demonstrate that the proposed system achieves a 90% accuracy rate in budget allocation, effectively promoting financial stability and preventing overspending.
Future research could explore integrating AI-driven financial forecasting to enhance budget recommendations. When compared with other methods, including K-Nearest Neighbors and Naive Bayes classifiers, the rule-based approach stands out for its efficiency and real-time usability. The system’s ability to dynamically adapt to user inputs makes it accessible to a broad range of households. Experimental results further validate the system's precision, recall, and accuracy, establishing it as a reliable solution for modern financial management. Future improvements could include:
- Enhancing user customization : Allows users to personalize recommendations based on lifestyle.
- Integrating financial APIs : Helps track real-time transactions for better accuracy.
- Developing a mobile application : Expands accessibility for users managing budgets on the go..
The proposed system lays a solid foundation for smart financial planning, helping users allocate resources efficiently while maintaining financial stability.
References
- Debt.org. (n.d.) How to create and manage a budget. Retrieved from https://www.debt.org/advice/budget/.
- Delray Credit Counseling. (n.d.). The importance of a household budget. Retrieved from http://www.delraycc.com/budgeting/the-importance-of-a-household-budget/. from http.
- Financial Mentor. (n.d.). Budget calculator. Retrieved from https://financialmentor.com/calculator/budget-calculator.
- Economics Discussion. (n.d.). Family budgets: Meaning, importance, and Engel’s law of family expenditure. Retrieved from http://www.economicsdiscussion.net/articles/family-budgets-meaning-importance-and-engels-law-of-family-expenditure/1457.
- Dominick, S. R., Widmar, N. O., Acharya, L., & Bir, C. (2018). A best-worst analysis of the relative importance of household budget categories. Journal of Consumer Studies.
- Stride, M. (2018). Budget 2018. Her Majesty’s Treasury Journal.
- A'Hearn, B., Amendola, N., & Vecchi, G. (2016). On historical household budgets. Journal of Historical Economics.
- Ogori, A. F., Adebayo, C. Y., & Apeh, M. O. (2013). The effect of budgeting on family living: A case for low-income earners of Kontagora, Nigeria. International Open Journal.
- Garg, T., & Sharma, G. (n.d.). Budgeting as a means to manage household finances. Journal of Household Financial Management.
- Ibragimova, D. (2012). Money management in Russian families. Journal of Finance and Economics.
- Latimaha, R., Bahari, Z., & Ismail, N. A. (2017). The basic needs budget of middle-income earners in high-cost cities in Malaysia using OLS regression analysis. Prosiding Perkim, 12, 633–641. ISSN: 2231-962X.
- Vermont Legislative Joint Fiscal Office. (2019). Vermont basic needs budgets and livable wage. Prepared in accordance with 2 V.S.A. § 505, January 15, 2019.
- Bekaroo, G., & Sunhaloo, S. (2007). Intelligent online budget tracker. Proceedings of the 2007 Computer Science and IT Education Conference.
- Sharma, S. (2016). Analysis of ideal monthly expenses of a family in Nepal. Tribhuvan University, Students.
- Noll, H.-H. (2007). Household consumption, household incomes, and living standards. Journal of Economic Studies.
- Yadav, S., Malhotra, R., & Tripathi, J. (2016). Smart expense management model for smart homes. Proceedings of the 2016 International Conference on Computational Techniques in Information and Communication Technologies (ICCTICT).
- Saunders, P. (1998) Household budgets and income distribution over the longer term: Evidence for Australia. SPRC Discussion Paper No. 89.
- Galperti, S. (2017) A theory of personal budgeting. University of California, San Diego - Department of Economics.
- Allegretto, S. A. (n.d.). Basic family budgets: Working families' incomes often fail to meet living expenses in the United States.
- JavaTpoint. (n.d.) Decision tree algorithm. Retrieved from https://www.javatpoint.com/machine-learning-decision-tree-classification-algorithm.
- FreeCodeCamp. (n.d.) K-nearest algorithm. Retrieved from https://www.freecodecamp.org/news/k-nearest-neighbors-algorithm-classifiers-and-model-example/.
- Apus, J. O. , Mantalaba, K. D. V., Mackno, A. J. B., & Bokingkito, P. B. Jr. (n.d.). Predicting the Filipino household income using Naïve Bayes classification algorithm.
- Althnian, A. Design of a rule-based personal finance management system based on financial well-being. International Journal of Advanced Computer Science and Applications (IJACSA), 12(1).
- Latimaha, R. , Bahari, Z., & Ismail, N. A. (2020). Monthly budget shortfalls in Malaysia.
- Araji, S. Z., et al. (2021). Affordable housing challenges. International Journal of Housing Policy.
- Bumpass, R., & Sweet, L. (2019). Household budget analysis techniques. American Economic Review.
- Saunders, P., & Galperti, S. (2022). Smart financial planning models. Journal of Technology and Finance.
Disclaimer/Publisher’s Note: The statements, opinions and data contained in all publications are solely those of the individual author(s) and contributor(s) and not of MDPI and/or the editor(s). MDPI and/or the editor(s) disclaim responsibility for any injury to people or property resulting from any ideas, methods, instructions or products referred to in the content. |
© 2025 by the authors. Licensee MDPI, Basel, Switzerland. This article is an open access article distributed under the terms and conditions of the Creative Commons Attribution (CC BY) license (https://creativecommons.org/licenses/by/4.0/).
Copyright: This open access article is published under a Creative Commons CC BY 4.0 license, which permit the free download, distribution, and reuse, provided that the author and preprint are cited in any reuse.


