
Submitted:
15 February 2025
Posted:
18 February 2025
You are already at the latest version
Abstract
Conical intersections (CIs) are the most efficient channels of photodeactivation and energy transfer, while femtosecond spectroscopy is the main experimental tool delivering information on molecular CI-driven photoinduced processes. In this work, we undertake comprehensive ab initio investigation of the CI-mediated internal conversion in fulvene by simulating evolutions of electronic populations, bond lengths and angles, and time-resolved transient absorption (TA) pump-probe (PP) spectra. TA PP spectra are evaluated on-the-fly, by combining the symmetrical quasi-classical/Meyer-Miller-Stock-Thoss (SQC/MMST) dynamics and the doorway-window representation of spectroscopic signals. We show that the simulated time-resolved TA PP spectra reveal not only the population dynamics but also the key nuclear motions as well as mode-mode couplings. We also demonstrate that TA PP signals are not only experimental observables: They can also be considered as information-rich purely theoretical observables, which deliver more information on the CI-driven dynamics than conventional electronic populations. This information can be extracted by the appropriate theoretical analyses of time-resolved TA PP signals.
Keywords:
1. Introduction
2. Theoretical Methods and Computational Details
2.1. SQC/MMST Approach
2.2. DW Representation of TA PP Signals
2.3. Computational Details
3. Results and Discussion
4. Conclusions
Author Contributions
Funding
Data Availability Statement
Conflicts of Interest
Appendix A
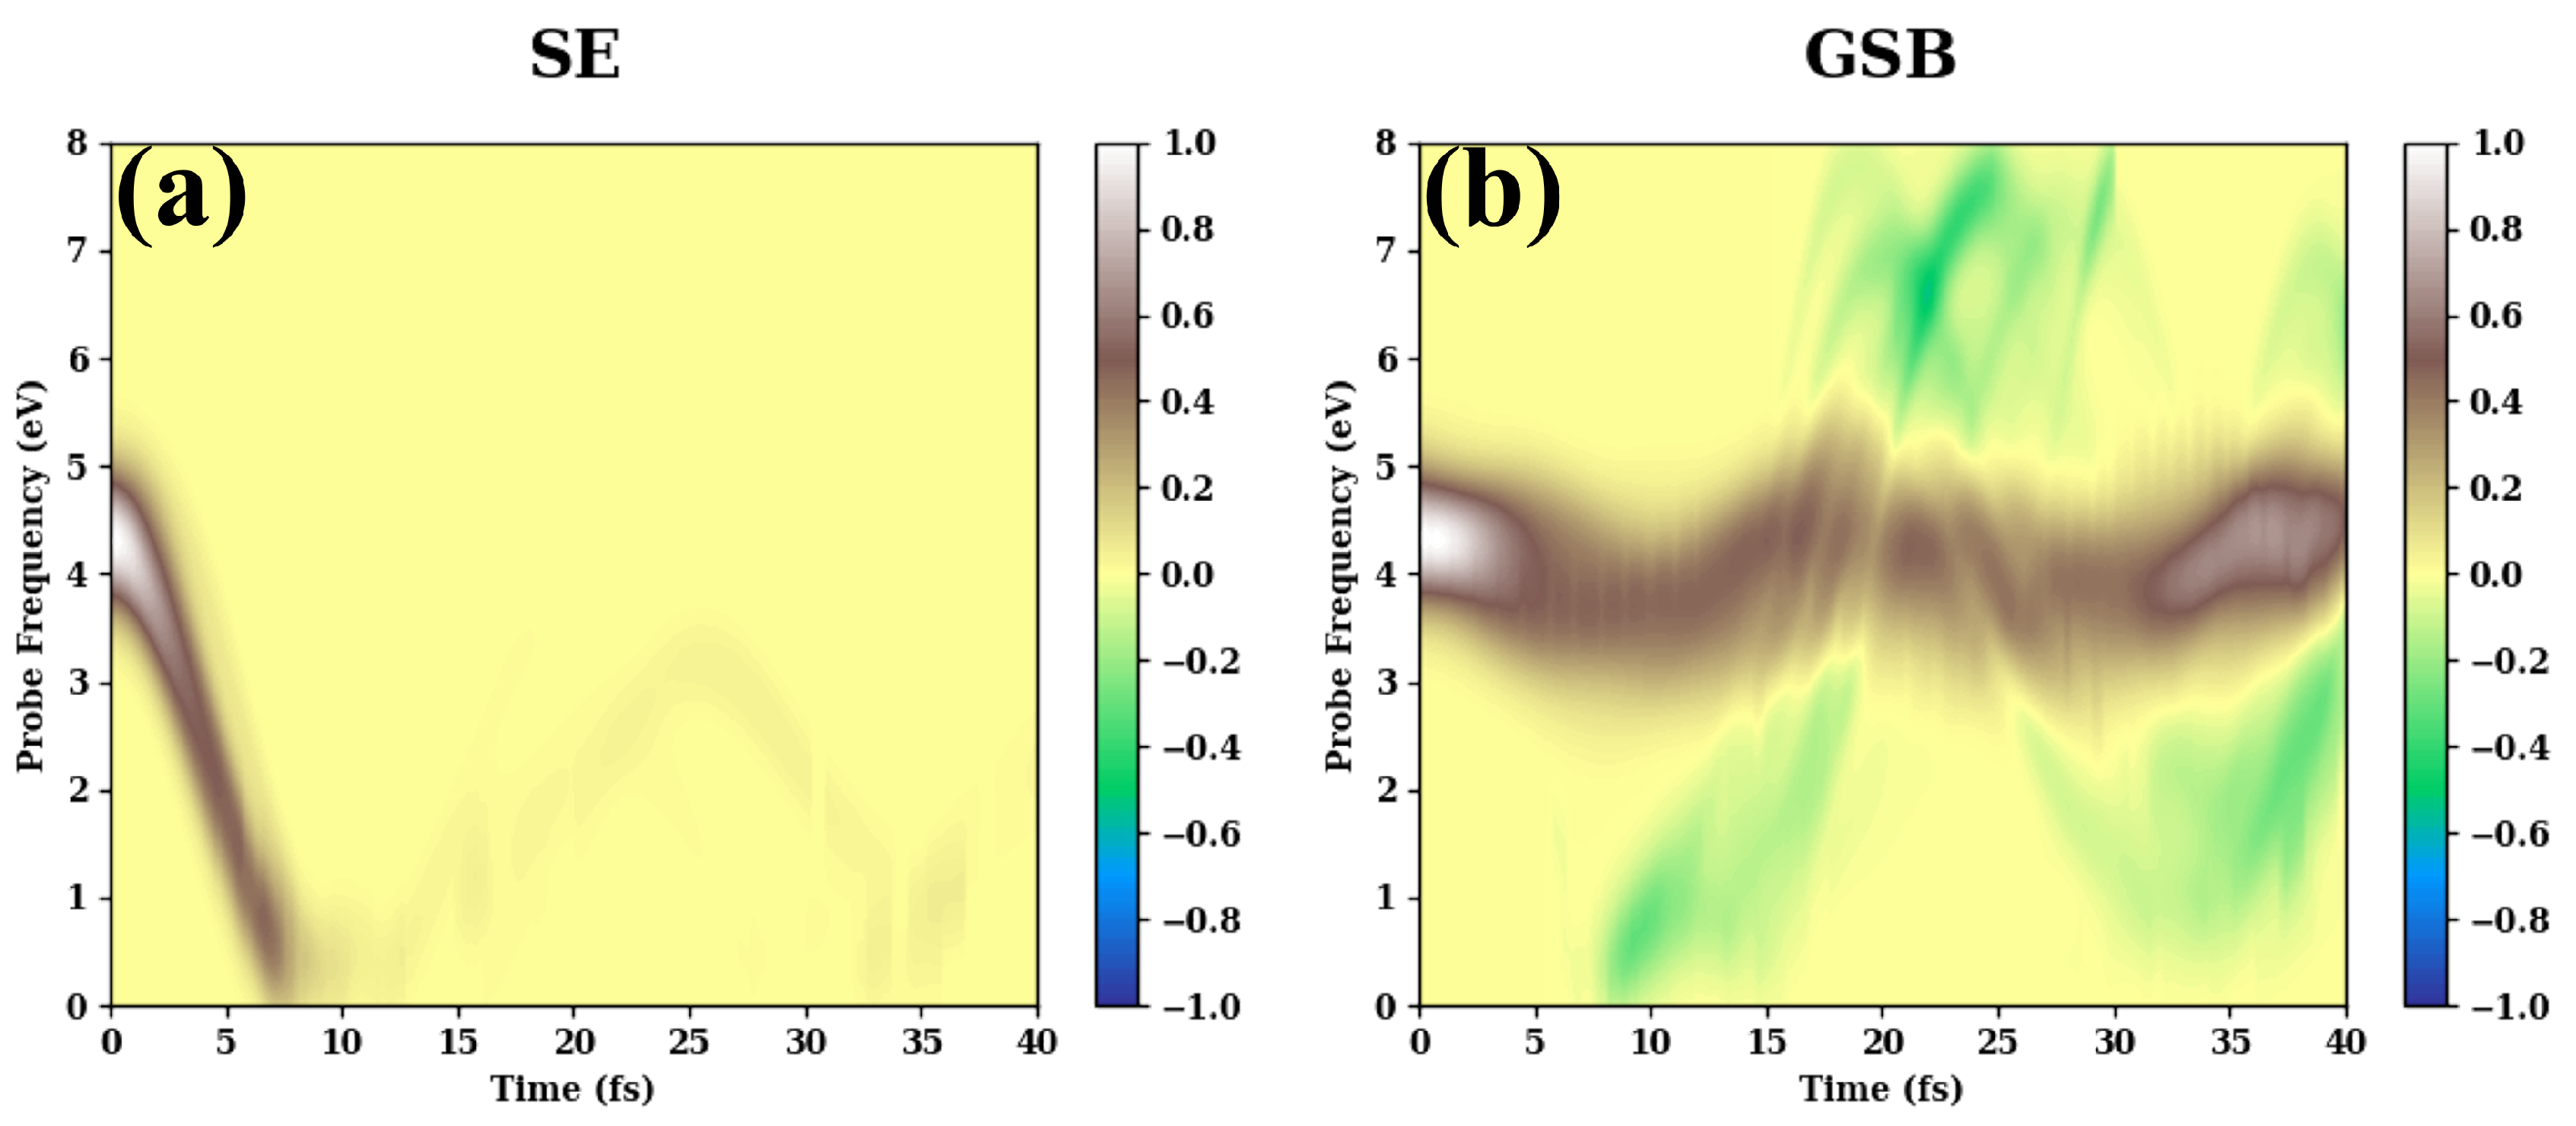
- (a)
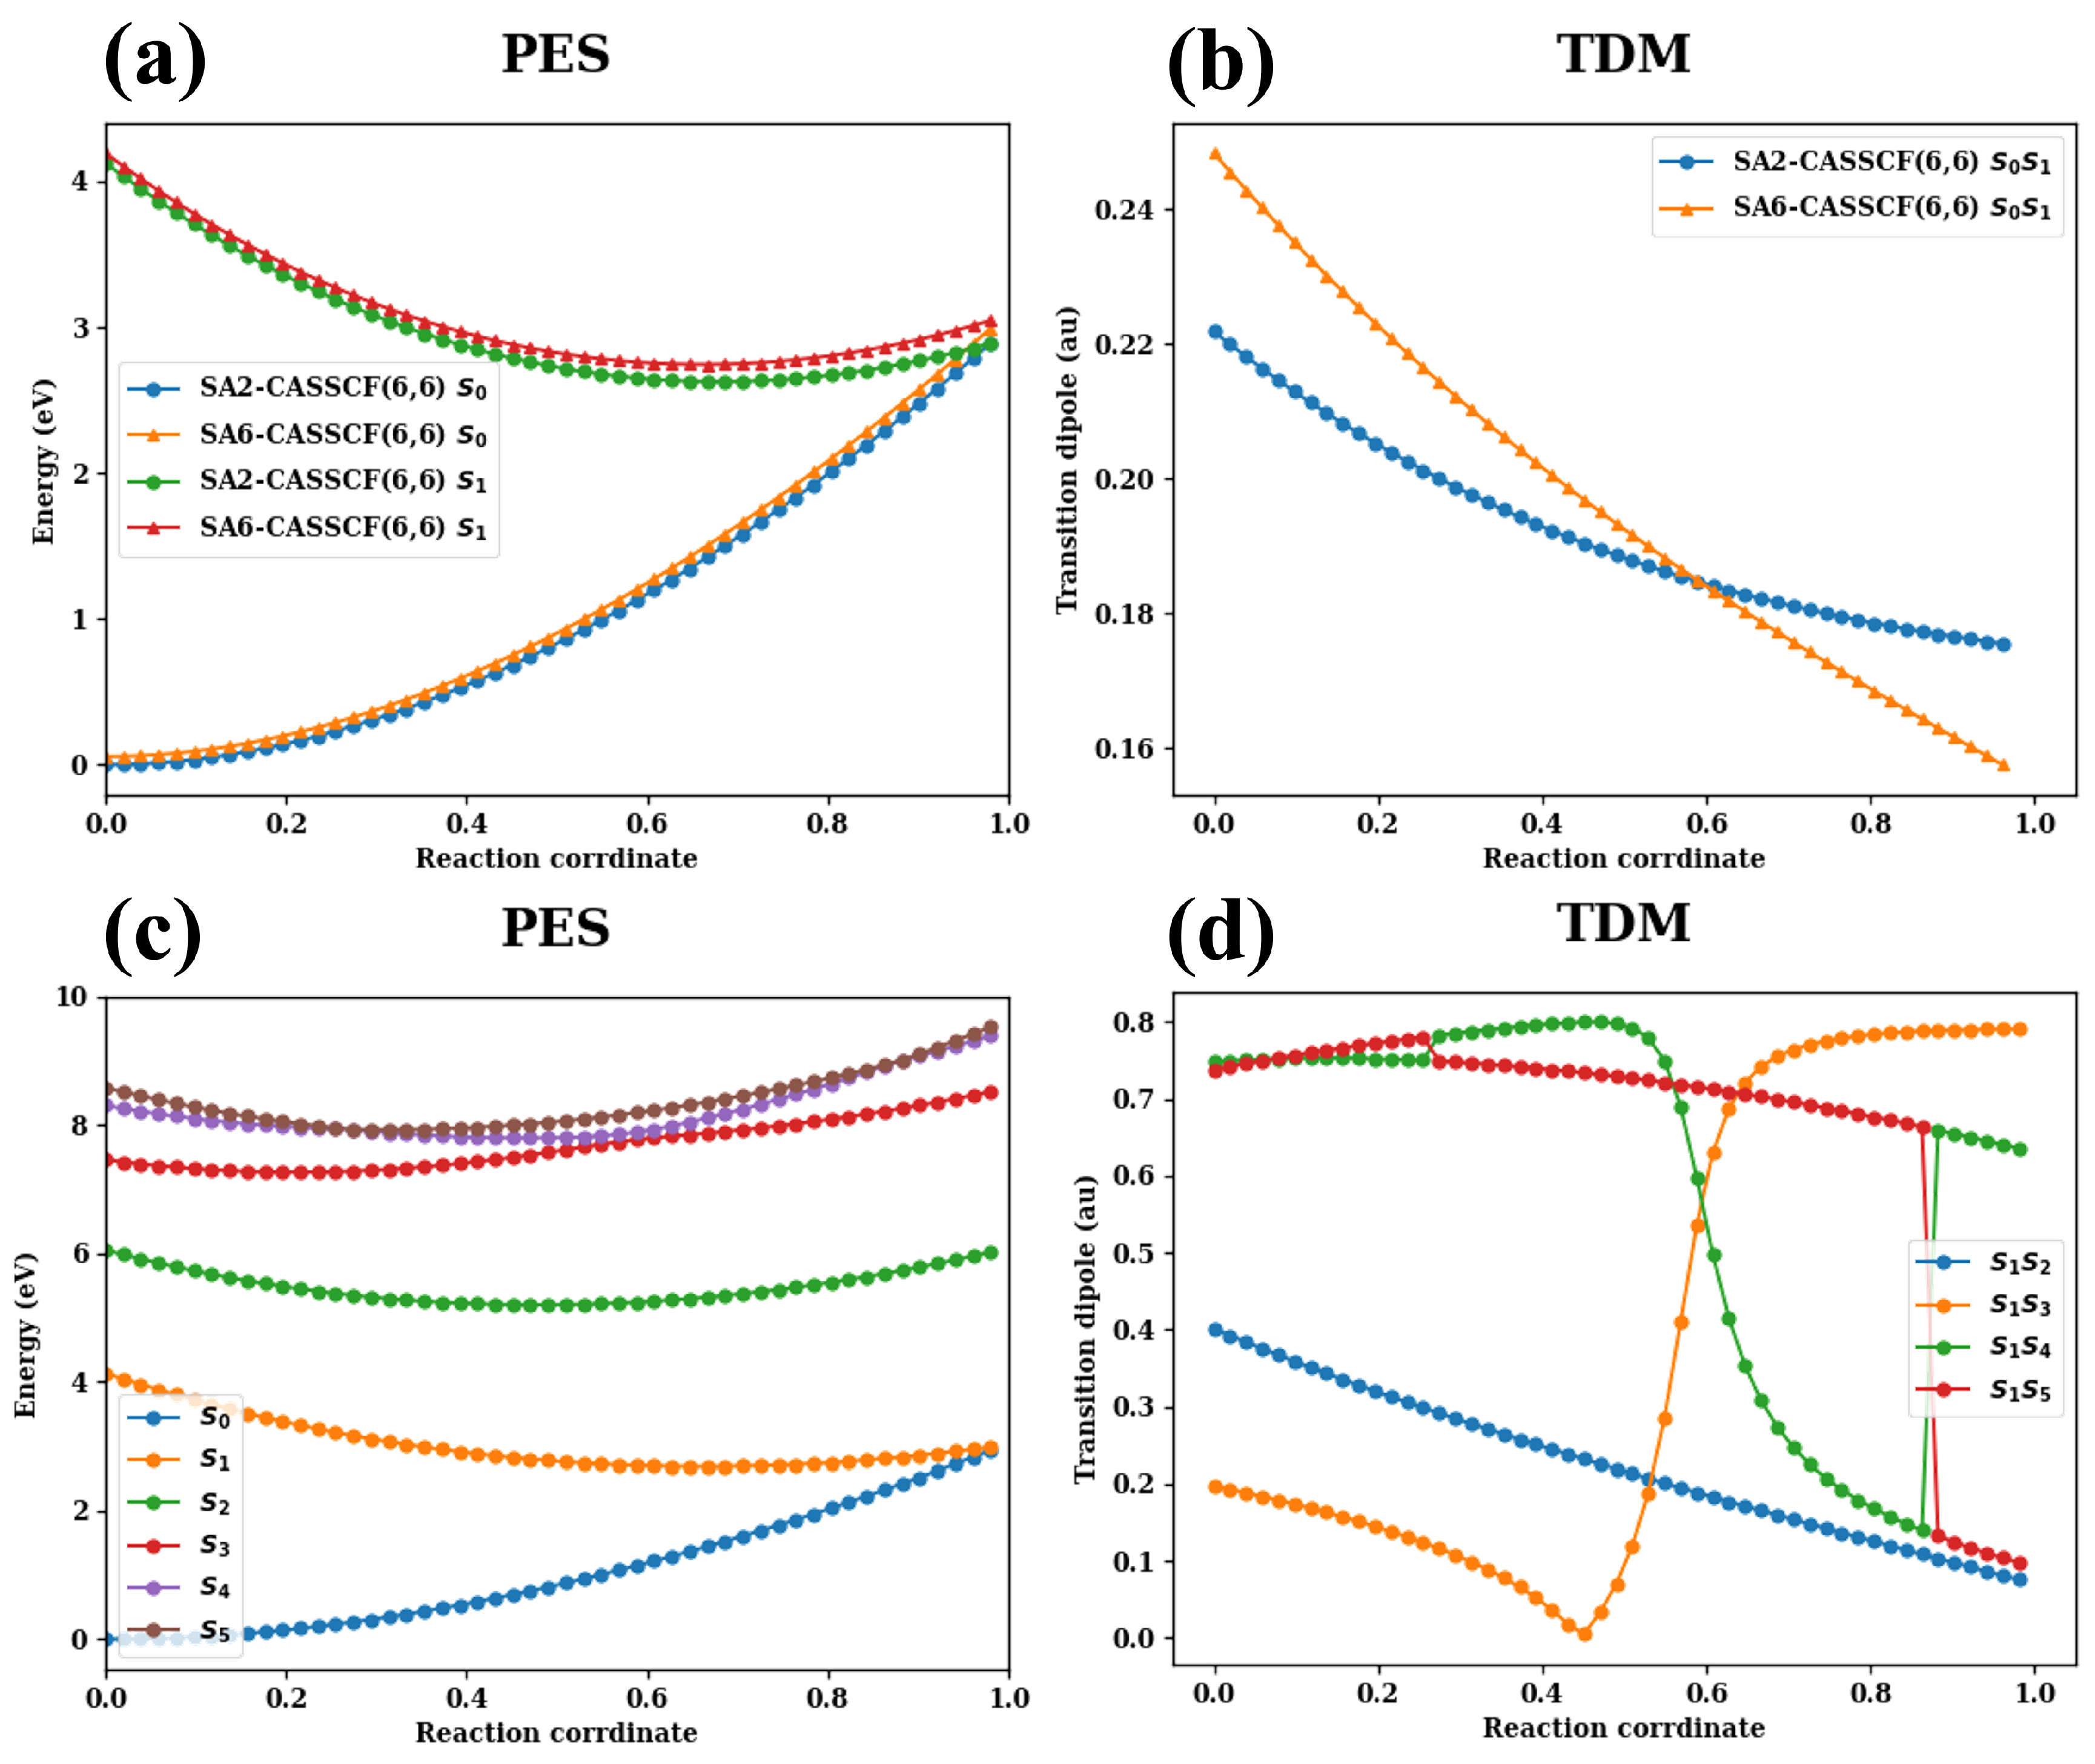
- ASSCF(6,6) level are shown in Figure A1.
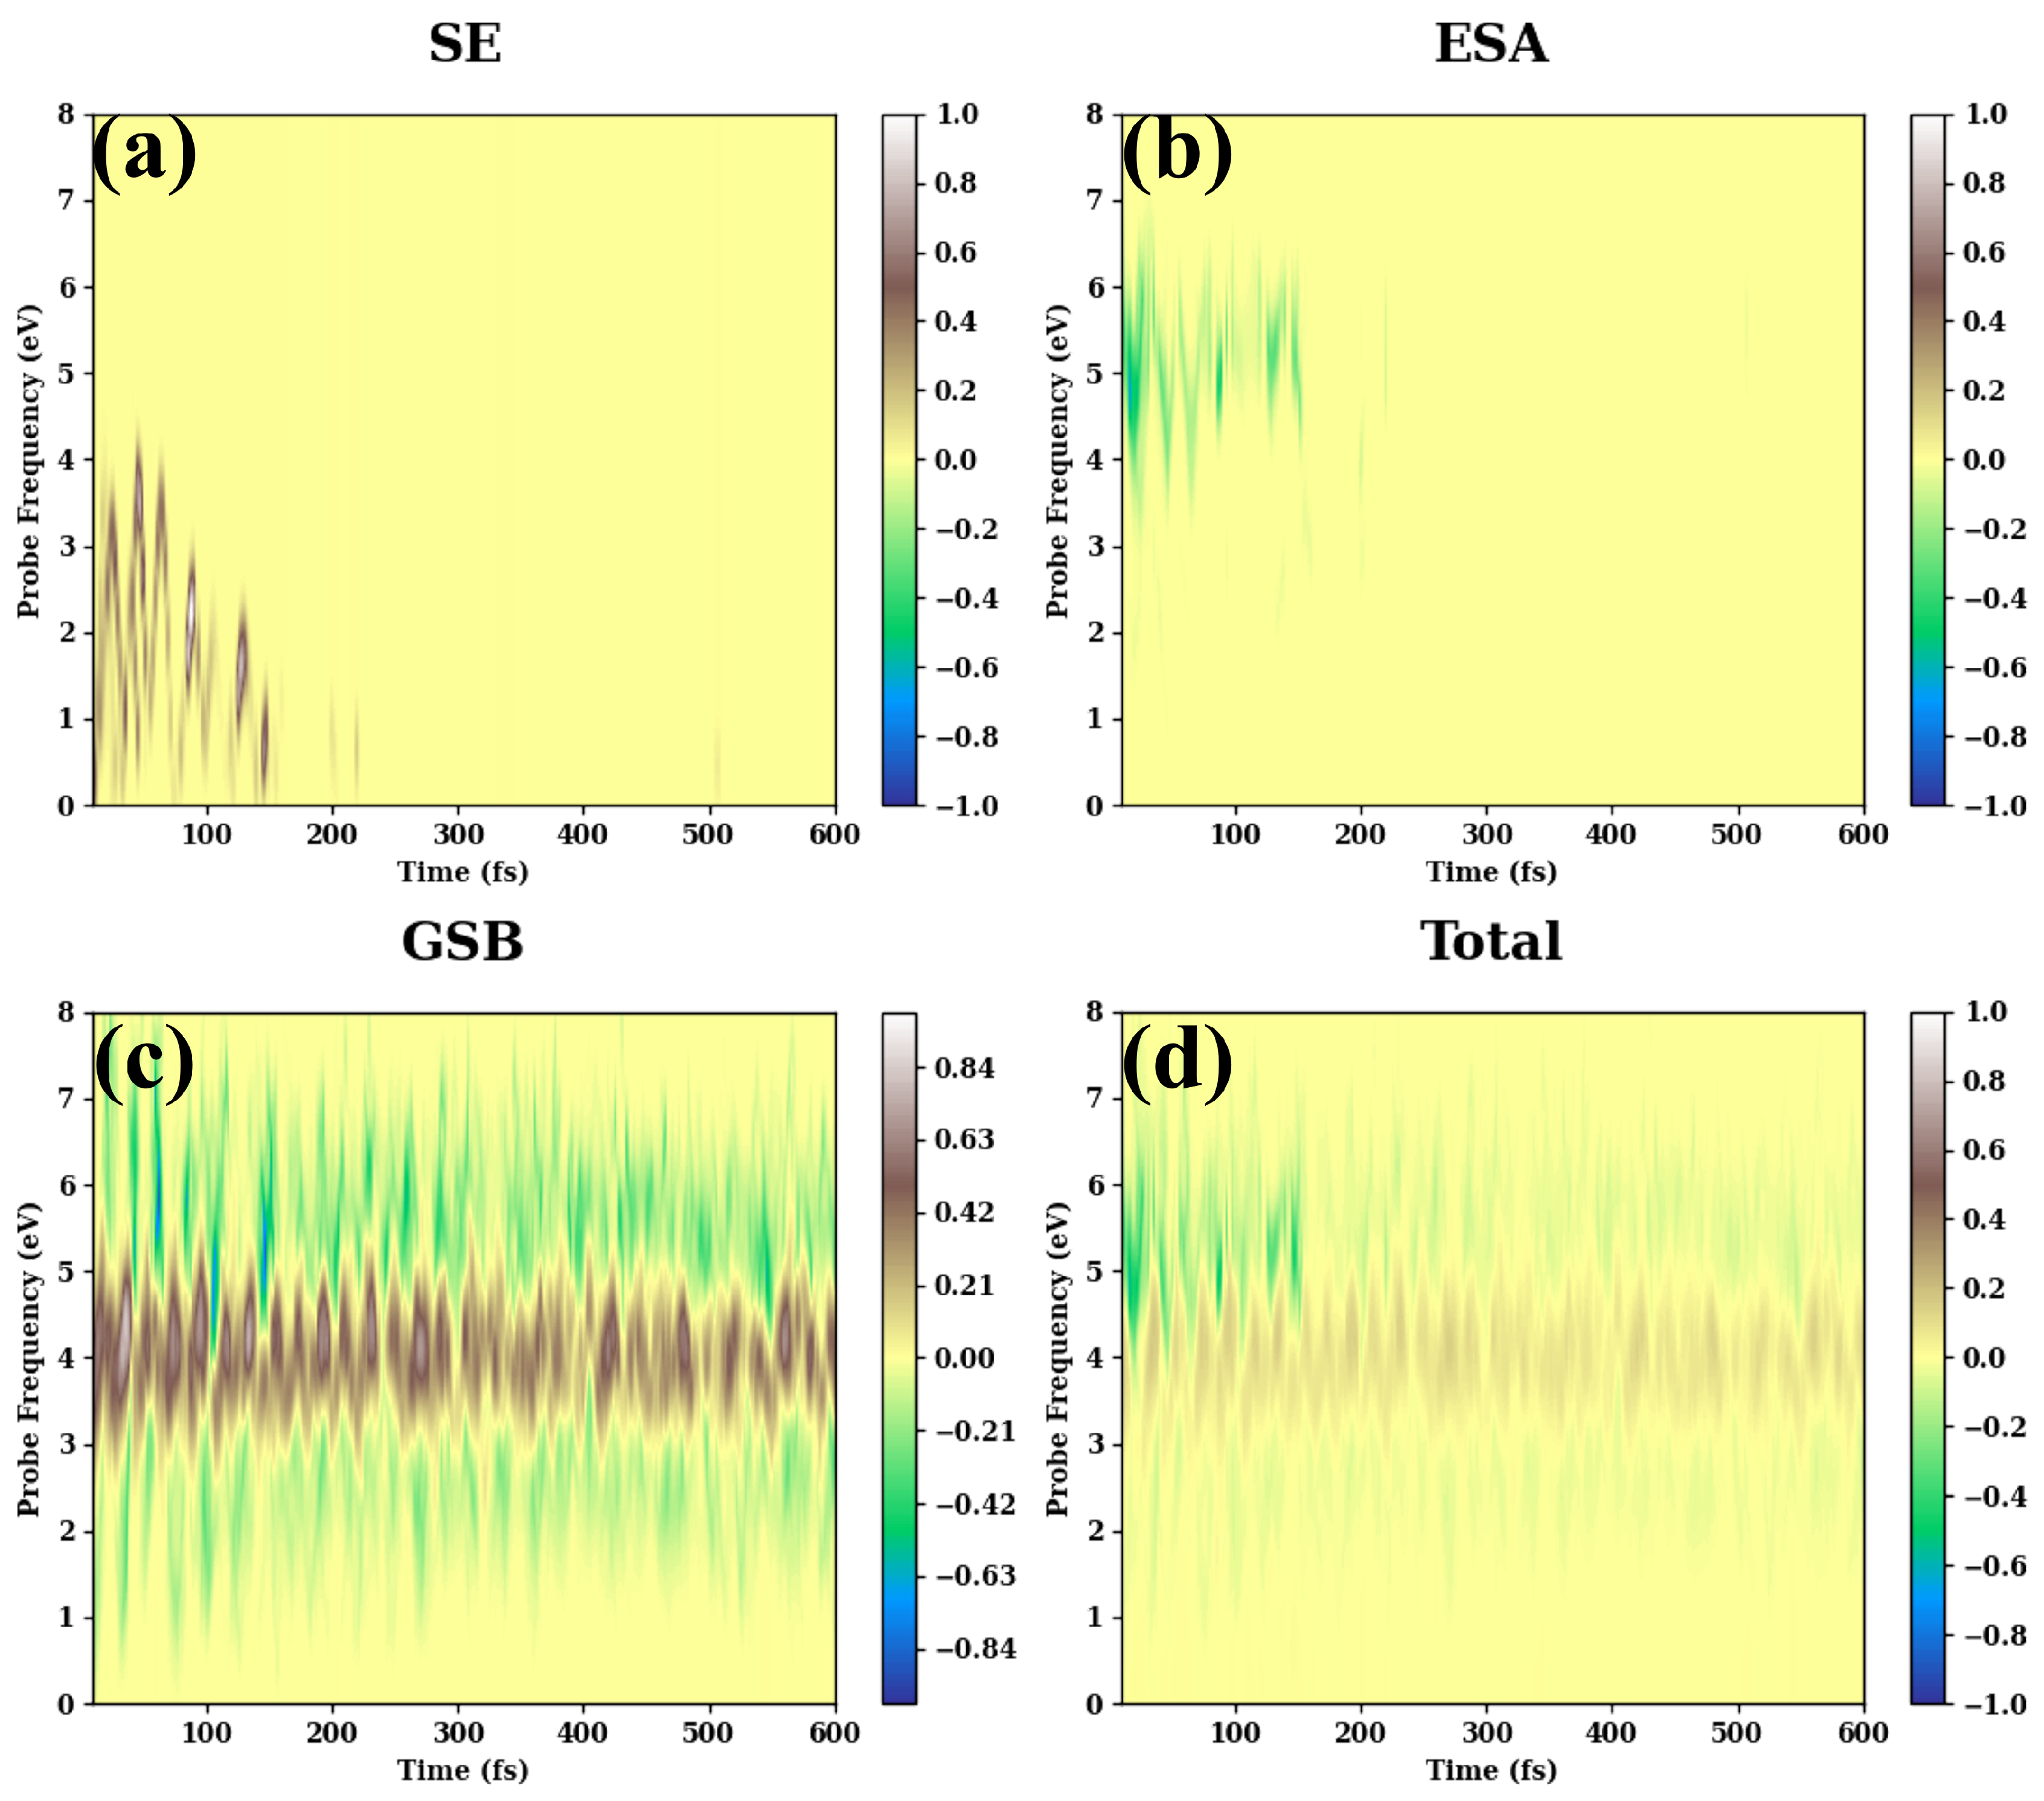
- (b)
- The long-time TA PP signals are given in Figure A2.
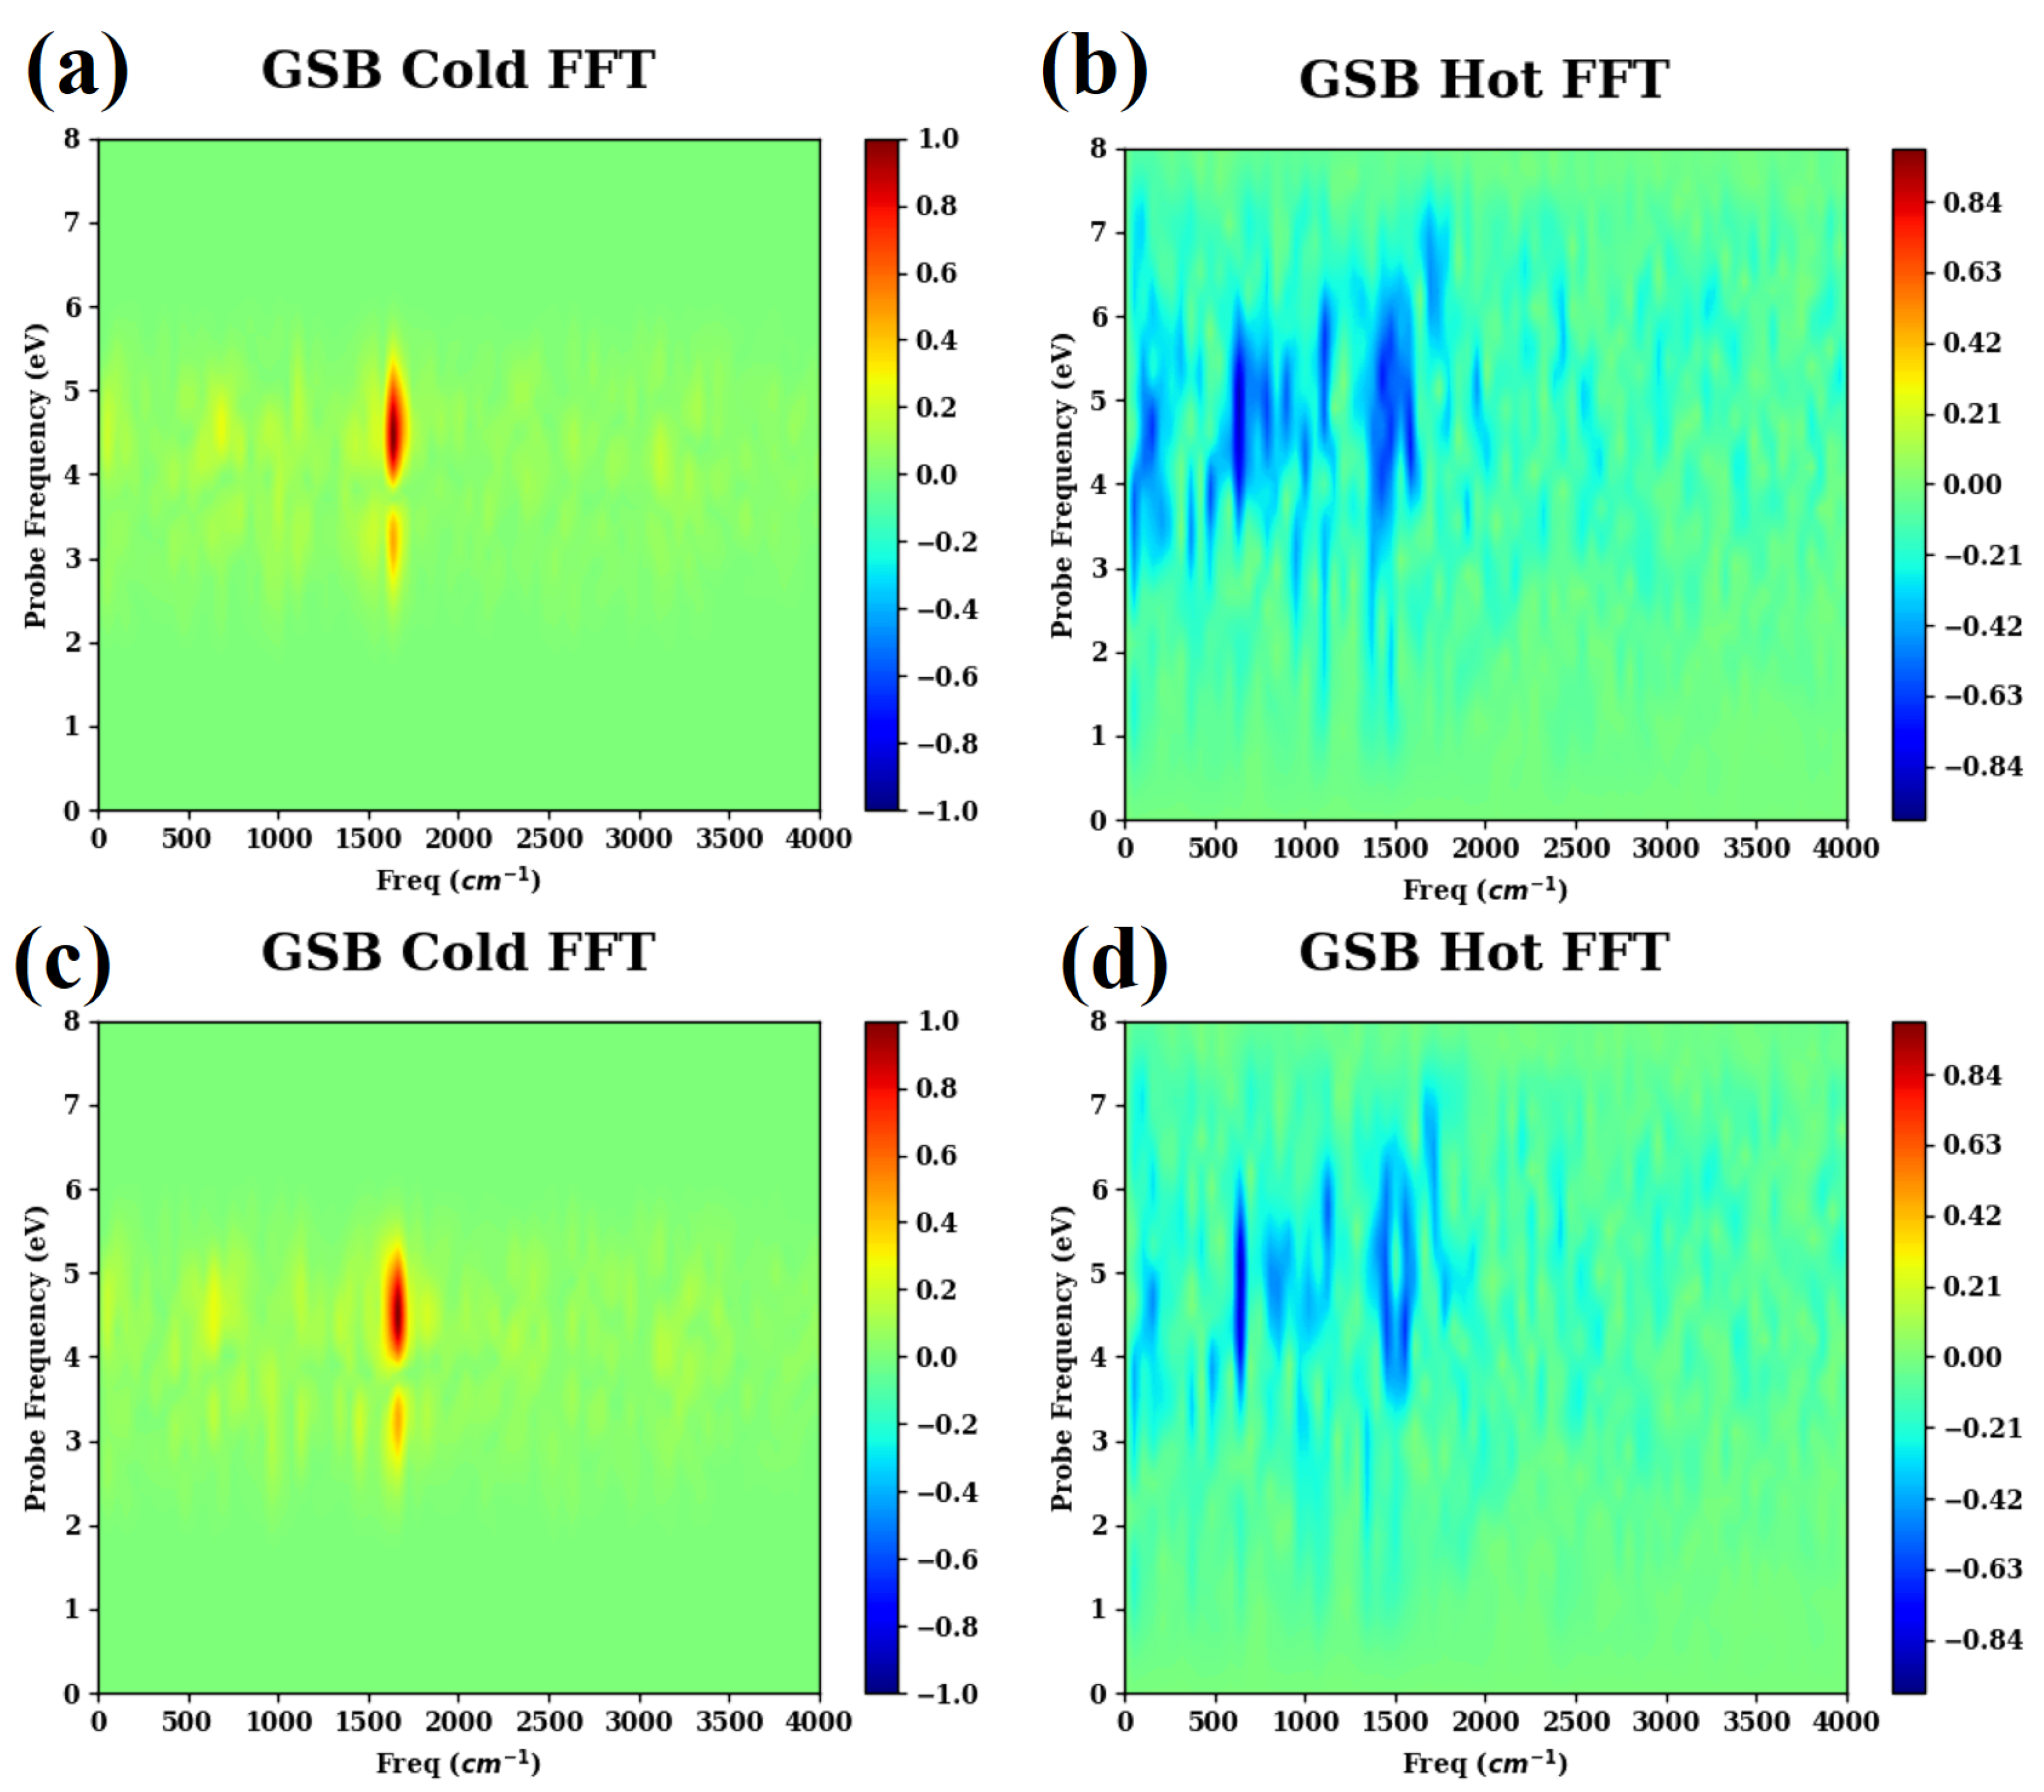
- (c)
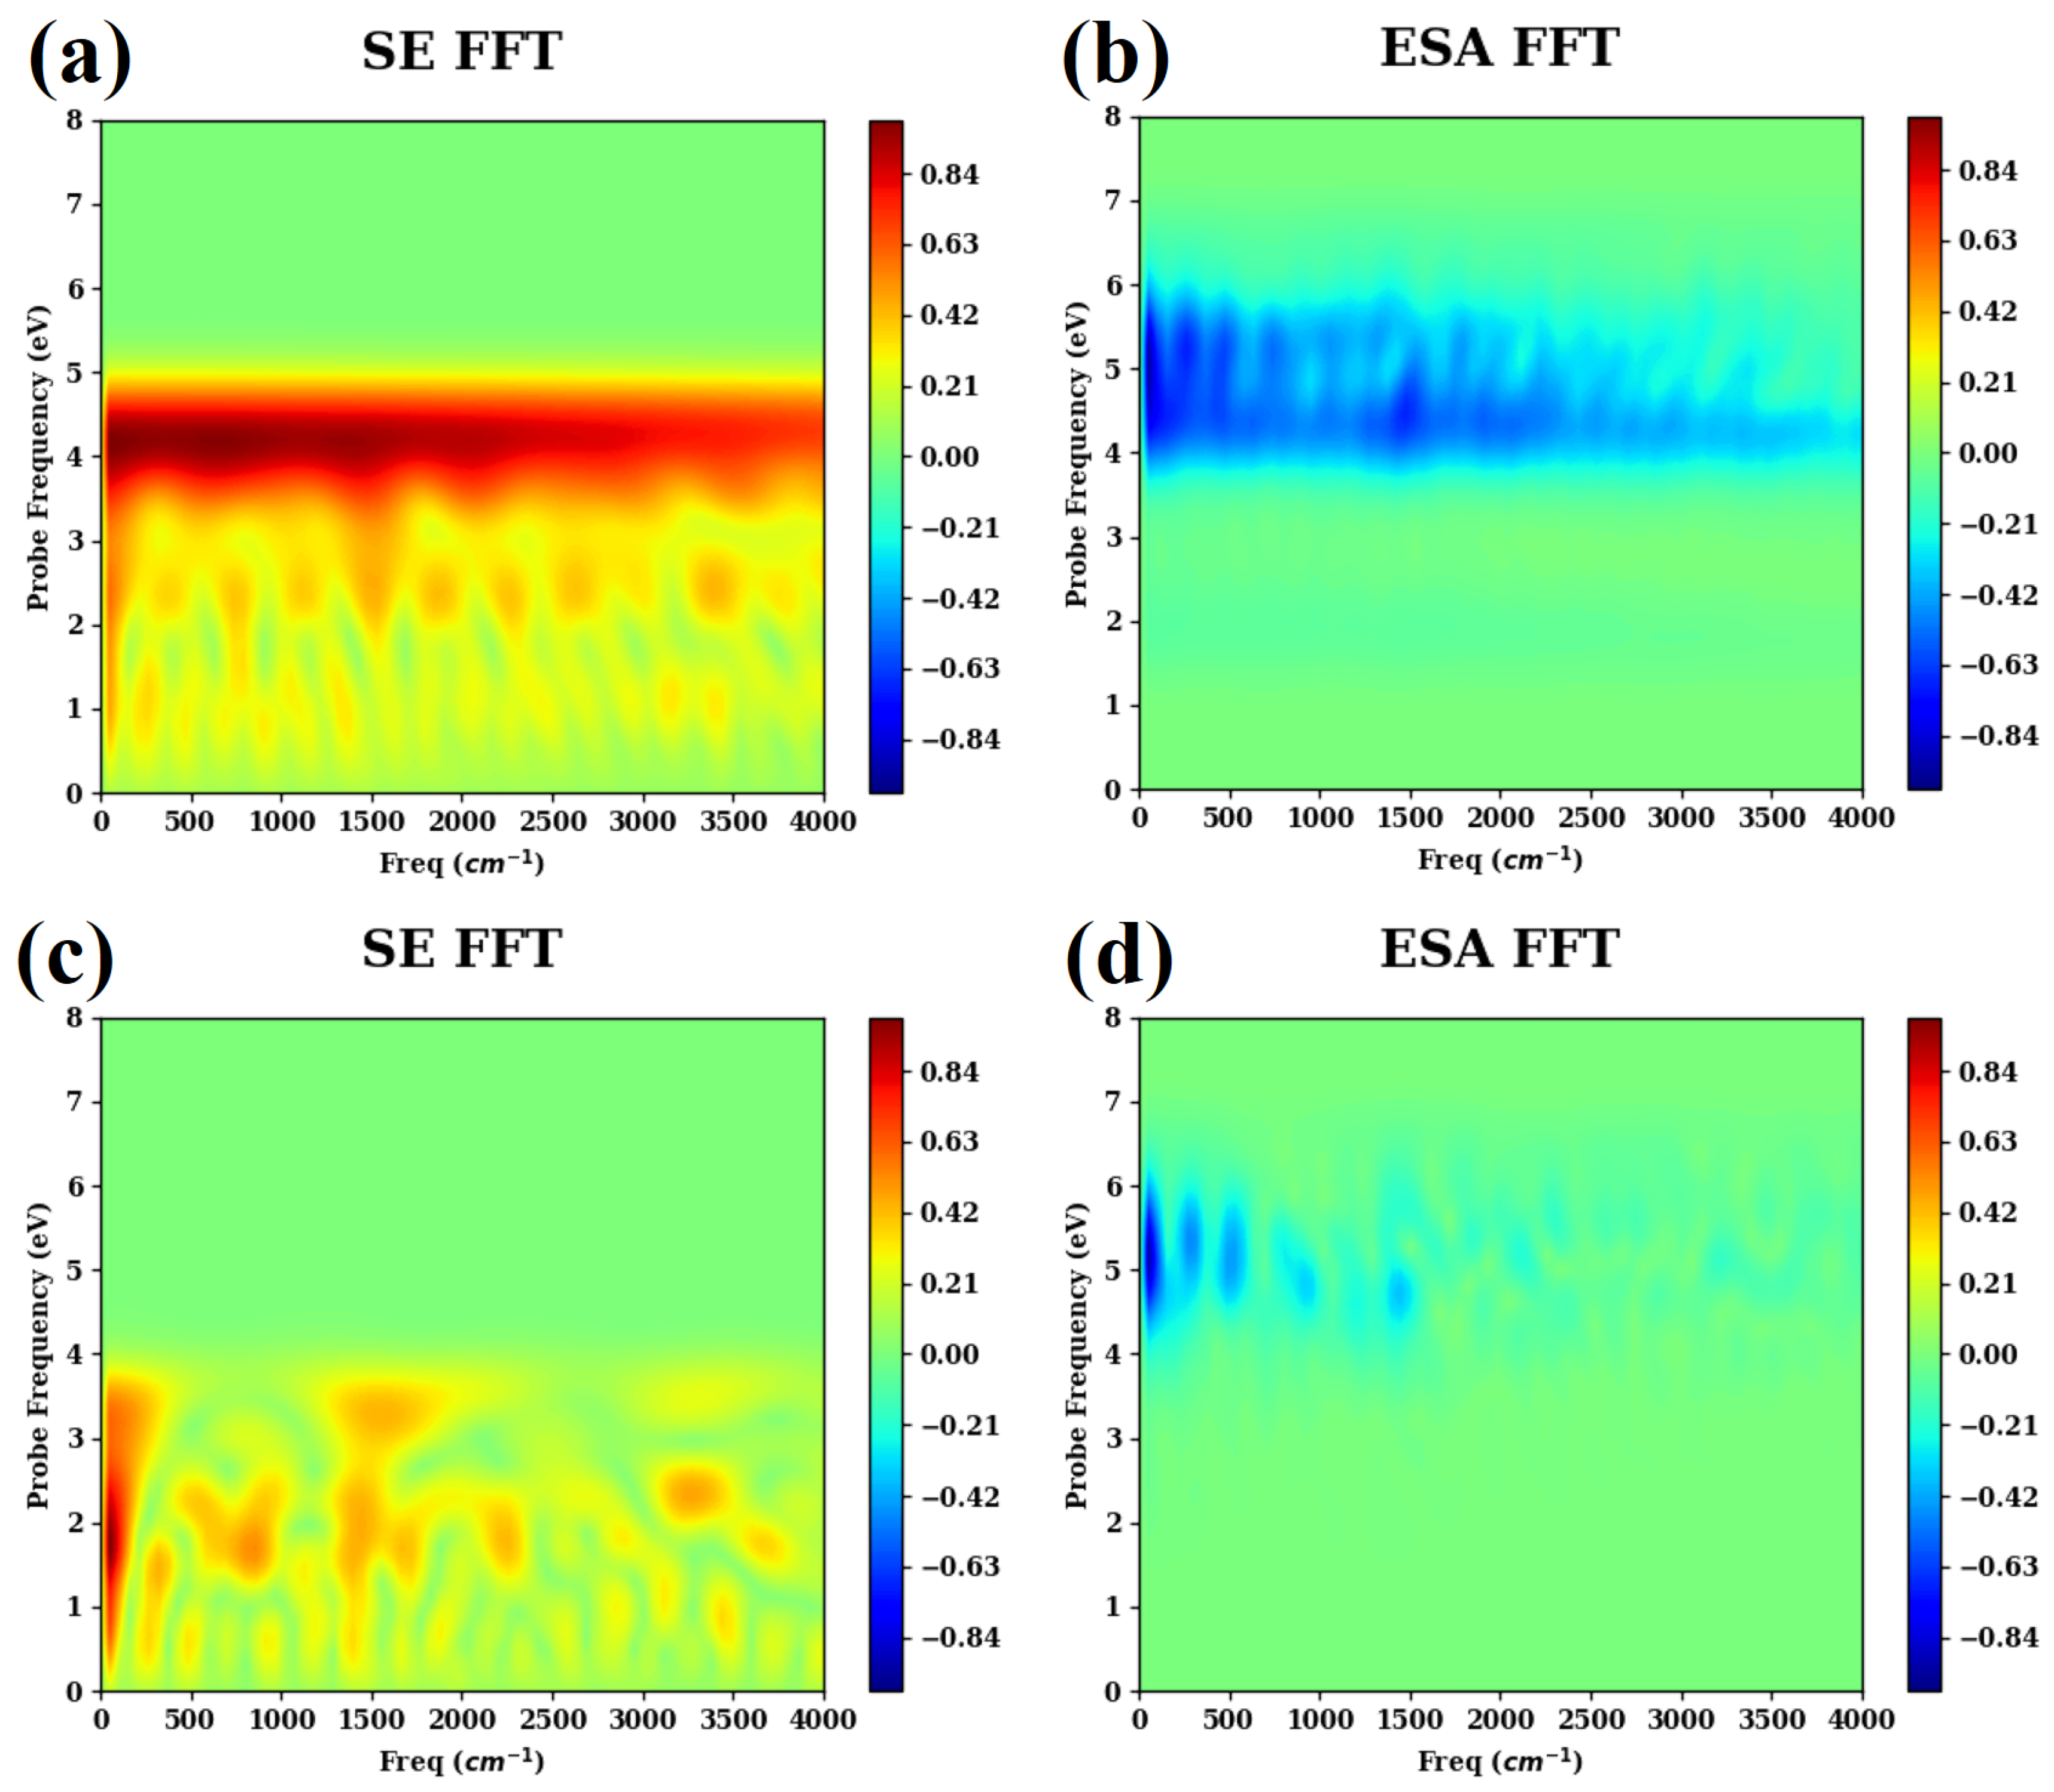
- The Fourier transforms of the cold and hot GSB signals are presented in Figure A3.
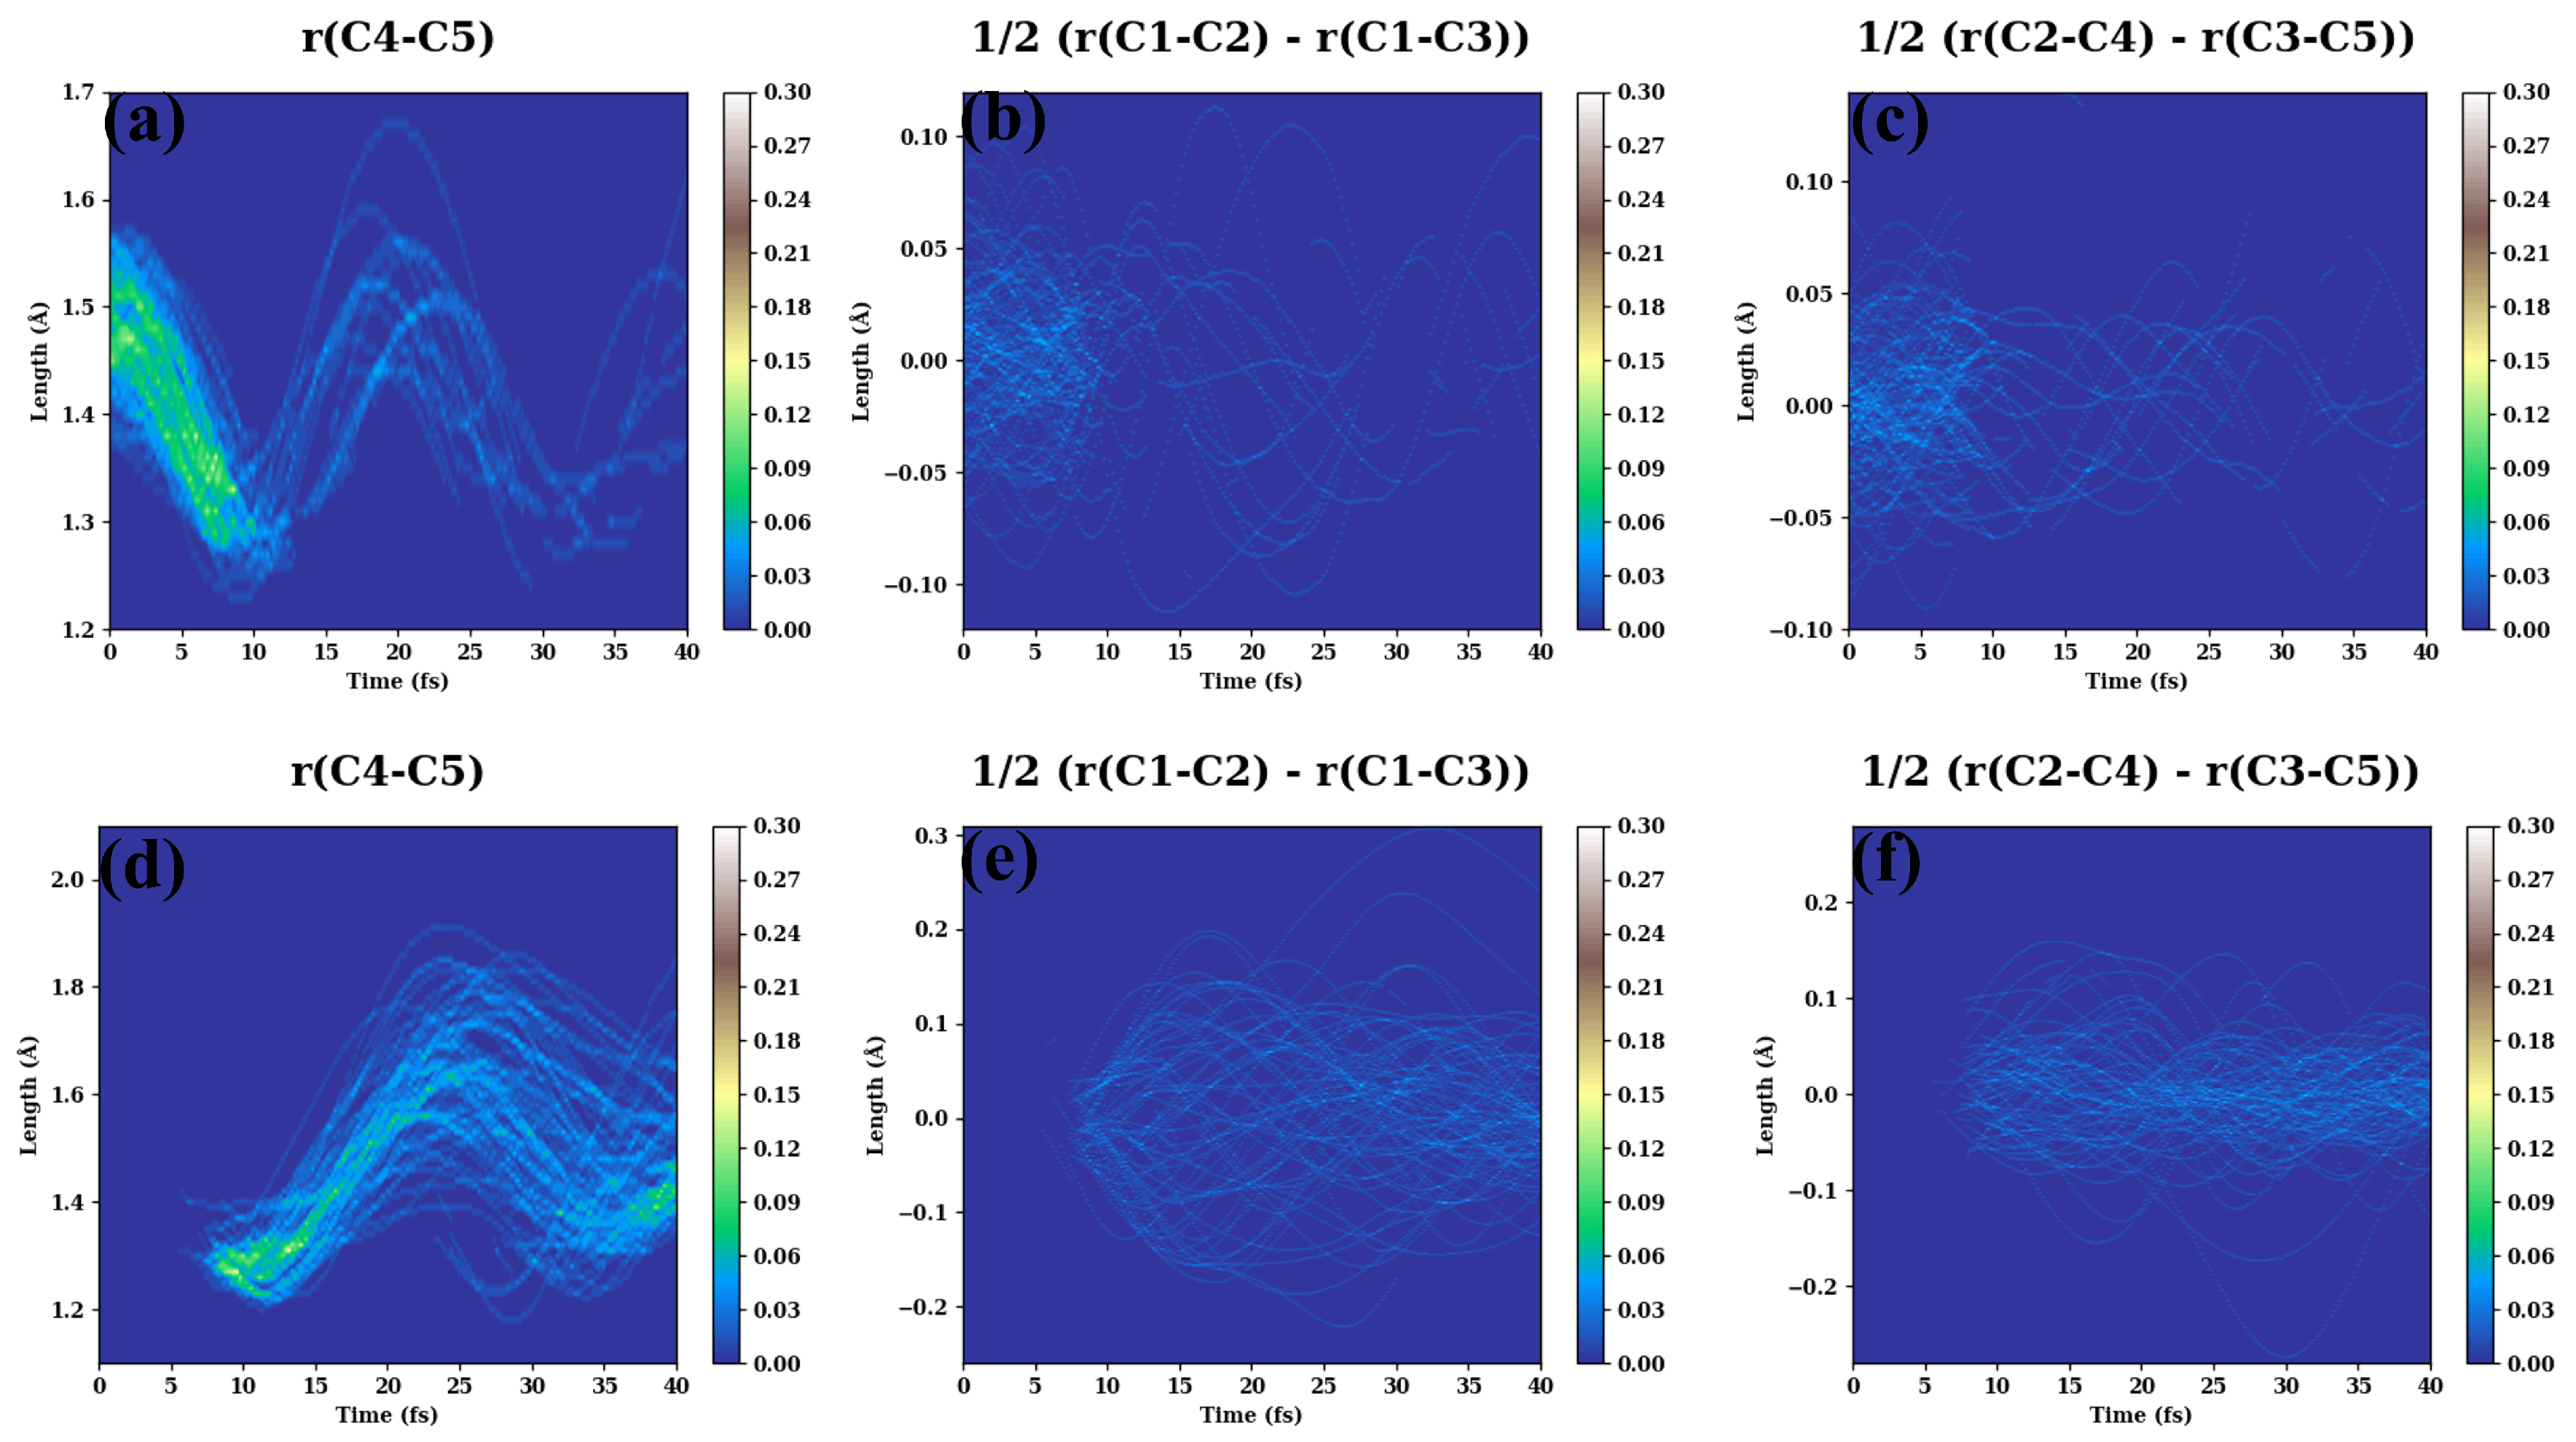
- (d)
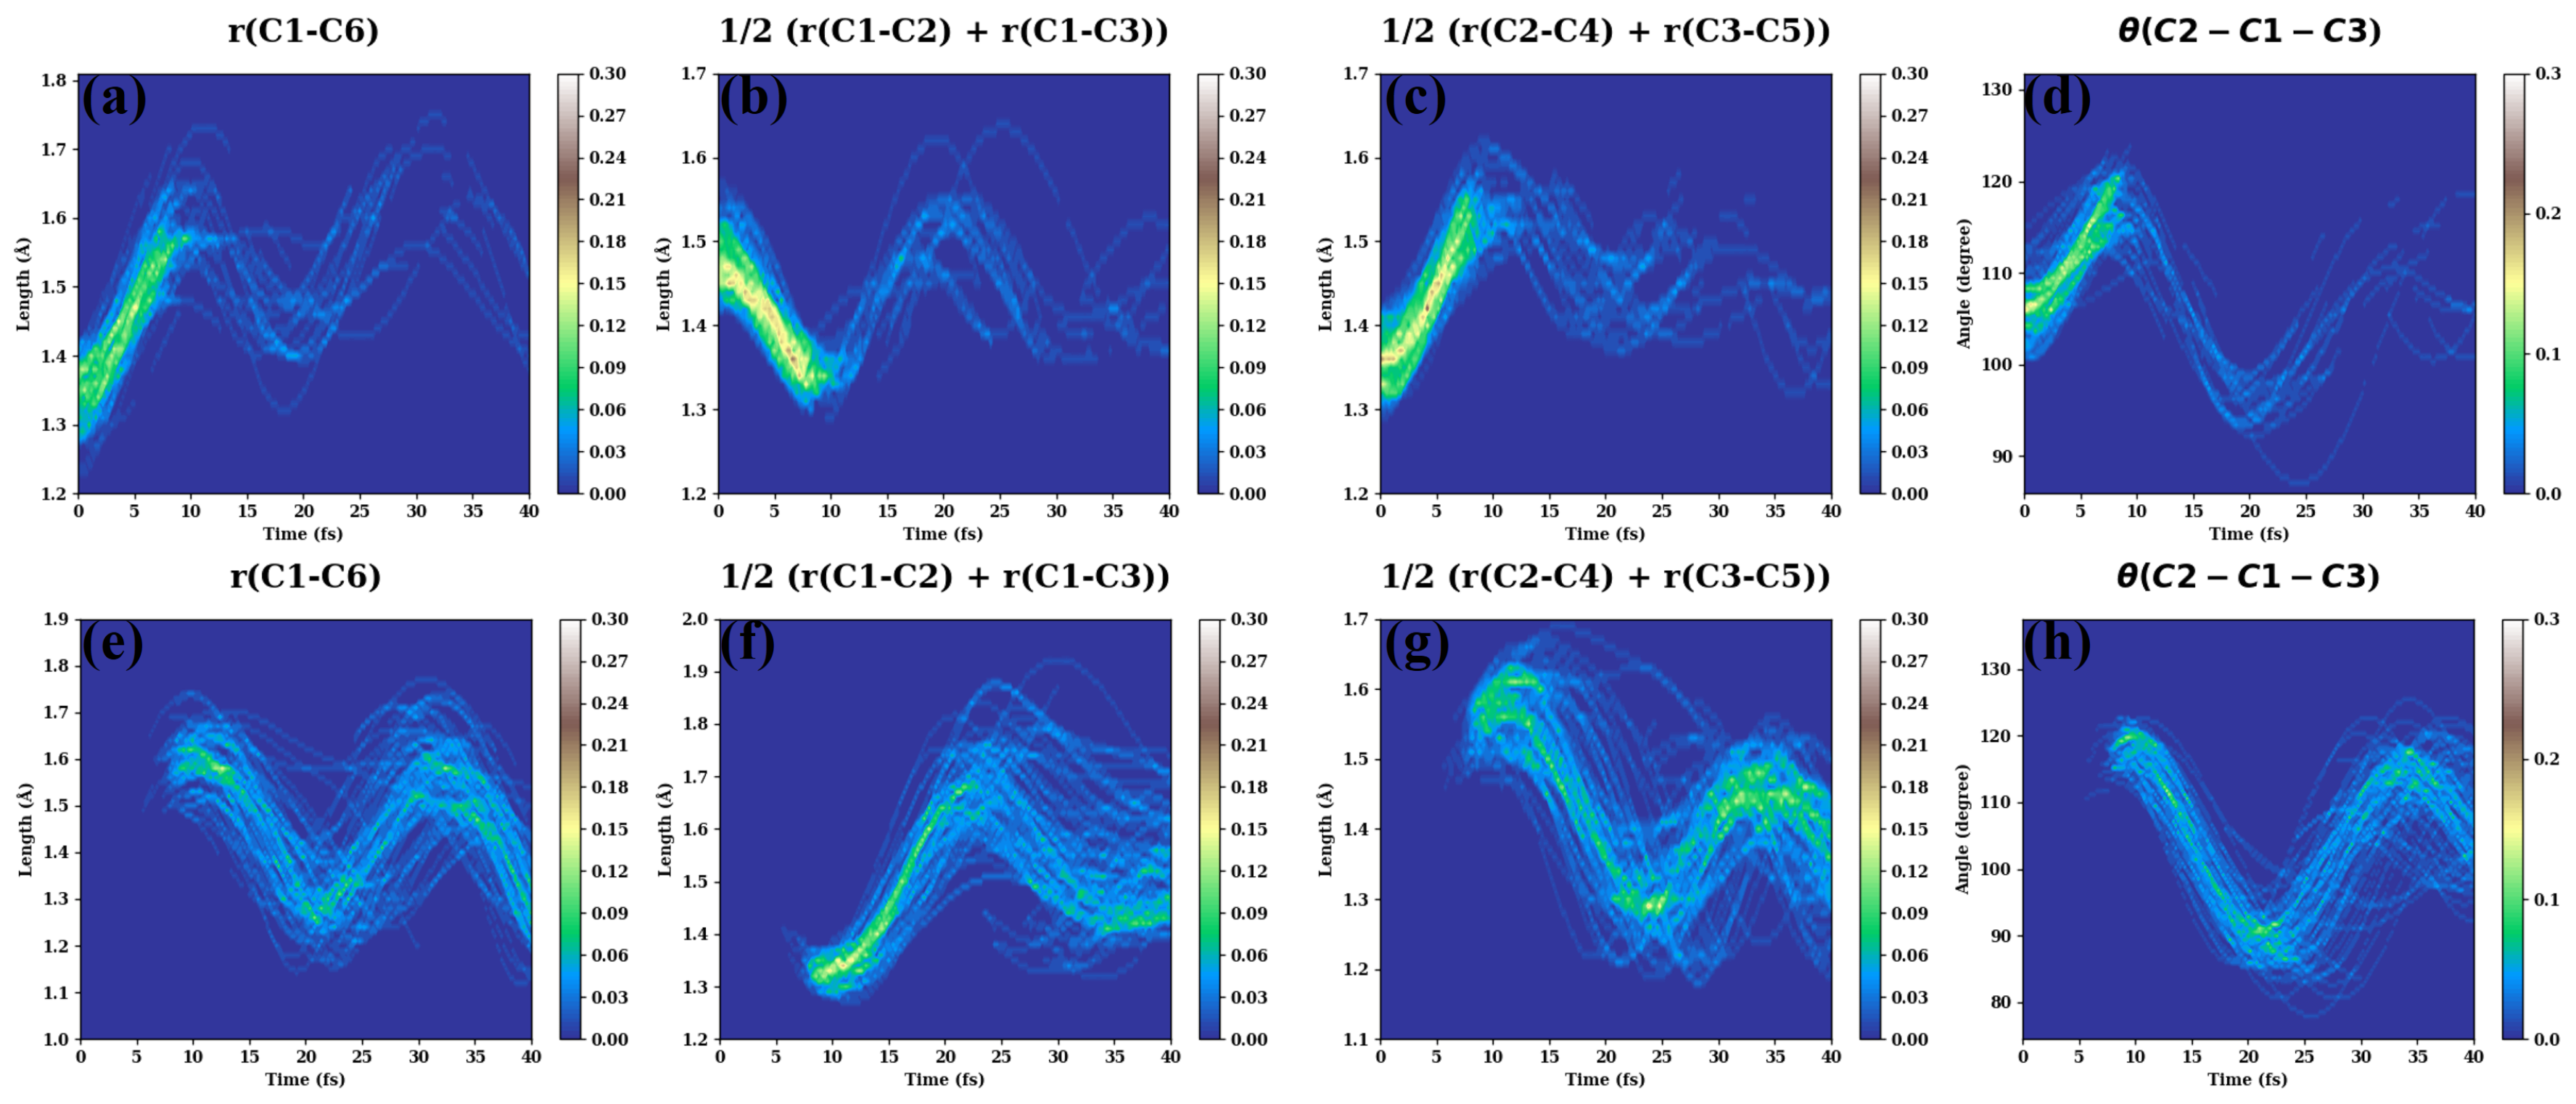
- The evolutions of several additional internal coordinates are displayed in Figure A4.
- (e)
- The excitation energies and TDMs between different electronic states are collected in Table A1.
- (f)

| Energy gap (eV) | TDM (a.u.) | |
| 4.39 | 0.27 | |
| 1.79 | 0.41 | |
| 3.22 | 0.21 | |
| 4.03 | 0.75 | |
| 4.36 | 0.77 |
| frequency (ranking) | Description | |
| A1 | 1781.04 (24) | C=C, sciss. |
| 1637.5 (22) | C=C(r) sciss., | |
| 1563.95 (21) | C=C(r), sciss., C=C | |
| 1483.03 (20) | CCH, C=C(r), C-C | |
| 1194.15 (17) | CCH | |
| 1048.43 (15) | C-C | |
| 957.18 (13) | C-C | |
| 706.37 (5) | CCC | |
| A2 | 929.85 (12) | CH wag |
| 797.32 (8) | tors, CH wag | |
| 715.91 (6) | tors, CH wag | |
| 512.82 (3) | CCCC(r) def | |
| B1 | 925.66 (11) | CH wag |
| 906.37 (10) | wag | |
| 790.47 (7) | CH wag | |
| 641.15 (4) | CCCC(r) def | |
| 221.89 (1) | CCCC def | |
| B2 | 1690.56 (23) | C=C(r) |
| 1461.33 (19) | C=C, CCH | |
| 1368.43 (18) | C=C, CCH | |
| 1187.5 (16) | CCH | |
| 1037.95 (14) | rock | |
| 856.37 (9) | CCC(r) | |
| 369.08 (2) | CCC |
| frequency (ranking) | frequency | |
| A1 | 1705.61 (23) | C=C, sciss. |
| 1646.85 (22) | C=C(r) sciss., | |
| 1590.15 (21) | C=C(r), sciss., C=C | |
| 1326.29 (18) | CCH, C=C(r), C-C | |
| 1210.35 (17) | CCH | |
| 1101.13 (16) | C-C | |
| 1008.5 (14) | C-C | |
| 679.71 (7) | CCC | |
| A2 | 903.59 (11) | CH wag |
| 806.51 (10) | tors, CH wag | |
| 549.89 (6) | CCCC(r) def | |
| B1 | 802.96 (9) | CH wag |
| 701.58 (8) | CH wag | |
| 532.6 (5) | CCCC(r) def | |
| 270.14 (3) | CCCC def | |
| B2 | 1873.28 (24) | C=C(r) |
| 1485.52 (20) | C=C, CCH | |
| 1388.54 (19) | C=C, CCH | |
| 1088.25 (15) | CCH | |
| 996.15 (13) | rock | |
| 926.05 (12) | CCC(r) | |
| 322.72 (4) | CCC |
References
- Domcke, W.; Yarkony, D.; Köppel, H. Conical intersections: electronic structure, dynamics & spectroscopy; Vol. 15, World Scientific, 2004.
- Domcke, W.; Yarkony, D.R.; Köppel, H. Conical intersections: theory, computation and experiment; Vol. 17, World Scientific, 2011.
- Yarkony, D.R. Nonadiabatic Quantum Chemistry Past, Present, and Future. Chemical Reviews 2012, 112, 481–498. [Google Scholar] [CrossRef] [PubMed]
- Jasper, A.W.; Zhu, C.; Nangia, S.; Truhlar, D.G. Introductory lecture: Nonadiabatic effects in chemical dynamics. Faraday Discussions 2004, 127, 1–22. [Google Scholar] [CrossRef] [PubMed]
- Worth, G.A.; Cederbaum, L.S. Beyond Born-Oppenheimer: molecular dynamics through a conical intersection. Annual Review of Physical Chemistry 2004, 55, 127–158. [Google Scholar] [CrossRef]
- Schuurman, M.S.; Stolow, A. Dynamics at conical intersections. Annual Review of Physical Chemistry 2018, 69, 427–450. [Google Scholar] [CrossRef] [PubMed]
- Matsika, S.; Krause, P. Nonadiabatic events and conical intersections. Annual Review of Physical Chemistry 2011, 62, 621–643. [Google Scholar] [CrossRef]
- Domcke, W.; Yarkony, D.R. Role of conical intersections in molecular spectroscopy and photoinduced chemical dynamics. Annual Review of Physical Chemistry 2012, 63, 325–352. [Google Scholar] [CrossRef]
- Zewail, A.H. Femtochemistry: Atomic-scale dynamics of the chemical bond. The Journal of Physical Chemistry A 2000, 104, 5660–5694. [Google Scholar] [CrossRef]
- Stolow, A. Femtosecond time-resolved photoelectron spectroscopy of polyatomic molecules. Annual Review of Physical Chemistry 2003, 54, 89–119. [Google Scholar] [CrossRef]
- Stolow, A.; Bragg, A.E.; Neumark, D.M. Femtosecond time-resolved photoelectron spectroscopy. Chemical Reviews 2004, 104, 1719–1758. [Google Scholar] [CrossRef]
- Dietze, D.R.; Mathies, R.A. Femtosecond stimulated Raman spectroscopy. ChemPhysChem 2016, 17, 1224–1251. [Google Scholar] [CrossRef]
- Bressler, C.; Chergui, M. Ultrafast X-ray absorption spectroscopy. Chemical Reviews 2004, 104, 1781–1812. [Google Scholar] [CrossRef] [PubMed]
- Milne, C.; Penfold, T.; Chergui, M. Recent experimental and theoretical developments in time-resolved X-ray spectroscopies. Coordination Chemistry Reviews 2014, 277, 44–68. [Google Scholar] [CrossRef]
- Fushitani, M. Applications of pump-probe spectroscopy. Annual Reports Section" C"(Physical Chemistry) 2008, 104, 272–297. [Google Scholar] [CrossRef]
- Ruckebusch, C.; Sliwa, M.; Pernot, P.d.; De Juan, A.; Tauler, R. Comprehensive data analysis of femtosecond transient absorption spectra: A review. Journal of Photochemistry and Photobiology C: Photochemistry Reviews 2012, 13, 1–27. [Google Scholar] [CrossRef]
- Braem, O.; Penfold, T.J.; Cannizzo, A.; Chergui, M. A femtosecond fluorescence study of vibrational relaxation and cooling dynamics of UV dyes. Physical Chemistry Chemical Physics 2012, 14, 3513–3519. [Google Scholar] [CrossRef]
- Hall, G.E.; North, S.W. Transient laser frequency modulation spectroscopy. Annual Review of Physical Chemistry 2000, 51, 243–274. [Google Scholar] [CrossRef]
- Crespo-Hernández, C.E.; Cohen, B.; Hare, P.M.; Kohler, B. Ultrafast excited-state dynamics in nucleic acids. Chemical Reviews 2004, 104, 1977–2020. [Google Scholar] [CrossRef]
- Rulliere, C.; et al. Femtosecond laser pulses; Springer, 2005.
- Diels, J.C.; Rudolph, W. Ultrashort laser pulse phenomena; Elsevier, 2006.
- Wei, Z.; Nakamura, T.; Takeuchi, S.; Tahara, T. Tracking of the nuclear wavepacket motion in cyanine photoisomerization by ultrafast pump–dump–probe spectroscopy. Journal of the American Chemical Society 2011, 133, 8205–8210. [Google Scholar] [CrossRef]
- Auböck, G.; Consani, C.; van Mourik, F.; Chergui, M. Ultrabroadband femtosecond two-dimensional ultraviolet transient absorption. Optics Letters 2012, 37, 2337–2339. [Google Scholar] [CrossRef]
- Davydova, D.; de la Cadena, A.; Akimov, D.; Dietzek, B. Transient absorption microscopy: advances in chemical imaging of photoinduced dynamics. Laser & Photonics Reviews 2016, 10, 62–81. [Google Scholar]
- Mukamel, S. Principles of Nonlinear Optical Spectroscopy; Oxford series in optical and imaging sciences, Oxford University Press, 1995.
- Egorova, D. Detection of electronic and vibrational coherences in molecular systems by 2D electronic photon echo spectroscopy. Chemical Physics 2008, 347, 166–176. [Google Scholar] [CrossRef]
- Kowalewski, M.; Bennett, K.; Dorfman, K.E.; Mukamel, S. Catching conical intersections in the act: Monitoring transient electronic coherences by attosecond stimulated X-ray Raman signals. Physical Review Letters 2015, 115, 193003. [Google Scholar] [CrossRef]
- Kowalewski, M.; Bennett, K.; Mukamel, S. Monitoring nonadiabatic avoided crossing dynamics in molecules by ultrafast X-ray diffraction. Structural Dynamics 2017, 4, 054101. [Google Scholar] [CrossRef]
- Bennett, K.; Kowalewski, M.; Rouxel, J.R.; Mukamel, S. Monitoring molecular nonadiabatic dynamics with femtosecond X-ray diffraction. Proceedings of the National Academy of Sciences 2018, 115, 6538–6547. [Google Scholar] [CrossRef] [PubMed]
- Segatta, F.; Nenov, A.; Orlandi, S.; Arcioni, A.; Mukamel, S.; Garavelli, M. Exploring the capabilities of optical pump X-ray probe NEXAFS spectroscopy to track photo-induced dynamics mediated by conical intersections. Faraday Discussions 2020, 221, 245–264. [Google Scholar] [CrossRef] [PubMed]
- Liu, Y.; Martínez-Fernández, L.; Cerezo, J.; Prampolini, G.; Improta, R.; Santoro, F. Multistate coupled quantum dynamics of photoexcited cytosine in gas-phase: Nonadiabatic absorption spectrum and ultrafast internal conversions. Chemical Physics 2018, 515, 452–463. [Google Scholar] [CrossRef]
- Wang, H.; Thoss, M. Nonperturbative quantum simulation of time-resolved nonlinear spectra: Methodology and application to electron transfer reactions in the condensed phase. Chemical Physics 2008, 347, 139–151. [Google Scholar] [CrossRef]
- Kramer, T.; Noack, M.; Reinefeld, A.; Rodríguez, M.; Zelinskyy, Y. Efficient calculation of open quantum system dynamics and time-resolved spectroscopy with distributed memory HEOM (DM-HEOM). Journal of Computational Chemistry 2018, 39, 1779–1794. [Google Scholar] [CrossRef]
- Toutounji, M. Electronic dephasing of polyatomic molecules interacting with mixed quantum-classical media. Physical Chemistry Chemical Physics 2021, 23, 21981–21994. [Google Scholar] [CrossRef]
- Toutounji, M. Mixed Quantum-Classical Liouville Equation Treatment of Electronic Spectroscopy of Condensed Systems: Harmonic and Anharmonic Electron–Phonon Coupling. Journal of Chemical Theory and Computation 2023, 19, 3779–3797. [Google Scholar] [CrossRef]
- Petit, A.S.; Subotnik, J.E. Calculating time-resolved differential absorbance spectra for ultrafast pump-probe experiments with surface hopping trajectories. The Journal of Chemical Physics 2014, 141. [Google Scholar] [CrossRef] [PubMed]
- Petit, A.S.; Subotnik, J.E. How to calculate linear absorption spectra with lifetime broadening using fewest switches surface hopping trajectories: A simple generalization of ground-state Kubo theory. The Journal of Chemical Physics 2014, 141, 014107. [Google Scholar] [CrossRef] [PubMed]
- Tempelaar, R.; Van Der Vegte, C.P.; Knoester, J.; Jansen, T.L. Surface hopping modeling of two-dimensional spectra. The Journal of Chemical Physics 2013, 138, 164106. [Google Scholar] [CrossRef] [PubMed]
- Humeniuk, A.; Wohlgemuth, M.; Suzuki, T.; Mitrić, R. Time-resolved photoelectron imaging spectra from non-adiabatic molecular dynamics simulations. The Journal of Chemical Physics 2013, 139, 134104. [Google Scholar] [CrossRef]
- Van Der Vegte, C.; Dijkstra, A.; Knoester, J.; Jansen, T. Calculating two-dimensional spectra with the mixed quantum-classical ehrenfest method. The Journal of Physical Chemistry A 2013, 117, 5970–5980. [Google Scholar] [CrossRef]
- Heller, E.J. The semiclassical way to dynamics and spectroscopy; Princeton University Press, 2018.
- Kowalewski, M.; Fingerhut, B.P.; Dorfman, K.E.; Bennett, K.; Mukamel, S. Simulating coherent multidimensional spectroscopy of nonadiabatic molecular processes: From the infrared to the x-ray regime. Chemical Reviews 2017, 117, 12165–12226. [Google Scholar] [CrossRef]
- Crespo-Otero, R.; Barbatti, M. Recent advances and perspectives on nonadiabatic mixed quantum–classical dynamics. Chemical Reviews 2018, 118, 7026–7068. [Google Scholar] [CrossRef]
- Mai, S.; González, L. Molecular photochemistry: recent developments in theory. Angewandte Chemie International Edition 2020, 59, 16832–16846. [Google Scholar] [CrossRef]
- Conti, I.; Cerullo, G.; Nenov, A.; Garavelli, M. Ultrafast spectroscopy of photoactive molecular systems from first principles: Where we stand today and where we are going. Journal of the American Chemical Society 2020, 142, 16117–16139. [Google Scholar] [CrossRef]
- Loring, R.F. Calculating multidimensional optical spectra from classical trajectories. Annual Review of Physical Chemistry 2022, 73, 273–297. [Google Scholar] [CrossRef]
- Yan, Y.; Liu, Y.; Xing, T.; Shi, Q. Theoretical Study of Excitation Energy Transfer and Nonlinear Spectroscopy of Photosynthetic Light- Harvesting Complexes Using the Nonperturbative Reduced Dynamics Method. WIREs Computational Molecular Science 2021, 11, e1498. [Google Scholar] [CrossRef]
- Gelin, M.F.; Chen, L.; Domcke, W. Equation-of-motion methods for the calculation of femtosecond time-resolved 4-wave-mixing and N-wave-mixing signals. Chemical Reviews 2022, 122, 17339–17396. [Google Scholar] [CrossRef]
- Jansen, T.L.C. Computational spectroscopy of complex systems. The Journal of Chemical Physics 2021, 155, 170901. [Google Scholar] [CrossRef]
- Krumland, J.; Guerrini, M.; De Sio, A.; Lienau, C.; Cocchi, C. Two-dimensional electronic spectroscopy from first principles. Applied Physics Reviews 2024, 11, 011305. [Google Scholar] [CrossRef]
- Faraji, S.; Picconi, D.; Palacino-González, E. Advanced quantum and semiclassical methods for simulating photoinduced molecular dynamics and spectroscopy. WIREs Computational Molecular Science 2024, 14, e1731. [Google Scholar] [CrossRef]
- Richter, M.; Fingerhut, B.P. Simulation of multi-dimensional signals in the optical domain: Quantum-classical feedback in nonlinear exciton propagation. Journal of Chemical Theory and Computation 2016, 12, 3284–3294. [Google Scholar] [CrossRef]
- Šulc, M.; Hernández, H.; Martínez, T.J.; Vaníček, J. Relation of exact Gaussian basis methods to the dephasing representation: Theory and application to time-resolved electronic spectra. The Journal of Chemical Physics 2013, 139, 034112. [Google Scholar] [CrossRef]
- Zimmermann, T.; Vaníček, J. Efficient on-the-fly ab initio semiclassical method for computing time-resolved nonadiabatic electronic spectra with surface hopping or Ehrenfest dynamics. The Journal of Chemical Physics 2014, 141, 134102. [Google Scholar] [CrossRef]
- Begušić, T.; Roulet, J.; Vaníček, J. On-the-fly ab initio semiclassical evaluation of time-resolved electronic spectra. The Journal of Chemical Physics 2018, 149, 244115. [Google Scholar] [CrossRef] [PubMed]
- Begušić, T.; Vaníček, J. On-the-fly ab initio semiclassical evaluation of third-order response functions for two-dimensional electronic spectroscopy. The Journal of Chemical Physics 2020, 153, 184110. [Google Scholar] [CrossRef] [PubMed]
- Nguyen, T.S.; Koh, J.H.; Lefelhocz, S.; Parkhill, J. Black-box, real-time simulations of transient absorption spectroscopy. The Journal of Physical Chemistry Letters 2016, 7, 1590–1595. [Google Scholar] [CrossRef] [PubMed]
- Meyer, H.D.; Miller, W.H. A classical analog for electronic degrees of freedom in nonadiabatic collision processes. The Journal of Chemical Physics 1979, 70, 3214–3223. [Google Scholar] [CrossRef]
- Stock, G.; Thoss, M. Semiclassical description of nonadiabatic quantum dynamics. Physical Review Letters 1997, 78, 578. [Google Scholar] [CrossRef]
- Thoss, M.; Stock, G. Mapping approach to the semiclassical description of nonadiabatic quantum dynamics. Physical Review A 1999, 59, 64. [Google Scholar] [CrossRef]
- Huo, P.; Coker, D.F. Communication: Partial linearized density matrix dynamics for dissipative, non-adiabatic quantum evolution. The Journal of Chemical Physics 2011, 135, 201101. [Google Scholar] [CrossRef]
- Lee, M.K.; Huo, P.; Coker, D.F. Semiclassical path integral dynamics: Photosynthetic energy transfer with realistic environment interactions. Annual Review of Physical Chemistry 2016, 67, 639–668. [Google Scholar] [CrossRef]
- Hsieh, C.Y.; Schofield, J.; Kapral, R. Forward–backward solution of quantum-classical Liouville equation in the adiabatic mapping basis. Molecular Physics 2013, 111, 3546–3554. [Google Scholar] [CrossRef]
- Liu, J.; He, X.; Wu, B. Unified formulation of phase space mapping approaches for nonadiabatic quantum dynamics. Accounts of Chemical Research 2021, 54, 4215–4228. [Google Scholar] [CrossRef]
- He, X.; Wu, B.; Shang, Y.; Li, B.; Cheng, X.; Liu, J. New phase space formulations and quantum dynamics approaches. Wiley Interdisciplinary Reviews: Computational Molecular Science 2022, 12, e1619. [Google Scholar] [CrossRef]
- Wu, B.; He, X.; Liu, J. Nonadiabatic Field on Quantum Phase Space: A Century after Ehrenfest. The Journal of Physical Chemistry Letters 2024, 15, 644–658. [Google Scholar] [CrossRef]
- Miller, W.H.; Cotton, S.J. Classical molecular dynamics simulation of electronically non-adiabatic processes. Faraday Discussions 2016, 195, 9–30. [Google Scholar] [CrossRef] [PubMed]
- Mandal, A.; Yamijala, S.S.; Huo, P. Quasi-diabatic representation for nonadiabatic dynamics propagation. Journal of Chemical Theory and Computation 2018, 14, 1828–1840. [Google Scholar] [CrossRef] [PubMed]
- Zhou, W.; Mandal, A.; Huo, P. Quasi-diabatic scheme for nonadiabatic on-the-fly simulations. The Journal of Physical Chemistry Letters 2019, 10, 7062–7070. [Google Scholar] [CrossRef]
- Hu, D.; Mandal, A.; Weight, B.M.; Huo, P. Quasi-diabatic propagation scheme for simulating polariton chemistry. The Journal of Chemical Physics 2022, 157, 194109. [Google Scholar] [CrossRef]
- Church, M.S.; Hele, T.J.; Ezra, G.S.; Ananth, N. Nonadiabatic semiclassical dynamics in the mixed quantum-classical initial value representation. The Journal of Chemical Physics 2018, 148, 102326. [Google Scholar] [CrossRef]
- Conte, R.; Aieta, C.; Cazzaniga, M.; Ceotto, M. A perspective on the investigation of spectroscopy and kinetics of complex molecular systems with semiclassical approaches. The Journal of Physical Chemistry Letters 2024, 15, 7566–7576. [Google Scholar] [CrossRef]
- Stock, G.; Miller, W.H. A classical model for time-and frequency-resolved spectroscopy of nonadiabatic excited-state dynamics. Chemical Physics Letters 1992, 197, 396–404. [Google Scholar] [CrossRef]
- Uspenskiy, I.; Strodel, B.; Stock, G. Classical calculation of transient absorption spectra monitoring ultrafast electron transfer processes. Journal of Chemical Theory and Computation 2006, 2, 1605–1617. [Google Scholar] [CrossRef]
- Uspenskiy, I.; Strodel, B.; Stock, G. Classical description of the dynamics and time-resolved spectroscopy of nonadiabatic cis–trans photoisomerization. Chemical Physics 2006, 329, 109–117. [Google Scholar] [CrossRef]
- Loring, R.F. Mean-trajectory approximation for electronic and vibrational-electronic nonlinear spectroscopy. The Journal of Chemical Physics 2017, 146, 144106. [Google Scholar] [CrossRef]
- Polley, K.; Loring, R.F. Two-dimensional vibronic spectra from classical trajectories. The Journal of Chemical Physics 2019, 150, 164114. [Google Scholar] [CrossRef] [PubMed]
- Kwac, K.; Geva, E. A mixed quantum-classical molecular dynamics study of the hydroxyl stretch in methanol/carbon tetrachloride mixtures III: Nonequilibrium hydrogen-bond dynamics and infrared pump–probe spectra. The Journal of Physical Chemistry B 2013, 117, 7737–7749. [Google Scholar] [CrossRef]
- Gao, X.; Lai, Y.; Geva, E. Simulating absorption spectra of multiexcitonic systems via quasiclassical mapping Hamiltonian methods. Journal of Chemical Theory and Computation 2020, 16, 6465–6480. [Google Scholar] [CrossRef]
- Gao, X.; Geva, E. A nonperturbative methodology for simulating multidimensional spectra of multiexcitonic molecular systems via quasiclassical mapping Hamiltonian methods. Journal of Chemical Theory and Computation 2020, 16, 6491–6502. [Google Scholar] [CrossRef] [PubMed]
- McRobbie, P.L.; Hanna, G.; Shi, Q.; Geva, E. Signatures of nonequilibrium solvation dynamics on multidimensional spectra. Accounts of Chemical Research 2009, 42, 1299–1309. [Google Scholar] [CrossRef]
- Bai, S.; Xie, W.; Zhu, L.; Shi, Q. Calculation of absorption spectra involving multiple excited states: Approximate methods based on the mixed quantum classical Liouville equation. The Journal of Chemical Physics 2014, 140, 084105. [Google Scholar] [CrossRef]
- Provazza, J.; Segatta, F.; Garavelli, M.; Coker, D.F. Semiclassical path integral calculation of nonlinear optical spectroscopy. Journal of Chemical Theory and Computation 2018, 14, 856–866. [Google Scholar] [CrossRef] [PubMed]
- Provazza, J.; Coker, D.F. Communication: Symmetrical quasi-classical analysis of linear optical spectroscopy. The Journal of Chemical Physics 2018, 148, 181102. [Google Scholar] [CrossRef]
- Provazza, J.; Segatta, F.; Coker, D.F. Modeling nonperturbative field-driven vibronic dynamics: Selective state preparation and nonlinear spectroscopy. Journal of Chemical Theory and Computation 2020, 17, 29–39. [Google Scholar] [CrossRef]
- Sun, X. Hybrid equilibrium-nonequilibrium molecular dynamics approach for two-dimensional solute-pump/solvent-probe spectroscopy. The Journal of Chemical Physics 2019, 151, 194507. [Google Scholar] [CrossRef]
- Karsten, S.; Ivanov, S.D.; Bokarev, S.I.; Kühn, O. Quasi-classical approaches to vibronic spectra revisited. The Journal of Chemical Physics 2018, 148, 102337. [Google Scholar] [CrossRef]
- Mannouch, J.R.; Richardson, J.O. A partially linearized spin-mapping approach for simulating nonlinear optical spectra. The Journal of Chemical Physics 2022, 156, 024108. [Google Scholar] [CrossRef] [PubMed]
- Polley, K.; Loring, R.F. Spectroscopic response theory with classical mapping Hamiltonians. The Journal of Chemical Physics 2020, 153, 204103. [Google Scholar] [CrossRef] [PubMed]
- Seidner, L.; Stock, G.; Domcke, W. Nonperturbative approach to femtosecond spectroscopy: General theory and application to multidimensional nonadiabatic photoisomerization processes. The Journal of Chemical Physics 1995, 103, 3998–4011. [Google Scholar] [CrossRef]
- Gelin, M.F.; Egorova, D.; Domcke, W. Efficient method for the calculation of time-and frequency-resolved four-wave mixing signals and its application to photon-echo spectroscopy. The Journal of Chemical Physics 2005, 123, 164112. [Google Scholar] [CrossRef]
- Mančal, T.; Pisliakov, A.V.; Fleming, G.R. Two-dimensional optical three-pulse photon echo spectroscopy. I. Nonperturbative approach to the calculation of spectra. The Journal of Chemical Physics 2006, 124, 234504. [Google Scholar] [CrossRef]
- Ka, B.J.; Geva, E. A nonperturbative calculation of nonlinear spectroscopic signals in liquid solution. The Journal of Chemical Physics 2006, 125, 214501. [Google Scholar] [CrossRef]
- Yan, Y.J.; Fried, L.E.; Mukamel, S. Ultrafast pump-probe spectroscopy: femtosecond dynamics in Liouville space. The Journal of Physical Chemistry 1989, 93, 8149–8162. [Google Scholar] [CrossRef]
- Yan, Y.J.; Mukamel, S. Femtosecond pump-probe spectroscopy of polyatomic molecules in condensed phases. Physical Review A 1990, 41, 6485. [Google Scholar] [CrossRef]
- Bosma, W.B.; Yan, Y.J.; Mukamel, S. Intramolecular and solvent dynamics in femtosecond pump–probe spectroscopy. The Journal of Chemical Physics 1990, 93, 3863–3873. [Google Scholar] [CrossRef]
- Pollard, W.T.; Lee, S.Y.; Mathies, R.A. Wave packet theory of dynamic absorption spectra in femtosecond pump–probe experiments. The Journal of Chemical Physics 1990, 92, 4012–4029. [Google Scholar] [CrossRef]
- Pollard, W.T.; Mathies, R.A. Analysis of femtosecond dynamic absorption spectra of nonstationary states. Annual Review of Physical Chemistry 1992, 43, 497–523. [Google Scholar] [CrossRef] [PubMed]
- Xu, C.; Lin, C.; Peng, J.; Zhang, J.; Lin, S.; Gu, F.L.; Gelin, M.F.; Lan, Z. On-the-fly simulation of time-resolved fluorescence spectra and anisotropy. The Journal of Chemical Physics 2024, 160, 104109. [Google Scholar] [CrossRef]
- Xu, C.; Lin, K.; Hu, D.; Gu, F.L.; Gelin, M.F.; Lan, Z. Ultrafast internal conversion dynamics through the on-the-Fly simulation of transient absorption pump–probe spectra with different electronic structure methods. The Journal of Physical Chemistry Letters 2022, 13, 661–668. [Google Scholar] [CrossRef] [PubMed]
- Hu, D.; Peng, J.; Chen, L.; Gelin, M.F.; Lan, Z. Spectral fingerprint of excited-state energy transfer in dendrimers through polarization-sensitive transient-absorption pump–probe signals: On-the-fly nonadiabatic dynamics simulations. The Journal of Physical Chemistry Letters 2021, 12, 9710–9719. [Google Scholar] [CrossRef]
- Gelin, M.F.; Huang, X.; Xie, W.; Chen, L.; Došlić, N.; Domcke, W. Ab initio surface-hopping simulation of femtosecond transient-absorption pump–probe signals of nonadiabatic excited-state dynamics using the doorway–window representation. Journal of Chemical Theory and Computation 2021, 17, 2394–2408. [Google Scholar] [CrossRef]
- Huang, X.; Xie, W.; Došlić, N.; Gelin, M.F.; Domcke, W. Ab initio quasiclassical simulation of femtosecond time-resolved two-dimensional electronic spectra of pyrazine. The Journal of Physical Chemistry Letters 2021, 12, 11736–11744. [Google Scholar] [CrossRef]
- Pios, S.V.; Gelin, M.F.; Ullah, A.; Dral, P.O.; Chen, L. Artificial-Intelligence-Enhanced On-the-Fly Simulation of Nonlinear Time-Resolved Spectra. The Journal of Physical Chemistry Letters 2024, 15, 2325–2331. [Google Scholar] [CrossRef]
- Perez-Castillo, R.; Freixas, V.M.; Mukamel, S.; Martinez-Mesa, A.; Uranga-Pina, L.; Tretiak, S.; Gelin, M.F.; Fernandez-Alberti, S. Transient-absorption spectroscopy of dendrimers via nonadiabatic excited-state dynamics simulations. Chemical Science 2024, 15, 13250–13261. [Google Scholar] [CrossRef]
- Li, Z.; Peng, J.; Zhu, Y.; Xu, C.; Gelin, M.F.; Gu, F.L.; Lan, Z. On-the-fly simulations of transient absorption pump-probe spectra: combining mapping dynamics with doorway-window protocol 2024.
- Cotton, S.J.; Miller, W.H. Symmetrical windowing for quantum states in quasi-classical trajectory simulations. The Journal of Physical Chemistry A 2013, 117, 7190–7194. [Google Scholar] [CrossRef]
- Cotton, S.J.; Miller, W.H. Symmetrical windowing for quantum states in quasi-classical trajectory simulations: Application to electronically non-adiabatic processes. The Journal of Chemical Physics 2013, 139, 234112. [Google Scholar] [CrossRef] [PubMed]
- Xie, Y.; Zheng, J.; Lan, Z. Performance evaluation of the symmetrical quasi-classical dynamics method based on Meyer-Miller mapping Hamiltonian in the treatment of site-exciton models. The Journal of Chemical Physics 2018, 149, 174105. [Google Scholar] [CrossRef] [PubMed]
- He, X.; Cheng, X.; Wu, B.; Liu, J. Nonadiabatic Field with Triangle Window Functions on Quantum Phase Space. The Journal of Physical Chemistry Letters 2024, 15, 5452–5466. [Google Scholar] [CrossRef]
- Gao, X.; Saller, M.A.; Liu, Y.; Kelly, A.; Richardson, J.O.; Geva, E. Benchmarking quasiclassical mapping Hamiltonian methods for simulating electronically nonadiabatic molecular dynamics. Journal of Chemical Theory and Computation 2020, 16, 2883–2895. [Google Scholar] [CrossRef]
- Jain, A.; Subotnik, J.E. Vibrational energy relaxation: A benchmark for mixed quantum–classical methods. The Journal of Physical Chemistry A 2018, 122, 16–27. [Google Scholar] [CrossRef]
- Stock, G.; Thoss, M. Classical description of nonadiabatic quantum dynamics. Advances in Chemical Physics 2005, 131, 243–375. [Google Scholar]
- Cotton, S.J.; Liang, R.; Miller, W.H. On the adiabatic representation of Meyer-Miller electronic-nuclear dynamics. The Journal of Chemical Physics 2017, 147, 064112. [Google Scholar] [CrossRef]
- Tang, D.; Fang, W.H.; Shen, L.; Cui, G. Combining Meyer–Miller Hamiltonian with electronic structure methods for on-the-fly nonadiabatic dynamics simulations: implementation and application. Physical Chemistry Chemical Physics 2019, 21, 17109–17117. [Google Scholar] [CrossRef] [PubMed]
- Hu, D.; Xie, Y.; Peng, J.; Lan, Z. On-the-fly symmetrical quasi-classical dynamics with Meyer–Miller mapping Hamiltonian for the treatment of nonadiabatic dynamics at conical intersections. Journal of Chemical Theory and Computation 2021, 17, 3267–3279. [Google Scholar] [CrossRef]
- Talbot, J.J.; Head-Gordon, M.; Cotton, S.J. The symmetric quasi-classical model using on-the-fly time-dependent density functional theory within the Tamm–Dancoff approximation. Molecular Physics 2023, 121, e2153761. [Google Scholar] [CrossRef]
- Tully, J.C. Molecular dynamics with electronic transitions. The Journal of Chemical Physics 1990, 93, 1061–1071. [Google Scholar] [CrossRef]
- Ibele, L.M.; Curchod, B.F. A molecular perspective on Tully models for nonadiabatic dynamics. Physical Chemistry Chemical Physics 2020, 22, 15183–15196. [Google Scholar] [CrossRef]
- Ibele, L.M.; Lassmann, Y.; Martínez, T.J.; Curchod, B.F. Comparing (stochastic-selection) ab initio multiple spawning with trajectory surface hopping for the photodynamics of cyclopropanone, fulvene, and dithiane. The Journal of Chemical Physics 2021, 154, 104110. [Google Scholar] [CrossRef]
- Vindel-Zandbergen, P.; Ibele, L.M.; Ha, J.K.; Min, S.K.; Curchod, B.F.; Maitra, N.T. Study of the decoherence correction derived from the exact factorization approach for nonadiabatic dynamics. Journal of Chemical Theory and Computation 2021, 17, 3852–3862. [Google Scholar] [CrossRef]
- Weight, B.M.; Mandal, A.; Huo, P. Ab initio symmetric quasi-classical approach to investigate molecular Tully models. The Journal of Chemical Physics 2021, 155, 084106. [Google Scholar] [CrossRef]
- Grohmann, T.; Deeb, O.; Leibscher, M. Quantum separation of para-and ortho-fulvene with coherent light: The influence of the conical intersection. Chemical Physics 2007, 338, 252–258. [Google Scholar] [CrossRef]
- Alfalah, S.; Belz, S.; Deeb, O.; Leibscher, M.; Manz, J.; Zilberg, S. Photoinduced quantum dynamics of ortho-and para-fulvene: Hindered photoisomerization due to mode selective fast radiationless decay via a conical intersection. The Journal of Chemical Physics 2009, 130, 124318. [Google Scholar] [CrossRef]
- Mendive-Tapia, D.; Lasorne, B.; Worth, G.A.; Bearpark, M.J.; Robb, M.A. Controlling the mechanism of fulvene S 1/S 0 decay: switching off the stepwise population transfer. Physical Chemistry Chemical Physics 2010, 12, 15725–15733. [Google Scholar] [CrossRef]
- Mendive-Tapia, D.; Lasorne, B.; Worth, G.A.; Robb, M.A.; Bearpark, M.J. Towards converging non-adiabatic direct dynamics calculations using frozen-width variational Gaussian product basis functions. The Journal of Chemical Physics 2012, 137, 22A548. [Google Scholar] [CrossRef]
- Bearpark, M.J.; Bernardi, F.; Olivucci, M.; Robb, M.A.; Smith, B.R. Can fulvene S1 decay be controlled? A CASSCF study with MMVB dynamics. Journal of the American Chemical Society 1996, 118, 5254–5260. [Google Scholar] [CrossRef]
- Toldo, J.M.; Mattos, R.S.; Pinheiro Jr, M.; Mukherjee, S.; Barbatti, M. Recommendations for velocity adjustment in surface hopping. Journal of Chemical Theory and Computation 2024, 20, 614–624. [Google Scholar] [CrossRef]
- Cotton, S.J.; Miller, W.H. A new symmetrical quasi-classical model for electronically non-adiabatic processes: Application to the case of weak non-adiabatic coupling. The Journal of Chemical Physics 2016, 145, 144108. [Google Scholar] [CrossRef]
- Cotton, S.J.; Miller, W.H. A symmetrical quasi-classical windowing model for the molecular dynamics treatment of non-adiabatic processes involving many electronic states. The Journal of Chemical Physics 2019, 150, 104101. [Google Scholar] [CrossRef]
- Liu, J. A unified theoretical framework for mapping models for the multi-state Hamiltonian. The Journal of Chemical Physics 2016, 145, 204105. [Google Scholar] [CrossRef]
- Cheng, X.; He, X.; Liu, J. A novel class of phase space representations for the exact population dynamics of two-state quantum systems and the relation to triangle window functions. Chinese Journal of Chemical Physics 2024, 37, 230–254. [Google Scholar] [CrossRef]
- Gao, X.; Geva, E. Improving the accuracy of quasiclassical mapping Hamiltonian methods by treating the window function width as an adjustable parameter. The Journal of Physical Chemistry A 2020, 124, 11006–11016. [Google Scholar] [CrossRef]
- Cotton, S.J.; Miller, W.H. Trajectory-adjusted electronic zero point energy in classical Meyer-Miller vibronic dynamics: Symmetrical quasiclassical application to photodissociation. The Journal of Chemical Physics 2019, 150, 194110. [Google Scholar] [CrossRef]
- He, X.; Gong, Z.; Wu, B.; Liu, J. Negative zero-point-energy parameter in the Meyer–Miller mapping model for nonadiabatic dynamics. The Journal of Physical Chemistry Letters 2021, 12, 2496–2501. [Google Scholar] [CrossRef]
- He, X.; Wu, B.; Gong, Z.; Liu, J. Commutator matrix in phase space mapping models for nonadiabatic quantum dynamics. The Journal of Physical Chemistry A 2021, 125, 6845–6863. [Google Scholar] [CrossRef] [PubMed]
- Lax, M. The Franck-Condon principle and its application to crystals. Journal of Chemical Physics 1952, 20, 1752–1760. [Google Scholar] [CrossRef]
- Hillery, M.; O’Connel, R.F.; Scully, M.O.; Wigner, E.P. Distribution Functions in Physics: Fundamentals. Phys. Rep. 1984, 106, 121–167. [Google Scholar] [CrossRef]
- Frisch, M.J.; Trucks, G.W.; Schlegel, H.B.; Scuseria, G.E.; Robb, M.A.; Cheeseman, J.R.; Scalmani, G.; Barone, V.; Petersson, G.A.; Nakatsuji, H.; et al. Gaussian˜16 Revision C.01, 2016. Gaussian Inc. Wallingford CT.
- Werner, H.J.; Knowles, P.J.; Manby, F.R.; Black, J.A.; Doll, K.; Heßelmann, A.; Kats, D.; Köhn, A.; Korona, T.; Kreplin, D.A.; et al. The Molpro quantum chemistry package. The Journal of Chemical Physics 2020, 152, 144107. [Google Scholar] [CrossRef]
- Du, L.; Lan, Z. An on-the-fly surface-hopping program jade for nonadiabatic molecular dynamics of polyatomic systems: implementation and applications. Journal of Chemical Theory and Computation 2015, 11, 1360–1374. [Google Scholar] [CrossRef]
- Farag, M.H.; Jansen, T.L.; Knoester, J. Probing the interstate coupling near a conical intersection by optical spectroscopy. The Journal of Physical Chemistry Letters 2016, 7, 3328–3334. [Google Scholar] [CrossRef] [PubMed]
- Zhan, S.; Gelin, M.F.; Huang, X.; Sun, K. Ab initio simulation of peak evolutions and beating maps for electronic two-dimensional signals of a polyatomic chromophore. Journal of Chemical Physics 2023, 158, 194106. [Google Scholar] [CrossRef]
- Qiang, Y.; Sun, K.; Palacino-González, E.; Shen, K.; Rao, B.J.; Gelin, M.F.; Zhao, Y. Probing avoided crossings and conical intersections by two-pulse femtosecond stimulated Raman spectroscopy: Theoretical study. Journal of Chemical Physics 2024, 160, 054107. [Google Scholar] [CrossRef]
- Butkus, V.; Zigmantas, D.; Valkunas, L.; Abramavicius, D. Vibrational vs. Electronic coherences in 2D spectrum of molecular systems. Chemical Physics Letters 2012, 545, 40–43. [Google Scholar] [CrossRef]
- Butkus, V.; Valkunas, L.; Abramavicius, D. Molecular vibrations-induced quantum beats in two-dimensional electronic spectroscopy. Journal of Chemical Physics 2012, 137, 044513. [Google Scholar] [CrossRef]
- Gómez, S.; Spinlove, E.; Worth, G. Benchmarking non-adiabatic quantum dynamics using the molecular Tully models. Physical Chemistry Chemical Physics 2024, 26, 1829–1844. [Google Scholar] [CrossRef]

Disclaimer/Publisher’s Note: The statements, opinions and data contained in all publications are solely those of the individual author(s) and contributor(s) and not of MDPI and/or the editor(s). MDPI and/or the editor(s) disclaim responsibility for any injury to people or property resulting from any ideas, methods, instructions or products referred to in the content. |
© 2025 by the authors. Licensee MDPI, Basel, Switzerland. This article is an open access article distributed under the terms and conditions of the Creative Commons Attribution (CC BY) license (http://creativecommons.org/licenses/by/4.0/).


