1. Introduction
The global energy transition is crucial for promoting sustainability and addressing the adverse effects of climate change. Developing countries, however, face distinctive challenges in balancing economic growth with environmental sustainability. The shift from fossil fuels to renewable energy sources is fundamental to overcoming these challenges, particularly in reducing pollution, enhancing energy access, and improving resilience to climate impacts. In many developing nations, efforts to transition to renewable energy have gained momentum, driven by international financial support, incentive policies, and local capacity building. These initiatives have led to substantial progress in the deployment of decentralized renewable energy systems, such as solar panels and small wind turbines, particularly in rural and isolated areas during period between 2000 and 2022 has seen considerable adoption of such technologies, which have not only contributed to reducing greenhouse gas emissions but have also promoted social inclusion. Vulnerable groups, including women and rural communities, have experienced improved access to clean and affordable energy, which has enhanced their quality of life and supported broader socio-economic development.
Mtiraoui, A., (2024)1 emphasize the role of renewable energy technologies in shaping the future of energy in developing countries. Their research highlights the importance of localized, decentralized energy systems in overcoming both energy poverty and environmental challenges. These systems have stimulated job creation, bolstered local economies, and enhanced resilience to climate change. Furthermore, the transition to renewable energy has played a key role in improving energy security by reducing reliance on imported fossil fuels. This energy transition aligns with global sustainability goals, such as clean energy, climate action, and poverty reduction. Understanding the interconnections between policy, technology, and social outcomes is vital as developing countries continue to make strides in renewable energy adoption. The application of models like the Simultaneous Equation Model can provide valuable insights into how various factors, such as economic policies, technological advancements, and social dynamics, influence the success of energy transition efforts.
This study explores the experiences of developing countries in their energy transition, focusing on the successes and challenges of adopting renewable energy. Drawing on the findings of Mtiraoui, A., et al. (2024)2 and other key studies, this paper aims to provide a comprehensive understanding of how energy transition efforts contribute to sustainable development, pollution reduction, and adaptation to climate change. The energy transition in developing countries is a crucial step toward achieving sustainable development and mitigating climate change. By adopting decentralized renewable energy systems, these countries have made significant progress in improving energy access, reducing pollution, and enhancing resilience to climate change.
However, challenges persist in terms of financing, policy implementation, and ensuring social inclusion.The work is subdivided into five sections namely: Introduction, literature review, methodology, analysis of results and finally conclusion.
2. Literature Review
The energy transition in developing countries is essential for addressing pollution, mitigating climate change, and fostering socio-economic development. This literature review delves into recent studies that investigate the progress, challenges, and strategies associated with the energy transition in these countries, with a particular focus on combating pollution and adapting to the climate crisis.
2.1. Challenges in the Energy Transition of Developing Countries
Shifting from fossil fuel-based energy systems to renewable, sustainable alternatives presents significant obstacles for developing countries. Alghamdi et al. (2023) identify financial constraints as one of the primary barriers to renewable energy adoption. The high initial capital required for technologies such as solar panels, wind turbines, and energy storage systems hinders widespread investment in renewable projects.
Additionally, Seyoum and Kassim (2023) highlight political and institutional challenges, noting that in many developing countries, fossil fuel industries play a central role in the economy, creating resistance to energy transition policies. Technological challenges are also critical; as Musa et al. (2023) point out, a lack of local expertise in renewable energy systems and insufficient grid infrastructure further complicate the transition. Furthermore, Zhang et al. (2023) stress that many developing nations lack coherent energy policy frameworks, making it difficult to integrate renewable energy projects with broader socio-economic goals, such as job creation and poverty reduction.
2.2. The Importance of Energy Transition for Developing Countries
The energy transition is particularly crucial for developing countries, as they are both major contributors to and vulnerable victims of climate change. Mtiraoui, A., et al. (2024) emphasize that while these nations contribute significantly to global carbon emissions due to their reliance on fossil fuels, they also face disproportionate impacts from climate change, including extreme weather, droughts, and rising sea levels.
Transitioning to renewable energy sources like solar, wind, and hydropower offers a dual benefit: reducing carbon emissions and enhancing resilience to climate impacts (Zhang et al., 2023). Furthermore, the energy transition is a critical solution to energy poverty, which remains a pressing issue in many developing regions. Kamau et al. (2023)3 argue that decentralized renewable energy systems, such as solar home systems and mini-grids, can provide affordable, sustainable electricity to the over 600 million people in Sub-Saharan Africa who still lack access to reliable power.
2.3. Technological Innovation, Socio-Economic Impacts, and Policy Frameworks
Recent literature underscores the crucial role of technological innovations in the energy transition, particularly in renewable energy solutions such as solar photovoltaics, wind turbines, and geothermal energy. Scholars have emphasized that these technologies are key not only to reducing greenhouse gas emissions but also to supporting climate adaptation efforts. In particular, advancements in energy storage and grid modernization, such as lithium-ion batteries, are essential in addressing the intermittency challenges associated with renewable energy sources. These innovations enhance the reliability and scalability of renewable technologies, particularly in regions with underdeveloped infrastructure (Johnson et al., 2022).
The socio-economic impacts of the energy transition are also profound. The shift toward renewable energy has the potential to generate new employment opportunities, reduce poverty, and drive economic growth, particularly in regions previously dependent on fossil fuels. However, challenges persist, especially in communities heavily reliant on traditional energy industries. As highlighted by researchers like Brown and Davis (2022), there is a pressing need for comprehensive workforce training and educational programs to equip individuals for the emerging renewable energy sector. Policies that promote job creation, social safety nets, and support for local communities are critical in ensuring an equitable energy transition (Green & Lee, 2022).
Additionally, international collaboration remains central to supporting developing countries, providing them with financial resources, technological assistance, and capacity-building opportunities. According to Williams et al. (2022), such international partnerships are vital for overcoming the financial and technological barriers that many developing nations face in their transition to renewable energy. The energy transition in developing countries is particularly critical, as it offers a pathway to reduce pollution, mitigate climate change, and adapt to its adverse impacts. While significant challenges ranging from financial constraints to political instability remain, the role of renewable energy technologies, including solar, wind, and energy storage, in addressing these challenges is increasingly recognized. Researchers such as Gupta, N.et al. (2021)4 highlight that these technologies, along with effective policy frameworks, international cooperation, and robust local engagement, are key to ensuring the transition is both environmentally sustainable and socially inclusive. Managing the socio-economic implications of this transition will be essential, particularly for marginalized communities, to ensure that the benefits of renewable energy are widely shared and contribute to long-term socio-economic development.
3. Transition Énergétique: Enjeux et Perspectives
In recent years, energy transition has gained significant attention in both public debates and academic research. Broggio et al. (2014) highlighted that energy transition is far from uniform, both conceptually and in its implementation. Broadly, energy transition can be understood as the substitution of renewable resources for non-renewable ones, accompanied by a shorter cycle between energy production and consumption. This shift addresses pressing issues such as sustainability and efficiency, as well as the need to adapt to evolving energy demands.
According to Folchi & Rubio (2006), studies on the energy history of nations consistently reveal a typical and recurring phenomenon. Over time, distinct periods can be identified during which a predominant energy source gradually declines and is eventually replaced by an emerging one. This phenomenon, termed “energy transition,” refers to the gradual replacement of one energy source by another over a specific period. Fouquet (2015) explains that this process, in essence, involves replacing traditional energy sources with renewable alternatives that are more efficient in terms of productivity and versatility.
Lejoux & Ortar (2014) argue that changes in energy systems are primarily driven by two factors: the anticipated scarcity of energy resources and the negative environmental impacts of current systems. However, the first argument has diminished in importance due to advancements in shale oil and gas extraction and the abundance of global coal reserves (IEA, 2014). On a global scale, the critical challenge lies not in meeting the growing energy demands of the coming decades but in managing the environmental consequences of energy consumption, particularly the global impact of greenhouse gas (GHG) emissions.
Citizens, to ensure energy autonomy (Deshaies, 2014), therefore, to replace centralized, corporate-controlled production structures with decentralized systems of smaller production units, ideally own the goal of energy transition.
Moreover, environmental transition is a key variable assessed through critical indicators related to greenhouse gas emissions. Gases such as carbon dioxide (CO2), methane (CH4), and nitrous oxide (N2O) are central to evaluating the environmental impact of human activities. This study examines and analyzes these indicators within the context of environmental transition, providing valuable insights to guide future decisions and actions for environmental protection.
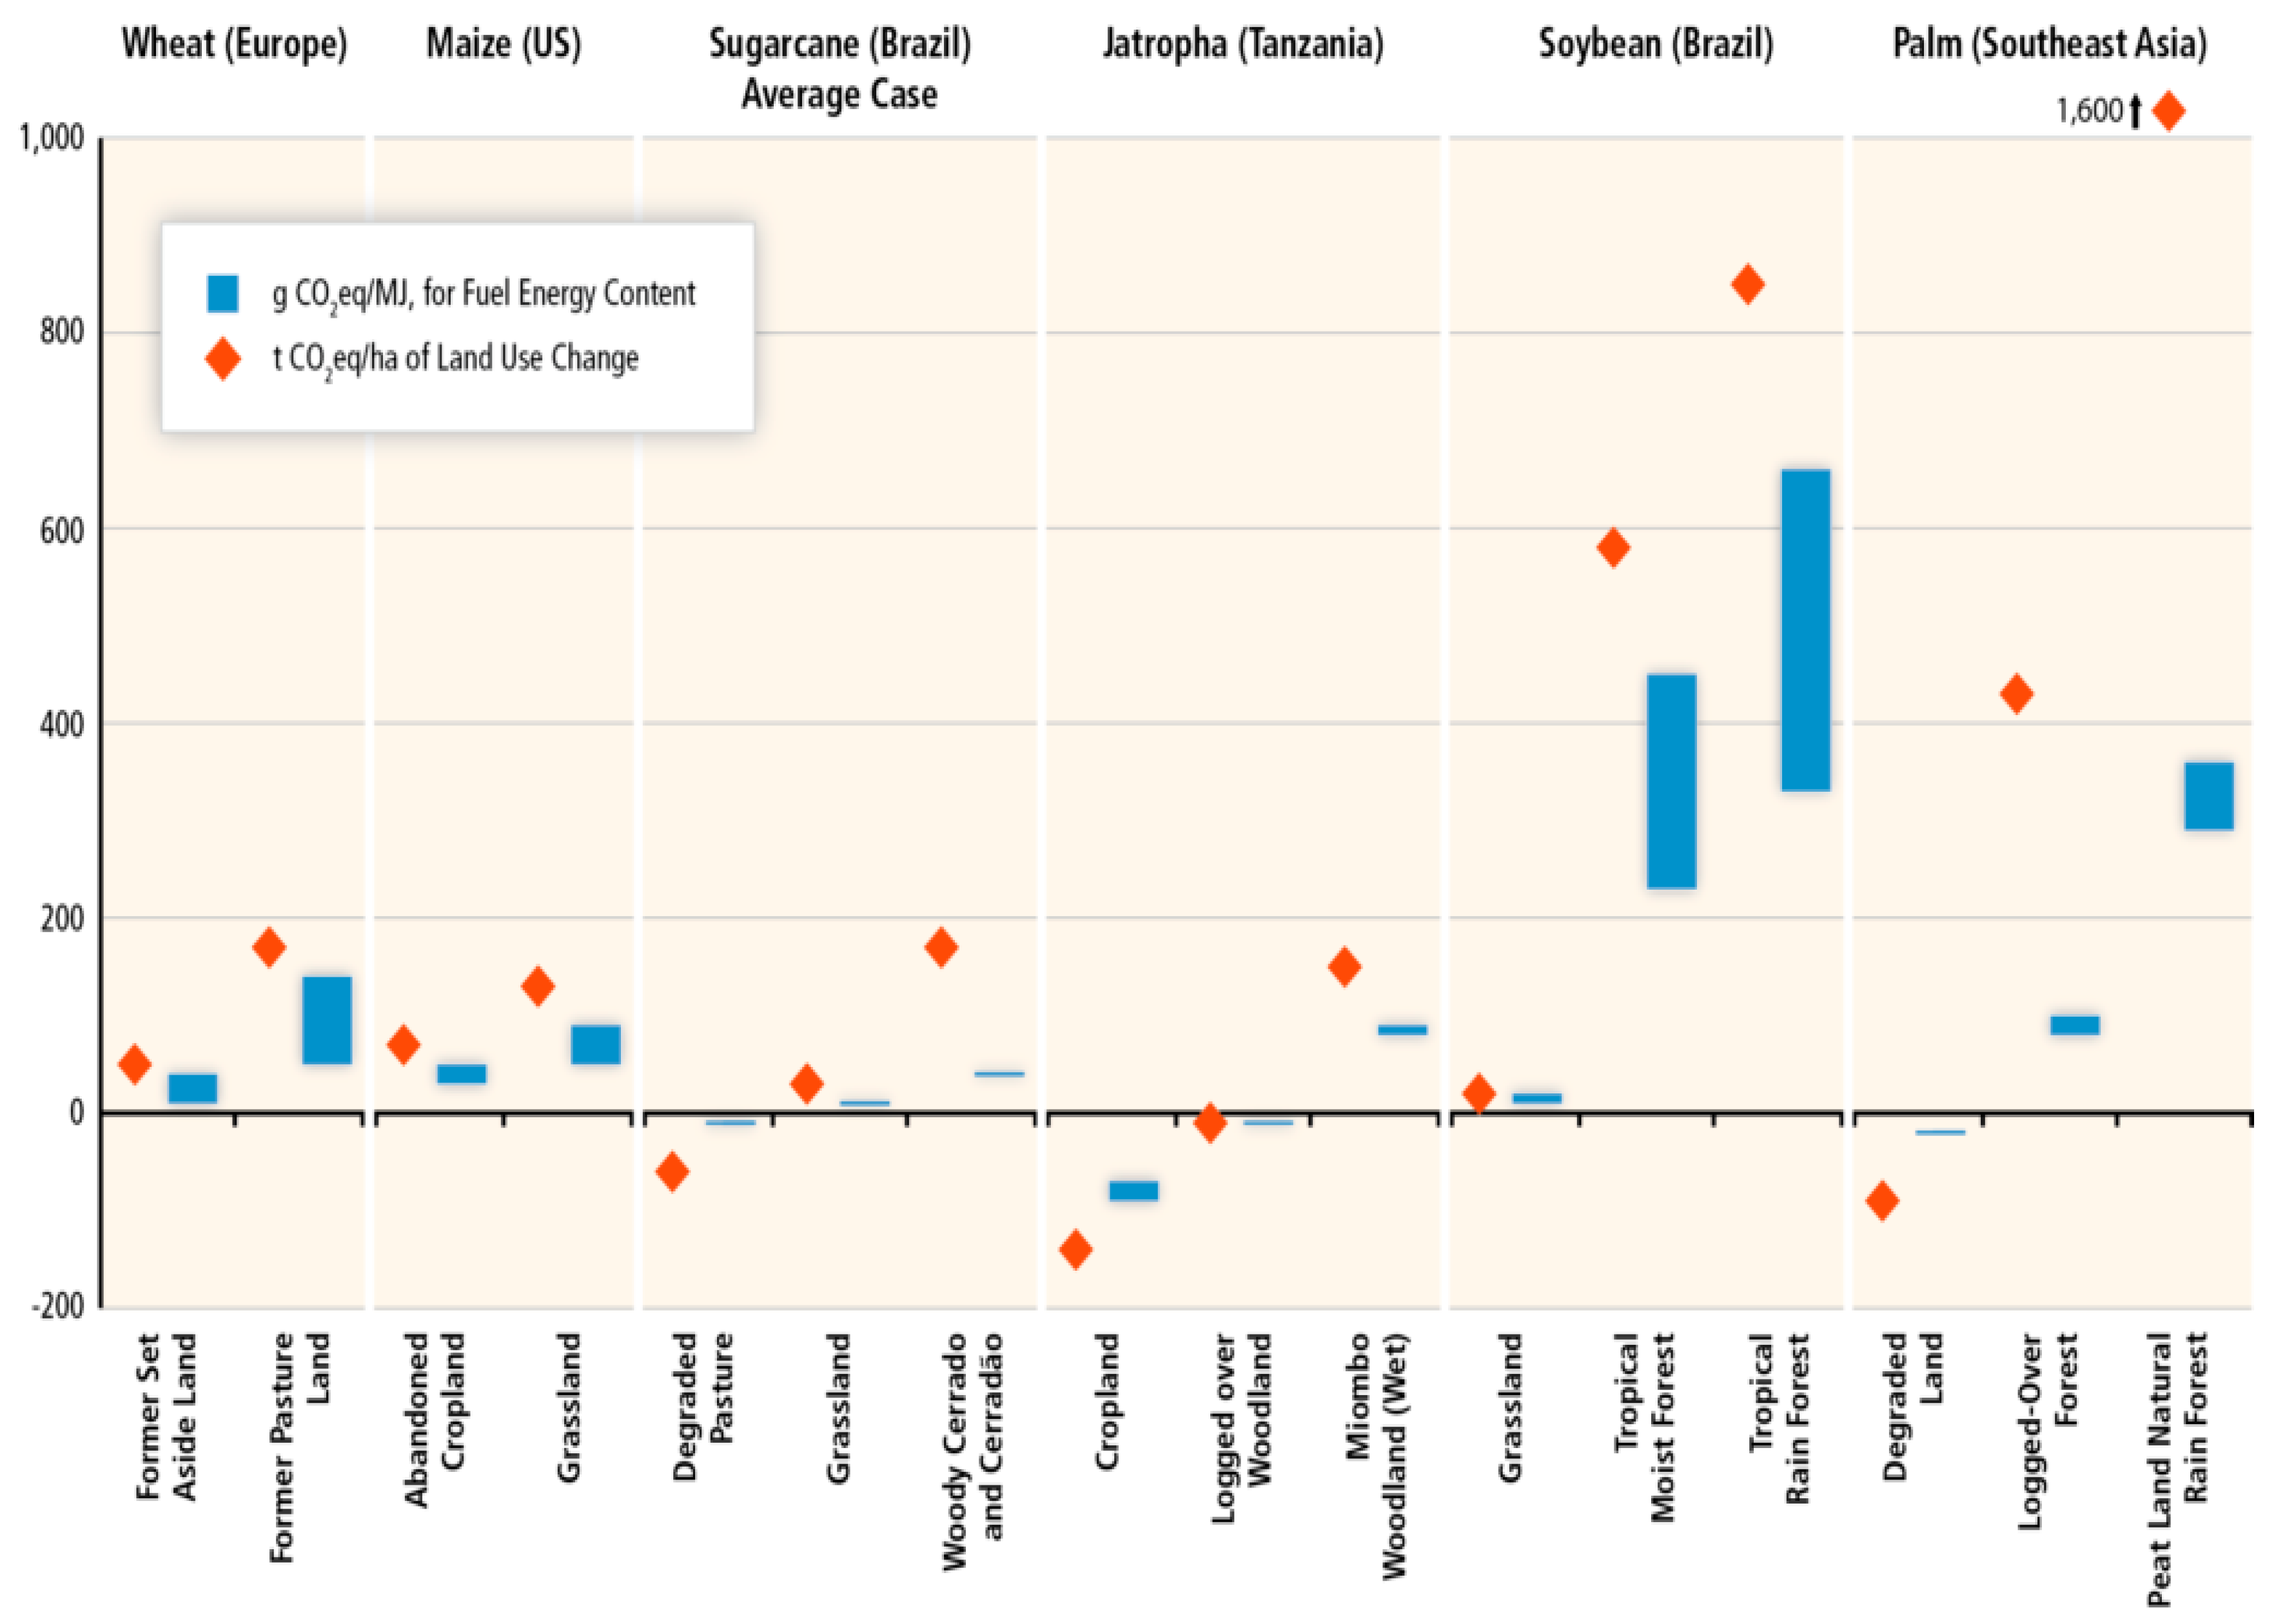
Additionally, estimates for biofuels vary significantly compared to gasoline and diesel due to factors such as land productivity variations, crop management practices, conversion processes, and the energy sources used during these processes. Other uncertainties include N2O emissions from fertilizer use and methodological differences in life cycle analyses (LCAs), such as co-product allocation approaches and system boundary definitions (Williams et al., 2009; Hoefnagels et al., 2010; Cherubini & Strømman, 2011)5.
This comprehensive examination of energy transition underscores its multifaceted nature, emphasizing the urgent need to balance technological advancement, environmental sustainability, and socio-economic equity.
Figure 1.
Illustrative ranges of life cycle GHG emissions from petroleum fuels for selected countries world 6. Source: Renewable Energy in the Context of Sustainable Development; Chapter 9.
Figure 1.
Illustrative ranges of life cycle GHG emissions from petroleum fuels for selected countries world 6. Source: Renewable Energy in the Context of Sustainable Development; Chapter 9.
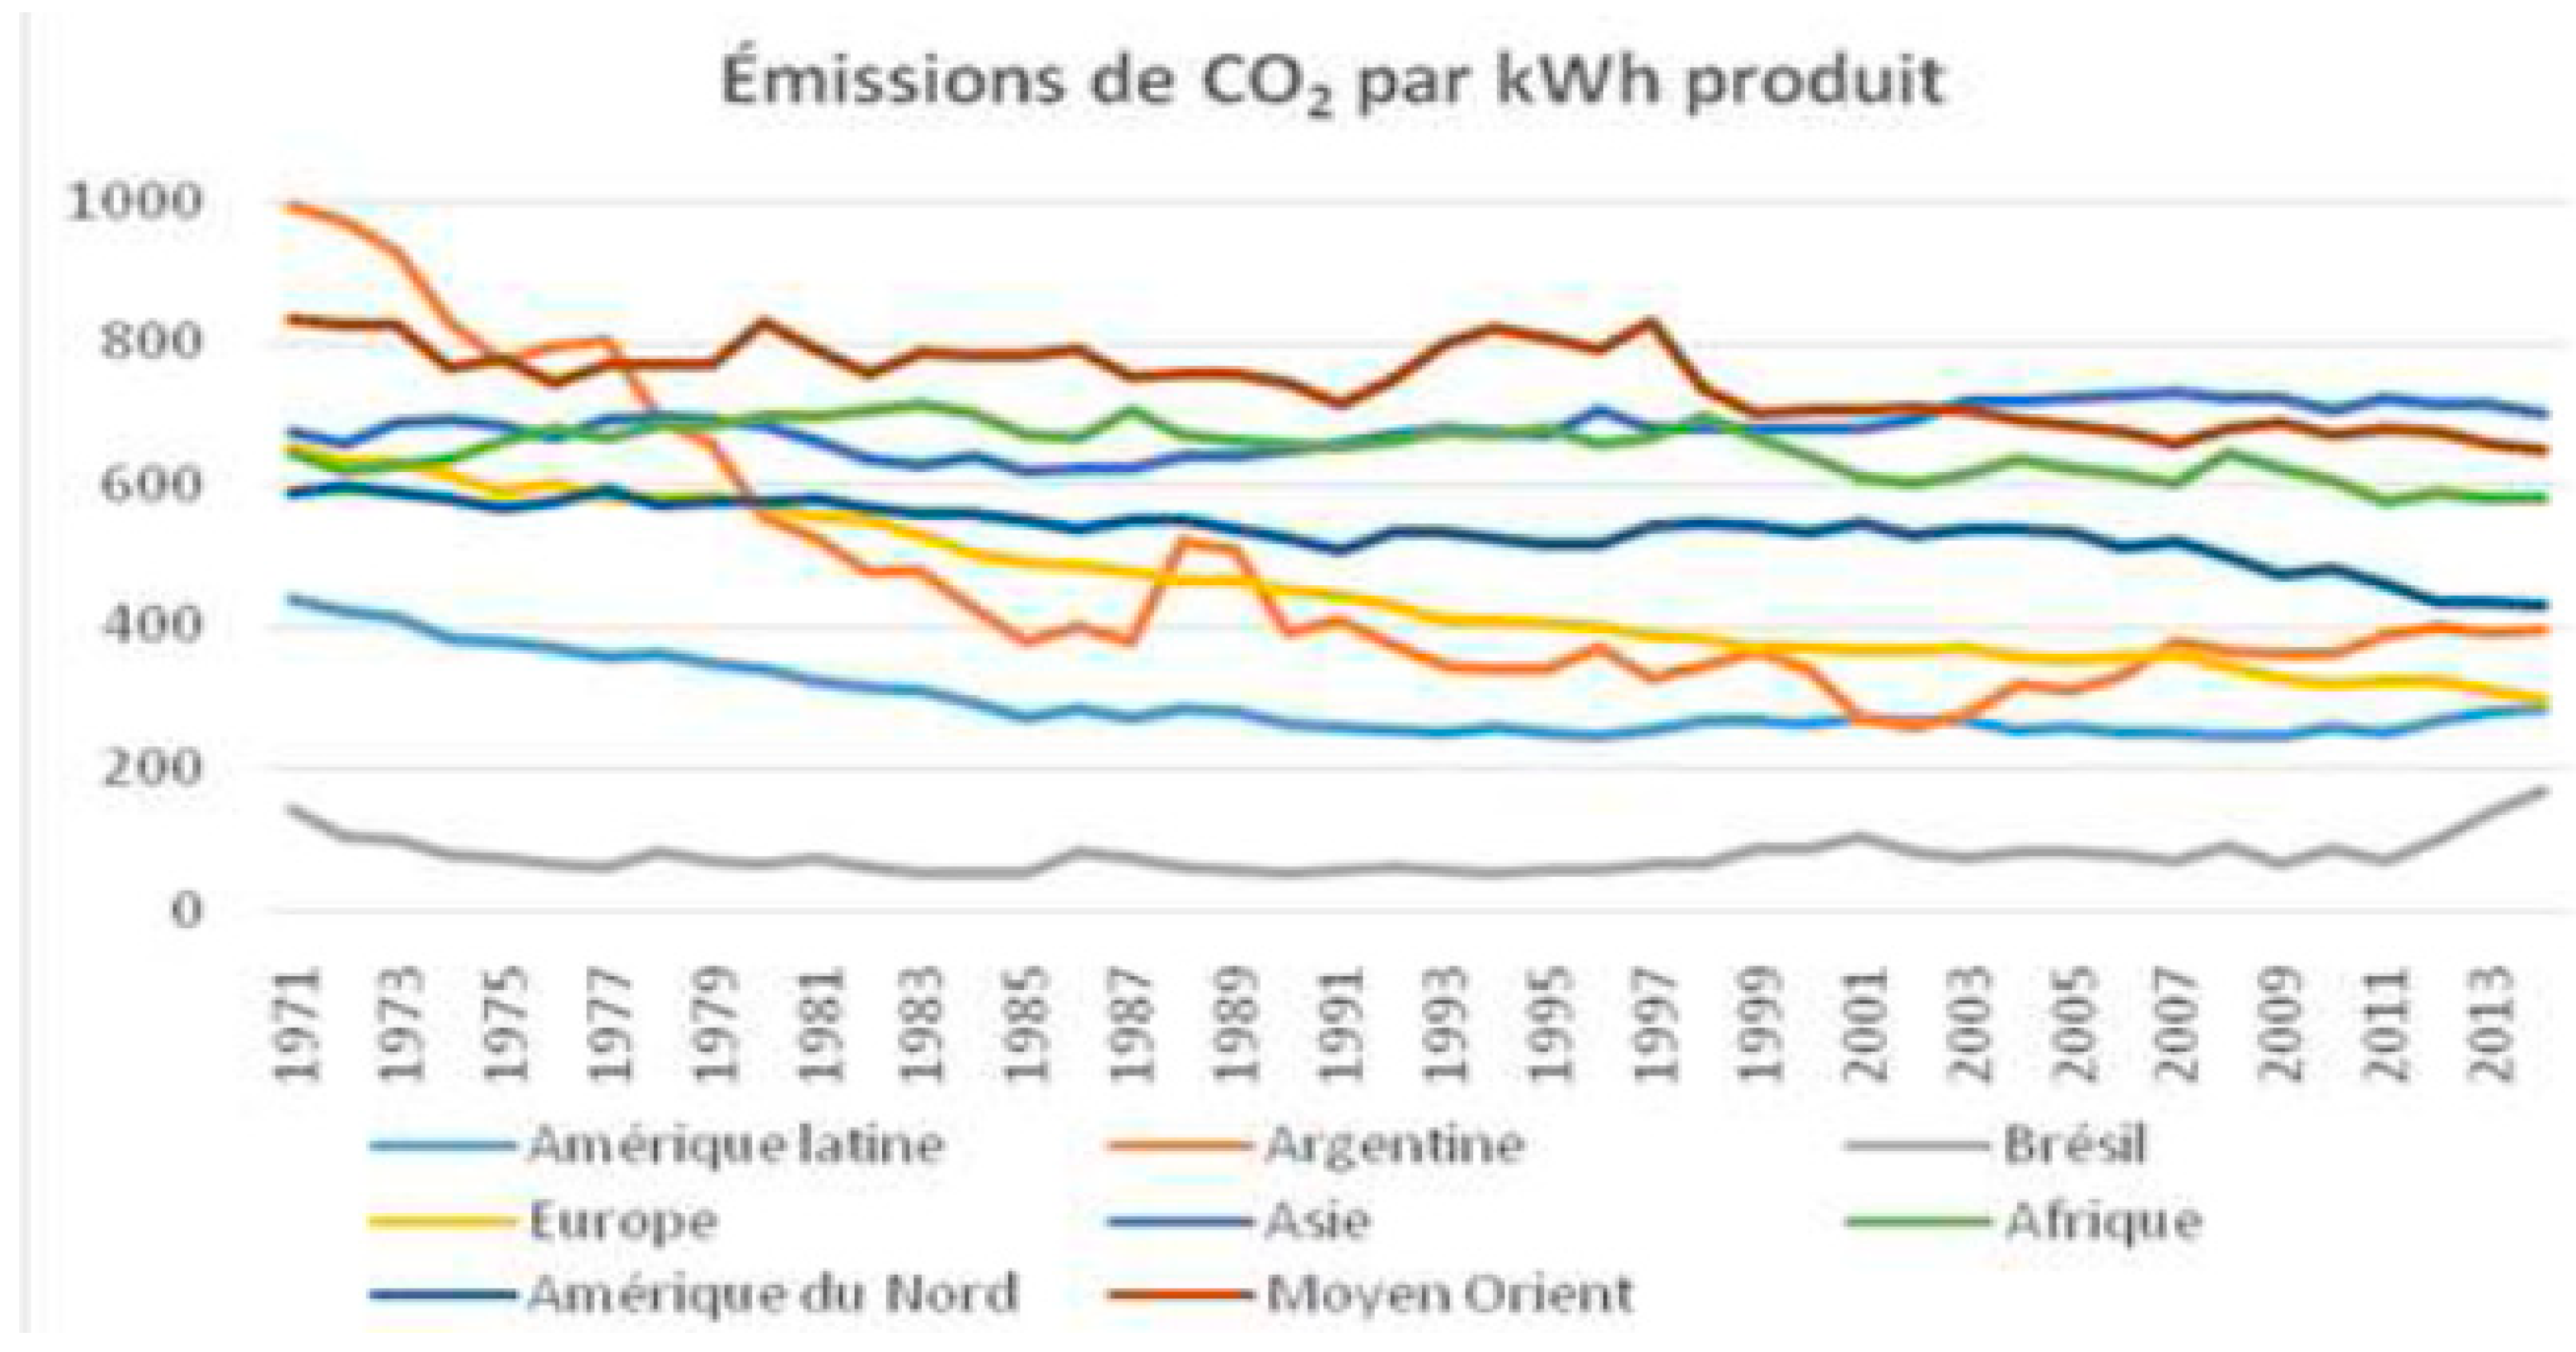
Figure 2.
Evolution of the carbon intensity of electricity 7. Source: The work done by Bersalli. G; ET Simon. J; (2017).
Figure 2.
Evolution of the carbon intensity of electricity 7. Source: The work done by Bersalli. G; ET Simon. J; (2017).
Carbon dioxide (CO2) emissions per kilowatt-hour (kWh) produced are a crucial indicator for assessing the environmental efficiency of electricity generation systems in a given region. This value is significantly lower than in other regions of the world.
Indeed, some countries have invested in cleaner technologies and infrastructure for their electricity generation. For example, government policies may have encouraged the adoption of stricter emission standards for power plants or provided financial incentives for investment in cleaner technologies. Geographically, any region can also play an important role in creating natural resources, such as rivers for hydropower or vast expanses of sunny land for solar energy, which offer unique opportunities for large-scale renewable energy deployment.
While overall CO2 emissions per kWh produced differ from region to region, there are still opportunities to continue reducing these emissions and promote cleaner and more sustainable electricity generation across the region. This will require continued efforts in energy policy, investment in clean technologies and international collaboration to address global climate challenges8.
4. Working Methodology
To analyze the energy transition toward a sustainable future in developing countries, several key variables must be considered. These variables can be grouped into categories such as socio-economic factors, policy frameworks, environmental impacts, and capacity building efforts. Here is an overview of the main variables, their potential sources.
4.1. Assomptions
H1: CO2 emissions assumed to adequately capture the environmental impact of energy transitions (ETN).
H2: The study assumes that renewable energy initiatives involve marginalized groups and promote social equity.
H3: Institutional quality (ICRG) environments are presumed to encourage investment (INV) in renewable energy projects.
4.2. Data Variables Presentation
CO2 emission reductions often indicate the effectiveness of energy transition policies, such as carbon pricing, renewable energy subsidies, and stricter emissions regulation when the lower CO2 emissions highlight the role of social awareness, behavior change, and investments in green technologies. Several authors have been used in the literature to measure environmental degradation such as Cho and al. (2014).
The study utilizes reliable secondary data collected from global databases, national reports, and institutional publications. Key sources include:
World Bank: Economic and social indicators.
International Energy Agency (IEA): Energy access and renewable energy data.
United Nations Development Programme (UNDP): Climate resilience and socio-economic inclusion indicators.
The data is categorized into four dimensions: Environmental, Economic, Social, and Policy. Each category includes specific indicators:
Environmental Variables (ENT):
CO2 emissions: Measured in metric tons (CO2, CH4, N2O).
Economic Variables (EV):
The employment (EMP) in renewable energy sectors and the investments (INV) in renewable energy projects.
Social Variables (PR):
Poverty reduction: Percentage decrease in energy poverty (%).
Policy Variables ( ICRG):
ICRG indicator of qualty of govermenemt: The mean value of ICRG variables “control of corruption”, law and order” and bureaucracy quality.
4.3. Model Specification: Simultaneous Equations Model 9
The study is to examine the direct and indirect effects of the energy transition on sustainable development in 20 developing countries by addressing pollution, enhancing climate adaptation, and fostering resilience. Using a simultaneous equations model, the research explores the interaction between economic, institutional, social, and environmental dimensions of the energy transition during the period (2000-2022) when the energy transition (ENT) is model as a function of these key dimensions:
*The Energy Transition Equation:
(A)
**The Govermenemt Equation:
(B)
*The Economic Growth Equation:
(C)
When (i = 1... 20; T = 23.). and; = =; = : indicator of quality of govermenemt: The mean value of ICRG variables “control of corruption (CC)”, law and order (LO)” and bureaucracy quality (BQ). Kaufman and al. (2010).
, and are the random variables of equations A, B and C respectively.
Method Useds10
Empirical studies have examined very simple models limited to a single equation, typically linear, where there is an endogenous variable or a variable to be explained. Estimation of model equations, the issue of endogeneity, REG3 methods (Three-Stage Least Squares Regression), and exclusion of restrictions have been considered. (Mtiraoui, A., 2024)
In our model, the variable “ENT” appears in the first equation as an endogenous variable, and respectively, in the second and third equations as an exogenous variable. Similarly, the variables “ICRG” and “ GDP “ appear in the last equation as exogenous variables, “ICRG” appears in the second equation as an endogenous variable, and “GDP” appears in the last equation as an endogenous variable.
Linear restrictions
There are two identification conditions: order conditions (necessary conditions) and rank conditions (sufficient conditions).
Necessary conditions: Order conditions11
In our case, we note that, for the model under study, all equations are over-identified. Indeed, we have three endogenous variables in the model (W = 3): “ENT”, “ICRG”, and “GDP”, and six exogenous variables: “ CO2 emissions “, “EMP”, “INV”, “FDI”, “CC”.”LO” and “BQ”.
First equation: Applying the identification conditions: W’ = 1, K’ = 3, and r = 0, where W’ represents the number of endogenous variables appearing in an equation and K’ the number of exogenous variables appearing in an equation.
Therefore, we have W – W’ + K – K’ = 3 – 1 + 10 – 3 = 9 > W – 1 = 3 – 1 = 2, indicating that the first equation is over-identified.
Second equation: We have: W = 3, K = 7, W’ = 1, K’ = 3, and r = 0, resulting in: W – W’ + K – K’ = 3 – 1 + 10 – 5 = 7 > W – 1 = 2, indicating that the second equation is over- identified.
Third equation: We have: W = 3, K = 7, W’ = 1, K’ = 3, and r = 0, which implies W – W’ + K – K’ = 3 - 1 + 10 – 5 = 7 > W – 1 = 2, indicating that the third equation is over-identified. Since all equations in our model are over-identified, the model is therefore over-identified.
5. Descriptive Analyzes, Presentations of Results and Comments
5.1. Descriptive Analytics
Descriptive Measures 12
First, our analysis will focus on descriptive measures, in this case the characteristics of position (Mean), dispersion (Standard Deviation) and coefficients of variation of the explanatory variables. This is to allow us to have an idea of the distribution and the degree of homogeneity of the series.
*The average: The average is a position measure which makes it possible to identify the value around which the observations are distributed.
* Standard deviation: The standard deviation is a measure of dispersion which makes it possible to evaluate the variability of a series. In other words, it makes it possible to determine the fluctuations of observations around the arithmetic Mean.
* The coefficient of variation: The coefficient of variation is a composite measure made up of the mean and the standard deviation. It makes it possible to gauge what the average is worth in relation to all the observations.
Table 1.
Descriptive Statistics.
Table 1.
Descriptive Statistics.
| Variables |
Obs. |
Mean |
Std. Dev. |
Min. |
Max. |
|
460 |
20.1120 |
0.1676 |
-10.4797 |
3.5278 |
|
460 |
13.3676 |
0.5446 |
2.2469 |
17.38329 |
|
460 |
3.7639 |
0.1295 |
-2.3352 |
9.78329 |
|
460 |
-3.7639 |
0.1295 |
-0.3352 |
5.78329 |
|
460 |
9.6042 |
0.3667 |
1.6589 |
9.3578 |
|
460 |
-8.3651 |
0.1455 |
-2.2469 |
18.3833 |
|
460 |
4.5813 |
0.8284 |
0.4618 |
4.9957 |
|
460 |
1.7927 |
0.4652 |
2.09751 |
6.1811 |
|
460 |
10.6625 |
0.8864 |
21.244 |
29.3315 |
|
460 |
2.6041 |
0.2568 |
3.2975 |
7.8578 |
Table Correlation Matrix
We present, secondly, the correlation matrix table, also the analysis of the graphs which will allow us to appreciate the nature and type of relationship existing between the endogenous variable and the exogenous variables taken. In other words, it allows us to detect the presence of relationships between variables.
Analyse multivariée
Table 2.
Correlation matrix between variables.
Table 2.
Correlation matrix between variables.
| |
|
|
|
|
|
|
|
|
|
|
|
1.000 |
|
|
|
|
|
|
|
|
|
|
0.323 |
1.000 |
|
|
|
|
|
|
|
|
|
0.484 |
0.128 |
1.000 |
|
|
|
|
|
|
|
|
-0.495 |
-0.497 |
-0.4241 |
1.000 |
|
|
|
|
|
|
|
0.032 |
0.419 |
0.496 |
-0.280 |
1.000 |
|
|
|
|
|
|
-0.082 |
0.077 |
0.265 |
-0.501 |
-0.167 |
1.000 |
|
|
|
|
|
-0.317 |
0.256 |
-0.497 |
-0.235 |
-0.035 |
-0.495 |
1.000 |
|
|
|
|
0.076 |
0.256 |
0.333 |
0.132 |
0.131 |
0.292 |
0.176 |
1.000 |
|
|
|
0.438 |
0.501 |
0.446 |
0.375 |
0.701 |
-0.421 |
-0.304 |
0.447 |
1.000 |
|
|
0.298 |
0.562 |
0.631 |
0.621 |
0.507 |
0.493 |
0.413 |
0.509 |
0.291 |
1.000 |
At this level, we will seek to specify the model. Unlike linear regression models where we can specify a one-dimensional model on the basis of economic theories and then carry out model validation tests, in the case of panel models, the analysis concerns two dimensions.
We analyze the characteristics of a set of countries over a defined period of time, we carry out different tests in order to define the form of the model studied. In other words, we seek to detect whether it is a stacked model, a fixed effect model (country/time) or a random effect model, from the tests. It is in this vein that we are led to carry out the Breusch-Pagan & Hausman test 13 for specification model. In addition to conducting tests to determine the structure of the model, we delve into further analysis to glean insights into the specific characteristics of each type of model. This entails examining the strengths and limitations of pooled models, fixed effects models, and random effects models in capturing the dynamics of the data under study.
5.2. Analysis of Model Results
The results of the simultaneous equation estimation by the double least squares method of the direct and indirect effects of economic, institutional, social, and environmental dimensions of the energy transition presented in
Table 3.
5.3. Discussions the Results
To demonstrate the direct and indirect effects between CO₂ emissions (CO2), energy transition (ENT), economic growth (GDP), and the indicator of government quality (ICRQ), using a simultaneous equations model for the developing countries during the period (2000-2022).
The results found in
Table 3 indicate the direct effect of CO₂ on GDP appears significant (10%). A positive coefficient (1.06) may indicate that in the short term, higher CO₂ emissions are associated with economic activities driven by traditional carbon-intensive sectors. This reflects a growth pattern often observed in developing economies dependent on fossil fuels.
*Direct Effects
CO₂ also shows a direct negative (-3.6) effect on ENT. High emissions often signify 1% resistance to transitioning toward cleaner technologies, due to either entrenched fossil fuel industries or inadequate environmental policies. However, CO2 has a direct negative effect on ENT, suggesting that high carbon emissions may reflect an entrenched reliance on traditional energy sources, impeding clean energy adoption. This aligns with findings from empirical studies that highlight the “carbon lock-in” challenge. (Unruh, 2000).
ENT positively (3.9) and directly influences GDP, indicating that investments in renewable energy technologies foster innovation and overall economic productivity. The significate 1% relationship between ENT and GDP aligns with studies by Sadorsky (2010) and Apergis & Payne (2011), which highlight that renewable energy contributes to long-term sustainable growth by enhancing energy security and reducing environmental degradation
ENT has a direct positive effect (1.6) on ICRQ, suggesting that energy reforms promote better governance practices, transparency, and regulatory frameworks that strengthen government institutions.
GDP positively affects both ENT and ICRQ. Wealthier economies are more likely to invest in cleaner energy technologies and improve governance structures. This highlights the reinforcing relationship between economic prosperity and sustainable practices. GDP has a direct positive impact on both ENT and ICRQ, implying that wealthier economies are better positioned to finance clean energy projects and improve governance systems. This supports arguments in the literature (Sadorsky, 2010) that higher income levels drive renewable energy adoption.
ICRQ has a direct positive effect on ENT and CO₂ emissions. Strong governance supports the adoption of renewable energy by providing a stable regulatory environment and enforcing environmental standards.
The direct impact on CO₂ suggests that effective governance helps in reducing emissions through better policy enforcement and environmental management.
**Indirect Effects
ENT acts as a mediator between CO₂ emissions and GDP. While high CO₂ levels initially contribute to growth in carbon-intensive sectors, the adoption of ENT mitigates environmental degradation (-3.1*3.9) and fosters sustainable long-term growth by enhancing energy efficiency. ENT indirectly reduces CO₂ emissions as higher GDP enables investments in renewable energy infrastructure, driving cleaner economic growth.
ENT mediates the relationship between ICRQ and CO₂ emissions. Strong governance (ICRQ) encourages ENT adoption, which in turn reduces emissions.
ENT mediates the relationship between ICRQ and CO2 emissions. Strong governance (ICRQ) fosters ENT, which in turn reduces emissions, aligning with literature highlighting governance’s critical role in climate action (Acemoglu et al., 2012).
ENT also bridges the gap between GDP and institutional development, showing that investments in clean energy are linked to improved governance structures.
Improved governance indirectly supports economic growth by fostering ENT, which drives innovation, energy efficiency, and industrial competitiveness.
The results underscore the interconnected nature of CO2 emissions, ENT, GDP, and governance quality. The findings align with existing literature, reinforcing the idea that strong institutions and economic prosperity foster clean energy adoption, which in turn mitigates emissions and promotes sustainable development. Policymakers in developing countries should prioritize ENT and governance reforms to achieve long-term environmental and economic sustainability.
***Policy Implications
The findings underscore the necessity of integrated policies that simultaneously target clean energy adoption, governance strengthening, and economic growth.
International cooperation, capacity building, and financial incentives are essential to overcoming barriers to ENT adoption and reducing emissions.
These key insights highlight the complex dynamics between environmental sustainability, economic development, and governance reforms, offering valuable guidance for policymakers aiming to achieve sustainable development goals in developing countries.
6. Conclusions
The direct and indirect effects between CO₂ emissions (CO2), energy transition (ENT), economic growth (GDP), and the indicator of government quality (ICRQ), using a simultaneous equations model for the developing countries during the period (2000-2022).
The estimation results highlight the intricate relationships between CO₂ emissions, energy transition (ENT), economic growth (GDP), and government quality (ICRQ) in developing countries from 2000 to 2022. ENT emerges as a crucial driver of sustainable development, positively influencing economic growth and institutional quality while significantly reducing CO₂ emissions. However, the reliance on carbon-intensive industries in these economies underscores the need for decarbonization strategies. Strong institutional frameworks (ICRQ) foster ENT adoption and environmental regulations, demonstrating the importance of governance in climate action. Higher GDP levels facilitate clean energy investments but may initially exacerbate emissions.
To ensure sustainable development, policymakers must prioritize renewable energy adoption, strengthen institutional capacity, and implement carbon pricing mechanisms. International cooperation, financial support, and public-private partnerships are essential to overcoming barriers. By leveraging ENT and governance improvements, developing countries can foster a balanced approach to environmental protection and socio-economic progress.
The results underscore the critical role of strong governance and effective policymaking in driving the energy transition (ENT) and reducing CO₂ emissions in developing countries. Institutional quality (ICRQ) positively influences clean energy adoption and climate resilience by fostering transparent regulatory frameworks, enhancing policy enforcement, and promoting long-term strategic planning. Governments must prioritize building robust institutions that encourage investment in renewable energy while ensuring compliance with environmental regulations.
The findings also highlight the need for coordinated political efforts to establish incentive structures, such as subsidies for clean energy and carbon pricing mechanisms, to discourage reliance on fossil fuels. Strengthening political will through regional cooperation and international climate agreements is crucial to secure financial resources and technological expertise. Ultimately, political leadership and inclusive governance are vital for fostering a just and equitable energy transition that benefits vulnerable communities while ensuring national sustainability objectives.
Notes
| 1 |
Mtiraoui, A., (2024). Energy transition and sustainable development: Case of developing countries. Working Papers hal-04450499, HAL. |
| 2 |
Mtiraoui, A., et al. (2024). Institutional Quality and Economic Growth in the Energy Transition of MENA Countries. International Journal of Energy Economics and Policy, 14(6), 605–613. https://doi.org/10.32479/ijeep.16230
|
| 3 |
3. Kamau et al. (2023). Modeling and performance analysis of solar parabolic trough collectors for hybrid process heat application in Kenya’s tea industry using system advisor model. Sustainable Energy res. 10, 7. |
| 4 |
Gupta, N.et al. (2021) Data Quality Toolkit: Automatic assessment of data quality and remediation for machine learning datasets. Journal of Computer and Communications, Vol.10 No.5, arXiv preprint arXiv:2108.05935. |
| 5 |
Mtiraoui, A., et al. (2024). Institutional Quality and Economic Growth in the Energy Transition of MENA Countries. International Journal of Energy Economics and Policy, 14(6), 605–613. https://doi.org/10.32479/ijeep.16230
|
| 6 |
Sources des estimations tracées : Wu et al., 2005 ; Fleming et al., 2006 ; Hill et al., 2006, 2009 ; Beer et al., 2007 ; Wang et al., 2007 ; CONCAWE, 2008 ; Macedo et Seabra., 2008 |
| 7 |
Bersalli. G; and Simon. J; (2017), “Towards an energy transition in emerging countries: what incentive policies for renewable energies in the electricity sector in Argentina and Brazil? », Sustainable development and territories, Vol. 8, n°2.Pages 1-21. |
| 8 |
Kartal, K. et al. (2024). Renewable electricity generation and carbon emissions in leading European countries: Daily-based disaggregate evidence by nonlinear approaches. Energy Strategy Reviews. Volume 51, 101300. |
| 9 |
9. Mtiraoui, A. and Talbi, T., (2021). Institutional Quality, Fight Against Corruption, Energy Consumption and Economic Growth in the MENA Region. International Journal of Progressive Sciences and Technologies. Vol.26 N°, pp.77-88 |
| 10 |
Mtiraoui, A. (2024). Interaction between Migration and Economic Growth through Unemployment in the Context of Political Instability in the MENA Region. International Journal of Economics and Financial Issues, 14(1), 204–215. https://doi.org/10.32479/ijefi.15419. |
| 11 |
Mtiraoui, A. and Obeid, H. (2023): ‘‘Public Expenditure, Energy Consumption and Economic Growth in Tunisia During the Period of COVID-19: Comparative Study Between Cartographic Spatial Distribution Analysis and Empirical Validation’’. Technium Sustainability, 4, 45–71. https://doi.org/10.47577/sustainability.v4i.9596
|
| 12 |
Mtiraoui, A. (2020). Governance, Human Capital and Economic Growth in OECD countries: Applying the dynamic panel data (GMM). al-02528386 |
| 13 |
Mtiraoui, A. and al. (2004). The Energy Transition between Institutional Quality and Economic Growth: The Case of MENA Countries, Russian Law Journal, Vol. 12 No. 02, pp.60-73. |
References
- Aklin: M.; al. The political economy of energy access: Survey evidence from India on state intervention and public opinion. Energy Research & Social Science 2015, 10, 250–258. [Google Scholar]
- Ang, J.B. CO2 emissions, energy consumption, and output in France. Energy Policy 2007, 35, 4772–4778. [Google Scholar] [CrossRef]
- Bersalli. G; and Simon. J. Towards an energy transition in emerging countries: what incentive policies for renewable energies in the electricity sector in Argentina and Brazil? Sustainable development and territories 2017, 8, 1–21. [Google Scholar] [CrossRef]
- Boulhaga M, Bouri A, Elamer, A. and Ibrahim, A. Environmental, social and governance ratings and company performance: The moderating role of the quality of internal control. Corp Soc Responsib Environ Manag. 2023, 30, 134–145. [Google Scholar] [CrossRef]
- Bo Li and, al. Perspectives of energy transitions in East and Southeast Asia. In Wiley Interdisciplinary Reviews: Energy and Environment; Wiley Blackwell, 2020; Vol. 9(1). [Google Scholar]
- Broggio. The challenge of energy transition in the Brazilian Amazon. Electronic Journal in Environmental Sciences 2014, 14. [Google Scholar] [CrossRef]
- Cho C., H. and al. (2014). An environment Kuznets curve for GHG emissions: a panel cointegration analysis. Economics, Planning, and Policy, 2.
- Deshaies, M. (2014). Ambiguities and limits to the energy transition in Germany. Energy transition. Vol. 14, N° 3. https://doi.org/10.4000/vertigo.15515. [CrossRef]
-
Grossman and Krueger, (1995). Economic Growth and the Environment. The Quarterly Journal of Economics, 2.
- Ishida, H. (2015). The effect of ICT development on economic growth and energy consumption in Japan. Telematics and Informatics, 1.
- Kais, S. and Ben Mbarek M. (2017). Dynamic relationship between CO2 emissions, energy consumption and economic growth in three North African countries. International Journal of Sustainable Energy.
- Kartal, K.; et al. (2024). Renewable electricity generation and carbon emissions in leading European countries: Daily-based disaggregate evidence by nonlinear approaches. Energy Strategy Reviews. Volume 51, 101300. Doi.org/10.1016/j.esr.2024. 1013. [Google Scholar]
-
Kaufmann D, Kraay, A. and Mastruzzi, M. (2010). The Worldwide Governance Indicators: Methodology and Analytical Issues. World Bank Policy Research Working Paper.
- Kamau, *!!! REPLACE !!!*; et al. (2023). Modeling and performance analysis of solar parabolic trough collectors for hybrid process heat application in Kenya’s tea industry using system advisor model. Sustainable Energy res. 10, 7.
- Kuznets, S. (1955). Economic Growth and Income Equality. American Economic Review, 1.
- Lejoux, P. and Ortar, N. (2014). La transition énergétique : vrais enjeux, faux départs ?. SHS Web of Conferences 9, 01001. [CrossRef]
- Mtiraoui, A. and Snoussi, A. (2024). Analysing the Nexus Between Economic Growth, Institutional Dynamics and Environmental Sustainability in the MENA region post-COVID-19. Russian Law Journal, 1195. [Google Scholar]
- Mtiraoui, A. (2024). The action of public power between digital evolution and the need for energy consumption: What effects on the economies of the MENA region. Working Papers,. [CrossRef]
- Mtiraoui, A. (2024). Energy transition and sustainable development: Case of developing countries. Working Papers,.
- Mtiraoui, A. (2024). Interaction between Migration and Economic Growth through Unemployment in the Context of Political Instability in the MENA Region. International Journal of Economics and Financial Issues. [CrossRef]
- Mtiraoui, A. and Obeid, H. (2023). Public Expenditure, Energy Consumption and Economic Growth in Tunisia During the Period of COVID-19: Comparative Study Between Cartographic Spatial Distribution Analysis and Empirical Validation. Technium Sustainability. [CrossRef]
- Mtiraoui, A. and al. (2021). Institutional Quality, Fight Against Corruption, Energy Consumption and Economic Growth in the MENA Region. International Journal of Progressive Sciences and Technologies. /: 2, pp.77-88. https, 3073; 2. [Google Scholar]
- Mtiraoui, A. , (2024). Energy transition and sustainable development: Case of developing countries. Working Papers hal-04450499.
- Mtiraoui, A. and al. (2004). The Energy Transition between Institutional Quality and Economic Growth: The Case of MENA Countries, Russian Law Journal, Vol. 12 No. 02, pp.60-73.
- Mtiraoui, A. , et al. ( 14(6), 605–613. [CrossRef]
- Osabuohien E., S. , Efobi U. R. and Gitau C. M. W. (2014). Beyond the environmental, Kuznets curve in Africa: evidence from panel cointegration. Journal of Environmental Policy & Planning. 517–538.
-
Panayotou (1997). Demystifying the environmental Kuznets curve: turning a black box into a policy tool Environment and Development Economics. The environmental Kuznets curve.
- Pellegrin, L. and Gerlach, R. (2006). Corruption and Environmental Policies: what are the implications for the enlarged EU? European Environment; 16(3);
- Quintyn, M. G. and Gollwitzer, S. (2009). North-Wallis-Weingast Doorsteps Framework. International Monetary Fund. [CrossRef]
-
Remigijus C, Streimikiene; D. and Kazimieras Z; 2008. The use of the environmental Kuznets curve: environmental and economic implications. International Journal of Environment and Pollution.
- Sovacool &, al. (2015). Integrating social science in energy research. Energy Research & Social Scienc Vol. 6: pp. 95-99. [CrossRef]
- Sachs, J. (2015). The Age of Sustainable Development. Journal of Economic Literature, 3.
- Sekrafi, H. and Sghaier,A. (2018). The effect of corruption on carbon dioxide emissions and energy consumption in Tunisia, PSU Research Review.Vol. 2 No. 1,;pp. 81-95 DOI 10. 1108. [Google Scholar]
- Vanderheiden, S. (2008). Atmospheric Justice: A political Theory of Climate Change. [CrossRef]
-
Xiaozi Liu, Gerhard K. Heilig, Junmiao Chen and Mikko Heino. (2007). Interactions between economic growth and environmental quality in Shenzhen, China’s first special economic zone. Ecological Economics 62:3-4, 559-570.
|
Disclaimer/Publisher’s Note: The statements, opinions and data contained in all publications are solely those of the individual author(s) and contributor(s) and not of MDPI and/or the editor(s). MDPI and/or the editor(s) disclaim responsibility for any injury to people or property resulting from any ideas, methods, instructions or products referred to in the content. |
© 2025 by the authors. Licensee MDPI, Basel, Switzerland. This article is an open access article distributed under the terms and conditions of the Creative Commons Attribution (CC BY) license (http://creativecommons.org/licenses/by/4.0/).