Preprint
Article

This version is not peer-reviewed.

Impact of High-Frequency Distributed Parametric Cable Model and Motor Terminal Overvoltage in SiC-Based Drives

Submitted:

16 February 2025

Posted:

18 February 2025

You are already at the latest version

Abstract

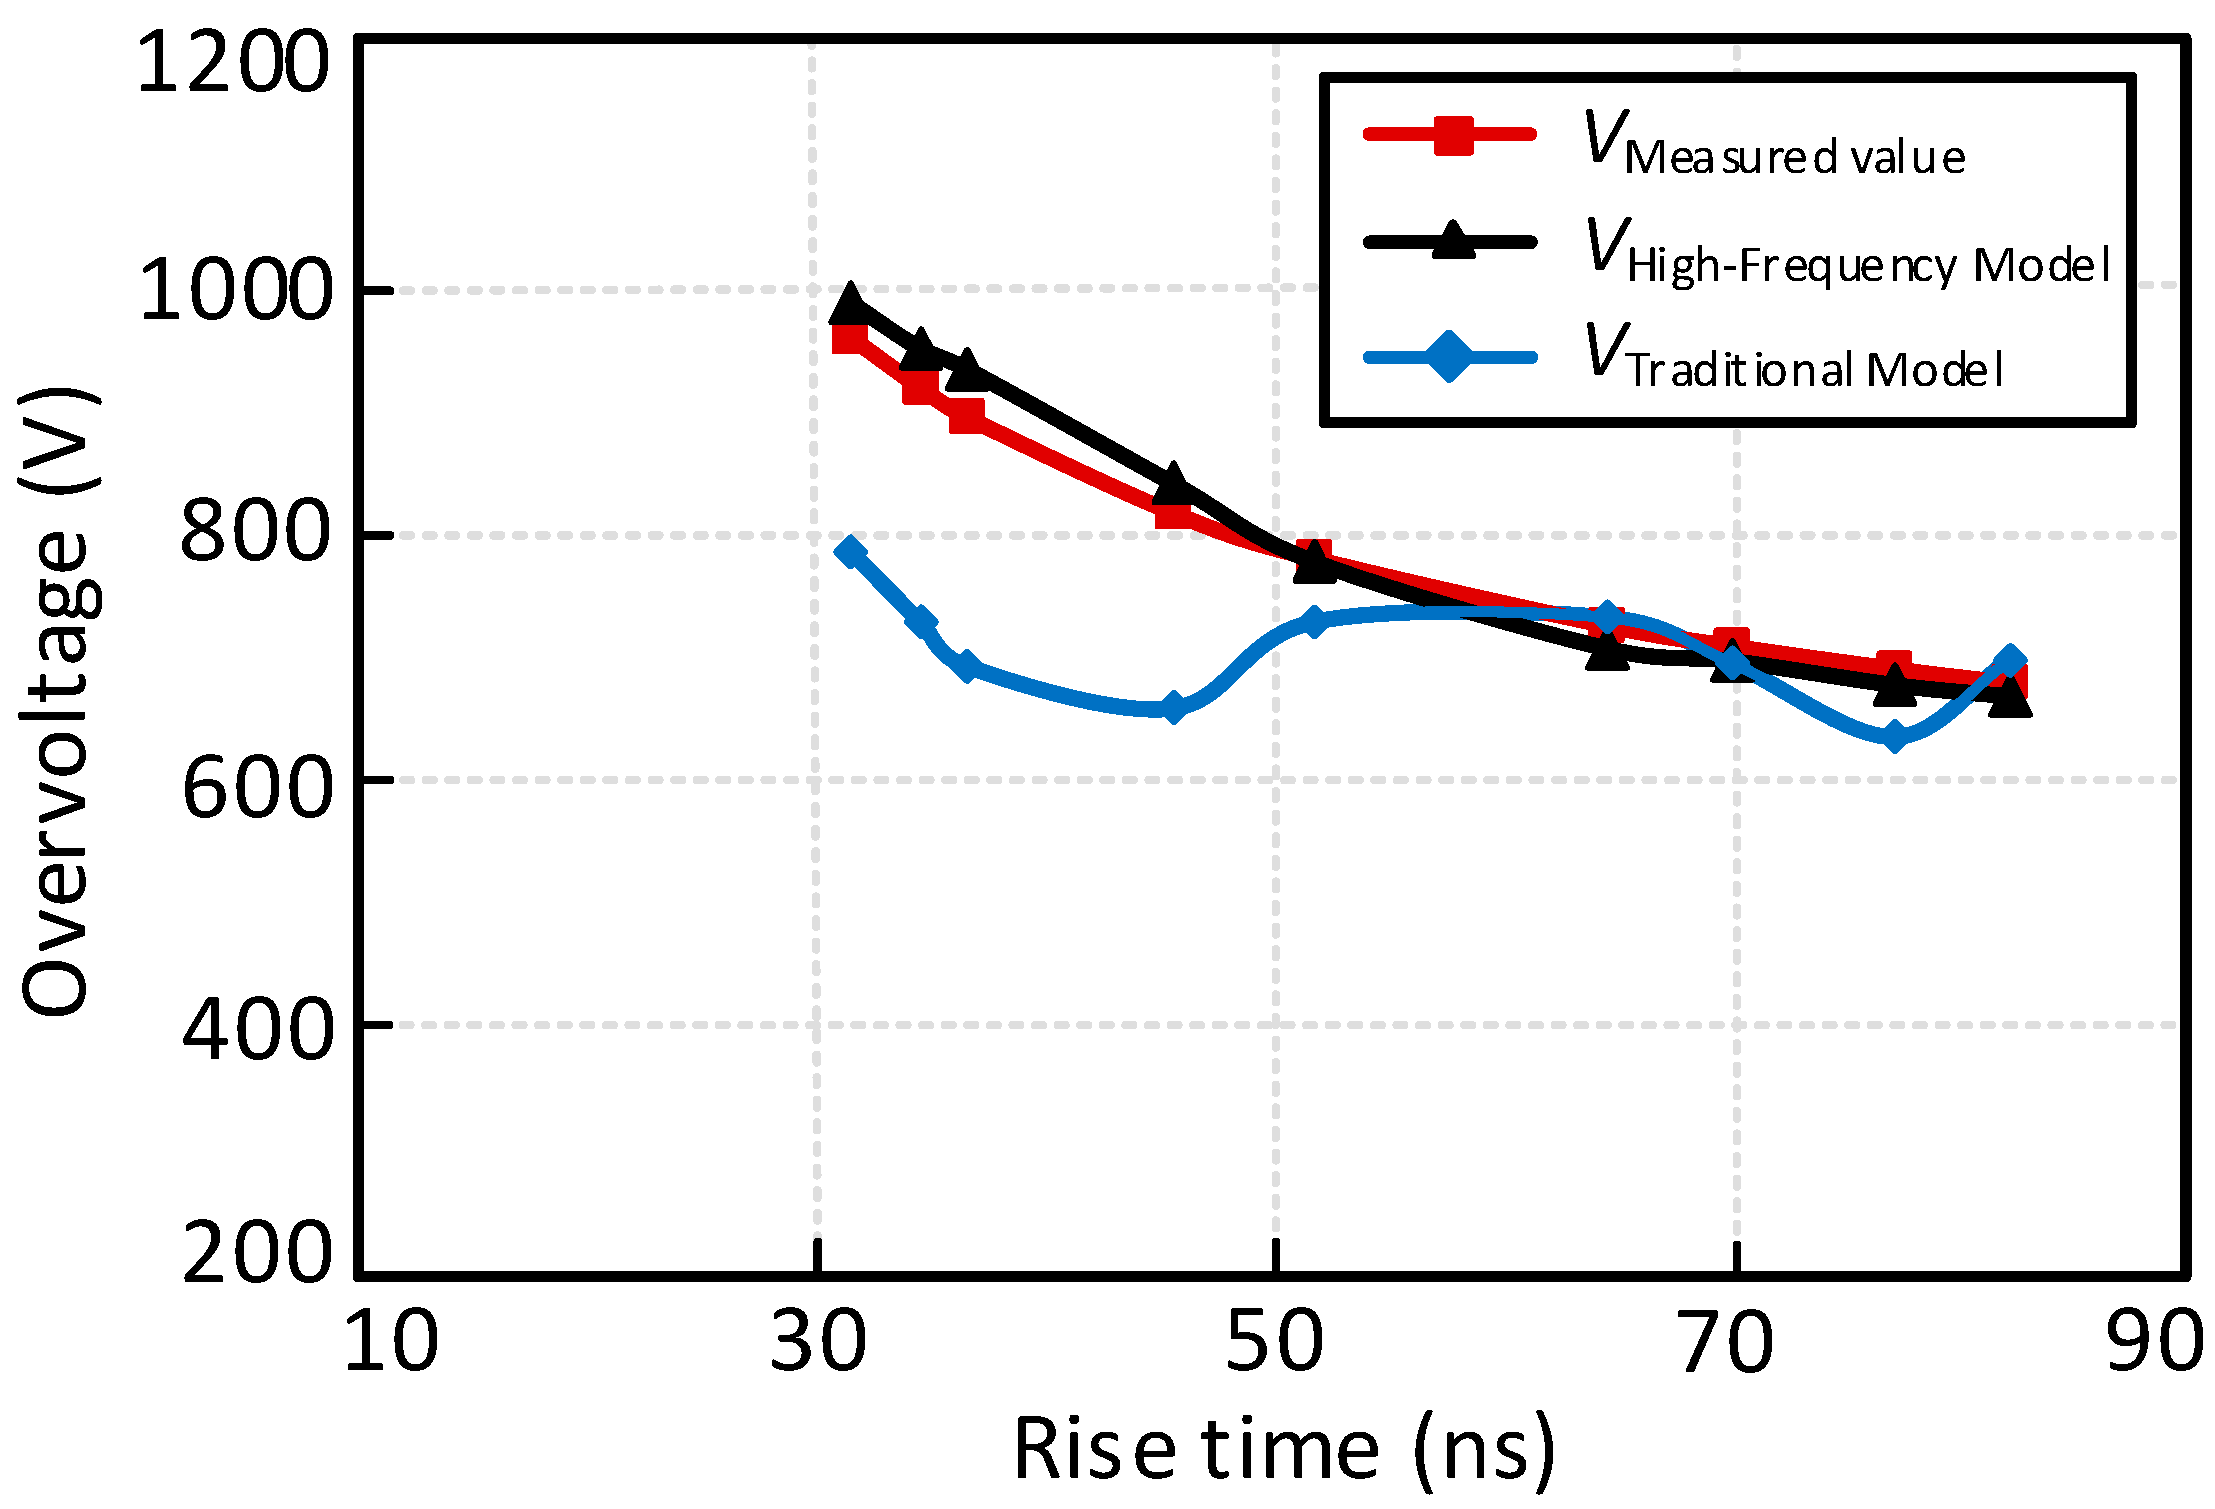
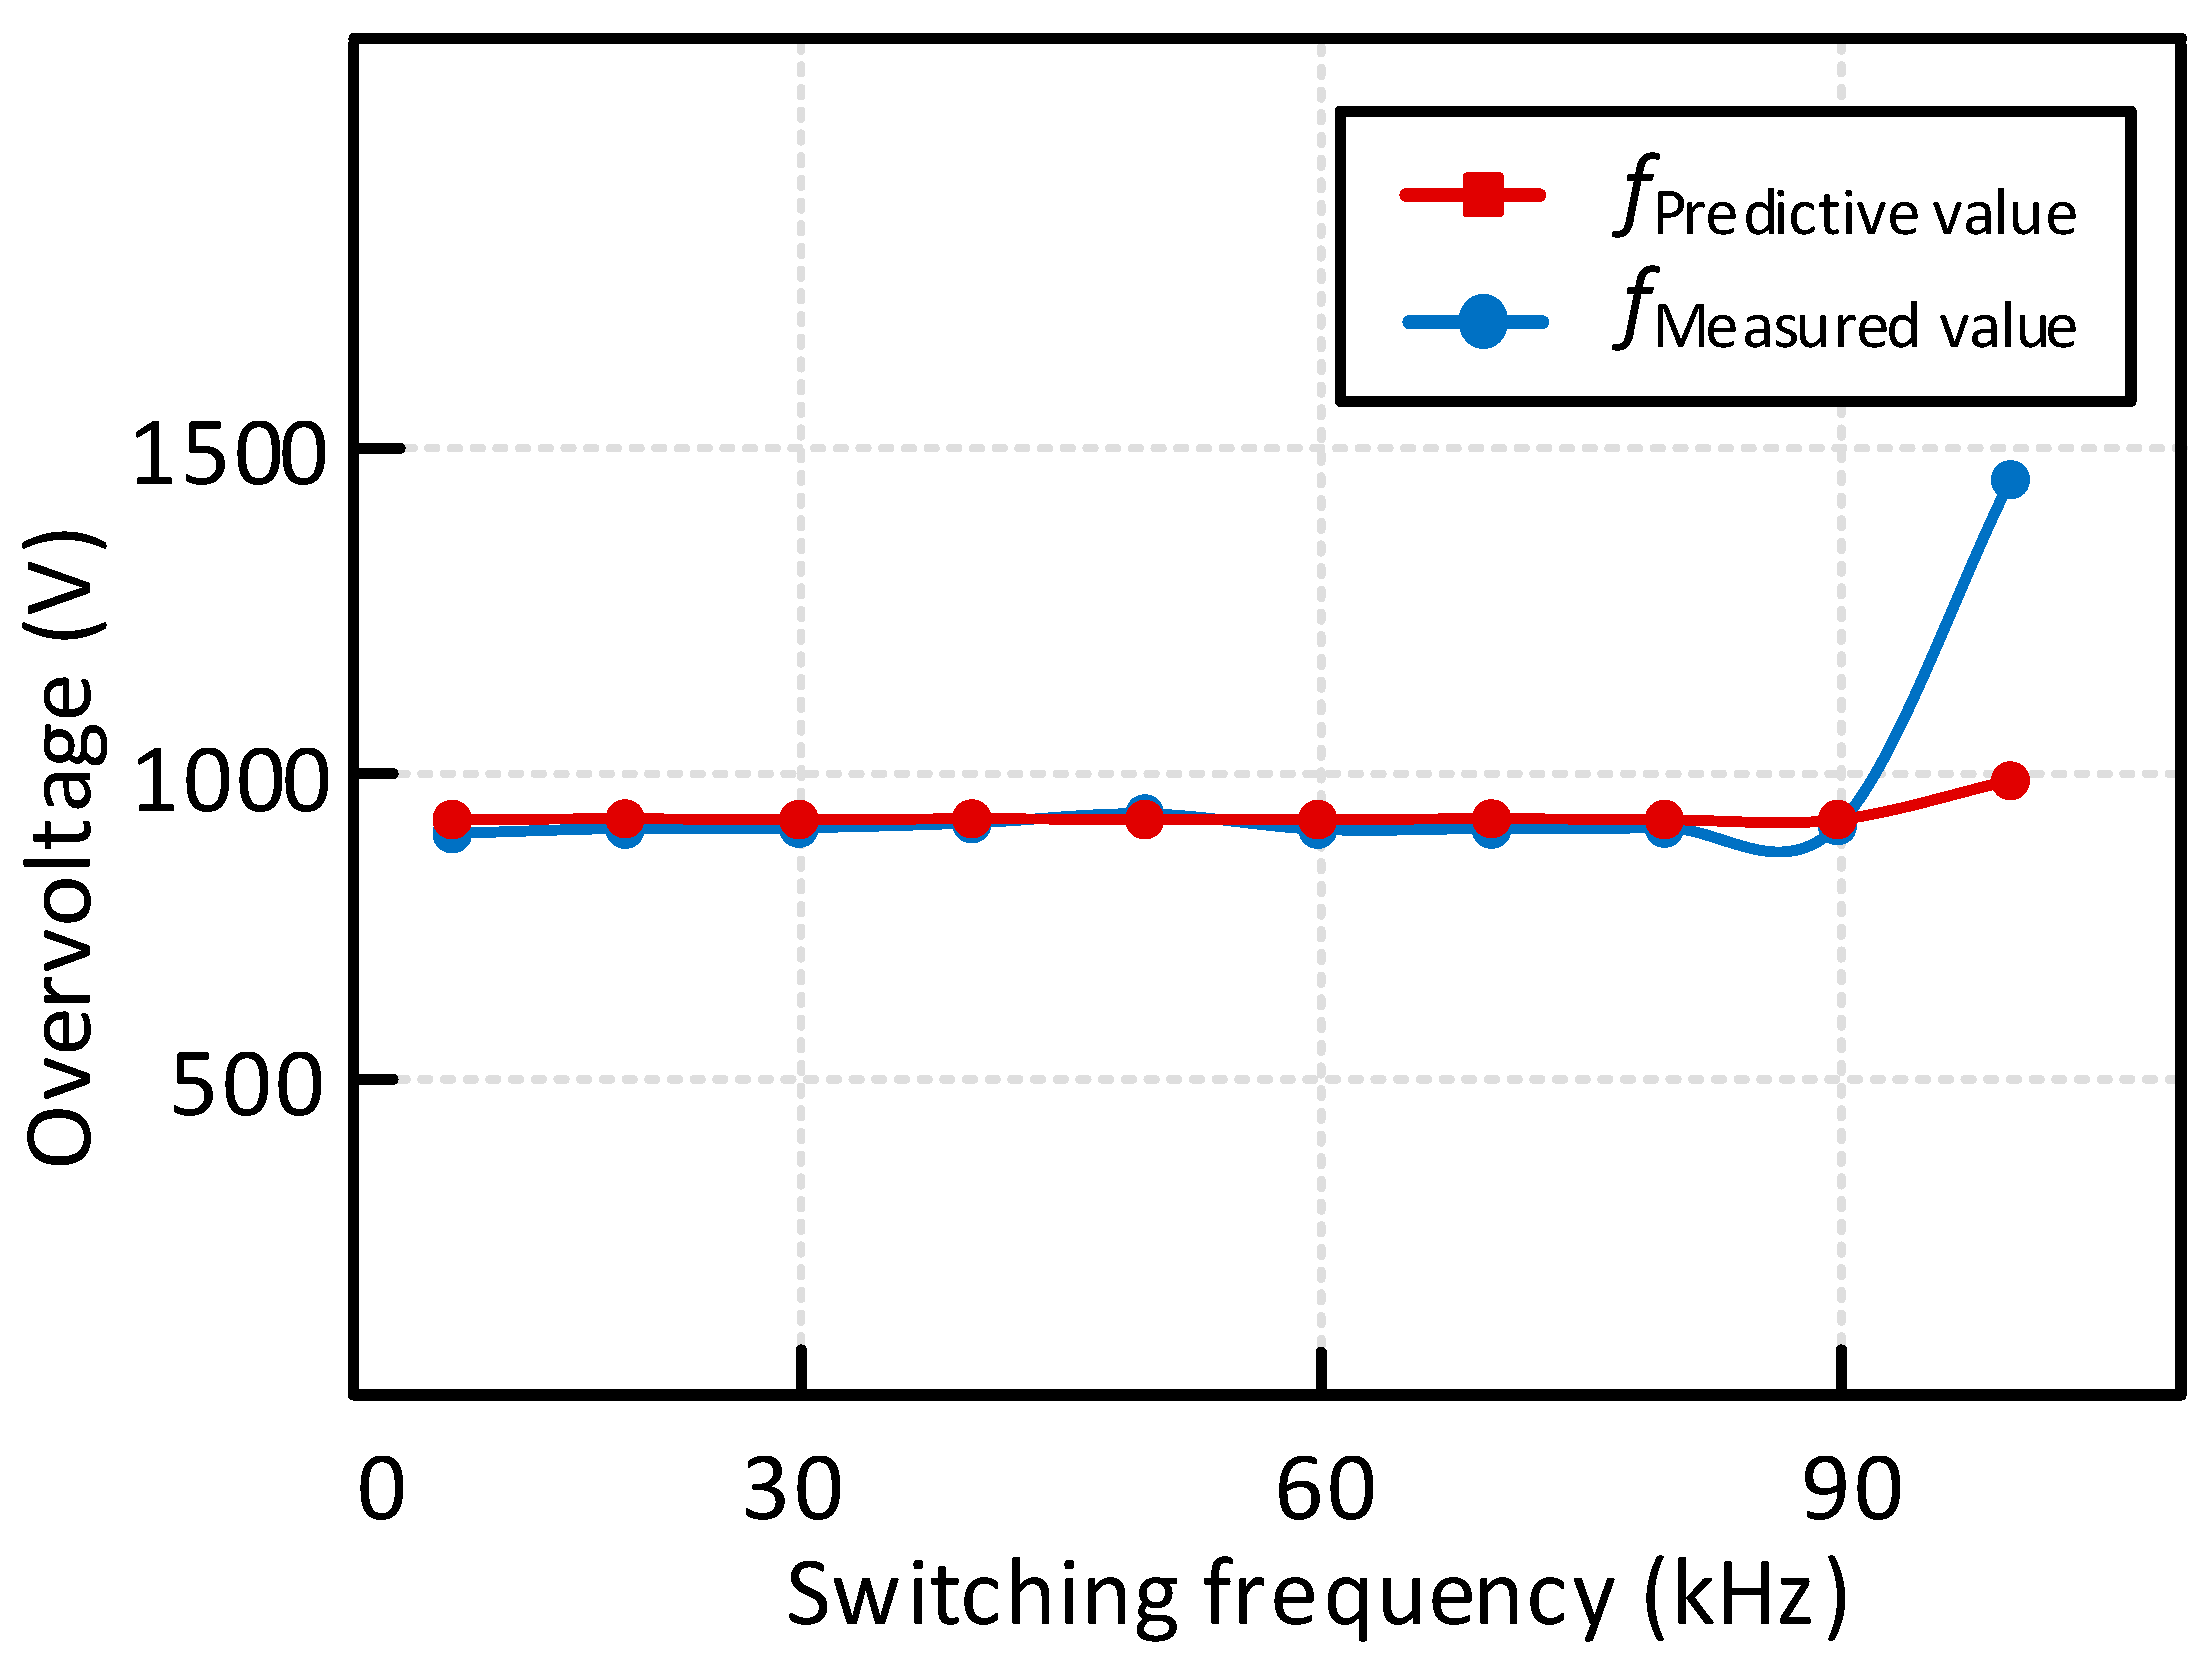
Silicon carbide (SiC) devices are characterized primarily by their high switching frequencies and rapid switching speeds. However, these faster switching speeds result in elevated voltage change rates (dv/dt), which in turn induce overvoltage at motor terminals. This overvoltage phenomenon places significant stress on motor winding insulation and bearings. In order to more accurately predict the overvoltage phenomenon of the inverter-cable-motor systems employing fast-switching SiC devices. This paper proposes a novel high-frequency cable modeling method for SiC drive systems, based on parameter fitting. This model is constructed using cable physical parameters obtained through impedance analyzer measurements. This approach offers advantages over existing high-frequency models, including simplified parameter extraction and accelerated computer simulation times. To validate the model's accuracy, we compare its predicted results against actual experimental measurements. The study further investigates the impact of cable length and voltage rise time on motor overvoltage (SiC system), utilizing both the proposed model and experimental verification. Experimental outcomes demonstrate that our high-frequency distributed parameter cable model accurately predicts motor overvoltage in SiC inverter systems. This research contributes to the analyzing and predicting of overvoltage issues in high-frequency switching environments, improving the reliability and performance of SiC-based motor drive systems.

Keywords: 
;  ;  ;  

1. Introduction

Due to the superior characteristics and commercial availability, silicon carbide (SiC) devices are gradually finding their applications. Compared to silicon (Si) counterparts, SiC devices have faster switching speed (shorter switching time), higher voltage blocking capability and higher temperature performance [1,2]. The switching frequency of hard-switched SiC inverters can reach 100kHz and the rise time of the switching voltage pulse can be only 10s of nanoseconds [3]. In contrast, the switching frequency of Si IGBT inverters is normally below 20kHz and the switching time is in the order of several hundred nanoseconds. Higher switching frequency can reduce the filtering components and the faster switching speed can reduce the switching loss hence the cooling requirement [4,5]. The adoption of SiC devices in motor drive systems can improve higher power density and efficiency, which is favored in applications such as more electric aircraft, electric vehicle, etc. The basic structure of an inverter-fed AC motor drive system with connecting cables is shown in Figure 1.
To protect motor winding insulation, the slew rate of the motor input voltage is suggested to be limited to 500V/μs by the standard, i.e. MG1 of National Electrical Manufacturers Association (NEMA) for general motor [6]. In [7], the switching behaviors of a 1700V, 50A SiC MOSFET are tested and analyzed. The dv/dt of the output voltage exceed 36kV/μs with a 5Ω gate resistance. The very high dv/dt will lead to overvoltage at motor terminals, which will have clear negative effects on the motors, e.g. causing motor winding insulation and bearing failure [8]. Furthermore, under higher frequencies, the overvoltage at motor terminals will be unevenly distributed among the winding turns, where the first several turns will bear most of the overvoltage during the transient of the PWM pulse, causing higher stress for the first several turns [9].
To analyze the above issues, suitable models need to be developed to analyze the negative effects of fast-switching SiC converters on motors, especially the overvoltage phenomenon. Motor terminal overvoltage need to be considered for selecting system configuration, filter design and selecting the insulation grade. The main factors affecting the motor overvoltage are the rise time of the inverter output voltage pulses, the length of the cable connecting the inverter and the motor, and the impedance mismatch between the characteristic impedance of the cable and the motor [10]. Due to the sharp edges of SiC inverter output voltages, the critical cable length for inducing overvoltage (voltage doubling) will be much shorter compared with that using relatively slow Si IGBT inverters. In other words, for similar conditions, the motor will experience higher overvoltage when the motor is driven by a SiC MOSFETs inverter.
At present, there are a few studies focusing on the negative effects of wide bandgap (WBG) devices on motors. In [11], the reflected wave phenomenon with gallium nitride (GaN) HEMTs, SiC MOSFETs and Si MOSFETs are studied and compared. It is found that the motor overvoltage is more likely to happen under shorter rise time of the inverter output voltage. However, the main factors affecting the motor overvoltage with a cable connected to an AC motor and a SiC inverter is not studied in detail. The motor overvoltage using SiC MOSFETs under different length of cables is studied in [12,13]. As a conclusion, the motor overvoltage (smaller than twice the DC input voltage (<2Vdc)) can occur with 2.3 meters-23 meters of cable length due to SiC MOSFETs short rise time. But in these papers, the effect of different rise times (10s of nanoseconds) on motor overvoltage are not studied in detail.
In order to analyze the motor overvoltage at high frequencies systematically and accurately, a high-frequency cable model needs to be established [14,15]. Regarding cable modelling, the distributed parameter model provides more accurate results than the lumped parameter model for the high-frequency behavior [16]. Long cable models for analyzing the motor overvoltage phenomenon have been widely studied [17,19]. The traditional multiple π-section model was proposed in [17,18] and the lossy transmission line model was also intensively studied in [20]. However, these traditional lumped cable models cannot predict the motor overvoltage with SiC system accurately and the parameters of these models are set to be constant. In other words, these models are frequency independent. To address the frequency-dependent parameters, a RL-ladder circuit is added into the cable equivalent circuit to represent the skin effect, etc [21]. This method could match the high frequency characteristics of the cable given the impedance of the RL-ladder circuit is frequency dependent. However, the number of the ladder branch and the number of cells of unit length will influence the accuracy of the prediction, so appropriate cells and branches are important in the ladder model and the computation time is a concern under high number of cells and branches to address the high frequency behavior. [22] extracted the cable parameters by using an open and short circuit testing method (low frequency excitation), and the cable model with low frequency response is stablished.
This paper quantitatively analyzes the factors influencing the motor overvoltage by the wave reflection theory when using SiC inverters. A high-frequency distributed parameter model of the cable is established, and the cable impedance is modeled as frequency dependent. The model parameters can be simply obtained by measurement using an impedance analyzer. This model can accurately predict the overvoltage for the SiC inverter-cable-motor system. The influencing factors including rise time and cable length on motor overvoltage with SiC inverter are studied in detail. This paper aims to provide a timely reference for analyzing and understanding the negative effects of fast-switching SiC inverters regarding motor voltage.

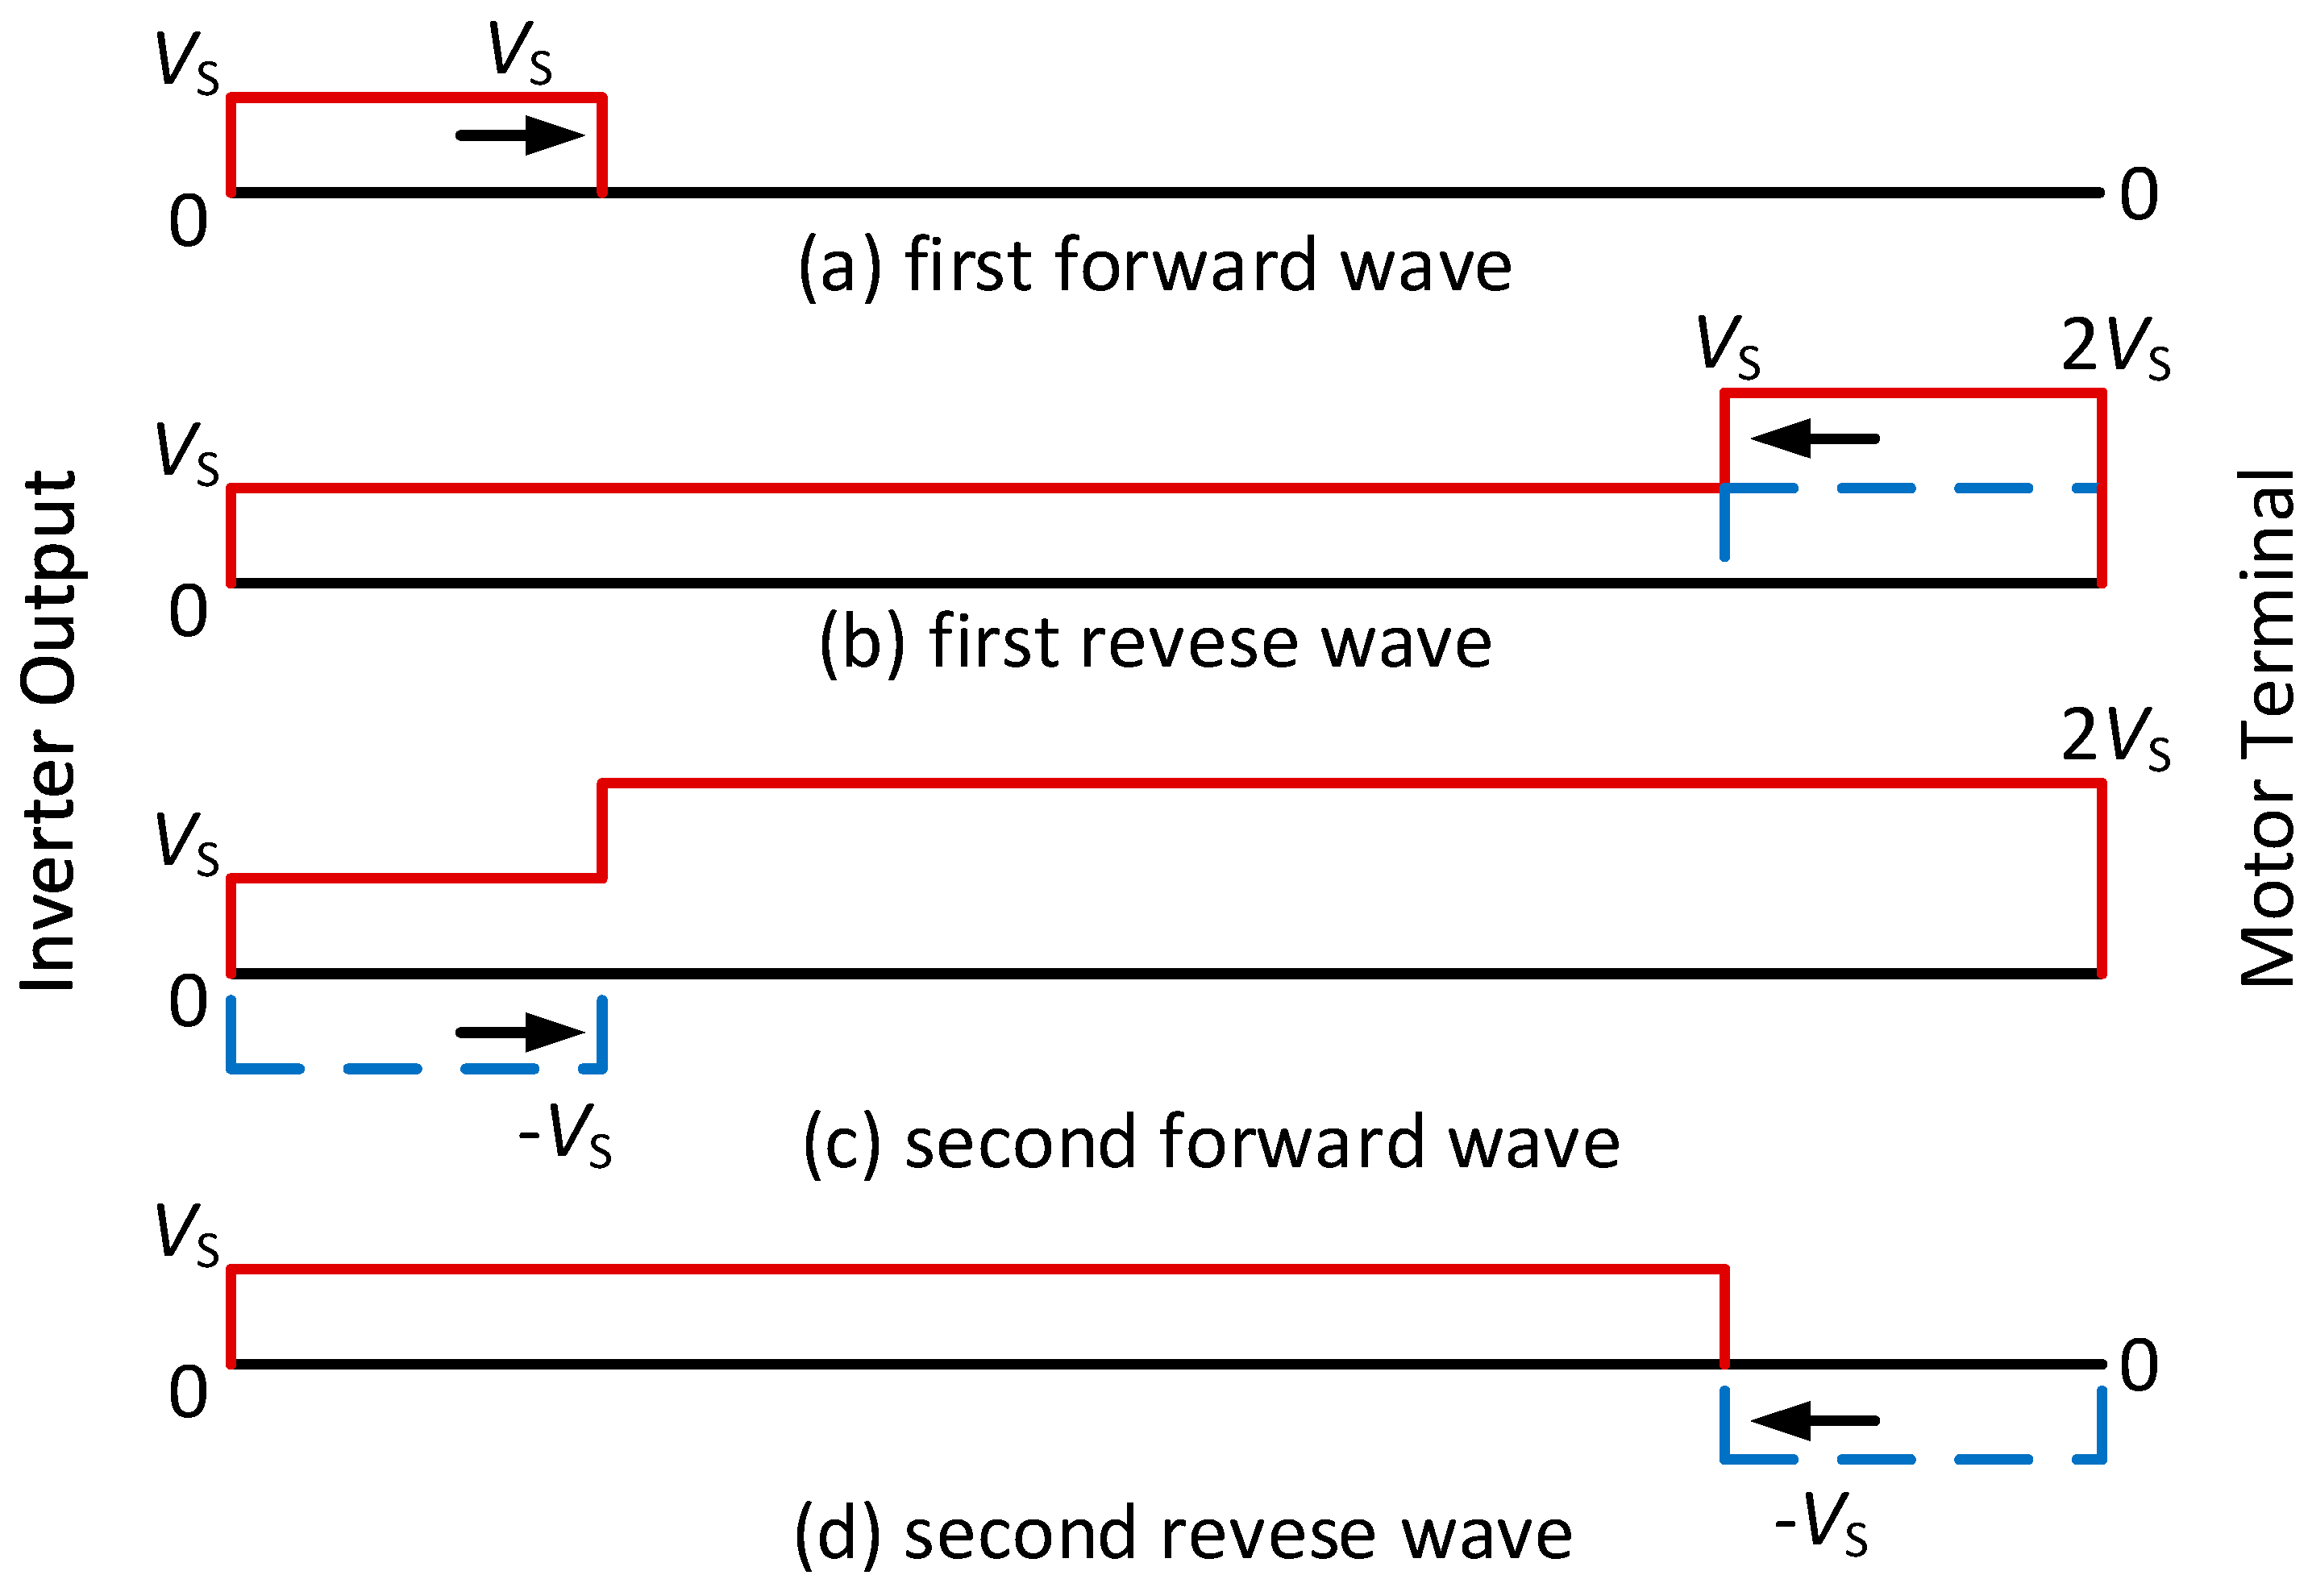
2. Wave Reflection Theory for Overvoltage Prediction

The structure of a variable speed motor drive system is shown in Figure 1. The inverter is connected with the motor through the cable (inverter-cable-motor system). In this topology, there are three main factors influencing the overvoltage on the motor, which are the cable length, the rise time of inverter output voltage pulses, and the characteristic impedance mismatch between the cable and the motor. Figure 2 shows a measured example of the motor overvoltage, where the SiC MOSFET inverter output voltage (VInverter) is a square wave (600V) and there is obvious overvoltage and oscillations at the motor terminal (VMotor). It can be seen from Figure 2 that when the inverter dc-link voltage Vdc is 600 V, the peak phase-to-phase (line) voltage of the motor can reach as high as 920V. It should be noted that the cable length is 2 meters in this test.
Figure 3 shows the reflection process of a traveling wave in the cable [23]. Figure 3(a) shows the voltage pulse traveling from the inverter output to the motor terminal which is called the first forward wave. Figure 3(b) shows the reflection of the first forward wave (VS) after arriving at the motor terminal. The motor terminal reflection coefficient is approximately equal to one since the load impedance of the motor is much higher than the impedance of the cable. The first forward wave will generate a traveling wave with the same amplitude (+VS) from the motor terminal back to the inverter output, which is called the first reverse wave. If the reflection coefficient is equal to one and the cable is long enough, the peak value of the voltage at the motor terminal is the superposition of the forward and reverse wave, presenting twice VS (voltage doubling). The motor overvoltage magnitude will be less than 2 Vs with smaller reflection coefficient and shorter cable length. Figure 3(c) shows the second forward wave from the reflection of the first reverse wave at the inverter side. The inverter can be seen as a short circuit where the inverter can be modelled as a voltage source. Therefore, the reflection coefficient of the inverter output is -1. Hence, the first reverse wave will generate a traveling wave with the amplitude of -VS from inverter output back to the motor terminal, which is called the second forward wave. Figure 3(d) shows the motor voltage drops to 0 with the superposition of the second forward wave and second reverse wave. A forward wave will reflect three times in a cycle and then reduce to 0 by the wave reflection theory. Actually, a forward wave will reflect many times in a cycle which induces the voltage oscillation and then reduce to 0, since the reflection coefficient is less than 1.
For long cables, the forward wave will generate a reflection wave after arriving at the motor terminal and the magnitude will be scaled by the reflection coefficient. However, the motor overvoltage is affected by the rise time of inverter output voltage with shorter cables. The transmission of the traveling waves along the cable from the inverter output to the motor terminal takes time, which is defined as tt. Also, the voltage pulse has a rise time of tr. The motor overvoltage only occurs when tr is less than the propagation time tt. It can be seen from Figure 3 that the voltage pulse has reflected through the cable three times in a cycle. Hence the motor terminal overvoltage peak (Vpeak) can be given by (1) and (2) respectively according to the relationship between the propagation time tt and 1/3 of the rise time tr [23].
V p e a k = V d c · N + V d c   ,   t t > t r 3
V p e a k = 3 · l · V d c · N v · t r + V d c ,   t t < t r 3
where Vdc is the magnitude of the forward wave and is equal to the inverter dc-link voltage, l is the cable length, v is the pulse velocity in the cable, N is the reflection coefficient at the motor terminal which can be expressed as the function of the cable impedance (Zc) and the motor impedance (Zm) as shown in (3) and (4).
N = Z m Z c Z m + Z c
Z c = L 0 c 0
In (4), L0 and Co are inductance and capacitance of per unit cable length, respectively.
However, the cable impedance Zc is closely related to the cable length, structure, material and parasitic parameters. Hence, it was found that Zc is a relatively constant value with a 2m 3 core XLPE cable, around 62Ω. The value of the motor impedance Zm can be approximated according to empirical formula (around 3500Ω for a 7.5kW motor) [24]. It should be noted that this traditional formula cannot describe the frequency response of the cable-motor model. In other words, the impedance calculated by this formula cannot represent the true impedance value under high-frequency excitation.
The voltage pulse propagation time (tt) can be expressed as the function of l and v as shown in (5).
t t = l v
The pulse propagation velocity (v) relates to the inductance (Lc) and capacitance (Cc) of per unit cable length [25]. Besides, the pulse propagation velocity can also be defined as a function of the permeability (µ) and permittivity (ε) of the dielectric material between conductors [26]. Hence, v can be expressed as (6).
v = 1 L c C c = l μ ε
It can be seen from (1) that the inverter is more likely to generate double overvoltage (2 Vdc) when the tr is less than 3 times of tt. Submitting (5) into (2), the ratio of 3 tt to tr is going to be less than 1 when tr > 3 tt as (7).
V p e a k = 3 · t t · V d c · N t r + V d c ,   t t < t r 3
Therefore, the motor overvoltage will reduce significantly when the rise time of the voltage pulse is longer. In other words, the motor overvoltage will be less than twice Vdc because of the longer rise time. Compared to Si IGBT inverters, the motor overvoltage using SiC MOSFETs inverters is higher due to the shorter rise time. Figure 4 shows an example where the motor overvoltage under a SiC MOSFET inverter and a Si IGBT inverter is compared. As seen, the motor overvoltage reaches 960V with the inverter SiC and a dc-link voltage of 600V. In contrast, with the Si IGBT inverter, there is very little overvoltage. A 2 meters cable is adopted in these two systems and the rise time for the SiC MOSFET inverter is 34ns versus 400ns for the Si IGBT inverter. Therefore, the motor overvoltage with the SiC inverter is more serious compared to the Si IGBT inverter with the same short cable.
Table 1 shows the rise time and the corresponding cable critical length for inducing the double voltage, which is calculated according to (2). The critical cable length reduces with the decrease of the rise time. As seen, for a typical rise time of 40ns of the SiC MOSFETs, the critical cable length is only 1.84m, which is much shorter than that with Si IGBTs (rise time 100 ~400ns), which is normally longer than 10m. Using Table 1, the cable length can be preliminary adjusted according to the rise time to reduce the magnitude of overvoltage where possible.
However, the amplitude of the motor overvoltage cannot be accurately calculated with SiC device system by (2). Figure 5 shows the ratio between motor terminal voltage (VM) and inverter output voltage (VDC) with various rise times measured in experiment and calculated using equation (2). As seen, the overvoltage reduces with the increase of rise time. Although the trend of the measure overvoltage ratio agrees with the that calculated from (2), there are clear differences in the magnitude. This is because the inaccuracy Zc for calculating equation (2) and (3), where the high frequency excitation could affect the impedance of the cable. In order to accurately predict the motor terminal overvoltage with the SiC inverter, it is necessary to establish a suitable cable model at high frequencies rather than approximately calculating the impedance of the cable by (4).

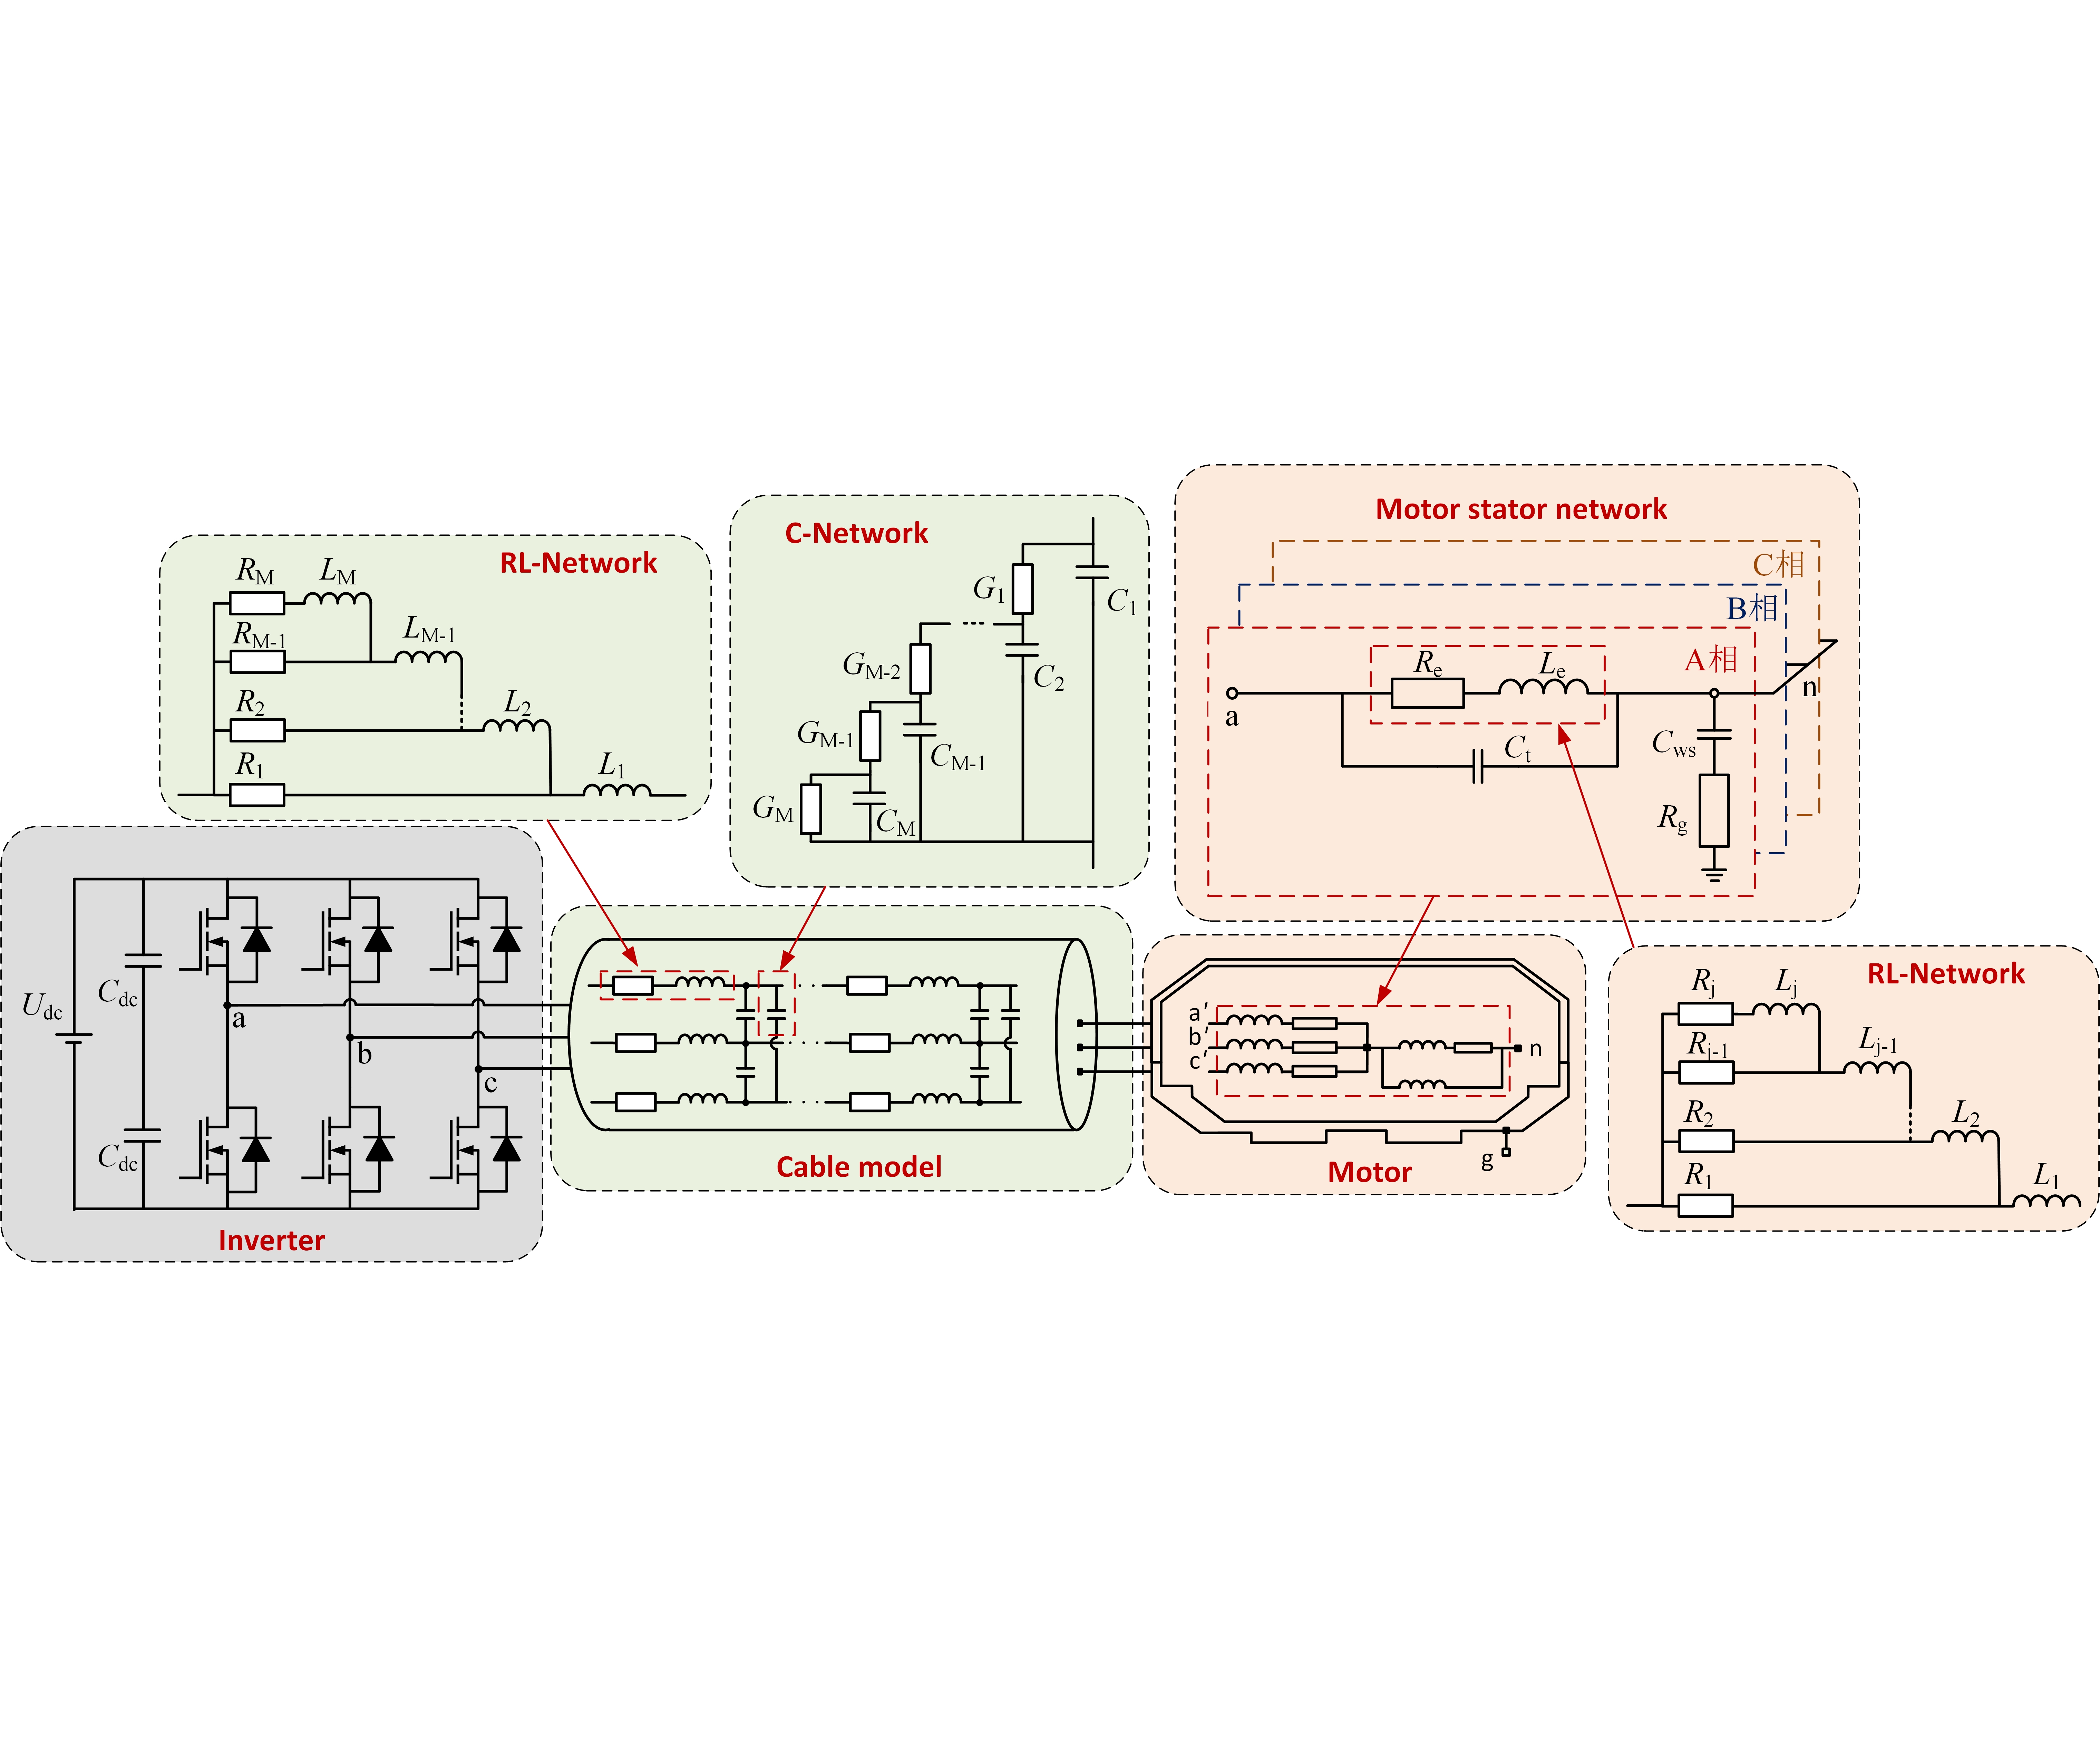
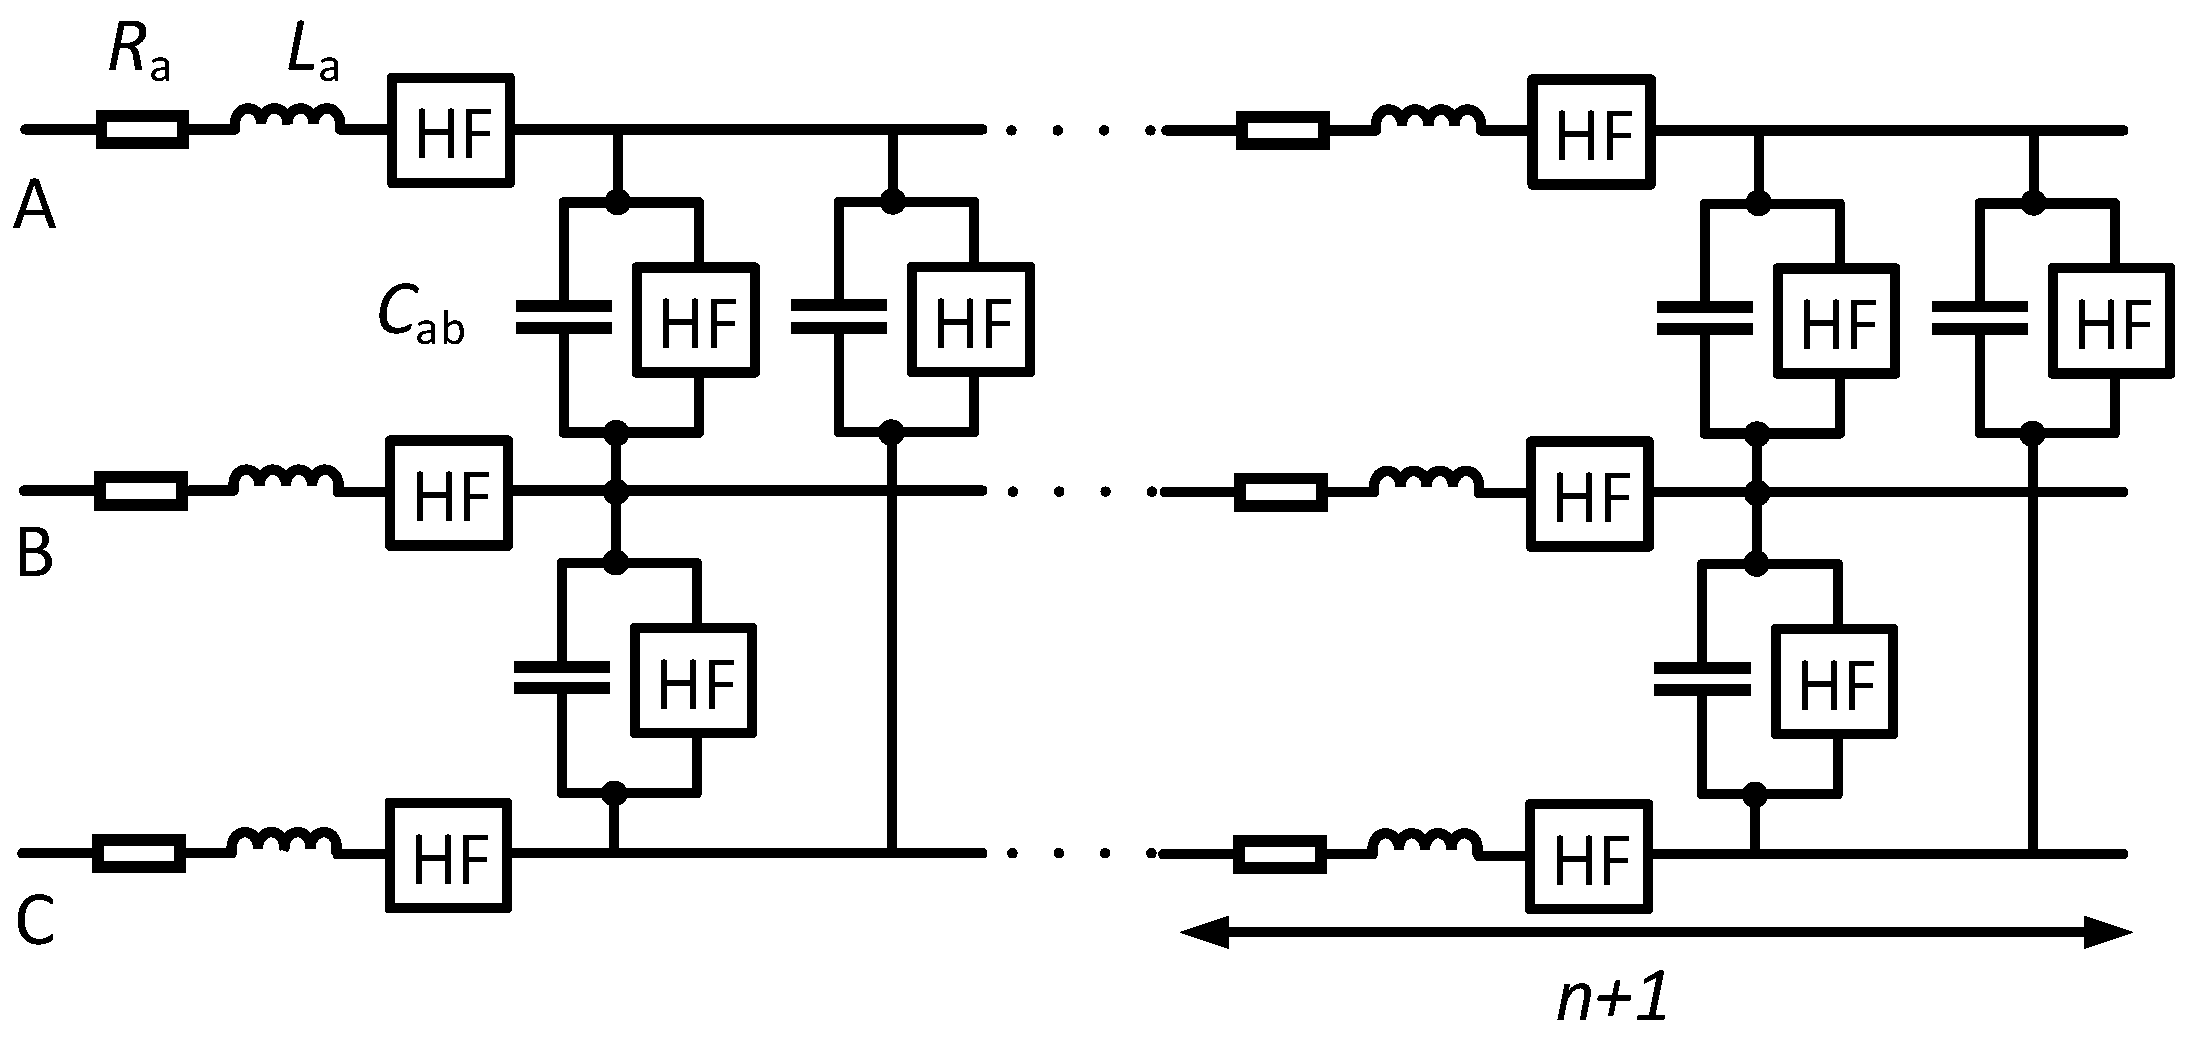
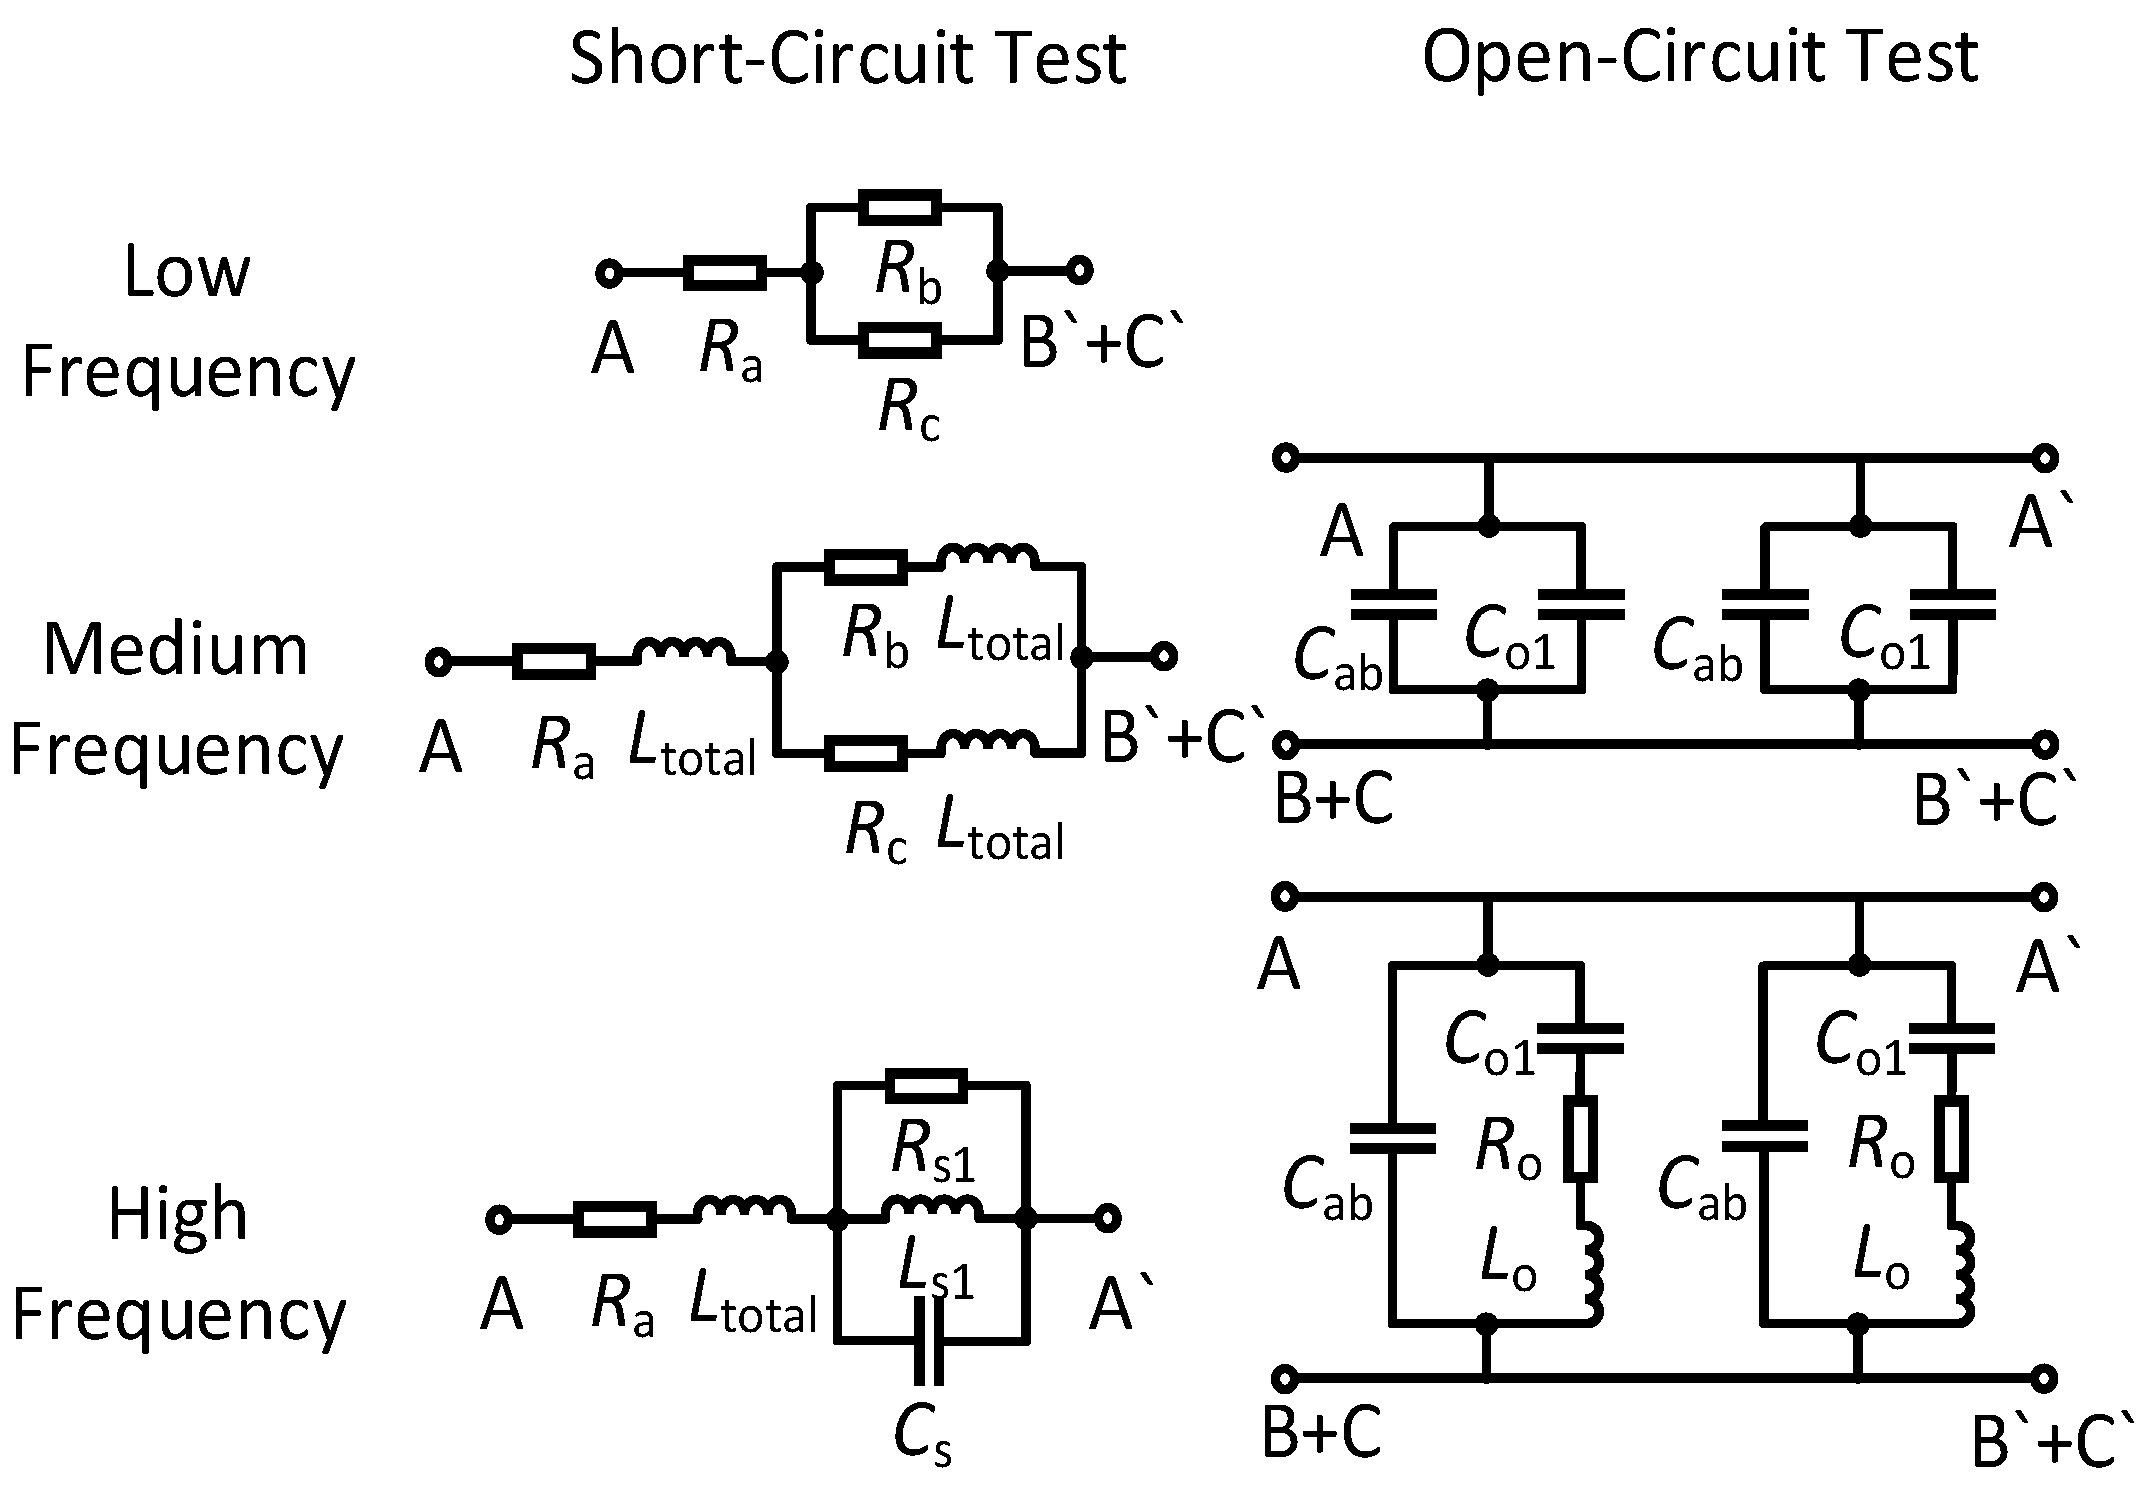
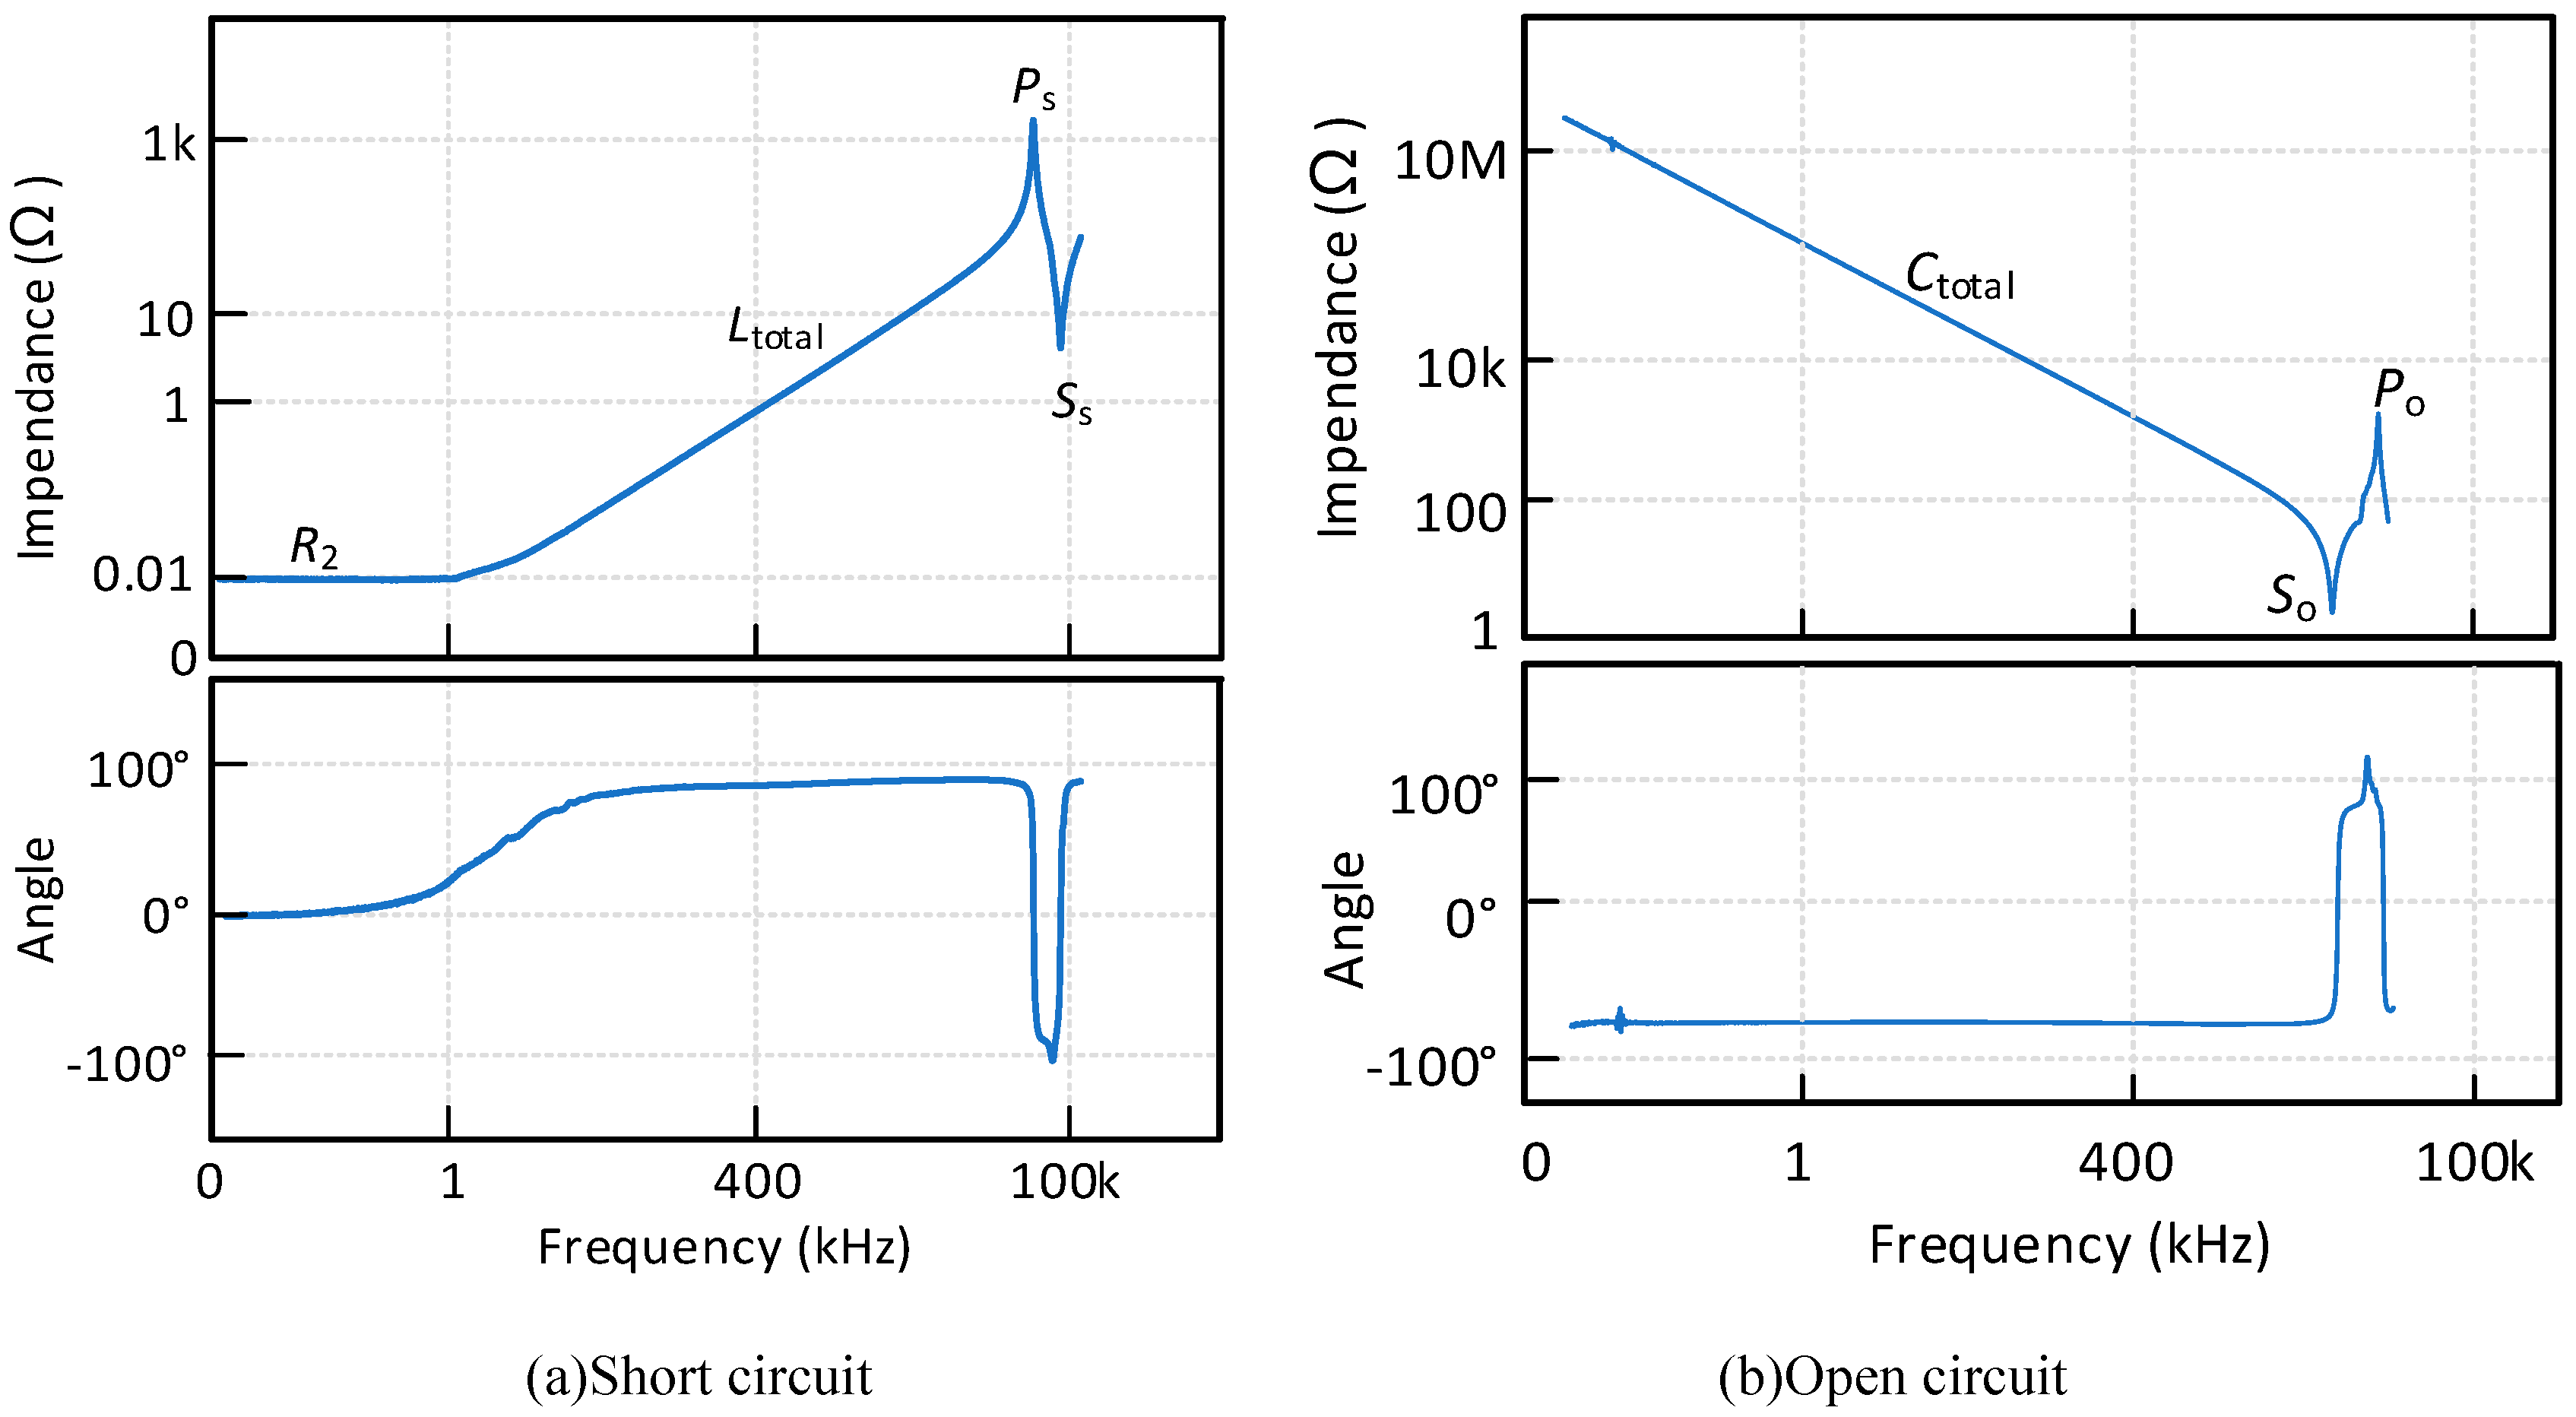
3. High-Frequency Cable Modelling

An accurate high-frequency cable model is critical for studying the overvoltage and voltage oscillation which is determined by the cable length, the cable structure, and the insulation material. Normally, the parasitic parameters in existing cable models are mainly studied under low-frequency conditions. The high frequency effects of the cable parasitic parameters are often not considered. For example, Figure 6 shows a widely used distributed cable model structure. This traditional distributed R-L-C cable model can be used between the inverter and the motor. However, the voltage characteristics at high frequencies cannot be accurately predicted in this model.
The overvoltage on the motor contains oscillations from several hundred Hz to several MHz due to the shorter rise time of the SiC MOSFET. In order to improve the prediction accuracy of motor overvoltage and voltage oscillation under high-frequency conditions, it is necessary to add the high-frequency part to the traditional distributed parameter model in Figure 6 to reflect the skin effect and proximity effect of the cable.
Figure 7 shows the simplified high-frequency three-phase distributed cable model with the high-frequency (HF) block. It should be noted that only one form of cable model cannot cover a wide frequency range. Figure 8 shows the proposed equivalent circuit cable models in the low, medium, and high frequency regions, and it is represented in two forms (open circuit and short circuit) for the convenience of extracting physical parameters.
In the following, how the circuit parameters are extracted is explained. The parasitic parameters of cable can be extracted from the impedance measurement as shown in Figure 9. Figure 9 shows the connection method of the cables during the short circuit and open circuit test. The series parasitic resistance and inductance of the cables can be obtained by short circuit test and the paralleled parasitic capacitance of the cables can be derived by open circuit test [21]. Therefore, the high-frequency parameters of the cable model in Figure 8 can be calculated by extracting the feature points of a real unit length cable. The cable used in this work is an unshielded, crosslinked polyethylene (XLPE) 3 core cable and the conductor area of the cable is 4mm2. An E4990A RLC impedance analyzer and a 16047E test fixture from Keysight is used to extract the parasitic parameters of the cables. The bandwidth of the impedance analyzer is set as 100MHz to identify the resonant point of the cable in the high frequency region.
Figure 10 shows the frequency response test results with an 1m cable, where the cable frequency response is shown. At low frequencies, short circuit test shows clear resistive characteristics and open circuit test shows clear capacitive characteristics. In the medium frequency range, short circuit test shows resistive and inductive characteristics and open circuit test still shows capacitive characteristic. At high frequencies, both short circuit test and open circuit test have two resonant points. From these frequency characteristics, the parasitic parameters of the cable can be obtained and parameters can accurately identify by separating the frequency into the low, medium and high regions.
For the short-circuit test, in the low-frequency region, the impedance characteristic of the cable is resistive as seen the impedance angle is around 0-degree as shown in Figure 10. Therefore, the value of the low-frequency resistance Rx(x=a,b,c) in Figure 8 is equal to |Z|. As the frequency increases, the impedance becomes more inductive. The value of the Ltotal can be calculated by the average value of the impedance corresponding to the 90-degree impedance angle in the low and medium frequency regions as shown in (9).
3 2 ω L t o t a l 2 + R α , b , c 2 = Z
It can be seen from Figure 10 that in the high-frequency region, the parallel resonance phenomenon first occurs at the Ps point, so the value of the high-frequency resistance is equal to |ZPs| as shown in (10). And the value of the high-frequency capacitance and inductance can be expressed as (11). Similarly, the frequency of Ss can be expressed as (12) due to the series resonance at point Ss, where LT can be expressed in (13).
2 3 Z P s = R s 1
f P s = 1 2 π L s 1 C s
f S s = 1 2 π L t o t a l C T
2 π f S s 2 L s 1 = C s + C T C s C T
From (11)-(13), the parameters Cs and Ls1 can be calculated.
The parasitic parameters between phases can be calculated and extracted from the open-circuit impedance as shown in Figure 10 (b). In the low to medium frequency region, the impedance characteristic is capacitive evidenced by the impedance angle of -90 degree. Therefore, the total capacitance at low-medium frequencies can be derived as:
1 2 C t o t a l = C a b + C o 1
As the series resonance phenomenon first occurs at So point, the value of the high-frequency resistance Ro is equal to |Z| as shown in (15). And the value of high-frequency capacitance and inductance can be expressed as (16). Similar, the frequency of Po can be expressed as (17) due to the parallel resonance at point Po, where Cp can be expressed as in (18).
2 Z S o · cos θ = R o
f S o = 1 2 π L o C o 1
f P o = 1 2 π L T C a b
L T = L o 1 2 π f P o 2 · C o 1
Based on the method presented above, the high-frequency parasitic parameters of the cable for per unit length can be accurately extracted, which can help to establish a more accurate cable model. This cable model could accurately fit the high-frequency characteristics of the real cable and accurately predict the amplitude of motor terminal overvoltage under high-frequency excitation. The parameters of unit length cable model parameters are summarized in Table 2.

4. Experimental Results

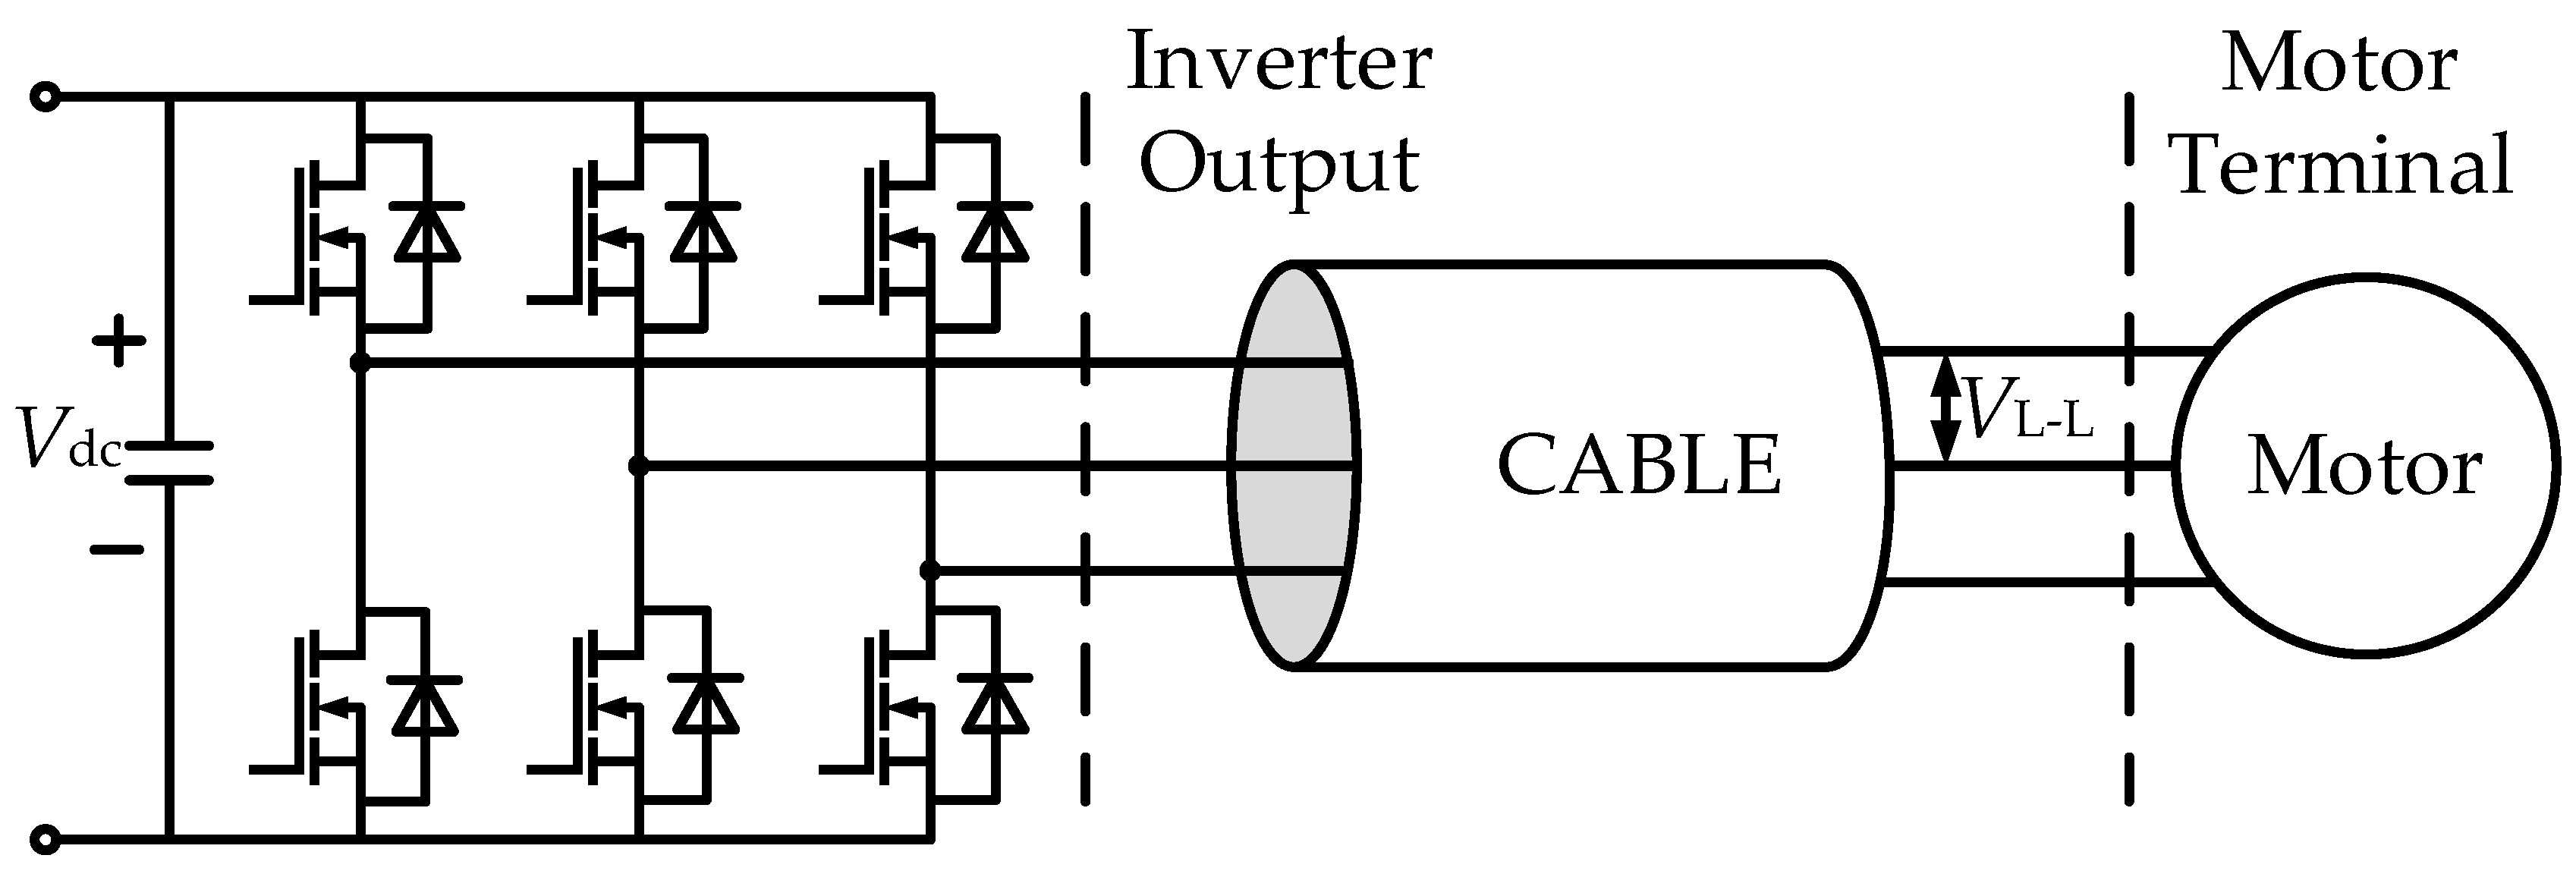
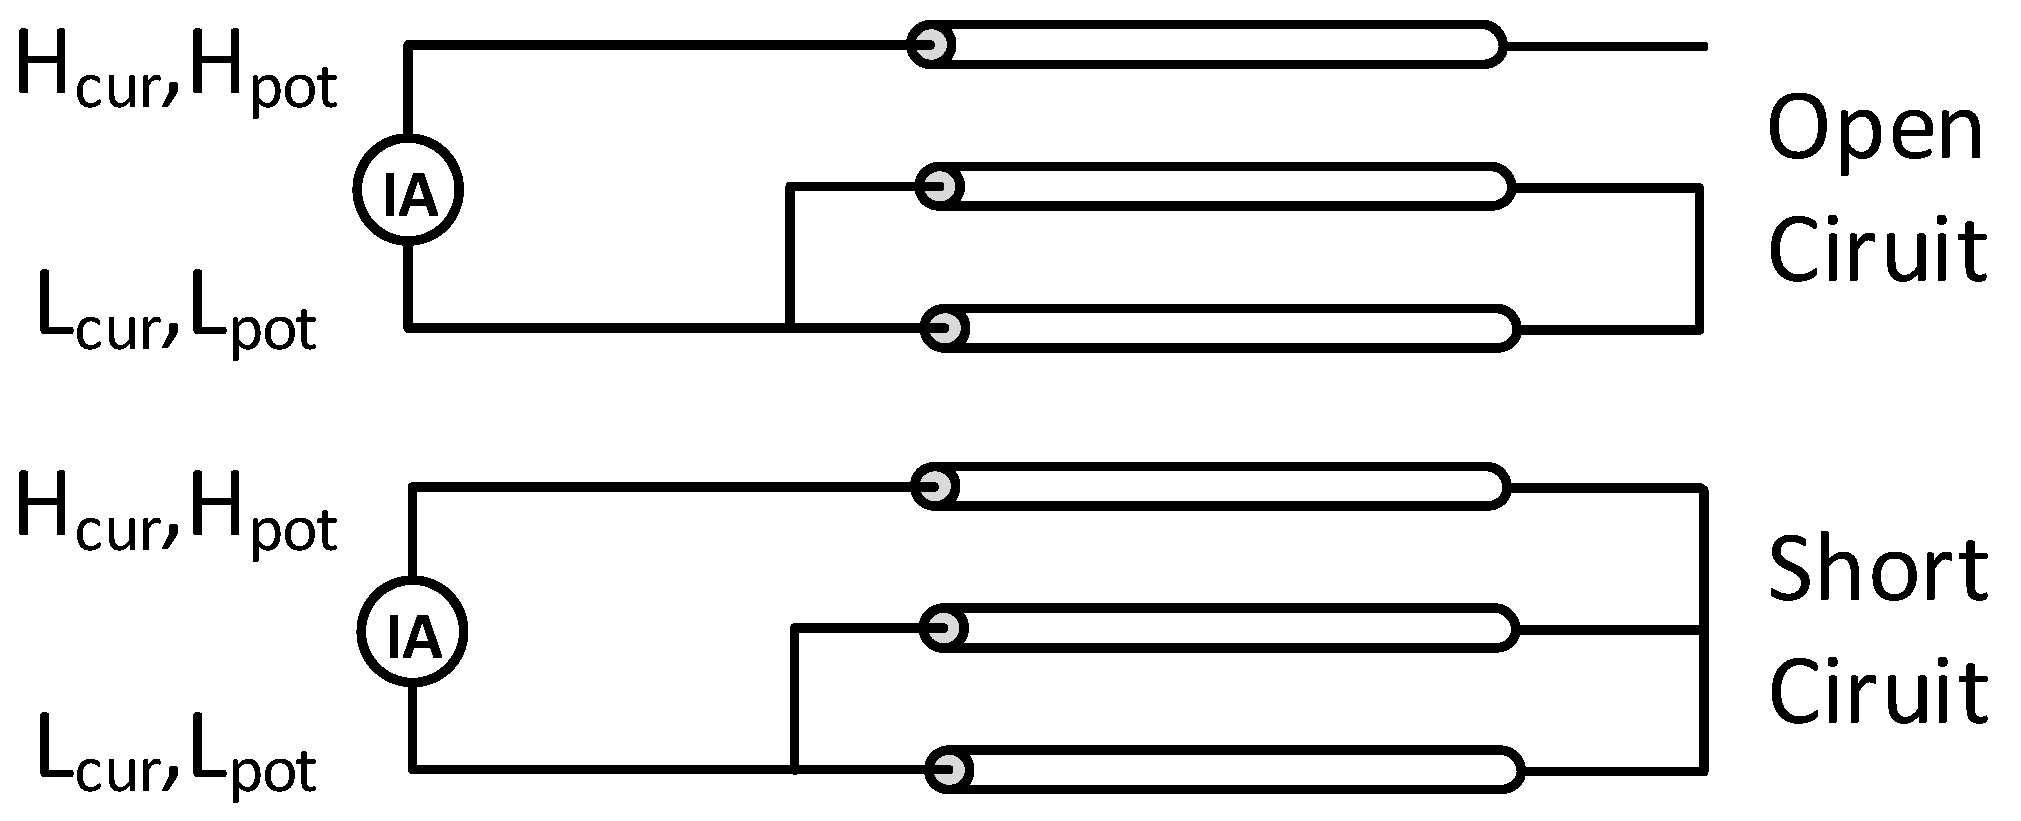
4.1. Experimental Prototype

In order to verify the accuracy of the overvoltage prediction model presented in this paper, an experiment prototype was built. Figure 11 shows the experimental prototype of SiC motor drives on electric machines. This prototype is composed of a three-phase two-level SiC inverter, a 2m, 3 core XLPE cable and a 380V/7.5kW three-phase induction AC motor. 1200V/60A SiC MOSFETs (Cree/Wolfspeed, C2M0040120D) are used. A 600V DC power supply (MAGNA TSD2000-15.0) is used for the input power. The SiC inverter is controlled by a TMS320F28335 DSP and a XC3S400 FPGA

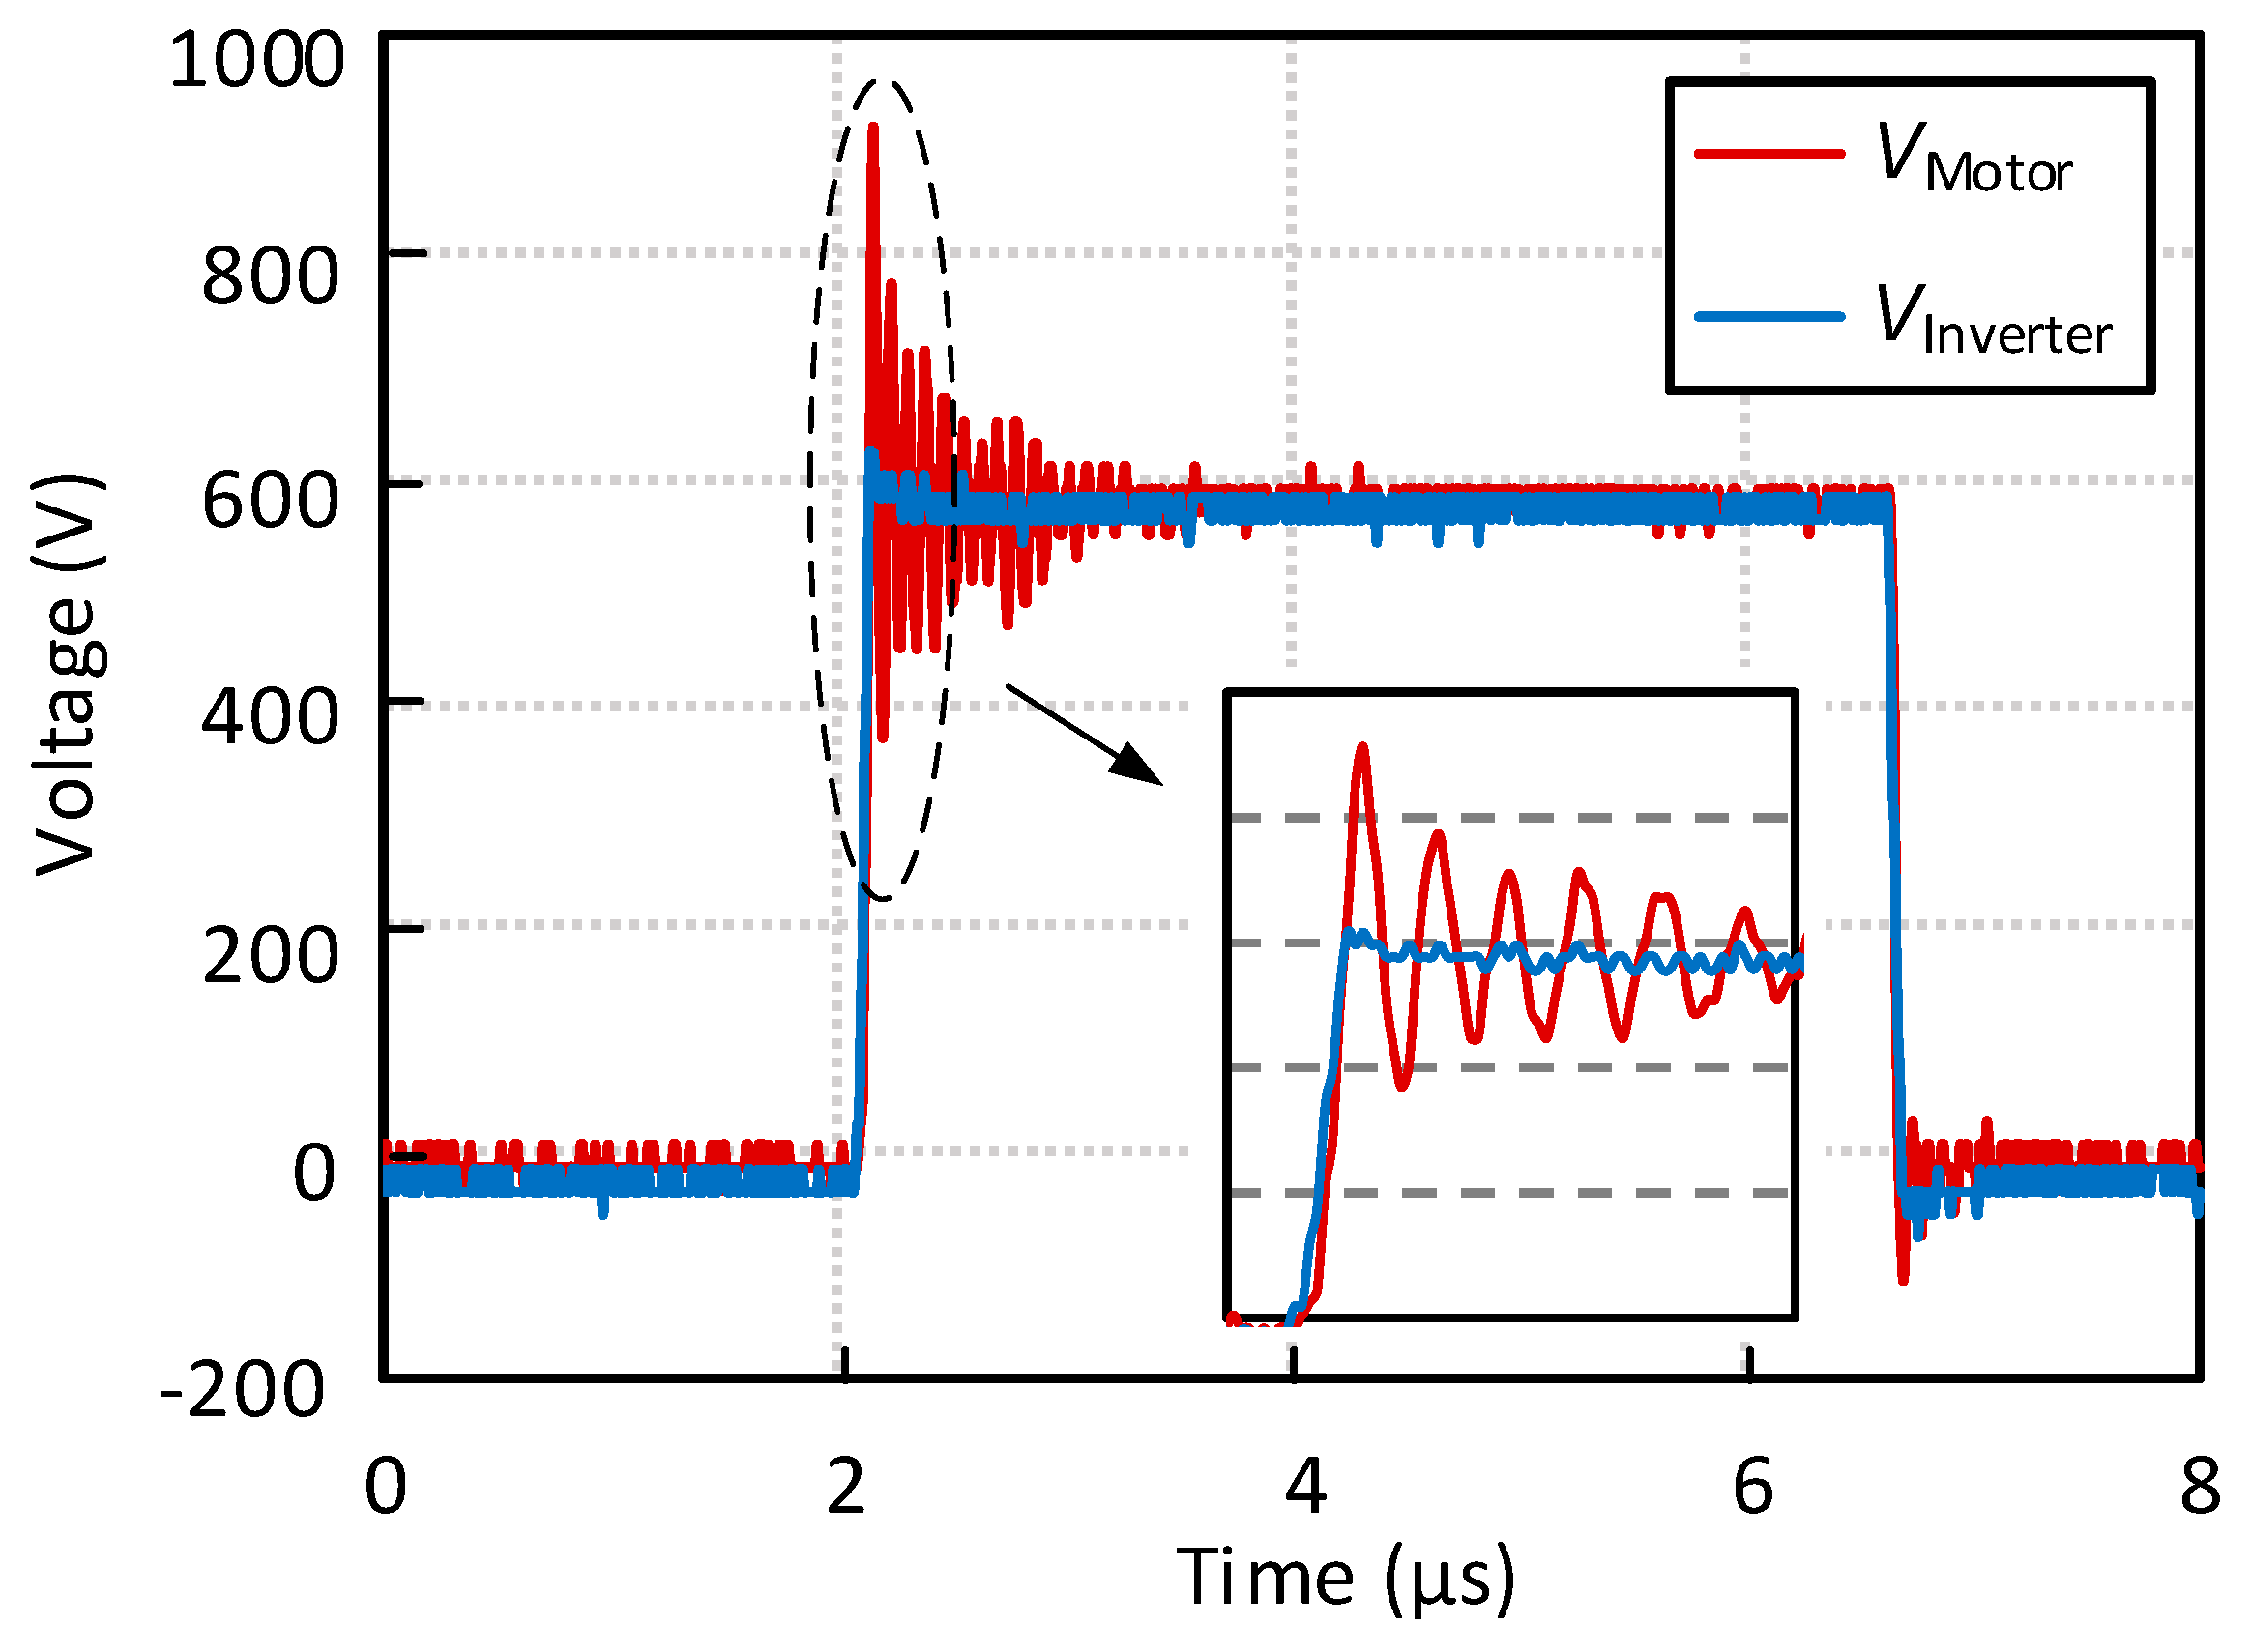
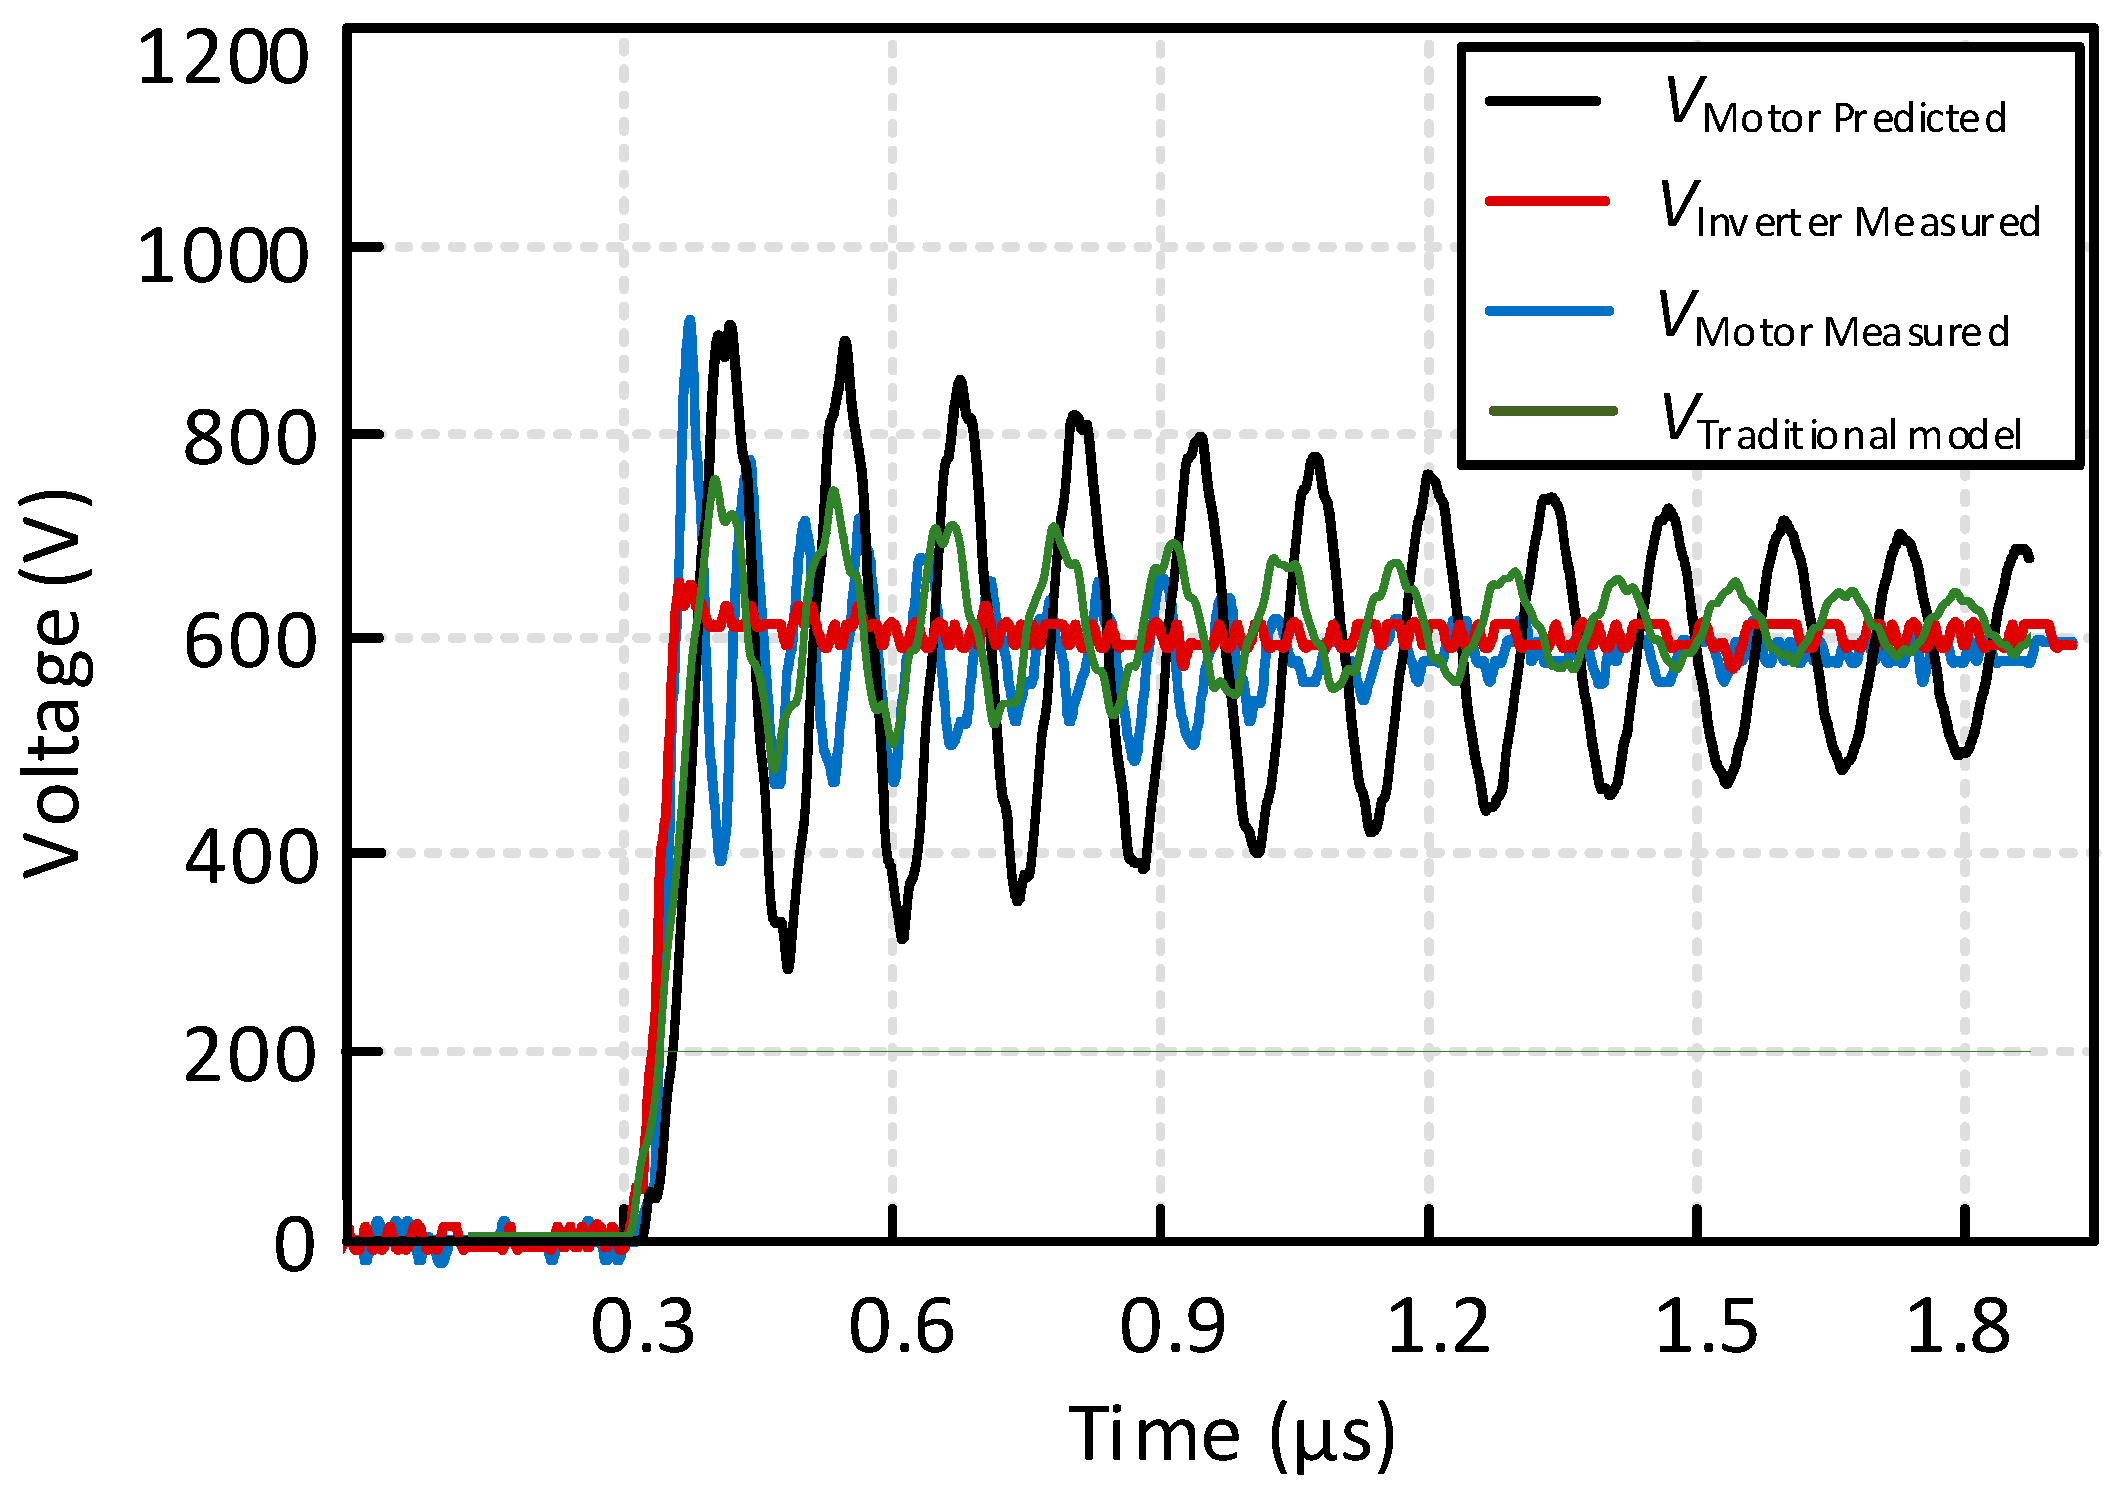
4.2. Experimental Results

The parameters listed in Table Ⅱ can be used to build a three-phase cable model in LT-Spice, which together with the SiC inverter and motor model can simulate the motor terminal voltage. Figure 12 shows the comparison between the simulated waveform and the measured waveform of the voltage on the motor. It can be seen that the error between the simulated and the measured values of the first voltage peak is within 5%, which is relatively accurate for predicting the highest voltage overshoot. However, this model cannot accurately predict the oscillation frequency and the oscillation amplitude after the first overshoot of the overvoltage because of the frequency response of the motor model are not accurate enough. Subsequent work will continue to optimize the high-frequency model of the motor, such as using a Ladder-Net model. The green line represents the prediction voltage of the motor terminal using the traditional π-section model. Clearly, the prediction value by the traditional model has larger errors.
To verify the accuracy of the model in predicting the overvoltage under different rise times, the peak values of the overvoltage are obtained through simulation and experiments respectively, as shown in Figure 13. It should be noted that the load at this time is a resistance load, in order to reduce the impact of inaccurate motor models on predicting overvoltage amplitude. In addition, the traditional π-section cable model has also been added to Figure 13 for comparison. The rise time of the voltage pulse is tested between 30ns to 80ns, which is relevant to the SiC MOSFET switching speed. It can be seen from Figure 13 that the accuracy of the predicted values with the high-frequency model presented in this paper and the traditional pi-model are similar in the range from 60ns to 70ns. However, the high-frequency model presented in this paper has better prediction accuracy than the traditional model in the range from 30ns to 60ns. The average prediction error of the traditional model is 11.9% which is larger than the average error of the high-frequency model of 3.8%.
A significant increase in the overvoltage can be seen as the rise time decreases, as shown in Figure 13. The motor overvoltage rapidly rises to 1.7 times of the bus voltage when the rise time drops to 30ns. Besides, the dv/dt of the voltage on the motor is as high as 34kV/µs when the switching time is only 30ns. The high dv/dt (34kV/µs) seriously exceeds the standard (500V/μs) presented by MG1 of the NEMA. This greatly reduces the insulation lifetime of the cable.
Additionally, the motor overvoltage is also tested under various switching frequencies from 10kHz to 100kHz as shown in Figure 14. The blue-line is the load terminal overvoltage value and the red-line is the predicted value with the high-frequency model presented in this paper. From 10kHz to 90kHz, the predicted values of the model are basically consistent with the measured values. However, the overvoltage measured value shows an abnormal amplitude jump at the 100kHz due to the coincidence of the switching frequency with the anti-resonance point of the system [27]. Although the high-frequency model proposed in this paper has the advantage of simplification in extracting parameters and calculating simulations, the accuracy of the frequency response at specific frequency points is insufficient.

5. Conclusions

This research comprehensively investigates the profound implications of high-speed switching characteristics in silicon carbide (SiC) inverter systems, with particular emphasis on cable modeling and terminal overvoltage phenomenon. Utilizing a wave reflection theory-based analytical framework, the line-to-line motor terminal overvoltage was meticulously examined in the time domain, revealing overvoltage propagation mechanisms with SiC system. Notably, the investigation uncovered that with ultra-rapid switching transitions (approximately tens of nanoseconds), the critical cable length potentially inducing motor terminal voltage doubling is remarkably condensed to merely a few meters. Conventional cable-motor modeling approaches demonstrate significant limitations in accurately predicting overvoltage amplitudes under high-frequency excitation—a crucial consideration for advanced insulation system design. This research introduces an innovative frequency fitting model and a systematic parameter extraction methodology. The proposed approach leverages RLC impedance analyzer techniques to comprehensively characterize cable parameters through open and short circuit assessments, thereby streamlining the model parameter extraction process. By strategically reducing the circuit order in frequency response fitting, the methodology significantly reduces computational simulation time. While acknowledging the inherent trade-offs in model simplification, the experimental validation demonstrates that the proposed model maintains an impressive prediction accuracy, with the average maximum overvoltage amplitude error remaining consistently below 5%. Future work will evaluate existing measures for mitigating motor overvoltage, including filter-based approaches and active methods such as multilevel converters, soft-switching, quasi-multilevel modulation, and advanced modulation techniques aimed at reducing motor overvoltage. Moreover, more efficient solutions will be explored, such as optimizing switching speeds and frequencies based on the overall system configuration and model, to achieve holistic optimization of SiC motor drive systems.

Author Contributions

formal analysis and writing, Y.X.; project administration, Z.D.; experiment, P.W; funding acquisition, L.W. and Z.D. All authors have read and agreed to the published version of the manuscript.

Funding

This work was supported by the Sailing program of Yibin University under project 2023QH24. This work was supported in part by the Sichuan Science and Technology program under project 2023YFQ0093. This work was supported by the Sichuan Science and Technology program under project 2024ZYD0267.

Data Availability Statement

The original contributions presented in the study are included in the article; further inquiries can be directed to the corresponding author.

Conflicts of Interest

The authors declare no conflicts of interest.

References

  1. P. Yi; P. K. S. Murthy; L. Wei. Performance Evaluation of SiC MOSFETs with Long Power Cable and Induction Motor. In IEEE Energy Conversion Congress and Exposition (ECCE), 2016, pp. 1–7.
  2. S. Tiwari; O. M. Midtgard; T. M. Undeland. SiC MOSFETs for Future Motor Drive Applications. In 18th European Conference on Power Electronics and Applications (EPE'16 ECCE Europe), 2016, pp. 1–10.
  3. B. A. Acharya; V. John. Design of output dv/dt filter for motor drives. in 5th International Conference on Industrial and Information Systems, 2010, pp. 562–567.
  4. M. J. Scott; J. Brockman; B. Hu. Reflected wave phenomenon in motor drive systems using wide bandgap devices. in IEEE Workshop on Wide Bandgap Power Devices and Applications, 2014, pp. 164–168.
  5. B. Narayanasamy; A. S. Sathyanarayan; Fang Luo. Impact of Cable and Motor Loads on Wide Bandgap Device Switching and Reflected Wave Phenomenonin Motor Drives. in 2017 IEEE Applied Power Electronics Conference and Exposition (APEC), 2017, pp. 931–937.
  6. Motors and Generators. NEMA Standards Publication No. MG1-1993, Revision No. 2, Apr. 1995.
  7. Hazra, S.; De, A.; Cheng, L. High Switching Performance of 1700-V, 50-A SiC Power MOSFET Over Si IGBT/BiMOSFET for Advanced Power Conversion Applications. IEEE Transactions on Power Electronics 2016, 31, 4742–4754. [Google Scholar]
  8. A. Morya; H. A. Toliyat. Insulation Design for Wide Bandgap (WBG) Device Based Voltage Source Converter Fed Motors. in 2017 IEEE 5th Workshop on Wide Bandgap Power Devices and Applications (WiPDA), 2017, pp. 74–79.
  9. Suresh, G.; Dudi, A.; Rendusara; Toliyat, H. A. Predicting the Transient Effects of PWM Voltage Waveform on the Stator Windings of Random Wound Induction Motors. IEEE Transactions on Power Electronics 1999, 14, 23–30. [Google Scholar] [CrossRef]
  10. Kerkman, R.J.; Leggate, D.; Skibinski, G.L. Interaction of Drive Modulation and Cable Parameters on AC Motor Transients. IEEE Transactions on Industry Applications 1997, 33, 722–731. [Google Scholar] [CrossRef]
  11. M. J. Scott; J. Brockman; B. Hu. Reflected wave phenomenon in motor drive systems using wide bandgap devices. in IEEE Workshop on Wide Bandgap Power Devices and Applications, 2014, pp. 164–168.
  12. S. N. M. Isa; Z. Ibrahim; M. Azri. Vector controlled AC motor drives for long cable application: Analysis of harmonics at motor terminal. in 4th IET Clean Energy and Technology Conference (CEAT 2016), 2016, pp. 1–8.
  13. Peizhong Yi; P. Murthy; Lixiang Wei. Performance evaluation of SiC MOSFETs with long power cable and induction motor. in IEEE Energy Conversion Congress and Exposition, Proceedings (ECCE 2016), 2016.
  14. Moreira, A.F.; Lipo, T.A.; Venkataramanan, G.; Bernet, S. High-frequency modeling for cable and induction motor overvoltage studies in long cable drives. IEEE Transactions on Industry Applications 2002, 38, 1297–1306. [Google Scholar] [CrossRef]
  15. G. Skibinski; R. Tallam; R. Reese. Common-mode and differential-mode analysis of three phase cables for PWM AC drives. in Conference Record of the 2006 IEEE Industry Applications Conference Forty-First IAS Annual Meeting, 2006, pp. 880–888.
  16. Krause, P.C.; Carlsen, K. Analysis and hybrid computer simulation of multiconductor transmission systems. IEEE Transactions on Power Apparatus and Systems, 1972; PAS-91, 469–477. [Google Scholar]
  17. Aoki, N.; Satoh, K.; Nabae, A. Damping circuit to suppress motor terminal overvoltage and ringing in PWM inverter-fed AC motor drive systems with long cable leads. IEEE Transactions on Industry Applications 1999, 35, 1014–1020. [Google Scholar] [CrossRef]
  18. von Jouanne, A.; Rendusara, D.A.; Enjeti, P.N.; Gray, J.W. Filtering techniques to minimize the effect of long motor leads on PWM inverter- fed AC motor drive systems. IEEE Transactions on Industry Applications 1996, 32, 919–926. [Google Scholar] [CrossRef]
  19. G. Tongkhundam. Over-voltages suppression methods in multiple drives using single half DC-link inverter for long cable applications. in 2015 IEEE 10th Conference on Industrial Electronics and Applications (ICIEA), 2015, pp. 713–718.
  20. G. Skibinski; D. Leggate; R. Kerkman. Cable characteristics and their influence on motor overvoltages. in Proceedings of APEC 97 - Applied Power Electronics Conference, 1997, pp. 114–121.
  21. Paula, H.D.; Andrade, D.A.; Chaves, M.L.R. Methodology for Cable Modeling and Simulation for High-Frequency Phenomena Studies in PWM Motor Drives. IEEE Transactions on Power Electronics 2008, 23, 744–752. [Google Scholar] [CrossRef]
  22. Wang, L.; Ho, C.N.-M.; Canales, F.; Jatskevich, J. High-frequency modeling of the long-cable-fed induction motor drive system using TLM approach for predicting overvoltage transients. IEEE Transactions on Power Electronics 2010, 25, 2653–2664. [Google Scholar] [CrossRef]
  23. von Jouanne, A.; Enjeti, P.; Gray, W. Application issues for PWM adjustable speed AC motor driver. IEEE Industry Applications Magazine 1996, 2, 10–18. [Google Scholar] [CrossRef]
  24. Melhorn, C.J.; Tang, L. Transient Effects of PWM Drives on Induction Motors. IEEE Transactions on Industry Applications 1995, 33, 1065–1072. [Google Scholar] [CrossRef]
  25. Kerkman, R.J.; Leggate, D.; Skibinski, G.L. Interaction of Drive Modulation and Cable Parameters on AC Motor Transients. IEEE Transactions on Industry Applications 1997, 33, 722–731. [Google Scholar] [CrossRef]
  26. A. von Jouanne; P. Enjeti. Design considerations for an inverter output filter to mitigate the effects of long motor leads in ASD applications. in Proceedings of Applied Power Electronics Conference. APEC '96, 1996, pp. 579–585.
  27. Xu, Y.; Yuan, X.; Ye, F.; Wang, Z.; Zhang, Y.; Diab, M.; Zhou, W. Impact of high switching speed and high switching frequency of wide-bandgap motor drives on electric machines. IEEE Access 2021, 9, 82866–82880. [Google Scholar] [CrossRef]
Figure 1. Inverter-fed AC motor drive with cables.
Preprints 149523 g001
Figure 2. Overvoltage across the motor terminals with a SiC MOSFET inverter.
Preprints 149523 g002
Figure 3. Reflection process of the traveling wave.
Preprints 149523 g003
Figure 4. Motor overvoltage comparison with a SiC MOSFET inverter and a Si IGBT inverter.
Preprints 149523 g004
Figure 5. The ratio between motor terminal voltage (VM) and inverter output voltage (VDC) with various rise times for a 2 meters cable. Red-line means traditional formula calculation value. Blue-line means measured value with SiC inverter system.
Preprints 149523 g005
Figure 6. Traditional distributed cable model structure.
Preprints 149523 g006
Figure 7. Simplified high-frequency three-phase distributed cable model.
Preprints 149523 g007
Figure 8. Short-open circuit test equivalent circuit.
Preprints 149523 g008
Figure 9. Cable connection in open circuit test short circuit test.
Preprints 149523 g009
Figure 10. Frequency-dependent parameters of the cable as measured in DM.
Preprints 149523 g010
Figure 11. Experimental prototype of SiC motor drives on electric machines.
Preprints 149523 g011
Figure 12. Comparison of the motor terminal voltage waveform between simulation and experimental measurement. Red-line is the line-to-line voltage at inverter terminal. Blue-line is the line-to-line voltage at motor terminal. Black-line is the predicting overvoltage with high-frequency model presented in this paper. Green-line is the predicting overvoltage with traditional model.
Preprints 149523 g012
Figure 13. The predicted and measured values of overvoltage at different rise time. Red-line is the line-to-line voltage at resistance load terminal. Blue-line is the predicting overvoltage with traditional model. Black-line is the predicting overvoltage with high-frequency model presented in this paper.
Preprints 149523 g013
Figure 14. The predicted and measured values of the line-to-line motor voltage under various switching frequencies.
Preprints 149523 g014
Table 1. Pulse rise time and the corresponding cable critical length.
Rise time of voltage pulse Critical cable length
20 ns 0.92 m
30 ns 1.38 m
40 ns 1.84 m
50 ns 2.30 m
60 ns 2.76 m
70 ns 3.22 m
80 ns 3.68 m
90 ns 4.13 m
100 ns 4.59 m
200 ns 9.20 m
300 ns 13.8 m
400 ns 18.4 m
Table 2. PROPOSED CABLE PER-METER PARAMETERS.
Parameter Value Parameter Value
Ra,b,c 5.71 mΩ Cab,ac,bc 9.79 pF
Ltotal 174 nH Ro 4.1 Ω
Cs 33.92 pF Lo 316.7 nH
Rs1 1.33 kΩ Co1 46.15 pF
Ls1 260.43 nH
Disclaimer/Publisher’s Note: The statements, opinions and data contained in all publications are solely those of the individual author(s) and contributor(s) and not of MDPI and/or the editor(s). MDPI and/or the editor(s) disclaim responsibility for any injury to people or property resulting from any ideas, methods, instructions or products referred to in the content.
Copyright: This open access article is published under a Creative Commons CC BY 4.0 license, which permit the free download, distribution, and reuse, provided that the author and preprint are cited in any reuse.
Prerpints.org logo

Preprints.org is a free preprint server supported by MDPI in Basel, Switzerland.

Subscribe

Disclaimer

Terms of Use

Privacy Policy

Privacy Settings

© 2025 MDPI (Basel, Switzerland) unless otherwise stated