
Submitted:
14 February 2025
Posted:
17 February 2025
You are already at the latest version
Abstract
The broad point spread function of the NuSTAR telescope makes resolving astronomical X-ray sources a challenging task, especially for off-axis observations. This limitation has affected the observations of the high-mass X-ray binary pulsars SXP 15.3 and SXP 305, in which pulsations are detected from nearly overlapping regions without spatially resolving these X-ray sources. To address this issue, we introduce a deconvolution algorithm designed to enhance NuSTAR’s spatial resolution for closely-spaced X-ray sources. We apply this technique to archival data and simulations of synthetic point sources placed at varying separations and locations, testing thus the algorithm’s efficacy in source detection and differentiation. Our study confirms that on some occasions when SXP 305 is brighter, SXP 15.3 is also resolved, suggesting that some prior non-detections may have resulted from imaging limitations. This deconvolution technique represents a proof of concept test for analyzing crowded fields in the sky with closely-spaced X-ray sources in future NuSTAR observations.
Keywords:
Image deconvolution
; Image resolution
; Point spread function (PSF)
; X-ray astronomy
; X-ray binary pulsars (XRBs)
; X-ray telescope
1. Introduction
1.1. Astronomical Point Sources and X-Ray Telescopes
Astronomical systems as observed by modern telescopes are divided into two types: point-like sources and extended sources. The former are unresolved and present images whose sizes and shapes are dictated purely by the combined point spread function (PSF) of the telescope optics and the detector; whereas extended sources and crowded fields (containing many closely-spaced point sources) present images that represent the true brightness patterns in the sky convolved with the imaging PSF [1]. If a reliable estimate of the PSF can be made, then in principle, mathematical deconvolution can reduce the instrumental blurring and provide a sharper image.
Most observations from space-based X-ray telescopes are used to study distant galactic and extragalactic point sources. Examples of such point sources are X-ray binaries [2], novae [3], and active galactic nuclei [4], while extended sources are found in supernova remnants [5], galaxy clusters [6], star-forming regions [7], and galactic halos [8]. The goal is always to obtain a more detailed image of the X-ray source irrespective of its nature. In extended sources, the finer the image, the more detailed the structure of the source. In the case of point sources, higher-resolution images can be crucial in distinguishing between two closely-spaced sources (actually their 2D projections in the sky).
Among presently operating X-ray observatories, Chandra [9] has the best spatial resolution and can distinguish even between sources projected to 0.5″ apart; whereas NuSTAR[10] has a broader energy coverage (viz. 3-79 keV versus 0.5-8 keV for Chandra), but also (suffers from) a broader PSF (a half power diameter (HPD) of 58″). The NuSTAR PSF also deteriorates considerably for off-axis sources (observed far out from the image center). This can create a grave issue in distinguishing between point sources lying within the full radius of the PSF when there are no simultaneous observations from the Chandra or the XMM-Newton [11] telescope. Image deconvolution can then help resolve the problem to a certain extent. For instance, Sakai et al. [12] used a Richarson-Lucy image deconvolution technique on a high-resolution Chandra image of the supernova remnant Cas A to bring out more detailed features in the low-flux regions. A non-iterative deconvolution technique has also been used on Suzaku-XIS [13] images to enhance the resolution from its 110″ HPD to [14].
1.2. Image Deconvolution
Image deconvolution is a mathematical technique used to improve the resolution or clarity of images by reversing the effects of blurring and distortion. These distortions arise from the instrument’s PSF, atmospheric effects, or other turbulence during observation. Deconvolution aims to reconstruct a more accurate version of the original image by using prior knowledge of the PSF and other known properties of the telescope. There are several methods for image deconvolution, each with specific advantages and limitations. Iterative methods, such as the Richardson-Lucy algorithm [15,16], apply successive approximations to recover the image, and they are particularly effective in dealing with noisy data. Fourier-based methods [17] work in the frequency domain to perform deconvolution efficiently, but they can be more sensitive to noise. Wavelet-based deconvolution [18] is often used for images with structures and edges, allowing for better edge detection and detail recovery. More recently, machine learning techniques [19] have become very common; they use deep learning models trained on known PSFs and image pairs, and they can achieve results comparable to or better than those from deconvolution methods; but these new techniques are heavily dependent on the availability of training data.
Applications of image deconvolution have appeared in diverse fields. In astronomy, deconvolution is used to sharpen images of distant stars, galaxies, and various other celestial objects captured by ground-based and space-based observatories. In medical imaging, deconvolution improves the quality of microscopy and radiology scans, aiding in more precise diagnoses. It is also widely used in remote sensing, surveillance, and increasingly in consumer photography to enhance image quality and detail.
1.3. High-Mass X-Ray Binary Pulsars
X-ray pulsars are rapidly spinning neutron stars (NSs) that emit X-rays modulated by their spin periods. These pulsars are found in NS X-ray binary (XRB) systems with high-mass or low-mass companion stars from which the NS accretes material. The material falls onto the star’s magnetic poles, forming bright spots (`hotspots’) that emit X-ray photons. As the NS rotates, the X-ray beams sweep across space, appearing as regular pulses to any observer. The pulse period tells us how fast the neutron star is spinning, and changes in this period over time reveal details about the interaction of the NS with its companion star [20,21].
High-mass X-ray binaries (HMXBs) are systems in which the NS companion is a massive () hot star, usually of spectral type O or B. A special type of HMXBs is the subset of Be X-ray binaries in which the companion is a Be star. Be stars are a class of B-type stars that show Hydrogen emission lines (e.g., H) in their optical spectra (hence the `e’ in the class name). They form large decretion disks around them due to material shed from their rapidly rotating surfaces enhanced by processes thought to be related to stellar pulsations [22,23]. Decretion disks play a crucial role in driving the observed X-ray behavior in Be-XRBs. When the NS passes through or interacts with the disk material, then the process of accretion occurs leading to powerful X-ray outbursts [24].
1.4. The Magellanic Pulsars SXP 15.3 and SXP 305
The Small Magellanic Cloud (SMC) is a nearby dwarf galaxy that is home to more than 100 HMXBs [25], about 70 of which are X-ray pulsars, and all but one are Be-XRBs [21]. The low metallicity of the SMC makes it a great environment for forming massive stars and studying their life cycles [26]. With a plethora of known HMXBs, the SMC offers unique opportunities to understand how these systems evolve.
In this work, we address the difficult problem of resolving point sources in NuSTAR X-ray images, especially when there is no other major distinguishable spectral or timing feature, and the observer has to rely entirely on the imaging capability of the telescope. The particular case that we explore concerns the closely-spaced pair of SXP 15.3 and SXP 305 [27,28]. These two pulsars have widely different spin periods, and their X-ray outbursts allow us to study the extreme conditions that develop near their accreting NSs.
SXP 15.3 [29,30,31] and SXP 305 [28] are both Be-HMXB pulsars [21,26], and they are separated by only 7″ in the sky (see Figure 1 of Monageng et al. [28]). Lazzarini et al. [27] determined the pulse period of SXP 305 for the first time using a NuSTAR observation (also used in this work), but the NuSTAR image did not resolve the pair as the projected separation of the two sources is much smaller than the NuSTAR HPD of 58″.
2. Methods
2.1. General Framework for Image Deconvolution
Image deconvolution is a computational technique used to reconstruct the `true’ image that has been blurred by the instrument’s PSF and the superimposed noise. The observed image is expressed as
where ∗ denotes convolution, and represents the noise at each image point . The goal of deconvolution is to estimate by reversing the effects of the PSF while accounting for noise.
Deconvolution is an ill-posed problem because noise in the observed image can be amplified during the reduction process. To address this issue, regularization techniques and additional constraints are applied. Common deconvolution approaches include:
- Direct Methods: These include Fourier-based deconvolution and Wiener filtering, which are computationally efficient but very sensitive to the noise content.
- Iterative Methods: Methods such as the Richardson-Lucy algorithm that refine the estimate during successive iterations and that are very effective against Poisson noise.
- Bayesian Methods: These incorporate prior knowledge about the image, such as smoothness or sparsity, to guide the cleaning algorithm.
- Machine Learning Approaches: Neural networks trained on simulated data can directly predict the `true’ image from the observed outcome [19].
The general update rule for iterative deconvolution is written as
where is the estimate after k iterations, is a step size, and is a residual term based on the convolution mismatch. Iterations continue for as long as the residual is minimized and an adopted convergence criterion is met.
2.2. The Richardson-Lucy Algorithm
The Richardson-Lucy (RL) algorithm [15,16] is an iterative deconvolution technique optimized for low-flux data, such as many X-ray observations of SMC sources. It is based on maximum likelihood estimation under Poisson statistics. The algorithm updates the image estimate by
where is the transpose (or flipped) version of the PSF. The numerator represents the cross-correlation of the observed image with the flipped PSF, while the denominator represents the deblurred estimate of the true image.
The execution steps for the RL algorithm are:
- Initialization: Start with an initial guess for the true image, typically a uniform image or a given .
- Update Rule: Correct the estimate iteratively based on the ratio of observed data to the simulated blurred estimate.
- Stopping Criterion: Stop the iteration when the changes in are negligible or when the residual error is sufficiently small.
The RL algorithm assumes an accurately known PSF and works quite well in images with superimposed Poisson noise. Various extensions of this algorithm can also handle spatially varying PSFs. This work uses a Python `scikit’ image restoration package called skimage.restoration.richardson_lucy (URL: https://scikit-image.org/, accessed on 26 October 2024).
2.3. NuSTAR Data Analysis
NuSTAR (Harrison et al. [10]) is the first orbiting telescope capable of focusing very high-energy X-rays. It was launched on June 13, 2012 and operates in the 3–79 keV energy range, surpassing the 10 keV limit of earlier focussing X-ray telescopes. NuSTAR comprises two co-aligned hard X-ray grazing incidence telescopes (Wolter I design) that focus X-rays onto two separate solid-state focal-plane detectors with a focal length of approximately 10 meters. The two focal-plane modules (FPMA and FPMB) are designed to be identical, enabling their combined data to enhance the signal.
The archival data from both FPMA and FPMB modules were processed using the NuSTAR Data Analysis Software (NuSTARDAS v2.1.4) with calibration files from CALDB (v20240325). This software is included in the HEASoft (v6.34) package distributed by the High Energy Astrophysics Science Archive Research Center (HEASARC). The nupipeline command was employed to convert level-1 event files into level-2 event files, applying standard data cleaning procedures. High-level products, including barycenter-corrected source event files, skymap images, light curves, and spectra, were generated using the nuproducts command. For this study, skymap images, created in the broad energy band of 3-79 keV, were utilized.
2.4. NuSTAR PSF
The PSF of NuSTAR describes how the telescope and detector system responds to point X-ray sources, effectively characterizing the blurring introduced by the instrument’s optical components. It is effectively determined by its focusing optics, which consist of multilayer-coated, grazing-incidence mirrors designed to reflect high-energy X-rays. The on-axis PSF has a full width at half maximum of approximately 18″ and an HPD of about 58″ [10].
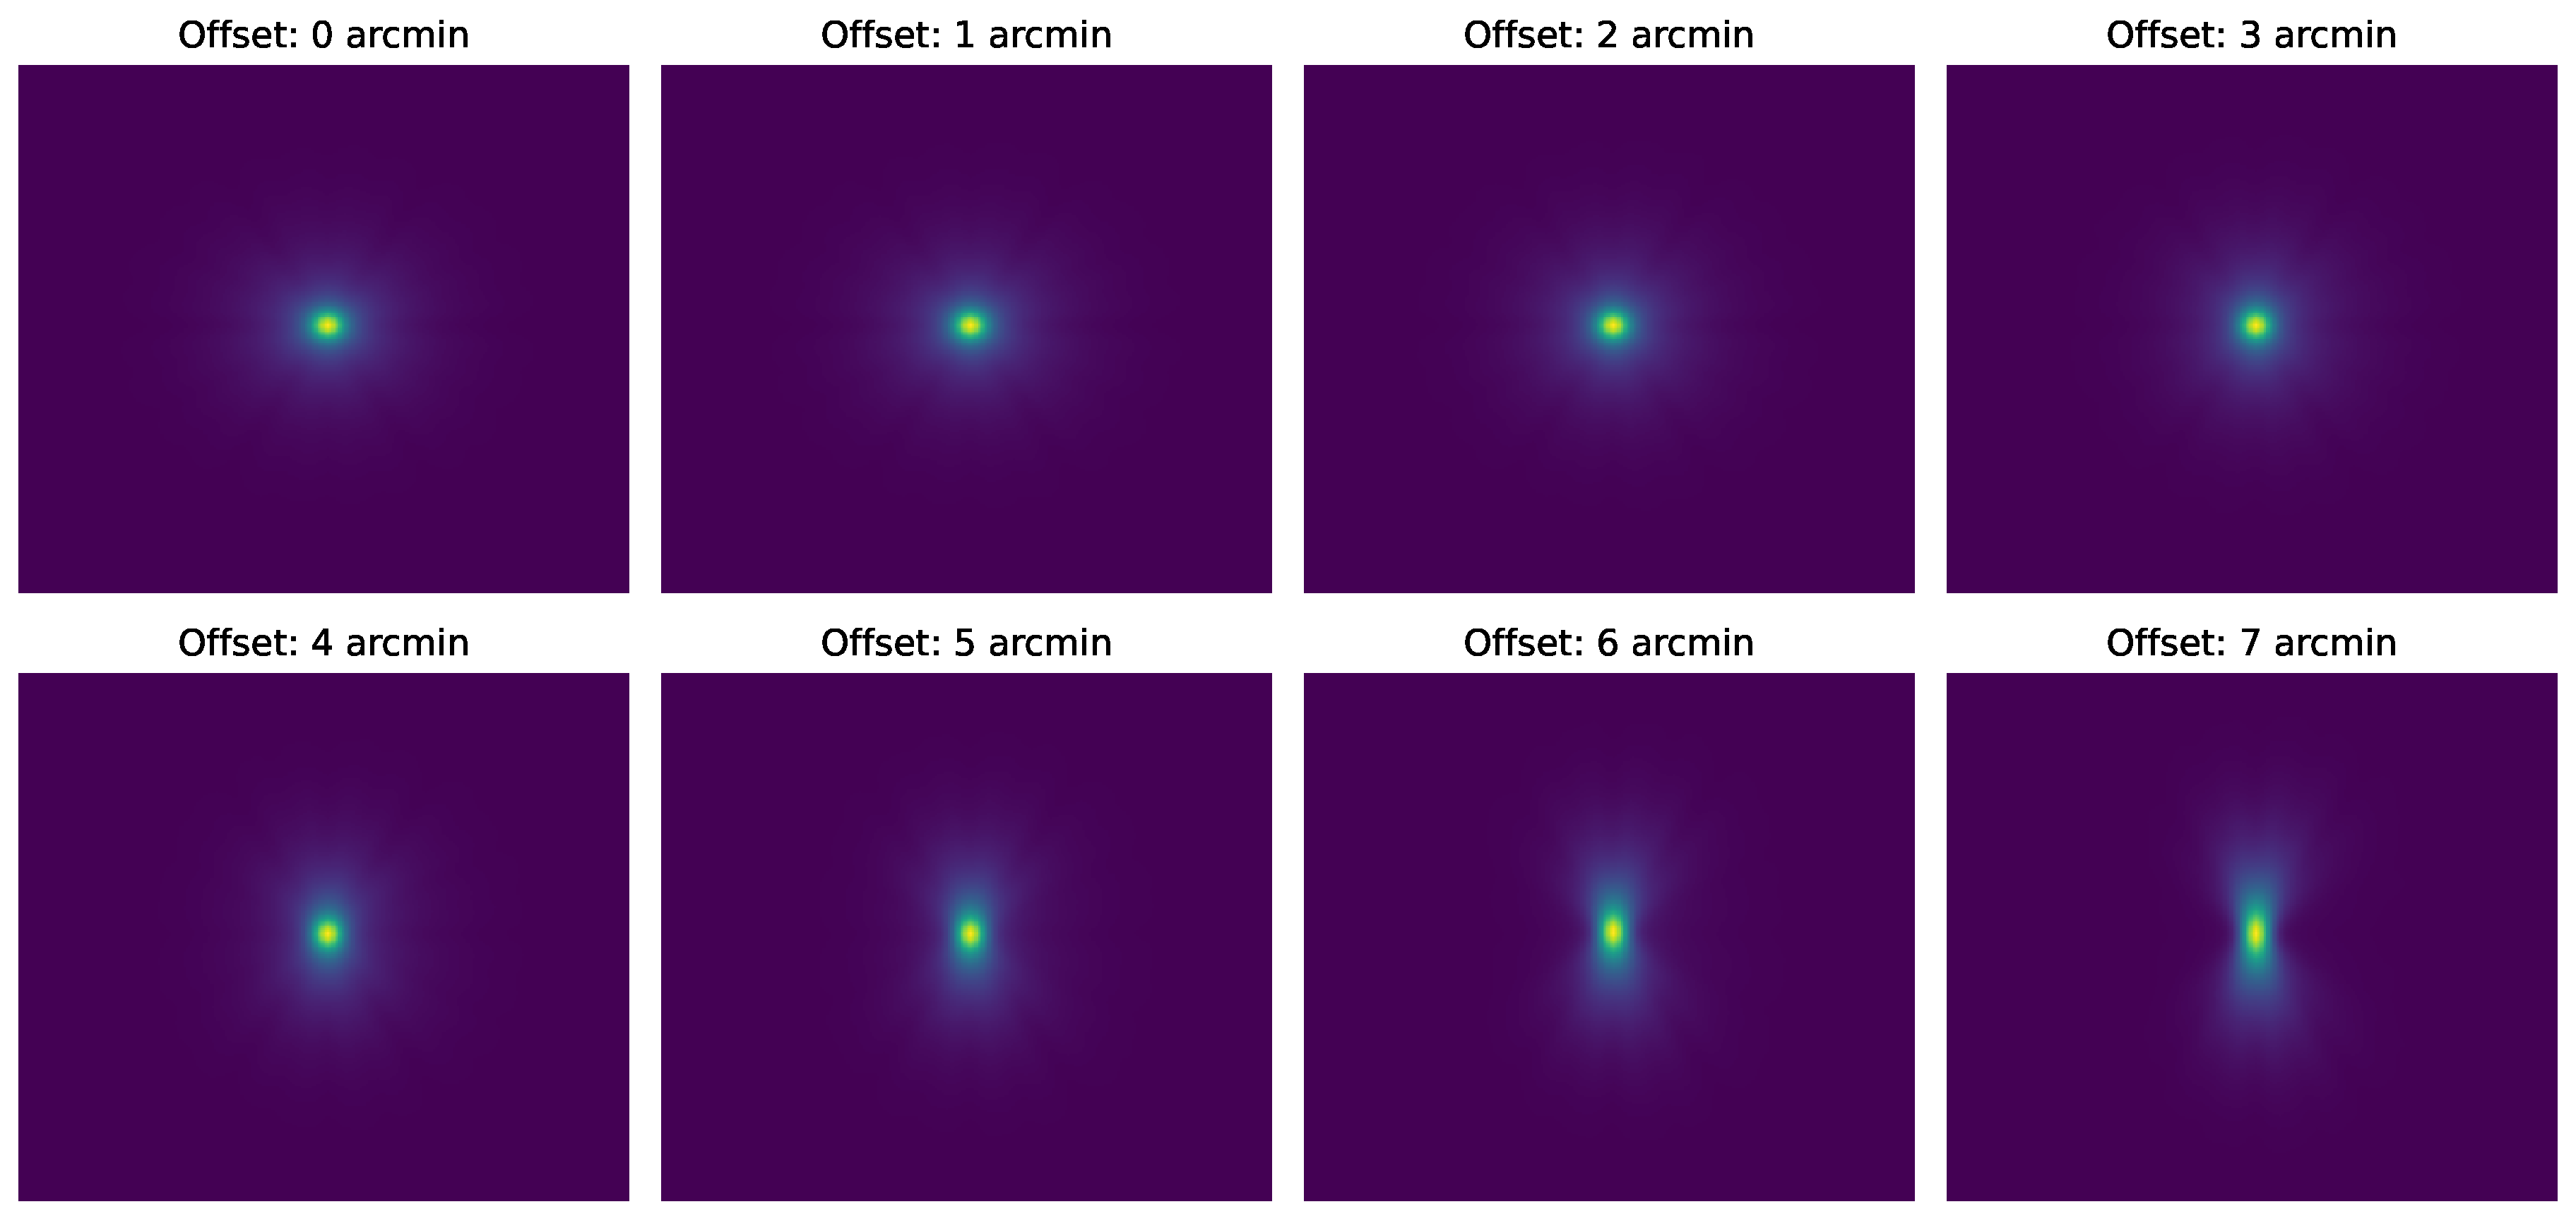
However, the PSF varies with off-axis angle due to optical aberrations inherent in the telescope’s design. As sources appear offset from the optical axis (the image center), the PSF broadens and becomes more asymmetric, resulting in decreased spatial resolution and increased overlap between nearby sources. Additionally, the PSF exhibits a slight energy dependence because of reflectivity variations in the multilayer mirror coatings. Accurately modeling the NuSTAR PSF—including its dependence on energy and off-axis angle—is crucial for image deconvolution techniques aiming to resolve sources in close proximity, such as SXP 15.3 and SXP 305 [27,28]. In this study, we have utilized the calibrated PSF models stored in CALDB, and we have accounted for the specific offsets and energy ranges that pertain to the particular FPMA and FPMB data sets.
Figure 1.
Central 100×100 pixel regions of the NuSTAR PSF at different off-axis angles ranging from 0′ to 7′. Each panel represents the PSF corresponding to a specific off-axis angle, highlighting the variation in spatial distribution due to the telescope’s optics. The color scale indicates relative intensity, and the images are shown in a logarithmic scale for a better view of the PSF structure.
3. Results
3.1. Deconvolution of Simulated NuSTAR Images
The NuSTAR PSF was used to simulate two nearby point sources. The sources were placed at various distances and the deconvolution algorithm was tested for efficiency. An example is shown in Figure 2, where a 4′ PSF was used for both sources separated by 10″.
3.2. Deconvolution of the SXP 15.3 – SXP 305 Pair
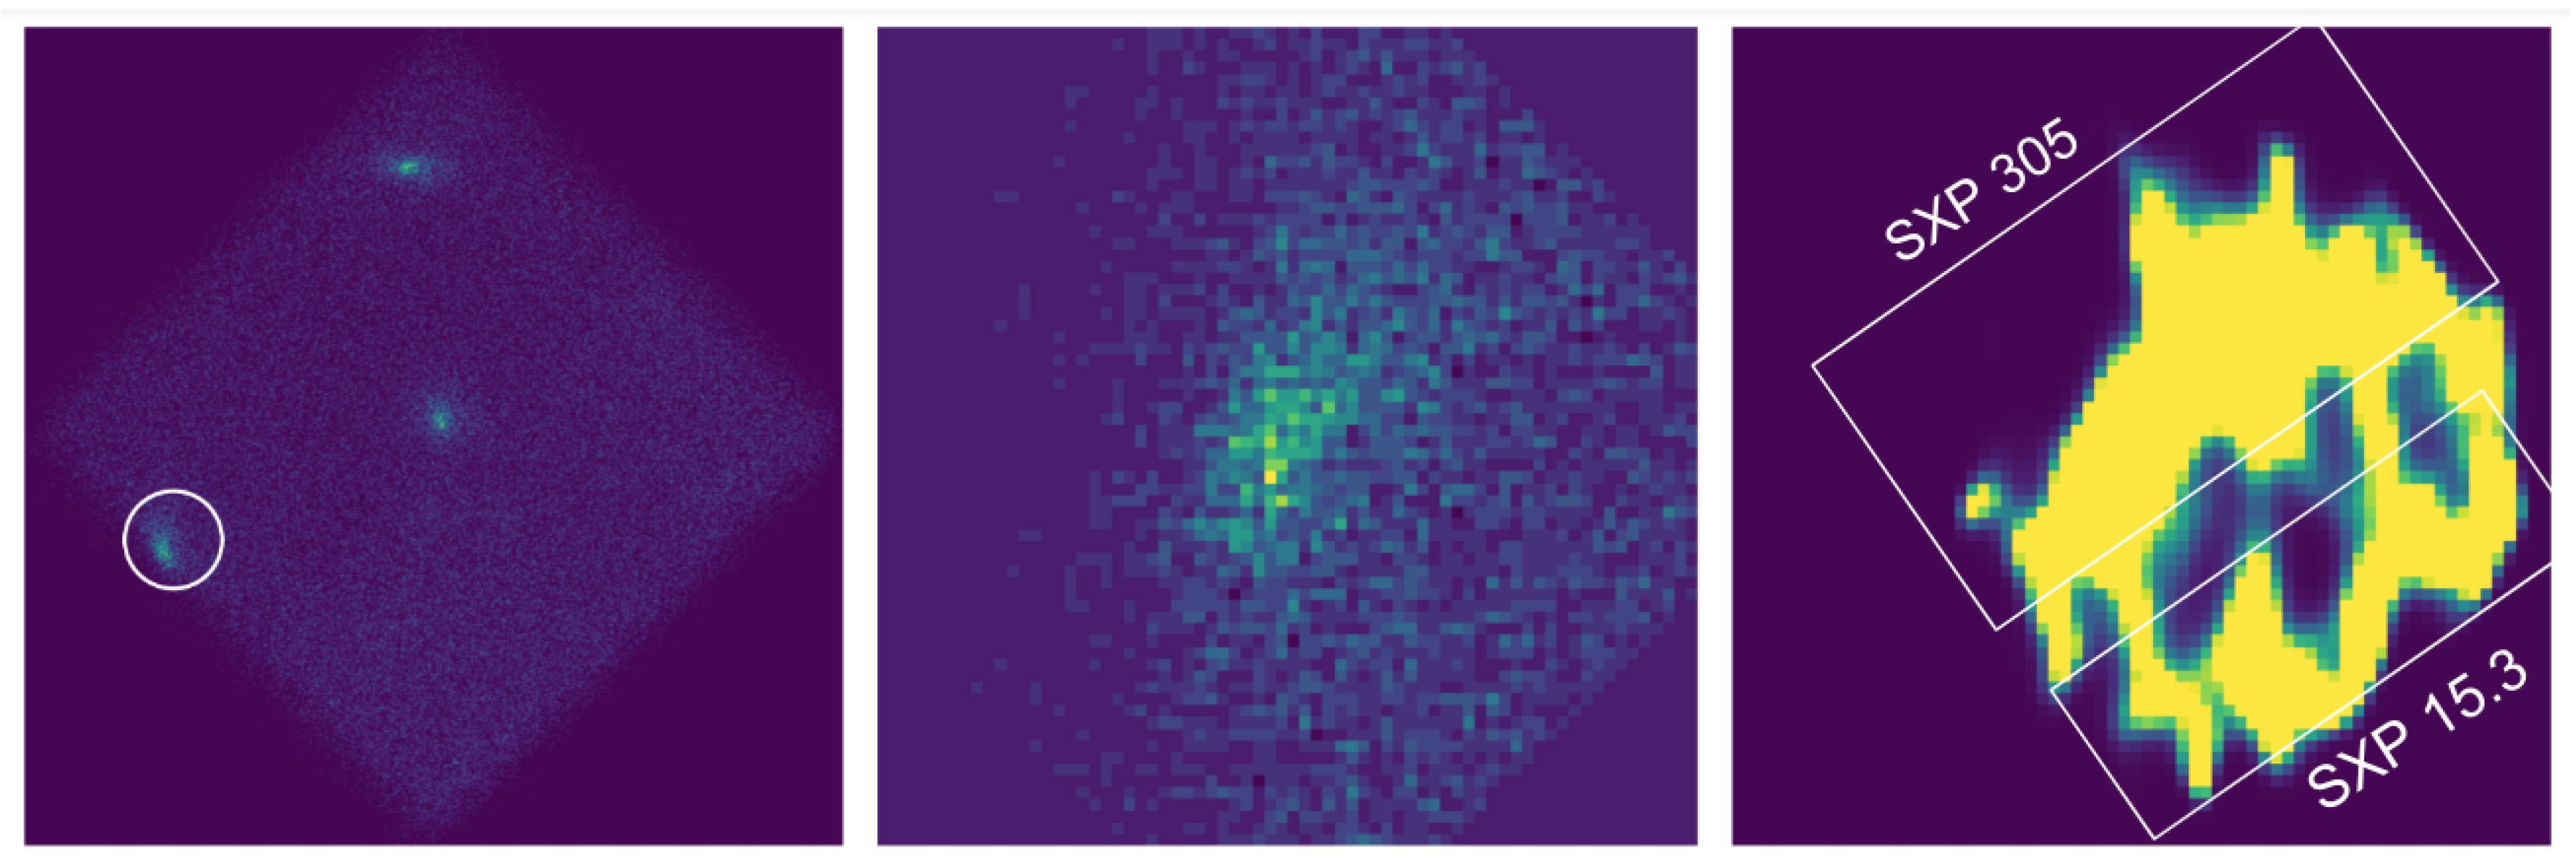
Figure 3 demonstrates that deconvolution of the SXP 15.3/305 image enhances the visibility of fine structures, particularly in the region around the sources. The cropped image isolates the target and reduces background noise during computations. Then, image rotation helps to align the raw cropped image with the adopted input PSF image. After rotation, the alignment of features remains consistent, preserving thus the various morphological details. Finally the RL iteration procedure sharpens the image and reveals details that were previously blurred due to the instrument’s PSF.
In the resulting image (right panel in Figure 3), the maximum X-ray luminosities are not the same in the two flux-enhanced regions marked by boxes. This is never the case in NuSTAR observations of single sources, so this feature signifies the presence of two X-ray emitters in the cleaned image. The sources are however not entirely resolved owing to their small separation by about for which the performance of the RL algorithm begins to degrade somewhat (simulations show strong performance for separations of ). Nevertheless, we believe that the brighter region corresponds to SXP 305 in outburst for which pulsations of 305 seconds were measured in this observation. Before this observation, only 15.3-second pulsations had been detected from this region, when SXP 15.3 was bright and SXP 305 was presumably in quiescence.
A comparison between the original, rotated, and deconvolved images of Figure 3 shows the effectiveness of th RL method in improving spatial resolution. The deconvolved image (right panel) can then be processed by other source detection algorithms (e.g., Gaussian fitting of the signal) to pinpoint the precise positions of the two sources that were unresolved in previous observations [27,28].
4. Discussion
We have demonstrated that utilizing advanced image deconvolution techniques, specifically the RL algorithm tailored to the NuSTAR PSF, we can significantly enhance the spatial resolution of NuSTAR X-ray images. By choosing the correct model of the telescope’s PSF and by incorporating it into the deconvolution procedure, it is possible to resolve closely-spaced X-ray sources that are indistinguishable by standard imaging techniques. Our application of the RL iterative method to the case of the HMXB pulsars SXP 15.3 and SXP 305 (right panel in Figure 3) illustrates this approach.
Observations of these nearly overlapping sources with NuSTAR have been challenged by the instrument’s broad and off-axis-dependent PSF, leading to blended images in which pulsations from one or the other source are detected at different epochs without the two sources ever being spatially resolved. By employing a refined PSF model accounting for energy dependence and off-axis variations inherent in the telescope’s optics, we have increased the effectiveness of the RL deconvolution algorithm.
The ability to resolve such X-ray sources has significant implications for astrophysical research. For HMXBs like SXP 15.3 and SXP 305, accurately determining their individual fluxes, spectral properties, and temporal behaviors is essential for understanding their accretion processes, magnetic fields, and evolutionary states [28]. In crowded pulsar fields (as in the SMC), where multiple X-ray sources may be located in close angular proximity, enhanced resolution facilitates a more precise characterization of the source population and their individual contributions to the X-ray luminosity of the entire region.
Furthermore, the improved detection capabilities enabled by refined PSF modeling and deconvolution can also aid the studies of transient phenomena. Detecting outbursts, pulsations, or other temporal variations from faint sources requires not only temporal resolution but also the ability to spatially isolate the sources in order to avoid contamination from nearby objects. By enhancing the spatial resolution, we improve the signal-to-noise ratio for individual sources, enabling thus the possibility of more sensitive timing analyses.
Despite the advancements in this field of research, certain challenges and limitations remain: (a) The RL deconvolution procedure is sensitive to inaccuracies in the adopted PSF model; any mismatch between the modeled PSF and the actual instrumental response can introduce artifacts or erroneous features in the cleaned image. This necessitates ongoing efforts to validate and update the existing PSF models using observations of bright isolated point sources across the detector field. (b) Noise amplification is an inherent risk in deconvolution algorithms, particularly in low-flux scenarios typical of faint (galactic and extragalactic) X-ray sources. Regularization techniques and careful selection of iteration parameters are required to mitigate this effect.
5. Conclusions
Our study reveals the significant impact that PSF modeling and RL deconvolution can have on the analysis of NuSTAR observations of X-ray point sources by enhancing the spatial resolution and enabling the detection of multiple sources in close proximity (≳ 10″). In a case study of pulsars SXP 15.3 and SXP 305, we have tested these tools in an investigation of a faint crowded X-ray field in the sky. This approach, not only improves our understanding of specific astrophysical objects, but also contributes to the broader capability of X-ray astronomy to explore the very high-energy universe with greater precision and clarity.
Future work should explore the integration of spatially varying PSFs directly into deconvolution algorithms, allowing thus for the continuous and seamless incorporation of off-axis signal variations. Bayesian deconvolution and machine learning approaches may offer alternative ways to handle complex PSF attributes and noise characteristics. Furthermore, applying the same methodology to a broader set of observations carried out at different wavelengths and targeting more crowded fields of high source density can help evaluate the effectiveness of the procedure and identify telescope-specific requirements.
Acknowledgments
This research project was facilitated in part by the following funding agencies and programs: NSF-AAG, grant 2109004; NASA Astrophysics Data Analysis Program (ADAP), grants NNX14AF77G and 80NSSC18K0430; and the Lowell Center for Space Science and Technology (LoCSST) of the University of Massachusetts Lowell.
Author Contributions
Conceptualization, Project Administration, Resources, and Supervision, S.L.; Investigation, Methodology Formal Analysis, and Software, S.B., D.C. and S.L.; Writing – original draft, S.B.; Writing – review & editing, S.B., D.C. and S.L.
Conflicts of Interest
The authors declare no conflicts of interest.
Data Availability Statement
The raw NuSTAR data are publicly available at the HEASoft archive, URL: https://heasarc.gsfc.nasa.gov/docs/nustar/analysis/ (accessed on 26 October 2024). The reduced images will be provided by the corresponding author upon request.
Funding
NSF-AAG, grant 2109004; NASA Astrophysics Data Analysis Program (ADAP), grants NNX14AF77G and 80NSSC18K0430.
Abbreviations
The followingacronymsareusedinthismanuscript:
| CALDB | Calibration Database |
| DOAJ | Directory of Open Access Journals |
| FPMA | Focal Plane Module A |
| FPMB | Focal Plane Module B |
| HEASARC | High Energy Astrophysics Science Archive Research Center |
| HEASoft | High Energy Astrophysics Software |
| HMXB | High-Mass X-ray Binary |
| HEASARC | High Energy Astrophysics Science Archive Research Center |
| HEASoft | High Energy Astrophysics Software |
| HMXB | High-Mass X-ray Binary |
| HPD | Half Power Diameter |
| LD | Linear Dichroism |
| NS | Neutron Star |
| NuSTAR | Nuclear Spectroscopic Telescope Array |
| NuSTARDAS | NuSTAR Data Analysis Software |
| PSF | Point Spread Function |
| RL | Richardson-Lucy |
| SMC | Small Magellanic Cloud |
| SXP | SMC X-ray Pulsar |
| TLA | Three Letter Acronym |
| XIS | X-ray Imaging Spectrometer |
| XMM | X-ray Multi-mirror Mission |
| XRB | X-ray Binary Pulsar |
References
- Starck, J.L.; Murtagh, F. Astronomical image and data analysis 2007.
- Lewin, W.H.; van den Heuvel, E.P.; van Paradijs, J. X-ray Binaries; Vol. 26, Cambridge University Press, 1997.
- Tanaka, Y.; Shibazaki, N. X-ray Novae. Annual Review of Astronomy and Astrophysics 1996, 34, 607–644.
- Padovani, P.; Alexander, D.; Assef, R.; De Marco, B.; Giommi, P.; Hickox, R.; Richards, G.; Smolčić, V.; Hatziminaoglou, E.; Mainieri, V.; et al. Active galactic nuclei: what’s in a name? The Astronomy and Astrophysics Review 2017, 25, 1–91.
- Reynolds, S.P. Supernova remnants at high energy. Annu. Rev. Astron. Astrophys. 2008, 46, 89–126. [CrossRef]
- Sarazin, C.L. X-ray emission from clusters of galaxies. Reviews of Modern Physics 1986, 58, 1. [CrossRef]
- Cohen, J.G. Star formation and X-ray emission in distant star-forming galaxies. The Astrophysical Journal 2003, 598, 288.
- Putman, M.; Peek, J.; Joung, M. Gaseous galaxy halos. Annual Review of Astronomy and Astrophysics 2012, 50, 491–529.
- Weisskopf, M.; Brinkman, B.; Canizares, C.; Garmire, G.; Murray, S.; Van Speybroeck, L. An overview of the performance and scientific results from the Chandra X-Ray Observatory. Publications of the Astronomical Society of the Pacific 2002, 114, 1. [CrossRef]
- Harrison, F.A.; Craig, W.W.; Christensen, F.E.; Hailey, C.J.; Zhang, W.W.; Boggs, S.E.; Stern, D.; Cook, W.R.; Forster, K.; Giommi, P.; et al. The nuclear spectroscopic telescope array (NuSTAR) high-energy X-ray mission. The Astrophysical Journal 2013, 770, 103.
- Jansen, F.; Lumb, D.; Altieri, B.; Clavel, J.; Ehle, M.; Erd, C.; Gabriel, C.; Guainazzi, M.; Gondoin, P.; Much, R.; et al. XMM-Newton observatory-I. The spacecraft and operations. Astronomy & Astrophysics 2001, 365, L1–L6.
- Sakai, Y.; Yamada, S.; Sato, T.; Hayakawa, R.; Higurashi, R.; Kominato, N. Richardson–Lucy Deconvolution with a Spatially Variant Point-spread Function of Chandra: Supernova Remnant Cassiopeia A as an Example. The Astrophysical Journal 2023, 951, 59. [CrossRef]
- Koyama, K.; Tsunemi, H.; Dotani, T.; Bautz, M.W.; Hayashida, K.; Tsuru, T.G.; Matsumoto, H.; Ogawara, Y.; Ricker, G.R.; Doty, J.; et al. X-ray imaging spectrometer (XIS) on board Suzaku. Publications of the Astronomical Society of Japan 2007, 59, S23–S33.
- Sugizaki, M.; Kamae, T.; Maeda, Y. Deconvolution of Images Taken with the Suzaku X-Ray Imaging Spectrometer. Publications of the Astronomical Society of Japan 2009, 61, S55–S67. [CrossRef]
- Richardson, W.H. Bayesian-based iterative method of image restoration. JoSA 1972, 62, 55–59. [CrossRef]
- Lucy, L.B. An iterative technique for the rectification of observed distributions. Astronomical Journal, Vol. 79, p. 745 (1974) 1974, 79, 745.
- Bonettini, S.; Cornelio, A.; Prato, M. A new semiblind deconvolution approach for Fourier-based image restoration: an application in astronomy. SIAM Journal on Imaging Sciences 2013, 6, 1736–1757. [CrossRef]
- Mertens, F.; Lobanov, A. Wavelet-based decomposition and analysis of structural patterns in astronomical images. Astronomy & Astrophysics 2015, 574, A67. [CrossRef]
- Akhaury, U.; Starck, J.L.; Jablonka, P.; Courbin, F.; Michalewicz, K. Deep learning-based galaxy image deconvolution. Frontiers in Astronomy and Space Sciences 2022, 9, 1001043. [CrossRef]
- Caballero, I.; Wilms, J. X-ray pulsars: a review. arXiv preprint arXiv:1206.3124 2012.
- Coe, M.; Kirk, J. Catalogue of Be/X-ray binary systems in the Small Magellanic Cloud: X-ray, optical and IR properties. Monthly Notices of the Royal Astronomical Society 2015, 452, 969–977.
- Reig, P. Be/X-ray binaries. Astrophysics and Space Science 2011, 332, 1–29.
- Kretschmar, P.; Fürst, F.; Sidoli, L.; Bozzo, E.; Alfonso-Garzón, J.; Bodaghee, A.; Chaty, S.; Chernyakova, M.; Ferrigno, C.; Manousakis, A.; et al. Advances in understanding high-mass X-ray binaries with INTEGRALand future directions. New Astronomy Reviews 2019, 86, 101546.
- Okazaki, A.; Negueruela, I. A natural explanation for periodic X-ray outbursts in Be/X-ray binaries. Astronomy & Astrophysics 2001, 377, 161–174.
- Haberl, F.; Sturm, R. High-mass X-ray binaries in the Small Magellanic Cloud. Astronomy & Astrophysics 2016, 586, A81. [CrossRef]
- Antoniou, V.; Zezas, A.; Hatzidimitriou, D.; Kalogera, V. Star formation history and X-ray binary populations: the case of the Small Magellanic Cloud. The Astrophysical Journal Letters 2010, 716, L140.
- Lazzarini, M.; Williams, B.; Hornschemeier, A.; Antoniou, V.; Vasilopoulos, G.; Haberl, F.; Vulic, N.; Yukita, M.; Zezas, A.; Bodaghee, A.; et al. Neutron stars and black holes in the small magellanic cloud: the SMC NuSTAR legacy survey. The Astrophysical Journal 2019, 884, 2. [CrossRef]
- Monageng, I.M.; Coe, M.J.; Townsend, L.J.; Laycock, S.G.; Kennea, J.A.; Roy, A.; Udalski, A.; Bhattacharya, S.; Christodoulou, D.M.; Buckley, D.A.; et al. Disentangling the neighbouring pulsars SXP 15.3 and SXP 305. Monthly Notices of the Royal Astronomical Society 2022, 511, 6075–6086.
- Galache, J.; Corbet, R.; Coe, M.; Laycock, S.; Schurch, M.; Markwardt, C.; Marshall, F.; Lochner, J. A long look at the be/x-ray binaries of the small magellanic cloud. The Astrophysical Journal Supplement Series 2008, 177, 189.
- Christodoulou, D.M.; Laycock, S.G.; Yang, J.; Fingerman, S. Determination of the magnetic fields of Magellanic X-ray pulsars. Research in Astronomy and Astrophysics 2017, 17, 059. [CrossRef]
- Maitra, C.; Paul, B.; Haberl, F.; Vasilopoulos, G. Detection of a cyclotron line in SXP 15.3 during its 2017 outburst. Monthly Notices of the Royal Astronomical Society: Letters 2018, 480, L136–L140.
Figure 2.
Deconvolution of simulated closely-spaced sources demonstrating that the RL algorithm can enhance source detection in NuSTAR images.
Figure 2.
Deconvolution of simulated closely-spaced sources demonstrating that the RL algorithm can enhance source detection in NuSTAR images.
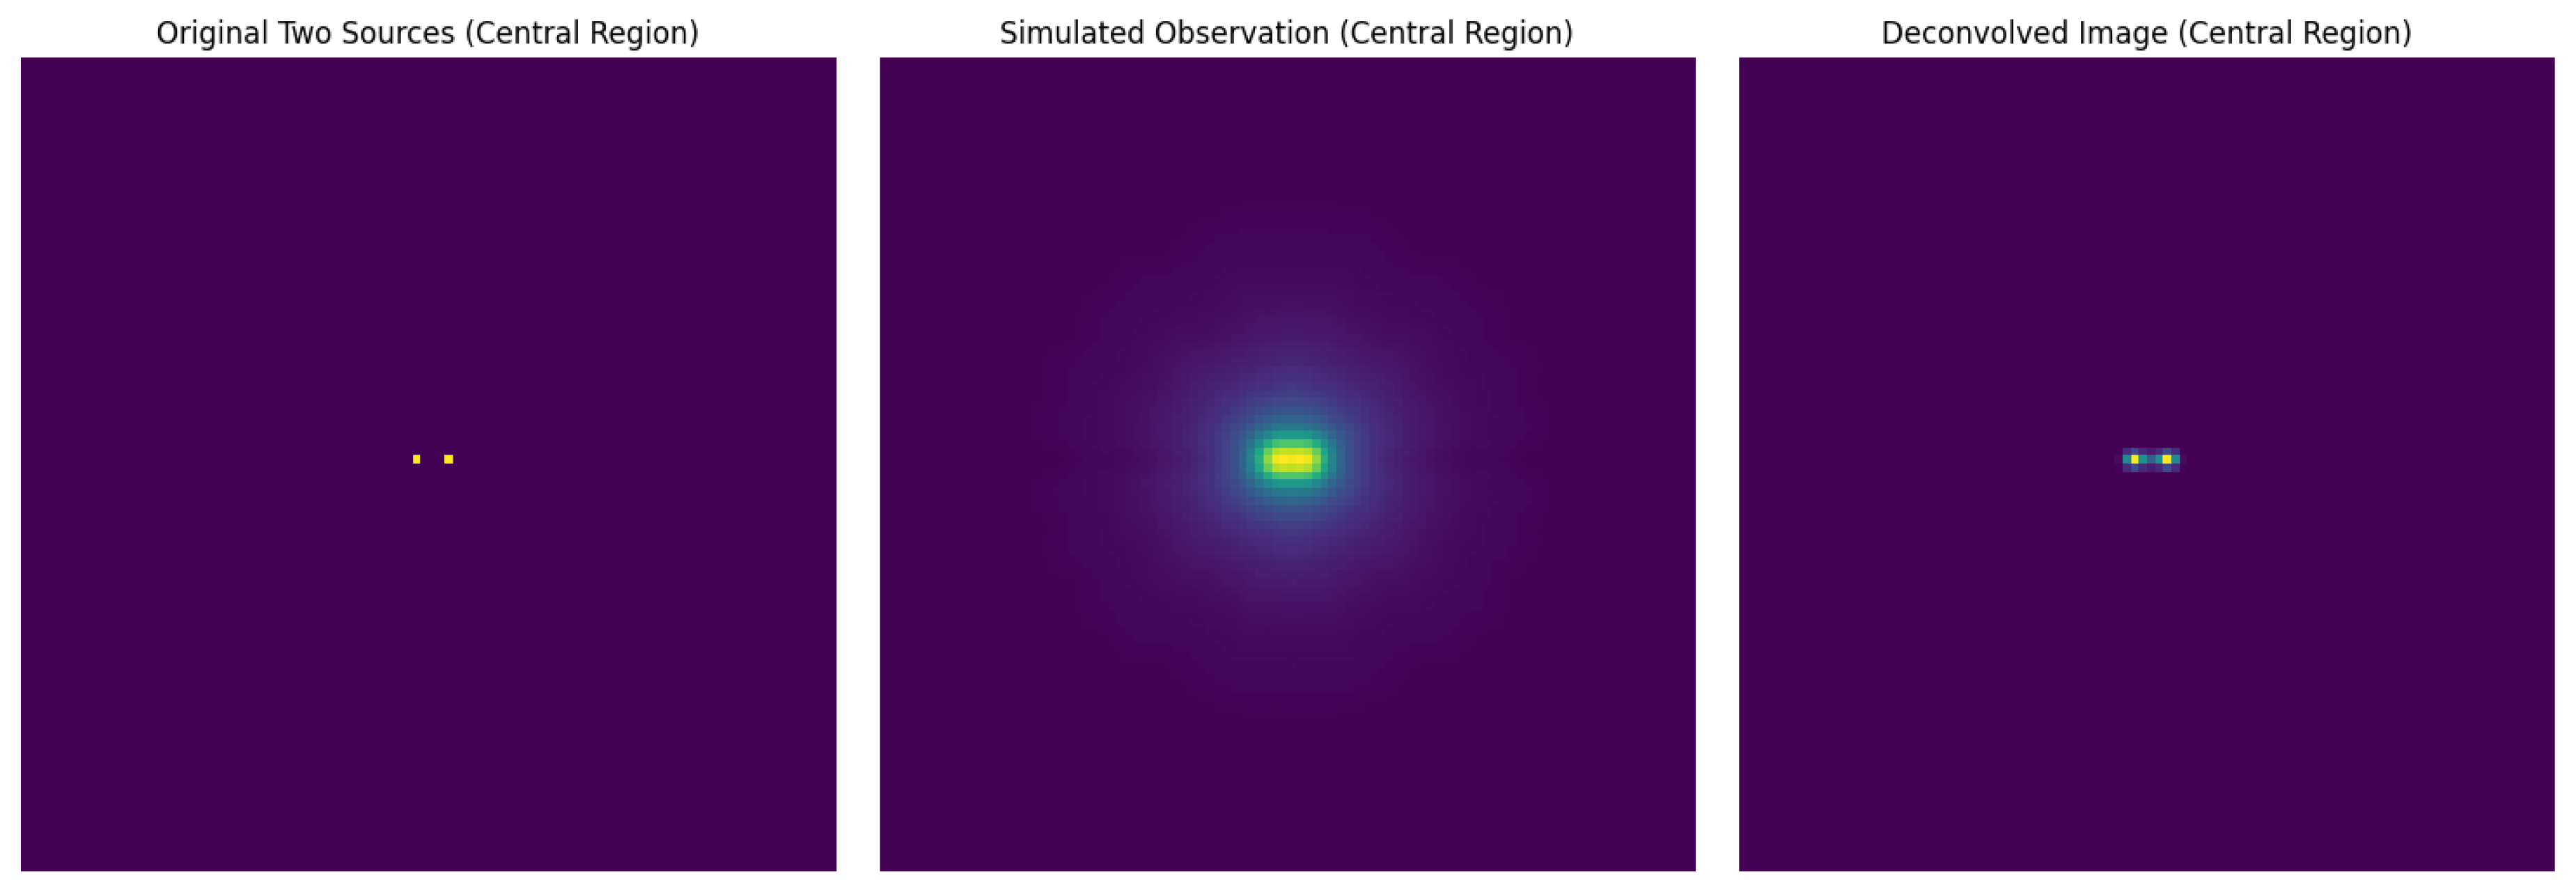
Figure 3.
Deconvolution of the original NuSTAR image. Left: Observed image of the sky field containing three sources, with our target circled. Center: The SXP 15.3/305 region cropped and centered by rotation. Right: Final deconvolved image using the off-axis PSF; the brighter source is likely SXP 305 since only 305-second pulsations were measured in this observation [27].
Disclaimer/Publisher’s Note: The statements, opinions and data contained in all publications are solely those of the individual author(s) and contributor(s) and not of MDPI and/or the editor(s). MDPI and/or the editor(s) disclaim responsibility for any injury to people or property resulting from any ideas, methods, instructions or products referred to in the content. |
© 2025 by the authors. Licensee MDPI, Basel, Switzerland. This article is an open access article distributed under the terms and conditions of the Creative Commons Attribution (CC BY) license (http://creativecommons.org/licenses/by/4.0/).
Copyright: This open access article is published under a Creative Commons CC BY 4.0 license, which permit the free download, distribution, and reuse, provided that the author and preprint are cited in any reuse.


