Submitted:
14 February 2025
Posted:
17 February 2025
You are already at the latest version
Abstract
Cohesive human-robot collaboration can be achieved through seamless communication between human and robot partners. We posit that the design aspects of human-robot communication (HRCom) can take inspiration from human communication to create more intuitive systems. This however, this must be achieved at no additional effort to the human operator and must be personalized for greater safety and team fluency. A key component of HRCom systems is perception models developed using machine learning. Being data-driven, these models suffer from the dearth of comprehensive, labelled datasets while models trained on standard, publicly available datasets do not generalize well to application specific scenarios. Involvement in these interactions lead to more uncertainties and complexities. Taking into account these challenges, a novel framework is presented that leverages existing domain adaptation (DA) techniques off-the-shelf. Statistically-Informed Multimodal (Domain Adaptation by Transfer) Learning (SIMLea) takes inspiration from human communication to use human feedback to auto-label for iterative DA. The framework presented can handle incommensurable multimodal inputs, is mode and model agnostic and allows statistically-informed extension of datasets. SIMLea allows neural network based models to adapt and personalize to the interacting humans, thus leading to more intuitive and naturalistic HRCom systems.
Keywords:
human-robot communication
; iterative domain adaptation
; personalized machine learning
; feedback enabled labelling
; machine perception
; model personalization
1. Introduction
While automation led to the development of robots (and other embodied computer systems) that perform repetitive, non-ergonomic, and dangerous jobs in the industrial sector, human operators are still unparalleled in carrying out precise tasks that require dexterity and flexibility. The complementary nature of human and robot agents’ capabilities forms the basis for the design of a shared workspace for the two types of agents to collaborate. Enmeshing of complementary capabilities of humans and robots has been proven to increase task efficiency, accuracy, quality, and general comfort (for the human) [1,2]. The endgame thus is to achieve the seamless team dynamics and communication fluency of an all-human team captured in the eponymously named sub-field of human-robot collaboration (HRC) [3].
Humans use multiple senses to understand their environment: sight, sound, touch, smell, and taste. Analogous operations have been carried out for robot or more generally, machine perception as well ranging from voice command recognition, object detection and recognition, semantic segmentation of scenes, and recognition of haptic signals for physical HRC amongst others [4]. These complex, high-dimensional data are learned by robots using deep convolutional neural networks (CNN) used for supervised learning (SL).
The metrics used to vet the usefulness of perception systems have been accuracy, precision, and efficiency. But as we as a society move ever closer to a more humanistic way of conducting business, the aspiration for an enjoyable, safe work-cell needs a more profound manner of design and evaluation. Our previous work in the critique of human-robot communication (HRCom) compared to natural human communication through the lens of complexity theory [5] argued that the former has a deficit of two important characteristics: feedback and multiplicity. Multiplicity refers to the variety in cultures, languages, and traditions that lead to large variability in the communication behaviour of humans while feedback is the circularity of actions in communication that are used to regulate the actions of the agents. Both aspects of HRCom - communication frameworks and robot perception systems built with CNNs can take advantage of knowledge from human communication to create more intuitive systems that truly leverage the presence of the human collaborating agent as something more meaningful than just a command centre.
- Challenges to SL in the context of Human-Robot Communication: Machine learning (ML) models are predominantly trained under the assumption that they will be operating in a closed-world scenario i.e., the test data it encounters will be drawn from the same distribution as the data on which it has been trained [5]. This is referred to as the data being in-distribution (ID). But real-world applications with the dynamics and uncertainties attached to the continually changing environment seldom generate ID data. Instead, test data are often sourced from a different distribution than that of the source i.e., from a domain-shifted distribution or out-of-distribution (OOD). This open-world approach [6] typically leads to poor performance of the model, even though the latter may be well-trained on ID data.
The distributional shifts may be caused due to differences in classes. In other words, the perception system encounters an instance or an object that it has not been trained for (semantic shift) or of instances of the same classes as training but in a change in the distribution (covariate shift). Even changes that are visually trivial to humans may be significantly covariate shifted enough to lead to degraded prediction accuracies. In a setup for HRCom, covariate shift in data distribution may arise due to change of any component of the scene (human or environment) or change in the sensor capturing the information, leading to a statistical shift in the distribution. Instead of rejecting such shifted observations, the robot perception and in turn communication model must be updated with the typical behaviours of the human(s) it encounters. In other words, much like the adjustment behaviours in an all human team, the models must be adapted or “personalized” to the behaviour of the human partner for more humanistic design of industrial systems.
Finally, as data-driven methods, deep CNNs require large amounts of labelled data, a very time and resource-consuming endeavour. The cost of creating such datasets with human participants requires additional efforts of securing permission from ethics boards, gathering participants, and then gathering data apart from pre-processing and annotating said data. The challenge stems from sampling bias that renders no sample constituting a dataset truly representative of the complex environment in which the human and the robot must collaborate. Thus, various techniques under domain adaptation have been developed for enriching the model on encountering domain-shifted data. A point to be noted here is that from here on, shift refers to covariate shift since that is the nature of the data studied for this paper.
The aim of this work is to develop a framework leveraging existing ML domain adaptation techniques for ensuring that the robot perception model performs as well in the real-world as it does in the hermetic lab conditions in which it has been developed. Particularly, the framework tries to enable higher specificity of the model towards data from the human(s) interacting with it within that application. The presented framework takes inspiration from natural human communication and uses real-time human feedback to auto-label shifted data in order to use computational resources only when needed. The setting in the presented work is primarily designed for "industrial" systems since robots in healthcare or social interactions would require to have perception systems that recognize affect data or health indicators as examples. In industrial settings, especially in the context of communication, commands would be common and nuances of emotions in communication signals would not have to be dealt with.
2. Background and Related Works
2.1. Personalization Of ML Models For HRCom
In human-computer interaction, personalized speech emotion recognition (SER) achieved through adaptation using maximum likelihood linear regression was studied [7]. Iterative unsupervised approach was taken for automatic labelling of SER data. This led to higher accuracy and reduced recognition errors. In the realm of gestures, researchers found that personalization during a collaborative task reduced the mental and physical workload of the humans leading to higher preference of such systems by the participants [8]. In another study, the approaching behaviour of service robots was found to have higher user satisfaction when the physical behaviour of the user was perceived and adapted to [9]. The personalized preference of the humans was learnt using feedback. In the field of social robotics, in applications such as elderly care, interactions with children with autism spectrum disorders, [10,11,12,13], and [14] found higher engagement amongst users and showcased good acceptability and positive response from users through usage of personalization.
Personalized driving experiences are a popular line of research for prediction of human driving behaviour through development of driver models to check driver impairment [15,16,17] as a first step to ensuring safety of drivers. The limitation of the study in [17] was that labelling was carried out manually and the learning was offline. For continuous adaptation and personalization in safety-critical operations, learning should be online and driven by automatic labelling of shifted (new) human data. This has been previously developed in literature [18] in which Training an Agent Manually via Evaluative Reinforcement (TAMER) framework allowed human trainers to shape positive or negative reinforcement for agents.
Apart from the above incentives for personalization of ML models applied to collaborating robots, productivity would be hampered if the human worker is expected to adapt to the robot’s work behaviours [19]. Miscommunications in that regard may compromise safety as well. A study found that workers in highly specialized roles e.g., the aerospace manufacturing factory considered, develop highly idiosyncratic work patterns that must be learnt and adapted to by the robot partners for increased team fluency [19]. In [20], short-term parameters of human behaviour like dynamic intent (motivation), availability, and capability as well as long-term ones were adapted through a novel Adaptive Bayesian Policy Selection (ABPS) mechanism based on the estimate of a human’s task expertise and collaboration preferences giving rise to higher efficiency.
2.2. Adaptation of Shifted Data
The dearth of labelled datasets for training has been effectively tackled by using transfer learning (TL) wherein a pre-trained model is used as a starting point to train on the much smaller labelled dataset. This is an extremely common step in deep learning wherein the idea is to re-use the model that has already learned general features like edges, shapes, and colours in data for improved computational efficiency. ImageNet [21] with 1000 object classes, 1,281,167 training images, 50,000 validation images and 100,000 test images, is a typical dataset used for this purpose.
Currently, multimodal inputs are detected and classified by machine learning (ML) models by learning a generic feature representation using a large dataset such as Imagenet or MS COCO [22] with over a million labelled images and then fine-tuning based on the required specific application. This pipeline is followed for almost all aspects of SL such as semantic segmentation, object detection, and pose estimation. Neural network architectures have been developed to leverage these features and achieve high accuracies on ID data.
Domain Adaptation (DA) is a class of techniques that aims to align features between the labelled source domain and the unlabelled target domains so as to increase the performance of the model in both domains. Essentially, DA is a special case of TL. In cases where the target domain is fully annotated, it is called Supervised DA. In [23], researchers introduced classification and contrastive semantic alignment loss to guide samples from different domains but same classes to map to the feature space created from input data. In Unsupervised DA (UDA), labels from the target domain are completely missing. [24] developed a methodology based on paired RGB images in both source as well as target domains. In another study, authors proposed a novel Residual Transfer Network to simultaneously learn adaptive classifiers and transferrable features [25]. The assumption was that the source and target classifiers differed by a small residual function.
One class of DA techniques exist called Iterative Algorithms that aim to “auto-label” target domains iteratively. Co-Training for Domain Adaptation (CODA) was presented in [26]. The methodology involved slowly adapting the training set from the source to the target domain by inclusion of target instances with the highest confidence scores. Co-training [27] as an example of unsupervised DA assumes the existence of two separate views of a single object and two trained classifiers respectively. At each iteration, only inputs that possess confidence scores above the threshold from only one of the two classifiers are moved to the training set; thus, one classifier provides labels while the other the data. CODA performed the same by training two classifiers on different sets of features of the same view.
2.3. Extension of Previous Work
From the discussion above it is to be noted that if “paired” sources of data exist or multiple views of the same object or scene can be utilized, then off-the-shelf domain adaptation methodologies may be used for enriching the model with shifted data. Therein lies the challenge since for HRCom such extensive and synchronized labelled data is not available. Therefore, more innovative methodologies must be looked into. Additionally, multimodal data can also often be incommensurable such as in the case of facial expressions and voice commands or hand gestures and voice commands and thus are challenging to use as synchronised datasets for model training. In such cases too, an off-the-shelf application of domain adaptation techniques may not be feasible.
The shortcomings of SL for HRCom include inter alia the lack of large, labelled datasets, and if labelled datasets are available, for domain shifts, paired or otherwise multi-view and labelled datasets are challenging to obtain. Thus, unlabelled data of the new domain must be used in conjunction with labelled ones to adapt to the new domain. As the human or the work-cell environment changes, the composition of the scene changes leading to shift in domain. In order to prevent data drift and in turn calibration drift from the dynamic environment, the ML model must learn continuously [28] thus requiring the framework to be iterative in nature. Cost of labelling and training prohibits a constant state of online learning, something that generalization and adaptation techniques do not take into consideration. In technical considerations, practitioners must stop the model from learning a dataset after it reaches an appropriate minimum, else the error begins to rise again. Thus, the adaptation framework must track when to start and stop training the model.
In a previous work [48], personalization through feedback-enabled human-robot communication (PF-HRCom) framework was implemented using facial expression recognition as a safety feature for tracking engagement of the human in the collaborative task with the robot. The collaborative task considered was a handover task of a tool from the robot to the human. The robot would continue the handover sequence while tracking the facial expressions of the human and ensuring that the expressions remained "engaged" or positive. The robot would stop operation if the perception system recognized the expression as being "not engaged" or negative in order to ensure the safety of the human. The seven types of emotions (anger, sad, afraid, happy, surprised, confused, and disgust) were not tracked individually, instead only "engaged" or positive and "not engaged" or negative emotions were since it our work deals with industrial use-cases and the nuances of each emotion is not expected to be encountered in such applications. The reader may refer to the video of the implementation attached to our previous work.
Voice commands were used as feedback to generate labels for shifted data when the robot perception system encountered “confusion” in its classification model. PF-HRCom used labelled test sets to gauge the efficacy of the personalization framework. This work builds upon PF-HRCom structure but instead of using labelled datasets while testing, the current work uses a statistical metric to determine the efficacy of using transfer learning for adaptation and when to start and stop the learning process. While the modalities of facial expressions and voice commands were implemented in [29] to a handover task with a 6-DOF Kinova arm using the framework developed, this work uses hand gestures to demonstrate the contributions discussed above. As a proof of concept of iterative transfer learning and feedback generated labels, the previous work used the authors (one male and one female) as participants for the implementation.
3. Methodology
In order to carry out domain adaptation, the framework must detect domain-shifted data. SoftMax probabilities are used to evaluate model performance where labelled test data is available. The usage of SoftMax probabilities for estimating accuracy of models is challenging in domain-shifted cases that lack labelled test data. This is because the use of the SoftMax function in neural network classifiers leads to the classification of OODs with high confidence since exponential functions in SoftMax lead to a large increase in output for a minor increase in input [30]. Studies carried out using Uncertainty Quantification methods: Deep Ensembles, Monte-Carlo Dropout, Learned Confidence, and Evidential Deep Learning were compared to each other and to the default SoftMax confidences, which served as a baseline to study the OOD detection capabilities using uncertainty measures [31]. None of the uncertainty quantification methods were successful in detecting all OOD samples. Out of the methods tested, deep ensembles demonstrated the best performance which may be because of their better accuracy baseline. Another perspective on the inefficacy of using accuracy scores as OOD detectors is that say a classifier provides scores for the positive and negative classes. But, if it is biased towards one of the classes, i.e., it is far more likely that one of the classes is detected, the model might obtain high accuracy if the dataset has more of that class than the other. This though is not a true picture of the model’s performance [32]. In the cited study statistical analysis of information derived from the SoftMax classifier probabilities was shown to be able to detect errors and out-of-distribution examples. This provides a strong intuition to look into statistical measures for OOD detection in conjunction with heuristic decisions to answer the design requirements of when to start and stop training.
The perception of relational similarity, a cornerstone of human cognition, enables abstract, higher-order thinking and aids in learning [33]. In the sphere of communication, expressions of similarity in the form of metaphors and similes make language profound and nuanced. Similarity is thus an evocative metric to base robot learning strategy as well, especially one that must learn continuously throughout its operation. This necessitates the addition of the concept of a similarity (S) metric as a check for calculating and visualizing the covariate domain shift that occurs when the model encounters new (user) data.
3.1. Contributions
With these considerations in mind, the paper proposes a novel framework for human-robot communication which as a use-case of domain adaptation: SIMLea: Statistically-Informed Multimodal (Domain Adaptation by Transfer) Learning. The following are the contributions of the same.
- 1.
-
For the development of a robust ML system, SIMLea leverages the advantage of the existence of publicly available, large datasets of multimodal data and high-accuracy models trained on them. These models can provide feedback during continuous operation so that new data from the user can be labelled using that feedback. This feature leverages real user feedback to auto-label user data during operation mimicking a key component of natural human communication wherein feedback is used to continuously update the knowledge associated with the shared task and its status.Feedback-driven labelling involves the human from whom the data was generated. This would reduce mislabelling that typically occurs when high-dimensional and complex communication data is labelled by a third-party and out-of-context. From an ML perspective, this allows the extension of the model’s learnt feature representations with those of new, covariate domain shifted data and personalization of the model to the collaborating human. The advantages are that the robot perception model is tuned to the typical behaviour of the human, making it more intuitive for the human.
- 2.
- Apart from utilizing off-the-shelf high accuracy models for generating feedback, in contrast to the current research under domain adaptation and domain generalization, SIMLea is designed to allow feedback to be used from incommensurate modes of communication. This feature allows the framework to be mode agnostic and flexible in application.
- 3.
- Statistical measure of similarity is used to drive the adaptation framework. Thus, models under SIMLea are empowered to learn only relevant data and start and stop the computationally heavy learning process when required. Ergo, during continuous operation, the model learning is judicious. Implementation of this aspect is in Section 5.2.
- 1.
- SIMLea allows the amalgamation of empirical thresholds and standards and application-specific heuristics. It is an add-on to the ML model and does not require change in its architecture.
- 5.
- Finally, while hand gesture recognition task is used for implementation of the framework, other human-generated datasets for communication can be used as long as the feedback-giving mode exists that can be used for auto-labelling.
- The paper does not introduce a new method for domain adaptation. Instead, it presents a framework for leveraging existing DA and similarity measurement techniques for HRC applications which would typically face the above-mentioned challenges as compared to straight-forward DA applications.
3.2. Assumptions of SIMLea
The assumptions taken under which the framework has been developed are as follows.
- 1.
- As mentioned before, the system only encounters covariate shifted data. This means that all commands from the human are "correct" in the lexical sense and will fall into one of the pre-trained classes.
- 2.
- The deployed base model (model trained on standard, publicly available dataset) is well-trained on the standard dataset i.e., it performs well on the test set of that dataset. This assumption is extrapolated to the iteratively generated models as well since the shifted data is from the same application and is similar to the original data, ipso facto, the training parameters could be re-used for TL without change. By well-trained, one refers to the models possessing the required trade-off between bias and variance, determined based on tribal knowledge of the application.
- 3.
- The ML classifier that understands (recognizes) feedback from the human has high variance and high accuracy.
In this work, voice command (VC) has been used to generate feedback. The third assumption is true for voice command classifiers trained on large publicly available datasets and on simple commands. As an example, VC classifiers can be trained using Google Speech Commands dataset [34] which contains 65,000 seconds of recorded and annotated data by thousands of participants. In comparison, other modes of communication such as hand gestures (HG) for specific applications such as the TinyHand dataset contain data from only 40 individuals [35]. The disparity in data leads to disparity in model performance which can be tackled using SIMLea.
3.3. Metric for an Informed Approach to Domain Adaptation
In the absence of labelled datasets for testing, unsupervised formulations for quantifying domain shift may be used for an informed approach to DA [36,37,38]. CNNs learn data through the creation of feature representation spaces specific to the datasets. Thus, using statistical distance in the analysis of this space instead of the data space may be more responsive to better understanding the shift in the distribution. This distance can be visualized as a similarity measure between the datasets. Small visual domain shifts get more pronounced as the data passes through the trained model. This is because deep learning architectures are highly parameterized and can learn the finer details of the data thereby losing variance in favour of being biased towards the training data. As the data travels deeper into the model, the representation space becomes more and more abstract. Finally, the fully connected layers use these representations to assign a class during a classification task. The vast collection of dependent weights and biases renders the model highly sensitive to small variations in the visual data. Thus, perceptually small (to the human) perturbations in data may lead to large statistical domain shifts in the model’s understanding.
3.4. Covariate Domain Shift as a Measure of Similarity
A statistical distance metric between the original training set (ID) or "source" and the new data or "target" can be used to determine the “similarity” (S) between the source and target domains. A universal definition of similarity to a given dataset may be a non sequitur because the representation space used to compare datasets are highly dependent on the model’s architecture, training, and hyperparameter values. Thus, “similarity” must be empirically defined as a consequence of the application and the requirements. Conservative approaches must have a lower range of features it considers similar while less conservative ones may contain higher variance. The application-specific thresholds have been defined in Section 4 where validation tests on HG data are discussed. The contributions of the paper lie in the framework for domain adaptation and not in the formulation of the specific metric for determining S.
As mentioned above, the similarity metric should be selected based on the type of data and application. The reader is directed towards two reviews on literature on similarity metrics [39,40], a work on image similarity through the use of ranking [41], usage of A-distance in domain adaptation to measure the distance between source and target domains [42], and a list of distance metrics that can be used to measure similarity [43]. Depending on the application, OOD detection techniques may also be used: anomaly detection [44], novelty detection [45], open set recognition [46], and outlier detection [47] or uncertainty quantification methods such as Deep Ensembles, Monte-Carlo Dropout, Learned Confidence, and Evidential Deep Learning [31].
3.5. Factor for Cessation of Domain Adaptation
The larger the value of S, higher the similarity between the datasets. This measure is used to determine if the adapted and newly generated model after an iteration of SIMLea has learnt the features of the new dataset. If it is found during an iteration that the new S is still small, new data would be collected to proceed towards another iteration of training. If S is increased to now lie within the threshold that one can confidently say that the model has learnt the new features, then the iterative training can be ceased, and the communication system would begin using the newly generated model for operation.
Use of an unsupervised statistical distance between the representation spaces of the source and target distributions to determine S would allow the framework to be model agnostic. This is because it would be an add-on component to the model without requiring any change in the architecture or hyperparameters. This S can then be used for monitoring the execution of the framework and the performance of the model. The decision to employ this monitoring analysis continually or after certain intervals is at the discretion of the engineer.
3.6. Criterion for Feasibility of Transfer Learning
The criterion for feasibility of transfer learning will depend on the application parameters. The threshold could be determined using size of dataset used, number of training epochs required, or time of training in order to reach a particular performance metric. These are typically empirically determined. For the purpose of this paper, we have used number of epochs to determine the feasibility of transfer learning.
In the human-generated datasets used in this paper (HG), the number of epochs required for 20%+ improvement of prediction accuracy scores have been in the range of 2 to 3. As more dissimilar datasets need to get adapted to it is logical that the more time the model needs to train on and hence the number of epochs would increase. So, for the purposes of illustration of SIMLea for HG, the number of epochs required for a feasible application of TL for DA is about 3.
We have used number of epochs as the criterion because we are using hand gestures created for a virtual environment as one of the datasets for adaptation studies. This would be a case wherein TL would not be suitable and training a model from scratch would be the best use of computational resources. Creating this dataset is a computationally expensive task, therefore, we could not create comparable number of images as the "real world" dataset, hence, size of dataset could not be used as a criterion. Also, the image size of the real and virtual datasets were different, leading to different training times for the same number of epochs. Therefore, number of epochs were deemed to be a good comparison.
Let us consider this case: for an HRC, or more generally, a human-machine interaction scenario, a virtual reality (VR) environment (VEnv) linked to the real-world environment (REnv) may contain a representation of the human in it. The real HG in REnv may be re-created in the VEnv which would then be recognized using an ML model, much like REnv gestures. Thus, the VEnv may be conceived as composed of two parts – the representation of the human through a humanoid model and the setting of the immersive scene which includes the light(s), the virtual sensor(s), other interacting object(s) and artifacts such as walls, floor, ceiling, their colours and so on. For developers, the construction of the scene is arduous but that of the humanoid with the complicated gestures is harder still, consuming large resources and time. Gestures which seem simple and ubiquitous in REnv need to be meticulously created by programming multiple joints. In order to simulate the dynamic nature of the industrial setting or work-cell, variability in the positioning of the humanoid as well as variability in the positioning of the hand, the degree to which the gestures are performed and the setting of the work-cell itself must be represented in the dataset. This constitutes an HG dataset that is recognizable by humans belonging to the specific classes as the REnv dataset but is so dissimilar from the perspective of the representation space of the model that TL would not be feasible for adaptation. This is reflected in the S values that are much lower than those for HG datasets in the REnv and is further confirmed on attempting TL wherein epochs are required to achieve comparable gains in accuracy.
Thus, a sliding scale may be developed for discerning the feasibility of TL using the statistical measure of similarity. As mentioned, it is not an absolute scale but must be determined based on the application. Indeed, between the extremes of a feasible dataset and a completely infeasible one (such as the VEnv HG dataset), there are many wherein the engineer must make decisions that are purely heuristic in nature and are thus not examined in this paper.
3.7. SIMLea Framework
The proposed novel framework for personalization through domain adaptation in HRCom consists of the following steps.
- 1.
- Train an ML model with a standard, publicly-available dataset such that it performs well on ID or source data: base model (model0).
- 2.
- Collect the new user data and store in memory. This data is unlabelled since it gets generated real-time by the user interacting with the robot. Calculate the similarity score (S) between the trained (in-distribution) data and the incoming user (covariate shifted) data.
- 3.
- If the similarity score is higher than a pre-set threshold (that is application and model specific), then the model can be effectively deployed and used for inferencing with the new data. If on the other hand the data are dissimilar, then transfer learning may be used if deemed feasible.
- 4.
- The next step is a checkpoint to test if transfer learning would be effective for domain adaptation. The similarity score obtained in step 2 is used again. If the covariate shifted dataset is similar to the in-distribution data, then iterative re-training can be used. If the datasets are very dissimilar, then instead of transfer learning the model should be trained from scratch and the new model deployed. Such a case may indicate a significant shift in the domain data and either the new data needs to be rejected or the model needs to be changed.
- 5.
- In the case of re-training, endeavouring to keep dataset size low, a small number of empirically determined instances per class of the covariate shifted data are then auto-labelled by the robot asking for multimodal (in this case, verbal) feedback from the user as per the work in [48].
- 6.
- The model is iteratively re-trained with the new batch of covariate shifted user images mixed with a larger batch of the source dataset or in-distribution data as per the work in [48].
- 7.
- Once the new model is generated, the representation space of this model is used to gauge the similarity of the two datasets and the loop is re-traced. This ensures that minimal amount of user data is required for effective learning of the model and is auto-labelled on a need-only basis.
The framework ensures that the model stops learning iteratively and consuming resources once it has:
- Case 1: either learnt the features of the target dataset well
- Case 2: or it can no longer benefit from transfer learning because the datasets are too dissimilar.
Larger batches of data may also be used and would be beneficial for faster DA and any similarity index may be used, thus making the framework quite flexible for deployment. In order to save resources and potentially down-time while the robot perception system analyses new data, the option for similarity analysis can be triggered manually when a new user is added or the work-cell changes or the sensor changes instead of it being automatic for all incoming data. As the model gets deployed for long period of time and increases its variance (with relevant data), the engineer can choose to trigger the analysis only periodically, electing to let some changes not lead to new re-trainings.
Furthermore, while human-generated datasets are the primary focus of this work, the framework can be used in continuous learning in other applications as long as the feedback-giving agent exists that can be used for auto-labelling. Validation tests have been carried out using HG datasets and examined in the next section. Figure 1 presents the consolidated framework of SIMLea.
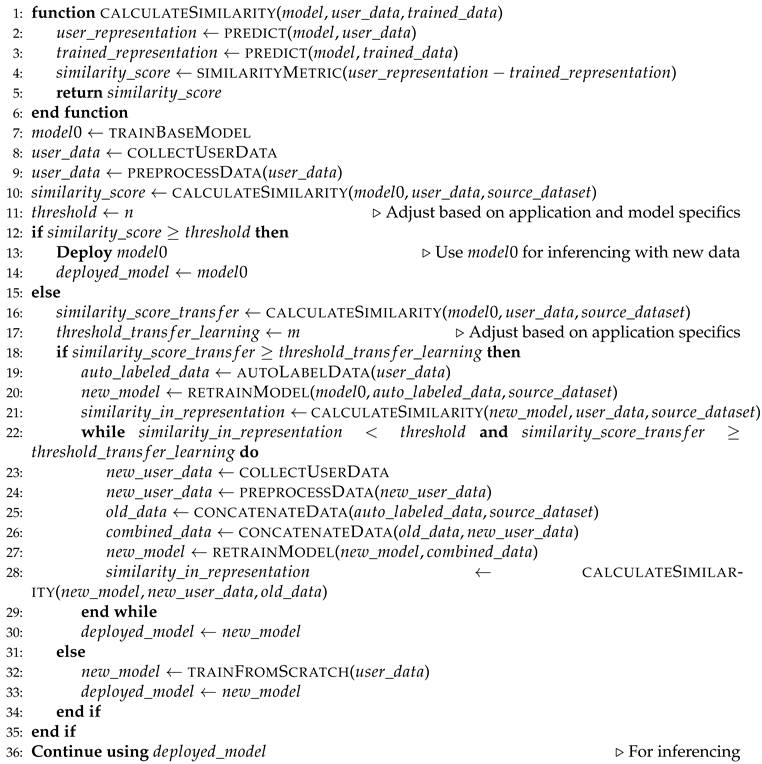
The pseudo code for calculating the representation shift is presented in Algorithm 1. similarity_score is calculated using a placeholder similarity metric function that has to be selected according to the application. Similarly, the threshold n is heuristic in nature. auto_labeled_data is generated using another placeholder function which in our previous work was voice command based labelling.
| Algorithm 1 SIMLea algorithm |
 |
4. Validation of SIMLea with Hand Gesture Recognition Data
In order for TL to work effectively, data from all classes must be used at every iteration and for human communication data similar to the training data, small batches of shifted data perform are sufficient for the model to learn. Furthermore, the batches for TL must be composed of a higher fraction of data from the source dataset.
4.1. Variance in HG Datasets
For the presented work, an HG classifier using VGG 16 [49] was trained with a publicly available hand gesture dataset: Image database for tiny hand gesture recognition [35], hereon referred to as TinyHand or TH. The dataset used is composed of seven hand gestures carried out with by 40 participants (male and female) with their right hands: fist, l, ok, palm, pointer, thumb down, and thumb up. RGB videos were collected with 1400 colour frames for each gesture. These hand gestures may be considered quite typical for communicating with a robot or other intelligent system. Variability has been added by the creators of the dataset by incorporating gestures performed in different locations in the images as well as by having the participants positioned with a number of different backgrounds both cluttered as well as clean, solid coloured, and with variation in illumination. The human face and body occupy the majority of the image while the hand occupies only about 10% of the pixels of the image. In a dynamic industrial environment, the human may not always be positioned in a central location or have the hands close to the camera, thus, the dataset was selected to mimic these inconsistencies in sensor data. Out of the 40 individuals, 25 had a clean, uncluttered background and the humans in a seated position. TinyHand Uncluttered Dataset or THUC is used to refer to this subset of TH. The remaining had different cluttered backgrounds and the humans standing, here referred to as THC (TinyHand Cluttered). For the tests carried out for SIMLea, THUC was used with gestures from 23 participants split into training and validation sets in the ratio of (70:30)% and the remaining two used as test sets. The training and validation set finally contained 62,035 images and the test set 4719.
The training parameters used were 0.01 learning rate, 16 batch size, and stochastic gradient descent optimizer run till 13 epochs. The data augmentations carried out on THUC training set were lateral shifts so as to not overfit the model to expecting the human to be at the centre of the scene, shears so that the fish-eye effect of certain cameras could be trained for, zoom to mimic the varying distance of the human from the camera in a dynamic environment, small rotation and brightness shifts to allow for dynamic lighting conditions. The trained VGG16 model (model0) was then tested on the THUC test set and had an accuracy of 0.96.
In order to simulate covariate domain shifts, three user datasets were created. These consisted of the author carrying out the seven gestures. In the first instance, the human (the author) of the scene is changed without any change in the environment. To clarify, the environment was uncluttered, a solid shade of gray similar to that of the source training set. In this dataset, the user gestured in a seated position and gestured with their right hand. This dataset is denoted by User Dataset 1 or UDS1. To simulate a change in both components of the scene, the User Dataset 2 (UDS2) consisted of the user (the author) seated in front of a cluttered background which is different from the background of THUC and also THC. Finally, to add more variations, User Dataset 3 (UDS3) had the user in a standing position in front of a cluttered background. Finally, to demonstrate a situation where the application of TL is not useful, a VEnv dataset (VDS) was also created using a skin-tone-coloured humanoid carrying out all the gestures in the above-mentioned classes except pointer since the “pointing” gesture is usually an in-built option in VR environments and for the VR application, the default one was used. Figure 2 provides a sample of images from all the datasets grouped by image classes.
Apart from the difference in the human or humanoid, the environment of the scene, and the variations in the “correct” gestures themselves (evident through the variety of deployment of the joints of the arm, their angles with respect to the body and the camera), the difference in the sensor too leads to a covariate domain shift. Notice that the resolutions of THUC, UDS1 and 2, and UDS3 are different although when passed through the model, they would all be scaled to fit (224, 224, 3) where 3 indicates the three RGB channels. The VDS images are captured through a virtual sensor and thus more agreeable to customized specifications that could be made closer to the original or source dataset.
It is important to point out the rationale for not including left-handed gestures. Some gestures such as ok, fist, palm remain semantically invariant even when carried out by the left hand. Others such as l carried out in the same way as the right-handed one (i.e., index fingers pointing upwards, thumbs pointing towards the body, and the remaining fingers curled downwards and facing outwards) do not semantically mean l anymore. Under natural circumstances, the human would not use the same way to indicate such laterally variant gestures. Thus, in order to retain focus solely on covariate shift for this study, only right-handed gestures were considered. Even when lateral inversion is used as a data augmentation tool in Section 5.3, this behaviour of l class of gestures is ignored and semantic shift is left to be delved into in future work.
4.2. Covariate Domain Shifts in User Data
The model naming conventions are as follows:
- model0 or base model is trained using standard dataset THUC in all tests except that in Section 5.3 where both THUC and THC are used.
- Iterative re-training of model0 on user-labelled data mixed with a portion of standard data generates modeln where n refers to the number of iterations.
model0 is used to determine the domain shifts in user data. Intuitively through (human) visual inspection, the degree of similarity to THUC would be highest for UDS1 followed by UDS2, UDS3, and finally VDS. This hypothesis should be validated through the use of covariate shift metric as well.
4.2.1. Shift Analysis with THUC Test Set as Source:
Stacke et al. proposed an unsupervised formulation called representation shift (RShift) to measure the statistical distance between the feature representation spaces of source and target domains [50]. The shift metric (R) is calculated using KL divergence between the outputs of max pooling layers averaged over all the filters of that particular layer for each dataset. The output of convolution layers are not used due to the high dimensionality of the data which would make analyses extremely computationally heavy and would in turn render the model impractical for operation. For zero values in the distributions, a small constant (.001) was added for numerical stability. A caveat to be remembered is that the discrepancy as calculated through RShift is the model’s understanding and not the objective or the human’s perspective of the datasets.
The formulation for RShift given as follows has been reproduced from [50]. Assume the layers of a CNN are denoted by
Let the layer activations of a trained model for layer l and filter k produced by an input x be denoted by:
The mean value of each activation per layer for a given filter and data is given by
where h and w denote the height and weight of the layer activation.
Next, assuming that the activations over all input data can be fit into a normal distribution,
- denotes the continuous distribution of and
- , the input data where n is the sample size. A similar formulation can be done for a second dataset:
- generating with m denoting the new sample size.
The representation shift, R is defined as the mean discrepancy D between the distributions over all filters k in a given layer l
where D is discrepancy or distance metric which is calculated using Kullback-Leibler (KL) divergence.
KL divergence is defined between two discrete probability distributions P and Q as:
VGG16 [49] has been used for classification of hand gestures and SIMLea has been applied on a trained VGG16 model. The architecture contains five convolutional blocks ending with a max pooling (MaxPool) layer (Figure 3). In the figure (which is reproduced from the paper [49]), "conv3" refers to 3D convolution and "FC", fully connected layers. Recall that R is larger for more dissimilar or more shifted datasets and vice versa. The following steps are taken for the analysis of each layer. Here, “layer” refers to a MaxPool layer.
- 1.)
- Mean and standard deviations of the activations of each filter are obtained for all images in the dataset. These statistics will represent the central tendency and spread of the activations for each filter. Then a normal distribution is fitted over the values using the mean and standard deviation values. These images are passed through the model unlabelled, and the outputs are obtained through the inference operation of model0. This is done for the source dataset (THUC) and the target datasets (UDS1, 2, and 3, and VDS).
- 2.
- KL divergence is calculated between pairs of source and target datasets for each filter of a layer.
- 3.
- The mean of KL divergence values over all filters per layer is obtained thereby generating one value per source-target pair per layer.
KL divergence is not a symmetrical distance measure, thus, it is important to keep the source unchanged in order to get the correct estimates of changes. Since the analysis is in service of DA of the model, the training sets for iterative re-trainings change at each step. Therefore, THUC test set was kept as the source for calculations. For THUC R analysis, the target dataset is the training set of the same. In order to ensure that the general statistical behaviour is independent of the test and training set of TH, the above analysis was carried out with THUC training set as the source as well. Of course the succeeding tests could not be re-done with THUC training set as source since the training set of each model during re-training is different from model0.
model0 was used for inferencing with the shifted datasets with a small batch of labelled data to examine the relation of R with accuracy scores. The R and accuracy values for all the datasets are presented in Table 1 As is evident, our intuition about the similarity of datasets is reflected in the R values for layers 2 and 3 most clearly. The test set of THUC has the smallest shift from THUC training set which is correlated with the highest accuracy (0.96). This is followed by higher discrepancy values and corresponding lower accuracy values from layer 2 for UDS1 (87.26, 0.58), UDS2 (486.05, 0.48), UDS3 (943.40.37, 0.16), and VDS (10571.15, 0.09). This trend is reflected in all layers with some deviations. Some deviation is to be expected as one goes deeper into the model since a large amount of information gets lost as the model approximates the input to classify to one of the classes. This is intentionally done so as reduce the dimensionality of data to be handled and to neglect insignificant changes in input data using such layers as Max Pooling and Batch Normalization. Apart from that, the features in the deeper layers are more abstract and it is challenging to use them to interpret the behaviour of the model. Conversely, the initial convolution layers handle very macro-level features, and they too should not be used for interpretation of domain shifts.
For this work, the second and third MaxPool layers provided intuitive results (as can be attested by Table 1 and in the succeeding study in the later part of this chapter), and are thus, considered for analysis. The first layer follows the intuition except for the discrepancy expected of UDS2 and UDS3. The values for the fouth layer indicate higher similarity for VDS which is certainly not backed by the accuracy score for VDS. The fifth layer reflects the desired trend except for UDS3 and VDS. Notice that the R values decrease for all cases deeper into the model. This is a consequence of the loss of information in the attempt to approximate towards pre-learnt classes.
Let us try to visually examine the normal distributions of the datasets for each layer to gain an intuition about the statistical shifts between the THUC and user datasets. The normal distributions of the activations of second and third MaxPool layers with respect to each dataset have been plotted in Figure 4. In Figure 4 (a), for the second MaxPool layer, the standard deviation of THUC training set is the largest since it contains the largest variance in data. Comparatively, the spread of the THUC test set is smaller but still larger than the shifted datasets. This is showcased in the other layer as well. UDS3 is the most dissimilar among the user datasets and this is evident from the shape of the distribution (more variation, hence flatter and shifted mean value). Thus, as more visual variations are added to the scene, the more statistically the dataset distribution gets shifted leading to lower accuracies. Layer 3 (Figure 4 (b)) provides the clearest indication of covariate shift that satisfies our visual inspection hypothesis. The lower standard deviations in the user sets are also a consequence of the dataset being generated using short RGB videos and the presence of only one user. Note the different x-axis scales that have been used for better visualization. VDS in (a) and (b) appear distinct from the user datasets. Its mean value is shifted from TH training set and it contains more variance than the user datasets.
Batches of around 200 unlabelled images (from all the classes) were used for the statistical analyses. This would require only about five to seven seconds for each gesture video. Smaller batches of images ensure that an acceptable amount of computational resources are dedicated for the statistical analysis during online learning of the model. Section 5.4 explores the issue of batch size. This shift analysis constitutes step 2 of the SIMLea framework. The similarity metric is used to decide if the model has learnt the new dataset and also if TL for DA is a feasible course of action.
4.2.2. Alternate Shift Analysis with THUC Training Set as Source
The domain shift calculations were repeated with THUC training set as the source so as to ascertain the reasoning that THUC test and training sets are pulled from the same (or nearly the same) distributions and can be used as a representation of THUC dataset. Refer to Table 2 for the covariate representation shift values for this analysis. It can be observed that the trends follow the intuition pertaining to the similarity between the datasets, especially for layers 2 and 3 same as for Table 1.
While using either THUC training or test set proves effective before re-training and for gauging the similarity between the source and shifted data, it is not so after re-training. As mentioned earlier, the "training set" is no longer just THUC, rather it is a mixture of THUC training images and auto-labelled shifted user images. Thus, in order to keep bench-marking parameters invariant, the THUC test set was used for calculations. Apart from that, let us inspect the divergence mathematically.
The formulation of KL divergence can be understood as follows:
From Figure 4, it can be noted that the standard deviation of THUC is by dint of its greater variance in features while that of user datasets or VDS are . In order to determine if is monotonically increasing with , let us find the first order differential of with respect to keeping constant and the means of the two source and target distributions equal.
In order to be monotonically increasing, must be for all values.
This inequality is true for the nature of data being handled as mentioned above. Therefore for the same ,
.
Thus, as variance in the source dataset decreases, the divergence decreases if other factors are unchanged. This response of KL divergence would lead to indications of lesser covariate shift or R values if the source dataset does not contain high variability. This explains the lower R values for the analysis using THUC test set versus training.
The THUC training set does contain high variability in features, but accessing a representative set for analysis every time during operation would prove to be time-consuming. In some cases, the model available may be trained without access to the training data. Keeping in mind such cases, the test set was used effectively for SIMLea. Furthermore, with all the factors kept constant, the effect of the standard deviation of THUC test set is applied to all the steps of the adaptation thus maintaining consistency in the process. Thus, for this application, it was deemed satisfactory to use THUC test set as the source for further DA calculations.
5. Results
SIMLea was applied to a hand gesture recognition task which consisted of the ML model constituting the robot perception system encountering new users, changes in the collaborative work-cell, and in the sensors. The capability to detect the changes that manifested as covariate shifts in the incoming data distribution and to decide the means to incorporate the changes into the model were enabled by the application of SIMLea. The validation tests undertaken in this work are indicative of the expected trends when working with human-generated communication data in the form of RGB images and handled using deep CNNs. But, while the steps of the framework are generic and applicable for a wide variety of HRCom scenarios, the architecture and type of classifier used will dictate the parameters of TL, the similarity metric used, and the shift values encountered.
5.1. Application of SIMLea to User Datasets
SIMLea was implemented and validated on UDS1 and UDS2. Empirically determined batches composed of 20 user images + 100 THUC training set images for each class and auto-labelled through feedback were used for iterative re-training as per the results from the work on personalization in HRCom [48].
On deploying model0 and it encountering UDS1, R was calculated for all layers along with accuracy as shown in Table 1. Since the R value indicated domain shift as compared to THUC training set shift score, DA was required to counter the domain shift. On an ad hoc basis, TL was used as the first study. VC classifier enabled feedback can be expanded upon and used for the seven classes of HG as well since the names of the classes are commonly used words. A simulation of feedback generated using voice commands from the human was used to label the data which consisted of 20 images per class of gestures. Conversely, simpler visual or haptic interfaces like touchscreens may also be used instead of using an ML model for feedback.
TL was used after labelling which consisted of freezing the layers of model0 except the fully connected and classification layers. The training was done for two epochs, thus proving that TL was effective, generating model1. The shift calculations were carried out with model1 with another batch of the same user data UDS1, the results of which are presented in Table 3. It was observed that for all layers, the R value decreased thus indicating a decrease in the dissimilarity of the datasets with respect to the new model and an increase in the variance of said model. For the purpose of validating, labelling was done for a new batch of UDS1 and tested with model1 giving an accuracy of 0.73 which was a 25.8% increase in one iteration and two epochs of training.
This implementation gave an empirical idea of the thresholds for the feasibility of TL for that particular dataset and model and an indication of accuracy from the R value. It should also be noted that the accuracy value for the THUC test set remains high (0.97 for model1 for UDS1 and 0.94 for UDS2). The framework can be deployed further or stopped on the basis of the threshold set for the application. A similar approach for taken for UDS2 which too demonstrated lessening of R for all layers (Table 4) with a new accuracy score of 0.59 (an increase of 22.9%) with two epochs.
Figure 5 contains the distributions of activations of second and third MaxPool layers juxtaposed for UDS1, UDS2 and THUC test datasets with respect to each layer. (a) and (b) are for model0 while (c) and (d), and (e) and (f) are for model1s for UDS1 and UDS2 respectively. Please note that model1 is different for the two datasets and the term is reused as a model variable name within the iterative framework. The ranges in vertical axes in (a) to (f) are as follows: 0.00 to 0.25, 0.00 to 0.08, 0.00 to 0.25, 0.00 to 0.08, 0.00 to 0.175 and 0.00 to 0.08 respectively. The ranges in horizontal axes in (a) to (f) are as follows: 30 to 100, 60 to 180, 30 to 100, 60 to 180, 30 to 100 and 60 to 180 respectively.
A decrease in (learnt) variance in THUC can be observed in the standard deviations of THUC in (d), (e), and (f) with respect to (b), (a), and (b) again. This stems from the model’s loss of learnt features and not a change in the source dataset itself. This is a consequence of TL. Based on such indicators, the designer may add a higher number of THUC images when creating batches for re-training. Be that as it may, in all instances, the distance between the mean values of THUC and the user datasets decreased thus validating a decrease in the perceived shift of the model when handled using SIMLea.
5.2. Application of SIMLea to Virtual Reality Datasets
A VEnv dataset was created ad hoc using the available 3D models and assets in the environment and with an initial structure of the scene [51]. A checkpoint of essence that needs to be added to any such undertaking is whether it is feasible in terms of time, skill, and computational resources to carry out the changes to the dataset. If it is indeed feasible, then the features may be added and the VEnv dataset tweaked to better resemble the trained dataset. There is of course a constraint to the addition of features and trying to make the VEnv images as “photorealistic” as possible. Thus, if TL or training a network (as the case may be) is determined to be more expensive than adding greater detail to the dataset, the dataset may be enhanced with more photorealistic features. For this study two datasets were created- one using a generic silver coloured humanoid with a generic background and the other closer to the (interpreted) features learnt by the model i.e., a humanoid with a more "natural" skin tone.
Even after curating VDS in such a way as to make the images as close to the source, training set of THUC as possible, the shift values as seen from Table 1 are still very high indicating significantly large covariate shift (∼ 76,071% + of the distance between THUC training and test sets). TL is not effective for VDS since a 10% gain in accuracy required 21 epochs. Therefore, in terms of the feasibility of TL, such a dataset may be construed to be at the limit of usefulness. There is of course a different way to look at this problem. The virtual dataset once made contains relatively lesser unstructured elements in the environment since from a design purview, more unstructured, randomness leads to greater realism in the scene. Thus, the classifier for a VEnv dataset would require much lesser parameters to learn i.e., shallower networks may be quite useful and which need lesser computational resources. In both aspects of this problem, one can get away with lesser computation once it is evident that the domain shift is too large for adaptation. Figure 6 qualitatively represents the domain shift from the source (training set of THUC) to the farthest target datasets (VDS with the "skin-tone" humanoid and farther shifted for the silver coloured humanoid). Most HG Renv datasets will fall somewhere in between the extremes discussed above and some heuristics in the form of design thresholds will be required to customize the framework to the application.
5.3. Application of SIMLea to a Simulated Long-Serving Model
SIMLea is designed to enable continuous learning of an HRCom model. It is expected that a long-serving model, initially trained with a simpler dataset such as THUC would continue to learn the features of new users and environments of the work-cell during its operation. At the same time, it should still be able to detect changes in the domain (if relevant enough to be further handled) and process the OOD data. Therefore, in order to simulate such a situation, VGG19 [49] was used to train on training sets of both THUC and THC. The training and validation sets contained 147,807 images split along (70:30)% and the test set 63,341. The hyperparameters remained the same except for the number of epochs which was 20 for this case. A deeper model was chosen for this case containing three extra convolution layers to account for the larger variability in data the model would have encountered during its operation. Delving into the dataset, THC contains 15 individuals (different from THUC) and a collection of seven different cluttered backgrounds. The new user datasets (UDS1, 2 and 3) contain individuals and backgrounds that are different from all of the combinations mentioned above. So, SIMLea should still be required. A cautionary point to be presented is that the R values correlated to accuracy values are not model agnostic and so the shifts in the present analysis would be unrelated to those in the previous analysis because of differences in architecture and training sets leading to significantly different models.
This VGG19 model was trained with lateral inversion as a data augmentation so as to enable recognition of the gestures performed with the left hand. UDS1, 2 and 3 in this case also contained left-handed gestures in order to increase the variance of the data. The discrepancy values of these complex, shifted datasets were evaluated. Table 5 and Table 6 present the values grouped by MaxPool layers.
Similar to VGG16, VGG19 also contains five convolution blocks ending with five MaxPool layers. The following trends can be observed from the data.
- 1.
- There is a distribution shift between the training sets of the model itself, i.e., between THUC and THC. The shift is the smallest among the pairs due to the model being trained on both data although in terms of visible similarity, THUC and UDS1 would be the most similar. Apart from that, the image sizes of the two training dataset were different as well (THUC: 640x480 pixels, THC 1920x10180 pixels) indicating a change in sensors capturing the data.
- 2.
- The covariate shift, R values for UDS1_R indicating right-handed gestures are lesser than UDS1_L indicating left-handed ones for layers 1 and 2. This is logical since the original training set contains only right-handed gestures and thus may be biased toward them.
- 3.
- UDS1 is more similar to the training sets of THUC than UDS2 or UDS3 and the level of similarity decreases in that order. This behaviour is attributed to the similar, uncluttered, clean backgrounds of THUC and UDS1.
- 4.
- THC with the cluttered backgrounds and standing humans are interpreted to be more similar to UDS3 followed by UDS2 and finally UDS1 which shows a large domain shift. This trend is followed by the deeper layers as well. This is expected since UDS3 contains the user standing in front of a cluttered background and gesturing and is thus structurally most similar to THC.
- 5.
- VDS is the least similar to THC or THUC and reflects results from the previous studies.
- 6.
- Accuracy scores for the user datasets are higher than in the previous study. This is also expected since the model contains higher variance. With that said, the metric is still able to detect a shift in distribution of incoming data. UDS2 and 3 may be used for DA while UDS1 could be allowed to be classified with the current model. For DA, a mix of THUC, THC and UDS1 can be used as the "old" data and the data from UDS2 or UDS3 respectively as the "new" data.
5.4. Examination of Batch Size for Shift Calculation
The sample size of images in a dataset should be statistically representative of the population under purview. Under the constraints of sparse data and limited allowance of computation time during operation, this is an extremely pertinent design consideration. All the aforementioned tests were carried out with about 200 images per batch for statistical analysis. A final study was conducted with 420 images for UDS1 left-handed gestures in comparison to the smaller batch containing 210 images. Table 7 contains the R values indicating domain shifts with respect to the VGG19 model trained with THC and THUC as mentioned in Section 5.3. The difference between the R values between the smaller and larger datasets for a given layer and for either THC or THUC as source sets, is a maximum of 21.8% (layer 2, for THUC as source set). Along with that, the discrepancy values follow the same trend for either sizes of dataset. Hence, lesser number of images were deemed safe to use for the analysis. Finally, a third reason for bolstering the rationale for small batches is that user data generated from a few seconds of only one user gesturing contains significantly less variance than the large publicly available datasets. Thus, for more complex datasets larger batch of images and smaller for simpler ones may be required.
6. Conclusions
A novel domain adaptation framework, SIMLea is presented that leverages the advantage of publicly available, large datasets of multimodal data and high-accuracy models trained on them to provide feedback from the human for auto-labelling during continuous operation. In contrast to the current research under domain adaptation and domain generalization, SIMLea is designed to allow feedback to be used from incommensurate multi-modes of communication. This feature allows the framework to be mode agnostic and flexible in application in addition to reducing mislabelling that typically occurs when high-dimensional and complex communication data is labelled by a third-party and out-of-context.
Domain adaptation allows the extension of the model’s learnt feature representations with those of new, covariate domain shifted data. Under HRCom, this allows personalization of the model to the collaborating human. Statistical measure of similarity is used to drive the adaptation framework. Thus, models under SIMLea are empowered to learn only relevant data and start and stop the computationally heavy learning process when required. Ergo, during continuous operation, the model learning is judicious and statistically and heuristically driven. SIMLea allows the amalgamation of empirical thresholds and standards and application-specific heuristics. It is an add-on to the ML model and does not require change in its architecture. Finally, while human-generated datasets are the primary focus of this dissertation, the framework can be used for DA in other applications as long as the feedback giving agent exists that can be used for auto-labelling.
Several research works in HRC have used establishing the context as a key component of HRCom setup. Additional information through context understood by the robot could be used to remove some of the reliance on heuristics in future works. As an example, consider that the robot perception understands through context that the incoming communication is not relevant to the task (e.g., the human is speaking to another agent about a task unrelated to the current robotic agent’s purview), then without expending the computational resources using SIMLea to find if the data is similar enough to be adapted or not, the robot can simply reject the data. While heuristics cannot be avoided and indeed when developing systems that are physically collaborating with humans, should not be avoided, the degree of reliance can be decreased for more autonomy. The addition of perception modules with higher capabilities could be a possible solution. Post that, to provide a consolidated command from the multiple modes of input, the multifaceted inputs must be combined by way of fusion. Thus, translating complementary input modes will make the communication more reliable, resolve the complexity associated with the robot’s understanding of human behavior, and hence improve the overall robustness of the HRC system.
The loss of variance contained in the large, standard dataset during the continued application of SIMLea is a limitation of the framework. From a safety standpoint, the higher specificity of the model is an asset, the trade-off being that as the model gets more specific (towards the humans working with it), TL under SIMLea will need to be used more and more. This is an inherent limitation of DA, DG and TL techniques when dealing with shifted datasets that are much smaller than the source ones. From an industrial perspective, calibration drift is tackled through the obsolescence of legacy information and tuning of the model to the new incoming data. Nonetheless, TL under SIMLea with portions of “old” data ensures the persistence of features from those datasets, while gradually lessening them over the operation life of the model.
Given the changing variance of the models, another checkpoint may be added to SIMLea in future works to stop further learning once the representation space of the current model contains so less variance as to be highly biased to the training data. This may lead to all incoming data to be flagged as too dissimilar thus leading to needing the model to be trained from scratch, thus further reducing the variance in learnt features. Of course, the model would encounter such a situation after multiple changes in the incoming datasets. Statistical analysis of the feature space and heuristics may be employed to indicate when the model has reached the high bias, low variance state.
Section 4.2.2 discussed the need for using the test set of THUC as the source set for similarity or shift calculations. This is also a consequence of the change in the training set and its associated variance. Thus, an adaptive approach to the selection of source datasets may be taken in future work. It would take into account the changes in the training set throughout the process and take data-driven decisions in the inclusion or exclusion of fractions of the stored standard and users’ data based on application requirements.
Author Contributions
Debasmita Mukherjee: Development of Methodology presented, Formal analysis, Data curation, Investigation, Software development of implemented framework and FER model, Visualization, FER application with robot, Writing-original draft;
Homayoun Najjaran: Funding acquisition, Project administration, Supervision, Writing- review & editing
Funding
Research supported by UBC Office of the Vice-President, Research and Innovation in the form of seed funding to establish research on digitalization of manufacturing.
Data Availability Statement
The new user data generated and used in this study are available on request from the corresponding author due to privacy reasons of user.
Conflicts of Interest
The authors declare no conflicts of interest. The funders had no role in the design of the study; in the collection, analyses, or interpretation of data; in the writing of the manuscript; or in the decision to publish the results.
References
- Reed, K., Peshkin, M., Hartmann, M., Grabowecky, M., Patton, J. & Vishton, P. Haptically linked dyads: Are two motor-control systems better than one?. Psychological Science. (2006).
- Boucher, J., Pattacini, U., Lelong, A., Bailly, G., Elisei, F., Fagel, S., Dominey, P. & Ventre-Dominey, J. I Reach Faster When I See You Look: Gaze Effects in Human–Human and Human–Robot Face-to-Face Cooperation. Frontiers In Neurorobotics. 6 (2012), https://www.frontiersin.org/articles/10.3389/fnbot.2012.00003.
- Mukherjee, D., Gupta, K., Chang, L. & Najjaran, H. A Survey of Robot Learning Strategies for Human-Robot Collaboration in Industrial Settings. Robotics And Computer-Integrated Manufacturing. 73 pp. 102231 (2022), https://www.sciencedirect.com/science/article/pii/S0736584521001137.
- Robinson, N., Tidd, B., Campbell, D., Kulić, D. & Corke, P. Robotic Vision for Human-Robot Interaction and Collaboration: A Survey and Systematic Review. (Association for Computing Machinery,2023,2), . [CrossRef]
- Mukherjee, D., Gupta, K. & Najjaran, H. A Critical Analysis of Industrial Human-Robot Communication and Its Quest for Naturalness Through the Lens of Complexity Theory. Frontiers In Robotics And AI. 9 (2022), https://www.frontiersin.org/articles/10.3389/frobt.2022.870477.
- Drummond, N. The open world assumption. The University Of Manchester, Established In 1824.. (2006), http://www.cs.man.ac.uk/ drummond/.
- Kim, J. & Park, J. Multistage data selection-based unsupervised speaker adaptation for personalized speech emotion recognition. Engineering Applications Of Artificial Intelligence. 52 pp. 126-134 (2016).
- Rautiainen, S., Pantano, M., Traganos, K., Ahmadi, S., Saenz, J., Mohammed, W. & Martinez Lastra, J. Multimodal Interface for Human–Robot Collaboration. Machines. 10, 957 (2022).
- Samarakoon, S., Muthugala, M., Jayasekara, A. & Elara, M. Adapting approaching proxemics of a service robot based on physical user behavior and user feedback. User Modeling And User-Adapted Interaction. pp. 1-26 (2022).
- Almousa, O. & Alghowinem, S. Conceptualization and development of an autonomous and personalized early literacy content and robot tutor behavior for preschool children. User Modeling And User-Adapted Interaction. pp. 1-31 (2022).
- Di Napoli, C., Ercolano, G. & Rossi, S. Personalized home-care support for the elderly: A field experience with a social robot at home. User Modeling And User-Adapted Interaction. pp. 1-36 (2022).
- Irfan, B., Céspedes, N., Casas, J., Senft, E., Gutiérrez, L., Rincon-Roncancio, M., Cifuentes, C., Belpaeme, T. & Múnera, M. Personalised socially assistive robot for cardiac rehabilitation: Critical reflections on long-term interactions in the real world. User Modeling And User-Adapted Interaction. pp. 1-48 (2022).
- Benedictis, R., Umbrico, A., Fracasso, F., Cortellessa, G., Orlandini, A. & Cesta, A. A dichotomic approach to adaptive interaction for socially assistive robots. User Modeling And User-Adapted Interaction. pp. 1-39 (2022).
- Shi, Z., Groechel, T., Jain, S., Chima, K., Rudovic, O. & Matarić, M. Toward Personalized Affect-Aware Socially Assistive Robot Tutors for Long-Term Interventions with Children with Autism. J. Hum.-Robot Interact.. 11 (2022,9), . [CrossRef]
- Siebinga, O., Zgonnikov, A. & Abbink, D. A Human Factors Approach to Validating Driver Models for Interaction-Aware Automated Vehicles. J. Hum.-Robot Interact.. 11 (2022,9), . [CrossRef]
- Affectiva Building the ultimate in-cabin experience with Renovo and Affectiva. Building The Ultimate In-Cabin Experience With Renovo And Affectiva. (2018,8), https://blog.affectiva.com/building-the-ultimate-in-cabin-experience-with-renovo-and-affectiva.
- Yi, D., Su, J., Liu, C., Quddus, M. & Chen, W. A machine learning based personalized system for driving state recognition. Transportation Research Part C: Emerging Technologies. 105 pp. 241-261 (2019), https://www.sciencedirect.com/science/article/pii/S0968090X18309458.
- Knox, W. & Stone, P. Interactively Shaping Agents via Human Reinforcement: The TAMER Framework. Proceedings Of The Fifth International Conference On Knowledge Capture. pp. 9-16 (2009), . [CrossRef]
- Wilcox, R., Nikolaidis, S. & Shah, J. Optimization of Temporal Dynamics for Adaptive Human-Robot Interaction in Assembly Manufacturing. (2012,7).
- Görür, O., Rosman, B., Sivrikaya, F. & Albayrak, S. FABRIC: A Framework for the Design and Evaluation of Collaborative Robots with Extended Human Adaptation. J. Hum.-Robot Interact.. (2023,3), . [CrossRef]
- Russakovsky, O., Deng, J., Su, H., Krause, J., Satheesh, S., Ma, S., Huang, Z., Karpathy, A., Khosla, A., Bernstein, M., Berg, A. & Fei-Fei, L. ImageNet Large Scale Visual Recognition Challenge. International Journal Of Computer Vision (IJCV). 115, 211-252 (2015).
- Lin, T., Maire, M., Belongie, S., Hays, J., Perona, P., Ramanan, D., Dollár, P. & Zitnick, C. Microsoft COCO: Common Objects in Context. Computer Vision – ECCV 2014. pp. 740-755 (2014).
- Motiian, S., Piccirilli, M., Adjeroh, D. & Doretto, G. Unified Deep Supervised Domain Adaptation and Generalization. (arXiv,2017), https://arxiv.org/abs/1709.10190.
- Kothandaraman, D., Nambiar, A. & Mittal, A. Domain Adaptive Knowledge Distillation for Driving Scene Semantic Segmentation. (arXiv,2020), https://arxiv.org/abs/2011.08007.
- Long, M., Zhu, H., Wang, J. & Jordan, M. Unsupervised Domain Adaptation with Residual Transfer Networks. (arXiv,2016), https://arxiv.org/abs/1602.04433.
- Chen, M., Weinberger, K. & Blitzer, J. Co-training for domain adaptation. Advances In Neural Information Processing Systems. 24 (2011).
- Blum, A. & Mitchell, T. Combining labeled and unlabeled data with co-training. Proceedings Of The Eleventh Annual Conference On Computational Learning Theory. pp. 92-100 (1998).
- Chi, S., Tian, Y., Wang, F., Zhou, T., Jin, S. & Li, J. A novel lifelong machine learning-based method to eliminate calibration drift in clinical prediction models. Artificial Intelligence In Medicine. 125 pp. 102256 (2022), https://www.sciencedirect.com/science/article/pii/S0933365722000215.
- Mukherjee, D., Gupta, K. & Najjaran, H. An AI-powered Hierarchical Communication Framework for Robust Human-Robot Collaboration in Industrial Settings. 2022 31st IEEE International Conference On Robot And Human Interactive Communication (RO-MAN). pp. 1321-1326 (2022).
- Gal, Y. & Ghahramani, Z. Dropout as a bayesian approximation: Representing model uncertainty in deep learning. International Conference On Machine Learning. pp. 1050-1059 (2016).
- Schwaiger, A., Sinhamahapatra, P., Gansloser, J. & Roscher, K. Is uncertainty quantification in deep learning sufficient for out-of-distribution detection?. AISafety@ IJCAI. (2020).
- Hendrycks, D. & Gimpel, K. A Baseline for Detecting Misclassified and Out-of-Distribution Examples in Neural Networks. (arXiv,2016), https://arxiv.org/abs/1610.02136.
- Christie, S. Learning sameness: Object and relational similarity across species. Current Opinion In Behavioral Sciences. 37 pp. 41-46 (2021), https://www.sciencedirect.com/science/article/pii/S235215462030098X, Same-different conceptualization.
- Warden, P. Speech Commands: A Dataset for Limited-Vocabulary Speech Recognition. (arXiv,2018), https://arxiv.org/abs/1804.03209.
- Bao, P., Maqueda, A., Blanco, C. & García, N. Tiny hand gesture recognition without localization via a deep convolutional network. IEEE Transactions On Consumer Electronics. 63, 251-257 (2017).
- Stacke, K., Eilertsen, G., Unger, J. & Lundström, C. A Closer Look at Domain Shift for Deep Learning in Histopathology. (arXiv,2019), https://arxiv.org/abs/1909.11575.
- Nisar, Z., Vasiljevic, J., Gancarski, P. & Lampert, T. Towards Measuring Domain Shift in Histopathological Stain Translation in an Unsupervised Manner. 2022 IEEE 19th International Symposium On Biomedical Imaging (ISBI). (2022,3), https://ieeexplore.ieee.org/document/9761411.
- Ketykó, I. & Kovács, F. On the Metrics and Adaptation Methods for Domain Divergences of sEMG-based Gesture Recognition. (arXiv,2019), https://arxiv.org/abs/1912.08914.
- Vangipuram, S. & Appusamy, R. A SURVEY ON SIMILARITY MEASURES AND MACHINE LEARNING ALGORITHMS FOR CLASSIFICATION AND PREDICTION. International Conference On Data Science, E-Learning And Information Systems 2021. pp. 198-204 (2021), . [CrossRef]
- Li, X., Yang, X., Ma, Z. & Xue, J. Deep metric learning for few-shot image classification: A Review of recent developments. Pattern Recognition. 138 pp. 109381 (2023), https://www.sciencedirect.com/science/article/pii/S0031320323000821.
- Chechik, G., Sharma, V., Shalit, U. & Bengio, S. Large scale online learning of image similarity through ranking.. Journal Of Machine Learning Research. 11 (2010).
- Ben-David, S., Blitzer, J., Crammer, K. & Pereira, F. Analysis of representations for domain adaptation. Advances In Neural Information Processing Systems. 19 (2006).
- Harmouch, M. 17 types of similarity and dissimilarity measures used in data science.. Medium. (2021,4), https://towardsdatascience.com/17-types-of-similarity-and-dissimilarity-measures-used-in-data-science-3eb914d2681.
- Jiang, L., Guo, Z., Wu, W., Liu, Z., Liu, Z., Loy, C., Yang, S., Xiong, Y., Xia, W., Chen, B., Zhuang, P., Li, S., Chen, S., Yao, T., Ding, S., Li, J., Huang, F., Cao, L., Ji, R., Lu, C. & Tan, G. DeeperForensics Challenge 2020 on Real-World Face Forgery Detection: Methods and Results. (arXiv,2021), https://arxiv.org/abs/2102.09471.
- Perera, P., Nallapati, R. & Xiang, B. OCGAN: One-class Novelty Detection Using GANs with Constrained Latent Representations. (arXiv,2019), https://arxiv.org/abs/1903.08550.
- Mukherjee, D. Statistically-informed multimodal domain adaptation in industrial human-robot collaboration environments. (University of British Columbia,2023), https://open.library.ubc.ca/collections/ubctheses/24/ items/1.0431170.
- Aggarwal, C. & Yu, P. Outlier detection for high dimensional data. Proceedings Of The 2001 ACM SIGMOD International Conference On Management Of Data. pp. 37-46 (2001).
- Mukherjee, D., Hong, J., Vats, H., Bae, S. & Najjaran, H. Personalization of industrial human–robot communication through domain adaptation based on user feedback. User Modeling And User-Adapted Interaction. 34, 1327-1367 (2024,3), http://dx.doi.org/10.1007/s11257-024-09394-1.
- Simonyan, K. & Zisserman, A. Very Deep Convolutional Networks for Large-Scale Image Recognition. (arXiv,2014), https://arxiv.org/abs/1409.1556.
- Stacke, K., Eilertsen, G., Unger, J. & Lundström, C. Measuring Domain Shift for Deep Learning in Histopathology. IEEE Journal Of Biomedical And Health Informatics. 25, 325-336 (2021).
- Mukherjee, D., Singhai, R. & Najjaran, H. Systematic Adaptation of Communication-focused Machine Learning Models from Real to Virtual Environments for Human-Robot Collaboration. (2023).
Figure 1.
The iterative framework for SIMLea: Statistically-Informed Multimodal (Domain Adaptation by Transfer) Learning involving collection of user data, finding similarity with trained data, determining effectiveness of transfer learning for domain adaptation, and training the model based on decisions of the framework
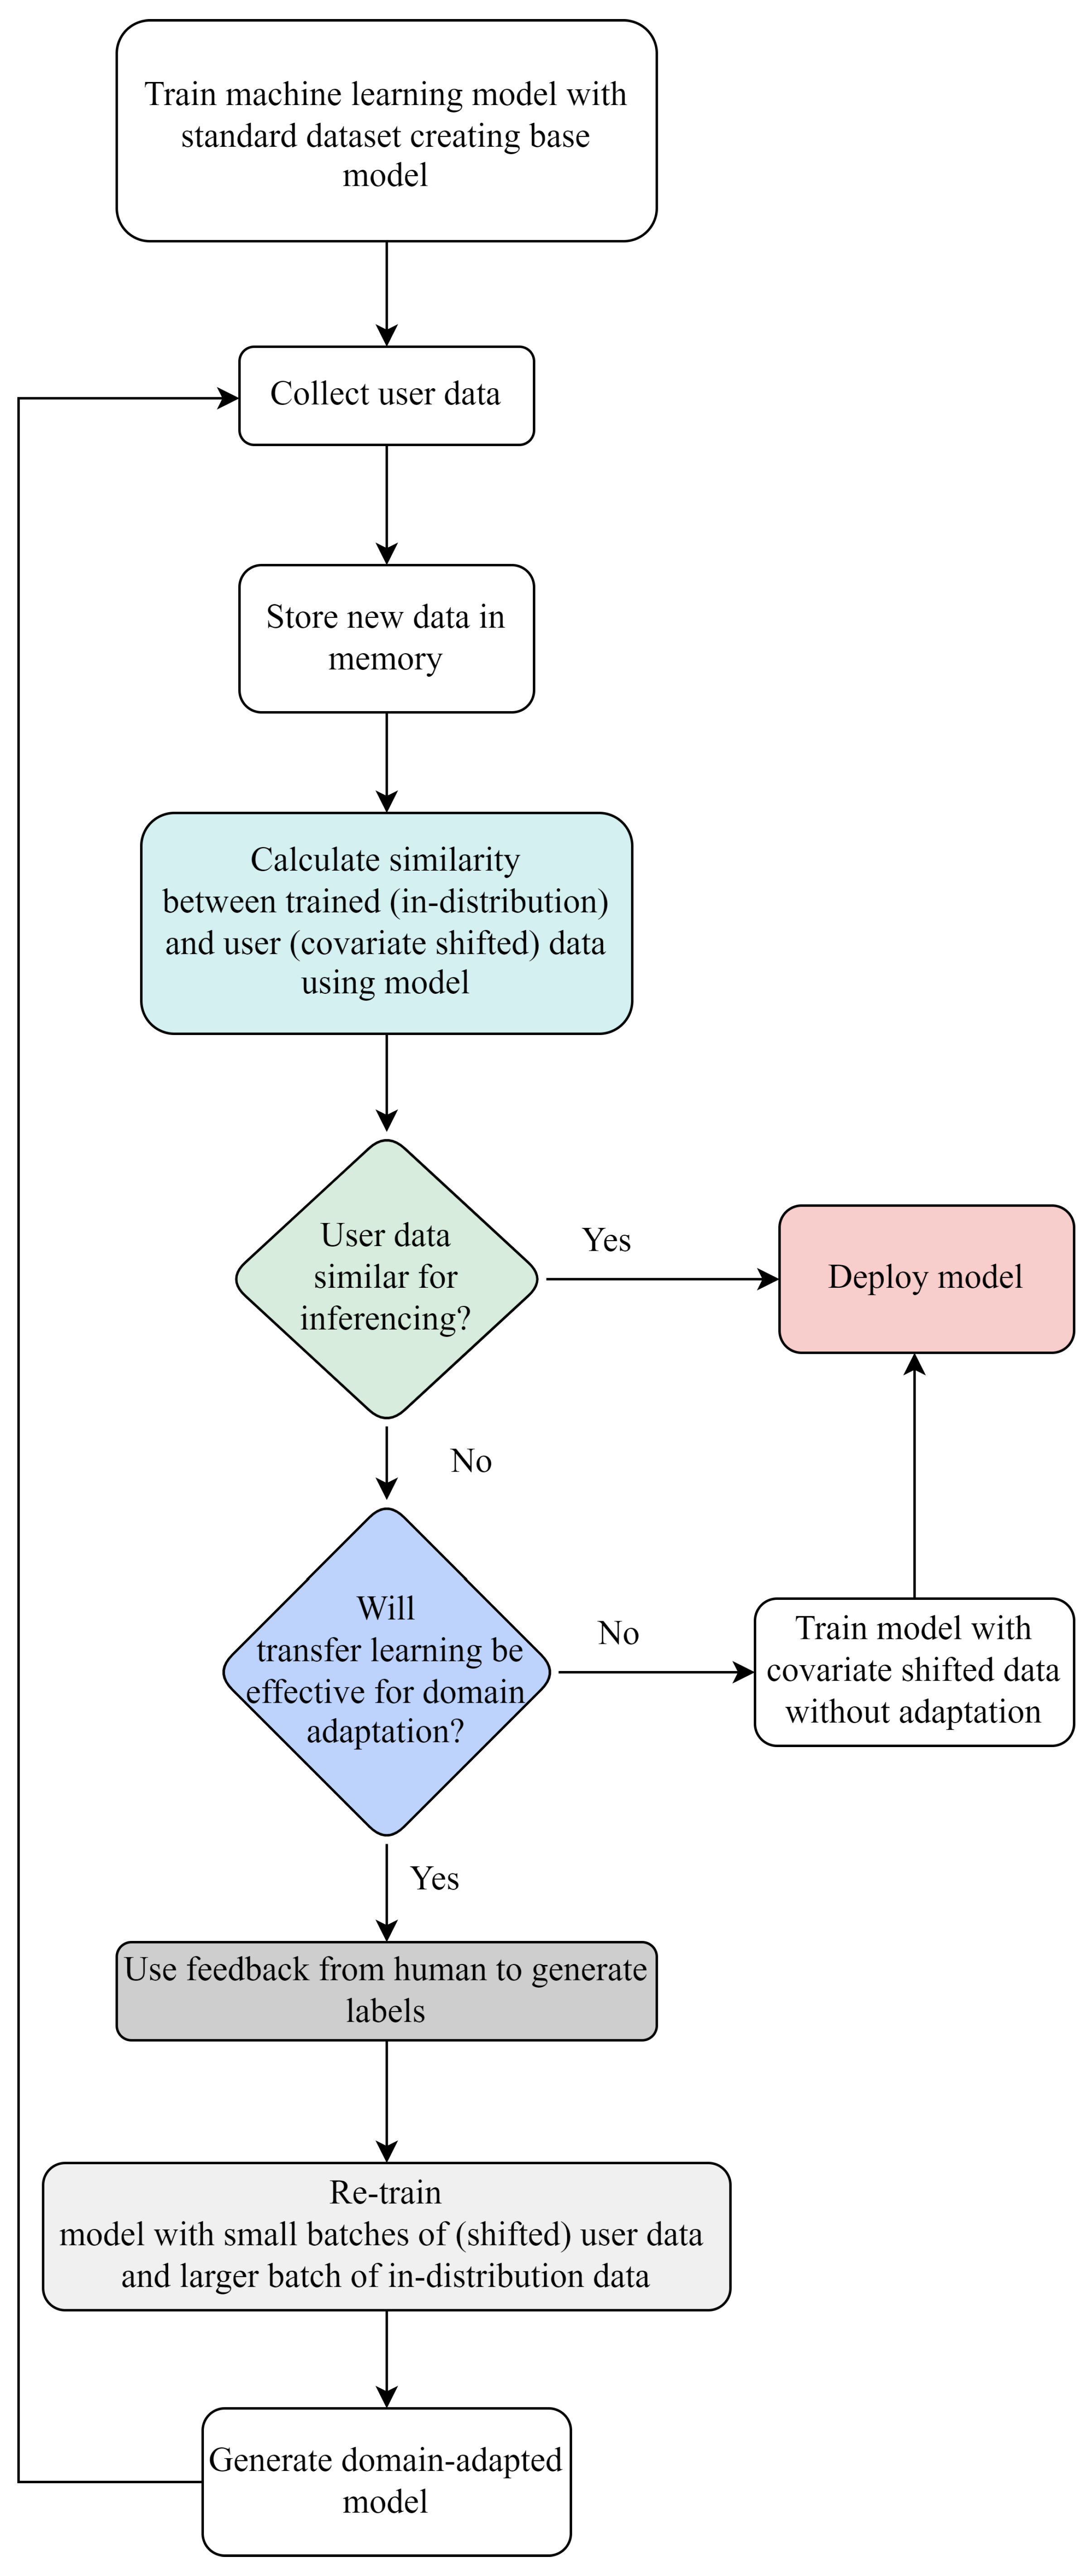
Figure 2.
Sample images and classes of hand gesture classification datasets:TinyHand Uncluttered Dataset (THUC), User Seated, Uncluttered (UDS1), User Seated, Cluttered (UDS2), User Standing, Cluttered (UDS3) & Virtual (VDS) showing visual differences in the datasets
(a) fist, (b) l, (c) ok, (d) palm, (e) pointer, (f) thumb up, (g) thumb down
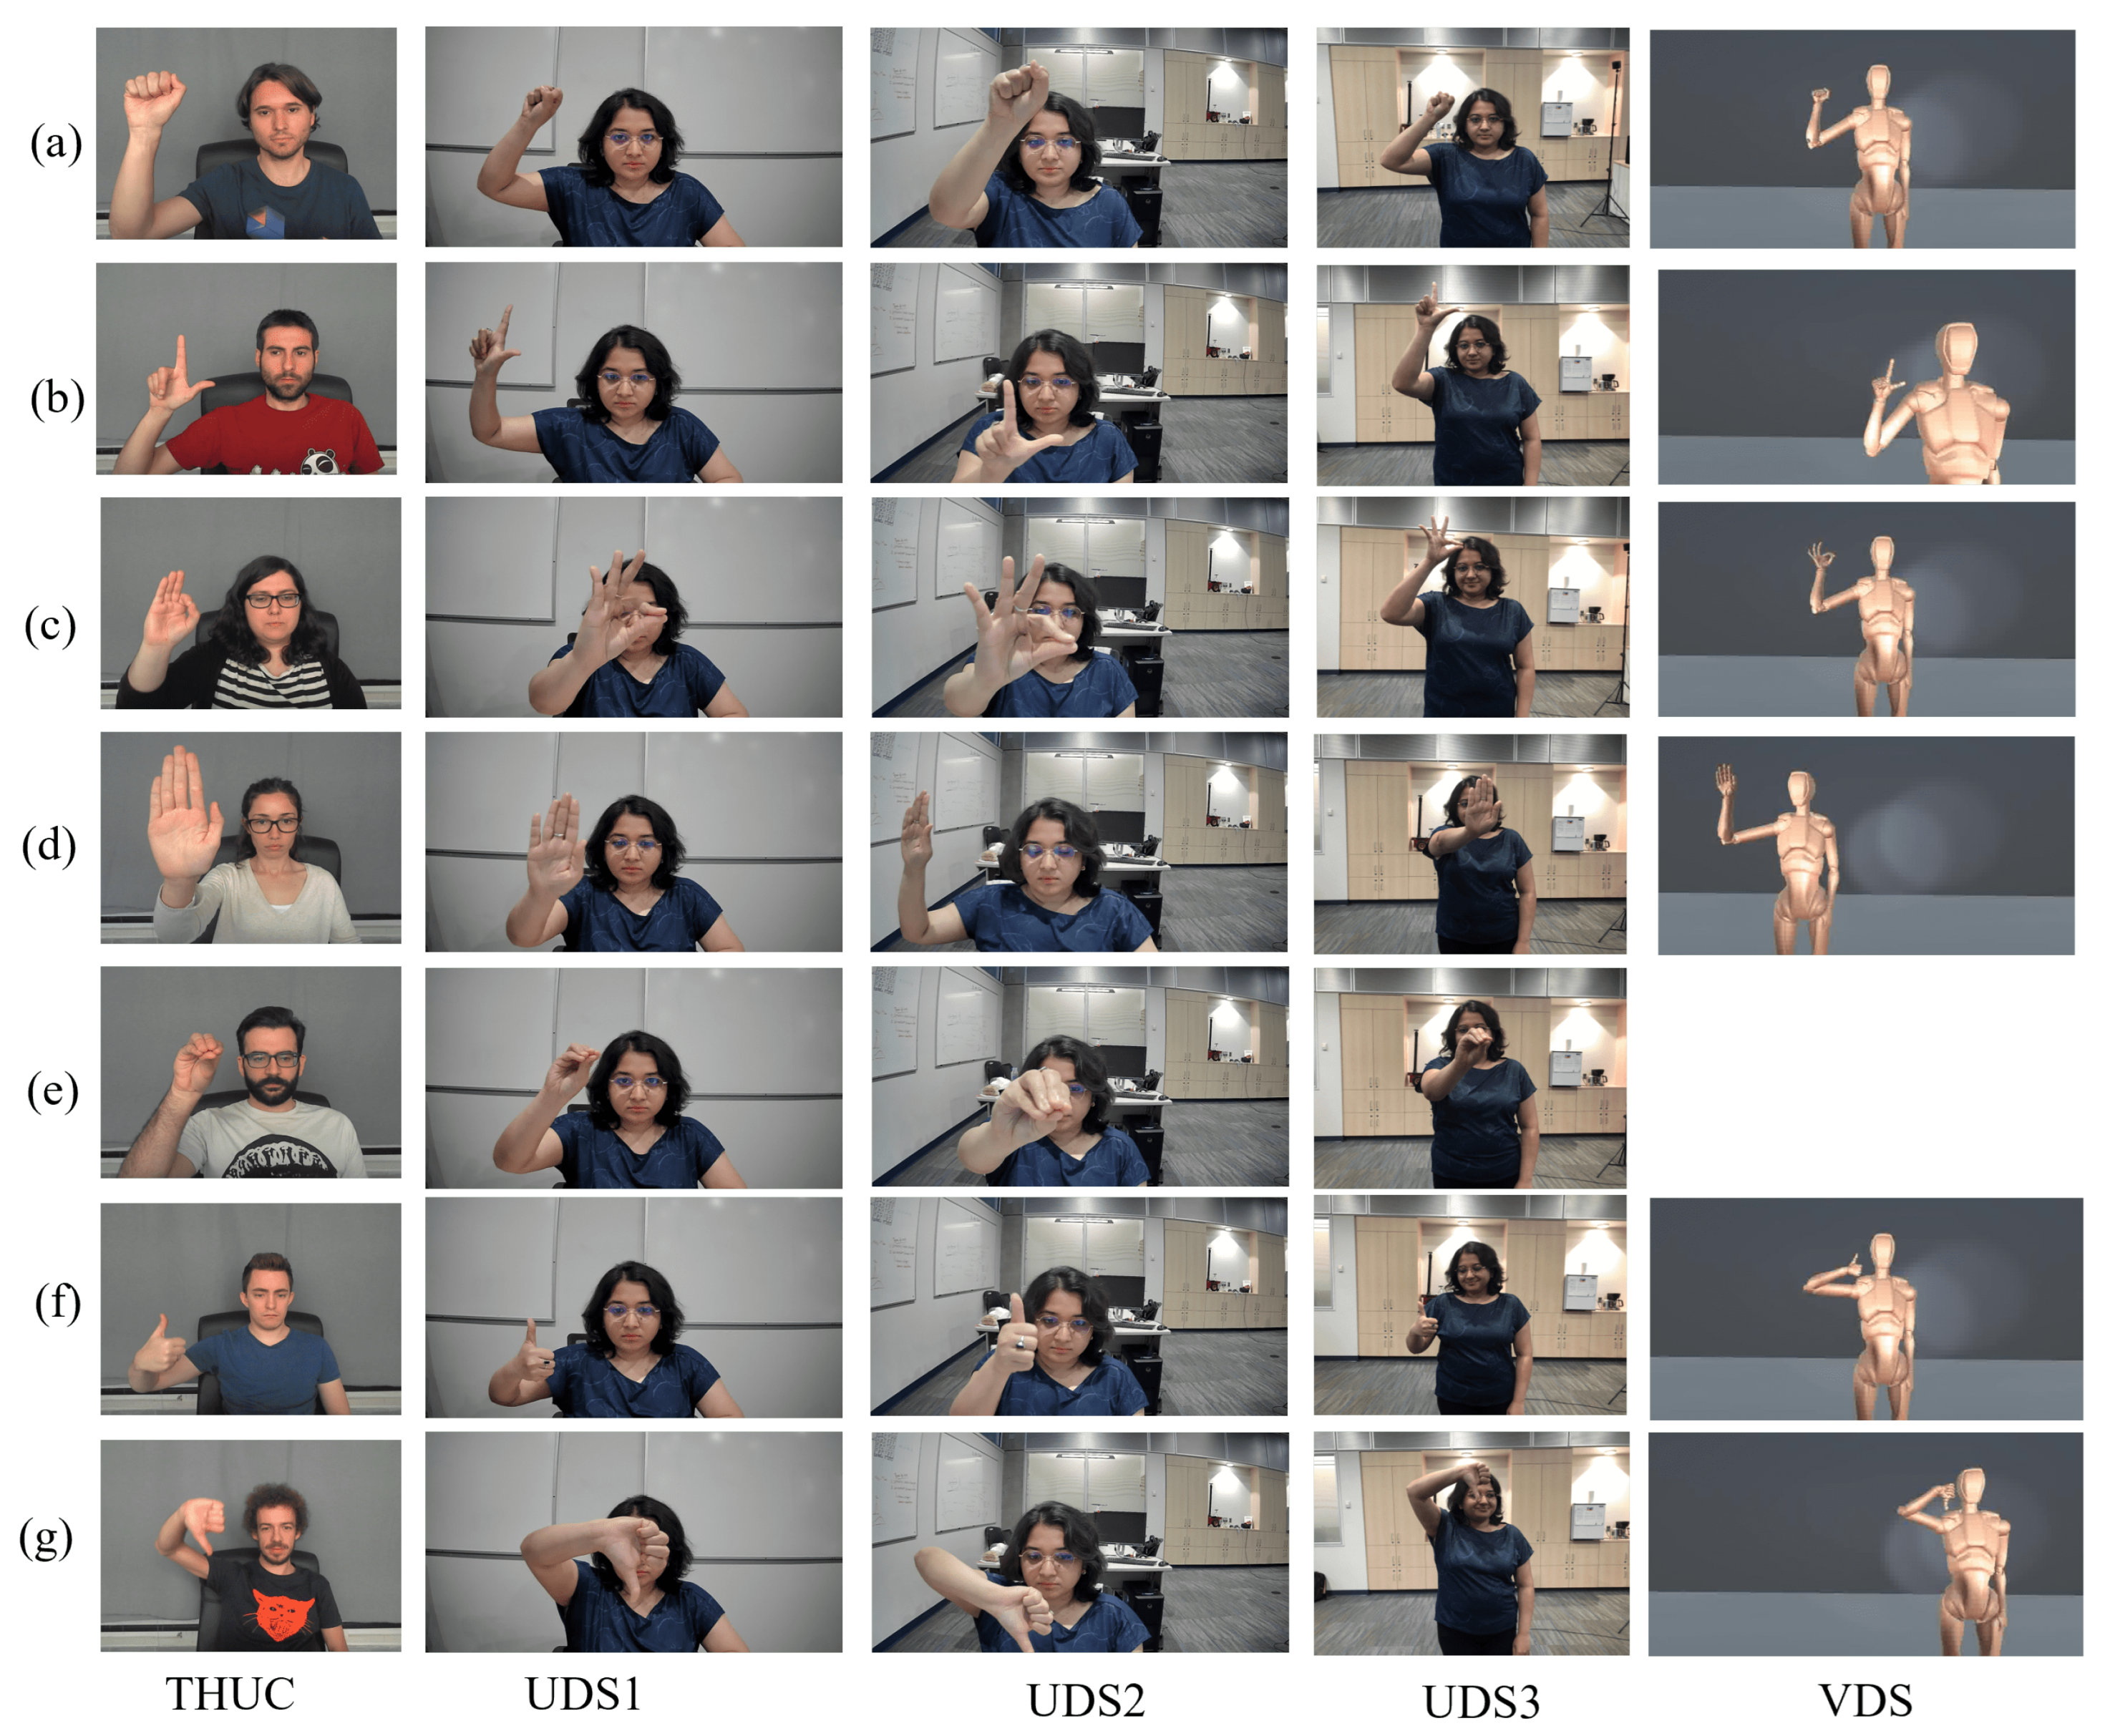
Figure 3.
Architecture of VGG16 and VGG19 adapted from [49]. Convolution layers are followed by ReLU Activations which are not shown here. n refers to number of classes
Figure 3.
Architecture of VGG16 and VGG19 adapted from [49]. Convolution layers are followed by ReLU Activations which are not shown here. n refers to number of classes
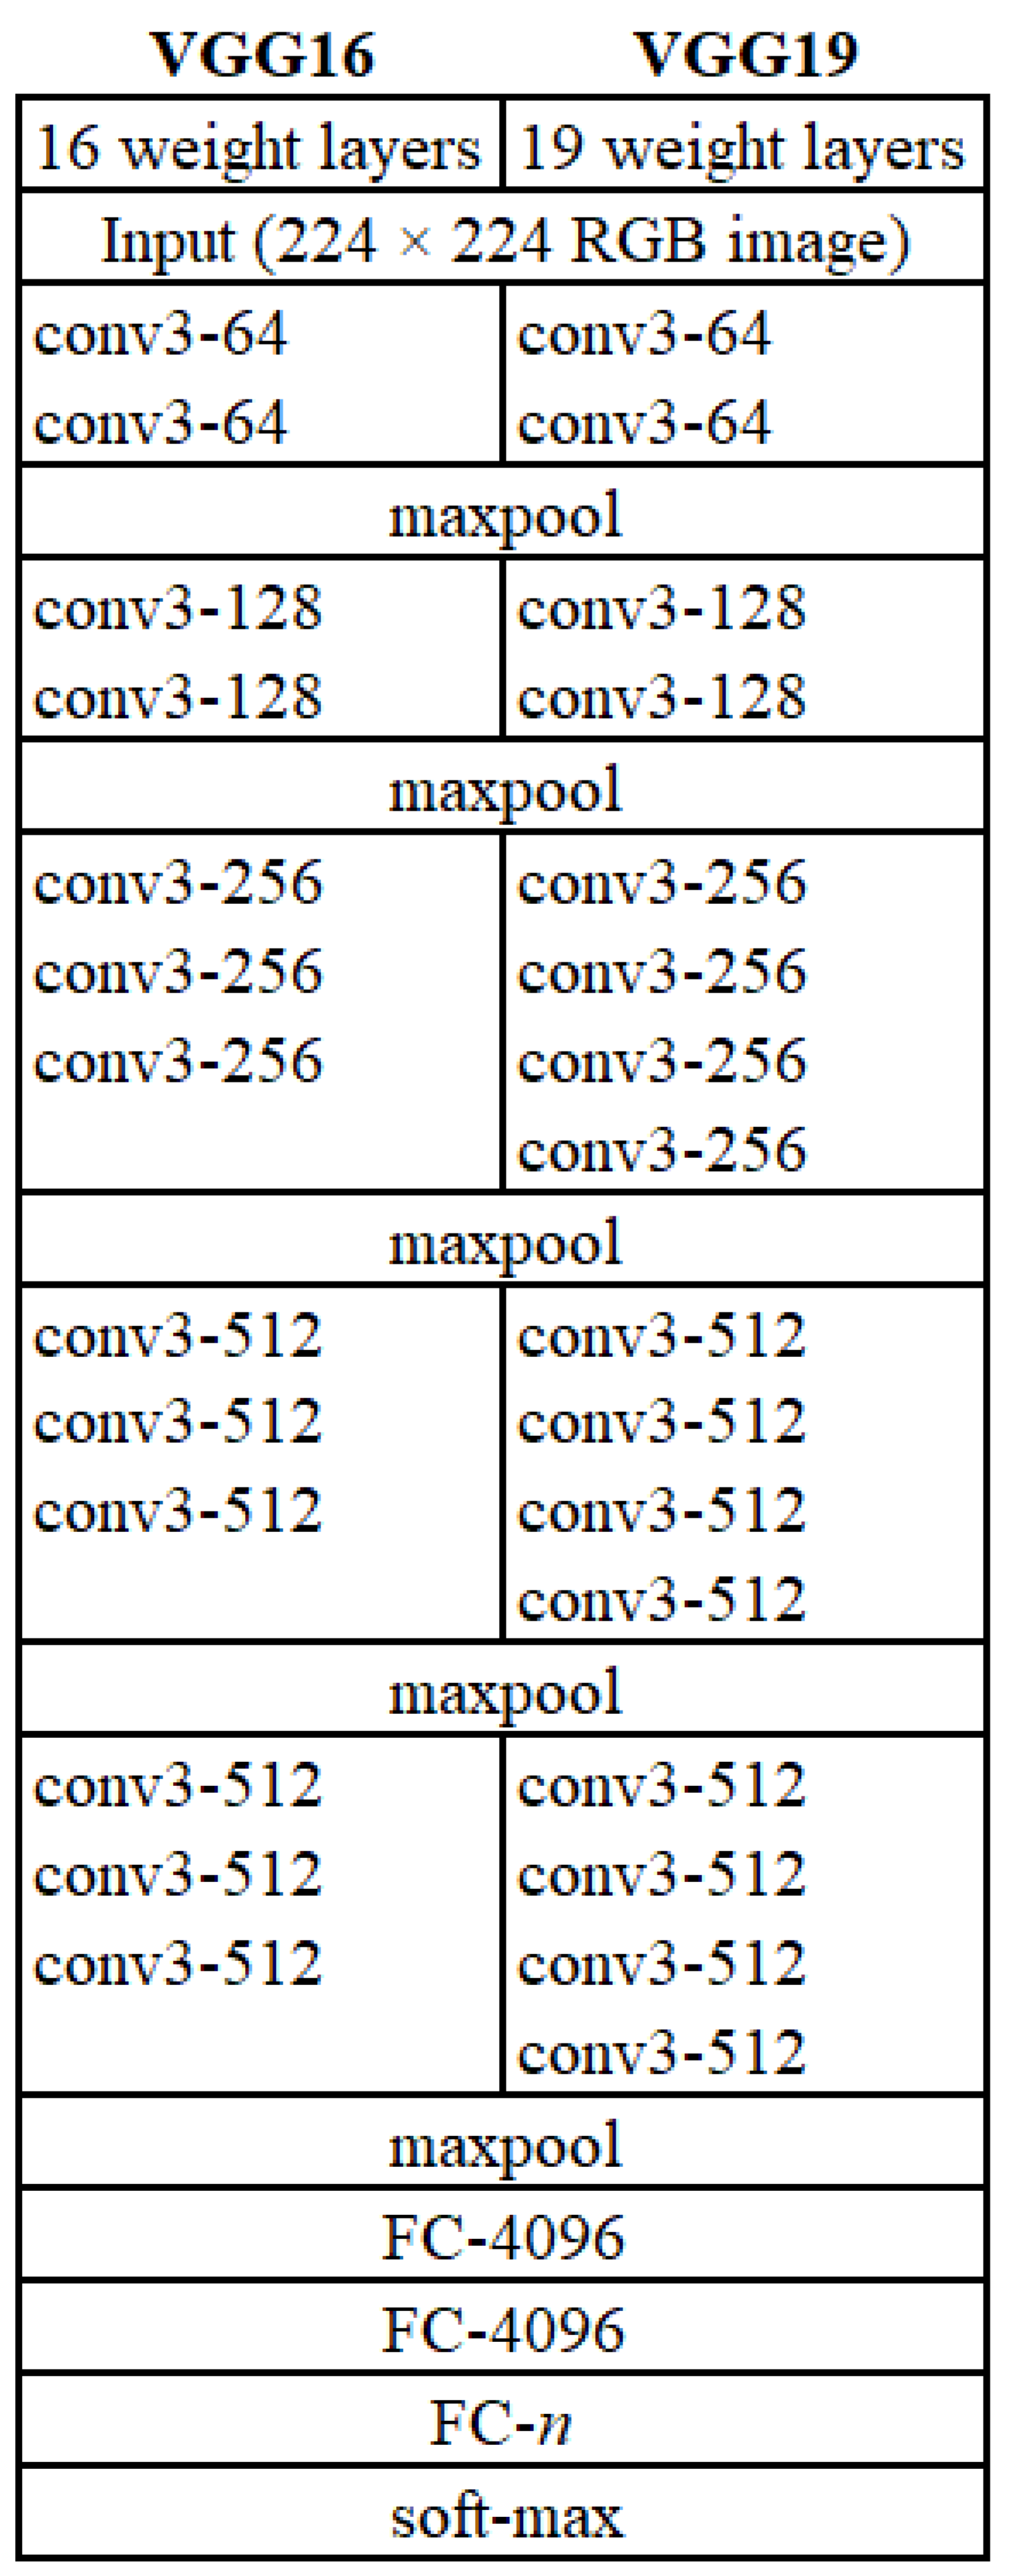
Figure 4.
Normal Distributions representing Activations of each MaxPooling Layer for Source and Target Datasets. (a) denotes MaxPool layer 2 and (b) layer 3. In (a) the range of horizontal axis is 30 to 90 and 0 to 400 in (b). The vertical axis in (a) is 0.00 to 0.25 while in (b) is 0.00 to 0.09
Figure 4.
Normal Distributions representing Activations of each MaxPooling Layer for Source and Target Datasets. (a) denotes MaxPool layer 2 and (b) layer 3. In (a) the range of horizontal axis is 30 to 90 and 0 to 400 in (b). The vertical axis in (a) is 0.00 to 0.25 while in (b) is 0.00 to 0.09
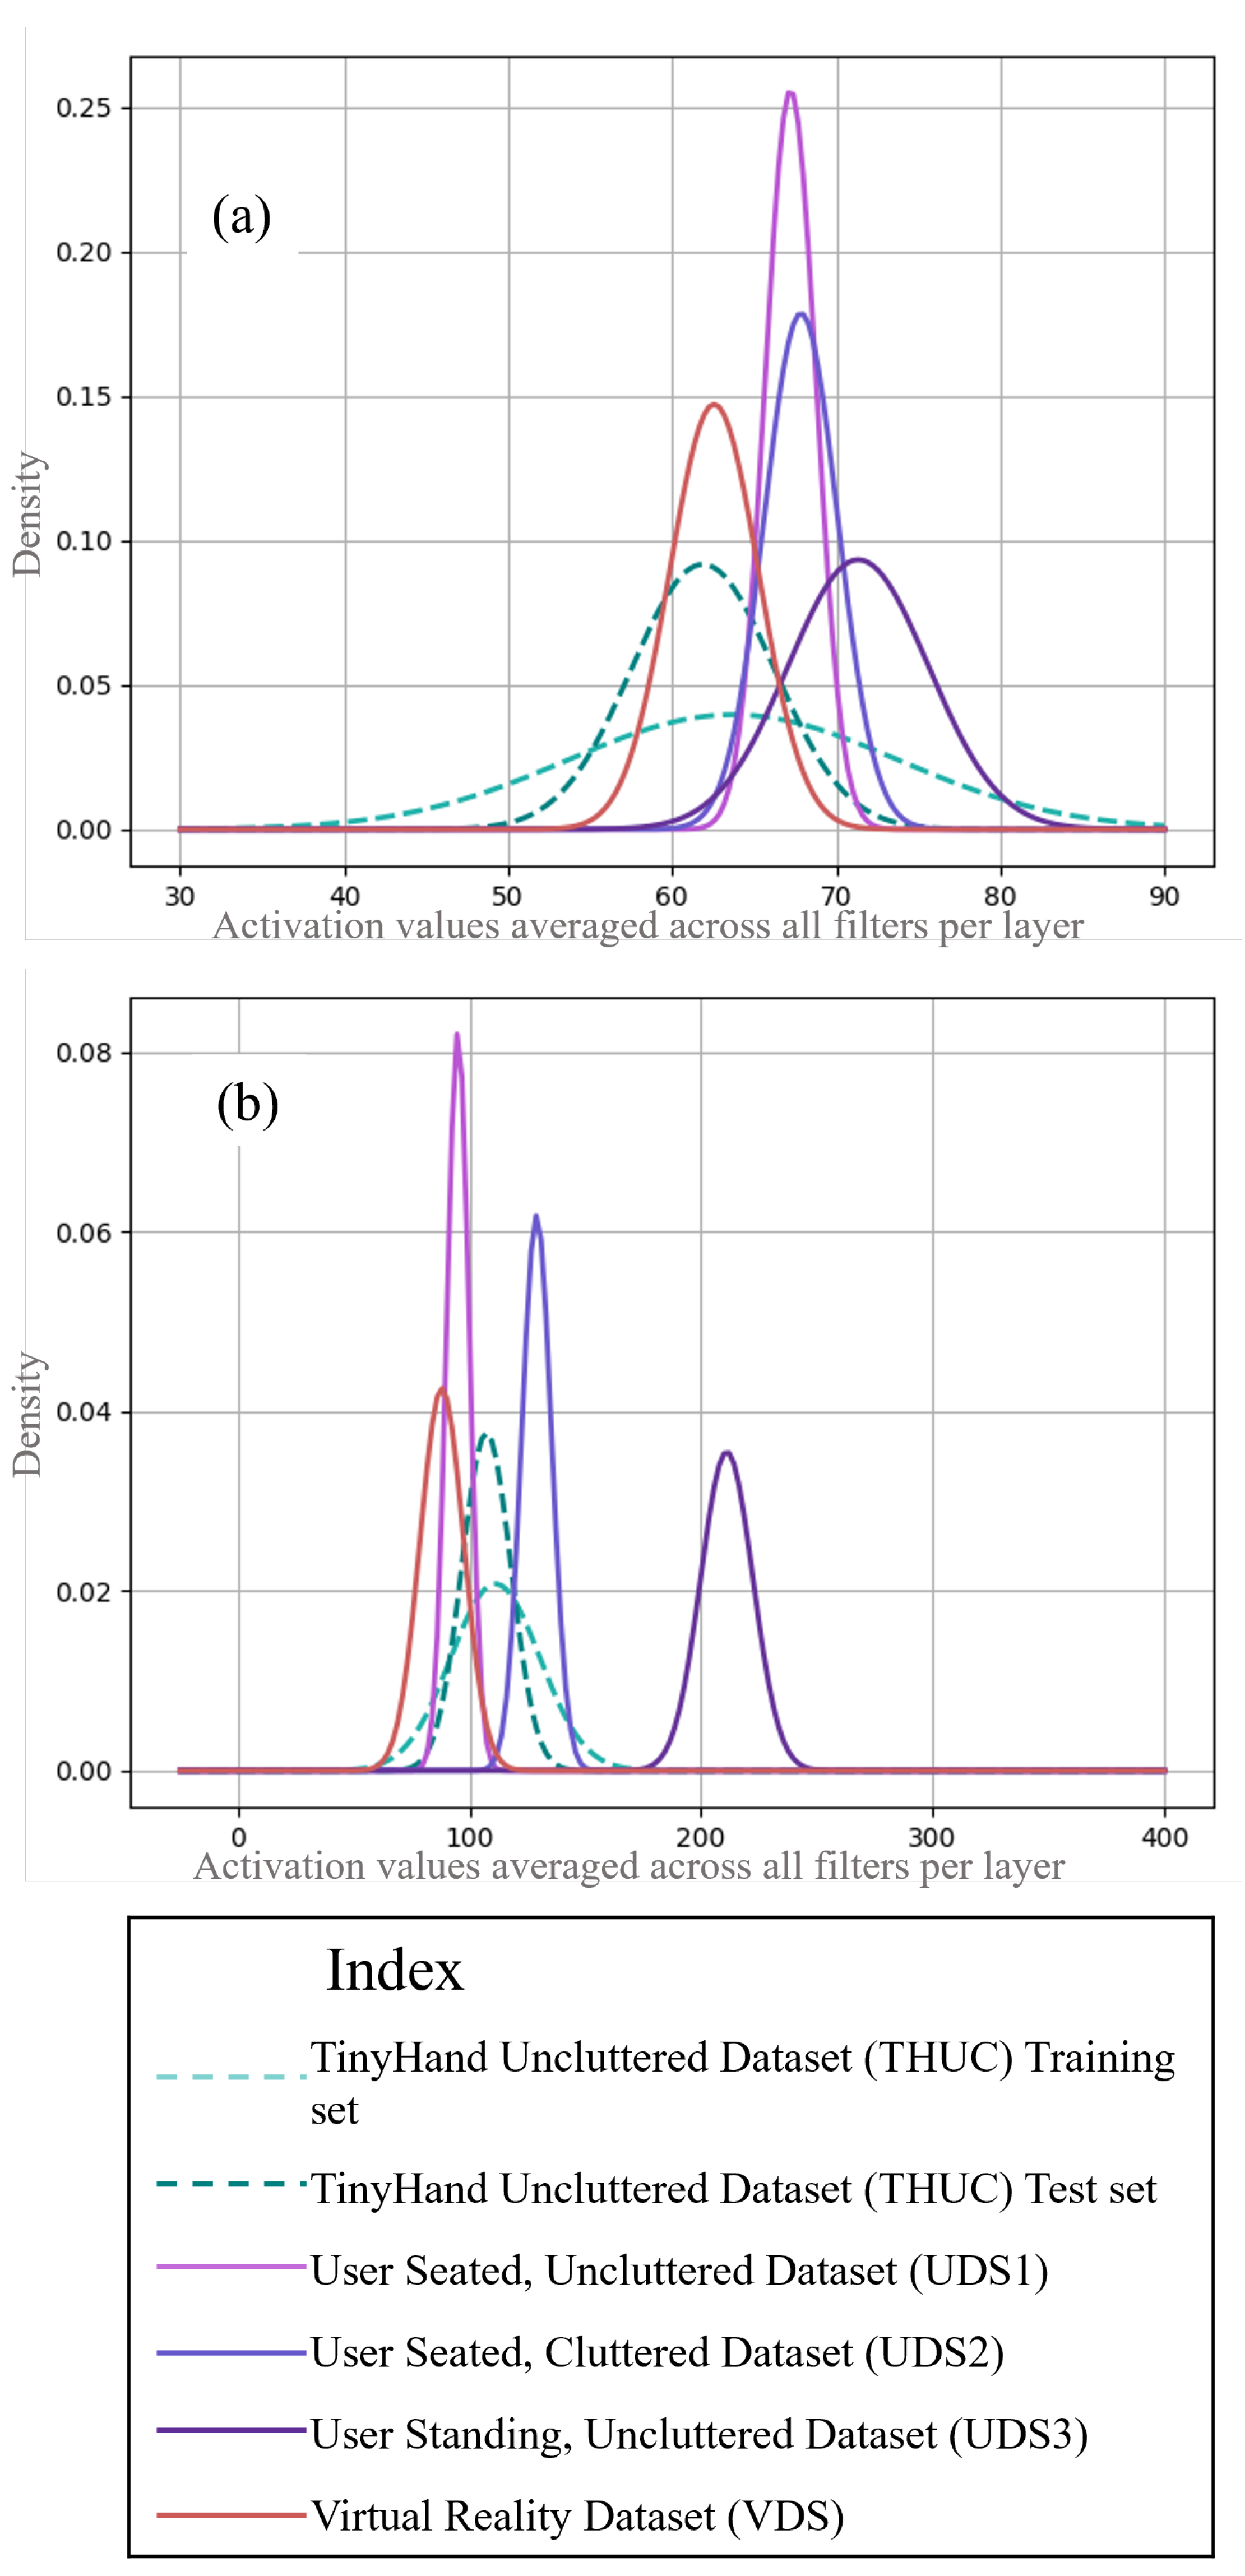
Figure 5.
Normal distributions of activations of second and third MaxPool layers juxtaposed for TinyHand Uncluttered (THUC), User Seated, Uncluttered (UDS1), User Seated, Cluttered (UDS2) Datasets with respect to each layer before iterative retraining ((a), (b)) and after ((c), (d): UDS1 and (e), (f): UDS2. The ranges in vertical axes in (a) to (f) are as follows: 0.00 to 0.25, 0.00 to 0.08, 0.00 to 0.25, 0.00 to 0.08, 0.00 to 0.175 and 0.00 to 0.08 respectively. The ranges in horizontal axes in (a) to (f) are as follows: 30 to 100, 60 to 180, 30 to 100, 60 to 180, 30 to 100 and 60 to 180 respectively.
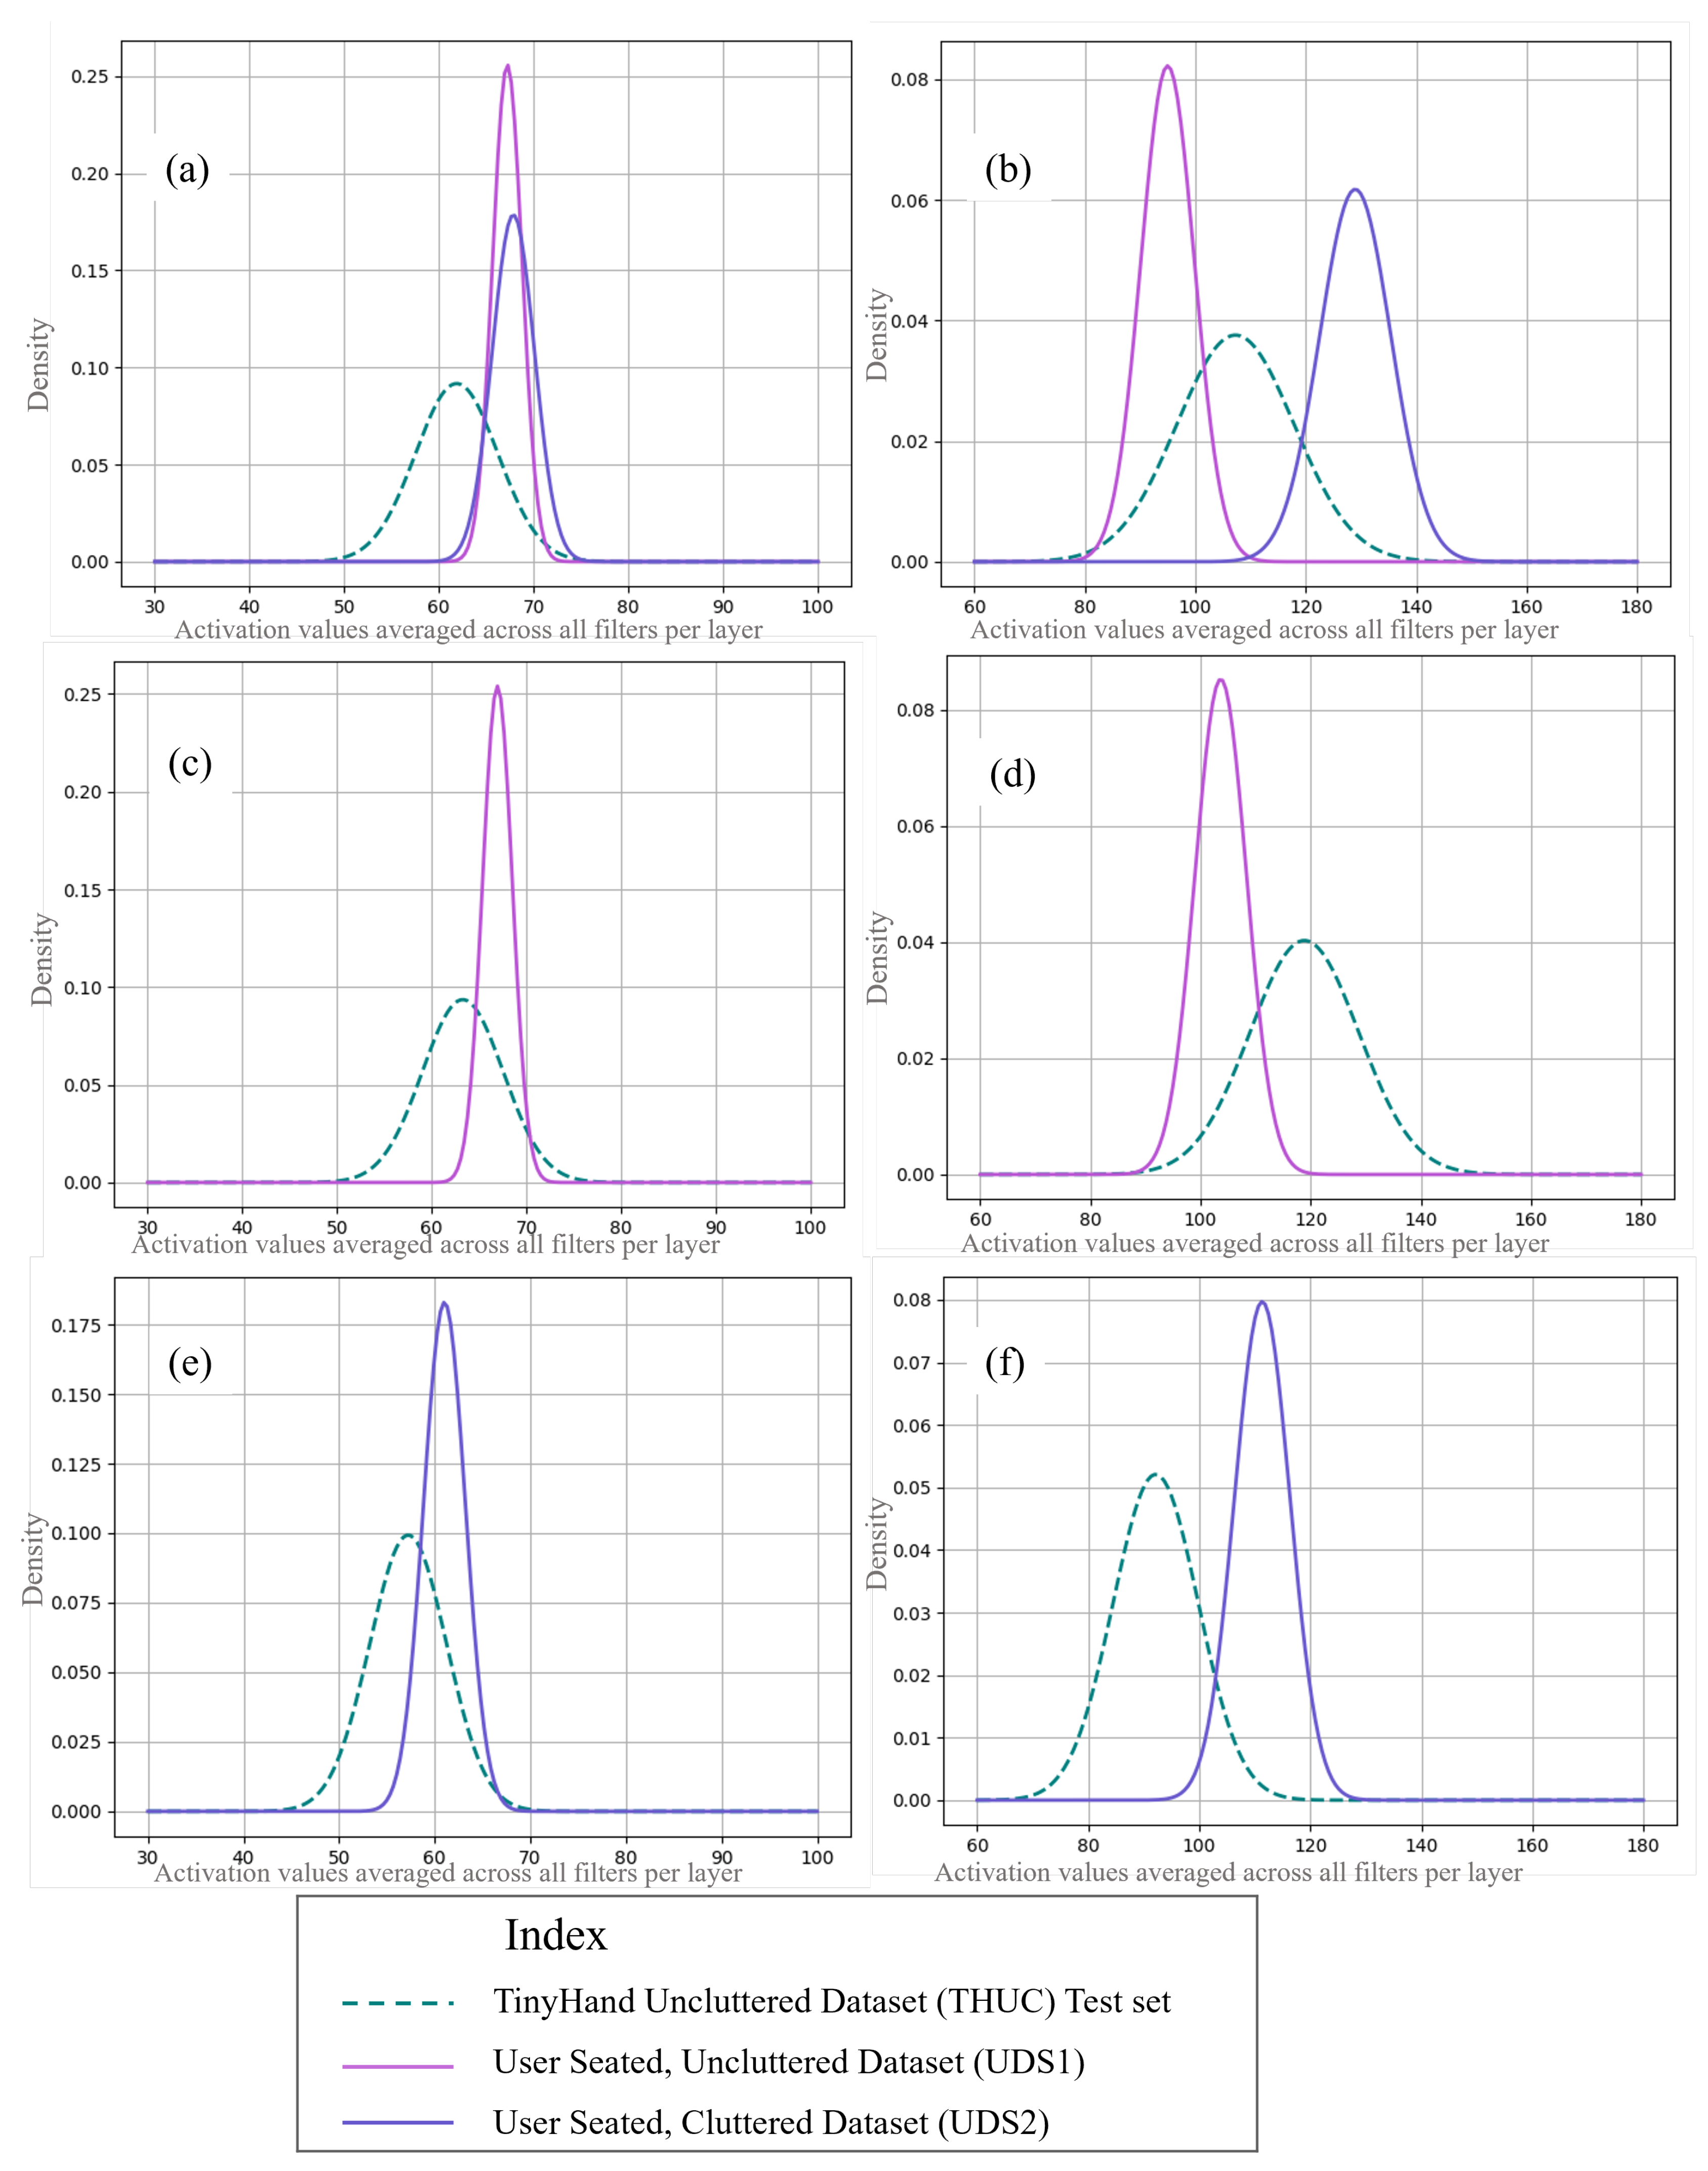
Figure 6.
Qualitative representation of covariate domain shifts encountered in hand gesture classification showing the relative shifts and corresponding similarity in the standard and used shifted datasets
Figure 6.
Qualitative representation of covariate domain shifts encountered in hand gesture classification showing the relative shifts and corresponding similarity in the standard and used shifted datasets
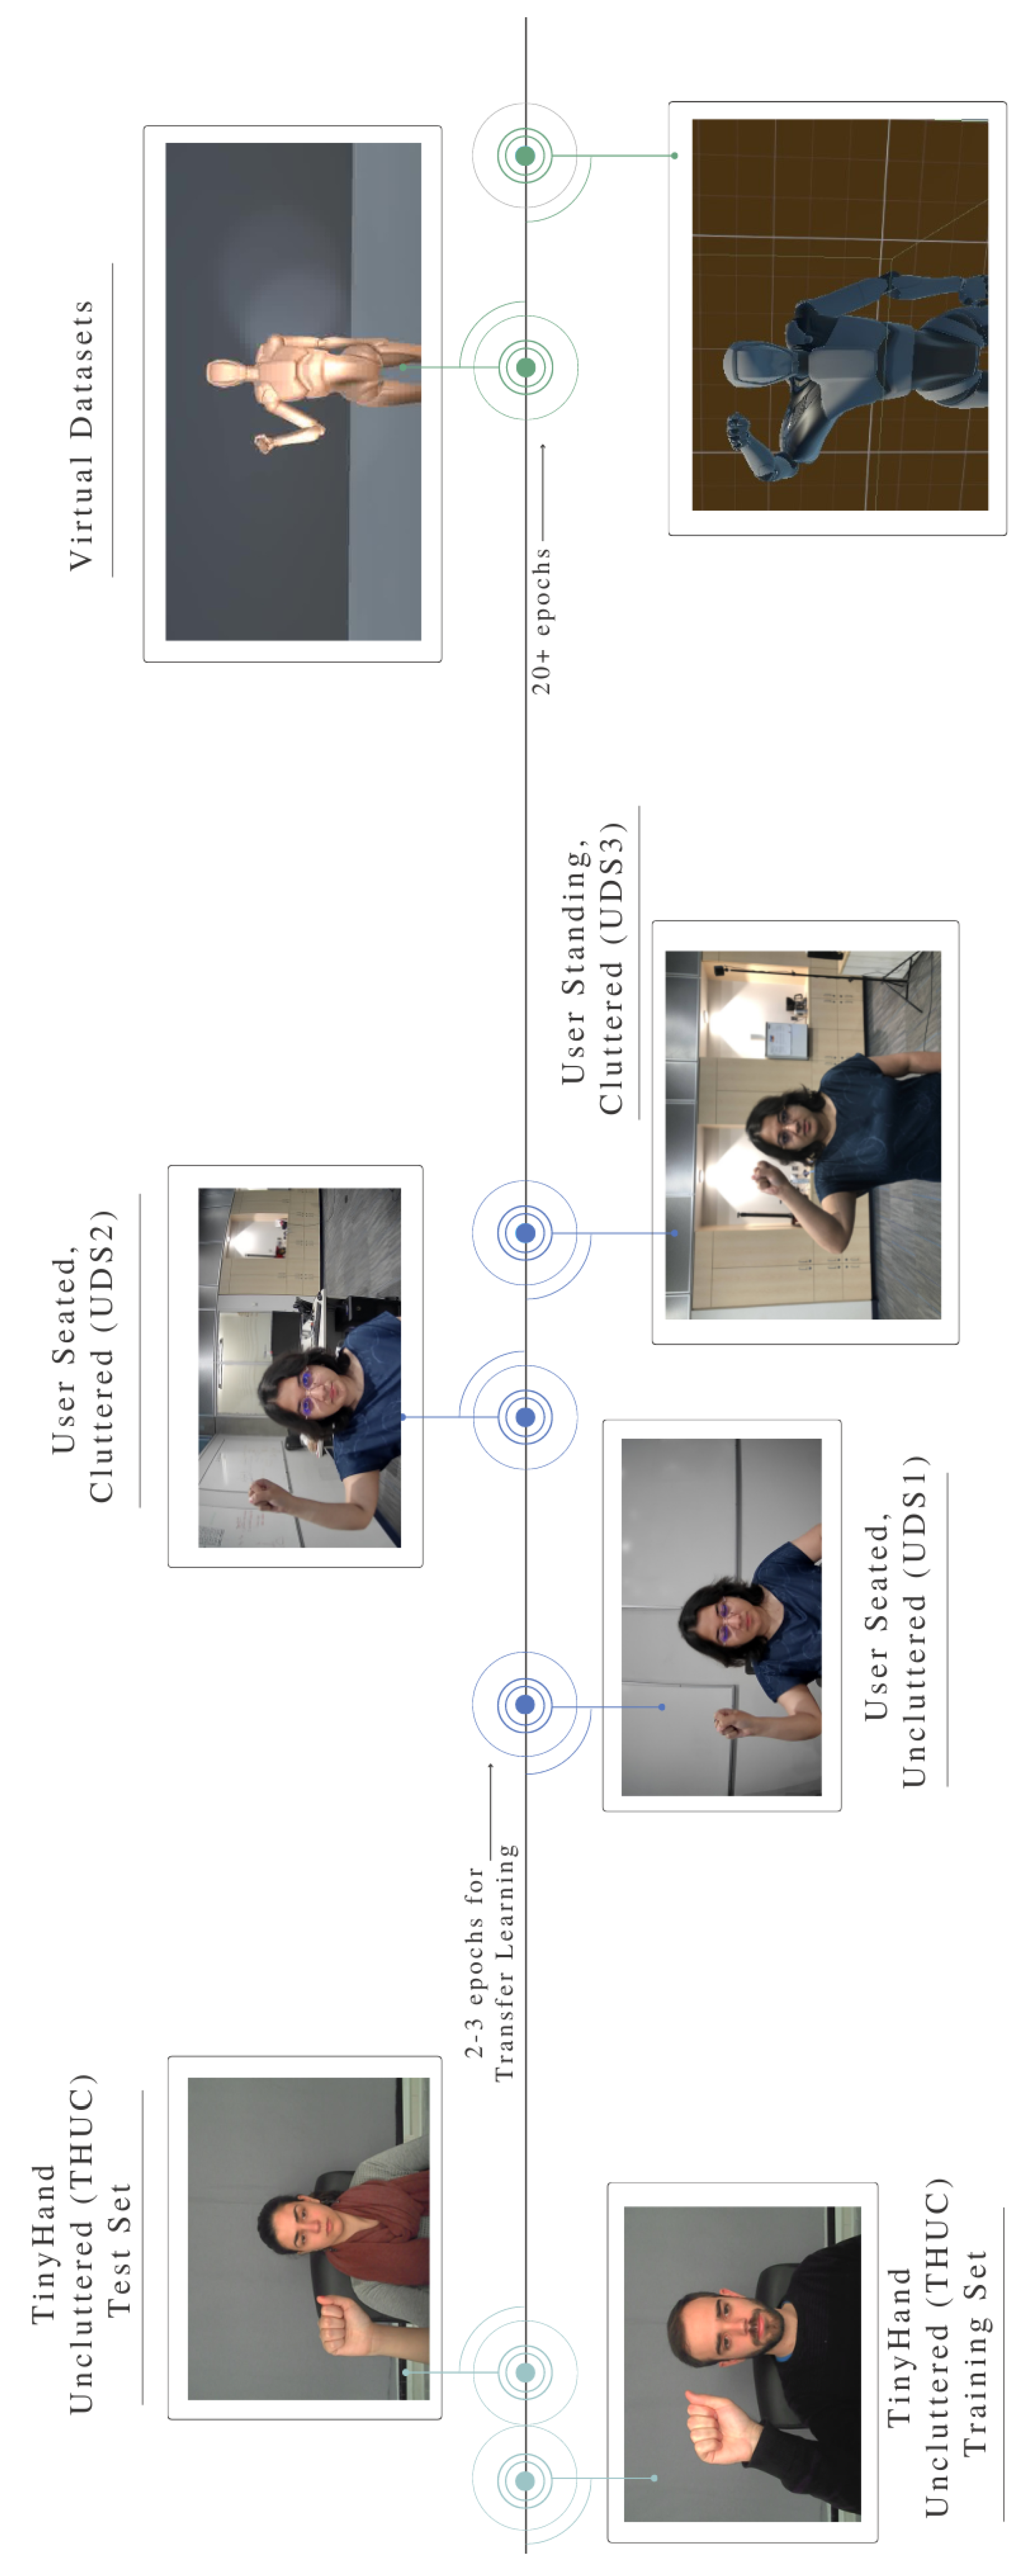

Table 1.
Covariate shift (R) and accuracy values for TinyHand Uncluttered Dataset (THUC), User Seated, Uncluttered (UDS1), User Seated, Cluttered (UDS2), User Standing, Cluttered (UDS3) & Virtual Datasets (VDS) using THUC test set as source
Table 1.
Covariate shift (R) and accuracy values for TinyHand Uncluttered Dataset (THUC), User Seated, Uncluttered (UDS1), User Seated, Cluttered (UDS2), User Standing, Cluttered (UDS3) & Virtual Datasets (VDS) using THUC test set as source
| Tested on | THUC | UDS1 | UDS2 | UDS3 | VDS |
|---|---|---|---|---|---|
| Accuracy | 0.96 | 0.58 | 0.48 | 0.16 | 0.09 |
| R, Layer 1 | 0.87 | 125.04 | 529.88 | 407.37 | 662.69 |
| R, Layer 2 | 0.77 | 87.26 | 486.05 | 943.40 | 10571.15 |
| R, Layer 3 | 0.38 | 33.86 | 70.78 | 67.34 | 116.28 |
| R, Layer 4 | 0.18 | 8.58 | 9.78 | 26.56 | 6.26 |
| R, Layer 5 | 0.12 | 2.08 | 5.08 | 6.54 | 6.12 |
Layer refers to MaxPool layer
Table 2.
Covariate shift (R) and accuracy values for TinyHand Uncluttered Dataset (THUC), User Seated, Uncluttered (UDS1), User Seated, Cluttered (UDS2), User Standing, Cluttered (UDS3) & Virtual Datasets (VDS) using THUC training set as source
Table 2.
Covariate shift (R) and accuracy values for TinyHand Uncluttered Dataset (THUC), User Seated, Uncluttered (UDS1), User Seated, Cluttered (UDS2), User Standing, Cluttered (UDS3) & Virtual Datasets (VDS) using THUC training set as source
| Tested on | THUC | UDS1 | UDS2 | UDS3 | VDS |
|---|---|---|---|---|---|
| Accuracy | 0.96 | 0.58 | 0.48 | 0.16 | 0.09 |
| R, Layer 1 | 146.08 | 417.86 | 3863.28 | 4689.43 | 8211.66 |
| R, Layer 2 | 183.72 | 241.45 | 3037.89 | 8296.30 | 4701616.77 |
| R, Layer 3 | 1.63 | 45.87 | 93.03 | 72.51 | 409.55 |
| R, Layer 4 | 3.98 | 10.94 | 10.65 | 25.16 | 12.11 |
| R, Layer 5 | 0.18 | 1.72 | 3.29 | 4.94 | 5.83 |
Layer refers to MaxPool layer
Table 3.
New covariate shift (R) and accuracy values for User Seated, Uncluttered (UDS1) on iteratively trained model1
Table 3.
New covariate shift (R) and accuracy values for User Seated, Uncluttered (UDS1) on iteratively trained model1
| Tested on |
New Accuracy |
New R on MaxPool Layer | ||||
|---|---|---|---|---|---|---|
| Layer1 | Layer2 | Layer3 | Layer4 | Layer5 | ||
| UDS1 | 0.73 | 119.49 | 81.06 | 28.86 | 9.10 | 2.04 |
Table 4.
New covariate shift (R) and accuracy values for User Seated, Cluttered (UDS2) on iteratively trained model1
Table 4.
New covariate shift (R) and accuracy values for User Seated, Cluttered (UDS2) on iteratively trained model1
| Tested on |
New Accuracy |
New R on MaxPool Layer | ||||
|---|---|---|---|---|---|---|
| Layer1 | Layer2 | Layer3 | Layer4 | Layer5 | ||
| UDS2 | 0.59 | 393.80 | 171.09 | 53.07 | 16.99 | 5.58 |
Table 5.
Covariate shift (R) and accuracy values for TinyHand Uncluttered Dataset (THUC), User Seated, Uncluttered (UDS1), User Seated, Cluttered (UDS2), User Standing, Cluttered (UDS3) & Virtual Datasets (VDS) on model0 trained on both THUC and THC (TinyHand Cluttered Dataset) with THUC as source distribution for shift calculations
| Tested on | THUC | UDS1_L | UDS1_R | UDS2 | UDS3 | VDS |
|---|---|---|---|---|---|---|
| Accuracy | 0.97 | 0.84 | 0.78 | 0.59 | 0.52 | 0.09 |
| R, Layer 1 | - | 201.43 | 134.27 | 329.49 | 610.39 | 39025 |
| R, Layer 2 | - | 68.53 | 53.63 | 68.74 | 61.04 | 386.46 |
| R, Layer 3 | - | 27.13 | 32.46 | 53.34 | 10.73 | 15.58 |
-
UDS1_L: UDS1 with left-handed gestures, UDS1_R: UDS1 with right-handed gesturesLayer refers to MaxPool layer
Table 6.
Covariate shift (R) and accuracy values for TinyHand Cluttered Dataset (THC), User Seated, Uncluttered (UDS1), User Seated, Cluttered (UDS2), User Standing, Cluttered (UDS3) & Virtual Datasets (VDS) on model0 trained on both THUC (TinyHand Uncluttered Dataset) and THC with THUC as source distribution for shift calculations
| Tested on | THC | UDS1_L | UDS1_R | UDS2 | UDS3 | VDS |
|---|---|---|---|---|---|---|
| Accuracy | 0.72 | 0.84 | 0.78 | 0.59 | 0.52 | 0.09 |
| R, Layer 1 | 46.29 | 2207.42 | 1897.07 | 178.75 | 62.79 | 2439 |
| R, Layer 2 | 30.18 | 264.05 | 256.69 | 157.53 | 24.67 | 459.35 |
| R, Layer 3 | 11.02 | 47.40 | 62.81 | 36.60 | 11.75 | 79.57 |
-
UDS1_L: UDS1 with left-handed gestures, UDS1_R: UDS1 with right-handed gesturesLayer refers to MaxPool layer
Table 7.
Covariate shift (R) for User Seated, Uncluttered Datasets with Left-Handed Gestures (UDS1_L) on model0 trained on both THUC (TinyHand Uncluttered Dataset) and THC (TinyHand Cluttered) with THUC and THC as source distributions for examination of batch size of target distribution
Table 7.
Covariate shift (R) for User Seated, Uncluttered Datasets with Left-Handed Gestures (UDS1_L) on model0 trained on both THUC (TinyHand Uncluttered Dataset) and THC (TinyHand Cluttered) with THUC and THC as source distributions for examination of batch size of target distribution
| Tested on | UDS1_L (large set) |
UDS1_L (small set) |
UDS1_L (large set) |
UDS1_L (small set) |
|---|---|---|---|---|
| Source | THUC | THUC | THC | THC |
| R, Layer1 | 190.88 | 201.43 | 2360.98 | 2207.42 |
| R, Layer2 | 53.60 | 68.53 | 223.89 | 264.05 |
| R, Layer3 | 23.44 | 27.13 | 45.48 | 47.40 |
Layer refers to MaxPool layer
Disclaimer/Publisher’s Note: The statements, opinions and data contained in all publications are solely those of the individual author(s) and contributor(s) and not of MDPI and/or the editor(s). MDPI and/or the editor(s) disclaim responsibility for any injury to people or property resulting from any ideas, methods, instructions or products referred to in the content. |
© 2025 by the authors. Licensee MDPI, Basel, Switzerland. This article is an open access article distributed under the terms and conditions of the Creative Commons Attribution (CC BY) license (https://creativecommons.org/licenses/by/4.0/).
Copyright: This open access article is published under a Creative Commons CC BY 4.0 license, which permit the free download, distribution, and reuse, provided that the author and preprint are cited in any reuse.


