
Submitted:
15 February 2025
Posted:
17 February 2025
You are already at the latest version
Abstract
The deep underground salt cavities have the advantage of allowing storage of hydrogen at higher pressures than surface installations. Worldwide, in the 2020s there were 4 functional sites of salt caverns used as hydrogen deposits, three in the United States and one in the United Kingdom, at an average of 600,000 m3 capacity each at pressures varies between 50 ÷ 150 bar in the United States and 3 x 70,000 m3 at a pressure of 45 bar in the United Kingdom [1, 2]. From 2020 until now, there is an increase in the salt deposit development for hydrogen storage, expecting to account for about 18% of global energy demand by 2050 [3]. Near Vadu locality, Constanta County, Romania, there are sald deposits located between 705 m and 905 m, respectively 1542 m and 1778 m, offshore in the Black Sea continental shelf. The study consists in determining the storage capacity, at the two drilling depths, for reliable projects of hydrogen storage, for Romania's Energy Strategy, leading to a reduction in the carbon footprint at 70% in 2050 compared to the levels recorded in 2008 of CO2 emissions per transport unit for all the civilian or military transport ships [4, 5].
Keywords:
deep salt caverns
; high pressure hydrogen storage
; Romanian Energy Strategy
1. Introduction
The continental shelf of the Black Sea represents the seabed, and the subsoil of the adjacent submarine regions located beyond the territorial sea to a depth of 200 m or over this limit, up to the point where the depth of the waters allows the exploitation of the natural resources of these regions. The platform has the appearance of a plane with a very low slope that descends towards the sea, reaching depths of 200 m [6], see also Figure 1, (a). The intermediate depths (50-100 m) follow the shoreline and include the territorial sea (22 km from onshore) and the exclusive economic zone, further on it being the free zone. The map from Figure 1, (b) shows a research work of a romanian-bulgarian team for determining simultaneously the bathymetry, gravimetry and total field magnetometry, with the R/V Mare Nigrum GeoEcoMar’s ship (Romania) [7, 8], that covered a total shelf and slope area of 47,000 km2, see in Figure 2, (b), the marked area [9]. The degree of knowledge of the geology of the aquatic area, near the shore, encourages the elaboration of works that capitalize the information already obtained; the geological exploration of the Romanian continental platform of the Black Sea has a long history, marking almost 55 years since the recording of the first seismic sections and 45 years since the digging of the first well. From a seismological, gravity and magnetic point of view it is evaluated an area of approx. 33,160 km2, and in the same time 120 wells were dug, that share the research in three subunits, North Dobrogea, Central Dobrogea and Southern Dobrogea, see Figure 1, (c, d) whose differences are manifested especially at the foundation level, 57 of them being between two geological faults, Capidava-Ovidiu and Peceneaga-Camena, that mark the Central Dobrogea area [9].
In Figure 2, a detail of Figure 1, (d) was made where it has been suggested that in the Vadu area there is a gravity negative anomaly which can be interpreted by various authors as salt deposits. Gravimetry is usually used for salt deposits, and it is not used for deposits that contain iron [10, 11, 12].
As a whole, the geological structure of the Dobrogean continental platform includes the same major units as the adjacent land: the North-Dobrogean Orogen, the Babadag Basin and the Moesic Platform with its subdivisions, Central Dobrogea and Southern Dobrogea, see also Figure 3 [13].
The paper is studying the Vadu structure that is before the Histria Depression, and is situated in Central Dobrogea, see the Figure 2 and Figure 3. The Vadu structure represented by the evaporitic facies from the Upper Jurassic and Lower Cretaceous periods, a unique case in the Romanian sector of the Black Sea continental platform, is mainly composed of salt alternating with limestone. These facies were opened by the 19 Vadu well, at a depth of about 1,500 m, in the interval 620 m ÷ 2,110 m. Towards the east of the basin, these facies are replaced by carbonates [14]. The Callovian-Oxfordian, 2,036 m ÷ 2,110 m is predominantly sandstone with clay intercalations, the Oxfordian – Kimmeridgian, 2,036 m ÷1,965 m is predominantly calcareous with marl intercalations, the Kimmeridgian – Purbekian, 1,818 m ÷ 1,965 m is represented by alternations of argillaceous limestone and limestone dolomitic. The Purbekian-Wealdian follows, 1,820 m ÷ 620 m represented by rock salt, alternating with calcareous - dolomitic or bituminous shale and anhydrite. The evaporitic series passes into the Neocomian, 620 m ÷ 458 m to gypsums with anhydrite. In succession, the Neocominan passes to limestone and conglomerates. In Apţian, 389 m ÷ 458 m the series continues also with conglomerates/pebbles and limestone. The Upper Cretaceous, 311 m ÷ 389 m, is calcareous and sandstone-clay with marl intercalations. The Upper Paleogene, 389 m ÷ 250 m is transgressive, being made up of sandstones and marly sandstones or with clayey intercalations. The Vadu structure was investigated in 1988 – 1989, when the 19 Vadu borehole was dug see Figure 4 [15]. The saline formation that is the object of this study was attributed to the Purbekian-Wealdian. The character of the deposits and the great thickness of the saline formation seem to represent the indicators of a sabkha-type sedimentary environment developed on a platform with very active subsidence [15].
2. The Evaluation Methodology for the Deep Salt Deposit in the Continental Shelf of the Black Sea and Calculus Results for Energy Storage Potential
The section methodology and evaluation of caverns for hydrogen storage summarizes the offshore salt cavern site selection process starting with the characterization of salt deposits, then passing the choice of conditions considered suitable for cavern development by analyzing the proximity of existing infrastructure and finally, on cavern design, placement and storage capacity estimates.
Determining the development potential of salt caverns requires the use of multiple techniques and datasets to form a robust analysis of the geology and geophysics of salt formations and associated geomechanics to ensure cavern stability and subsequent energy security. Therefore, characterizing the identified salt formations and evaluating them for their suitability for hydrogen storage are the first steps in the screening process. The selection process for the depth and height of the location of the caverns was based on the lithological heterogeneity, thickness and mode of formation: sedimentary or diapiric. The cavern placement was based on an optimal depth range dependent on the convergence rate of the caverns, hydrogen storage pressure, floor and safety pillar thickness, and recommended cavern shape criteria established from the literature and gas storage experience underground see Figure 5 (a) [16], Figure 5 (b) [16] and Table 1 [17].
The classical method consists in injecting fresh water into the saline layer; the fresh water circulates and becomes salty, forming the brine, which is then extracted through extraction pipes and directed for processing and production, especially of sodium products. The equipment consists of three concentric columns: a sealing column (anchoring column, cemented, which will have the length to where it is estimated that the ceiling of the future dissolution gap should be), an exploitation column (cassing) and a column extraction (tubing). Three concentric spaces are created, which ensure that the circuits of the cell are three technological fluids: industrial water, insulating fluid and brine [27]. In our case at Vadu well, the induistrial water can be marine water, and, also, the brine can be discharged back into the sea, as no facilities for salt processing are implemented yet. The construction of the well begins with the drilling of the well for the anchor column, continues with its tubing, cementing, tightness check and finishing with the drilling and tubing of the exploitation hole see Figure 6 (a) [28]. In Figure 6 (b) the cavern was simplified to a cylinder with conical top and bottom with the values of: Ød~300mm – the diameter of the cemented column, ØD – the diameter of the underground cavern, h1 = 1/3D, h3 = 1/6D, h2 = H-(h1 + h3), where H is the total hight of the cavern.
The volume of the simplified cavern from Figure 7 (b) is given by the relation:
The conditions for carrying out marine drilling are more special, considering the lack of fresh water. However, the Black Sea has a medium to low salinity around the Vadu structure. For the area near the coast, the values for temperature and salinity measured in June are in the range of 20.68°C - 26.2°C, respectively 9.8 PSU (practical salinity unit – 9.8 g salt/1000g water) in the Danube mouth area and 17.98 PSU in the Vadu - Constanta - Eforie areas, see Figure 7 [29].
Another condition, according to the Romanian experience in the exploitation of salt through wells, is imposed by the depth: it is estimated that up to 1250 m there are no special technical problems [15]. On the world level, with the taking of additional measures, salt was also exploited from depths up to 3000 m. For example, since 1972, the company KemOne has been extracting the salt from deep caverns (1500–3000 m) in the form of brine [30]. In the Vadu structure, the exploitation of salt in order to create natural gas storage deposits is leased on the intervals of 705 - 905 m and 1542 - 1800 m. In the laboratories of the University of Petroşani, Petroşani city Romania, research was carried out on the samples of salt extracted from the 19 Vadu well to determine the geomechanical characteristics of rock salt, namely: physical-mechanical, deformation and rheological. The average values of these characteristics are shown in Table 2 [15]. In Table 3 [15], compressive strength measurements performed on salt samples from different salt mines in Romania are presented comparatively.
The diameter of the underground cavern is calculated with the relation (2) [31] (p. 58):
where:
R – the radius of the dissolution cylinder;
Q – the flow of water introduced into the cavern, Q = 30 m3/h;
Csat – extracted brine concentration (saturated), in Kappeller degree (1 Kappeller degree = 10 grams / liter of brine), Csat = 31.5 g/dm3;
w – the lifting speed of the operating column, w = 0.00287 m/h, given by the relation (3) [31], (p. 59):
where: Csol – solvent concentration in Kappeller degree = 13.1 g/dm3;
For these parameters, resulted in a diameter of the underground reservoir of ~40 m. The dissolution massic speed of rock salt in the horizontal direction in [kg/(m2h)] can be evaluated with the following empirical formula established by Külle (URSS) [32] (p. 59), [32] (p. 63), which also considers the salinity of the water introduced, in our case sea water:
where: Csat – the saturation concentration of the brine = 0.315 g/cm3; Csol – solvent concentration ~ 0.18 g/cm3 (marine water in Vadu area, see above); Ψ – 1.57 rad (corresponds to the 90° angle made by the vertical wall of the dissolution chamber with the horizontal); γsat – the specific density of the saturated brine = 1.24 g/cm3; γsol – the specific density of the solvent = 1.13 g/cm3. To express the dissolving speed in [m/h] in radial direction, should be divided the Vmass obtained by Kulle's relation to the specific density of the salt γsalt = 2160 kg/m3 and in this case
The management of the dissolution is done through a rigorous control of the quantities of seawater introduced into the well, the quantities of brine extracted and its concentration, considering the initial salinity of the seawater. The completion time of a step can be calculated with the relation (6) [32]:
where: R – radius of the underground reservoir, R = 20 m; V – mean radial velocity of dissolution = 0.0027 . 24 = 0.0648 m/day. Results the completion time of T = 200 days. For a radius of the underground reservoir, R = 30 m, the completion time is T = 300 days. The optimal height of the dissolution step was determined by the relation (7) [15]:
where: K1 – correction coefficient = 1.13; K2 – coefficient that depends on the speed of salt dissolution = 14.4; γsalt – the specific density of the salt (from above); V – mean radial velocity of dissolution = 0.065 m/day; Cm – medium concentration of brine = 166.5 g/dm3.
In conclusion, for these parameters, the height of the dissolution step will be 8.7 m for a radius of the underground reservoir, R = 20 m, and 5.9 m for a radius of the underground reservoir, R = 30 m, in completion time of T = 200 days for the first case and T = 300 days for the second case. For the geomechanical conditions in the Vadu structure the parameters are: the thickness of the package of covering rocks and sea water, h1 = hr + hw = 700 m + 100 m = 800 m; volume density of the covering rocks, γ = 2.0 · 103 kg/m3; the diameter of the dissolution cylinder, D = 40 m; tensile strength of the salt, σrt = 1.4 N/mm2; density of salt, g = 9.8 m/s2 (standard gravity).
The thickness of the salt floor hf see the relation below [15]:
where: D – the diameter of the reservoir; q – the load given by the covering rocks, sea water, and the contrapressure of the brine, kf = 4.85 (the correction coefficient), ks = 1.3 (safety coefficient) and n = 1. For q see Appendix A.
The calculation results are given in the tables below:
The time is almoust double as given in literature [15] due to the salinity of the see water used for cavern creation and that is lowering the proces.
In Table 6 below calculations are given over the hydrogen storage capacity of each type of cavern at the given depth of 700 m respectivelly 1,400 m. Also, the termal gradient with depths of about 30°/1,000m have been taken into consideration, see Table 5. Heve been taken into consideration the netto volume of hydrogen, the netto mass stored and the netto energy potential storage.
For a request of energy of 10 MWh at a given time, the energy stored in cavern A ensures a total functioning time of 2,344.3 hours ~ 97.7 days ~ 3 months and 1 week. Cavern B ensures a total functioning time of 9,393.9 hours ~ 391.4 days ~ 13 months (1 year and 1 month). Energy is a netto energy without taking into consideration the captived energy, that represents the minimum energy stored required for the correct functioning of such a storage system.
3. FEA Analysis of Underground Hydrogen Storage Caverns: Structural Integrity Under Pressure
To assess the structural integrity of underground hydrogen storage, finite element analysis (FEA) simulations were conducted on caverns located at two different depths: 700 m and 1400 m. The 3D models are at real scale. These caverns are subjected to varying hydrogen pressures, as shown in Table 6 above, the shallower cavern at 700 m operating within a range of 30–120 bar, while the deeper cavern at 1400 m experiences pressures between 60–230 bar.
The simulations aimed to evaluate the mechanical response of the surrounding salt deposit under these pressure conditions, identifying potential stress concentrations and failure points. The results provide insight into the feasibility of sustained hydrogen storage at different depths and pressure levels.
SolidWorks Simulation add-on was used to create and run the FEA analysis, due to its capability of defining custom materials. The caverns must withstand the lithostatic pressure exerted by the overlying rock strata and sea water. To account for this, an equivalent mass was determined based on the average density of each stratum and the mass of sea water above (shown in Figure 8. In order to be able to drill the 60 m caverns, they were interspersed between the 40 m ones. Also, in order to validate this result, the mass was also calculated based on geostatic pressure. Since SolidWorks does not support direct input of such high distributed mass values, an additional domain with an adjusted density was introduced to replicate the correct weight. Series of simulations were done for both salt deposit and minimum and maximum cavern pressure. The matrix was simplified to 3x3 for 40 diameter caverns and 2x2 for 60 diameter caverns.
In Figure 9 von Mises stress distribution across the first set of salt caverns is depicted (40m diameter, at 700m depth). The scale was limited to the lower value of compressive strength (22 MPa as of Table 2) showing that there is no risk of failure. It is shown that in the center of the matrix, the compressive strength is greater than at the margins.
In Figure 10 the scale was limited to the dilatation threshold (13 MPa as of Table 2), a point where the caverns will suffer plastic deformations.
For the minimum pressure of 30 bar, higher stress is seen at the extremities of the cylindrical part of the caverns, where the upper limit of the compressive strength is reached (36 MPa as of Table 2), which can be avoided by increasing the minimum pressure of the vessels, see Figure 11 and Figure 12. The hidrogen withdrawal is available between 120 to 30 bar, and the cushion gas in conclusion should have 30 bar pressure minimum.
At 1400m depth, since the geostatic pressure is much higher, this results in higher operating conditions of the caverns in order to avoid failure due to the exceeding of the compressive strength. At maximum operating pressure, at the extremities of the cylindrical part, some spots that are close to the compressive strength limit can be seen in Figure 13 and Figure 14.
At the minimum pressure of 60 bar, a maximum stress of around 65 MPa is reached, that would result in a critical failure of the salt caverns, in the zone of the top and bottom cones. The conclusion is that it is not possible to withdraw the hidrogen under the pressure of 60 bar in the cavern at 1400 m depth. The hidrogen withdrawal is available between 230 to 60 bar, and the cushion gas in conclusion should have 60 bar pressure.
In Table 7 data have been collected for cavern storage sites indicated for drilling salt storage caverns [33].
4. Short Comparison Between H2 Salt Cavern Storage and H2 Hydrate Storage
The conventional H2 storage options include salt caverns, saline aquifers, and depleted gas reservoirs. Generally, storing hydrogen in salt caverns is preferable as the cushion gas is very low comparativelly with the other solutions, and it can be implemented on a large scale once these caverns exist. If these do not exist, the salt caverns are created by solution mining in salt-rich formations and the costs with mining are about $25.5/m3 [49]. For a cavern of 150,000 m3 at 700m depth, the cost of salt cavern creation is about $3,825,000, without other costs that are about $5,800,000 [49] taking into consideration the values from Table 6. As a first approximation, the cost of a new salt cavern at 700m depth is about $10,000,000. For a cavern of 320,000 m3 at 1400m depth, as a first approximation, the cost of a new salt cavern is about $30,000,000 taking into consideration the values from Table 6, about 3 times greater than a cavern at 700 m depth, but the storage mass is about 4 times greater than the storage mass in the cavern located at 700m depth.
A new technology for hydrogen storage is hydrate-based H2 storage, based on thermodynamic hydrate promoter. A pure H2 hydrate can achieve 5.3 wt% H2 storage capacity at extremely high pressures of 300 MPa at 249 K (-24°C). The addition of thermodynamic hydrate promoters (THPs), such as tetrahydrofuran (THF), 1,3-dioxolane (DIOX), cyclopentane (CP) in the 5.56 mol%, have shown promotion effect on shifting H2 hydrate equilibrium to moderate pressure and temperature ranging from 8.3 MPa to 18.3 MPa and 277…284K (4…11°C) [50].
The technology of hydrate formation is promising as long as for 1000 kg of water (1 m3 of water) there is 56 kg captured hydrogen, or 1.9MWh/ tone water captured energy in conformity with Table 6, taking into consideration the pure water. Also, for pure water hydrogen hydrate formation it is necessary to have a pressure of over 300 Mpa at low temperatures. Using 5.56 mol% thermodynamic hydrate promoters (THPs), the amount of hydrogen stored decreased at ~4.3wt% see Appendix B, but the pressures also decrease dramatically, with positive slightly above 0°C temperatures.
From [51] for an amount of stored H2 = 5.4 milion Nm3, the initial cost of implementing the hydrate technology is about 15.2 billion JPY or 99 milion USD. From the above the initial cost for implementing 2 caverns, one at 700m and the other one at 1400m, is about 40 milion USD, for an amount of 39.5 million Nm3 H2.
In conclusion from a rough estimation, hydrogen hydrate technology is a very promising one with a ratio of 1:6 costs compared to salt cavern storage technology up to date.
The advantage of salt cavern tehnology in offshore areas is that the technology does not require fresh water for dissolving and the technologies are quite well-known. The greatest desadvantage is that technology takes a very long time to create a new cavern.
The offshore hydrogen hubs are a necessity not just for Romania but also for other countries especially those with access to the sea and ocean for large capacity container ships transporting to reduce and eventually eliminate greenhouse gas (GHG) emissions from international shipping [52].
5. Conclusions
The storage of hydrogen in Romania, as it was said in the summary of the work, is included in the Romanian Energy Strategy 2016-2030 [53] regarding the development of production, transport and storage infrastructure in the development of reliable projects to reduce the carbon footprint, and not only, but especially in the creation of a clean and intelligent planet. There are laws implemented at the European level for the gradual reduction of the carbon footprint, such as the reduction of at least 40% in 2030 and 70% in 2050 compared to the levels recorded in 2008 of CO2 emissions for transport units, especially naval which brings a huge contribution to marine and environmental pollution. Romania had in April 2024 about 3,000 MW (16.5%) represented by wind farms [54], and in March 2024 about 3,000 MW (16.5%) represented by photovoltaic farms (including the prosumers) [55], which means 33% of the power installed in electricity production units in Romania. The energy given by regenerable sourses at maximum production is in summer. In the winter the production of the regenarable sourses decrease dramatically. The hydrogen storage strategy plays an important role in maintaining stability and uniformity of energy production.
For Romania, the implementing of the hydrogen storage in the Romanian Energy Strategy, is of capital importance in terms of the further development of hydrogen production and transport capacities, in the context in which renewable energy is rapidly developing and the need for decarbonization comes into force. There are also projects to introduce hydrogen into natural gas networks, as well as projects to introduce hydrogen into electrical and thermal energy production capacities like fuel plants, with new generation engines, see Siemens Energy Strategy [56]. The opening of storage capacities offshore to the Black Sea, also opens up the opportunity to use stored hydrogen in order to feed maritime and fluvial, commercial and military ships in order to mix conventional fuels with percentages of hydrogen to reduce de carbon footprint [57]. The total number of wells that could be opened in the area of the trapezoid shown in Figure 2 and Figure 3 of about 595 km2, taking into consideration the margins shown in table 1, considering a diapiric deposit, and both levels, is aproximativelly 20,600 (10,300 in the 700 m first level and 10,300 at the 1,400 m second level), considerring a diameter of 60 m for the cavern and a distance between them of 240m (4 . D), see also the trapezoidal area from Figure 2 and Figure 3, divided into 18+5.35 sectors of 441 wells each shown in Figure B1 from Appendix C.
The total capacity in tonnes is given (from table 6) by the relation:
over 36 million tonnes H2. The total amount of energy stored is given by relation (9):
over 1.2 PWh energy stored. The conclusion is that Romania is at the beginning of the road in terms of hydrogen storage capacities but has a huge potential in developing them and in increasing the production and transport capacities of hydrogen, ensuring a sustainable future in the Green Energy Sector.
Author Contributions
Conceptualization, S.P., S.D., I.V. and B.T.O; methodology, S.P., I.V, S.D; validation, B.T.O and S.P.; formal analysis, I.V., R.M.S. and M.T.S.; investigation, S.P. and S.M.R; resources, S.P., S.D., R.M.S., M.T.S., M.L.V. and I.V.; writing—original draft preparation, I.V. and M.T.S.; writing—review and editing, S.P.; visualization, M.L.V; supervision, S.M.R; project administration, S.M.R; funding acquisition, S.M.R.; software, M.T.S.; data curation, B.T.O and M.L.V. All authors have read and agreed to the published version of the manuscript.
Funding
This research received no external funding
Data Availability Statement
The authors confirm that the data supporting the findings of this study are available within the article [and/or] its supplementary materials.
Acknowledgments
In this section, you can acknowledge any support given which is not covered by the author’s contribution or funding sections. This may include administrative and technical support, or donations in kind (e.g., materials used for experiments).
Conflicts of Interest
The authors declare no conflicts of interest.
Appendix A
Regardless of how the floor is considered, the load acting on it will be [15]:
Where q0 is the weight of the salt floor, qs represents the additional load exerted by the rocks located above the salt deposit and p represents the counterpressure exerted by the brine inside the void produced by dissolution. So, we have the relations below:
where hf was defined in the work by relation (8)
and
where the specific density of the salt, γsalt = 2.16 · 103 kg/m3; the specific density of the brine, γsat = 1.24 · 103 kg/m3; the specific density of the solvent water (see water), γsol –= 1.13 g/cm3.
Appendix B
For pure hydrogen hydrate, 5.3 wt% (5.3 kg H₂ per 100 kg hydrate) corresponds to 53 kg of hydrogen per 1000 kg of hydrate. Adding 5.56 moles THPs will be slightly reduces the H₂ storage capacity, as part of the hydrate mass is replaced by the promoter. The molar mass for THP varies (e.g., for THF is about 72 g/mol, for DIOX is about 90 g/mol and for CP is about 70 g/mol). For a rough estimation, we can use the average molar mass of the THPs, about 72 g/mol [58]. 5.56mol% of THP implies 94.44mol% of water. The mass procent for water and THP are calculated by equations [59]:
and
where ; ; and
As results, = 81% and = 19% from 1000 kg hydrate.
The amount of H2 will be
where is the mass of H2 storred in 1000 kg hydrate with5.56 mol% of THP.
Appendix C
Figure A1.
A schematic division of the trapezoidal sector from Figure 3, with the theoretical 10,300 wells per each level.
Figure A1.
A schematic division of the trapezoidal sector from Figure 3, with the theoretical 10,300 wells per each level.
References
- Hévin, G.; Underground storage of Hydrogen in salt caverns, European Workshop on Underground Energy Storage, Paris, France, 7th - 8th November 2019. Available online: https://energnet.eu/wp-content/uploads/2021/02/3-Hevin-Underground-Storage-H2-in-Salt.pdf (accesed on 29.10.2024).
- Jahanbakhsh, A.; Potapov-Crighton, A. L.; Mosallanezhad A.; Tohidi Kaloorazi N.; Mercedes Maroto-Vale M.; Underground hydrogen storage: A UK perspective, Renewable and Sustainable Energy Reviews, 2024, 189, Part B, 114001. [CrossRef]
- Zhu S.; Shi X.; Yang C.; Bai W.; Wei X.; Yang K.; Li P.; Li H.; Li Y.; Wang G.; Site selection evaluation for salt cavern hydrogen storage in China, Renewable Energy, 2024, 224, 120143. [CrossRef]
- Parliament says shipping industry must contribute to climate neutrality. Press release. European Parliament, 16-09-2020. Available online: https://www.europarl.europa.eu/news/ro/press-room/20200910IPR86825/parliament-says-shipping-industry-must-contribute-to-climate-neutrality (accessed on 08.01.2025).
- How much does the shipping industry contribute to global CO2 emissions? GHG Emissions. Sinai SAS. September 22, 2023. Available online: https://sinay.ai/en/how-much-does-the-shipping-industry-contribute-to-global-co2-emissions/ (accessed on 08.01.2025).
- Dimitriu R. G.; Oaie G.; Ranguelov B.; Radichev R.; Maps of the Gravity and Magnetic Anomalies for the Western Black Sea Continental Margin (Romanian - Bulgarian Sector), In Proceedings of 16th International Multidisciplinary Scientific GeoConference SGEM, 2016, 3.
- Oaie G.; Florescu S.; Mare Nigrum – The First Romanian Multidisciplinary Research Vessel in Romania, In Proceedings of EuroEcoGeoCenter - Romania / Danube Delta, Romania, 2004, No. 9-10. Available online: https://geoecomar.ro/website/publicatii/Nr.9-10-2004/22.pdf (accesed on 29.10.2024).
- Mare Nigrum. Ship of national interest. GeoEcoMar. Available online: https://geoecomar.ro/en/research-vessels/mare-nigrum/ (accessed on 08.01.2025).
- Georgiev G.; Geology and Hydrocarbon Systems in the Western Black Sea, Turkish Journal of Earth Sciences, 2012, 21, (5), 4. [CrossRef]
- Flores M. N.; Aleman C. O.; Orozco-del-Castillo M. G.; Fucugauchi J. U.; Castellanos A. R.; Castañeda C. C.; Alcantara A. T.; 3D Gravity Modeling of Complex Salt Features in the Southern Gulf of Mexico, International Journal of Geophysics, 2016, Article ID 1702164. [CrossRef]
- Prutkin I.; Saleh A.; Gravity and magnetic data inversion for 3D topography of the Moho discontinuity in the northern Red Sea area, Egypt, Journal of Geodynamics, 2009, 47, 5, pp. 237-245. [CrossRef]
- Prutkin I.; Vajda P.; Jahr T.; Bleibinhaus F.; Novák P.; Tenzer R., Interpretation of gravity and magnetic data with geological constraints for 3D structure of the Thuringian Basin, Germany, Journal of Applied Geophysics, 2017, 136, pp. 35–41. [CrossRef]
- Juravle D. T., In Geologia Romaniei, Vol. 1, Geologia terenurilor Est-Carpatice (Platformele şi Orogenul Nord-Dobrogean) (Romanian Geology, Vol. 1, Geology of the Eastern Carpathian lands (Platforms and the North Dobrogean Orogen)), Editura STEF, Iasi, Romania, 2009, ISBN: 978-973-1809-55-7, 2009. Available online: https://doru.juravle.com/publicatii/geologia_romaniei_vol01.html (accesed on 29.10.2024).
- Dinu C.; Wong H. K.; Tambrea D.; Matenco L., Stratigraphic and structural characteristics of the Romanian Black Sea shelf, Tectonophysics 2005, 410, (1) pp. 417–435. [CrossRef]
- Coteş D., Studiul geomecanic al masivului de sare din structura Vadu în vederea executării unui rezervor de gaze naturale (Geo-mechanical study of Vadu salt deposit, in view of the construction of an underground natural gas storage facility), PhD. Thesis, University of Petroşani, Faculty of Mines, Petroşani, Romania, 2008.
- Hui S., Yin S., Pang X., Chen Z., Shi K., Potential of Salt Caverns for Hydrogen Storage in Southern Ontario, Canada, Mining 2023, 3, pp. 399–408. [CrossRef]
- Popescu S., Radu M. S., Vîlceanu F., Dinescu S., Research on the setting of maximum pressure in salt caverns intended for CO2 storage, MATEC Web of Conferences, 2022, 373, 00066. [CrossRef]
- Caglayan D. G.; Weber N.; Heinrichs H. U.; Linßen J.; Robinius M.; Kukla P. A.; Stolten D., Technical potential of salt caverns for hydrogen storage in Europe, International Journal of Hydrogen Energy, 2020, 45, pp. 6793–6805. [CrossRef]
- Wang L.; Bérest P.; Brouard B., Mechanical behavior of salt caverns: closed-form solutions vs numerical computations, Rock Mechanics and Rock Engineering, 2015, 48, pp. 2369–2382. [CrossRef]
- Wang T.; Yang C.; Ma H.; Daemen J. J. K.; Wu H., Safety evaluation of gas storage caverns located close to a tectonic fault, Journal of Natural Gas Science and Engineering, 2015, 23, pp. 281–293. [CrossRef]
- Lux K. H., Design of salt caverns for the storage of natural gas, crude oil and compressed air: geomechanical aspects of construction, operation and abandonment, Geological Society, Special Publications, London, 2009, 313, pp. 93–128. [CrossRef]
- Evans D. J.; Holloway S., A review of onshore UK salt deposits and their potential for underground gas storage. Geological Society, Special Publications, London, 2009, 313, pp. 39–80. [CrossRef]
- Plaat H., Underground gas storage: why and how, Geological Society, Special Publications, London, 2009, 313, pp. 25–37. [CrossRef]
- Ozarslan A., Large-scale hydrogen energy storage in salt caverns, International Journal of Hydrogen Energy, 2012, 37, pp. 14265–14277. [CrossRef]
- Stolzenburg, K.; Hamelmann, R.; Wietschel, M.; Genoese, F.; Michaelis, J.; Lehmann, J.; Miege, A.; Krause, S.; Donadei, S.; Crotogino, F.; Acht, A.; Sponholz, C. & Horvath, P.-L. (2014). Integration von Wind-Wasserstoff-Systemen in das Energiesystem. Abschlussbericht. Planungsgruppe Energie und Technik (PLANET); Fachhochschule Lübeck (FH Lübeck); Fraunhofer Institut für System- und Innovationstechnik (ISI); Fachhochschule Stralsund (FH Stralsund); Underground Technologies (KBB). Available online: https://www.planet-energie.de/de/media/Abschlussbericht_Integration_von_Wind_Wasserstoff_Systemen_in_das_Energiesystem.pdf (accesed on 29.10.2024).
- Kupfer D. H.; Lock B. E.; Schank P. R., Anomalous zones within the salt at Weeks Island, Louisiana, Gulf Coast Association of Geological Societies Transactions, 1998, 48, pp. 181–192.
- Exploatarea zacamintelor de sare din Romania (II), (Exploitation of salt deposits in Romania (II)), Univers Ingineresc nr. 4/2015. Available online: https://www.agir.ro/univers-ingineresc/numar-4-2015/exploatarea-zacamintelor-de-sare-din-romania-ii_4763.html (accesed on 29.10.2024).
- Stoica C.; Gherasie I., Sarea şi sărurile de potasiu şi magneziu din România (Halite and potassium and magnesium salts from Romania), Editura tehnică, 1981, Bucureşti, Romania.
- Raport privind starea mediului marin şi costier în anul 2022 (Report on the state of the marine and coastal environment in 2022), Institutul National de Cercetare-Dezvoltare Marina „Grigore Antipa” (National Institute for Marine Research and Development “Grigore Antipa”). Available online: https://www.anpm.ro/documents/18093/81141723/2022+Capitolul+II.3+Mediul+marin+si+costier.pdf/08610e93-db2a-4c05-887e-e0980b2f7b35 (accesed on 29.10.2024).
- Furst S. L.; Doucet S.; Vernant P.; Champollion C.; Carme J. L.; Monitoring surface deformation of deep salt mining in Vauvert (France), combining InSAR and leveling data for multi-source inversion, Solid Earth, 2021, 12, pp. 15–34. [CrossRef]
- Popescu P., Analiza stabilității golurilor și riscurile miniere din exploatările de sare în soluție din românia, în vederea utilizării acestora ca depozite subterane (Analysis of void stability and mining risks in solution salt mines in Romania, with a view to their use as underground storage), PhD. Thesis, University of Petroşani, Faculty of Mines, Petroşani, Romania, 2023.
- Paul C., Exploatarea sării prin sonde (Exploitation of salt through wells), Editura Asociaţiei “S.I.P.G.”, 2006, Bucureşti, Romania.
- Allsop C.; Yfantis G.; Passaris E.; Edlmann K., Utilizing publicly available datasets for identifying offshore salt strata and developing salt caverns for hydrogen storage, Geological Society, London, Special Publications, 2023, 528, pp. 139 – 169. [CrossRef]
- Smith N. J. P.; Evans D. J.; Andrew I., The geology of gas storage in offshore salt caverns. Marine, Coastal and Hydrocarbons Programme, British Geological Survey, 1–22. Confidential Report to the Department of Trade and Industry No. GC05/11, 2005.
- Li J.; Tang Y.; Shi X.; Xu W.; Yang C., Modeling the construction of energy storage salt caverns in bedded salt. Applied Energy, 2019, 255, 113866. [CrossRef]
- Solution Mining, Saltwork Consultants Pty Ltd. Available online: https://www.saltworkconsultants.com/solution-mining/ (accessed on 08.01.2025).
- Minkley W.; Knauth M.; Fabig T.; Farag N., Stability and integrity of salt caverns under consideration of hydro-mechanical loading, IfG Institut für Gebirgsmechanik GmbH, 2016. Available online: https://www.researchgate.net/publication/283871641_Stability_and_integrity_of_salt_caverns_under_consideration_of_hydro-mechanical_loading (accessed on 29.10.2024).
- Li S.; Urai J., Numerical modelling of gravitational sinking of anhydrite stringers in salt (at rest). Bollettino di Geofisica Teorica e Applicata, 2016, 57, pp. 233–246. [CrossRef]
- Zijp M. H. A. A.; Huijgen M. A.; Wilpshaar M.; Bouroullec R. J.; ter Heege H., Stringers in Salt as a Drilling Risk. Report no. TNO2018 R10975 by Nederlandse Organisatie voor Toegepast Natuurwetenschappelijk Onderzoek for Dutch State Supervision of Mines, 2018.
- Urai J. L.; Schmatz J.; Kalver J., Over-pressured Salt Solution Mining Caverns and Leakage Mechanisms. Report, Project KEM-17, Phase 1: Micro-scale processes, 2019. Available online: https://kemprogramma.nl/file/download/a22c0dda-017d-4ecf-9f72-a911d9c51b5c/kem-17-kem-deepnl-colloquium-overpressured-caverns-presentatie-sodm-7-oktober-2021.pdf (accessed on 29.10.2024).
- Li W.; Miao X.; Yang C., Failure analysis for gas storage salt cavern by thermo-mechanical modelling considering rock salt creep, Journal of Energy Storage, 2020, 32, 102004. [CrossRef]
- Taheri S. R.; Pak A.; Shad S.; Mehrgini B.; Razifar M., Investigation of rock salt layer creep and its effects on casing collapse, International Journal of Mining Science and Technology, 2020, 30, pp. 357–365. [CrossRef]
- Bruno M. S., Geomechanical Analysis and Design Considerations for Thin-bedded Salt Caverns. Final report no. DE-FC26-03NT41813, GTI Contract 8701. Terralog Technologies Inc., Arcadia, CA, 2005.
- Cala M.; Cyran K.; Kowalski M.; Wilkosz P., Influence of the anhydrite interbeds on a stability of the storage caverns in the Mechelinki salt deposit (Northern Poland). Archives of Mining Sciences, 2018, 63, pp. 1007–1025. [CrossRef]
- Hamilton W. N., Salt in east-central Alberta. Research Council of Alberta, RCA/AGS Bulletin, 1971, 29, 65.
- Richter-Bernburg G., Salt tectonics, interior structures of salt bodies. Bulletin des Centres de Recherches Exploration-Production Elf-Aquitaine, 1980, 4, pp. 373–393,.
- Li J.; Tang Y.; Shi X.; Xu W.; Yang C., Modeling the construction of energy storage salt caverns in bedded salt, Applied Energy, 2019, 255, 113866. [CrossRef]
- Looff K.; Duffield J.; Looff K., Edge of salt definition for salt domes and other deformed salt structures – geologic and geophysical considerations, Solution Mining Research Institute Technical Conference, 2003, Houston, TX, United States of America.
- F. Chen, Z. Ma, H. Nasrabadi, B. Chen, M. Z. Saad Mehana, J. Van Wijk, Capacity assessment and cost analysis of geologic storage of hydrogen: A case study in Intermountain-West Region USA, IJHE 48 (2023) 9008-9022. [CrossRef]
- J. Zhang, Yan Li, Y. Rao, Yang Li, T. He, P. Linga, X. Wang, Q. Chen, Z. Yin, Probing the pathway of H2-THF and H2-DIOX sII hydrates formation: Implication on hydrate-based H2 storage, Applied Energy 376 (2024) 124289. [CrossRef]
- T. Shibata, H. Yamachi, R. Ohmura, Y. H. Mori, Engineering investigation of hydrogen storage in the form of a clathrate hydrate: Conceptual designs of underground hydrate-storage silos, IJHE, 37, 9, 2012, pp. 7612-7623. [CrossRef]
- D. Rutherford, X. Mao, B. Comer, Potential CO2 reductions under the Energy Efficiency Existing Ship Index, ICCT WORKING PAPER 2020-27, 2020. Available online: https://www.researchgate.net/publication/345950880_Potential_CO_2_reductions_under_the_Energy_Efficiency_Existing_Ship_Index. (accessed on 13.02.2025).
- Romanian Energy Strategy 2016-2030, With an Outlook to 2050. Executive Summary, Ministry of Energy. Available online: https://energie.gov.ro/wp-content/uploads/2016/11/Romanian-Energy-Strategy-2016-2030-executive-summary3-1.pdf (accessed on 29.10.2024).
- Dogar A., Producători de energie eoliană în România. Lista completă a centralelor în 2024 (Wind energy producers in Romania. Complete list of power plants in 2024), GreatNews, April 4, 2024. Available online: https://onoff.greatnews.ro/producatori-de-energie-eoliana-in-romania-lista-completa-a-centralelor-in-2024/ (accessed on 08.01.2025).
- Nicut M., Premieră: România a depășit pragul de 1.000 MW producție instantanee de energie solară pentru prima dată în istorie (Premiere: Romania has exceeded the threshold of 1,000 MW of instantaneous solar energy production for the first time in history), ECONOMICA.net, March 4, 2024. Available online: https://www.economica.net/premiera-romania-a-depasit-pragul-de-1-000-mw-productie-instantanee-de-energie-solara-pentru-prima-data-in-istorie_729357.html (accessed on 08.01.2025).
- EWE, Siemens Energy to build 280 MW green hydrogen electrolysis plant, Reuters, July 25, 2024. Available online: https://www.reuters.com/sustainability/climate-energy/ewe-siemens-energy-build-280-mw-green-hydrogen-electrolysis-plant-2024-07-25/ (accessed on 08.01.2025).
- Vlăducă I.; Nechifor C. V.; Vasile M. L.; Suciu C. P.; Badea P. G.; Stănescu T.; Nicoară R. E.; Prisăcariu E. G.; Stanciuc R. M.; Popescu S.; Dinescu S.; Obreja A. M., Hydrogen Storage in Offshore Salt Caverns for Reducing Ships Carbon Dioxide Footprint, Technium: Romanian Journal of Applied Sciences and Technology (ISSN: 2668-778X), 2022, 4, 9. [CrossRef]
- Tetrahydrofuran. National Library of Medicine. Available online: https://pubchem.ncbi.nlm.nih.gov/compound/Tetrahydrofuran. (accessed on 13.02.2025).
- P.A. O’Neill, Industrial compressors. Theory and equipment. Butterworth-Heinemann Ltd, Linacre House, Oxford, Great Britain, 1993. ISBN 0-7506-0870-6.
Figure 1.
The continental shelf of the Western Black Sea Basin; (a) Bathimetry map; (b) Romanian-bulgarian team research work area with the main faults depicted; (c) The wells that were dug, that share the research in three subunits, North Dobrogea, Central Dobrogea and Southern Dobrogea; (d) Evaluated an area of approx. 33,160 km2 from a seismological, gravity and magnetic point of view.
Figure 2.
The exploratory wells and gravity anomalies in the Moesic Platform - Central Dobrogea. Details of Figure 1, (d).
Figure 2.
The exploratory wells and gravity anomalies in the Moesic Platform - Central Dobrogea. Details of Figure 1, (d).
Figure 3.
The major structural units that make up the southeastern part of Romania's territory and subunits of the North-Dobrogean Orogen, Babadag Basin, Central Dobogea and South Dobrogea.
Figure 3.
The major structural units that make up the southeastern part of Romania's territory and subunits of the North-Dobrogean Orogen, Babadag Basin, Central Dobogea and South Dobrogea.
Figure 4.
The lithostratigraphic column of well 19 Vadu, Constanta County Romania.
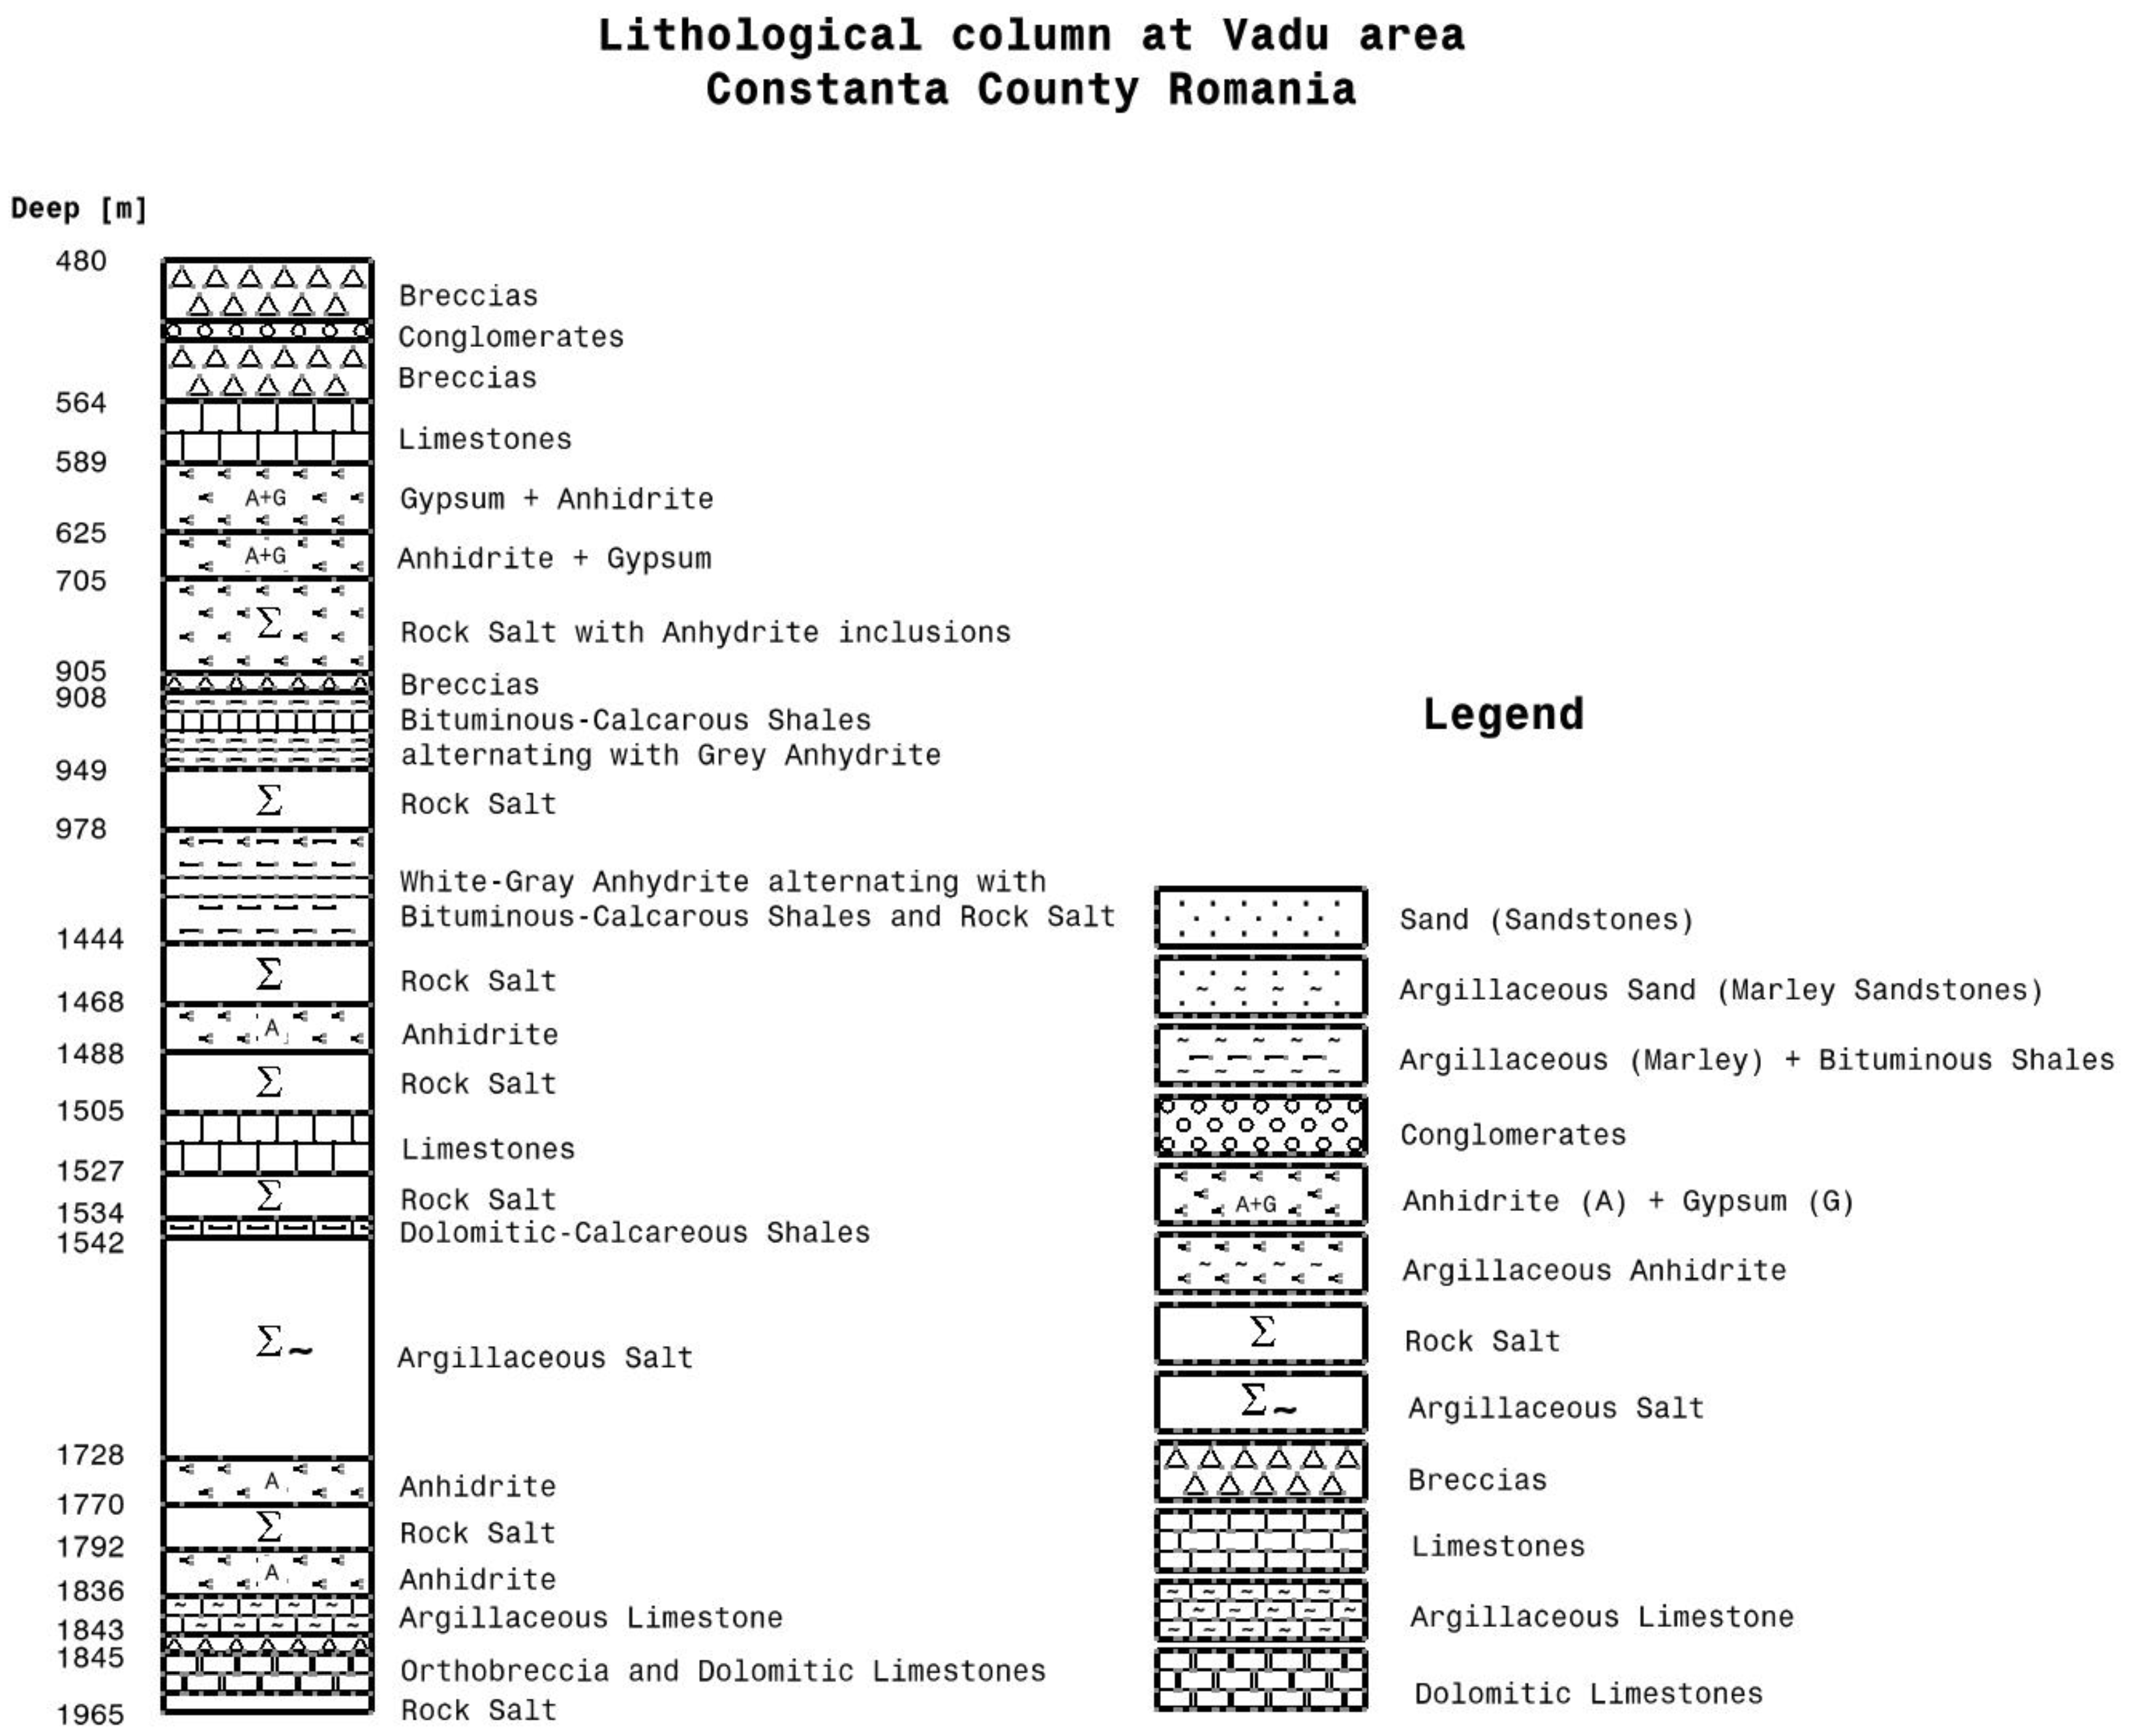
Figure 5.
Simplified schematic diagram for a cavern design: (a) Usual capsule shape, for geotechnical safety, and (b) Safety depth for the cavern vs. Geostatic + Hydrostatic pressure.
Figure 5.
Simplified schematic diagram for a cavern design: (a) Usual capsule shape, for geotechnical safety, and (b) Safety depth for the cavern vs. Geostatic + Hydrostatic pressure.
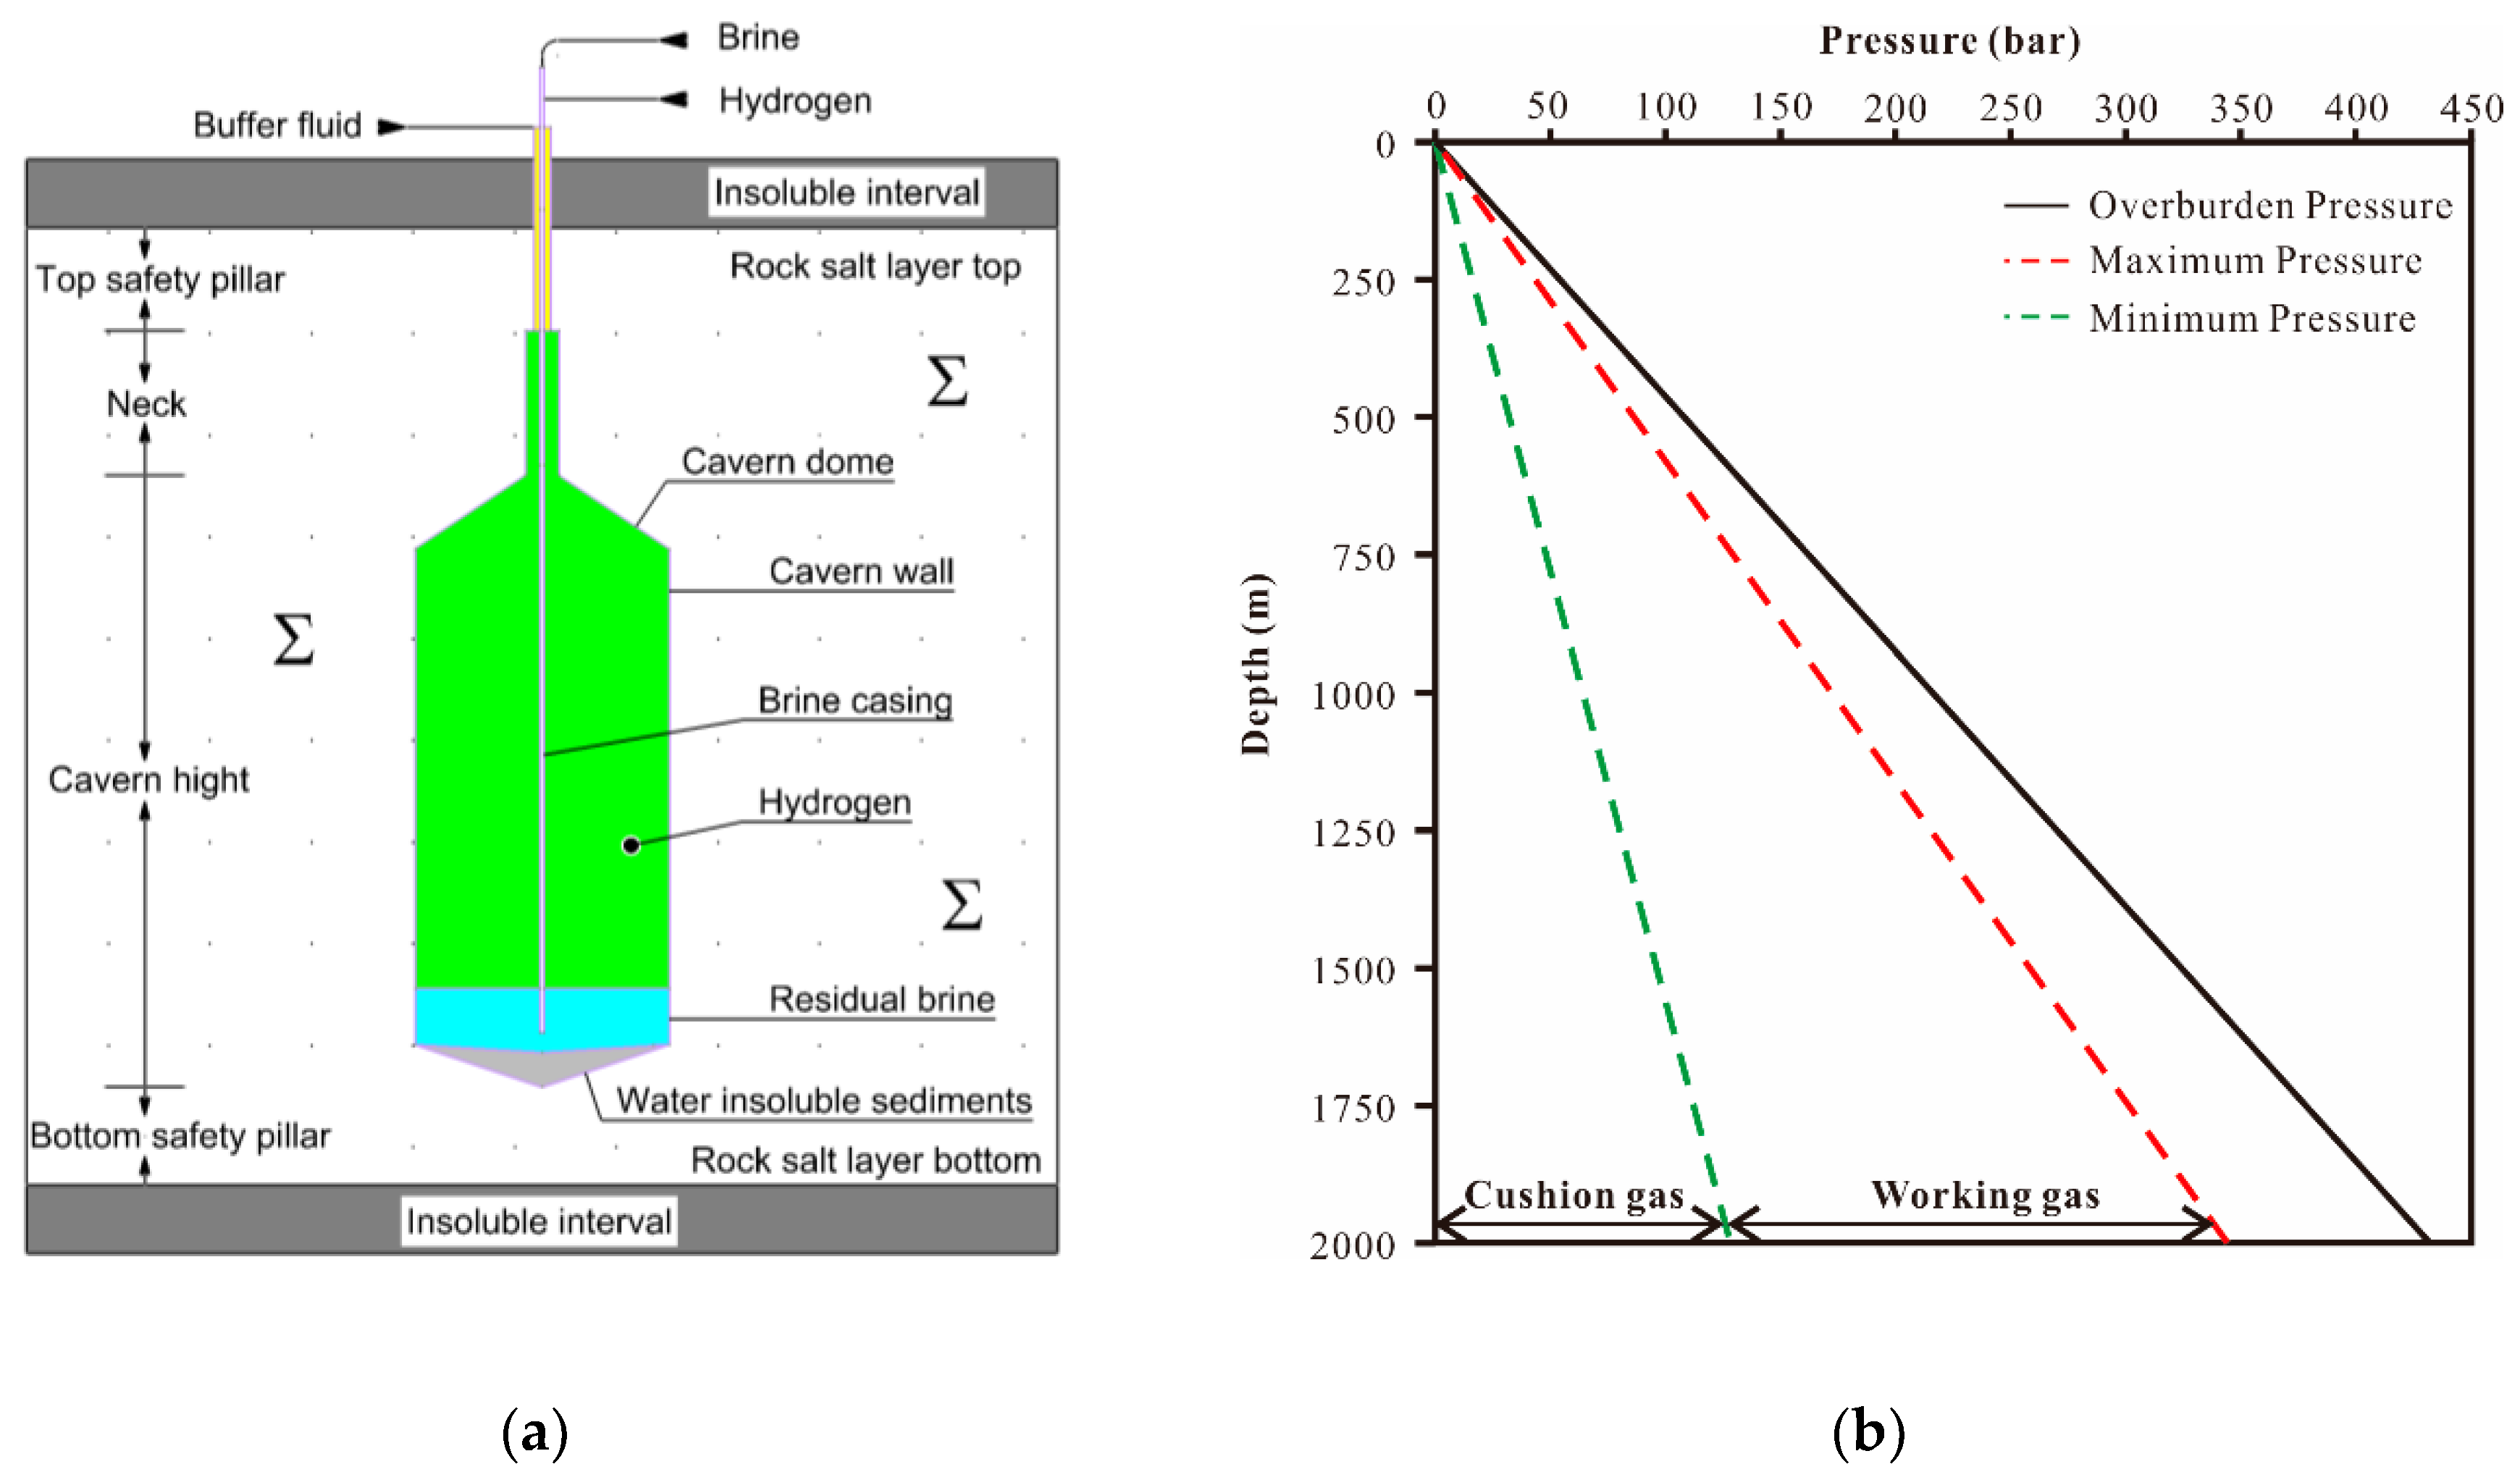
Figure 6.
Simplified schematic diagram for a cavern design; (a) Theoretical extraction of brine; (b) Simplified cavern, where:.
Figure 6.
Simplified schematic diagram for a cavern design; (a) Theoretical extraction of brine; (b) Simplified cavern, where:.
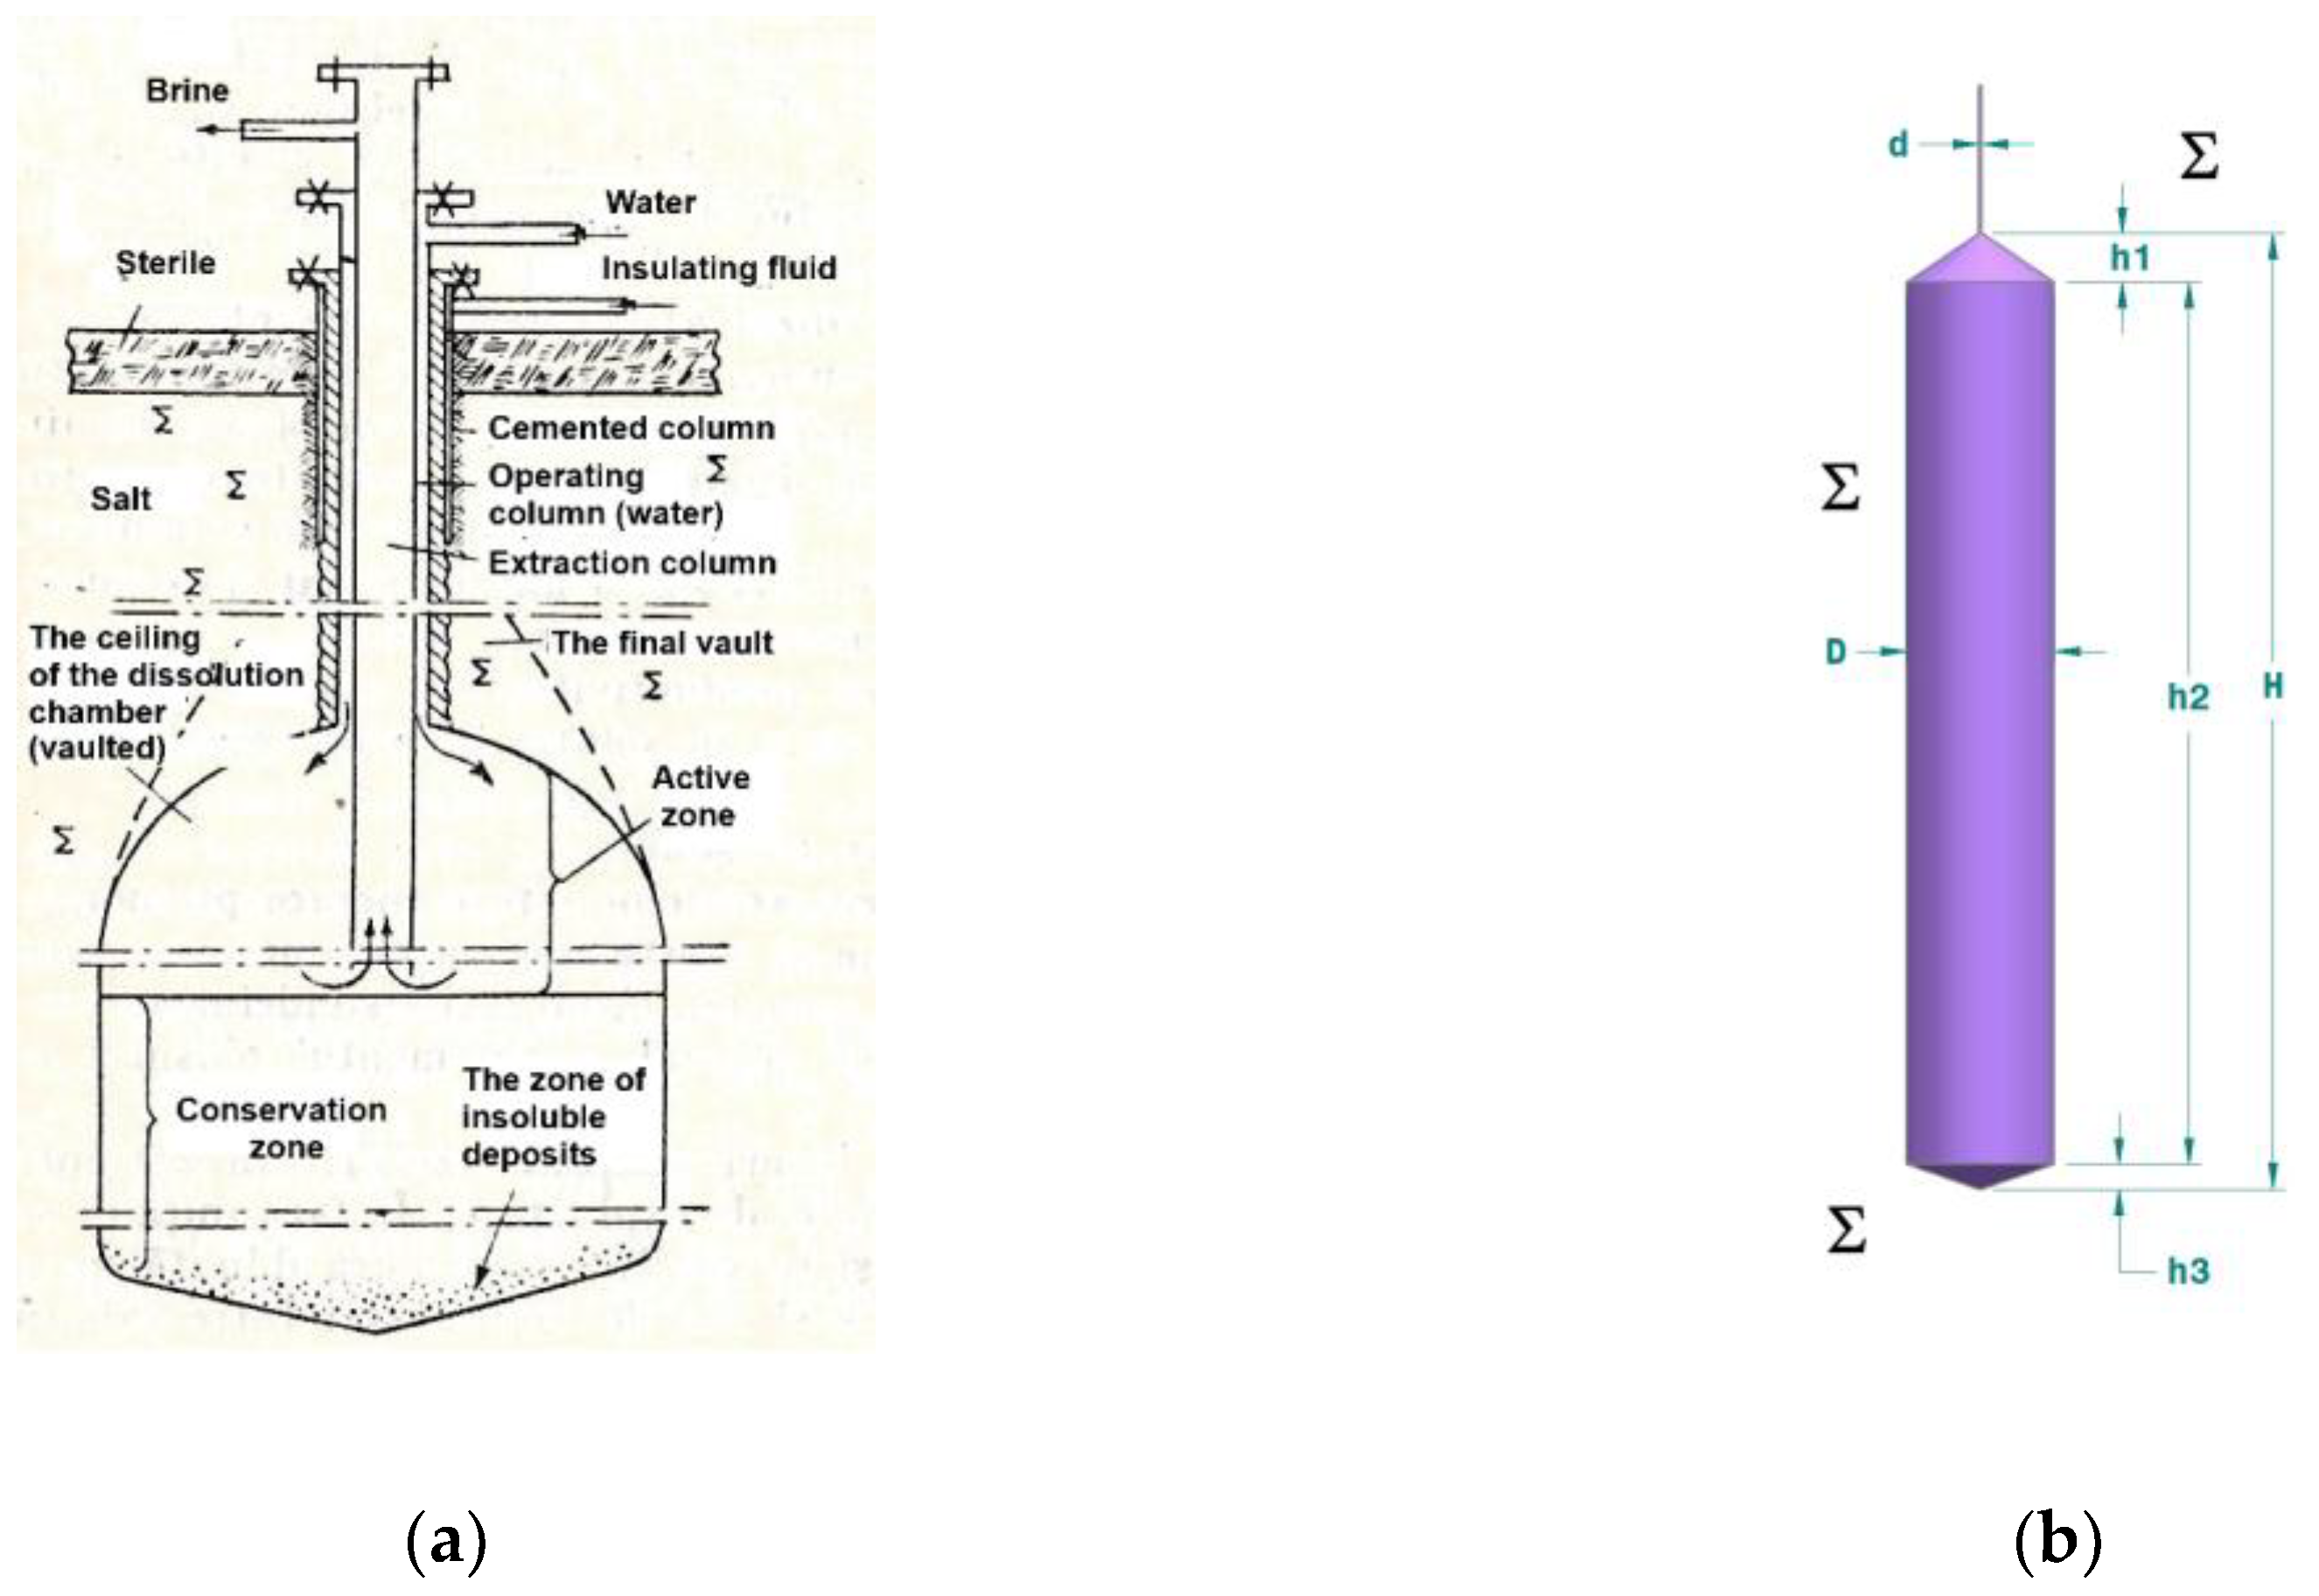
Figure 7.
Horizontal surface distribution of temperature and salinity in the coastal / exclusive economic zone during June 2022; (a) Temperature [°C] @ Depth [m]; (b) Salinity [PSU] @ Depth [m].
Figure 7.
Horizontal surface distribution of temperature and salinity in the coastal / exclusive economic zone during June 2022; (a) Temperature [°C] @ Depth [m]; (b) Salinity [PSU] @ Depth [m].
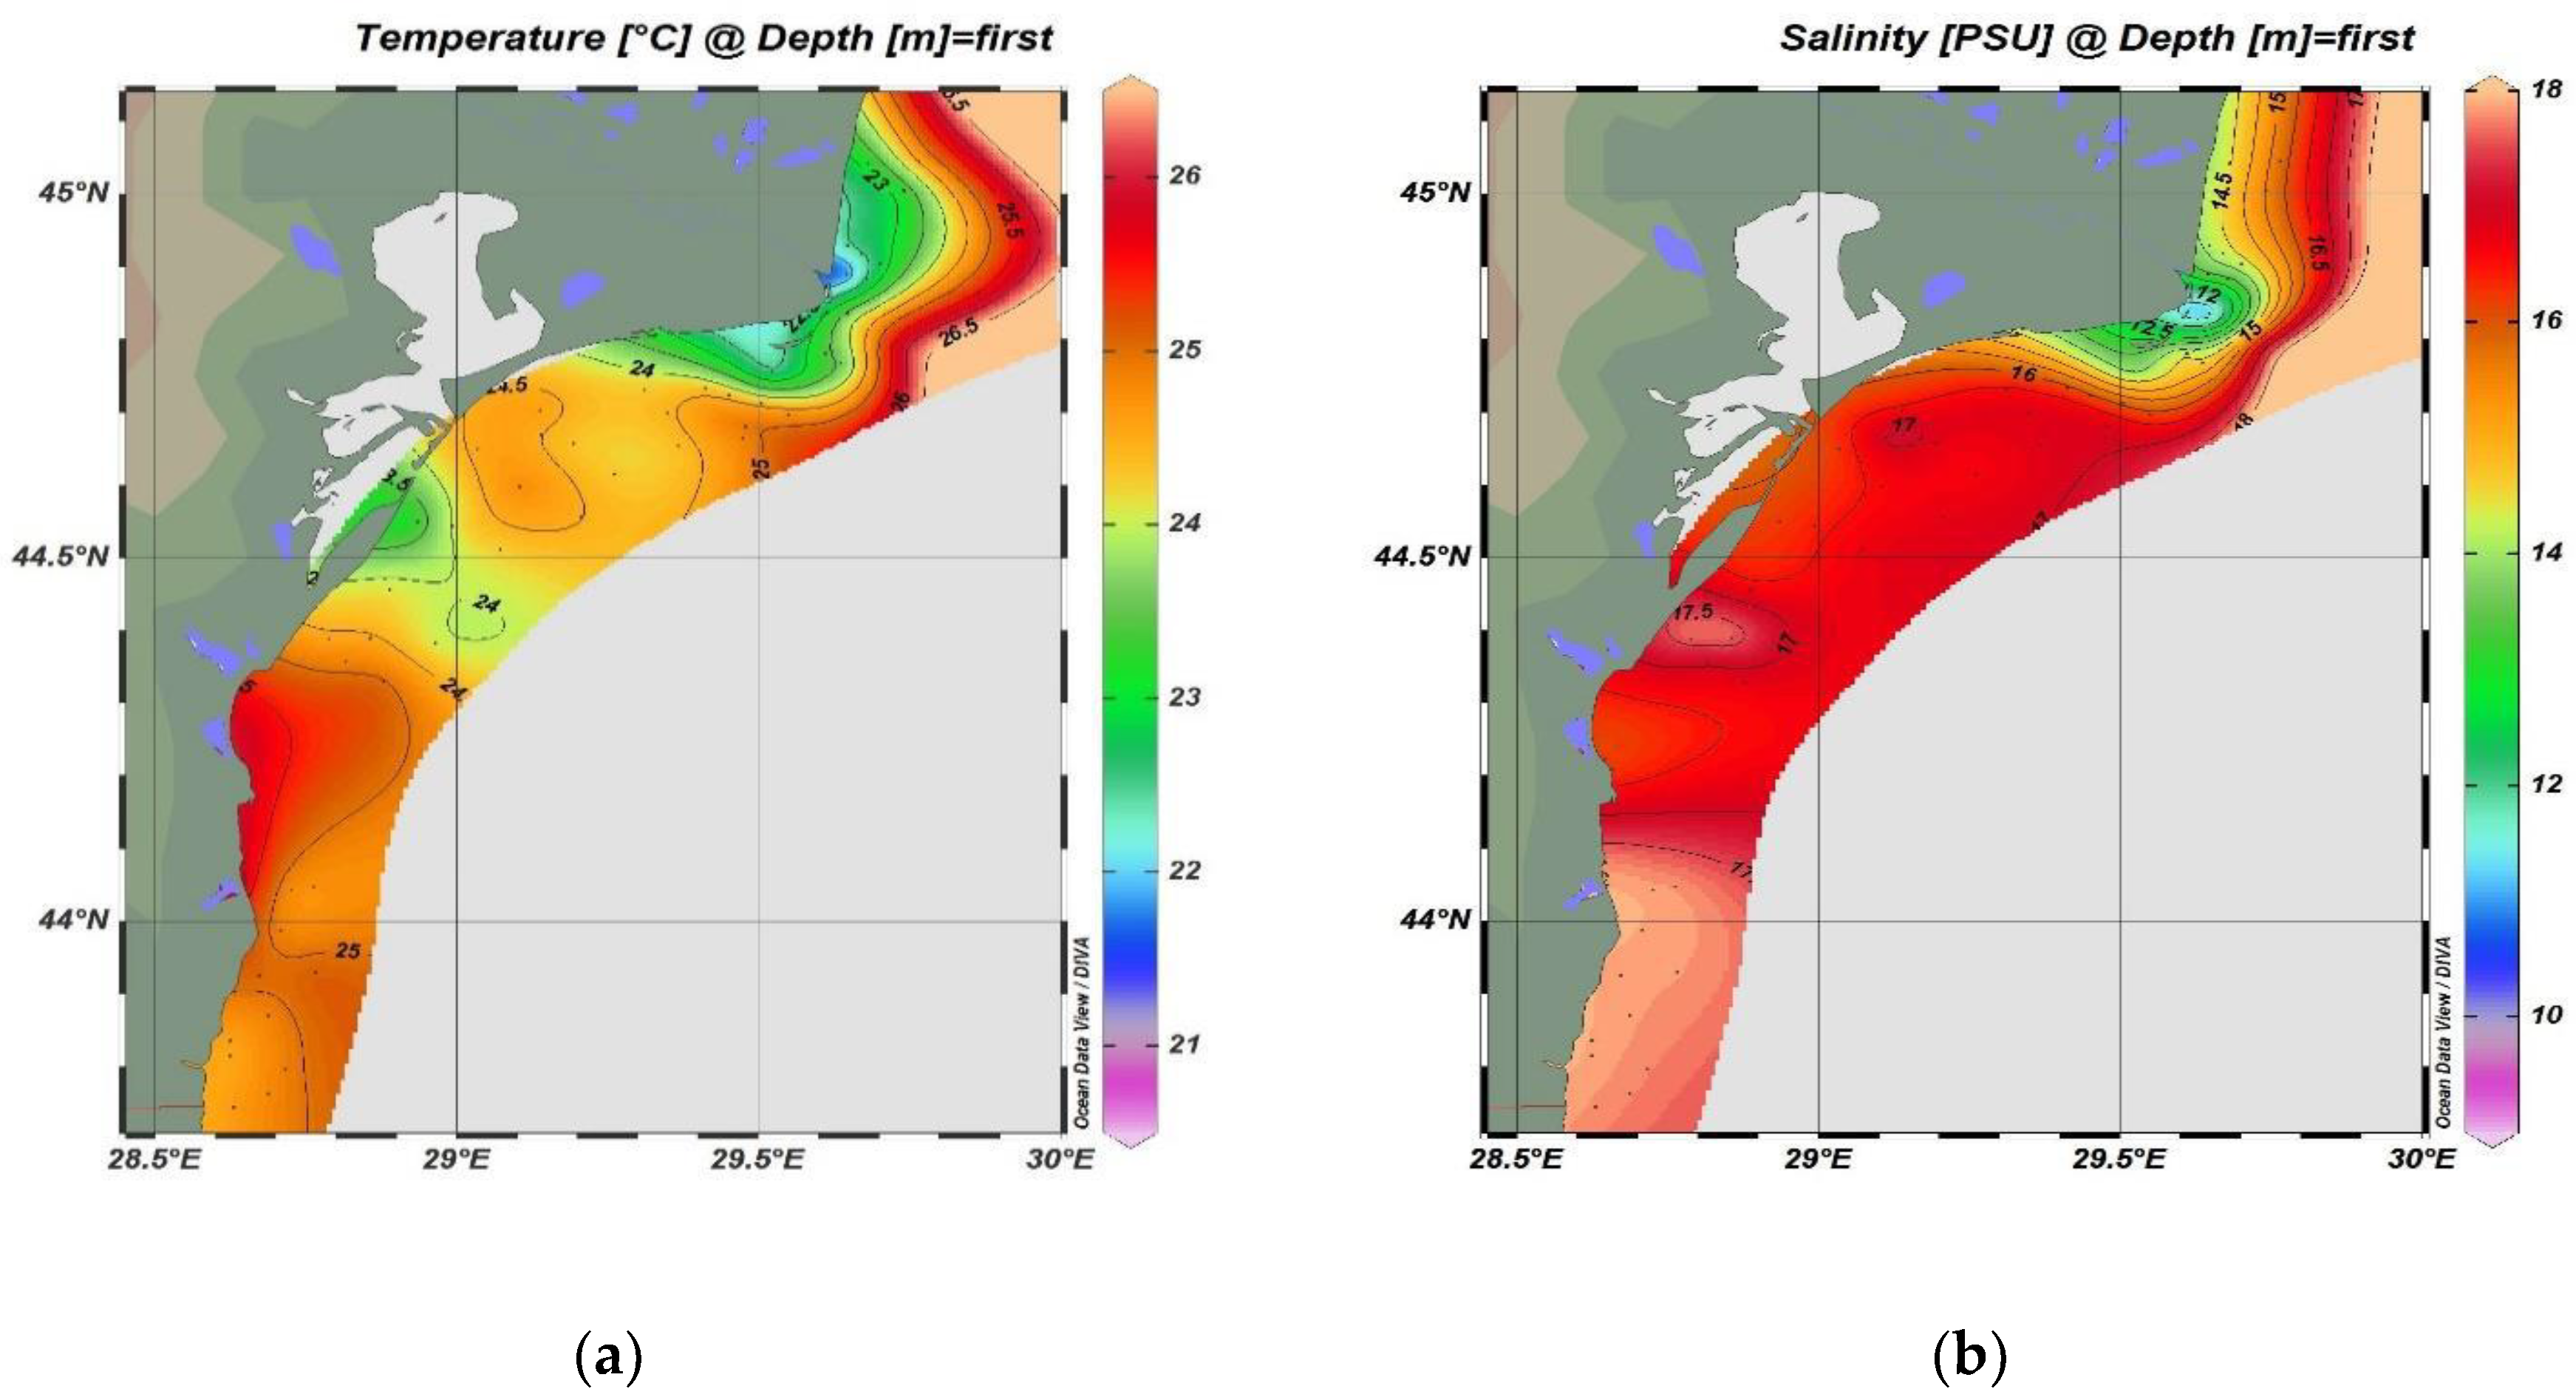
Figure 8.
Simplification of domain of salt caverns. (a) individual 40m diameter cavern view; (b) top section view for 9 of 40 m diameter caverns.
Figure 8.
Simplification of domain of salt caverns. (a) individual 40m diameter cavern view; (b) top section view for 9 of 40 m diameter caverns.
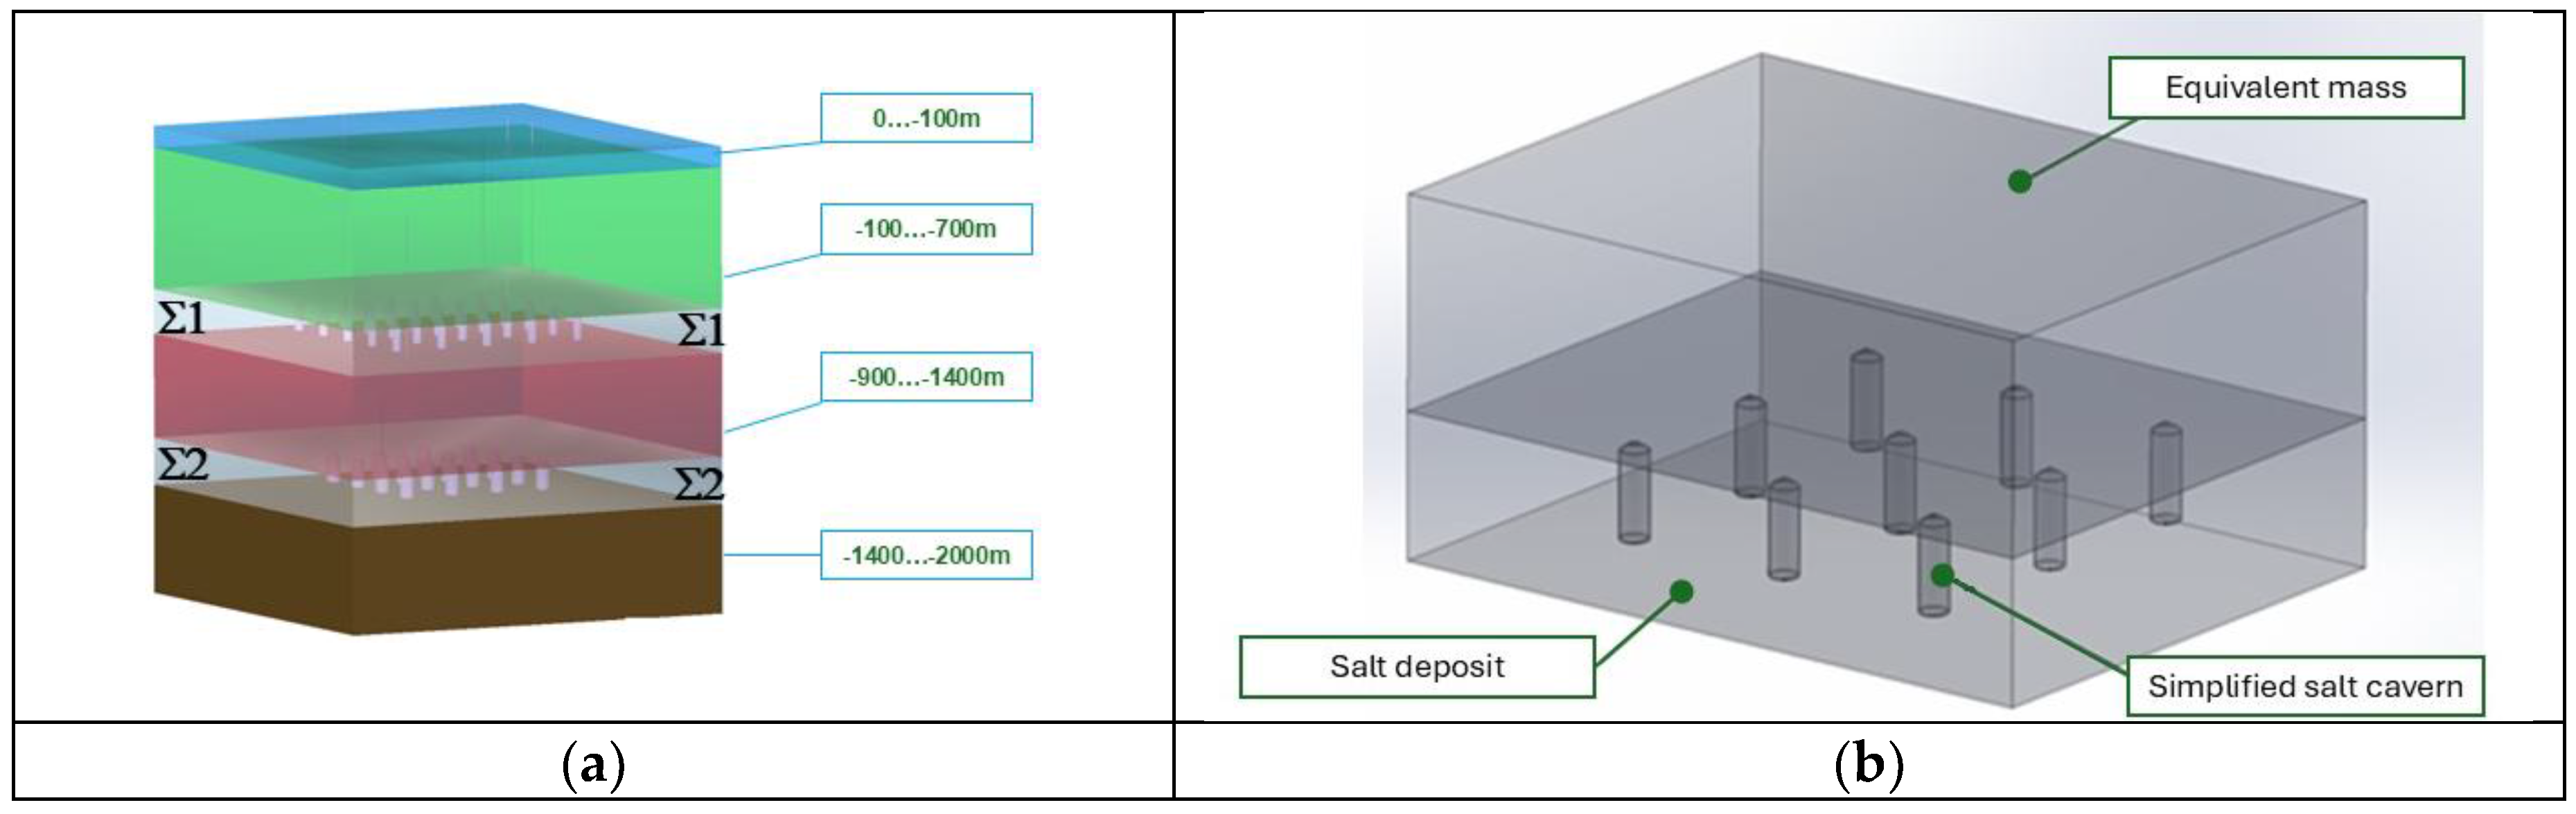
Figure 9.
Mechanical stress of salt caverns at 120 bar internal pressure and 40m diameter; (a) individual cavern view; (b) top section view for 9 of 40 m diameter caverns.
Figure 9.
Mechanical stress of salt caverns at 120 bar internal pressure and 40m diameter; (a) individual cavern view; (b) top section view for 9 of 40 m diameter caverns.
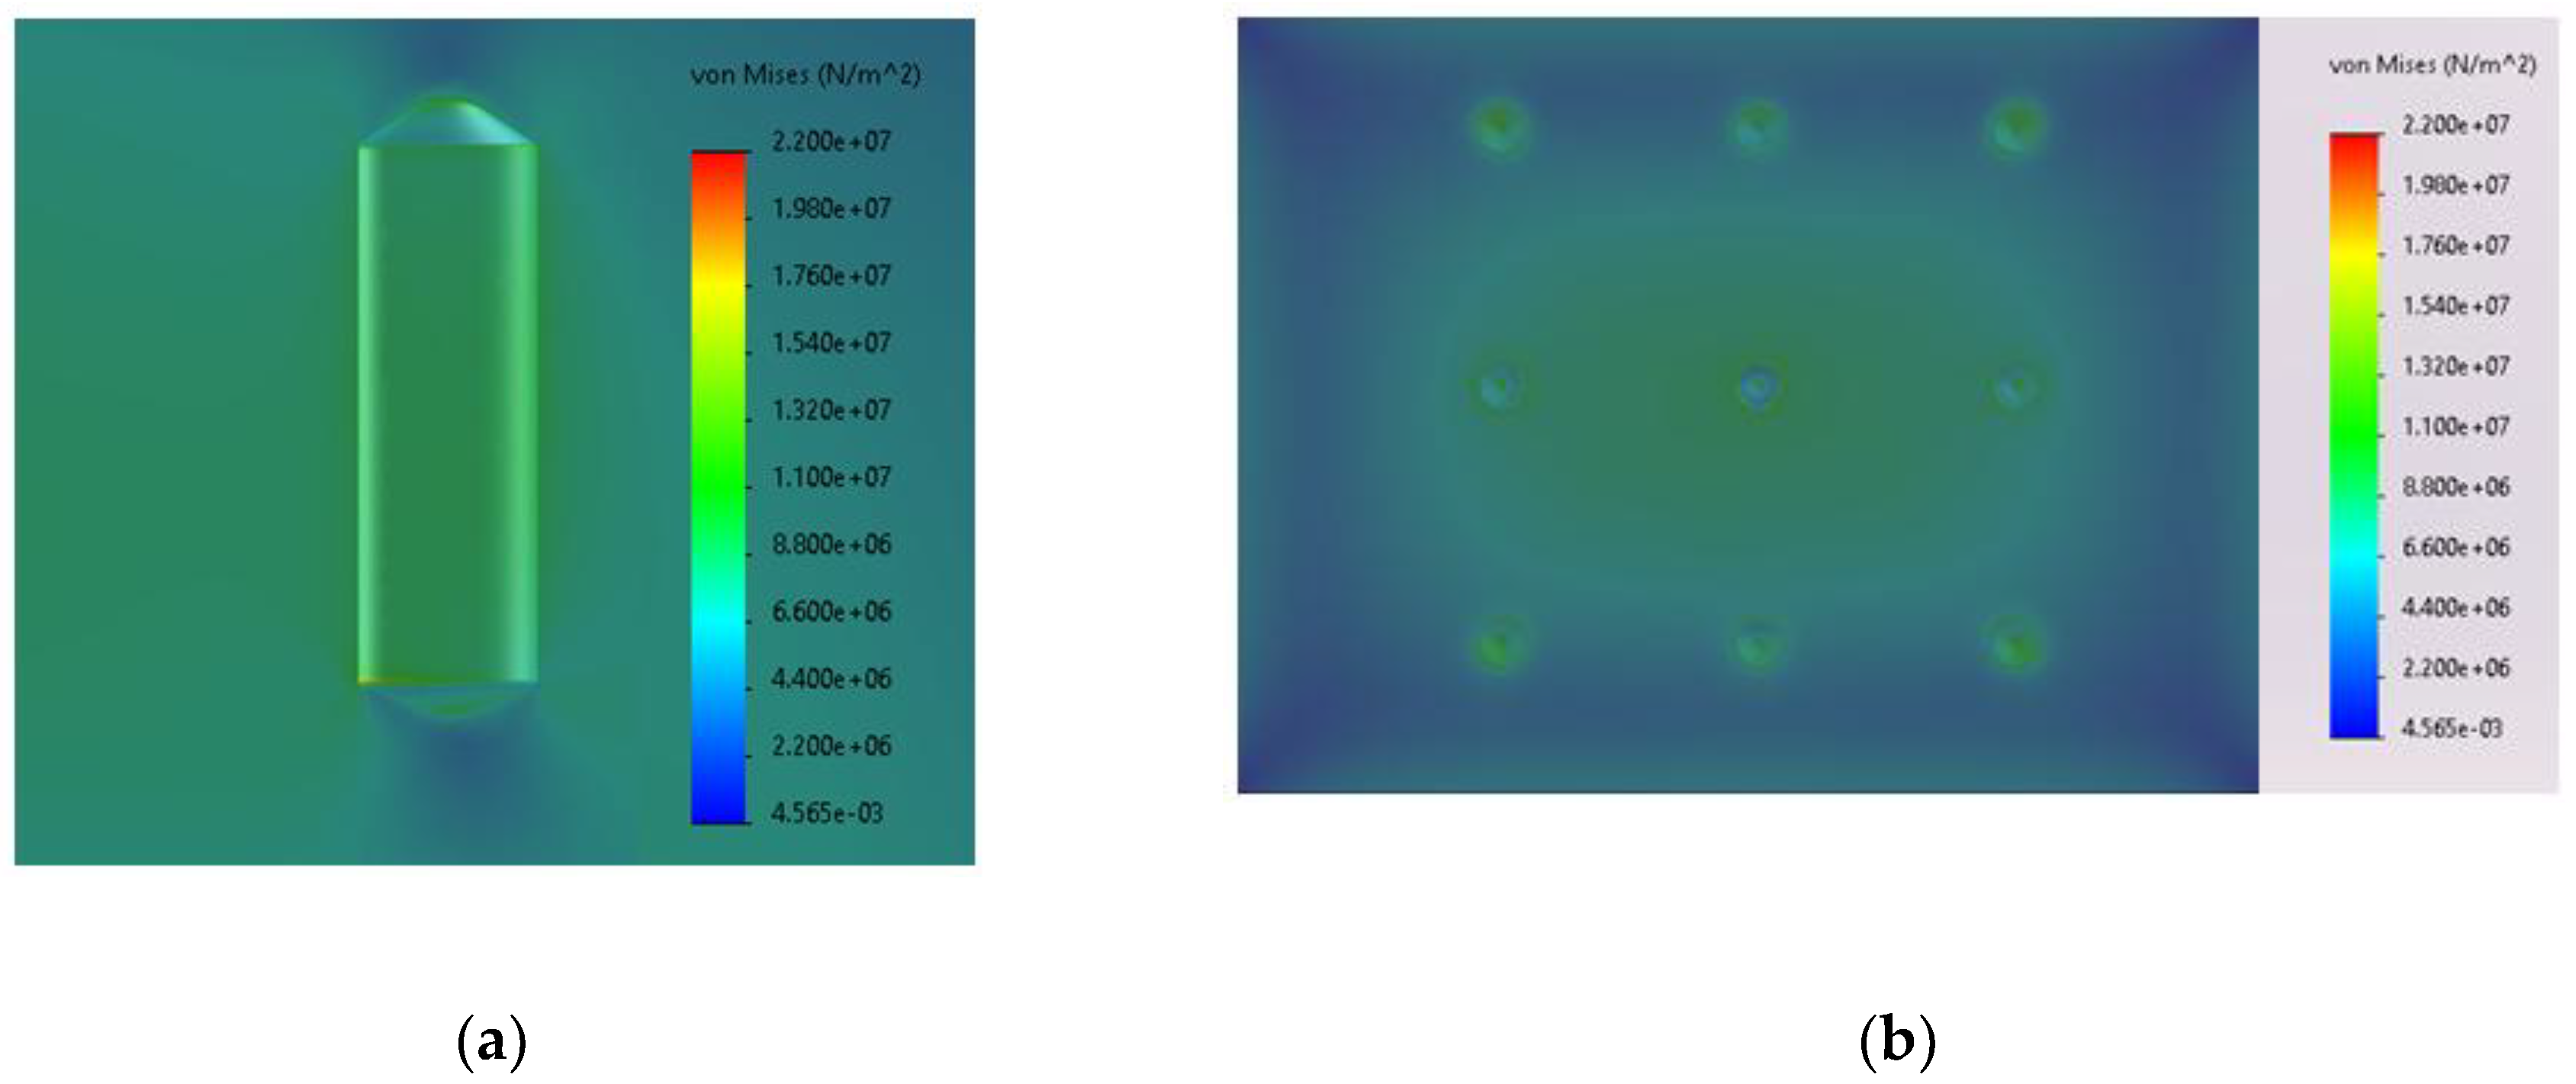
Figure 10.
Tension at dilatation threshold for 120 bar internal pressure and 40m diameter.
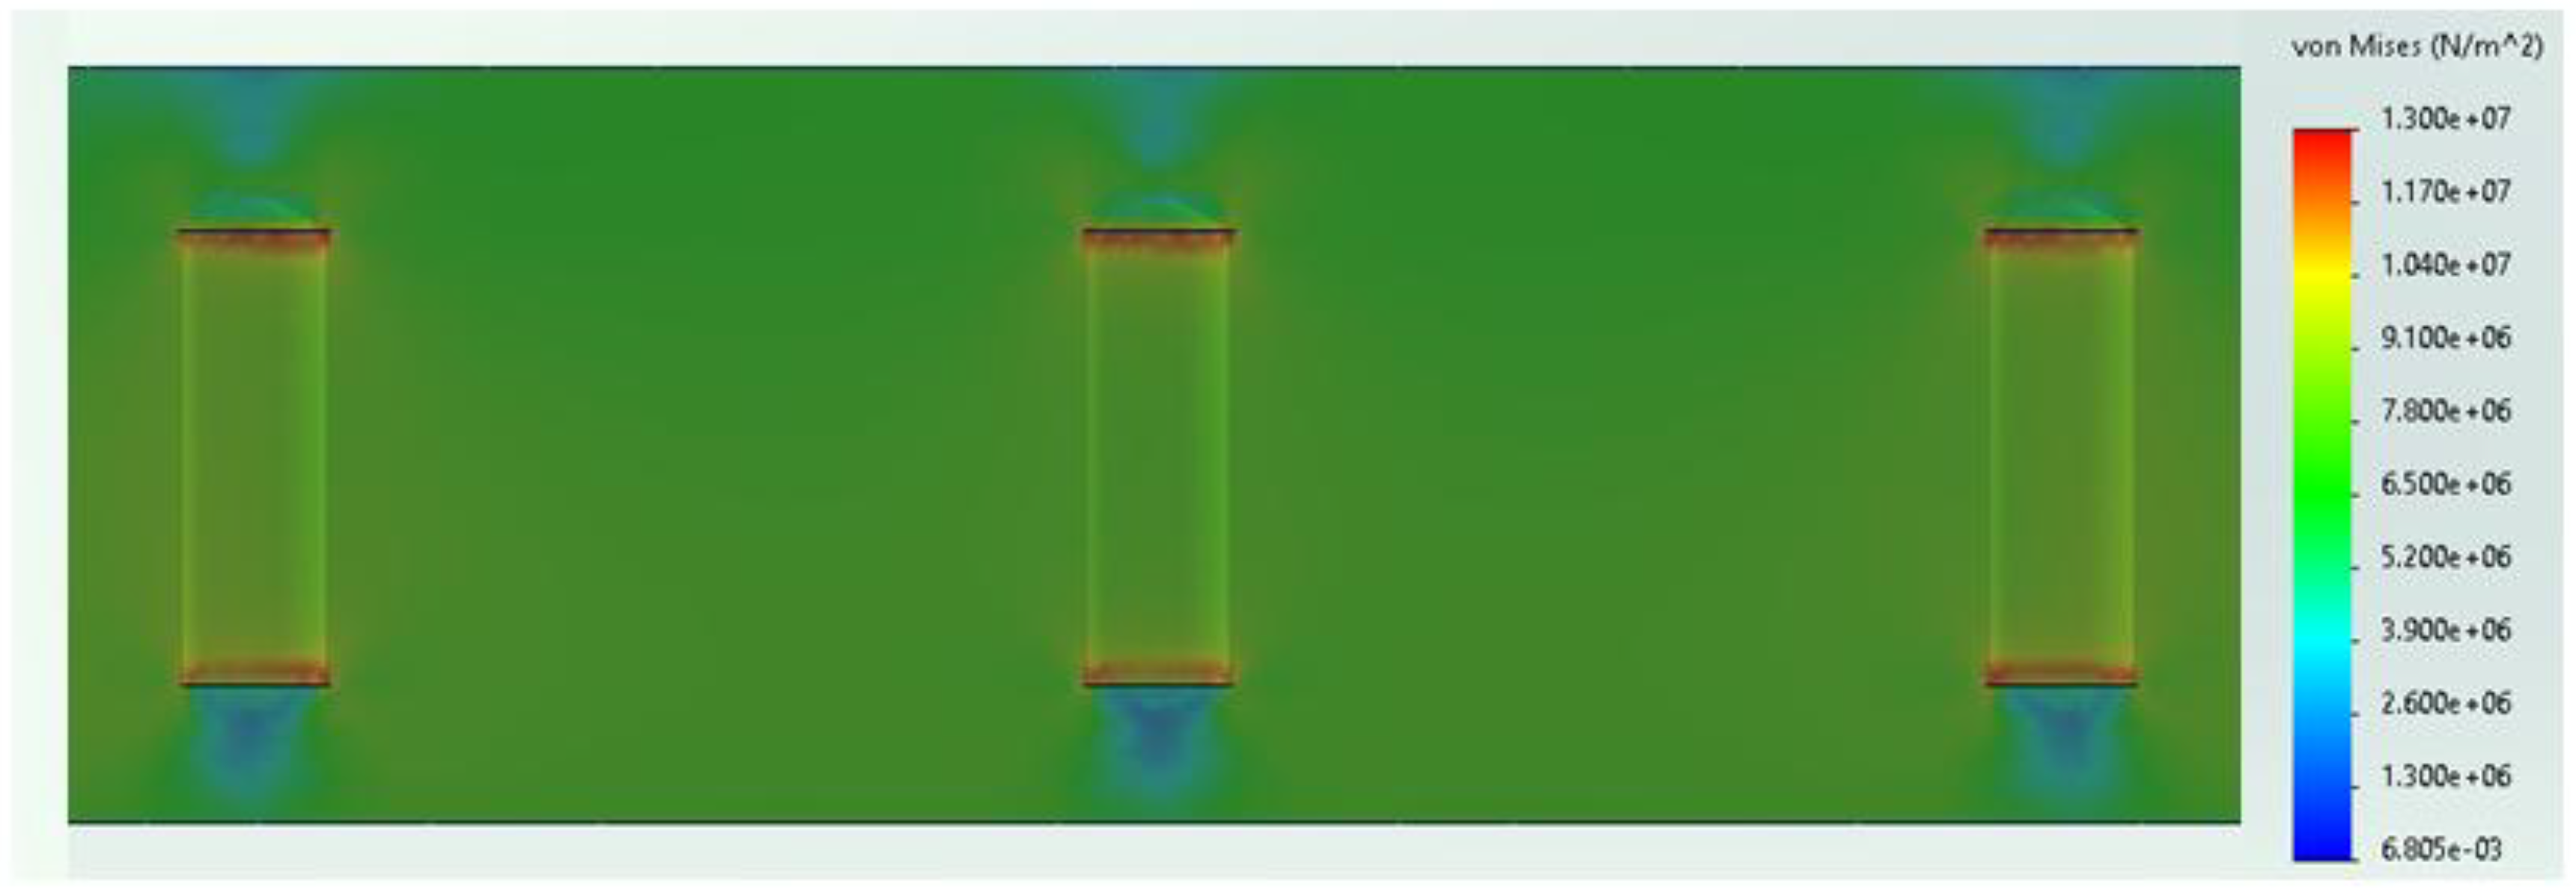
Figure 11.
Mechanical stress of salt caverns at 30 bar internal pressure and 40m diameter. (a) whole cavern view; (b) Detail at the top cavern view.
Figure 11.
Mechanical stress of salt caverns at 30 bar internal pressure and 40m diameter. (a) whole cavern view; (b) Detail at the top cavern view.
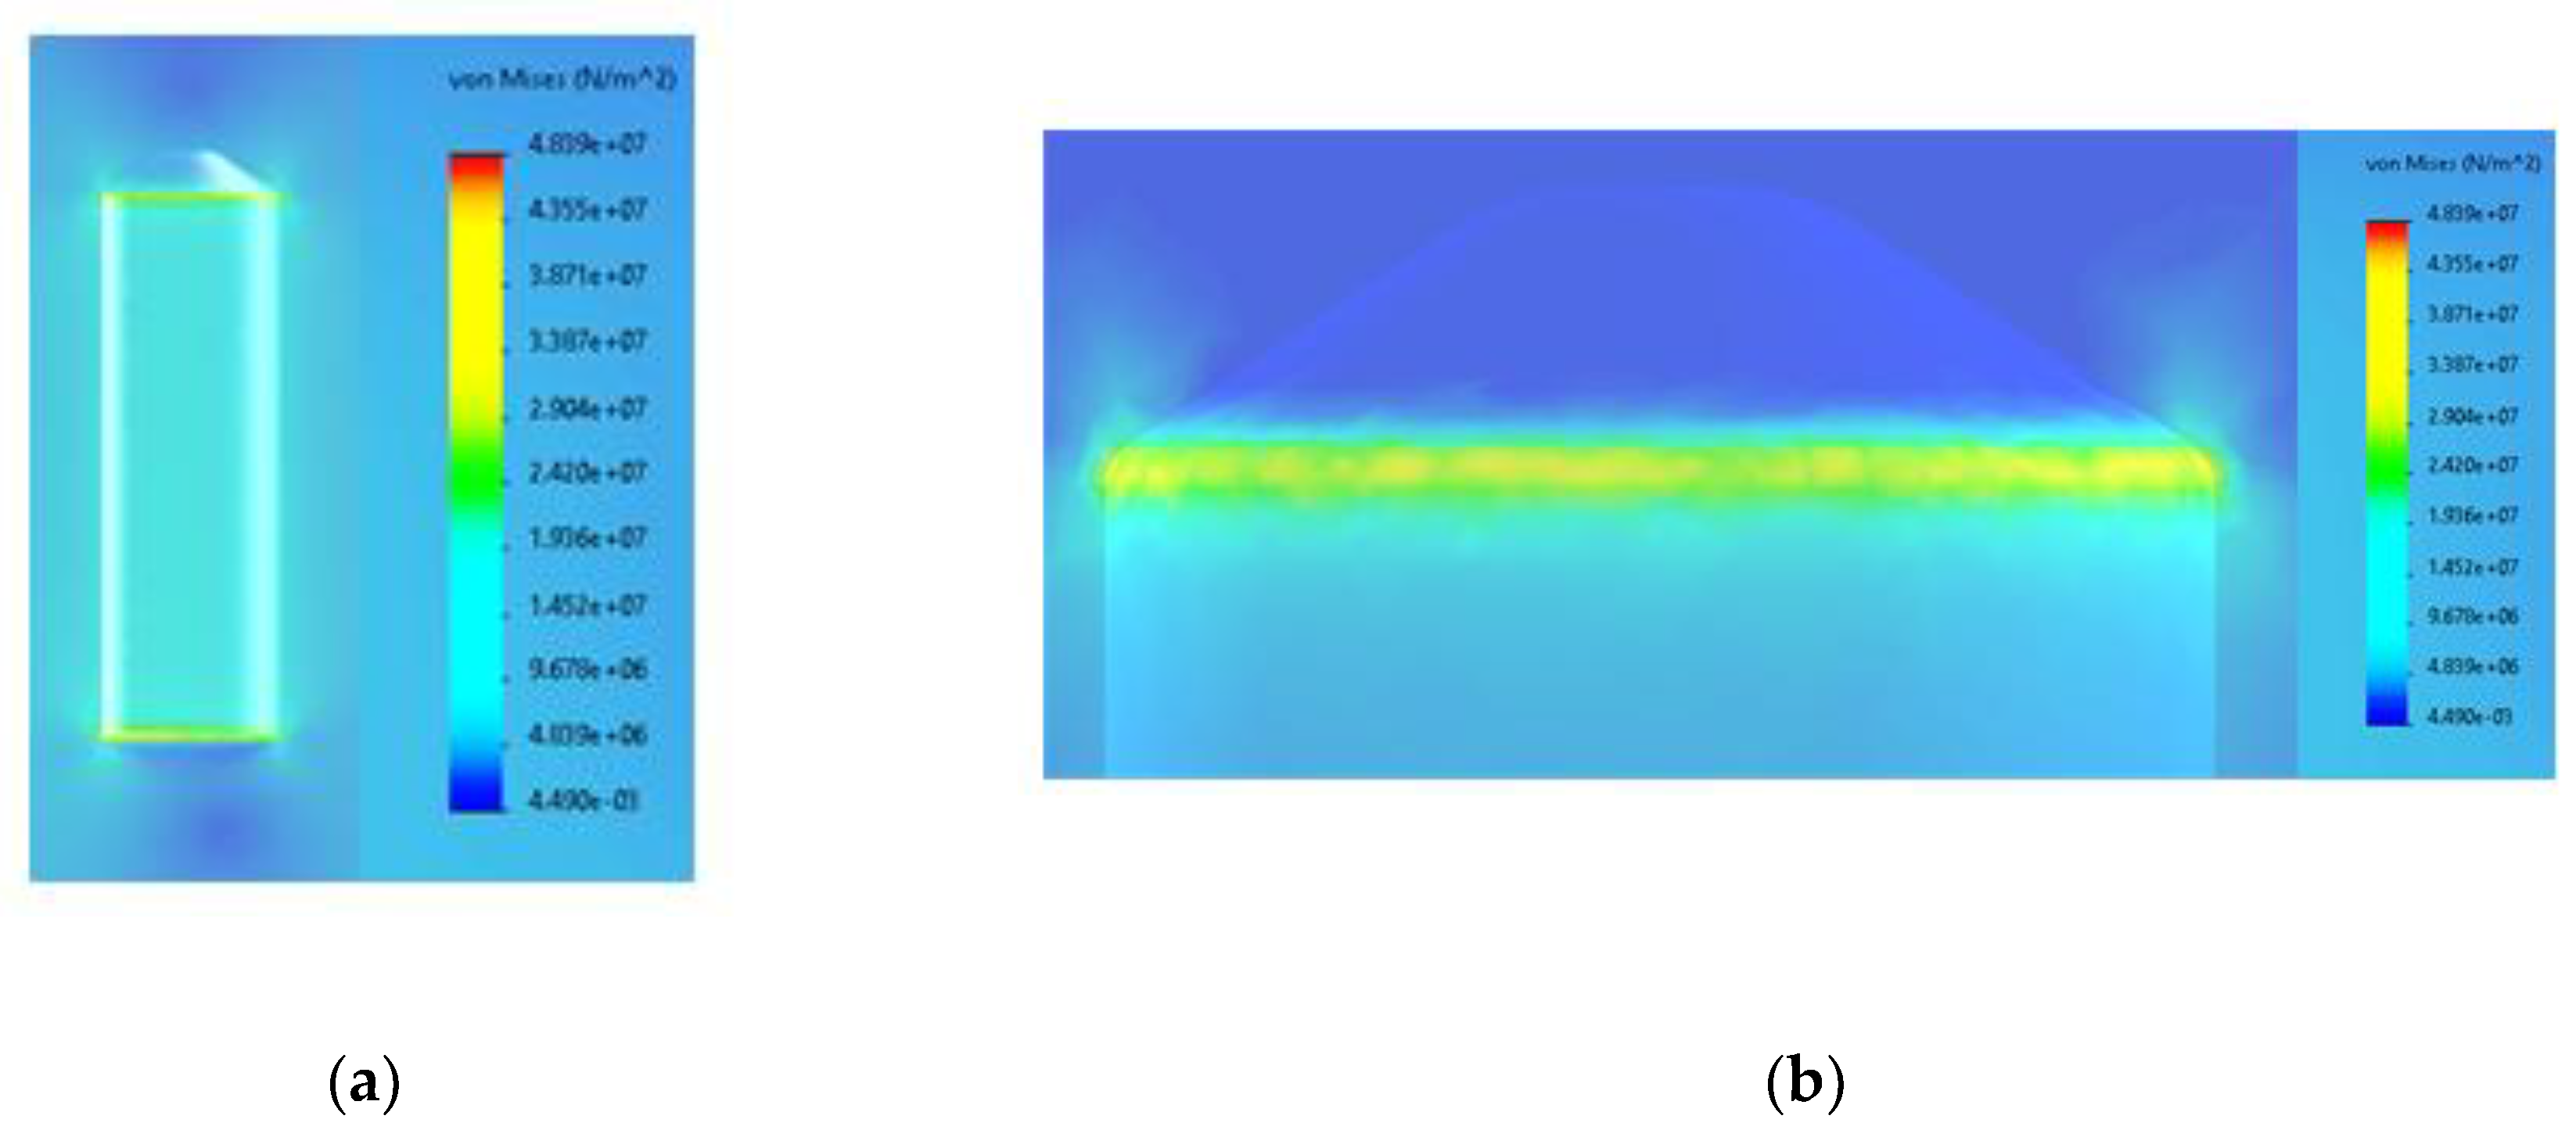
Figure 12.
Tension at dilatation threshold for 30 bar internal pressure and 40m diameter.
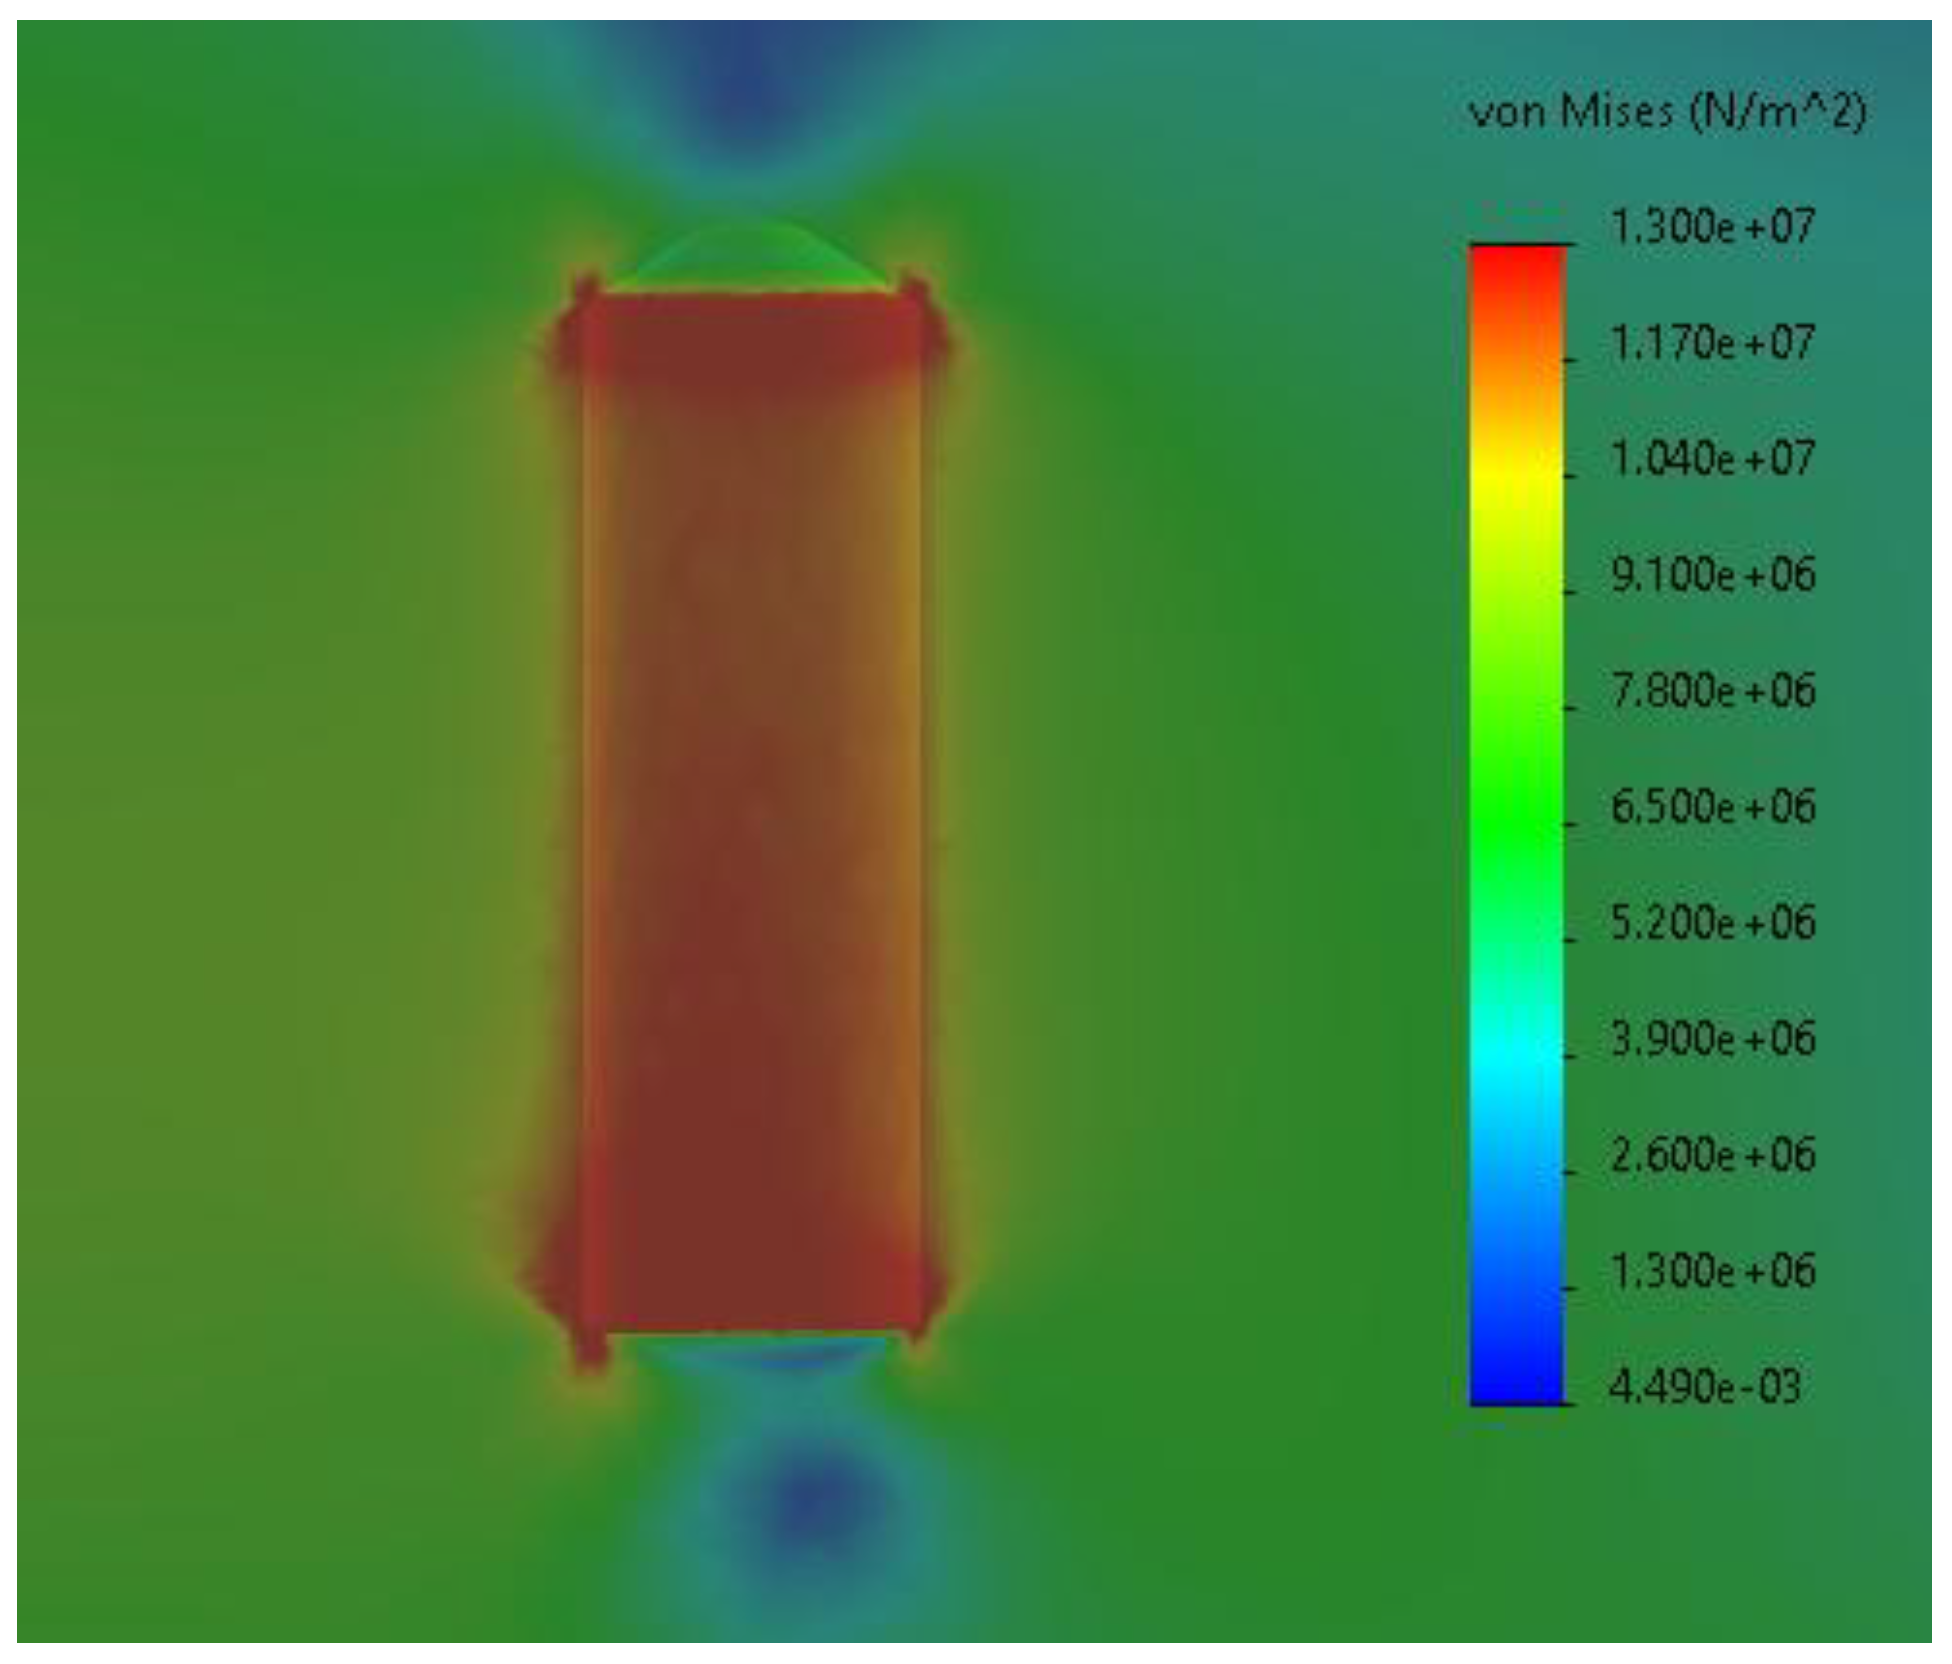
Figure 13.
Mechanical stress of salt caverns at maximum 230 bar internal pressure and 60m diameter. (a) individual cavern view; (b) top section view for 4 caverns.
Figure 13.
Mechanical stress of salt caverns at maximum 230 bar internal pressure and 60m diameter. (a) individual cavern view; (b) top section view for 4 caverns.
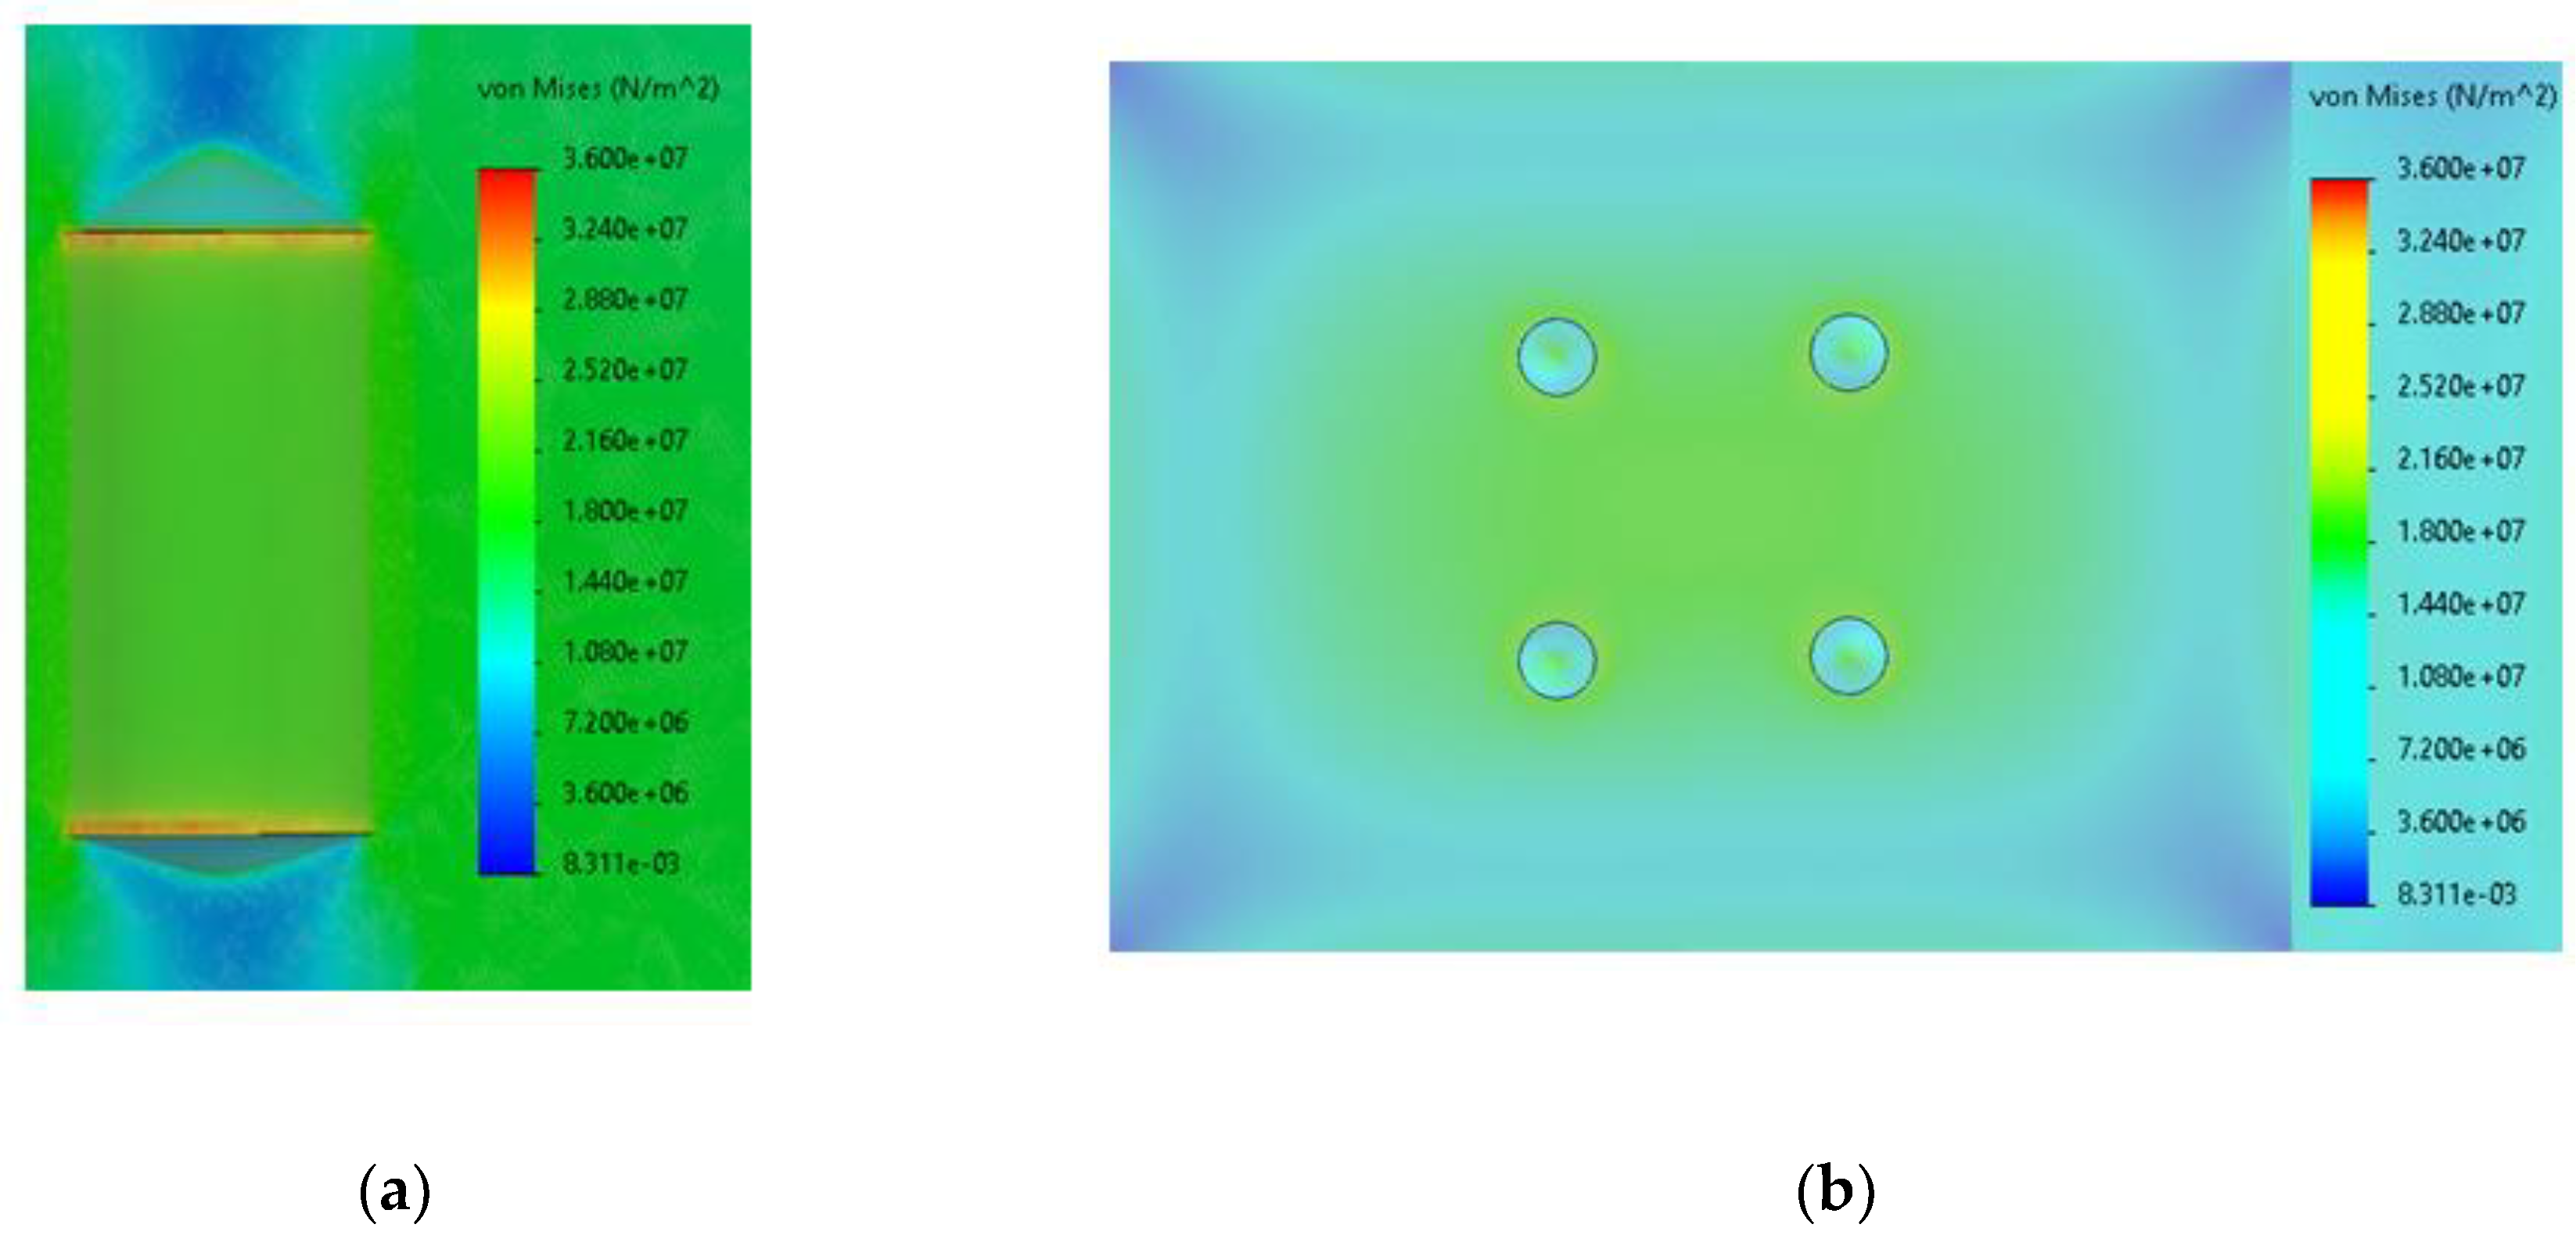
Figure 14.
Mechanical stress of salt caverns at minimum 60 bar internal pressure and 60m diameter. (a) whole cavern view; (b) Detail at the top cavern view, with rescaled tensions in the crical zone.
Figure 14.
Mechanical stress of salt caverns at minimum 60 bar internal pressure and 60m diameter. (a) whole cavern view; (b) Detail at the top cavern view, with rescaled tensions in the crical zone.
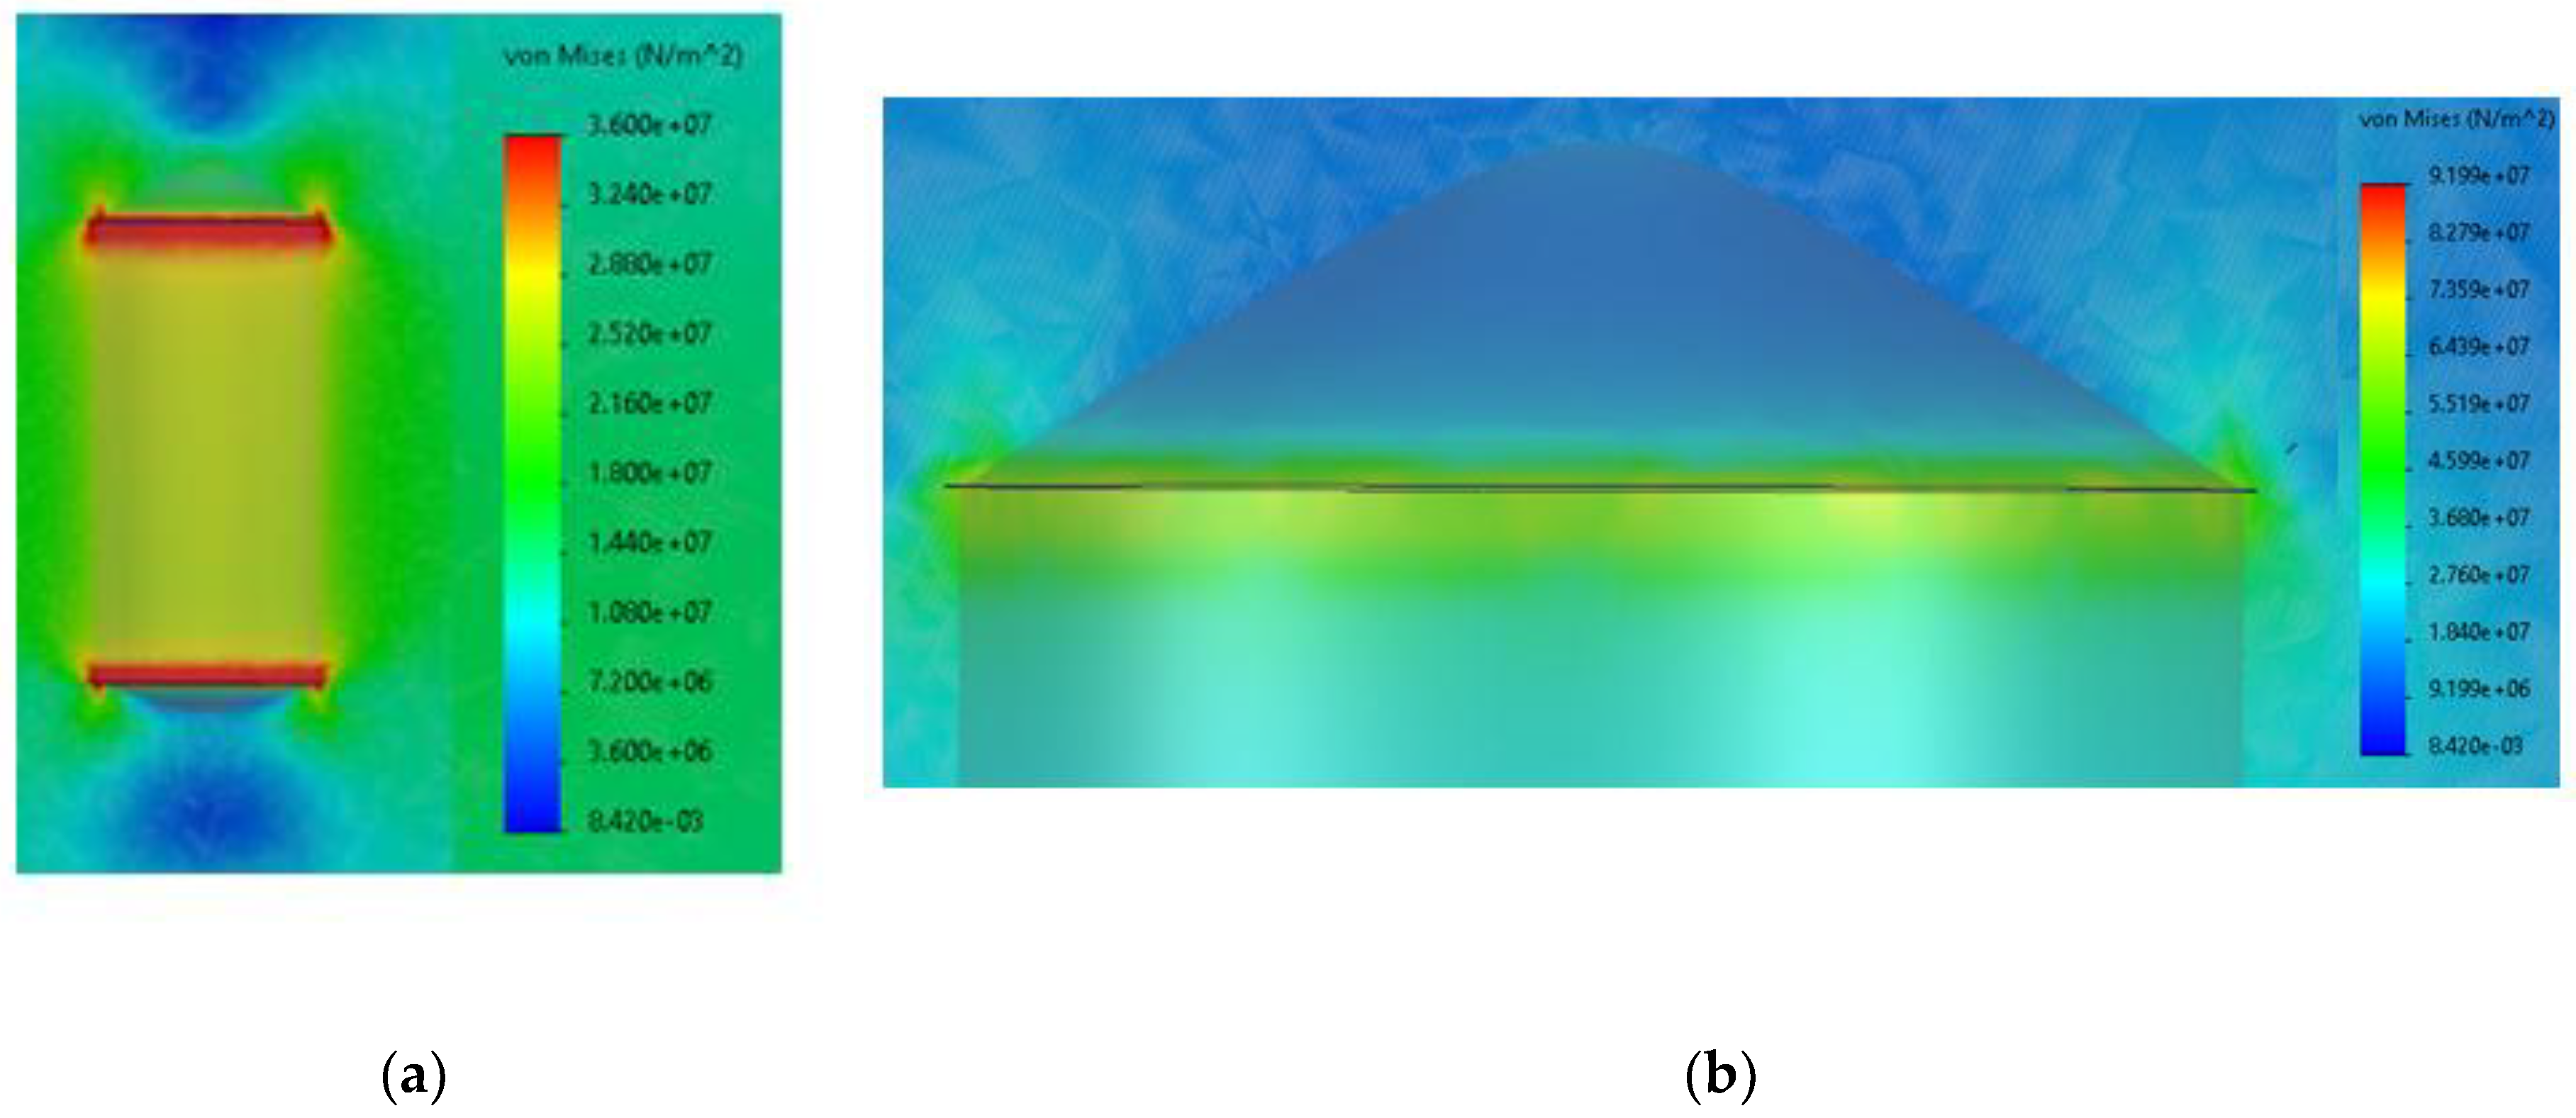

Table 1.
Key parameters in cavern design.
| Parameters | Values | References | |
|---|---|---|---|
| Distance between caverns(axis to axis) | 4 times the cavern diameter | Caglayan et al. (2020) [18] | |
| Ceiling-wall thickness | 75% from cavern diameter | Caglayan et al. (2020) [18] | |
| Foot-wall thickness | 20% from cavern diameter | L. Wang et al. (2015) [19] | |
| Height / Diameter ratio | > 0,5 | T. Wang et al. (2015) [20] | |
| The shape of the caverns | Bell-shaped or cylindrical | Lux (2009) [21] | |
| The depth range where from the cavern begin to be formed | 500 - 3000m | Evans and Holloway (2009) [22] Plaat (2009) [23] Caglayan et al. (2020) [18] |
|
| Distance from adjacent faults/ discontinuities or old workings (e.g. abandoned oil wells) | > 2 times the cavern diameter | L. Wang et al. (2015) [19] | |
| H2 operating pressure (measured at the bottom of the cemented column) | Pmin=24%, Pmax=80% from geostatic pressure | Ozarslan (2012); [24]Stolzenburg et al. (2014) [25] | |
| Distance from salt formation edge (dome margins) | > 500m (diapiric) > 2000m (sedimentary) |
Kupfer et al. (1998) [26] Caglayan et al. (2020) [18] |
|
Table 2.
The geomechanical properties of the salt from the 19 Vadu well.
| Physically | Mechanically | Elastically | |||||||||
|---|---|---|---|---|---|---|---|---|---|---|---|
| Specific distance γ.104[N/m3] |
Apparent specific gravity a.104[N/m3] | Porosity n[%] |
Humidity W[%] | Compressive strength σrc,[MPa] | Tensile strength σrt, [MPa] | Flexural strength σrf, [MPa] |
Cohesion C [MPa] | The angle of internal friction ϕ, [0] | The modulus of elasticity E [MPa] | The tension at the dilatation threshold σd*[MPa] |
Wave propagation speed v[m/s] |
| 2.175 - 2.181 | 2.04 - 2.059 | 0.82 - 1.231 | 2.13 - 3.13 | 21.94 - 36.76 | 0.80 - 2.154 | 9.75 - 13.00 | 1.20 - 4.42 | 39 - 42 | 2120 - 2610 | 12.94 - 15.65 | 3885 - 4215 |
Table 3.
Average compression strength of salt comparative table from different salt mines in Romania.
Table 3.
Average compression strength of salt comparative table from different salt mines in Romania.
| Deposit | Praid | Ocna Dej | Ocnele Mari | Tg. Ocna | Slanic Prahova | Vadu |
|---|---|---|---|---|---|---|
| Romanian County | Harghita | Cluj | Valcea | Bacau | Prahova | Constanta |
| Compression strength | 21.7 [ MPa] |
21.1 [ MPa] |
18.3 [ MPa] |
25 [ MPa] |
20 [ MPa] |
30 [ MPa] |
Table 4.
Geometrical data of the investigation of caverns.
| Parameter | Cavern A | Cavern B |
|---|---|---|
| Diameter [m] | 40 | 60 |
| Height [m] | 120 | 120 |
| Cavern total volume [m3] | 150,000 | 320,000 |
| Cavern free volume [m3] | 100,000 | 225,000 |
| Formation time/step | 200 days/8.7 m=23 days/m | 300 days/5.7 m=51 days/m |
| Total time for a cavern formation | 2,760 days~92 month~8 years | 6120 days~204 month~17 years |
| Depth to cavern ceiling from seabed [m] | 700 | 1,400 |
Table 5.
Assumptions used in the cavern capacity calculations.
| Parameter | Value |
|---|---|
| Seabed depth | 20 ÷ 100 m |
| Fraction of total cavern volume used as cavern free volume | 70% |
| Average temperature at wellhead | 6°C |
| Maximum cavern pressure, measured at the LCCS (Last Cemented Casing Shoe) | 0.80 · σv |
| Minimum cavern pressure, measured at the LCCS | 0.20 · σv |
| Average temperature at seabed | 9°C |
| Geothermal gradient | 0.031°C/m |
Table 6.
Results of the calculations for the hydrogen storage capacity of the two investigated caverns.
Table 6.
Results of the calculations for the hydrogen storage capacity of the two investigated caverns.
| Calculations results | Cavern A | Cavern B |
|---|---|---|
| Depth to cavern ceiling from seabed (m] | 700 | 1,400 |
| Geostatic vertical stress at the LCCS depth (bar) | 150 | 290 |
| Maximum cavern pressure, measured at the LCCS (bar-abs) | 120 | 230 |
| Minimum cavern pressure, measured at the LCCS (bar-abs) | 30 | 60 |
| Temperature at cavern mid-height (°C) | 31 | 53 |
| Cushion hydrogen required to maintain minimum cavern pressure (millions Nm3) | 2.75 | 11.16 |
| Cushion hydrogen required to maintain minimum cavern pressure (tonnes) | 245 | 996 |
| Netto hydrogen volume (million Nm3) | 7.9 | 31.61 |
| Netto hydrogen mass (tonnes) | 704 | 2,821 |
| Netto energy stored in the cavern (GWh) | 23.443 | 93.939 |
| Energy density per cavern (MWh/tonne) | 33.3 | |
Table 7.
Key geological and industrial indicators for suitable sites.
| Parameter | Criteria | Positive indicator score = 10 |
Intermediate indicator score = 5 |
Cautionary indicator score = 1 |
Reference |
|---|---|---|---|---|---|
| Host salt formation | Depth (m) (from seabed) | 1000–1500 | 500–1000 and 1500–2000 | <500 and >2000 | Smith et al. (2005) [34]; Evans and Holloway (2009) [22]; Plaat (2009) [23]; Caglayan et al. (2020) [18] |
| Thickness (m) | >400 | 200-400 | <200 | Caglayan et al. (2020) [18]; Allsop et al. (2023) [16]; |
|
| Purity (%) | >80 | 60-80 | <60 | Li et al. (2019) [35] ; Saltwork Consultants Pty Ltd (2021) [36]; |
|
| In situ stress state | Isotropic | Orthotropic | Anisotropic | Minkley et al. (2015) [37]; Li and Urai (2016) [38]; Zijp et al. (2018) [39] ; Urai et al. (2019) [40]; |
|
| Load bearing rock formation (hanging and foot wall) | Lithology | Halite | Mudstone and K–Mg salts | Carbonate and anhydrite | Li et al. (2020) [41] ; Taheri et al. (2020) [42]; |
| Thickness (m) | Bedded hanging: >80; foot: >30 |
Bedded hanging: 63; foot: 16.8 | Bedded hanging: <60; foot: <20 |
Bruno (2005) [43] ; Wang T. et al. (2015) [20]; Caglayan et al. (2020) [18]; |
|
| Diapiric hanging: >50; foot: >15 |
Diapiric hanging: >43.5; foot: 11.6 |
Diapiric hanging: <40; foot: <10 |
|||
| Structural features | None | Folding | Faults/fractures | Allsop et al. (2023) [16]; | |
| Lithological Interlayers If no interlayers, award score = 100 | Lithology | K–Mg salts and polyhalite | Anhydrite and mudstone | Carbonates | Li and Urai (2016) [38]; Cala et al. (2018) [44]; Zijp et al. (2018) [39]; Urai et al. (2019) [40]; |
| Thickness (m) (non-salt) | <3 (single interlayer) | 3 (single interlayer) | >3 (single interlayer) | Hamilton (1971) [45]; | |
| Thickness (m) (K–Mg salts) | <3 (total thickness) | 3–10 (total thickness) | >10 (total thickness) | Urai et al. (2019) [40]; | |
| Location | Base | Centre | Top | Richter-Bernburg (1980) [46]; Li et al. (2019) [47]; |
|
| Number of interlayers | 0 | 1 – 2 | > 2 | Li and Urai (2016) [38]; Cala et al. (2018) [44]; Zijp et al. (2018) [39]; Urai et al. (2019) [40]; |
|
| Cavern geometry | Cavern volume (m3)/ height (m) | 750,000 (300) |
500,000 (120) |
n/a | Caglayan et al. (2020) [18]; |
| Distance from salt edge (m) | Bedded: 2000 | Bedded: <2000, >500 | > 500 m | Kupfer et al. (1998) [26]; Looff et al. (2003) [48]; |
|
| Diapiric: 1000 | Diapiric: <1000, >500 |
Caglayan et al. (2020) [17]; | |||
| Industrial | Pipeline infrastructure (km) | < 5 | 5 – 10 | > 10 | Allsop et al. (2023) [16]; |
| Distance from UK coastline (km) |
< 50 | 50 – 80 | > 80 | Allsop et al. (2023) [16]; |
Disclaimer/Publisher’s Note: The statements, opinions and data contained in all publications are solely those of the individual author(s) and contributor(s) and not of MDPI and/or the editor(s). MDPI and/or the editor(s) disclaim responsibility for any injury to people or property resulting from any ideas, methods, instructions or products referred to in the content. |
© 2025 by the authors. Licensee MDPI, Basel, Switzerland. This article is an open access article distributed under the terms and conditions of the Creative Commons Attribution (CC BY) license (http://creativecommons.org/licenses/by/4.0/).
Copyright: This open access article is published under a Creative Commons CC BY 4.0 license, which permit the free download, distribution, and reuse, provided that the author and preprint are cited in any reuse.


