1. Introduction
Obesity is becoming increasingly common in today's society, characterized by an excessive accumulation of triglycerides leading to a total body fat content far above the normal range. The World Health Organization has classified 'obesity' as one of the top ten diseases that severely affect health, and the widespread prevalence of obesity worldwide has a clear correlation with the increased incidence of type 2 diabetes, hypertension, cardiovascular diseases, and related cancers [
1]. Currently, obesity has become a global epidemic, severely threatening people's health and safety. Preventing and treating obesity is a significant public health challenge faced by countries around the world [
2]. The occurrence and development of obesity are closely related to the metabolic abnormalities of brown adipose tissue. Understanding the mechanisms involved is crucial for intervening in the onset of pathological obesity.
Brown adipose tissue (BAT) is a highly vascularized type of fat tissue that is rich in multilocular lipid droplet structures and numerous mitochondria, distributed in areas such as the neck, shoulders, and mediastinum [
3]. BAT plays a key role in energy expenditure and obesity prevention by releasing energy in the form of heat through non-shivering thermogenesis [
4]. Research indicates that activating BAT can increase metabolic rate and promote the secretion of hormones such as adiponectin and irisin, thereby reducing inflammation, enhancing insulin sensitivity, and stabilizing blood sugar levels [
4,
5,
6], showing potential for treating obesity and type 2 diabetes. However, dysfunction of brown adipose tissue, such as vascular insufficiency and mitochondrial dysfunction [
7], is closely related to obesity. Factors such as a high-fat diet can lead to "whitening" of Brown adipose tissue (characterized by reduced capillaries and decreased thermogenic function), which in turn lowers energy expenditure and promotes the onset of obesity. Therefore, in-depth research into the mechanisms of metabolic abnormalities in Brown adipose tissue is of significant importance for intervening in obesity.
The occurrence of obesity is not only related to genetic, environmental, and social factors but is also closely linked to poor dietary habits [
8]. A high-fat diet has been confirmed as a significant cause of obesity. Additionally, environmental endocrine disruptors (ECDs) such as bisphenol A (BPA) are also considered important risk factors for obesity. Research indicates that exposure to BPA can increase the risk of obesity [
9]. BPA is a monomer widely used in the production of epoxy resins and polycarbonate plastics, commonly found in food containers, thermal paper, and medical devices, entering the body through skin contact, oral intake, or inhalation [
10,
11,
12]. Inside the body, BPA can bind to estrogen receptors and androgen receptors, disrupting the normal function of hormones and causing long-term harm to reproductive, metabolic, and immune systems [
13]. The U.S. Environmental Protection Agency (EPA) has set a reference dose for BPA at 50 μg/kg/day [
14]. In response to precise risk assessments of BPA and its adverse health effects, the European Food Safety Authority (EFSA) has reduced the acceptable daily intake (TDI) to 4 μg/kg/day. However, the specific mechanisms by which a high-fat diet and BPA together lead to decreased function and activity of Brown adipose tissue, the whitening of highly vascularized Brown adipose tissue, and ultimately the development of obesity still require further clarification.
Brown adipose tissue is highly dependent on the normal function of blood vessels, and its capillary density and functionality are crucial for maintaining thermogenesis and metabolic homeostasis. Vascular endothelial growth factor (VEGF) is one of the important factors that regulate angiogenesis and vascular function [
15]. Particularly, VEGF-A plays a critical role not only in angiogenesis but also in the function of adipocytes, chronic inflammation, and the browning of white fat [
16]. Studies have shown that a high-fat diet reduces VEGF levels, leading to decreased vascular density in Brown adipose tissue, triggering mitochondrial autophagy and "whitening" [
17], and is closely related to glucose metabolism disorders [
18]. The downstream signaling pathways of VEGF include phosphoinositide 3-kinase (PI3K)/protein kinase B (Akt), which not only affects vascular formation but also enhances endothelial cell proliferation, migration, and lumen formation [
19,
20,
21]. Research indicates that bisphenol A (BPA) can cause abnormalities in angiogenesis [
22]. In summary, these studies suggest that microvascular supply profoundly regulates the thermogenic capacity of Brown adipose tissue and the metabolic homeostasis of the body. Furthermore, high-fat diets and BPA may influence the capillary function of Brown adipose tissue through the VEGF pathway, thereby weakening its thermogenic function and promoting obesity, although the specific mechanisms remain unclear.
Given the high prevalence and harmful effects of obesity, along with the limited literature on the impact of high-fat diets and BPA on the microvascular structure and function of Brown adipose tissue, studying the effects of high-fat diets and BPA exposure on brown adipose tissue is highly valuable. The occurrence and development of obesity are closely related to metabolic abnormalities in brown adipose tissue, and understanding these mechanisms is crucial for intervening in pathological obesity. We hypothesize that this study will reveal how exposure to bisphenol A (BPA) and high-fat diets may affect the microvascular structure or function within brown adipose tissue (BAT) through the VEGF/VEGFR2/PI3K/AKT pathway, thereby impairing BAT function and ultimately leading to the onset and progression of obesity. Investigating the mechanisms of microvascular function in brown adipose tissue may help uncover new mechanisms underlying the development of obesity and provide new insights and potential intervention targets for the prevention and treatment of obesity and its related metabolic diseases.
2. Materials and Methods
2.1. Animals and Experimental Protocol
In this study, 40 male C57BL/6J mice aged 6-8 weeks, SPF grade, were used. The mice were purchased from the Guangdong Medical Laboratory Animal Center, and the certificate number is No. 44007200119269. The ethical approval number for this experiment is: Animal Ethics Review [2023] No. 006, and the animal use license number is SYXK (Yue) 2023-0312. The experiment was conducted in the Toxicology Laboratory of the Guangzhou Center for Disease Control and Prevention. After a two-week acclimation period to ensure no significant weight differences, further treatment was conducted. During the trial, the animals had free access to water, with a 12-hour light/dark cycle, a temperature of (22±2)℃, and humidity between 40% and 70%. Regular feed was purchased from the Guangdong Medical Laboratory Animal Center, while the high-fat diet (with a fat energy ratio of 45%) was sourced from Jiangsu XieTong Pharmaceutical Bioengineering Co., Ltd. The mice were randomly divided into four groups (n = 40, 10 animals per group): (a) NCD group: standard feed with daily gavage of equal volumes of corn oil; (b) NCD + BPA group: standard feed with daily gavage of BPA dissolved in corn oil (50 μg/kg/d); (c) HFD group: high-fat feed with daily gavage of equal volumes of corn oil; (d) HFD + BPA group: high-fat feed with daily gavage of BPA dissolved in corn oil (50 μg/kg/d). The treatment lasted for 90 days, after which the mice were anesthetized with isoflurane inhalation, blood was collected from the posterior vena cava, and subscapular brown adipose tissue was isolated.
2.2. Cell and Experimental Protocol
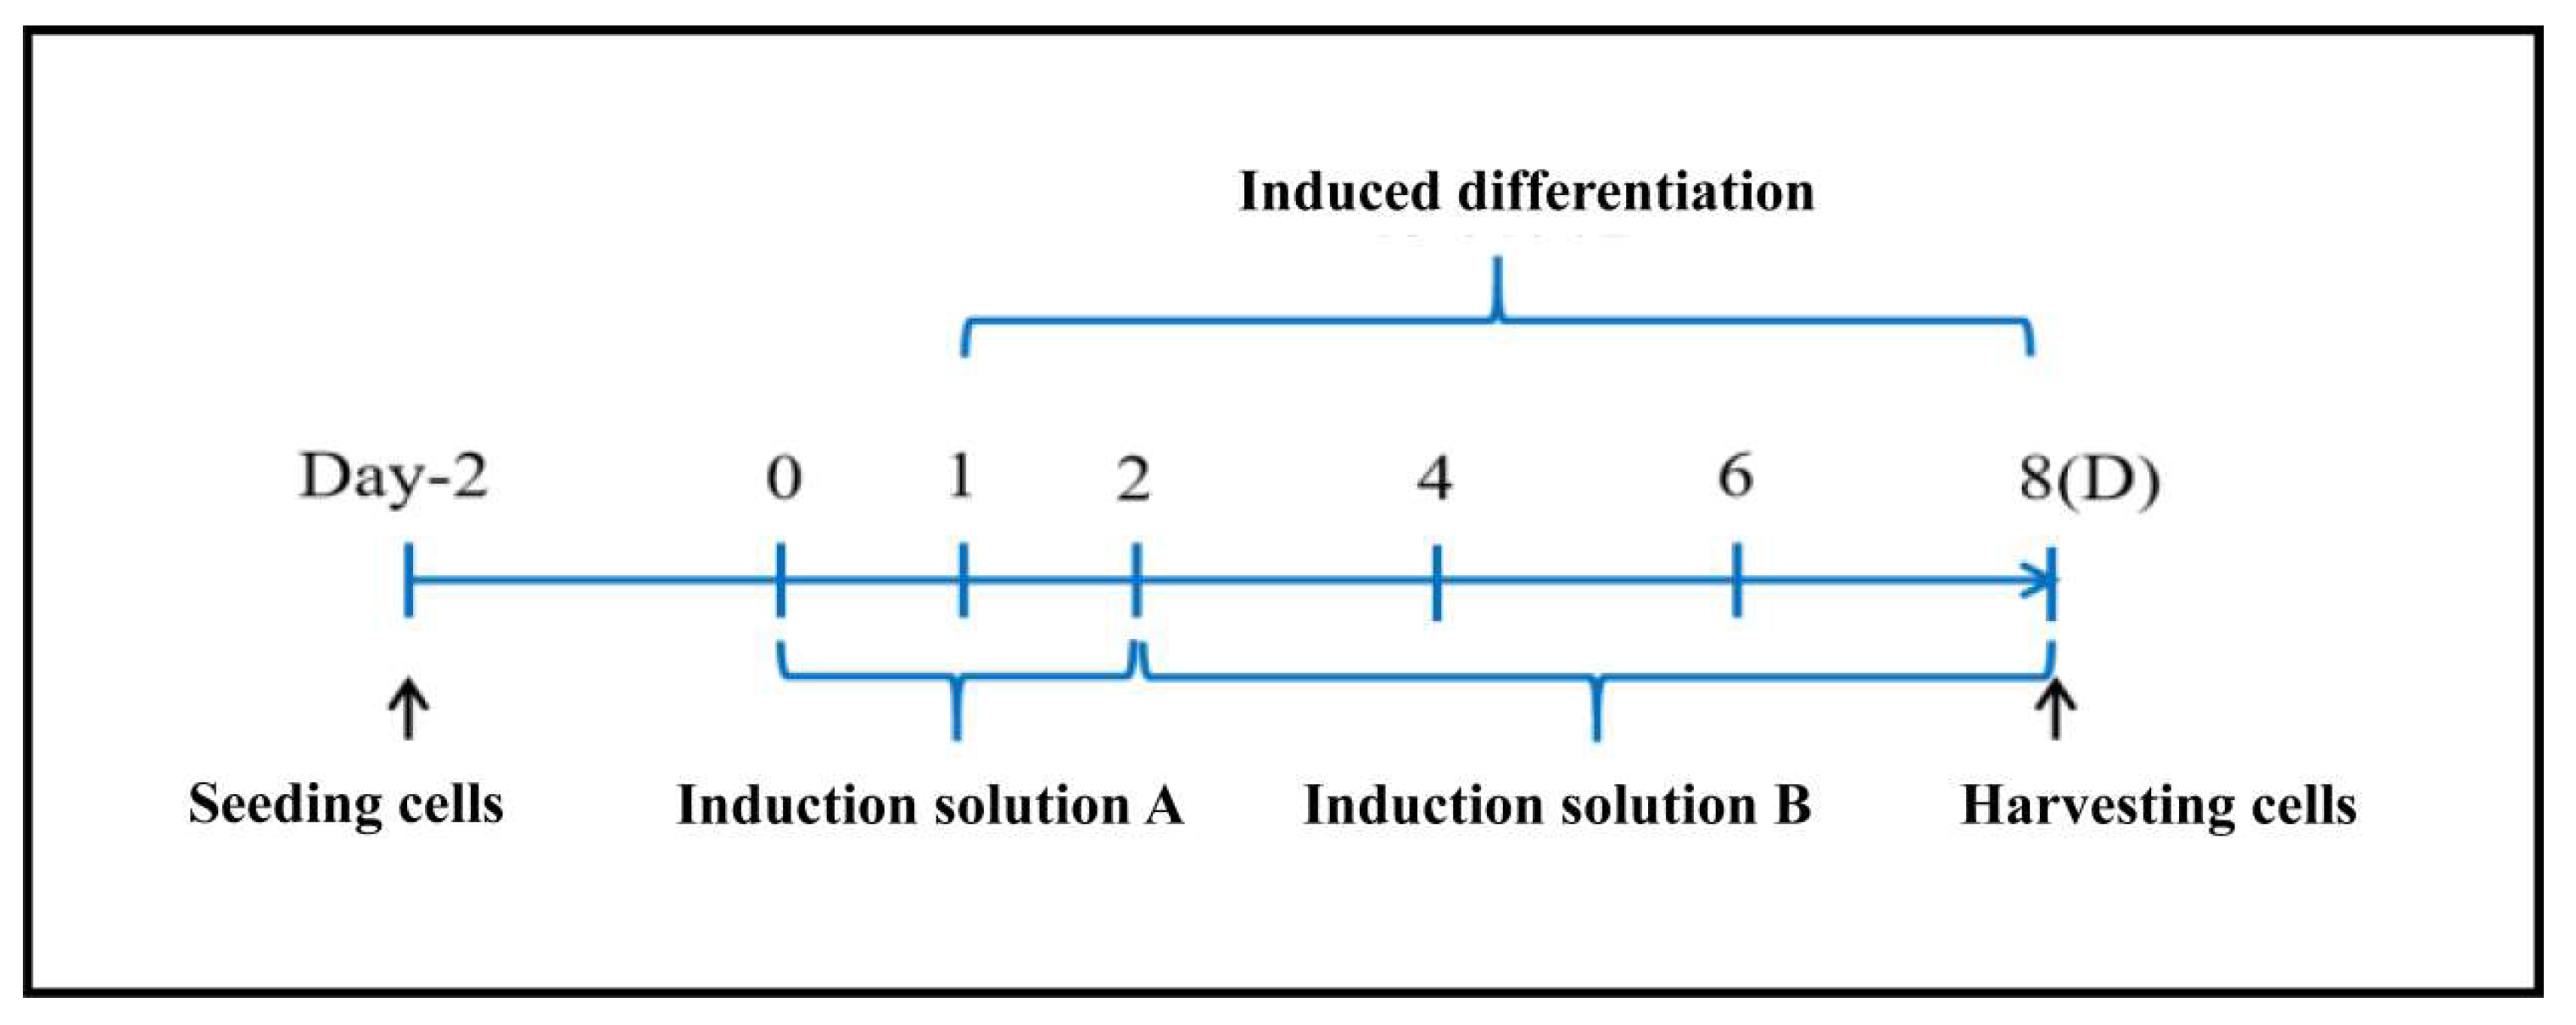
The mesenchymal stem cell line C3H10T1/2 was purchased from Procell Life Science & Technology Co. Ltd. (Wuhan, China). It was cultured in MEM (Beijing Wokai Biotechnology Co., Ltd.) containing 10% fetal bovine serum (Gibco, USA) at a temperature of 37°C with 5% CO2. The cells were grown until they reached complete confluence before initiating induced differentiation (
Figure A1). After 48 hours of differentiation with Induction Medium A (
Table A1) and 6 days with Induction Medium B (
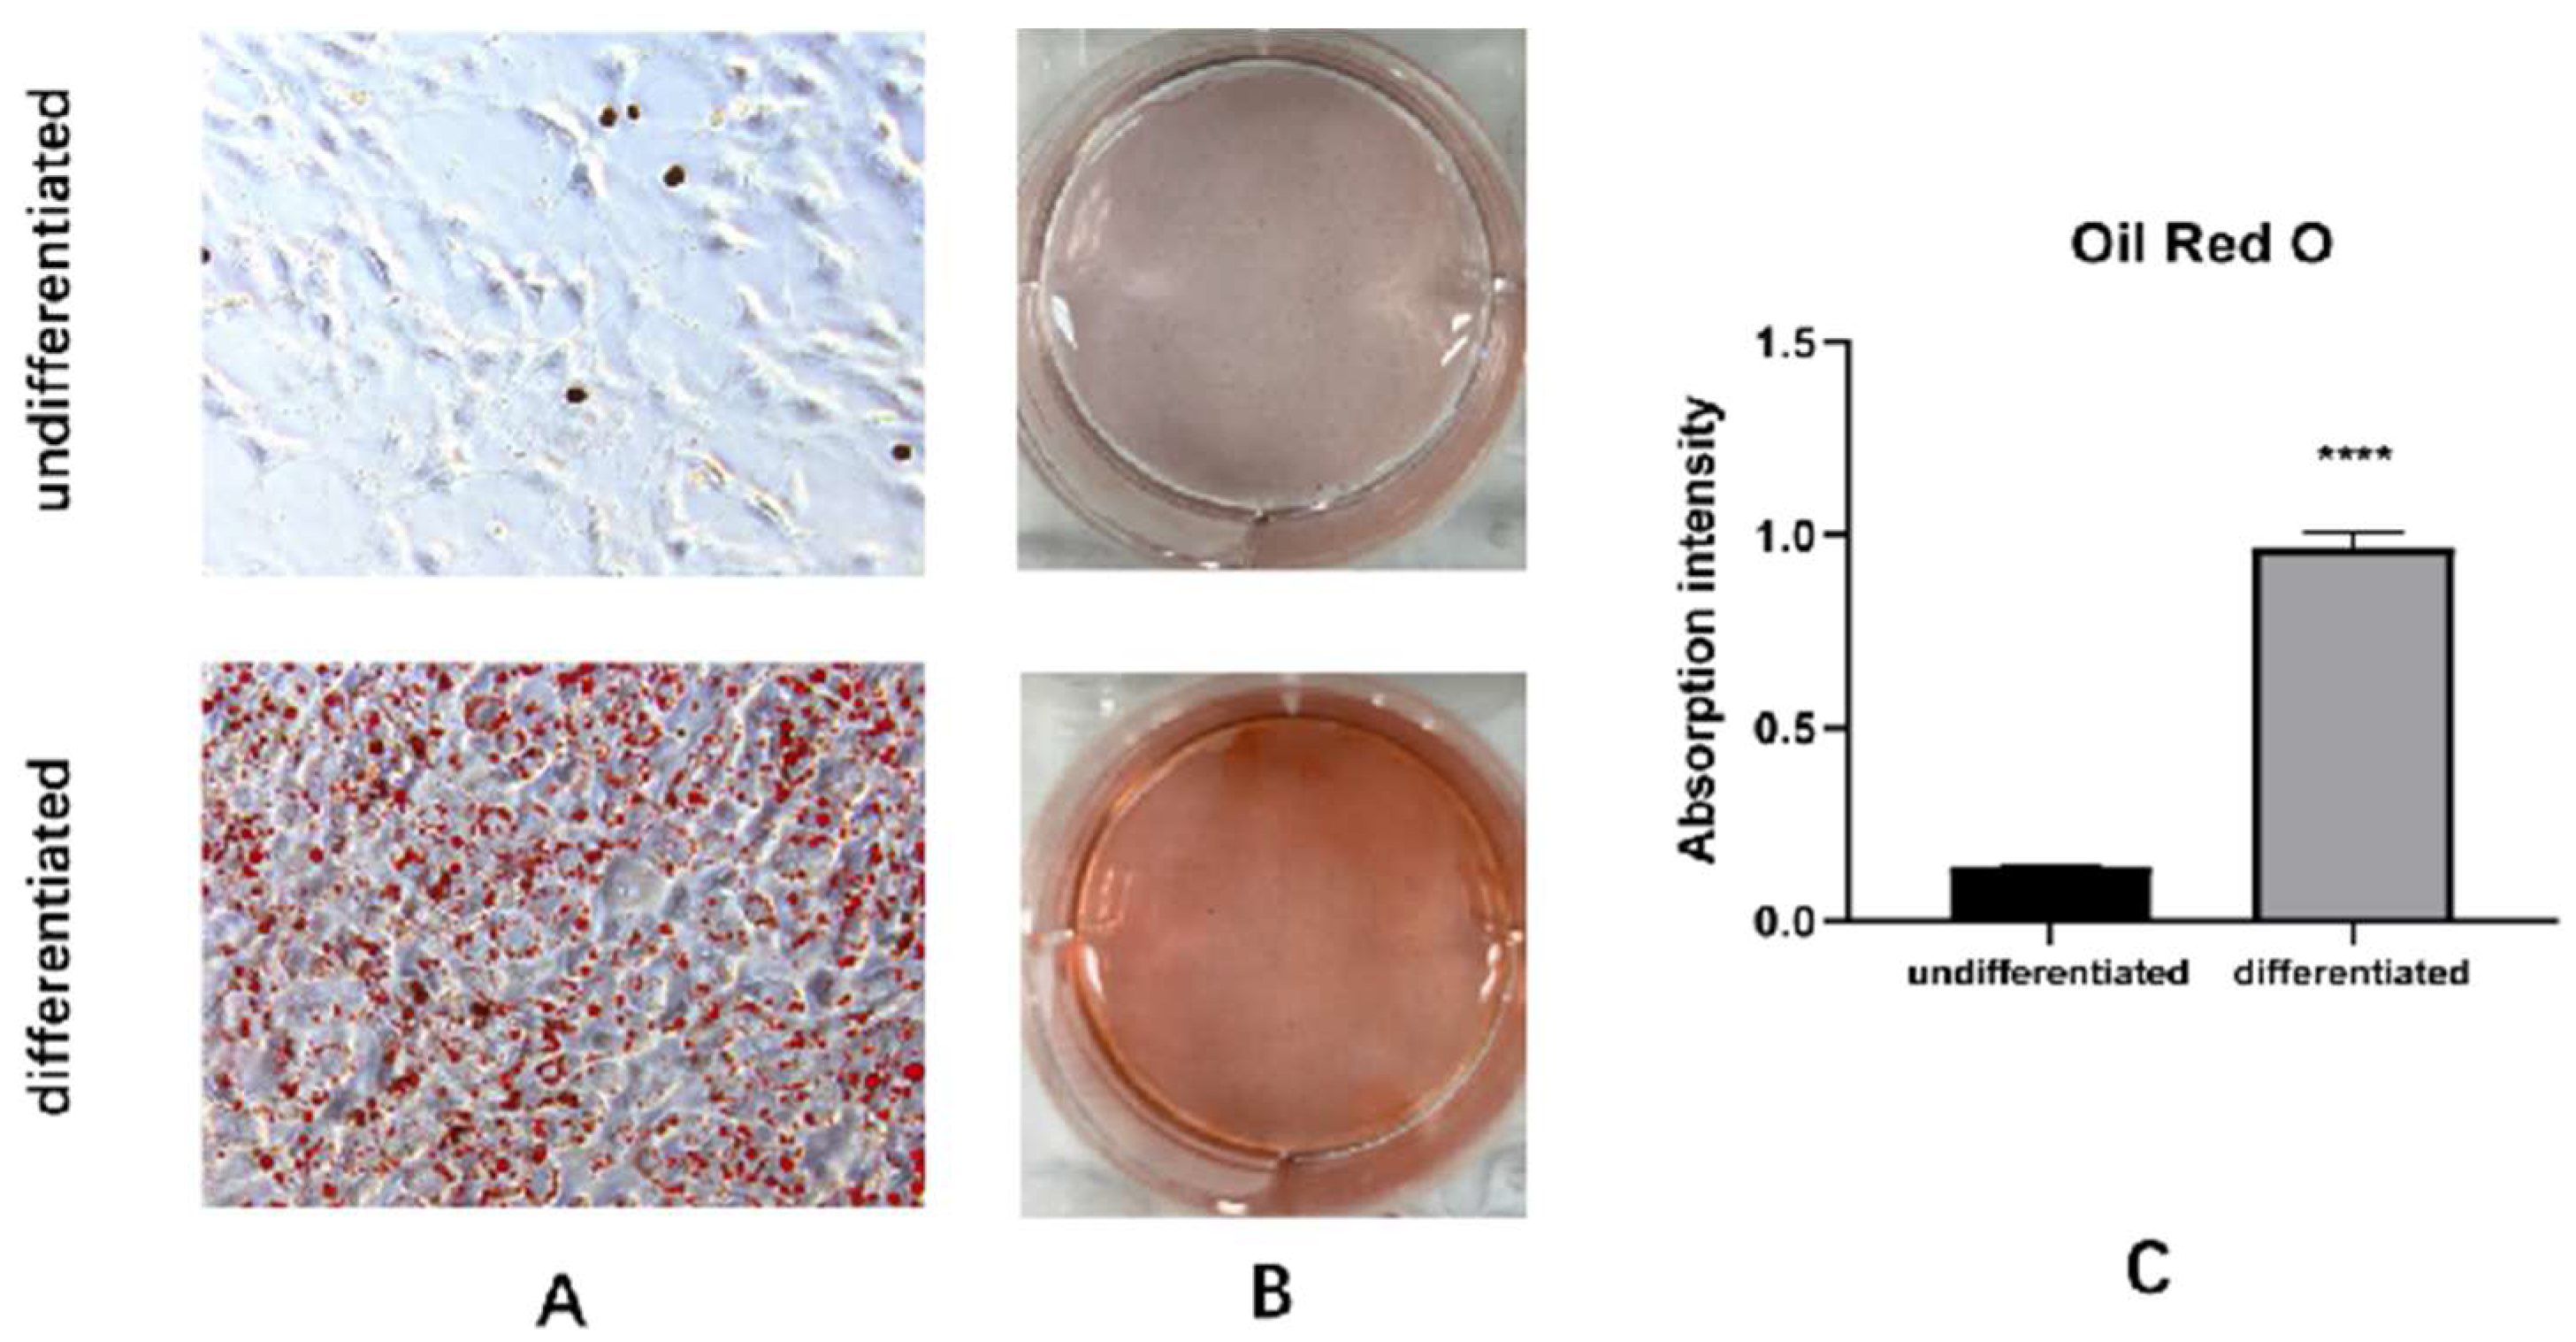
Table A2), they differentiated into mature brown adipocytes. The C3H10T1/2 cells induced to become mature brown adipocytes were identified using Oil Red O staining(
Figure A2), immunofluorescence(
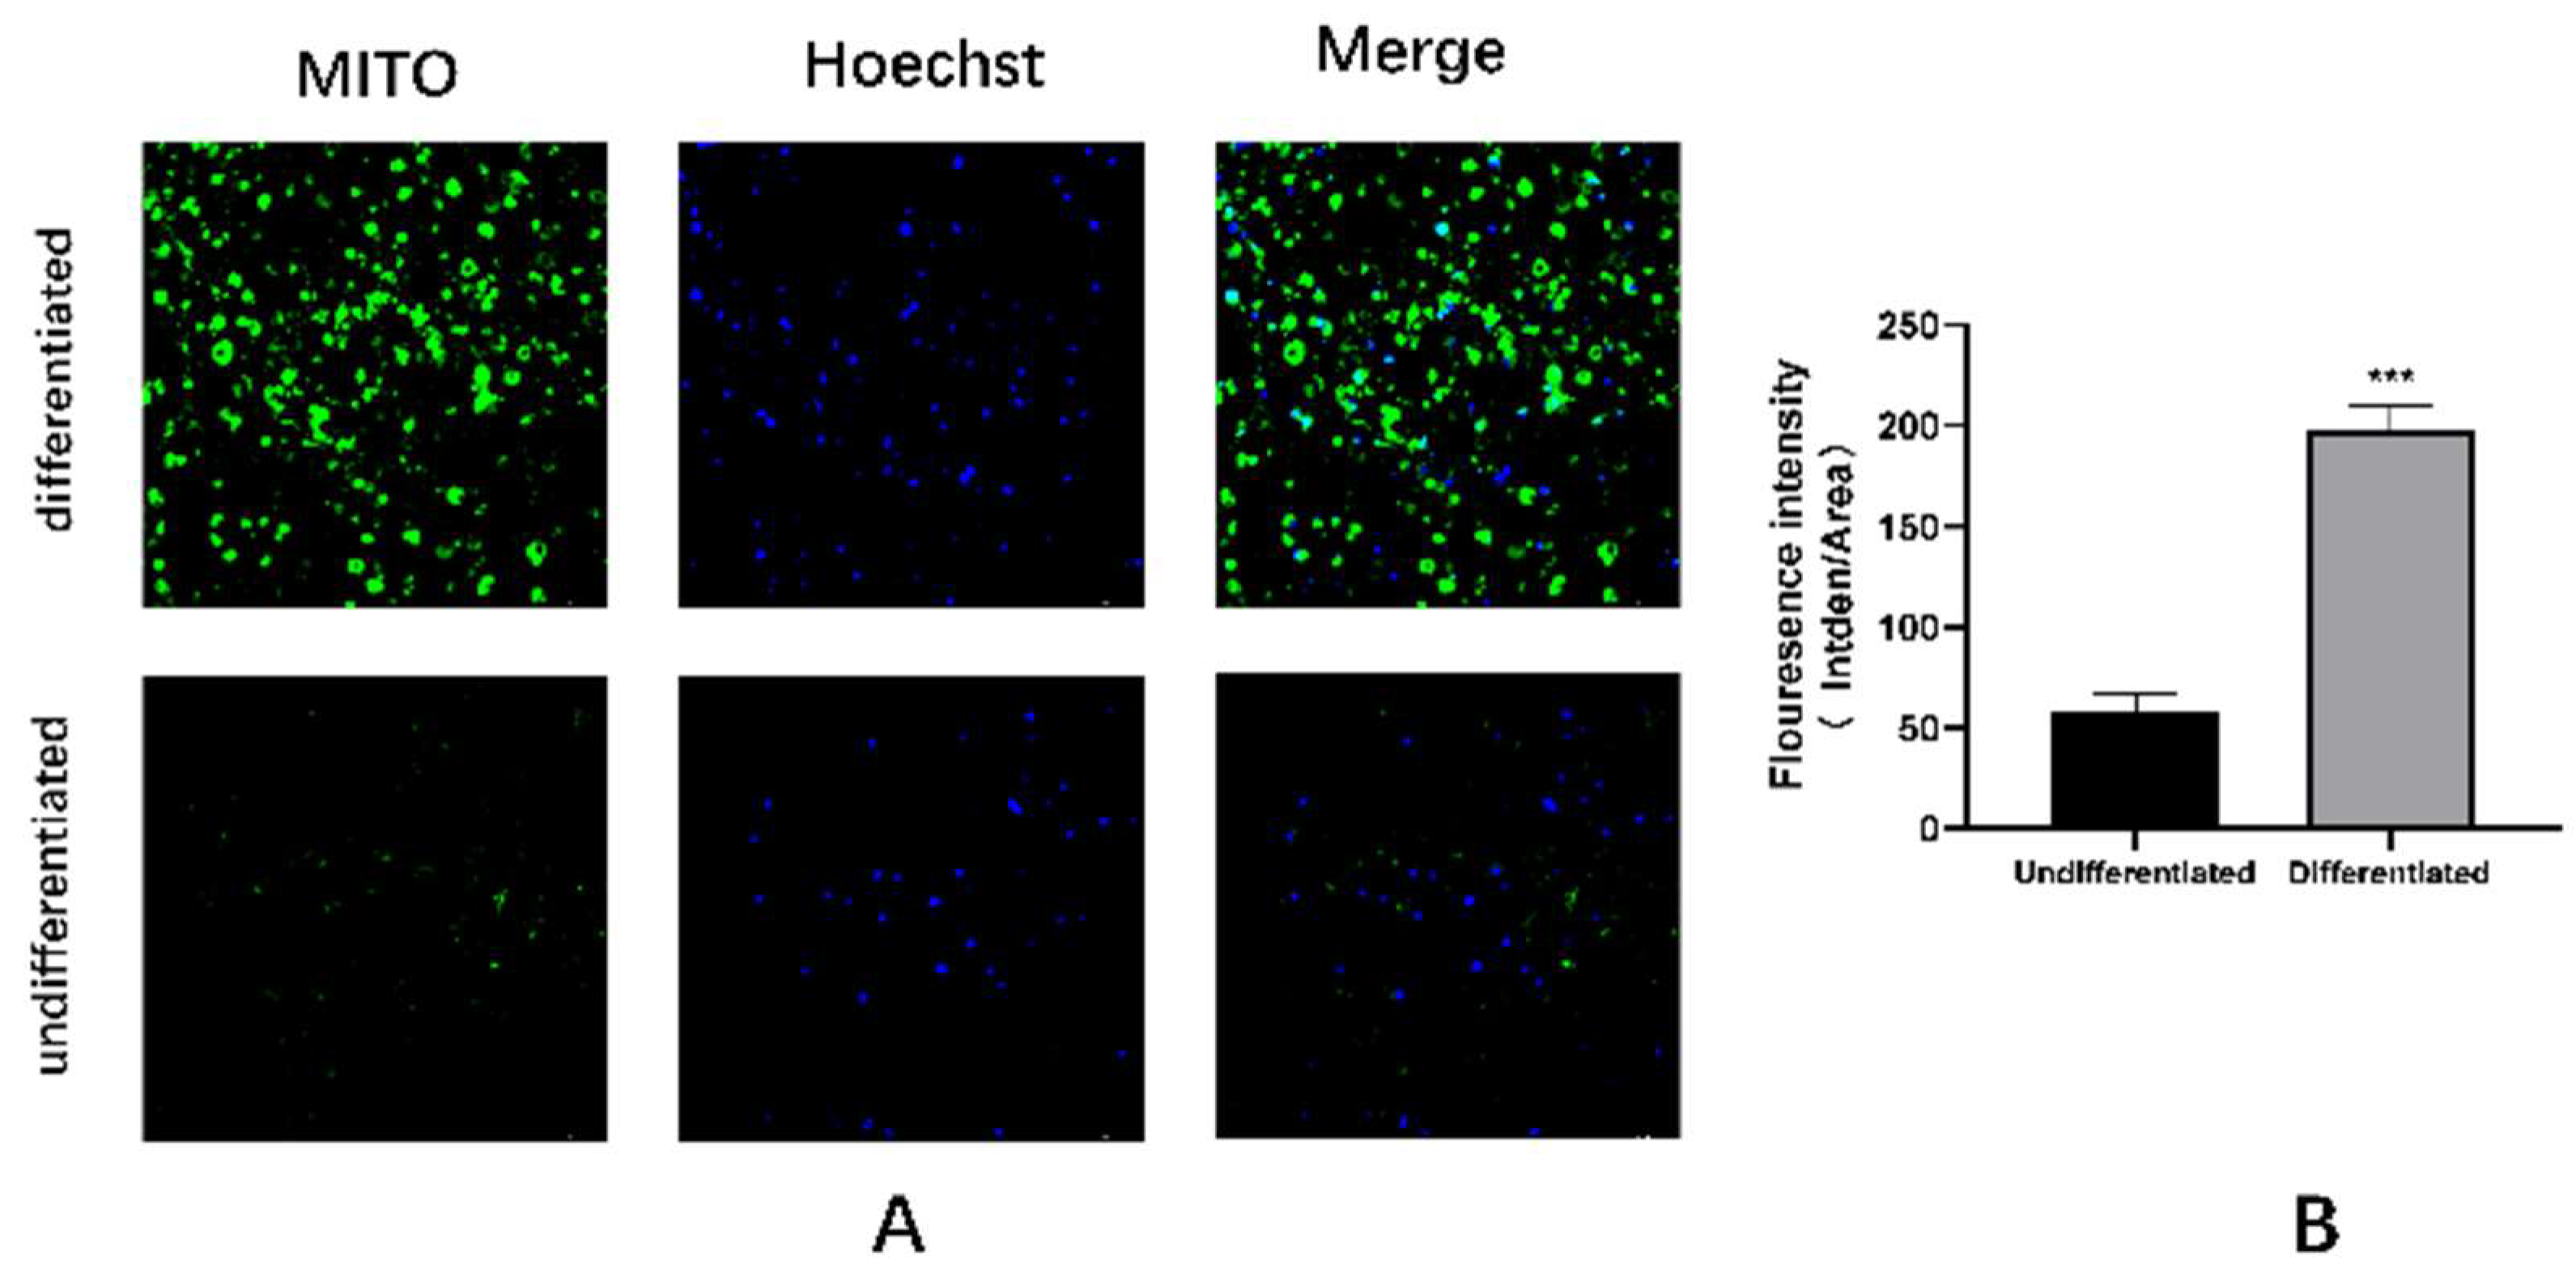
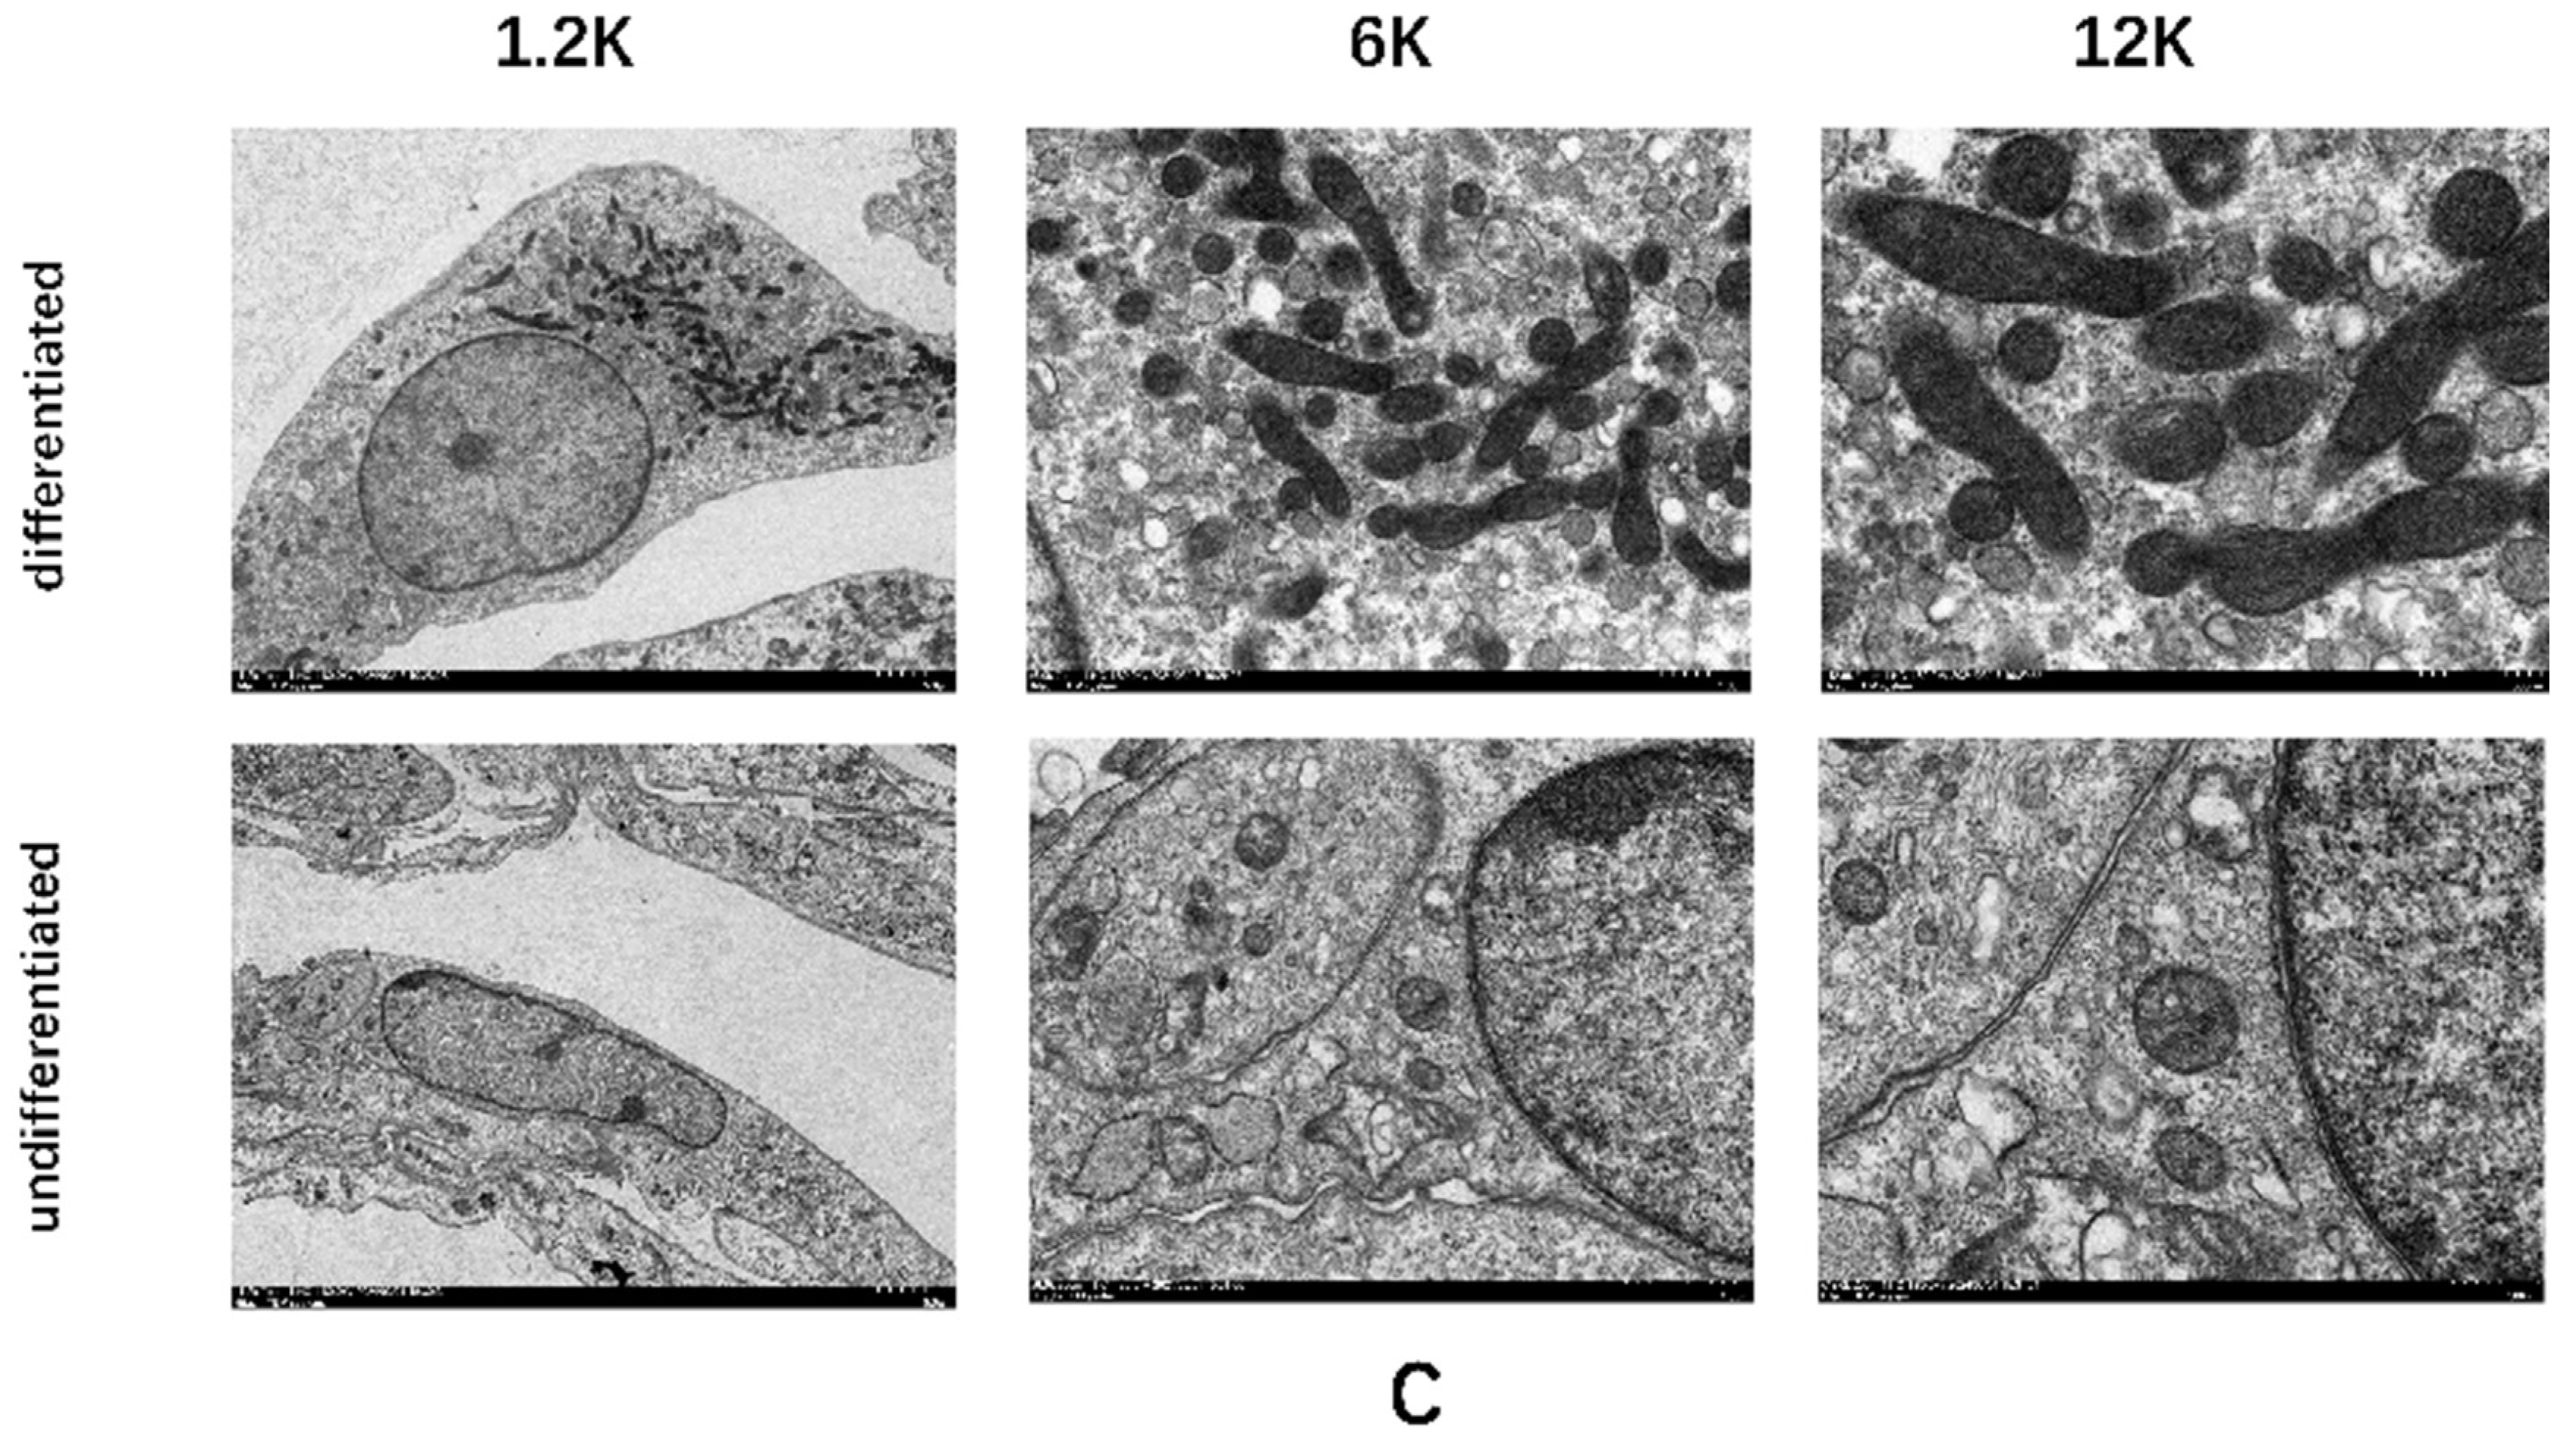
Figure A3), mitochondrial probes, and electron microscopy(
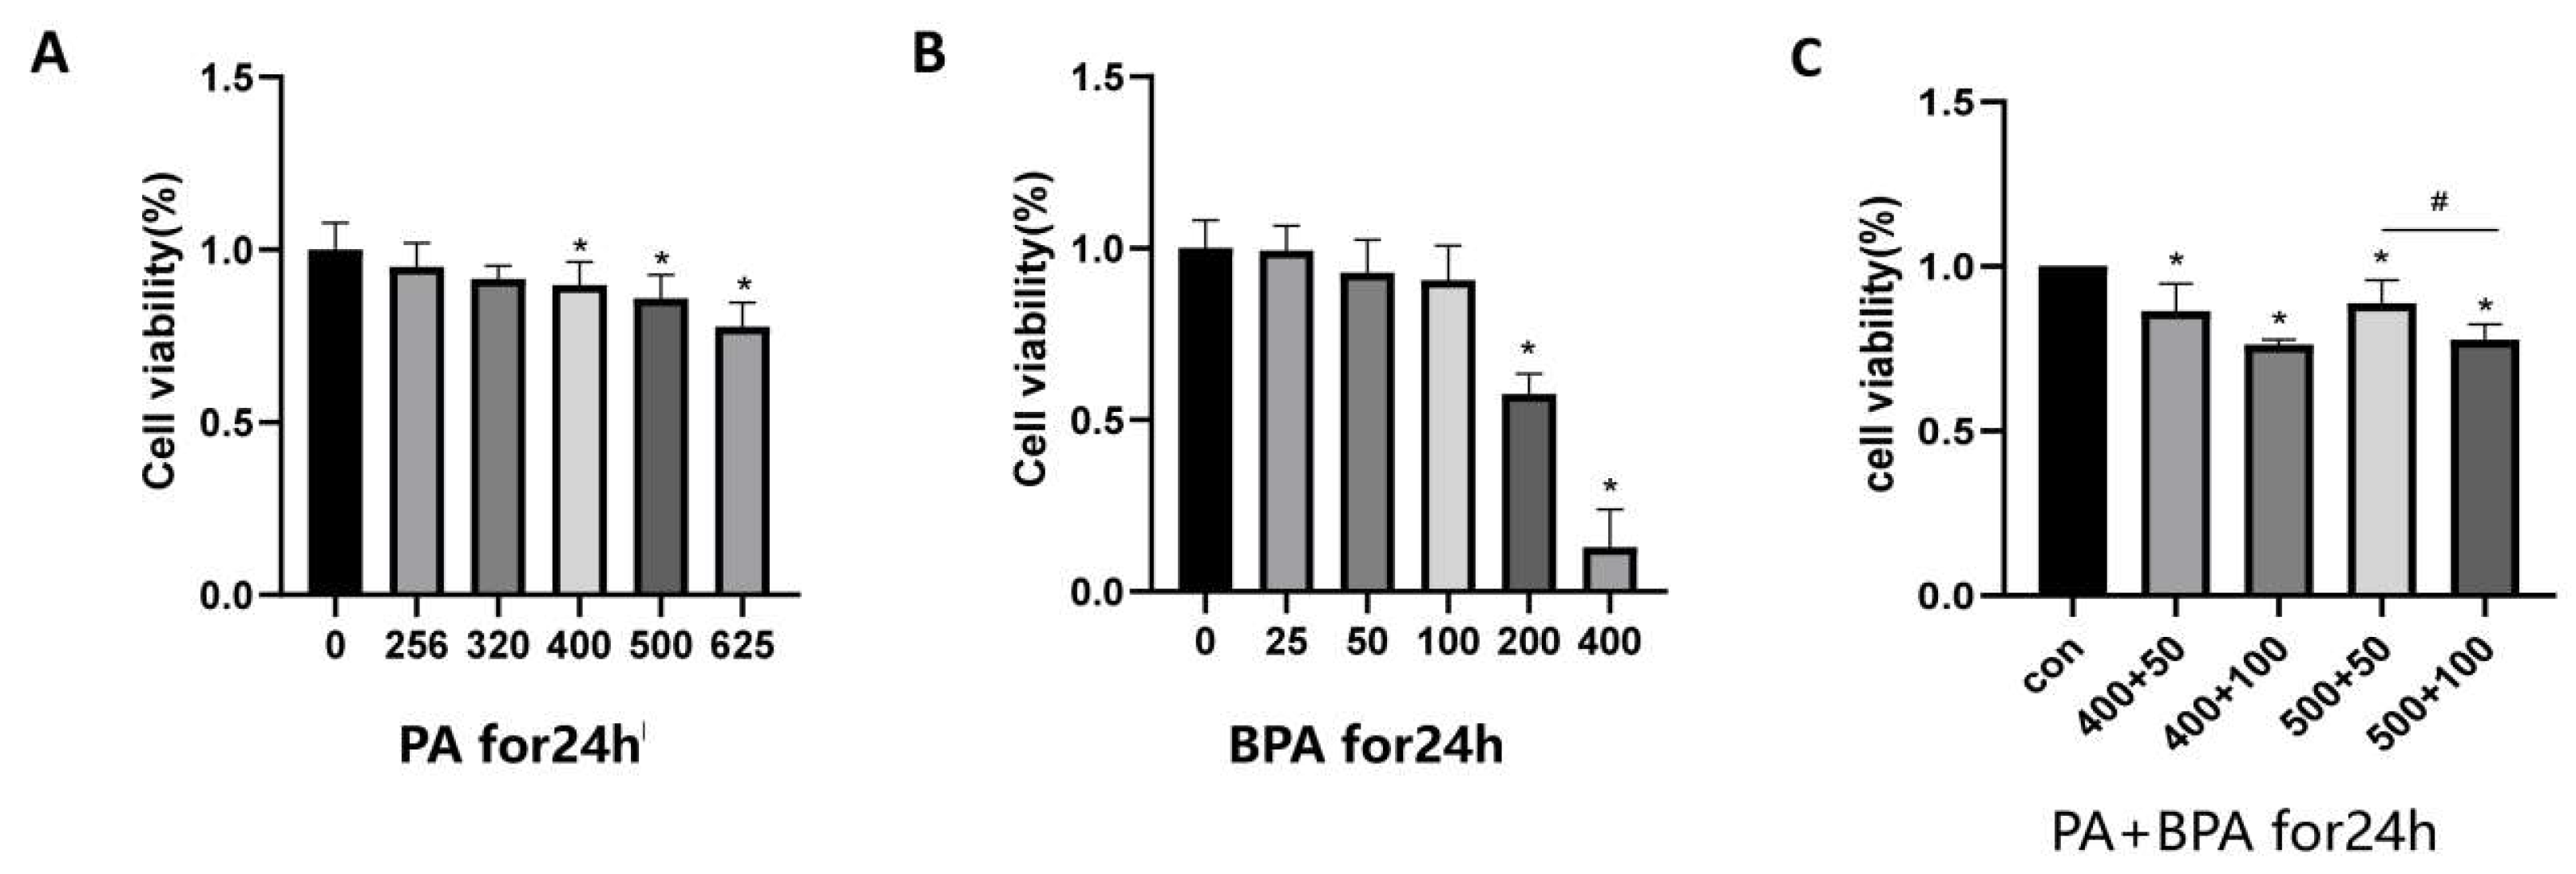
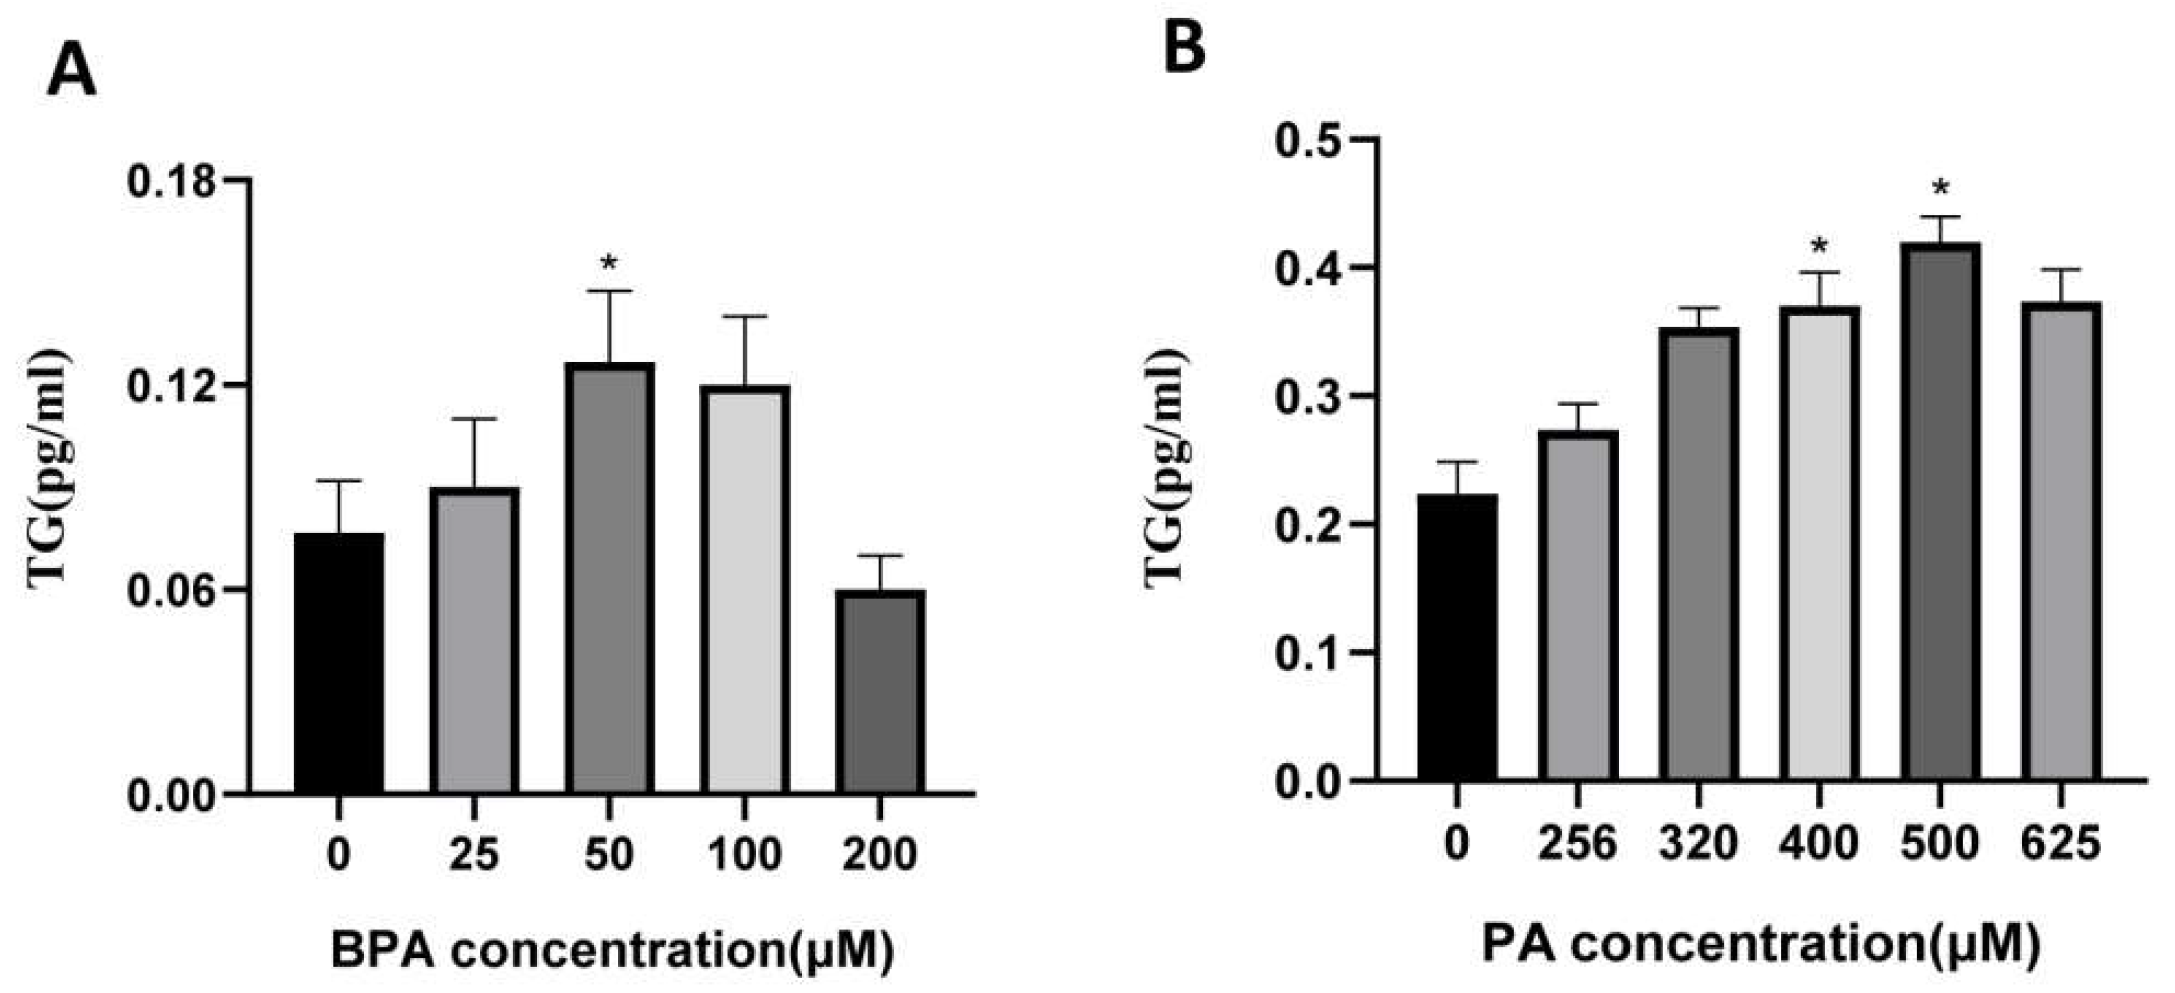
Figure A4). The best doses for combined exposure to BPA and PA were determined by measuring triglyceride accumulation using the CCK-8 method (
Figure B1)and triglyceride lipase assay(
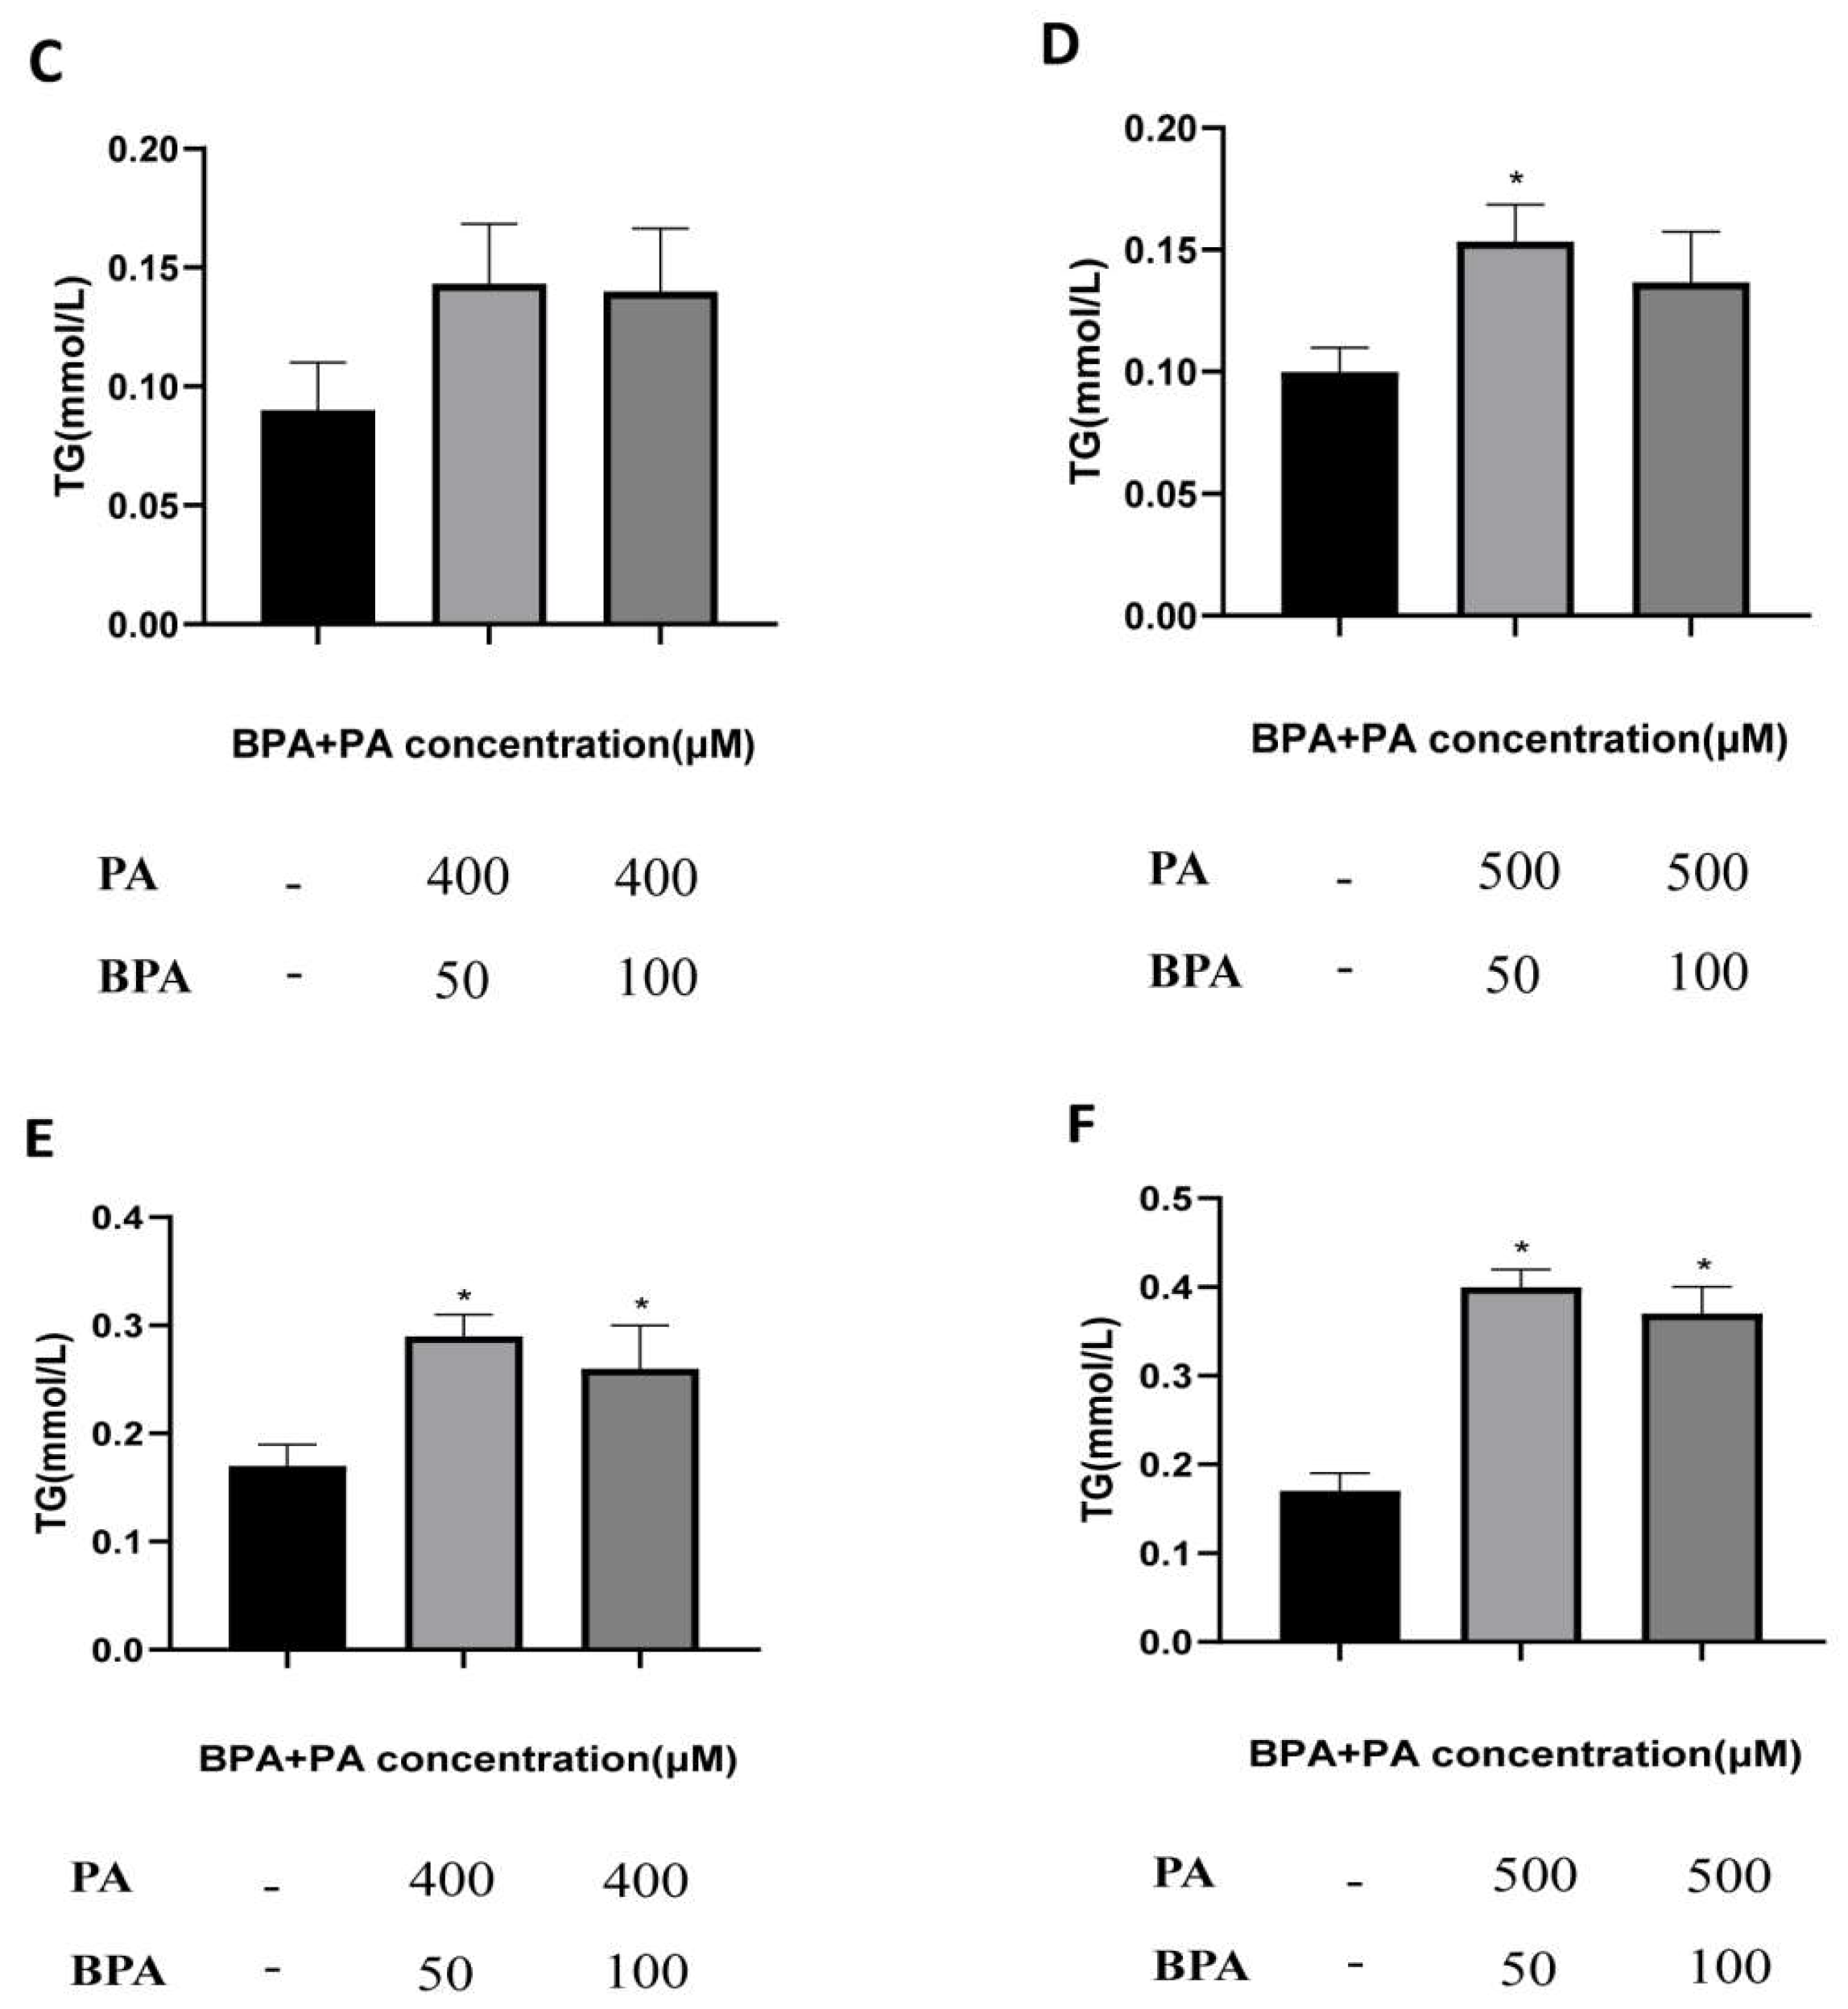
Figure B2). The cell experiment was divided into four groups: (a) control group, (b) BPA group: 50 μM BPA, (c) PA group: 500 μM PA, (d) BPA + PA group: 50 μM BPA + 500 μM PA.
2.3. Cell Viability Assay
Place the mature brown adipocytes into MEM containing 10% FBS and incubate overnight in a 96-well plate. Then treat the cells with PA (256, 320, 400, 500, 625 μM) and BPA (25, 50, 100, 200, 400 μM) for 24 hours. After that, add 100 μl of CCK-8 working solution (90 μl complete culture medium + 10 μl CCK-8 solution) to each well, and incubate under conditions of 37°C and 5% CO2 for 30 minutes. Measure the absorbance at 450 nm using a microplate reader to calculate cell viability. The formula for calculating cell viability is: Cell viability (%) = [ (Experimental well - Blank well) / (Control well - Blank well) ] × 100%.
2.4. HE Staining
Cut the paraffin-embedded brown adipose tissue blocks into 8 µm sections. After baking the slides, deparaffinize them in xylene, then gradually dehydrate in ethanol (75%, 85%, 95%, and 100%). Stain the sections using the Hematoxylin and Eosin (H&E) staining method, followed by dehydration and clearing. Finally, mount the slides with neutral resin and observe the pathological changes under an optical microscope.
2.5. ELISA
To measure the levels of inflammatory factors in brown adipose tissue and cells (tumor necrosis factor α (TNF-α) and IL-1β), mouse serum and cell supernatants were collected and subjected to incubation, washing, color development, reaction termination, and OD value measurement. After combined treatment with BPA and PA, the supernatants were collected by centrifugation, and ELISA was used to measure the levels of IL-1β, and TNF-α, with each experiment repeated three times.
2.6. Immunohistochemistry
After cutting sections from paraffin blocks of brown adipose tissue, the slides underwent deparaffinization, rehydration, antigen retrieval, circled marking, blocking, and incubation with primary antibodies IL-1β (1:100 dilution, CST, 12242), MCP1 (1:1000 dilution, CST, 59333), and TNF-α (1:300 dilution, Abcam, ab6671). This was followed by incubation with secondary antibodies, DAB chromogenic reaction, counterstaining, dehydration, and clearing. Finally, the slides were mounted with neutral gum, and observations were made under a microscope, with photographs taken for records.
2.7. Immunofluorescence
Cut 8 µm sections from paraffin blocks of brown adipose tissue and deparaffinize and rehydrate the slides. Microwave the repair solution and let it sit twice, followed by washing with PBS. Permeabilize with Triton X-1en block and incubate with antibodies CD31 (1:100 dilution, Abcam, ab222783) and Isolectin GS-B4 (IB4+) (1:200 dilution, Invitrogen, I32450). Incubate the secondary antibody in the dark, stain the nuclei with DAPI, and mount the slides. Images were captured using a fluorescence microscope, and the fluorescence intensity was quantified and analyzed.
2.8. Western Blotting
After extracting proteins from brown adipose tissue and cells, the protein concentrations were quantified using the BCA method. Following this, standard electrophoresis was performed, and after transferring to a membrane and blocking, diluted primary antibodies were added: UCP1 (1:1,000 dilution, CST, 72298), PGC-1α (1:1,000 dilution, Abcam, ab106814), PRDM16 (1:1,000 dilution, Abclonal, A18633), PPARγ (1:1,000 dilution, CST, 2435), GAPDH (1:3,000 dilution, CST, 5174), VEGFA (1:1,000 dilution, Abcam, ab46154), VEGFR2 (1:1,000 dilution, CST, 9698), PI3K (1:1,000 dilution, CST, 4257), P-PI3K (1:1,000 dilution, CST, 17366), AKT (1:1,000 dilution, CST, 4685), and P-AKT (1:1,000 dilution, CST, 4060). This mixture was placed on a shaker and incubated overnight at 4°C. After that, a solution of 2.5% non-fat milk and horseradish peroxidase-conjugated goat anti-rabbit secondary antibody (1:2,000 dilution, CST, 4970) was used to detect the binding of the primary antibodies, and this was incubated at room temperature for 2 hours before developing the results. After development, the band results were saved.
2.9. Statistical Analysis
The experimental indicators for quantitative data are expressed as mean ± standard deviation (x ±s), and statistical analysis was performed using SPSS 25.0 software. Mouse weight data were analyzed using repeated measures ANOVA, while comparisons between the two groups in animal and cell experiments were conducted using independent samples t-test. For comparisons among multiple groups, one-way ANOVA was used. When there were statistically significant differences between groups, the LSD method was employed to compare the differences between each experimental group and the control group.The probability p values < 0.05 were considered to be statistically significant.
3. Results
3.1. BPA and High-Fat Diet Treatment Cause Weight Gain and Obesity in Mice
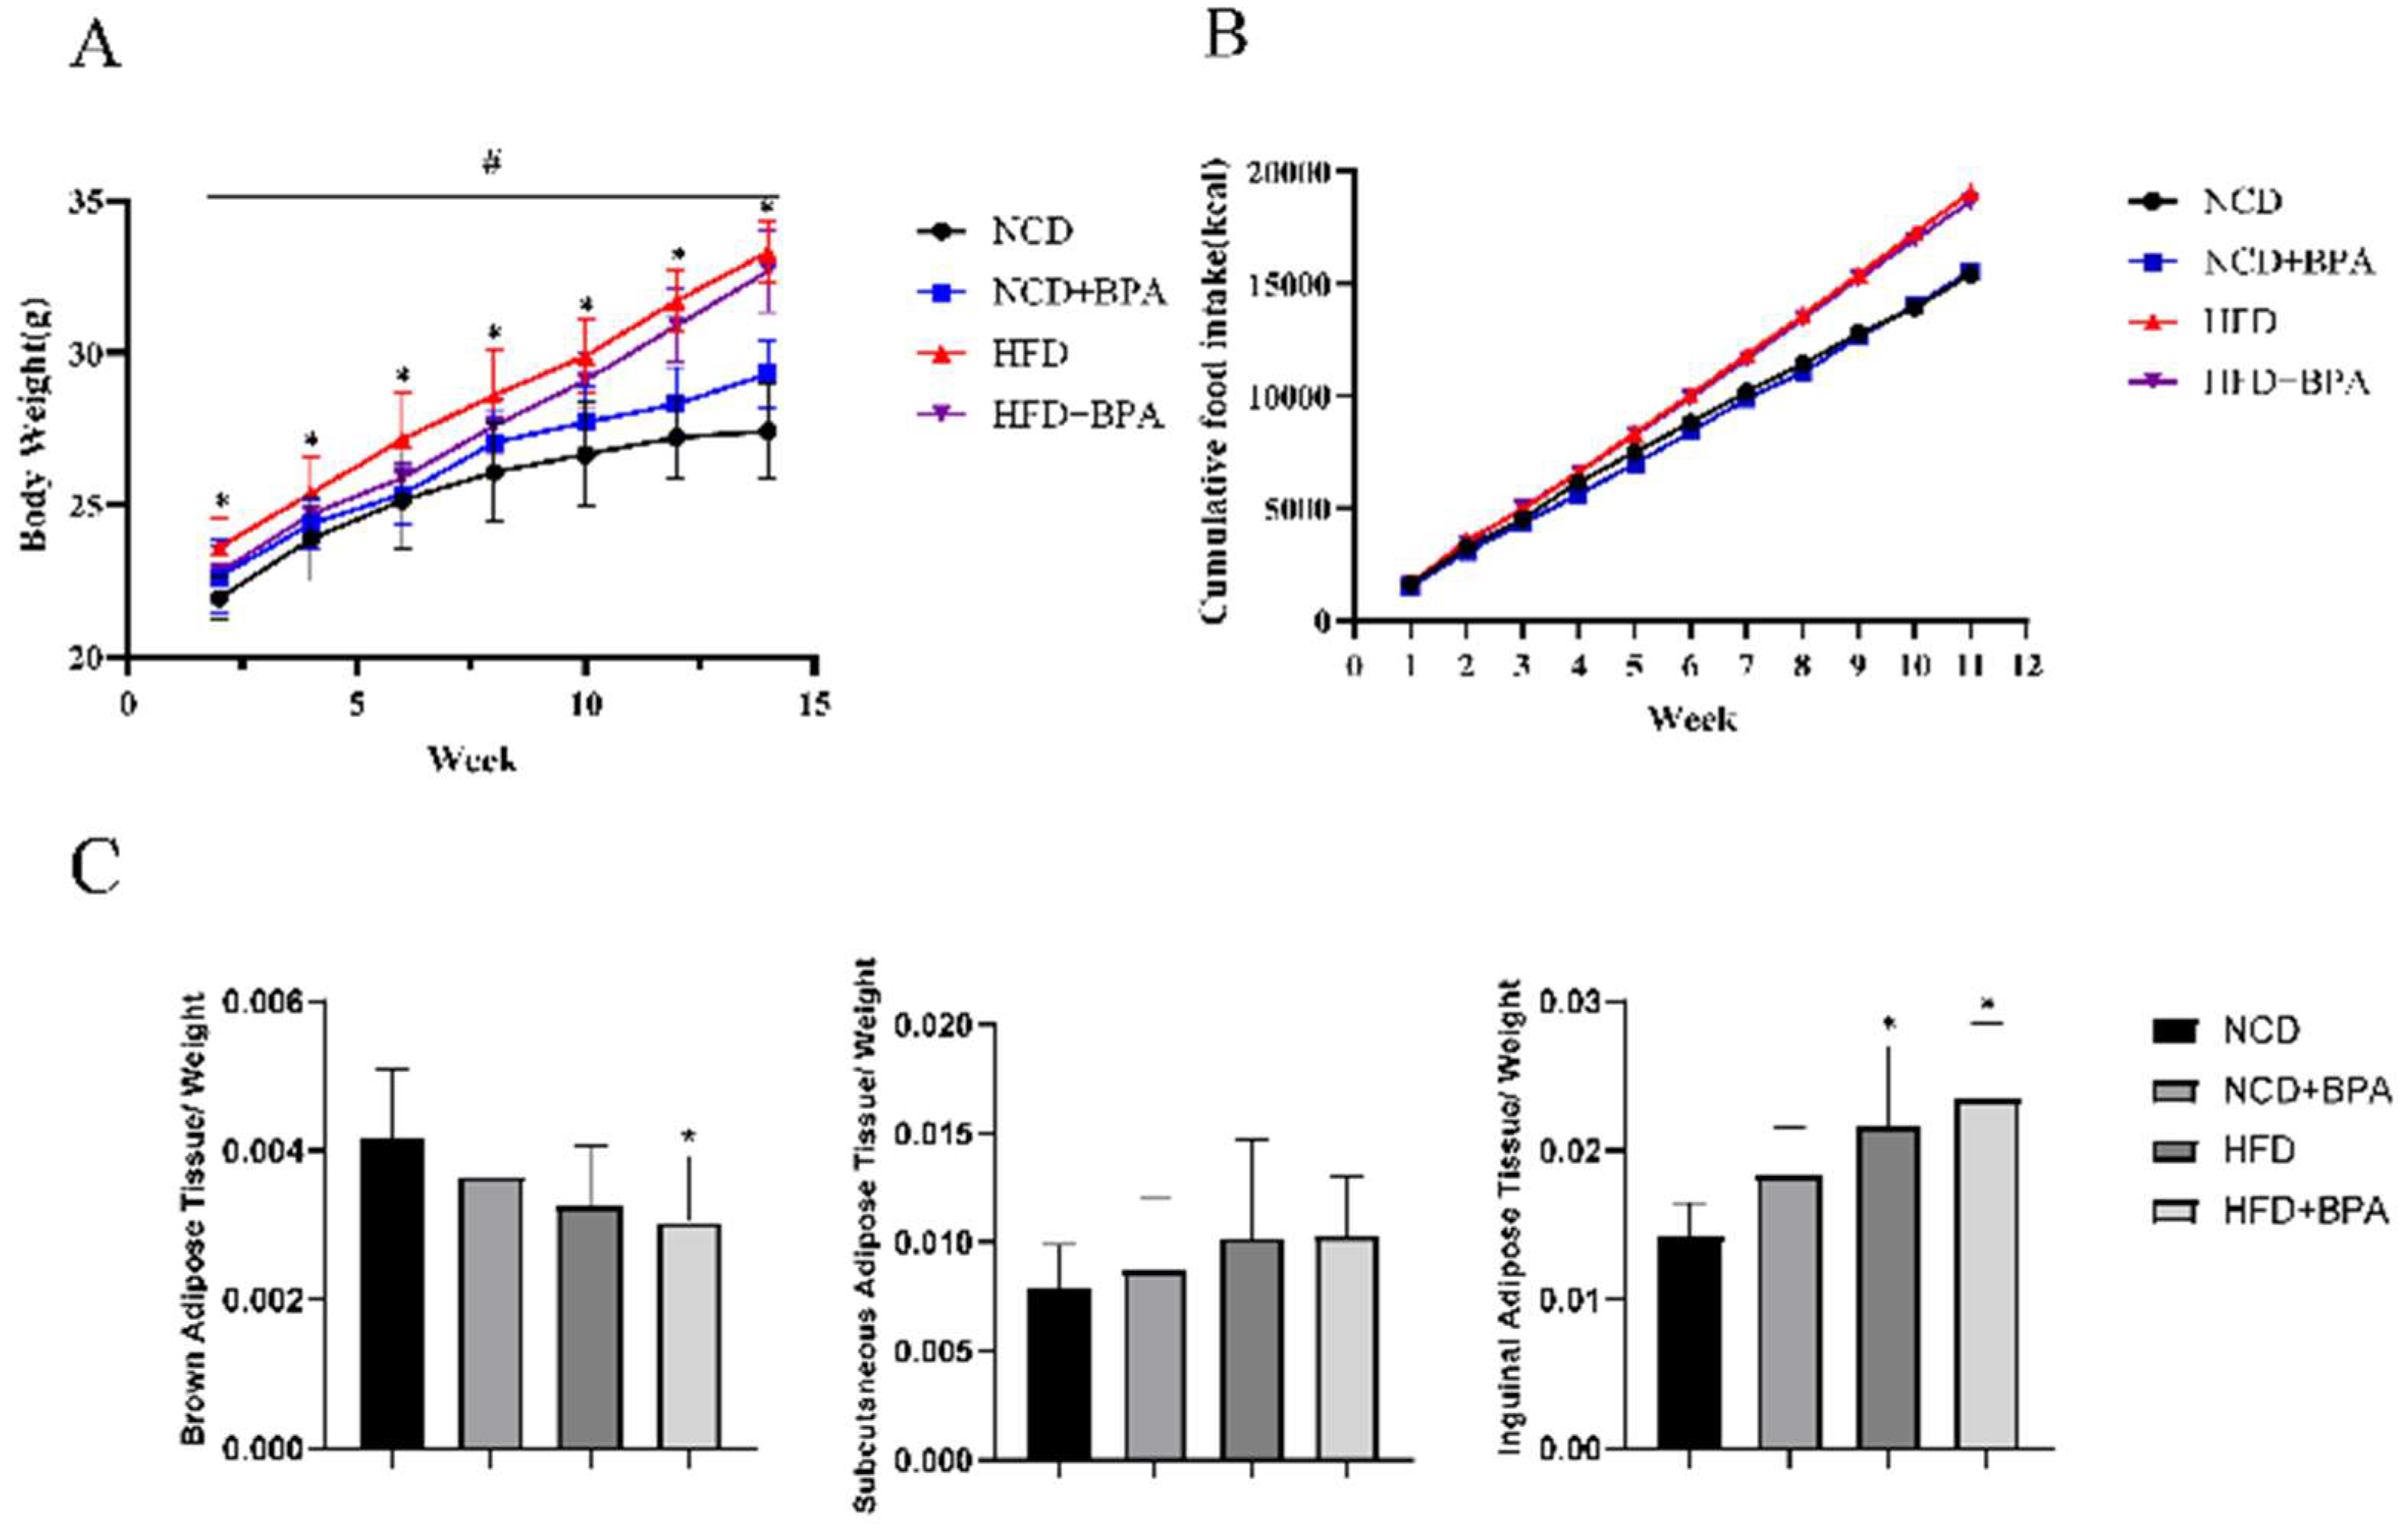
Combined treatment with BPA and a high-fat diet significantly promoted weight gain and the occurrence of obesity in mice, as evidenced by a gradual increase in body weight. The fasting average weight of the high-fat group exceeded that of the control group by 20.68%. The effects of different treatments on mouse body weight showed significant differences over time, particularly with the high-fat treatment group exhibiting marked weight gain (
Figure 1A, p < 0.05). Additionally, cumulative caloric intake from food was significantly increased (
Figure 1B, p < 0.05). Furthermore, BPA and high-fat diet treatment altered the fat organ coefficients in mice, especially for brown adipose tissue and inguinal fat (
Figure 1C, p < 0.05), while having little effect on subcutaneous fat. These results indicate that the combined effects of BPA and a high-fat diet lead to weight gain and changes in fat distribution in mice.
3.2. BPA and High-Fat Diet Treatment Cause Dyslipidemia in Mice
The combined treatment with BPA and a high-fat diet significantly elevated serum total cholesterol (TC) levels and exhibited a significant interaction effect; meanwhile, the high-fat diet significantly reduced high-density lipoprotein (HDL) levels (
Table 1, p < 0.05). However, the effects on triglycerides (TG) and low-density lipoprotein (LDL) levels were not significant. These results indicate that the combined effects of BPA and a high-fat diet increase the risk of dyslipidemia in mice.
3.3. Pathological Changes in Brown Adipose Tissue (BAT) in Mice Treated with BPA and a High-Fat Diet
As shown in
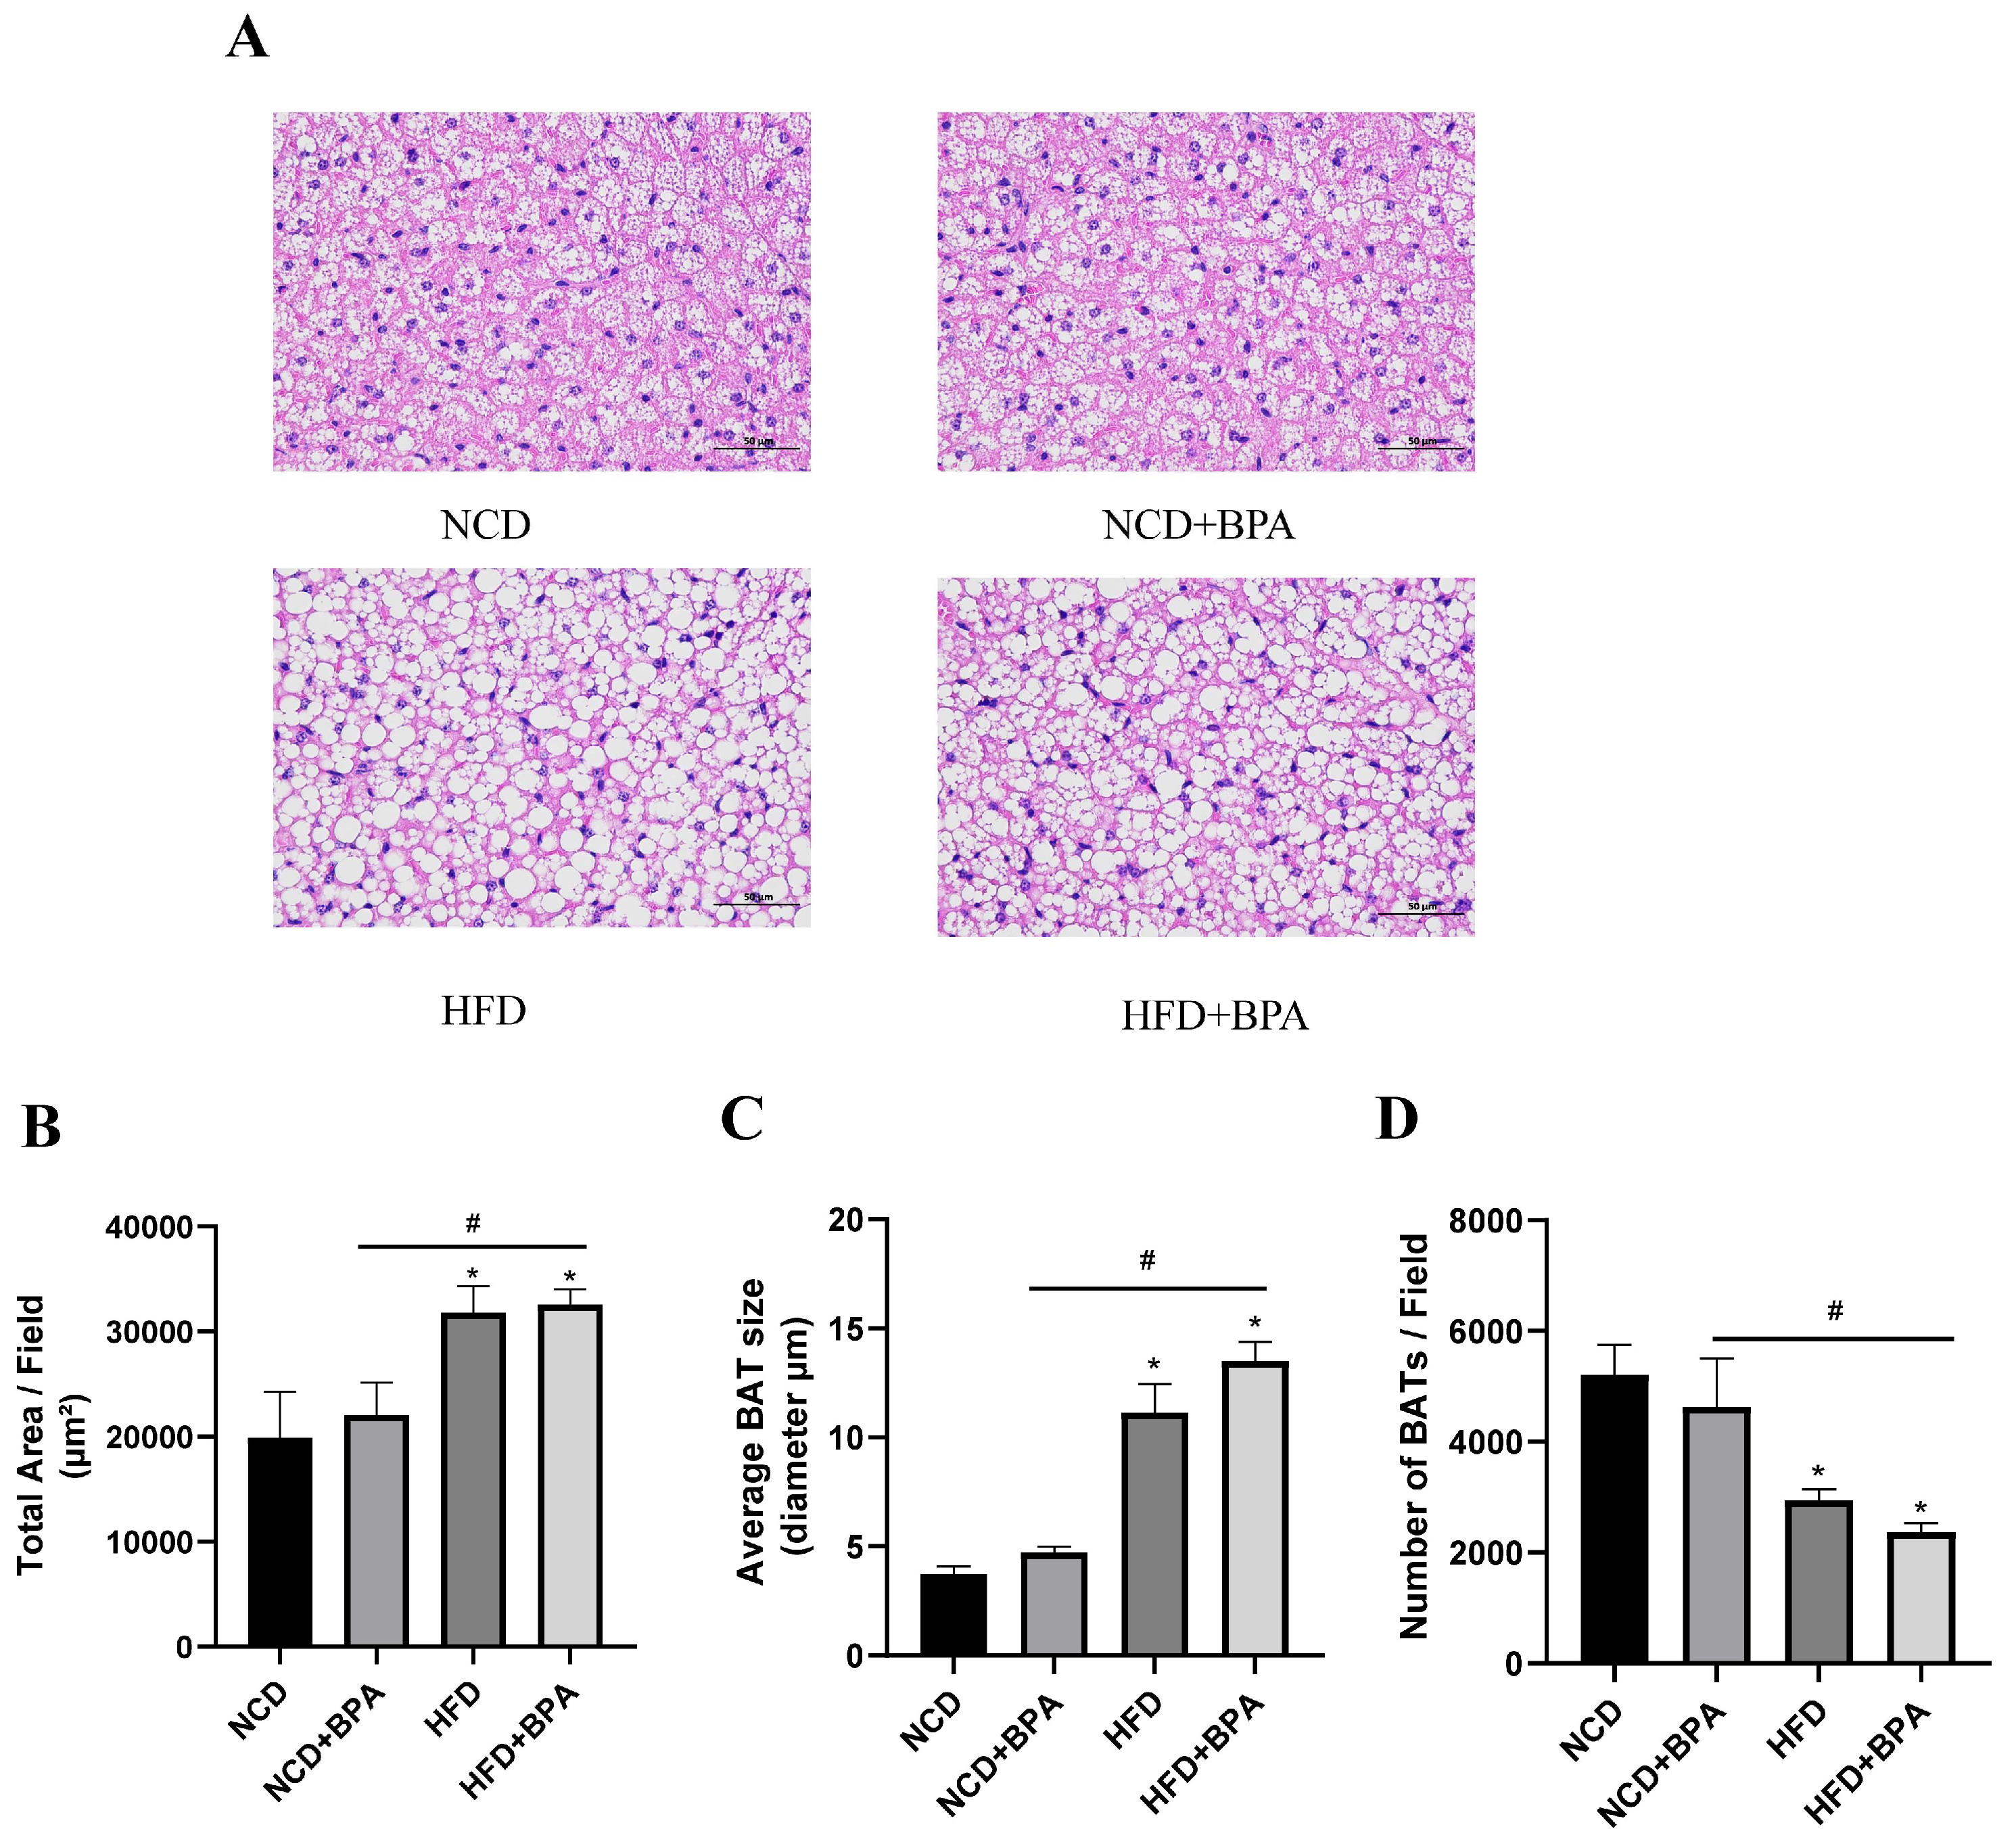
Figure 2A, the results of paraffin section HE staining of brown adipose tissue are presented.Compared with the NCD group, the cell structure changed from a reddish homogeneous tissue containing erythrophilic plasma to a structure surrounded by a small amount of loose connective tissue after BPA and high-fat diet treatment, and the area of lipid droplets in the cytoplasm was significantly increased (
Figure 2B, p < 0.05), the mean diameter was significantly increased (
Figure 2C, p < 0.05), and the number of lipid droplets was significantly decreased (
Figure 2D, p < 0.05). It was also observed that the distribution of capillaries in the brown adipose tissue gradually decreased, and the position of nucleoli within the nuclei became clearly visible. This suggests that the combination of high-fat and BPA treatment caused morphological and functional changes in the brown adipose tissue.
3.4. BPA and High-Fat Diet Treatment Increase the Expression Levels of Inflammatory Factors in Mice
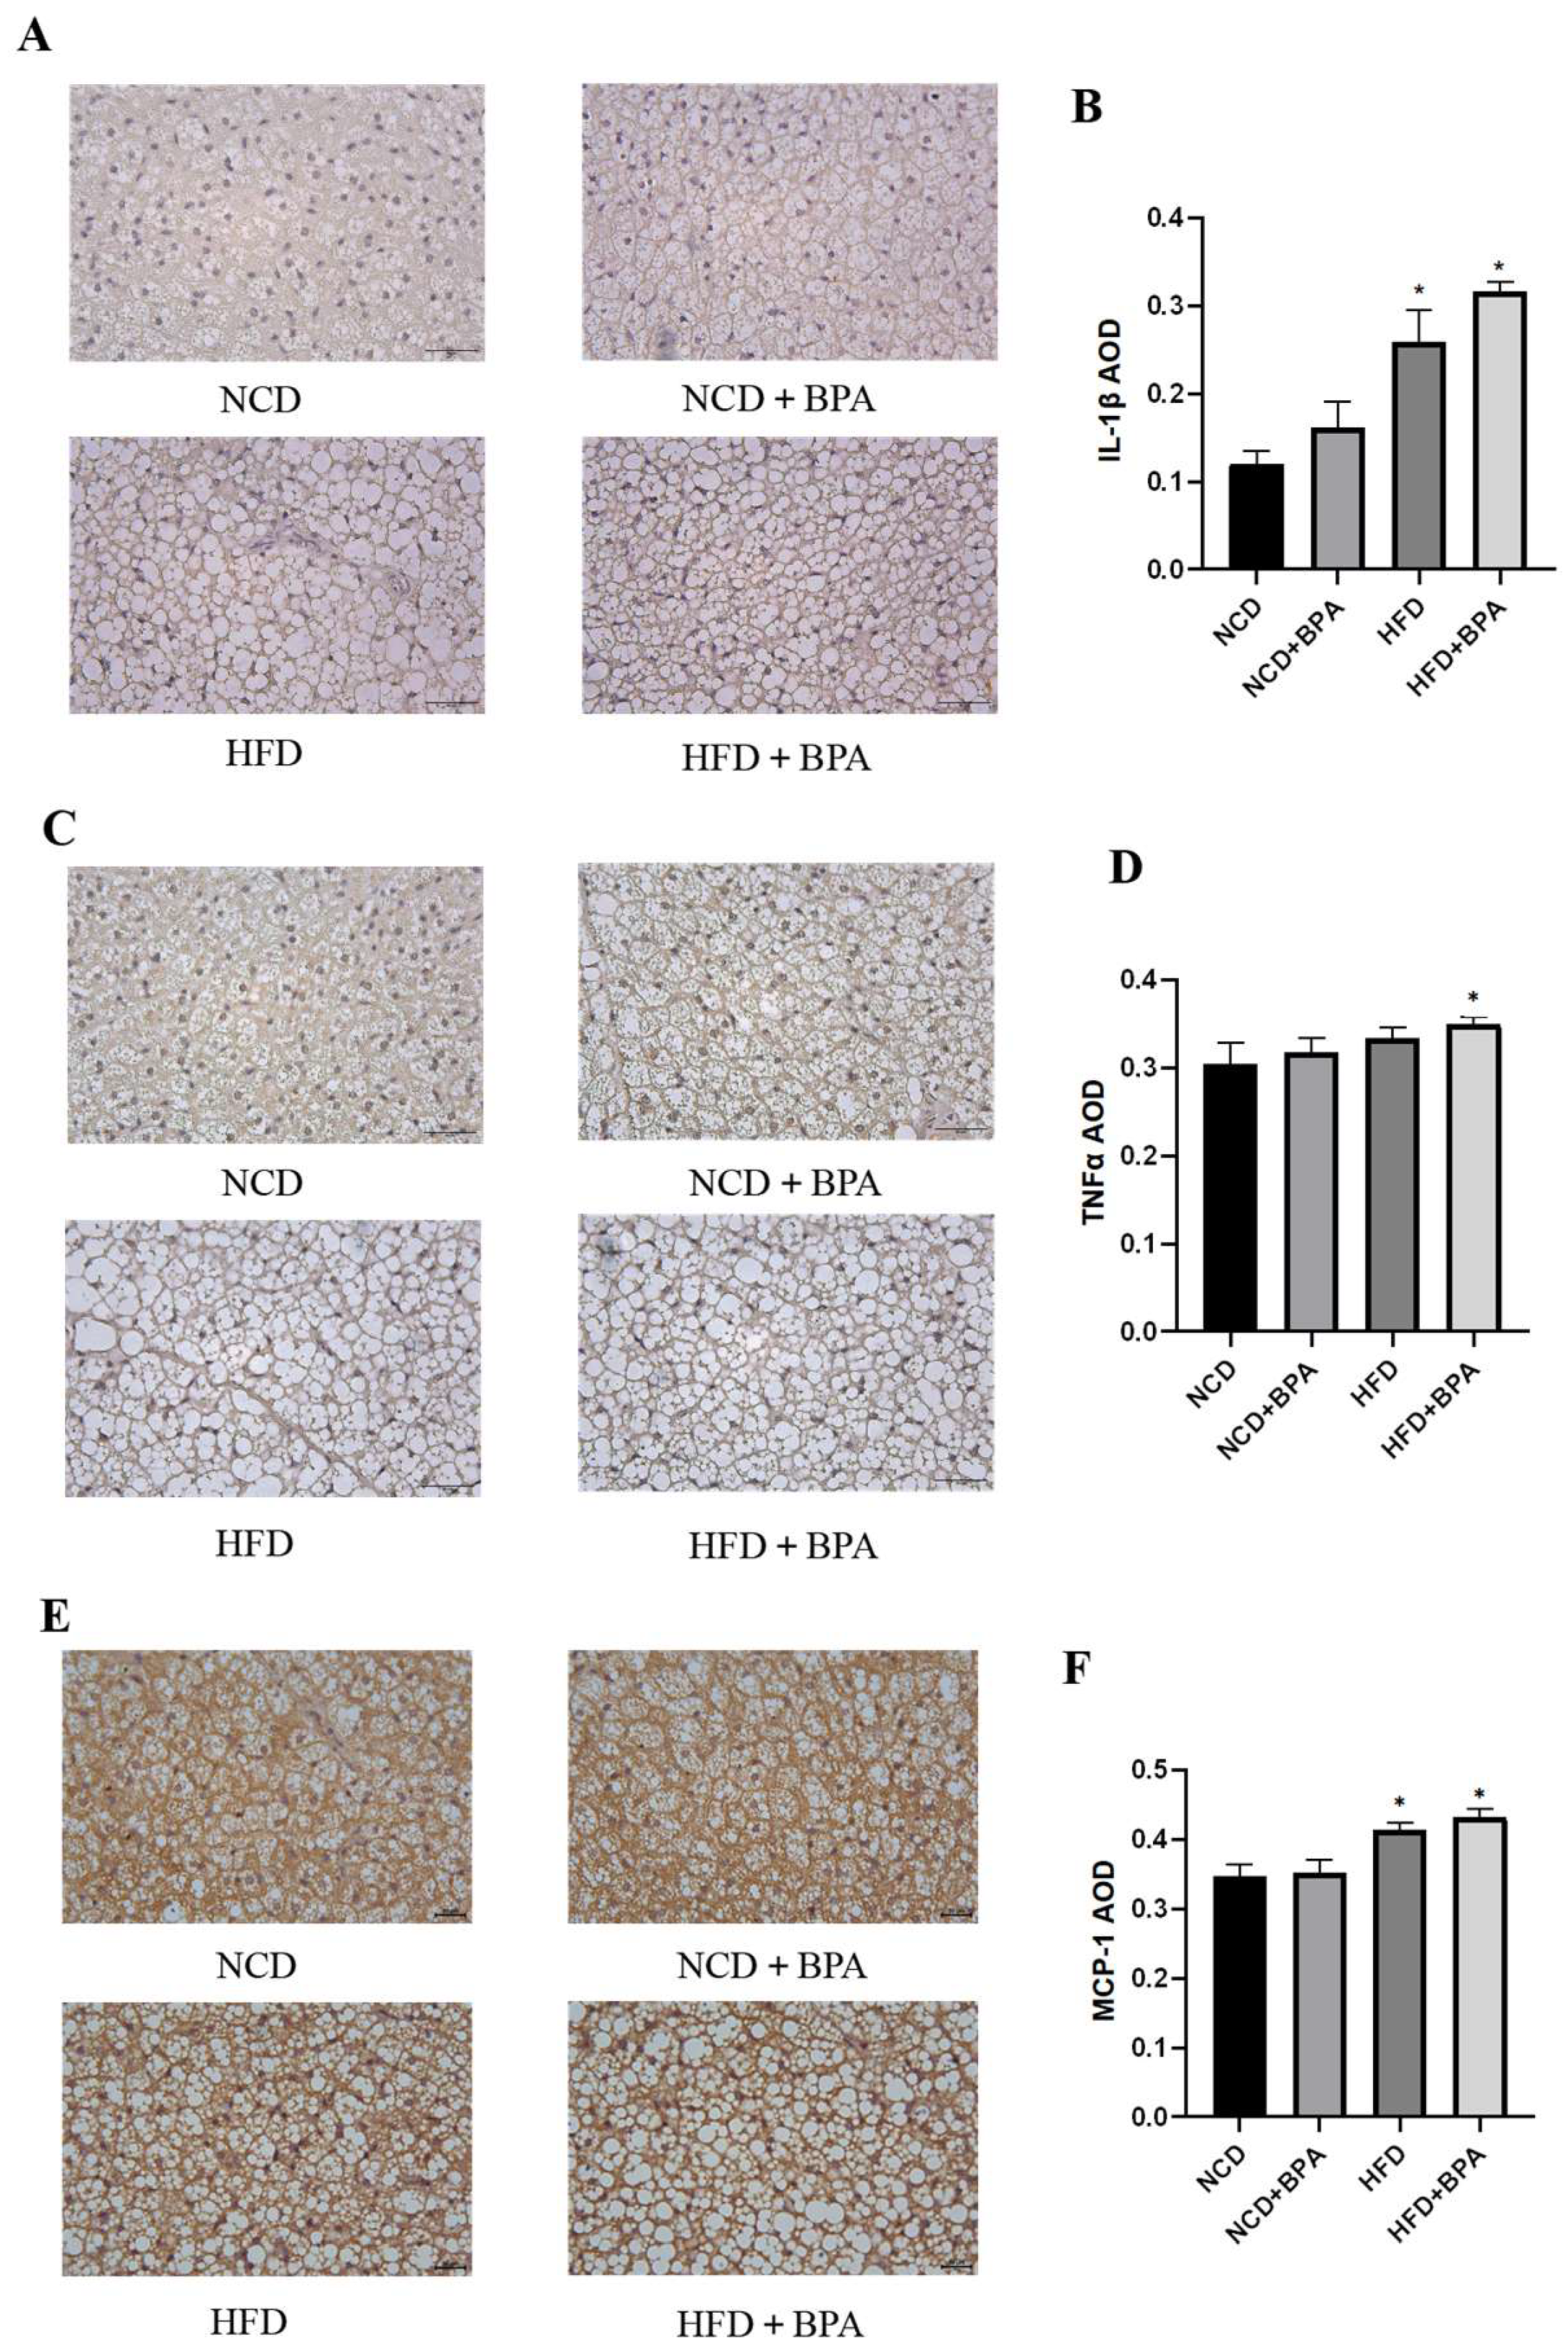
This study employed immunohistochemistry (IHC) to investigate the effects of bisphenol A (BPA) and a high-fat diet on the expression of inflammatory factors in mouse brown adipose tissue. The results indicated that under the combined influence of BPA and a high-fat diet, the expression levels of inflammatory factors such as IL-1β,TNF-α and MCP-1 in mouse brown adipose tissue were significantly increased (
Figure 3A–F, p < 0.05). Furthermore, enzyme-linked immunosorbent assay (ELISA) confirmed that after 24 hours of combined treatment with BPA and PA, the levels of IL-1β, TNF-α, and IL-6 in the supernatant of brown adipocytes were also significantly elevated (
Table 2, p < 0.05). These findings collectively suggest that BPA and high-fat diet treatment significantly promote the release of inflammatory factors in brown adipose tissue.
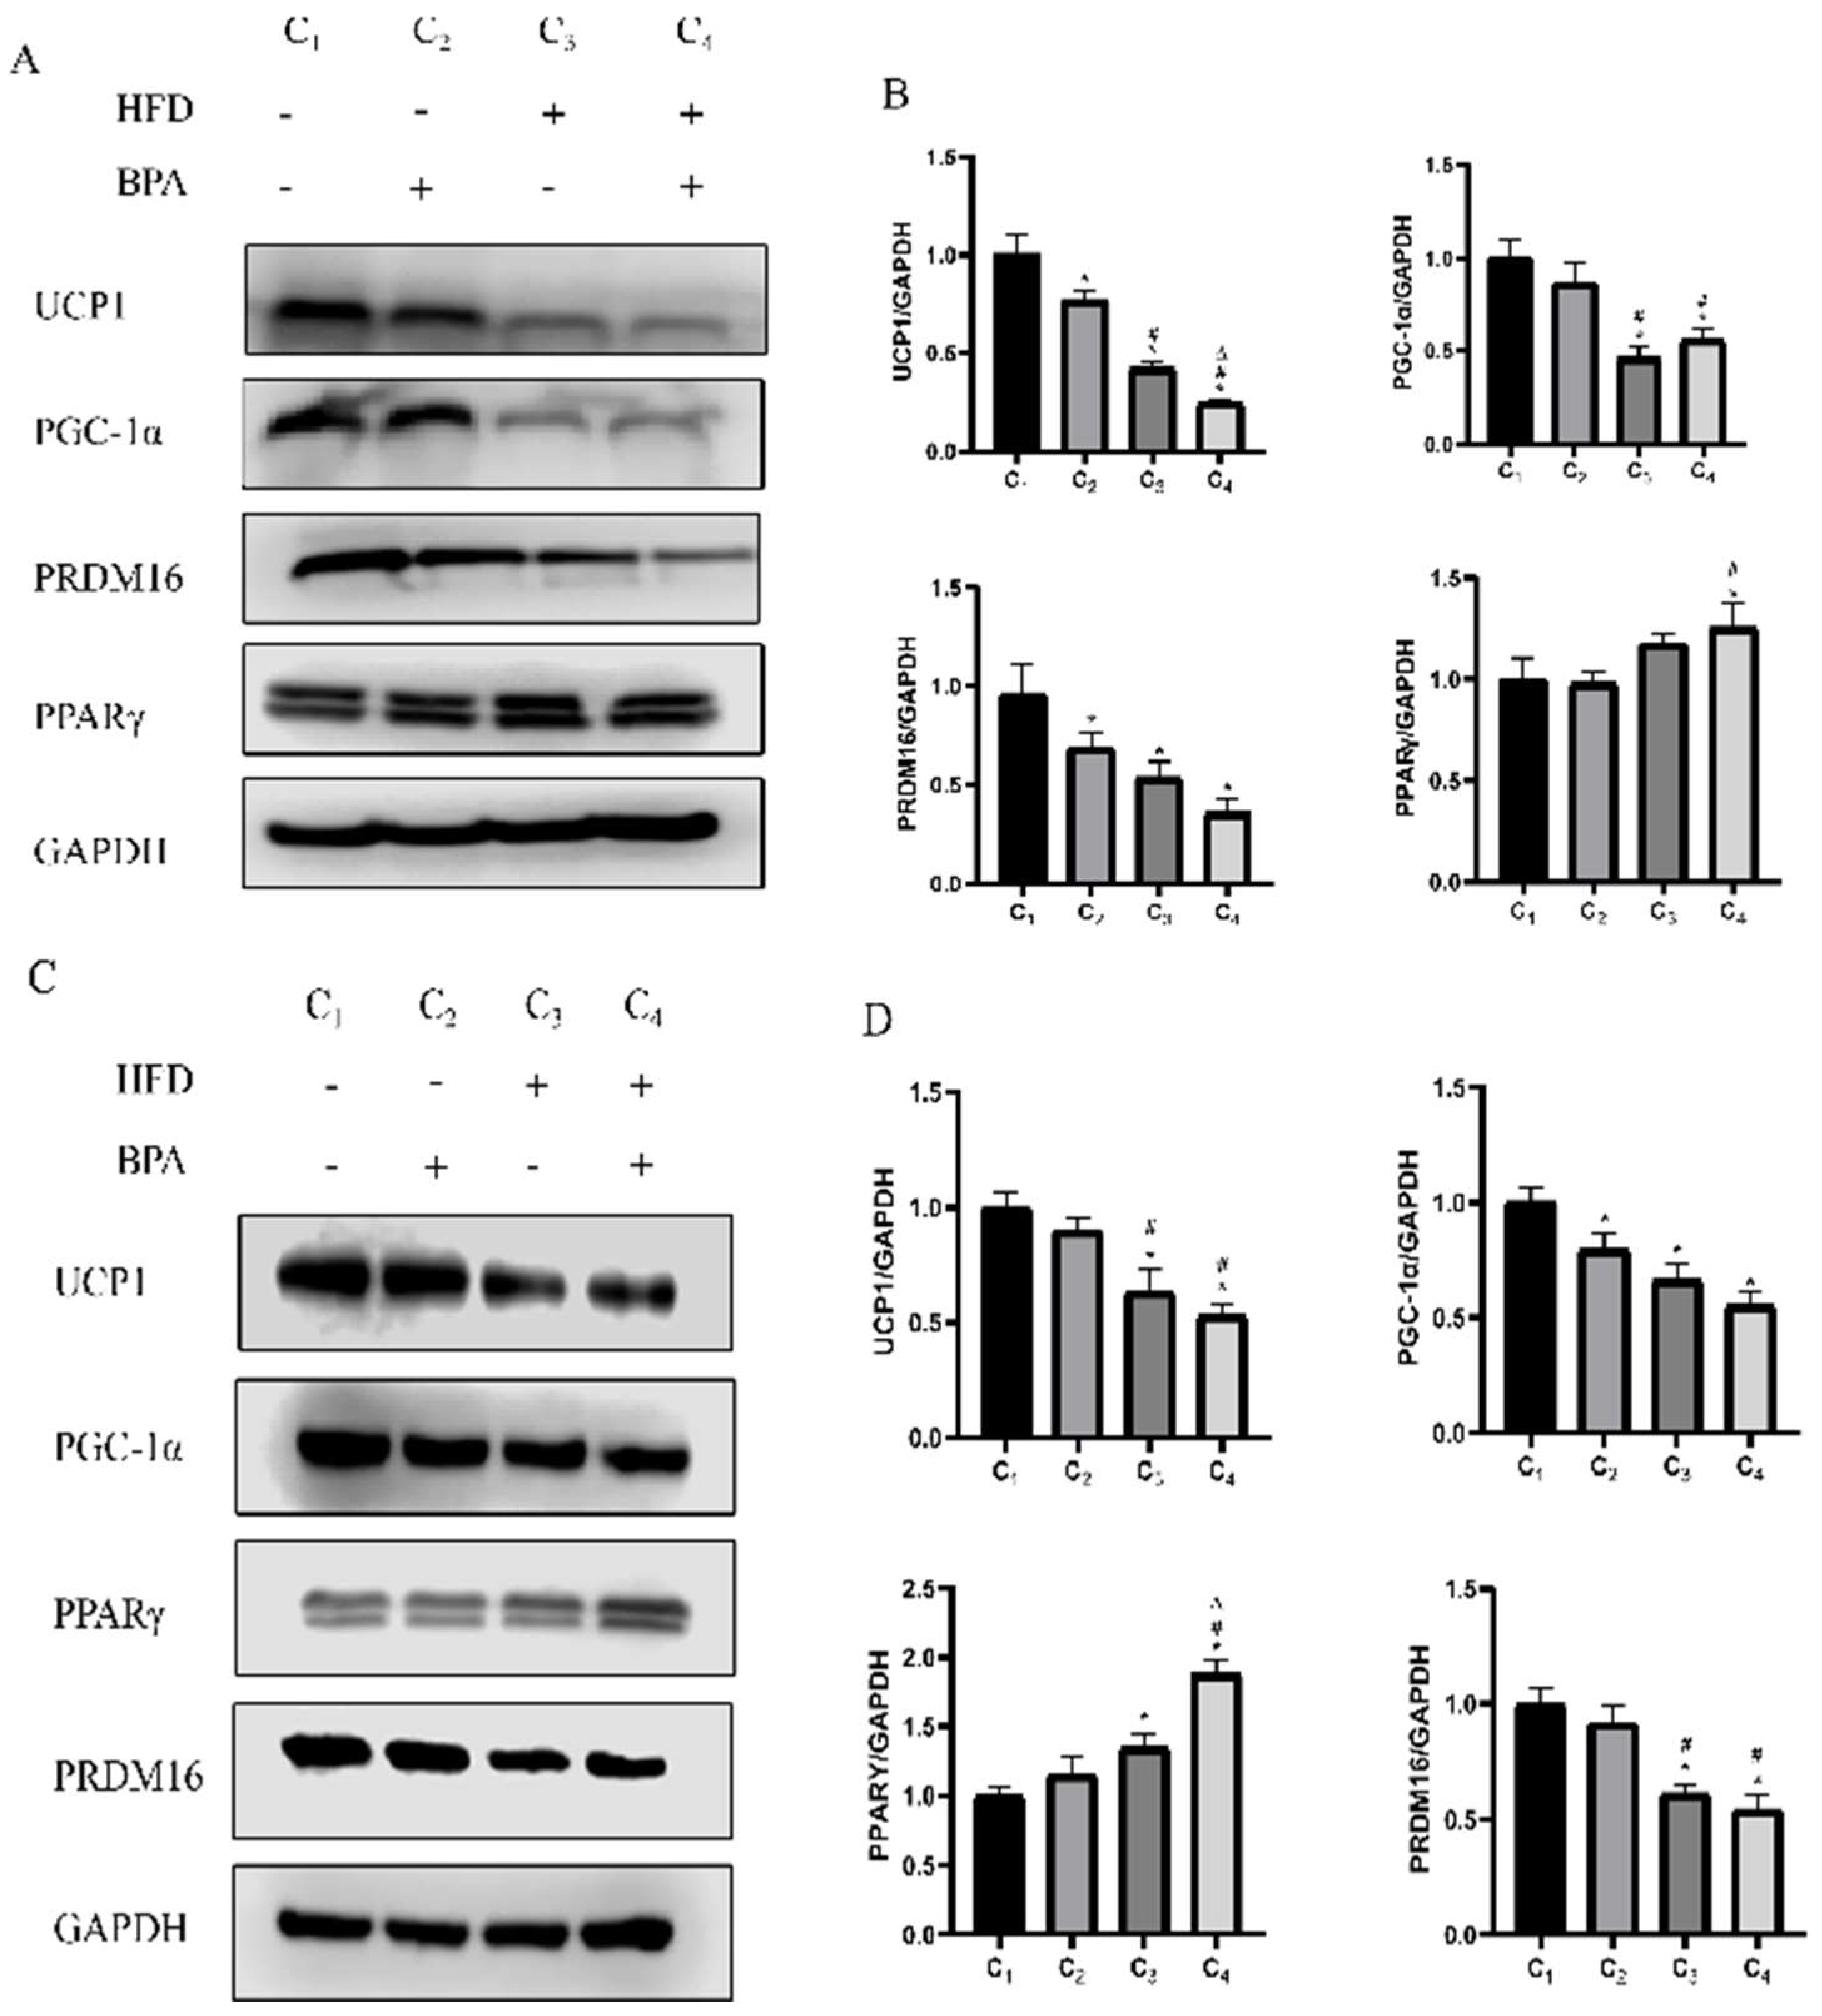
3.5. BPA and High-Fat Diet Reduce the Expression Levels of Thermogenic Factors
This study found through Western blotting experiments that in animal studies, there is no interaction between BPA and a high-fat diet (HFD) on the protein expression levels of thermogenic factors UCP1, PGC-1α, PRDM16, and PPARγ in brown adipose tissue (p > 0.05), but there are significant main effects on the expression of these factors. Specifically, both BPA and HFD significantly inhibited the protein expression of UCP1 and PRDM16,and HFD exhibits a suppressive effect on the expression of PGC-1α, while it has an upregulating effect on the expression of PPARγ (
Figure 4A,B, p < 0.05). Additionally, in cell experiments, co-treatment with BPA and PA also inhibited the expression of thermogenic-related proteins in brown adipocytes, particularly showing a significant decrease in the levels of UCP1, PGC-1α, and PRDM16, while PPARγ expression showed an increasing trend in the HFD group and HFD + BPA group (
Figure 4C,D, p < 0.05). These results indicate that BPA and high-fat diet treatment can synergistically inhibit the thermogenic function of brown adipose tissue.
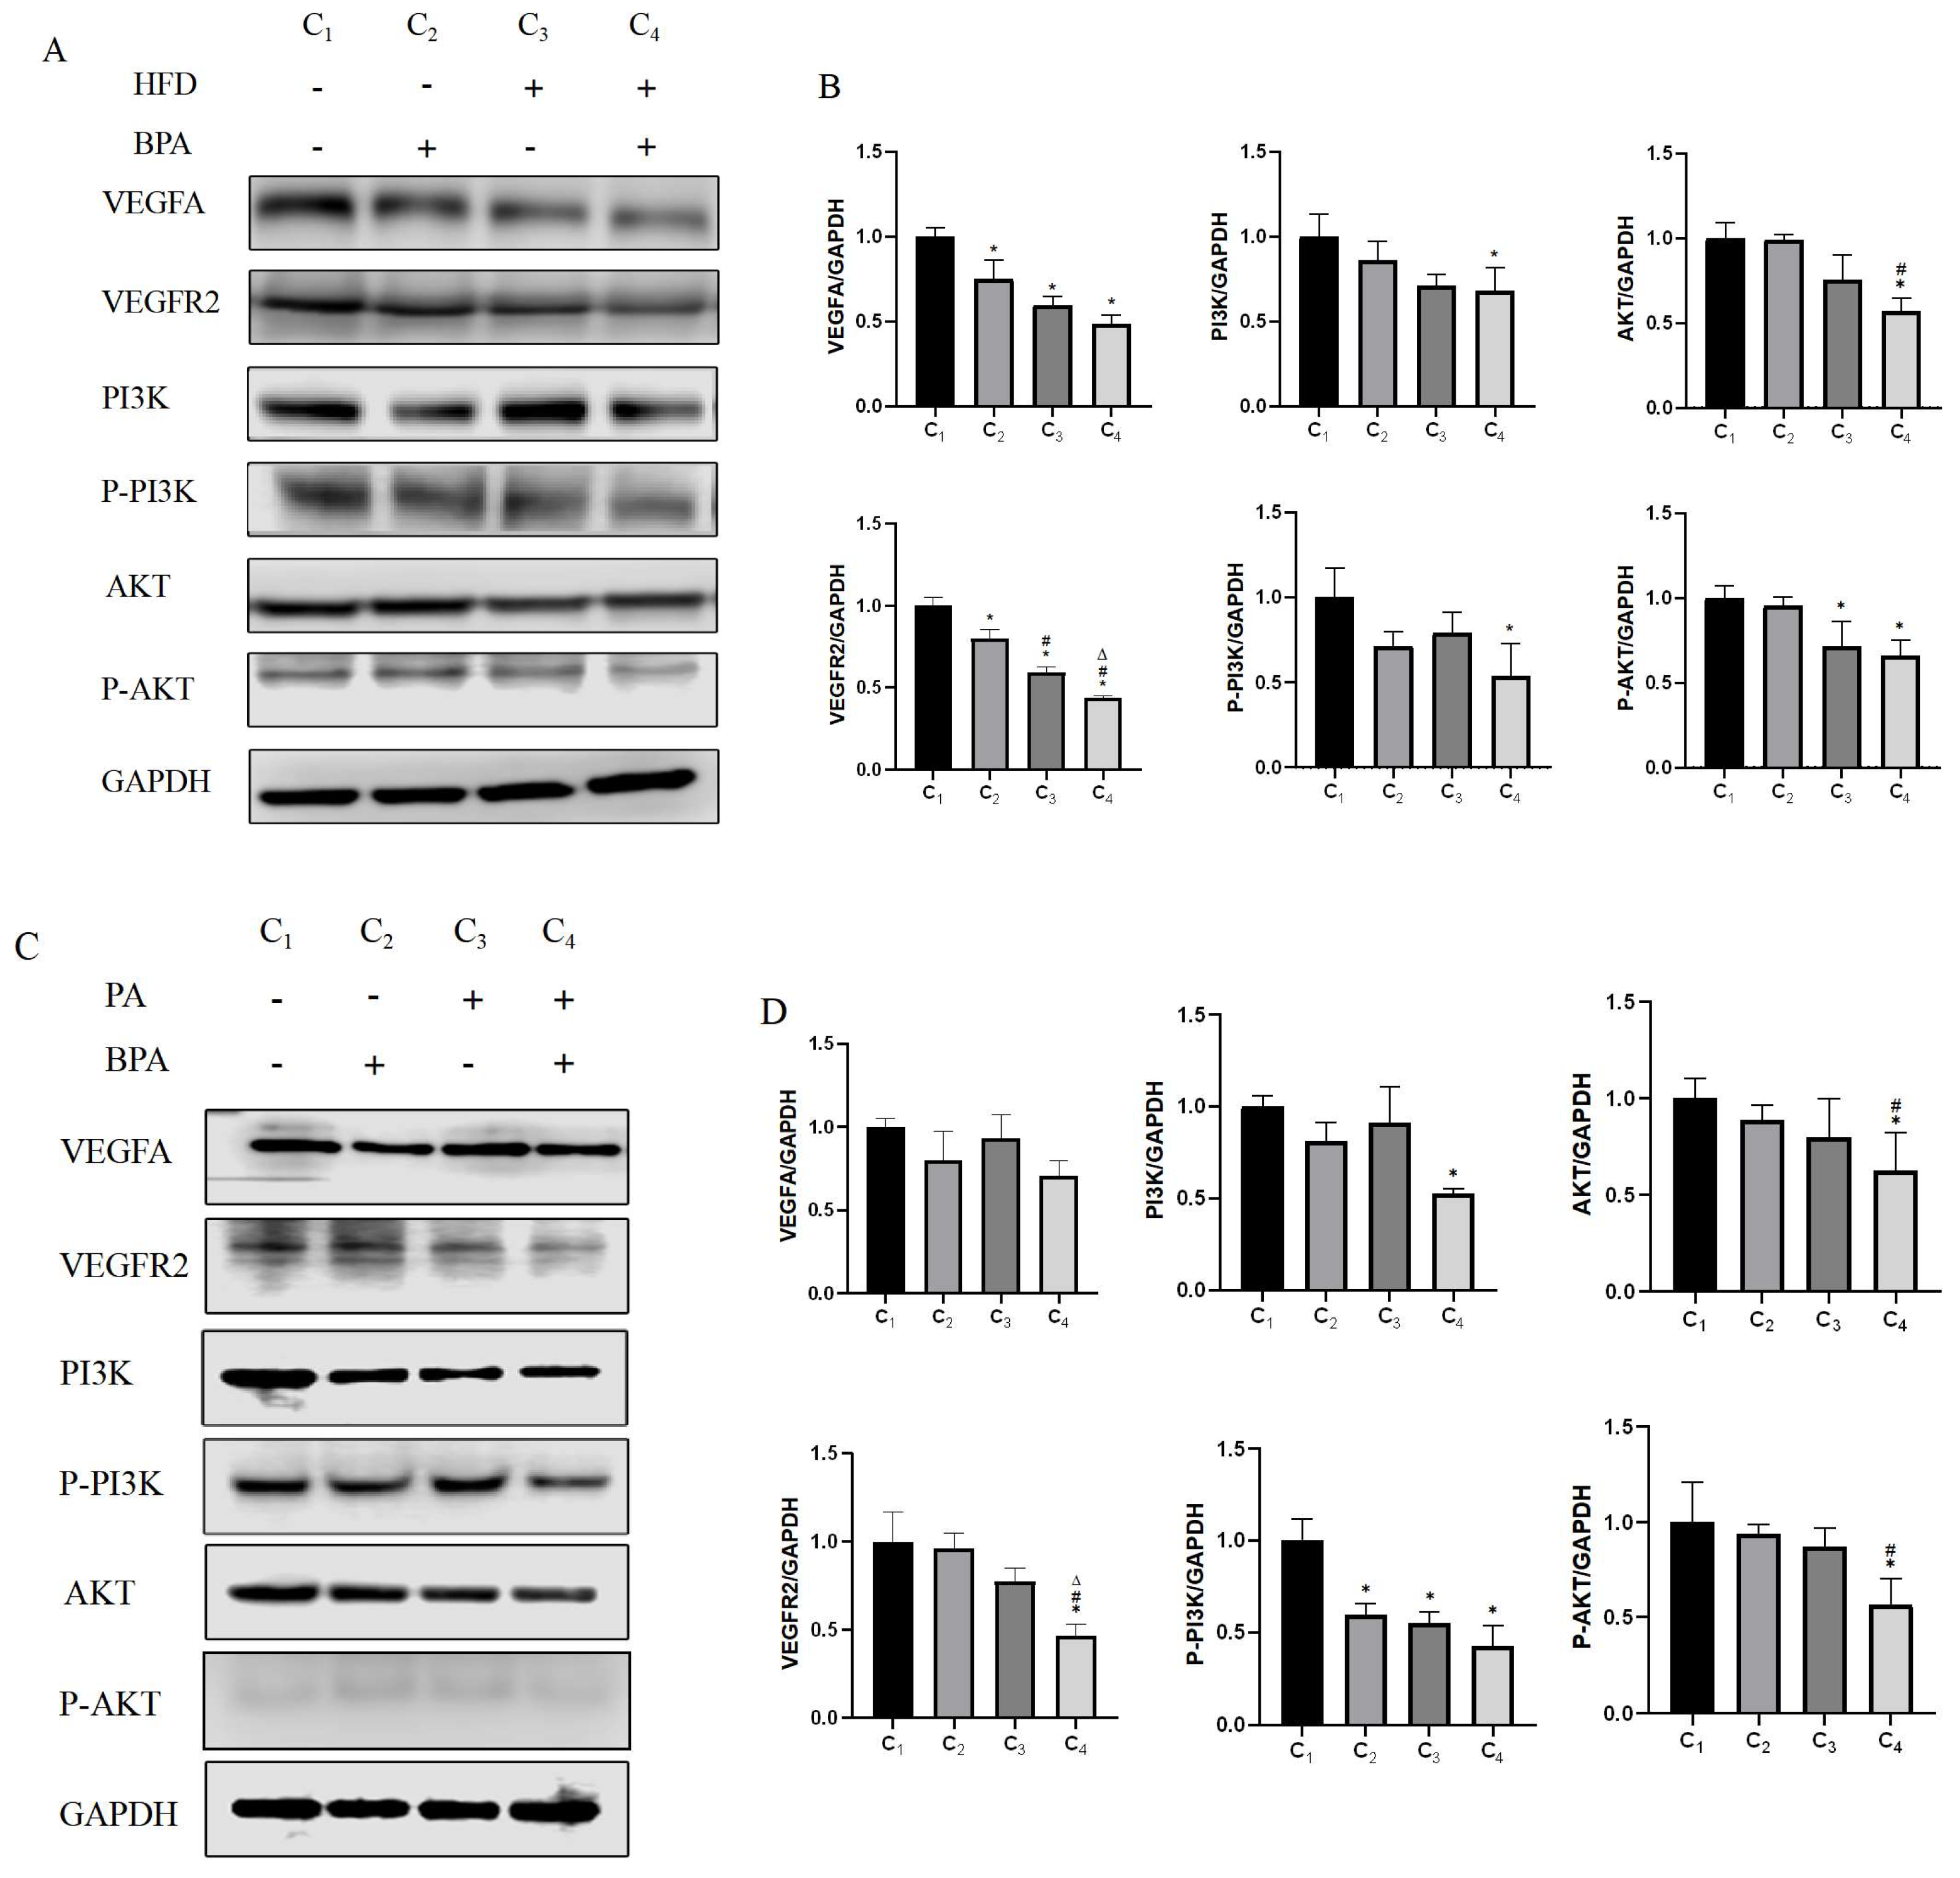
3.6. BPA and High-Fat Diet Treatment Affect Vegf Pathway Activation
This study found through Western blotting that BPA and a high-fat diet (HFD) significantly affect the expression levels of VEGFA, VEGFR2, PI3K, P-PI3K, AKT, and P-AKT proteins in brown adipose tissue. BPA and HFD have main effects on the protein expression of VEGFA and VEGFR2, but they interact in their effects on the protein expression of PI3K and P-PI3K. Additionally, HFD has a main effect on the protein expression of AKT and P-AKT (
Figure 5A,B, p < 0.05). Cell experiments confirmed these results (
Figure 5C,D, p < 0.05), indicating that the combined treatment of BPA and HFD may influence the activation of the VEGF pathway, subsequently affecting the microvascular distribution in brown adipose tissue and potentially contributing to the whitening phenomenon of brown adipose tissue.
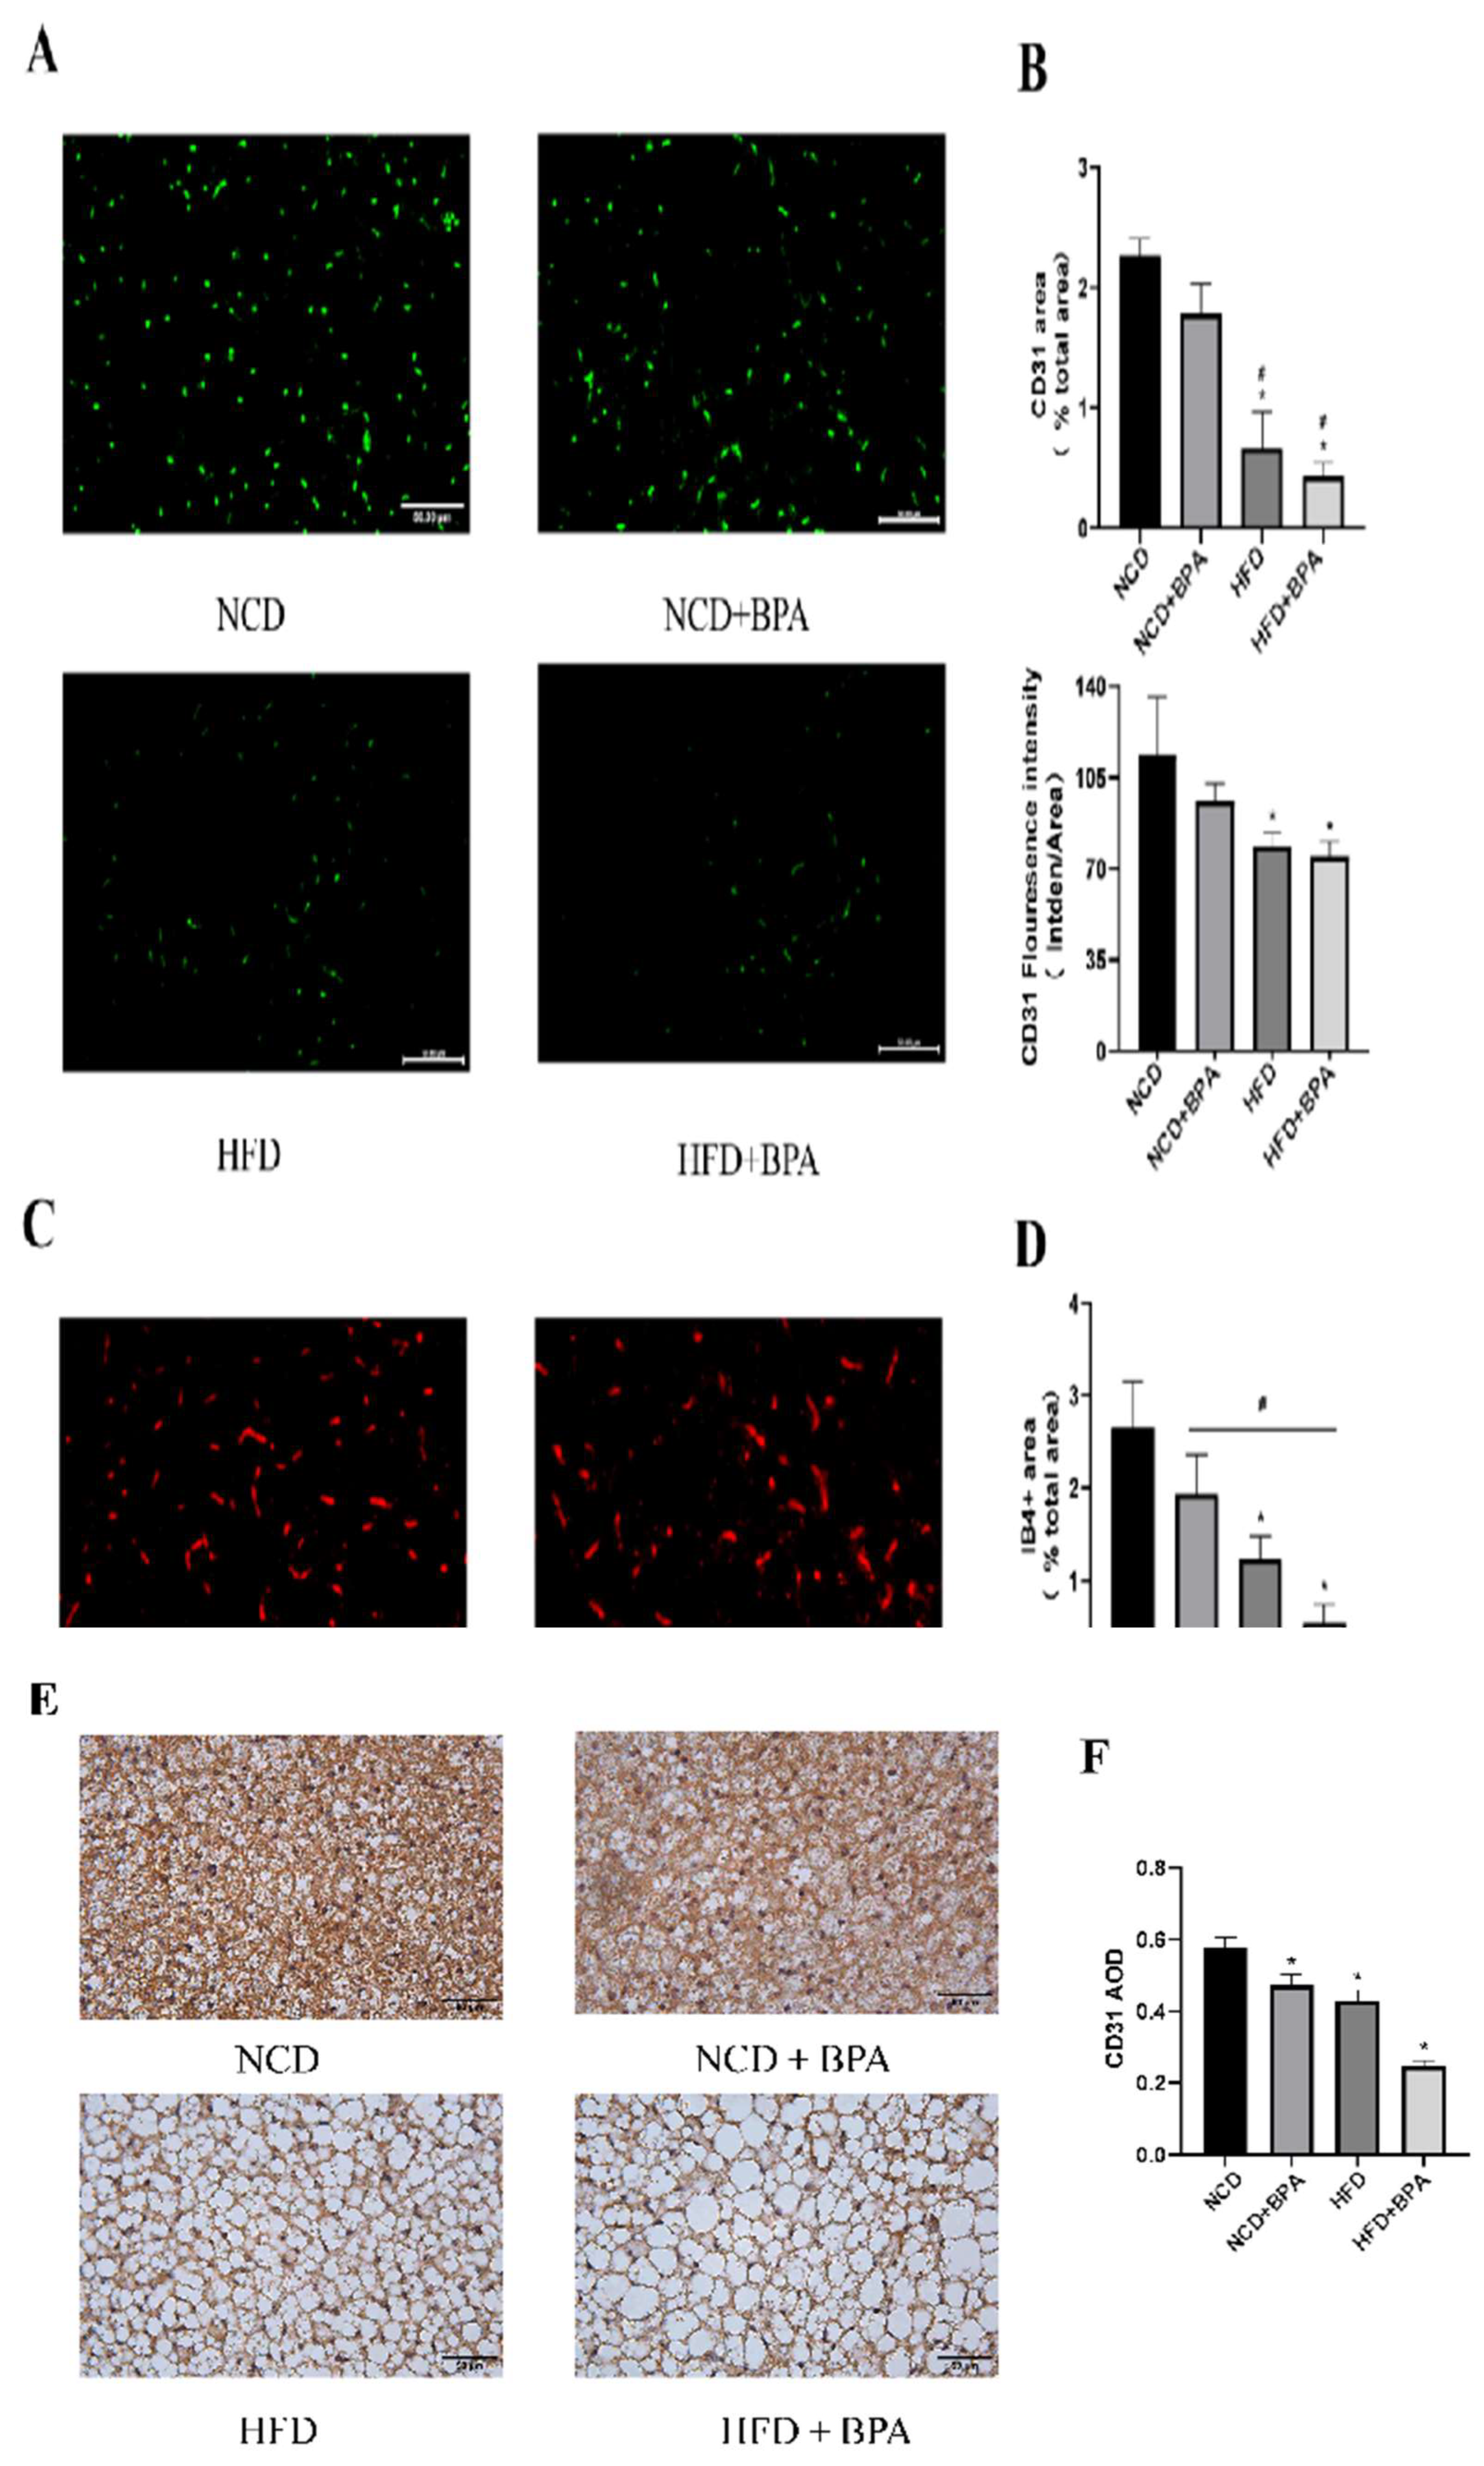
3.7. BPA and High-Fat Diet Treatment Reduce the Levels of Endothelial Cell Markers in Tissues
To further investigate the effects of combined exposure to bisphenol A (BPA) and a high-fat diet on the microvasculature of brown adipose tissue, this study utilized paraffin sections to detect endothelial cell markers—isolectin B4 (IB4
+) and CD31 (
Figure 6 A,C,E). The results from both immunofluorescence and immunohistochemistry showed that BPA and high-fat diet treatment had a significant interaction effect on the expression levels of CD31 and IB4+ in brown adipose tissue. Additionally, both main effects significantly reduced the expression of these microvascular markers (
Figure 6B,D,F, p < 0.05). In summary, the combined treatment of BPA and a high-fat diet can lead to a significant reduction in microvasculature within brown adipose tissue, a phenomenon that may be closely related to the decreased distribution of microvessels and the whitening of brown adipose tissue.
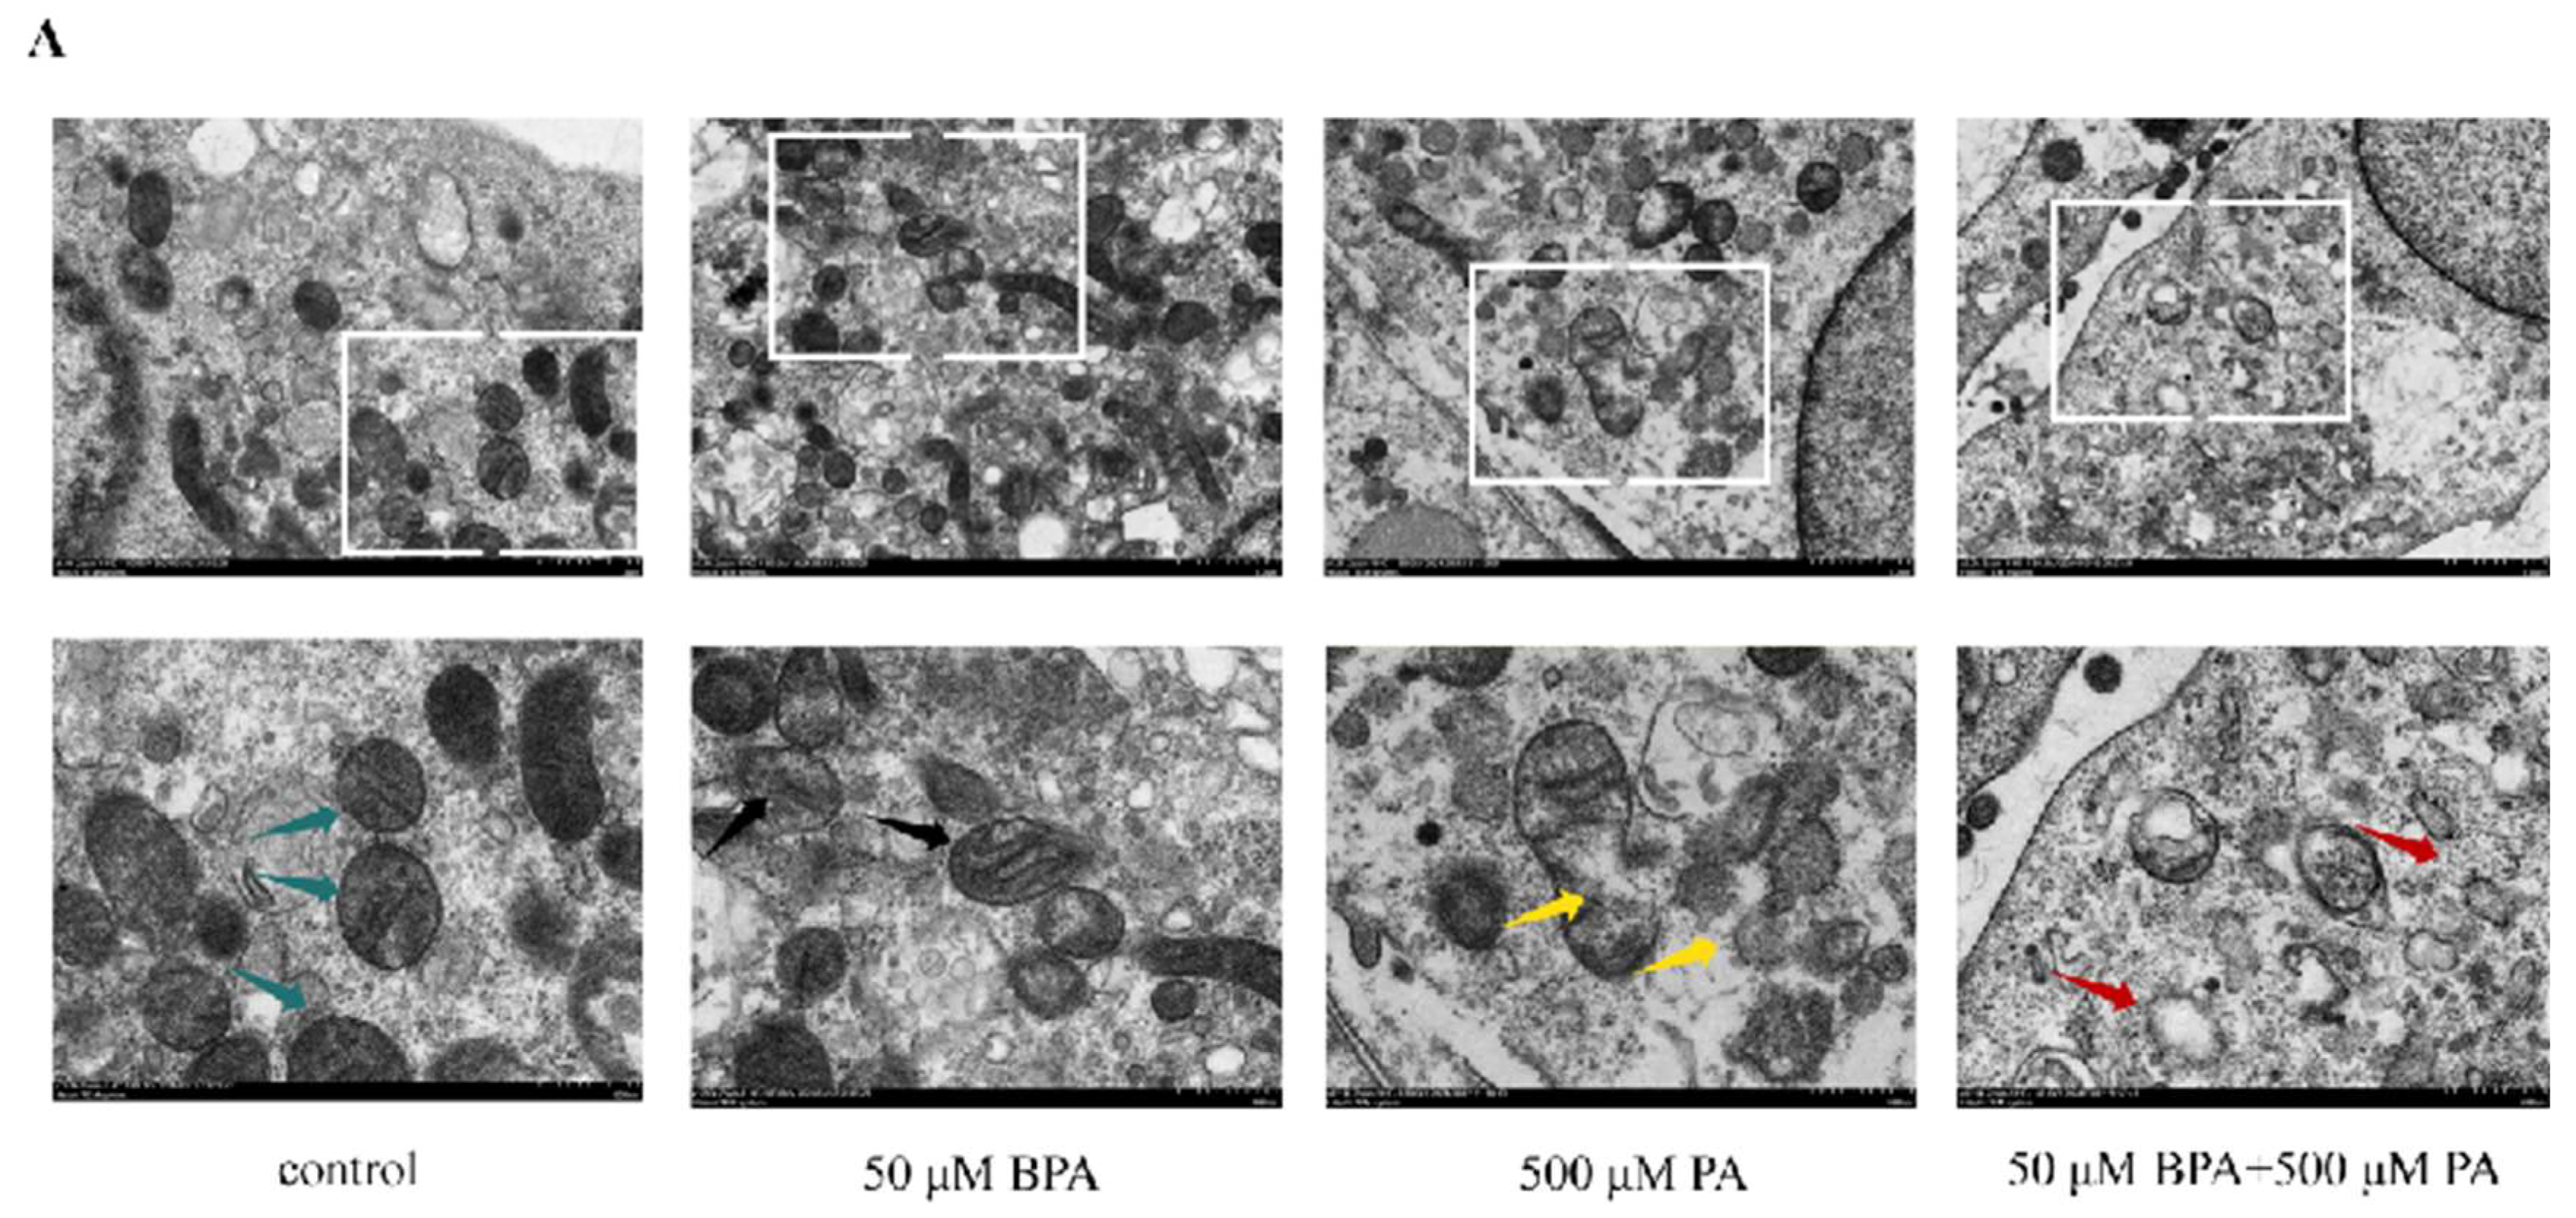
3.8. BPA and High-Fat Diet Treatment Lead to Mitochondrial Damage
This study observed significant damaging effects of combined BPA and high-fat diet treatment on the mitochondria of mouse brown adipose tissue through mitochondrial electron microscopy. Specifically, the damage was characterized by mitochondrial swelling, disorganized cristae structures, and a reduction in mitochondrial density (
Figure 7A). This mitochondrial damage may further affect the energy metabolism and thermogenic function of brown adipose tissue, thereby exacerbating the occurrence and development of obesity and related metabolic diseases.
4. Discussion
Obesity is a chronic metabolic disease characterized by excessive accumulation of triglycerides in the body, significantly increasing the risk of developing diseases such as type 2 diabetes, fatty liver, hypertension, myocardial infarction, stroke, dementia, osteoarthritis, obstructive sleep apnea, and cancer [
1], thus leading to a decline in quality of life and life expectancy. As the number of obese individuals in our country continues to rise, the prevention and treatment of obesity have become major public health issues. Previous studies have largely focused on the role of white adipose tissue in obesity, while there has been relatively less attention on brown adipose tissue. However, obesity is a complex disease with multiple contributing factors. Research has shown that the development of obesity may be related to changes in the structure and function of brown adipocytes, and in addition to the effects of a high-fat diet, environmental endocrine disruptors are playing an increasingly important role in the occurrence of obesity.
BPA, as an environmental endocrine disruptor, poses potential risks to human health [
23]. Prolonged exposure to BPA can lead to endocrine disruption and metabolic dysfunction. The U.S. Environmental Protection Agency (EPA) has set the reference dose for bisphenol A at 50 μg/kg/day
[14,24] in response to precise risk assessments of BPA and its adverse health effects. Meanwhile, the European Food Safety Authority (EFSA) has reduced the acceptable daily intake (TDI) to 4 μg/kg/day, further highlighting the negative impact of BPA on health. This study builds upon this foundation by revealing the detrimental effects of BPA in conjunction with a high-fat diet on brown adipose tissue, expanding research on the mechanisms by which BPA contributes to the development of obesity.
This study employed a two-factor research design to simulate the adverse lifestyle of daily human exposure to BPA and a high-fat diet. The results showed that combined exposure to BPA and a high-fat diet effectively induced an obesity model, with the mice's body weight gradually increasing. At the end of the experiment, the fasting average body weight of mice in the high-fat group increased by 20.68% compared to the control group, meeting the criteria for obesity model establishment (≥20%) [
14,
24]. Measurements of the adipose organ coefficient indicated that, compared to the control group, the brown adipose organ coefficient in the BPA and high-fat treatment group significantly decreased, and there was an interaction between the two, suggesting that BPA exacerbates the negative impact of a high-fat diet on brown adipose tissue.Measurements of the adipose organ coefficient indicated that, compared to the control group, the brown adipose organ coefficient in the BPA and high-fat treatment group significantly decreased, and there was an interaction between the two, suggesting that BPA exacerbates the negative impact of a high-fat diet on brown adipose tissue. Furthermore, obesity leads to a reduction in anti-inflammatory active peptides, an accumulation of inflammatory peptides, and triggers macrophage infiltration and dysfunction, along with increased storage and reduced activity of brown adipose tissue, as well as decreased expression of UCP1
[25,26,27]. This study further found that combined exposure to BPA and a high-fat diet significantly increased the expression levels of inflammatory factors such as IL-1β and TNFα in the brown adipose tissue of mice, demonstrating a significant interaction between the two in exacerbating inflammatory responses, indicating that BPA and a high-fat diet jointly promote the release of inflammatory factors from brown adipose tissue. Additionally, in vitro experiments using the ELISA method validated the significant impact of combined treatment with BPA and palmitic acid (PA) on the secretion levels of inflammatory factors IL-6 and IL-1β (P < 0.05). This result not only aligns with our animal experiment data but also further reinforces the notion that BPA and a high-fat diet collaboratively enhance the release of inflammatory factors from brown adipose tissue. The study showed that after high-fat induction, observations of the brown adipose tissue cells in mice using HE staining [
28] revealed a significant increase in cell volume, and the vacuolar lipid droplets contained within were also noticeably enlarged, displaying a single cavity structure. Meanwhile, the red-stained cytoplasmic portion significantly decreased. This is consistent with the HE staining results of this experiment.
Brown adipose tissue (BAT) [
29,
30] is a special type of fat tissue that functions in thermogenesis and energy expenditure. It generates heat by utilizing metabolic fuels through the specific uncoupling protein 1 (UCP1)
[31], providing profound insights into the mechanisms of obesity and overall health status assessment. The whitening of Brown adipose tissue may be associated with the accumulation of large lipid droplets and a reduction in the number and function of mitochondria [
17,
32], To evaluate the browning of white fat, enhanced detection markers include key thermogenic factors such as UCP1, PR domain-containing 16 (PRDM16), peroxisome proliferator-activated receptor-γ (PPARγ), and peroxisome proliferator-activated receptor gamma coactivator 1 alpha (PGC-1α)
[28,33,34]. Factorial design analysis demonstrated that bisphenol A (BPA) and a high-fat diet (HFD) exert significant main effects on the protein expression levels of thermogenic markers UCP1 and PRDM16 in BAT. Additionally, HFD alone significantly influenced the expression levels of PGC-1α and PPARγ.Western blotting results further confirmed that combined exposure to BPA and HFD markedly inhibited the expression of thermogenesis-related proteins in BAT. Previous studies have shown that palmitic acid (PA) can induce lipid accumulation and elevate inflammatory factors [
35]. However, the combined effect of BPA and PA on lipid accumulation and thermogenic protein expression had remained unclear. In cell experiments, combined treatment with BPA and PA for 24 hours showed a main effect on the protein expression levels of thermogenesis-related genes UCP1 and PGC-1α. The combined treatment also exhibited an interaction effect on the protein expression levels of the key transcriptional regulator PPARγ for adipocyte differentiation, while PA had a main effect on the protein expression levels of PRDM16, a key regulator of Brown adipose tissue development. The in vitro experimental results mutually validate the animal experiment results, indicating that the combined exposure to BPA and a high-fat diet significantly inhibits the expression of thermogenic-related genes in Brown adipose tissue by promoting lipid accumulation, thereby accelerating the whitening process of Brown adipose tissue.
Capillary damage is associated with the VEGF/VEGFR2/PI3K/AKT pathway [
21]. VEGF/VEGFR2 can activate downstream proteins related to the PI3K/AKT pathway
[36,37,38,39], promoting capillary angiogenesis [
40]. Additionally, this study is the first to include the VEGF/VEGFR2/PI3K/AKT signaling pathway in the investigation of combined exposure to BPA and a high-fat diet. By integrating animal and cell experiments, we thoroughly explored the role of this pathway in the whitening of Brown adipose tissue and the development of obesity. The results from animal experiments showed that both BPA and a high-fat diet have a main effect or interaction on the expression levels of various key proteins in this pathway. Cell experiments further validated this result, indicating that the VEGF/VEGFR2/PI3K/AKT pathway may be involved in the process of BPA and high-fat diet-induced whitening of Brown adipose tissue and the occurrence of obesity by regulating angiogenesis and vascular function.
In summary, combined exposure to BPA and a high-fat diet leads to an increase in inflammatory factors in brown adipose tissue or cells, a decrease in thermogenic factor levels, and ultimately results in the whitening of Brown adipose tissue, contributing to the development of obesity. During this process, a reduction in microvascular content and dysfunction, mitochondrial damage, and the VEGF/VEGFR2/PI3K/AKT pathway may play a significant role. More importantly, this study systematically reveals for the first time the specific effects of combined exposure to BPA and a high-fat diet on the VEGF/VEGFR2/PI3K/AKT pathway, clarifying its potential role in the whitening of brown adipose tissue and the occurrence of obesity. This innovative finding not only fills a research gap in the relevant field but also provides a new perspective and theoretical foundation for understanding the pathophysiological mechanisms of obesity.
5. Conclusions
In this study, the combined treatment of BPA and a high-fat diet led to obesity in mice and related metabolic disorders, including weight gain, abnormal blood lipids, dysfunction of brown adipose tissue, enhanced inflammatory responses, suppressed thermogenic function, altered vascular pathways, reduced microvessels, and mitochondrial damage.
Author Contributions
Conceptualization, Z.-H.H.,F.-Q.Q.,Q.-C.Z.,Z.W. and Z.B.; methodology, Z.-H.H.,F.-Q.Q.,W.-X.L.; software,Q.-C.Z.,Z.-J.X.,Z.W. and Z.B.; validation, Z.-H.H.,F.-Q.Q.; formal analysis,Z.-H.H.,F.-Q.Q.,W.-R.T.; investigation, F.-Q.Q.,W.-R.T.,Z.W. and Z.B.; resources, Z.W. and Z.B.; data curation, W.-R.T.,Y.-R.J., X.-L.L.,Z.W. and Z.B.; writing—original draft preparation, Z.-H.H.,F.-Q.Q.,Z.W. and Z.B.; writing—review and editing, Z.-H.H.,F.-Q.Q.,Z.W. and Z.B.; visualization, X.-L.L.,Y.-R.J.,Z.W. and Z.B.; supervision, W.-R.T.,Y.-R.J.,Z.W. and Z.B.; project administration, Z.-H.H.,F.-Q.Q.,Z.W.and Z.B.; funding acquisition, Z.W.;Z.B.All authors have read and agreed to the published version of the manuscript.
Funding
This research was funded by the Key Research and Development Program of Guangdong, China (2019B020210003), National Natural Science Foundation of China, China (81773403), Basic Research Project of Key Laboratory of Guangzhou (2024A03J0558) and the Key Project of Medicine Discipline of Guangzhou (No. 20212023012).
Conflicts of Interest
The authors declare no conflict of interest.
Abbreviations
The following abbreviations are used in this manuscript:
| VEGF |
Vascular endothelial growth factor |
| BPA |
Bisphenol A |
| EDCs |
Environmental endocrine disrupting chemicals |
| PA |
Palmitic acid |
| BAT |
Brown adipose tissue |
| UCP1 |
Uncouple protein 1 |
| PRDM16 |
PR domain - containing 16 |
| IL-1β |
Interleukine-1 beta |
| TNF-α |
Tumor necrosis factor-α |
| MCP-1 |
monocyte chemotactic protein-1 |
| HDL |
High-density lipoprotein |
| LDL |
Low-density lipoprotein |
| TC |
Total cholesterol |
| TG |
Triglyceride |
| DAPI |
4',6-diamidino-2-phenylindole |
| IBMX |
3-Isobutyl-1-methylxanthine |
| SPSS |
Statistical Product and Service Solutions |
| |
|
Appendix A
| Induction solution A |
concentration |
Volume |
| (Dexa) Dexamethasone |
1mM |
45ul |
| (Indo) Indomethacin |
125uM |
45ul |
| (Insulin)Insulin |
850uM |
45ul |
| (IBMX)3-Isobutyl-1-methylxanthine |
0.5M |
45ul |
| (T3) Triiodothyronine |
1uM |
45ul |
| (ROS) Rosiglitazone |
1mM |
45ul |
| (FBS) Fetal bovine serum |
|
4.5ml |
| (MEM)Minimum Essential Medium |
|
40.23ml |
| Induction solution B |
concentration |
Volume |
| (T3) Triiodothyronine |
1uM |
45ul |
| (ROS) Rosiglitazone |
1mM |
45ul |
| (Insulin)Insulin |
850uM |
45ul |
| (FBS) Fetal bovine serum |
|
4.5ml |
| (MEM)Minimum Essential Medium |
|
40.37ml |
Figure A1.
Induction scheme for C3H10T1/2 cells.
Figure A1.
Induction scheme for C3H10T1/2 cells.
Figure A2.
Oil Red O staining identification. Oil Red O staining B, C. Comparison before isopropanol dissolution and absorbance analysis chart.
Figure A2.
Oil Red O staining identification. Oil Red O staining B, C. Comparison before isopropanol dissolution and absorbance analysis chart.
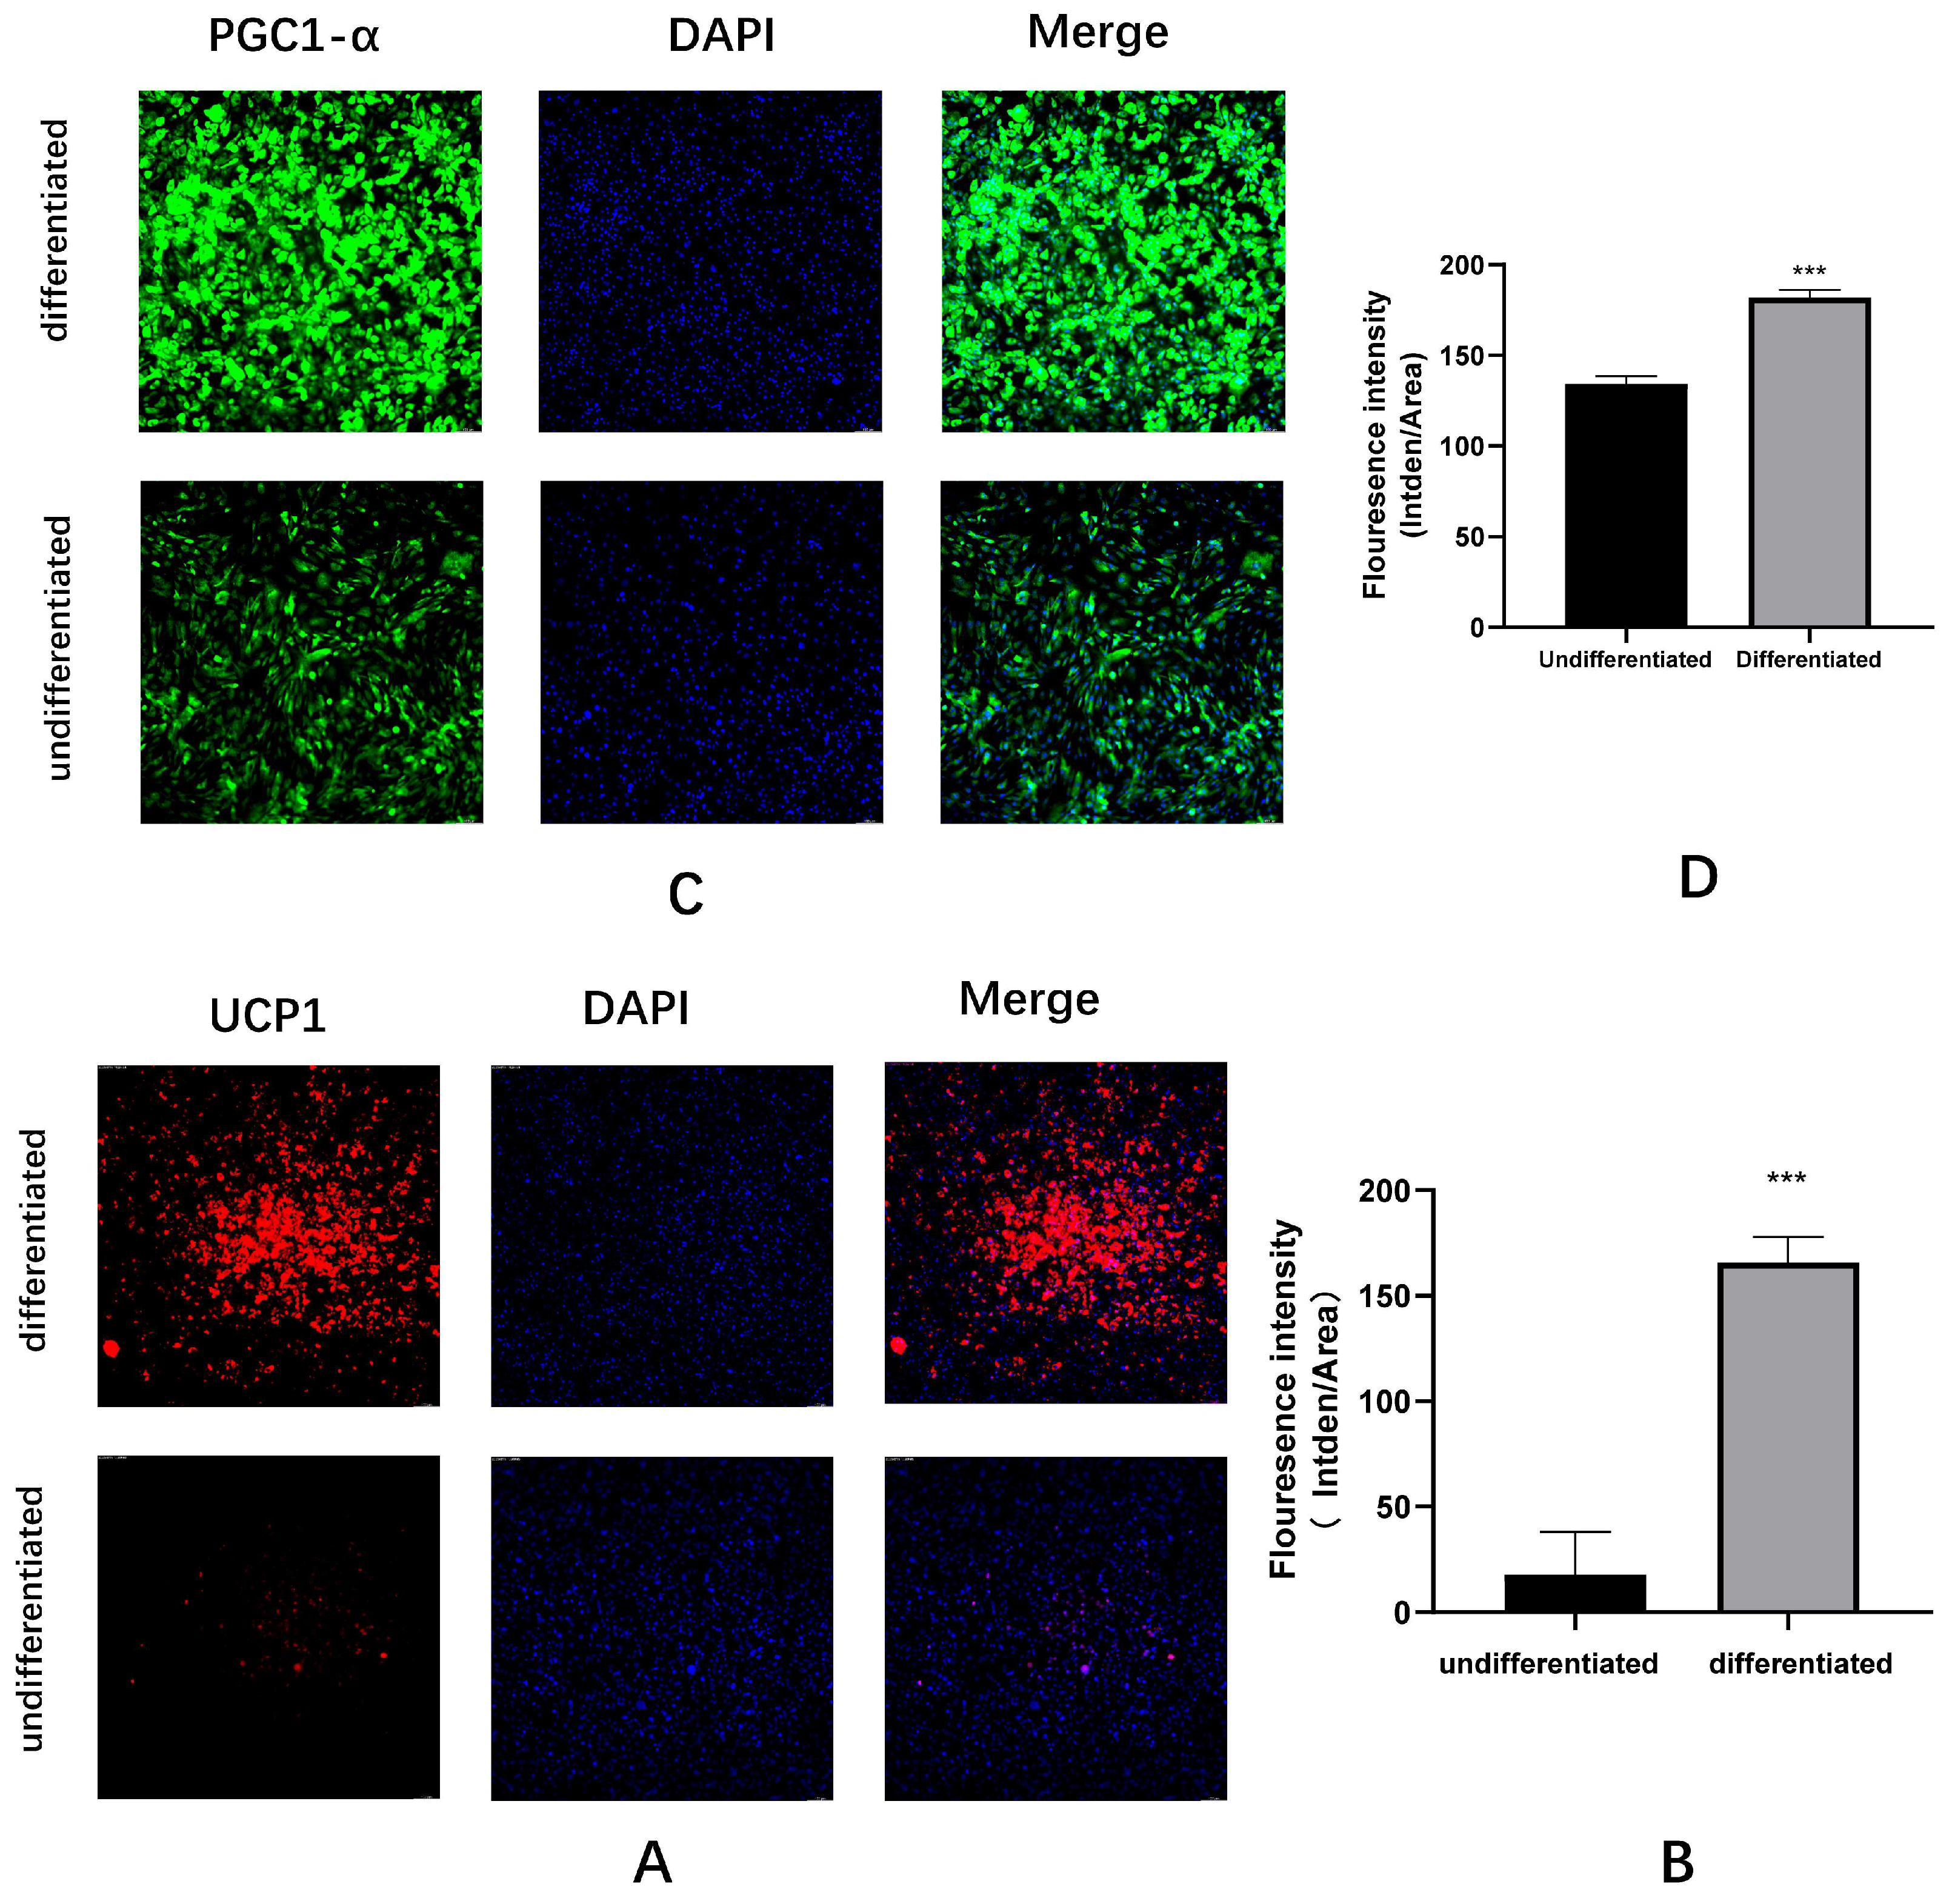
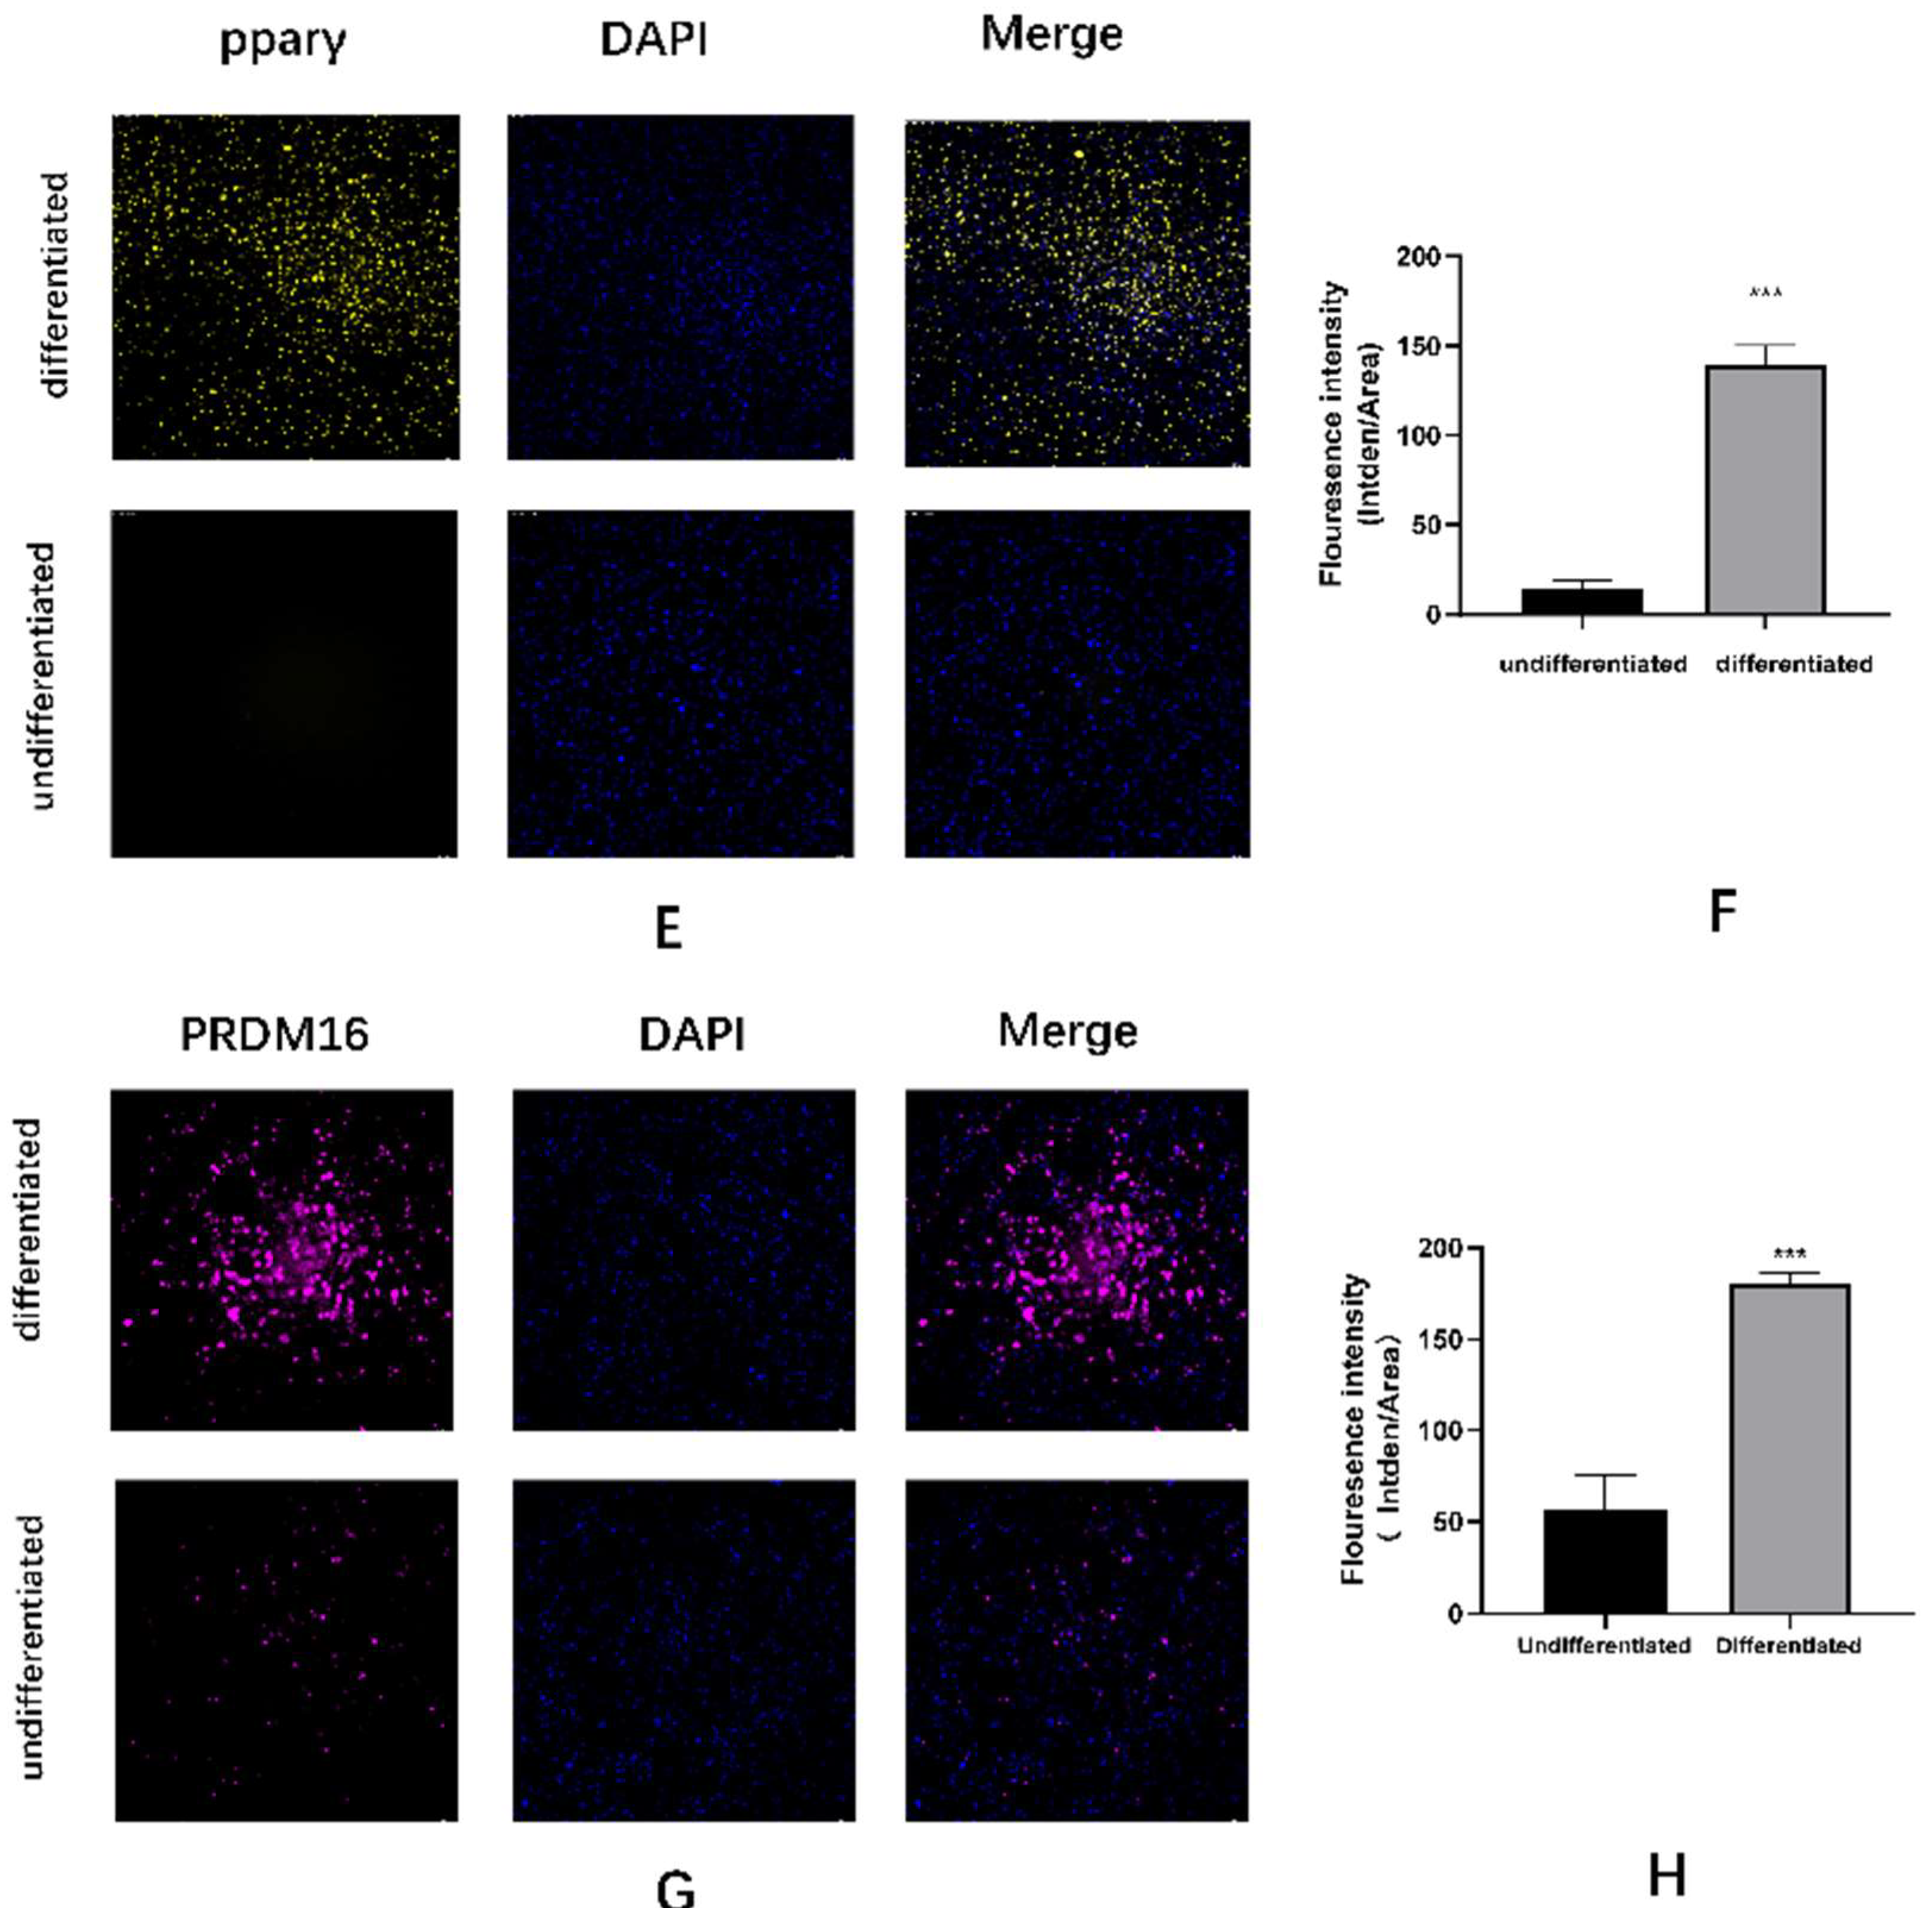
Figure A3.
Immunofluorescence identification of C3H10T1/2 cells differentiating into mature brown adipocytes (A-H) UCP1, PGC-1α, PPARγ, PRDM16 immunofluorescence staining images and quantitative analysis.
Figure A3.
Immunofluorescence identification of C3H10T1/2 cells differentiating into mature brown adipocytes (A-H) UCP1, PGC-1α, PPARγ, PRDM16 immunofluorescence staining images and quantitative analysis.
Figure A4.
Mitochondrial identification of C3H10T1/2 cells differentiating into mature brown adipocytes. L, M: Mitochondrial fluorescent probe images and quantitative analysis; N, O: Mitochondrial electron microscopy images of undifferentiated and differentiated groups. VS undifferentiated group, *** represents P < 0.001.
Appendix B
Figure B1.
Changes in cell viability after 24-hour combined treatment with BPA and PA.
Figure B1.
Changes in cell viability after 24-hour combined treatment with BPA and PA.
Figure B2.
Accumulation of Triglycerides in Cells after Treatment with Different Doses of BPA and PA. (A, B) Accumulation of TG in cells after treatment with different doses of BPA and PA for 24 hours; (C, D) Accumulation of TG in cells after treatment with BPA + PA for 18 hours; (E, F) Accumulation of TG in cells after treatment with BPA + PA for 24 hours; *VS con group, P < 0.05.
References
- Blüher, M. Obesity: global epidemiology and pathogenesis. Nat Rev Endocrinol, 2019, 15, 288–298. [Google Scholar] [CrossRef] [PubMed]
- Kelly, T.; Yang, W.; Chen, C.S.; et al. Global burden of obesity in 2005 and projections to 2030. Int J Obes 2008, 32, 1431–1437. [Google Scholar] [CrossRef] [PubMed]
- Refardt, J.; Winzeler, B.; Christ-Crain, M. Diabetes Insipidus: An Update. Endocrinol Metab Clin North Am, 2020, 49, 517–531. [Google Scholar] [CrossRef] [PubMed]
- Okla, M.; Kim, J.; Koehler, K.; et al. Dietary Factors Promoting Brown and Beige Fat Development and Thermogenesis. Adv Nutr, 2017, 8, 473–483. [Google Scholar] [CrossRef]
- Trayhurn, P. Brown Adipose Tissue-A Therapeutic Target in Obesity? Front Physiol, 2018, 9, 1672. [Google Scholar] [CrossRef] [PubMed]
- Cero, C.; Lea, H.J.; Zhu, K.Y.; et al. β3-Adrenergic receptors regulate human brown/beige adipocyte lipolysis and thermogenesis. JCI Insight 2021, 6. [Google Scholar] [CrossRef]
- Shimizu, I.; Walsh, K. The Whitening of Brown Fat and Its Implications for Weight Management in Obesity. Curr Obes Rep, 2015, 4, 224–229. [Google Scholar] [CrossRef]
- Endalifer, M.L.; Diress, G. Epidemiology, Predisposing Factors, Biomarkers, and Prevention Mechanism of Obesity: A Systematic Review. J Obes, 2020, 2020, 6134362. [Google Scholar] [CrossRef]
- Cohen, I.C.; Cohenour, E.R.; Harnett, K.G.; et al. BPA, BPAF and TMBPF Alter Adipogenesis and Fat Accumulation in Human Mesenchymal Stem Cells, with Implications for Obesity. Int J Mol Sci 2021, 22. [Google Scholar] [CrossRef]
- Corrales, J.; Kristofco, L.A.; Steele, W.B.; et al. Global Assessment of Bisphenol A in the Environment: Review and Analysis of Its Occurrence and Bioaccumulation. Dose Response, 2015, 13, 1559325815598308. [Google Scholar] [CrossRef]
- Sonavane, M.; Gassman, N.R. Bisphenol A co-exposure effects: a key factor in understanding BPA's complex mechanism and health outcomes. Crit Rev Toxicol, 2019, 49, 371–386. [Google Scholar] [CrossRef] [PubMed]
- Chianese, R.; Troisi, J.; Richards, S. et al. Bisphenol A in Reproduction: Epigenetic Effects. Curr Med Chem, 2018, 25, 748–770. [Google Scholar] [CrossRef]
- Ma, Y.; Liu, H.; Wu, J.; et al. The adverse health effects of bisphenol A and related toxicity mechanisms. Environ Res 2019, 176, 108575. [Google Scholar] [CrossRef] [PubMed]
- Jalal, N.; Surendranath, A.R.; Pathak, J.L.; et al. Bisphenol A (BPA) the mighty and the mutagenic. Toxicol Rep 2018, 5, 76–84. [Google Scholar] [CrossRef]
- Hu, K.; Olsen, B.R. The roles of vascular endothelial growth factor in bone repair and regeneration. Bone 2016, 91, 30–38. [Google Scholar] [CrossRef]
- Park, J.; Kim, M.; Sun, K.; et al. VEGF-A-Expressing Adipose Tissue Shows Rapid Beiging and Enhanced Survival After Transplantation and Confers IL-4-Independent Metabolic Improvements. Diabetes, 2017, 66, 1479–1490. [Google Scholar] [CrossRef] [PubMed]
- Shimizu, I.; Aprahamian, T.; Kikuchi, R.; et al. Vascular rarefaction mediates whitening of brown fat in obesity. J Clin Invest, 2014, 124, 2099–2112. [Google Scholar] [CrossRef]
- Chen, Y.; Zhao, M.; Zheng, T.; et al. Repression of adipose vascular endothelial growth factor reduces obesity through adipose browning. Am J Physiol Endocrinol Metab, 2019, 316, E145–e55. [Google Scholar] [CrossRef]
- Di Somma, M.; Vliora, M.; Grillo, E.; et al. Role of VEGFs in metabolic disorders. Angiogenesis, 2020, 23, 119–130. [Google Scholar] [CrossRef]
- Li, B.; Zhang, Y.; Yin, R.; et al. Activating CD137 Signaling Promotes Sprouting Angiogenesis via Increased VEGFA Secretion and the VEGFR2/Akt/eNOS Pathway. Mediators Inflamm 2020, 2020, 1649453. [Google Scholar] [CrossRef]
- Wang, X.; Jiang, L.; Liu, X.Q. et al. Paeoniflorin binds to VEGFR2 to restore autophagy and inhibit apoptosis for podocyte protection in diabetic kidney disease through PI3K-AKT signaling pathway. Phytomedicine 2022, 106, 154400. [Google Scholar] [CrossRef]
- Lu, L.; Shen, L.; Cui, S.; et al. Angiogenic Activity and Mechanism for Bisphenols on Endothelial Cell and Mouse: Evidence of a Structural-Selective Effect. Environ Sci Technol, 2023, 57, 11803–11813. [Google Scholar] [CrossRef]
- Yang, M.; Chen, M.; Wang, J.; et al. Bisphenol A Promotes Adiposity and Inflammation in a Nonmonotonic Dose-response Way in 5-week-old Male and Female C57BL/6J Mice Fed a Low-calorie Diet. Endocrinology, 2016, 157, 2333–2345. [Google Scholar] [CrossRef]
- Krishnan, K.; Gagné, M.; Nong, A.; et al. Biomonitoring Equivalents for bisphenol A (BPA). Regul Toxicol Pharmacol, 2010, 58, 18–24. [Google Scholar] [CrossRef] [PubMed]
- Zoico, E.; Rubele, S.; De Caro, A.; et al. Brown and Beige Adipose Tissue and Aging. Front Endocrinol (Lausanne) 2019, 10, 368. [Google Scholar] [CrossRef] [PubMed]
- Machado, S.A.; Pasquarelli-Do-Nascimento, G.; Da Silva, D.S.; et al. Browning of the white adipose tissue regulation: new insights into nutritional and metabolic relevance in health and diseases. Nutr Metab (Lond), 2022, 19, 61. [Google Scholar] [CrossRef] [PubMed]
- Martí-Pàmies, Í.; Thoonen, R.; Morley, M.; et al. Brown Adipose Tissue and BMP3b Decrease Injury in Cardiac Ischemia-Reperfusion. Circ Res, 2023, 133, 353–365. [Google Scholar] [CrossRef] [PubMed]
- Chen, Y.; Ding, J.; Zhao, Y.; et al. Irisin induces white adipose tissue browning in mice as assessed by magnetic resonance imaging. Exp Biol Med (Maywood), 2021, 246, 1597–1606. [Google Scholar] [CrossRef]
- Czech, M.P. Mechanisms of insulin resistance related to white, beige, and brown adipocytes. Mol Metab 2020, 34, 27–42. [Google Scholar] [CrossRef]
- Kimura, H.; Nagoshi, T.; Yoshii, A.; et al. The thermogenic actions of natriuretic peptide in brown adipocytes: The direct measurement of the intracellular temperature using a fluorescent thermoprobe. Sci Rep, 2017, 7, 12978. [Google Scholar] [CrossRef]
- Carpentier, A.C.; Blondin, D.P.; Haman, F.; et al. Brown Adipose Tissue-A Translational Perspective. Endocr Rev, 2023, 44, 143–192. [Google Scholar] [PubMed]
- Kimura, H.; Nagoshi, T.; Oi, Y.; et al. Treatment with atrial natriuretic peptide induces adipose tissue browning and exerts thermogenic actions in vivo. Sci Rep, 2021, 11, 17466. [Google Scholar] [CrossRef]
- Bargut, T.C.L.; Souza-Mello, V.; Aguila, M.B.; et al. Browning of white adipose tissue: lessons from experimental models. Horm Mol Biol Clin Investig 2017, 31. [Google Scholar] [CrossRef]
- Seale, P.; Kajimura, S.; Yang, W.; et al. Transcriptional control of brown fat determination by PRDM16. Cell Metab, 2007, 6, 38–54. [Google Scholar] [CrossRef] [PubMed]
- Törőcsik, D.; Fazekas, F.; Póliska, S.; et al. Epidermal Growth Factor Modulates Palmitic Acid-Induced Inflammatory and Lipid Signaling Pathways in SZ95 Sebocytes. Front Immunol 2021, 12, 600017. [Google Scholar] [CrossRef] [PubMed]
- Wang, H.J.; Ran, H.F.; Yin, Y.; et al. Catalpol improves impaired neurovascular unit in ischemic stroke rats via enhancing VEGF-PI3K/AKT and VEGF-MEK1/2/ERK1/2 signaling. Acta Pharmacol Sin, 2022, 43, 1670–1685. [Google Scholar] [CrossRef]
- Liu, T.; Zhou, W.; Cai, B.; et al. IRX2-mediated upregulation of MMP-9 and VEGF in a PI3K/AKT-dependent manner. Mol Med Rep, 2015, 12, 4346–4351. [Google Scholar] [CrossRef]
- Li, Y.; Ge, J.P.; Ma, K.; et al. The combination of EGCG with warfarin reduces deep vein thrombosis in rabbits through modulating HIF-1α and VEGF via the PI3K/AKT and ERK1/2 signaling pathways. Chin J Nat Med, 2022, 20, 679–690. [Google Scholar] [CrossRef]
- He, Y.; Wang, H.; Lin, S.; et al. Advanced effect of curcumin and resveratrol on mitigating hepatic steatosis in metabolic associated fatty liver disease via the PI3K/AKT/mTOR and HIF-1/VEGF cascade. Biomed Pharmacother 2023, 165, 115279. [Google Scholar] [CrossRef]
- Namjoo, M.; Ghafouri, H.; Assareh, E.; et al. A VEGFB-Based Peptidomimetic Inhibits VEGFR2-Mediated PI3K/Akt/mTOR and PLCγ/ERK Signaling and Elicits Apoptotic, Antiangiogenic, and Antitumor Activities. Pharmaceuticals 2023, 16. [Google Scholar] [CrossRef]
Figure 1.
BPA and high-fat diet treatment cause weight gain and obesity in mice. (A)The body weight of the mice. (B) Cumulative food intake in mice *Indicates differences between groups at various time points,#Indicates differences at time points between groups.(C) Image analysis results of fat tissue organ coefficients for each group.*vs NCD group, P < 0.05, Values (n = 10) are expressed as mean ± SEM.
Figure 2.
Pathological changes in brown adipose tissue (BAT) in mice treated with BPA and a high-fat diet. (A) HE staining results of brown adipose tissue in mice from each group.Scale bar:50μm (B、C、D) After exposure to BPA and a high-fat diet, the area of lipid droplets in brown adipocytes in mice is significantly enlarged, the average diameter of lipid droplets is increased, and the number of lipid droplets is relatively decreased. Data arepresented as the mean 6 standard deviation of at least three independent experiments.*vs NCD group, P < 0.05, #vs BPA group, P < 0.05.
Figure 3.
BPA and high-fat diet treatment increase the expression levels of inflammatory factors in mice. (A, C, E) Results of IHC detection of protein expression levels of IL-1β, TNF-α, and MCP-1 in brown adipose tissue of mice. (B, D, F) AOD image analysis results for each group.AOD=IOD/Area,*vs NCD group, P < 0.05.
Figure 4.
BPA and a high-fat diet reduce the expression levels of thermogenic factors.(A, C) Measurement of UCP1, PGC-1α, PRDM16, and PPARγ protein levels in brown adipose tissue and cells using Western blot. (B, D) Analysis of the expression levels of various proteins in brown adipose tissue and cells treated with BPA or a high-fat diet (HFD) through factorial design analysis of variance (n=3). *vs NCD /Control group, P < 0.05,#VS BPA/50μM BPA group,P<0.05,ΔVS HFD /500μM PA group,P<0.05.
Figure 5.
BPA and high-fat diet treatment affect the activation of the VEGF pathway.(A, C) Measurement of VEGFA, VEGFR2, pI3K, P-PI3K, AKT, and P-AKT protein levels in brown adipose tissue and cells using Western blot. (B, D) Analysis of the expression levels of various proteins in brown adipose tissue and cells treated with BPA or a high-fat diet (HFD) through factorial design analysis of variance (n=3).*vs NCD /Control group, P < 0.05,#VS BPA/50μM BPA group,P<0.05,ΔVS HFD /500μM PA group,P<0.05.
Figure 6.
BPA and high-fat diet treatment reduce the levels of endothelial cell markers in tissues.(A, B) Results of CD31 immunofluorescence detection and image analysis in mice. (C, D) Results of IB4+ immunofluorescence detection and image analysis. (E, F) Results of CD31 immunohistochemistry and image analysis in mice.*vs NCD group, P < 0.05,#VS BPA group,P<0.05.
Figure 7.
BPA and high-fat dietary treatments lead to mitochondrial damage.
Figure 7.
BPA and high-fat dietary treatments lead to mitochondrial damage.
Table 1.
BPA and high-fat diet treatment cause dyslipidemia in mice.
Table 1.
BPA and high-fat diet treatment cause dyslipidemia in mice.
| Group |
NCD |
NCD+BPA |
HFD |
HFD+BPA |
| TC(mmol/L) |
2.196±0.198 |
2.644±0.199* |
2.632±0.158* |
2.944±0.289* |
| TG(mmol/L) |
0.76±0.385 |
0.814±0.203 |
0.876±0.043 |
0.968±0.188 |
| LDL(mmol/L) |
0.194±0.057 |
0.182±0.061 |
0.276±0.051 |
0.236±0.098 |
| HDL(mmol/L) |
1.924±0.128 |
2.05±0.251 |
2.17±0.243 |
2.392±0.238* |
Table 2.
Differences in inflammatory factor concentrations in cell supernatants after treatment with BPA and PA for 24 hours.
Table 2.
Differences in inflammatory factor concentrations in cell supernatants after treatment with BPA and PA for 24 hours.
| Group |
IL-1β(pg/mL) |
TNFα(pg/mL) |
IL-6(pg/mL) |
| NCD |
0.229±0.0019 |
0.292±0.0005 |
0.228±0.0007 |
| NCD+BPA |
0.231±0.0016 |
0.292±0.0012 |
0.232±0.0022* |
| HFD |
0.234±0.0026* |
0.294±0.0011 |
0.233±0.0015* |
| HFD+BPA |
0.236±0.0026* |
0.295±0.007* |
0.237±0.0026* |
|
Disclaimer/Publisher’s Note: The statements, opinions and data contained in all publications are solely those of the individual author(s) and contributor(s) and not of MDPI and/or the editor(s). MDPI and/or the editor(s) disclaim responsibility for any injury to people or property resulting from any ideas, methods, instructions or products referred to in the content. |
© 2025 by the authors. Licensee MDPI, Basel, Switzerland. This article is an open access article distributed under the terms and conditions of the Creative Commons Attribution (CC BY) license (http://creativecommons.org/licenses/by/4.0/).