
Submitted:
13 February 2025
Posted:
14 February 2025
You are already at the latest version
Abstract
In a photovoltaic (PV) system, shading conditions caused by weather and ambient factors can significantly affect the electricity production. For more than a decade, applications of artificial intelligence (AI) techniques have been used to improve energy production efficiency in the solar energy sector. In this paper, we present how using AI-based can increase energy production for solar power plants experiencing shading conditions. It is shown that the application of these techniques paves the road towards sustainable development for the solar power sector. Employing maximum power point tracking (MPPT) control systems, running metaheuristic and computer-based algorithms, help PV arrays to cope with shading conditions effectively. Using a case study, we compare energy productions of the solar power plant in two scenarios: I) PVs without a control system, and II) PV arrays equipped with MPPT boards. System Advisory Model (SAM) is used to calculate monthly powers generated by the PV system. Our results prove our hypothesis that the PV system using MPPT systems provides a greater monthly energy production than without MPPTs.
Keywords:
solar energy
; energy forecasting
; PSC
; sustainable development
; MPPT
; SDGs
1. Introduction
The total world energy consumption is expected to grow by 14% during the time period of 2020 to 2030 [1]. The share of fossil fuels in the global energy mix is predicted to be about 75% by the year 2035 [2]. Economic development and prosperity depend heavily on energy and its resources. Using fossil fuels emits harmful gases to the air and cause environmental concerns, while renewable energy resources offer sustainable energy systems [3]. Therefore, the utilization of clean energies including solar energy has arisen globally. Providing sustainable sources of energy, freely available solar power can be accessible almost everywhere across the world. Worldwide, the share of solar energy has increased significantly from about 180 (MW) in 2014 to 1,418 (MW) in 2023 [4]. Solar power generations produced about 4,323 gigawatt-hours of electricity, enough to provide power to over 470,000 Canadian residences in 2022 [5].
A photovoltaic (PV) panel can be used to convert solar irradiances to electricity. Affordable PV systems are easy to install and maintain, appointing them as a promising and sustainably source of clean energy for energy consumers. They can be utilized in both urban and remote areas providing sustainable electricity generation. However, PV power outputs undeniably rely on irradiance received from sun. Shading caused by weather or ambient conditions deteriorates energy production of such systems. There is no substitute for the sun to overcome this cause of shading; nevertheless, some of the most regular shading conditions that PV systems experience is caused by snowfall. In this regard, the depth of snowfall defines the level of shading severity for the system. In this work, we focus on scientific methods to deal with shading conditions initiated by ambient or weather conditions. Thus, full shading that ends up with no output power for a PV system is not the focus of this work. Full shading occurs when no irradiance can reach the surface of a PV because the panel is covered entirely due to heavy snow, dust, pollution, or other ambient factors. Practically, maximum power point tracking (MPPT) methods are used to deal with in the case of partial shading. In a solar power plant, MPPT control systems help PV arrays to generate maximum power by finding optimize points of operations. These systems run artificial intelligence (AI) algorithms.
Although there is no exact definition for AI methods in most cases, in this paper, we refer AI to employing advanced technologies using sophisticated and computer-based techniques and algorithms to deal with intricate data. In recent years, AI-based approaches have gained prominence in tackling PV shading. The ability of handle complex input-output relationships and data-driven nature of AI methods provides optimal solutions with increased speed and reliability [6]. Although there are enormous amounts of research studies using AI algorithms in MPPT, the impact of such a system in power generation in a solar power plant has not been investigated yet. We design a PV system for a case study located in Golden, Colorado, using System Advisor Model (SAM), with and without an MPPT control system. The reported output powers in these two scenarios show that applying MPPT-based PV arrays can effectively improve energy productions of the solar power plant.
The paper is structured in six sections: an overview of how a PV panel generates electricity and the way shading conditions affect the performance of the system are described in section 2. Using AI-based techniques, MPPT algorithms, and its role in sustainable development are reviewed briefly in section 3. Section 4 presents monthly power productions of PV system designed for the case study considering two scenarios, with and without MPPT systems. We interpret the results of electricity productions considering two scenarios in section 5 followed by conclusion as the final section.
2. PV Systems and Shading Conditions
2.1. PV Cell Model
A PV system is built in a series-parallel configuration to produce desired output power and voltage. Using an appropriate electrical circuit model and an estimation of its parameters are crucial to predict PV performances and the energy yield. Defining PV model and equivalent electrical circuit enable us to predict variations of I-V and P-V curves to the ambient conditions and climate factors. A proper PV model reflecting characteristics of the system enables system designers to calculate the power generated by the system. The most important element of a PV module is the PV cell [7]. The cell behaves as a simple diode p-n junction representing two layers of semiconductor material. The following equation describes relationship between the current (I) and the voltage (V) in a single diode (Rp) model:
I = IL – I0[exp (q (V + IRs)/αkT) – 1] – (V + IRS)/RSH,
Where (I) is the PV current and has a direct relationship with sun intensity and temperature changes. The saturation current (I0) depends on temperature differences, α is the ideality factor of the diode, (q) is constant (-1.6021764 x 10⁻¹⁹) representing an electron’s charge, (K) is Boltzmann’s constant (-1.380653 x 10⁻²³), T (0K) is the absolute temperature of the p-n junction, and (RS) and (RSH) are the series and parallel equivalent resistances of the solar panel, respectively [8]. Figure 1 demonstrates an equivalent circuit of a PV cell consists of a current source, a diode, and a set of resistors connected in parallel and series.
2.2. The Effect of Partial and Full Shading on Energy Productions
Shading of only one cell in a PV module can reduce the power output to zero. A typical and simple PV system generating electricity includes a PV array, a DC-AC inverter and a load. PV modules are assembled in different series and parallel configurations to form an array at the desired output voltage and current. A single module is equipped with bypass diodes allowing current from non-shaded parts of the module to pass by the shaded part and limits the effect of shading to the only neighboring group of cells protected by the same bypass diode [9,10]. When the bypass diode begins conducting, the module voltage drops by an amount corresponding to the sum of cell voltages protected by the same bypass diode plus the diode forward voltage. Nevertheless, the current from surrounding unshaded groups of cells continues around the group of shaded cells [9].
A PV module may operate under fewer irradiances due to receiving less sunlight or because of weather, or different ambient conditions including dust, snow, ice, pollution-related particles, and clouds [11]. Unlike partial shading where some portions of a PV module are affected, full shading conditions the entire surface of a PV module is shadowed. The thickness of object covering a solar panel, for instance snow, indicates the amount of irradiance received by the PV [12].
Figure 2 illustrates the P-V and I-V curves of a SunPower SPR-E19-310-COM module operating under various full shading conditions. This brand module is selected to design the PV system for the case study investigated in this paper. As observed in the figure, the produced power degrades when the PV module operates under limited irradiance. Regarding snowfalls, which is the main cause of full shading conditions in most cases, the amount of precipitation identifies the total irradiance received by a solar panel. Daily energy losses due to snowfalls can be predicted as: I) snowfall depth greater than 1” cause 45% of daily energy loss, and less than 1” cause 11% loss (for 30° module angle), II) snowfall depth greater than 1” cause 26% of daily energy loss, and less than 1” cause 5% loss (for 40° module angle) [13].
Alternatively, partial shading conditions (PSCs) when some parts of a PV surface are affected by an object. Depending on the altitude and longitude, weather can be the main source of partial shadings for a solar power plant; for instance, cloud, snowfall, wind, heavy rain, hail, freezing rain, sandstorm, or a combination of these elements create problems in energy productions. In addition to the climate, the environment and location of a PV site can be affected because of nearby objects, buildings, trees and vegetation, pollution, dune, and so on. When the module is partially exposed to sunlight I-V and P-V curves depict one global and two local maximum points. Using MATLAB simulations, in our previous work, these curves are demonstrated for a PV array consisting of 4 PV modules connected in parallel-series configuration [15]. Figure 3 shows the P-V and the I-V curves of the partially shaded PV modules in the array affected by unlike solar radiation of 500 (W/m2), 100 (W/m2), 1000 (W/m2), and 300 (W/m2). The two local points and one global maximum demonstrate the P-V and I-V relationships of the PV system.
2.3. The Application of an MPPT Method
An MPPT system withdraws optimum output energy from a solar panel operating under partial shading. Nonlinear characteristics of the PV array under PSCs and various irradiances and temperatures demonstrate multi-peak P-V and I-V curves with one global point (GP) and several local maximum points [16,17]. MPPT methods are developed to overcome the impact of PSC on PV system performances ensuring that the PV system operates efficiently at its maximum power point (MPP). To accomplish this, an MPPT controller running an optimization algorithm is used. In a MPPT-based control system, the control parameters can influence the functionality of each algorithm so that the comparison result may be altered slightly [18]. It provides reference voltages or reference currents needed for the PV module. Then according to these references, the pulse width modulation (PWM) generator provides appropriate duty cycle to the converter. One essential part of any MPPT controller system is voltage regulator. Voltage regulator tracks the reference value provided by the running algorithm [19]. The reference value is sensed by a microcontroller (MCU) equipped with current and voltage sensing. MCUs offer a variety of solutions for solar energy harvesting by providing system control and support communication technologies allowing system designers to control the output power of the PV arrays [20]. MCUs can detect PSCs and replied accordingly due to their capability of dynamic responses. Besides, MCU-based PV systems use fewer components while increasing reliability with minimum cost than conventional or analog technologies. Todays’ advanced MCUs offer various technical features, capable of producing multiple PWM, simultaneously. As a result, the MPPT identifies the optimal operation for the PV system [21].
3. AI-Powered PV Systems and Sustainable Development
AI-driven technologies have been used in different fields of research studies in the solar power sector mainly to cope with complex data generated by several sources. This can be navigated from a wide range of research studies from energy forecasting to analyzing data generated by controlling and monitoring systems. In a paper [22], finding optimal sites for installing solar farms is efficiently performed using AI methods in geographic information system (GIS) databases. Site selection models deal with various related and sometimes unrelated factors encompassing environmental, socioeconomic, legal, and political elements. As presented in [23] anomaly detection for PV system maintenance can be performed using deep learning. Forecasting solar power production is one of the main research areas with a broad amount of AI contribution. In [24], machine learning models are used to predict energy production of a PV system. AI and machine learning methods can be used to develop an energy model for system modeling or energy cost [25]. Likely, AI applications for cost reduction, strategies to reduce climate impacts, and increase energy efficiency have been outlined in a literature review [26].
Since the focus of this paper is the PV shading, we investigate the advancement of sustainable electricity production in the subject of MPPT. For the same reason, the role of AI in energy efficiency for PV systems operating under shading is also studied. In the following subsection, we provide an overview of AI-based algorithm that improves efficiency in PV energy generation and accelerates the functionality of an MPPT control system.
3.1. The Role of AI in MPPT Computer-Based Algorithms
There are countless algorithms developed by researchers attempting to find MPP that the PV system can efficiently operate under shading conditions. In literature reviews, Classifications of existing methods representing functionality of the algorithms are widely distinctive. These perceptions mainly focus on MPPT applications, optimization methods, costs, parameters used, efficiencies, tuning parameters, the system complexity, and the rapid convergence [27,28]. Ultimately, the most common clustering can be defined as: I) conventional or classical methods, II) modern or soft computing methods, and III) hybrid methods, and IV) power electronics (PE) based methods.
While conventional methods offer convenience and simplicity, they may be trapped in local points and detect one of the local points as the MPP for the system consisting of several PVs performing under PSCs [29]. Furthermore, shading conditions can affect the PV performance significantly. Soft computing methods can be categorized into AI and meta-heuristic optimization techniques [30,31]. Meta-heuristic methods make two subdivisions, the evolutionary algorithm (EA) and population-based or swarm intelligence (SI). As stated in section 1, all soft computing MPPT algorithms and possible hybrid methods are identified as AI techniques in this paper. These methods are fast in detecting MPP and can increase PV performance efficiency. Employing hardware and technical features of the power electronics components are the reason they are called power electronics (PE)-based methods, benefited from technical characteristics of microcontrollers used in an MPPT control system [32]. PE-based MPPT methods that also can be considered as AI-based methods are fast providing high efficiency as well as soft computing approaches [33].
3.2. Solar Power Generation and Sustainable Development
United Nation has defined 17 guiding aims, known as the Sustainable Development Goals (SDGs), establishing a framework for addressing environmental, political, economical, and human aspects of any project developments involving technologies [34]. Promised to be settled by 2030, these goals encompass various aspects of our lives and socioeconomic aiming on poverty, good health, equality, economic growth, clean water, and so on. Solar power is considered as one of the key factors for economic development due to its role in prosperity of generating electricity. The 7th goal of SDGs, affordable and clean energy, reflects the direct application of using AI techniques for efficient generation of solar power in sustainable development. To sustainably develop electricity generation, technologies used in the system production can be reviewed. Deep learning and machine learning for fulfilling of the SDGs is investigated in [35]. Although, the beneficial aspect of AI technologies have been notified in most literatures, there are a few papers presenting negative impacts of a utility-scale solar power plant on SDGs [36]. The article emphasizes the important of understanding local communities of where the power plant located, in that case Madagascar. However, a large portion of studies focus on tight relation between positive effects of solar power generation and SDGs. Considering the purpose of this article, we review the 7th goal of SDGs defining how to advance towards affordable and clean energy. As the definition of sustainable development requires [35], the main goal here is to not disrupt or compromise future generations to meet their own needs. Comparing to fossil fuels, solar energy provides substantial environmental benefits contributing to the long term development of human activities [37].
Respectfully, initial phases of every renewable energy project require significant considerations. AI-based technologies have been utilized in smart grids and renewable energy systems for more than two decades [38]. Impacts of AI can be found in forecasting, monitoring, controlling, and managing energy production in solar power sector as well [39]. As stated in section 3.1, majority of advanced and computer-based techniques use AI technology to implement algorithms in MPPT systems. Running different optimization algorithms and being flexible in transforming the functionality of the control system of a PV system allow us to conveniently and sustainably improve the entire system. In an article [40], it is emphasized the important role of local level communities in sustainable development of a solar power plant. However, we focus on technological enhancements of AI methods providing sustainability and conformity with regards to the 7th goal of SDGs.
4. Monthly Power Productions of the Case Study
Solar energy practitioners and non-technical solar power users employ PV planning tools, online applications, and software products to estimate energy outputs generated by a system. In order to submit a reliable PV planning software to report most accurate output electricity of this paper’s case study, we investigated thirty-one commercial and open-source software (the complete list is available in Annex I [41]). We finally selected System Advisor Model (SAM) to calculate energy productions of our case study, considering PV model used in the tool and validity of research studies by which the software had been designed [42,43,44,45]. Provided by the U. S. Department of Energy [14], National Renewable Energy Laboratory (NREL), it has been largely utilized by researchers and PV practitioners to plan solar energy projects. Besides, output data of more than 10 solar power plants for certain years are available publicly in the website [14] by which validation of comparable results can be reviewed. Hourly power productions of the solar power plants are available in [46]. The reported data have been measured and collected at the power plants. The measured output powers are accessible in Excel files for the entire year of 2012. The case study used in this paper is a PV system installed in one of the buildings at the National Renewable Energy Laboratory (NREL) in Golden, Colorado, in the United States, known as Research Support Facility 2 (RSF 2). The PV system provides a 408-kW solar power plant built on the roof of A-wing expansion of the RSF. It is located at 39.74_ (N), 105.18 (W), with an elevation of 1829 (m). The complete technical description of the case study can be found in [46].
SAM is a free desktop application allowing renewable energies practitioners to examine the technical, economic, and financial feasibility of renewable energy projects [14]. In addition, it provides various output reports including daily, monthly, and annually energy productions. The model uses the meteorological data available in its weather library. Using SAM simulation (version 2023.12.17), we design the PV power system choosing the same inverter and module of the actual project. Two different planning scenarios are applied to design separate PV system for the case study. Later, monthly power generations of these solar plants are compared. The new version of the design tool adds MPPTs to the design. However, there is no consideration for designing MPPT in older versions of the SAM model. We employed two different versions of SAM to simulate two scenarios: 1) a system designed without MPPT, 2) a system equipped with MPPT. SAM provides monthly and annual summaries of energy productions as well as technical characteristics of the designed system. The brand and type of the PV module used in the designs are selected likely to investigate same PV systems. In the following, both scenarios and designed PV systems are listed.
Scenario 1. PV arrays without MPPT
To design a PV system without MPPT, we employed an older version of SAM (version 2014.1.14). Table 1 projects the technical features of the designed system generating 408.3 kW power.
Scenario 2. PV arrays equipped with an MPPT control system
Using SAM (version 2023.12.17), Table 2 depicts technical characteristics of the designed PV system equipped with MPPT. Since choosing 1 or 3 MPPT systems for the PV system does not affect the estimated output power, we apply one MPPT system to eliminate more complexity and added cost to the final design.
As depicted in Table 1 and 2, the two different versions of SAM design two slightly unlike PV systems despite similarity in the input data determined for the case study. The fact is that the SAM model has been improved as well as its libraries offering more PV types with upgraded technical performances. Consequently, the same number of a certain type of module used in both scenarios generates to some extent distinct energy production, in this case about %0.5 further (410.33 kW vs 408.3 kW).
5. Discussion of Results
Using the SAM model, we compare monthly power outputs of two scenarios to determine which design projects produce more energy. Figure 4 presents the monthly power generation for the designed systems. It is noted that the designed systems do not present the actual monthly energy generations of RSF2 since the SAM model uses default typical-year (TMY) weather files for most long-term analysis. For instance, heavy snowfall results in zero energy output for the power plant in certain days that is not included in the TMY. However, the simulation reports distinct monthly power productions. These outputs are depicted in Figure 4. Comparing two monthly power productions demonstrates that the PV system equipped with MPPTs generates more energy than the designed system configured without MPPTs.
5.1. Hypothesis Testing for Both PV Systems: With and Without MPPTs
As illustrated in Figure 4, There are two sets of data presenting power generations respecting MPPT for the case study (RSF 2) for 12 months in a typical year. To understand the important role of an MPPT-based control system in increasing energy production, we perform the t-test for the results. The one tail t-test formula in Excel is used for calculating the results of the table. Our hypothesis is defined as whether the PV system equipped with MPPT control system provides the same power generation as without MPPT. The alternative hypothesis is defined as the designed PV system with MPPT provides a greater monthly power production. The hypothesis is described as:
H0: Monthly Power Production (with MPPTs) = Monthly Power Production (without MPPTs)
HA: Monthly Power Production (with MPPTs) > Monthly Power Production (without MPPTs)
The test has α = 0.05 level of significant; and normal distribution is not included as the number of comparable data is only 12 months. Table 3 presents the results showing highly correlated power productions for both scenarios, about 97%. As presented, P-value (about 2.5x10⁻⁶) is significantly less than α = 0.05, so null hypothesis is rejected stating that monthly power generations for the designed PV system equipped with MPPT offers greater energy productions.
5.2. AI-Based Approaches and Sustainable Development
As stated in section 3, solar power plants play an undeniable part in achieving the 7th goal of SDGs. The ecological footprint of a solar power plant, contrasting to other fossil fuel energy resources, is remarkably low. Considering technological aids offered by AI to the solar energy sector, we argue that AI-driven methods provide greater efficiency where shading conditions play an important role in the location of the site. Furthermore, using soft-computing techniques and microcontrollers for the purpose of MPPT address sustainability development since no environmental resources are needed to increase an existing power plant. Therefore, to establish maximum efficiency and improve technical characteristics of a solar power plant, we need to utilize AI for the development of the plant. We also argue that using MCU-based systems for MPPT purposes in fact demonstrates hardware application of AI-based technologies.
6. Conclusion
AI-driven approaches have offered immense capability in establishing sustainable development in the sector of solar power generation. This is the next step in achieving the 7th goal of SDGs, affordable and clean energy, by 2030. In this paper, we focus on how AI can improve efficiency in an existing solar power plant by including MPPT control systems in the PV system. Respecting the fact that AI-driven MPPT algorithms are the most efficient techniques for PV system, we realize that different sorts of AI technologies consisting of hardware should be considered as well. Project managers, engineers, and policy makers can employ AI methods to develop a solar power plant since minimum technical requirements needed to improve the functionality of the existing systems. Instead of adding further PV modules, we can increase energy production considering partial and full shading conditions and how to deal with it.
References
- “International energy outlook,” US Department of Energy, DOE/EIA-0484. US. [Online]. Available: http://www.eia. doe.gov/oiaf/ieo/pdf/0484(2009).pdf.
- “World energy outlook,” International Energy Agency. [Online]. Available: http:// www.iea.org/newsroomandevents/speeches/131112_WEO2013_Presenta tion.pdf.
- J. Khan and M. H. Arsalan, “Solar power technologies for sustainable electricity generation – A review,” Renewable and Sustainable Energy Reviews, vol. 55, pp. 414–425, Mar. 2016. [CrossRef]
- “Renewable Energy Statistics 2024”.
- “Solar Energy In canada,” Natural resources Canada, Apr. 2024. [Online]. Available: https://natural-resources.canada.ca/our-natural-resources/energy-sources-distribution/renewable-energy/solar-energy/25796.
- Z. Wang and R. S. Srinivasan, “A review of artificial intelligence based building energy use prediction: contrasting the capabilities of single and ensemble prediction models,” Renewable and Sustainable Energy Reviews, vol. 75, pp. 796–808, 2017. [CrossRef]
- P. A. Kumari and P. Geethanjali, “Parameter estimation for photovoltaic system under normal and partial shading conditions: A survey,” Renew. Sustain. Energy Rev., vol. 84, pp. 1–11, 2018.
- R. A. Reisi, M. Hassan Moradi, and S. Jamasb, “Classification and comparison of maximum power point tracking techniques for photovoltaic system: A review,” Renew. Sustain. Energy Rev., vol. 19, pp. 433–443, 2013.
- B. A. Alsayid, S. Y. Alsadi, J. F. S. Jallad, and M. H. Dradi, “Partial Shading of PV System Simulation with Experimental Results,” Smart Grid and Renewable Energy, vol. 4, no. 6, pp. 429–435, 2013.
- R. Ramabadran and B. Mathur, “MATLAB Based Modelling and Performance Study of Series Connected SPVA under Partial Shaded Conditions,” Sustainable Development, vol. 2, no. 3, p. 10, 2009.
- F. Khosrojerdi, S. Gagnon, and R. Valverde, “Identifying Influential Factors Affecting the Shading of a Solar Panel,” in 2021 IEEE Electrical Power and Energy Conference (EPEC), Toronto, ON, Canada: IEEE, Oct. 2021, pp. 255–260. [CrossRef]
- F. Khosrojerdi, S. Gagnon, and R. Valverde, “Full Shading for Photovoltaic Systems Operating under Snow Conditions,” in 2021 IEEE 9th International Conference on Smart Energy Grid Engineering (SEGE), Oshawa, ON, Canada: IEEE, Aug. 2021, pp. 82–87. [CrossRef]
- R. W. Andrews, A. Pollard, and J. M. Pearce, “The effects of snowfall on solar photovoltaic performance,” Solar Energy, vol. 92, pp. 84–97, 2013.
- System Advisor Model (SAM). NREL. [Online]. Available: https://sam.nrel.gov/.
- F. Khosrojerdi, S. Gagnon, and R. Valverde, “Proposing an Ontology Model for Planning Photovoltaic Systems,” MAKE, vol. 3, no. 3, pp. 582–600, Jul. 2021. [CrossRef]
- R. Santhiya, A. Senthilnathan, V. K. Chinnaiyan, and R. N. Priya, “Grid Connected Multilevel Inverter and MPPT for Photovoltaic System,” vol. 3, no. 26, pp. 201–211, 2015.
- Y. H. Liu, S. C. Huang, J. W. Huang, and W. C. Liang, “A Particle Swarm Optimization-Based Maximum Power Point Tracking Algorithm for PV Systems Operating Under Partially Shaded Conditions,” IEEE Transactions on Energy Conversion, vol. 27, no. 4, pp. 1027–1035, 2012.
- R. Jordehi, “Maximum power point tracking in photovoltaic (PV) systems: A review of different approaches,” Renewable and Sustainable Energy Reviews, vol. 65, pp. 1127–1138, 2016.
- W. Na, T. Carley, L. Ketcham, B. Zimmer, and P. Chen, “Simple DSP Implementation of Maximum Power Pointer Tracking and Inverter Control for Solar Energy Applications,” Journal of Power and Energy Engineering, vol. 4, no. 9, pp. 61–76, 2016.
- “Energy Harvesting: Solar. Available:,” Texas Instruments, 2017. [Online]. Available: www.ti.com/solar.
- R. Sridhar, S. Jeevananthan, S. S. Dash, and N. T. Selvan, “Unified MPPT Controller for Partially Shaded Panels in a Photovoltaic Array,” International Journal of Automation and Computing, vol. 11, no. 5, pp. 536–542, 2015.
- I. Guaita-Pradas, I. Marques-Perez, A. Gallego, and B. Segura, “Analyzing territory for the sustainable development of solar photovoltaic power using GIS databases,” Environ Monit Assess, vol. 191, no. 12, p. 764, Dec. 2019. [CrossRef]
- R. Pierdicca, M. A. Paolanti, F. Piccinini, and P. Zingaretti, “Automatic faults detection of photovoltaic farms: SolAIr, a deep learning-based system for thermal images,” Energies, vol. 13, p. 6496, 2020.
- M. Cordeiro-Costas, D. Villanueva, P. Eguía-Oller, and E. Granada-Álvarez, “Machine learning and deep learning models applied to photovoltaic production forecasting,” Appl. Sci., vol. 12, p. 8769, 2022.
- R. Akpahou, L. D. Mensah, D. A. Quansah, and F. Kemausuor, “Energy planning and modeling tools for sustainable development: A systematic literature review,” Energy Reports, vol. 11, pp. 830–845, Jun. 2024. [CrossRef]
- M. A. Hannan et al., “Impact of renewable energy utilization and artificial intelligence in achieving sustainable development goals,” Energy Reports, vol. 7, pp. 5359–5373, Nov. 2021. [CrossRef]
- P. Joshi and S. Arora, “Maximum power point tracking methodologies for solar PV systems – A review,” Renewable and Sustainable Energy Reviews, vol. 70, pp. 1154–1177, 2017.
- Jordehi, “Maximum power point tracking in photovoltaic (PV) systems: A review of different approaches,” Renewable and Sustainable Energy Reviews, vol. 65, pp. 1127–1138, 2016.
- A. Gupta, Y. K. Chauhan, and R. K. Pachauri, “A comparative investigation of maximum power point tracking methods for solar PV system,” Solar Energy, vol. 136, pp. 236–253, 2016.
- S. Mirjalili and S. M. Mirjalili, “Grey Wolf Optimizer,” Advances in Engineering Software, vol. 69, pp. 46–61, 2014.
- A. K. Tripathi et al., “Advancing solar PV panel power prediction: A comparative machine learning approach in fluctuating environmental conditions,” Case Studies in Thermal Engineering, vol. 59, p. 104459, Jul. 2024. [CrossRef]
- A. Elbaset, A. E. Hussein, A. Brisha, and R. E. Mostafa, “Implementation of a PIC-based, Photovoltaic Maximum Power Point Tracking Control System,” International Journal of Emerging Technology and Advanced Engineering, vol. 4, no. 5, p. 10, 2014.
- P. S. Shenoy and K. A. Kim, “Differential power processing for increased energy production and reliability of photovoltaic systems,” IEEE Trans Power Electronics, vol. 68, no. 6, p. 2013.
- “The-Sustainable-Development-Goals-Report-2020.”.
- A. Singh, A. Kanaujia, V. K. Singh, and R. Vinuesa, “Artificial intelligence for Sustainable Development Goals : Bibliometric patterns and concept evolution trajectories,” Sustainable Development, p. sd.2706, Jul. 2023. [CrossRef]
- C. Brunet et al., “Impacts Generated by a Large-Scale Solar Photovoltaic Power Plant Can Lead to Conflicts between Sustainable Development Goals: A Review of Key Lessons Learned in Madagascar,” Sustainability, vol. 12, no. 18, p. 7471, Sep. 2020. [CrossRef]
- N. S. M. N. Izam, Z. Itam, W. L. Sing, and A. Syamsir, “Sustainable Development Perspectives of Solar Energy Technologies with Focus on Solar Photovoltaic—A Review,” Energies, vol. 15, no. 8, p. 2790, Apr. 2022. [CrossRef]
- F. Khosrojerdi, O. Akhigbe, S. Gagnon, A. Ramirez, and G. Richards, “Integrating artificial intelligence and analytics in smart grids: a systematic literature review”.
- U. Rusilowati, H. Rasmita Ngemba, R. Wahyudin Anugrah, A. Fitriani, and E. Dian Astuti, “Leveraging AI for Superior Efficiency in Energy Use and Development of Renewable Resources such as Solar Energy, Wind, and Bioenergy,” ITALIC, vol. 2, no. 2, pp. 114–120, Jun. 2024. [CrossRef]
- S. N. Panda et al., “Solar Energy’s Role in Achieving Sustainable Development Goals in Agriculture,” IJECC, vol. 14, no. 5, pp. 10–31, May 2024. [CrossRef]
- F. Khosrojerdi, “An Ontology-Based Decision-Making Framework Modeling Power Efficiency for Photovoltaic Systems,” Université du Québec en Outaouais, 2020.
- J. Freeman, J. Whitmore, N. Blair, and A. P. Dobos, “Validation of Multiple Tools for Flat Plate Photovoltaic Modeling Against Measured Data,” NREL, 2014.
- J. Freeman, J. Whitmore, L. Kaffine, N. Blair, and A. P. Dobos, “System Advisor Model: Flat Plate Photovoltaic Performance Modeling Validation Report,” NREL/TP--6A20-60204, 1115788, Dec. 2013. [CrossRef]
- B. Bourne, “PVSim and Solar Energy System Performance Modeling,” SunPower Corporation, 2009.
- G. Klise, J. Freeman, O. Lavrova, and R. Gooding, “PV-RPM v2.0 beta – SAM Implementation DRAFT User Instructions,” Sandia National Laboratories & National Renewable Energy Laboratory, 2017.
- NREL, “PV Case Studies and Validation (accessed on 28 July 2021). https://sam.nrel.gov/photovoltaic/pvvalidation. html,” NREL PV Validation 2013.
Figure 1.
Equivalent circuit of a PV cell.
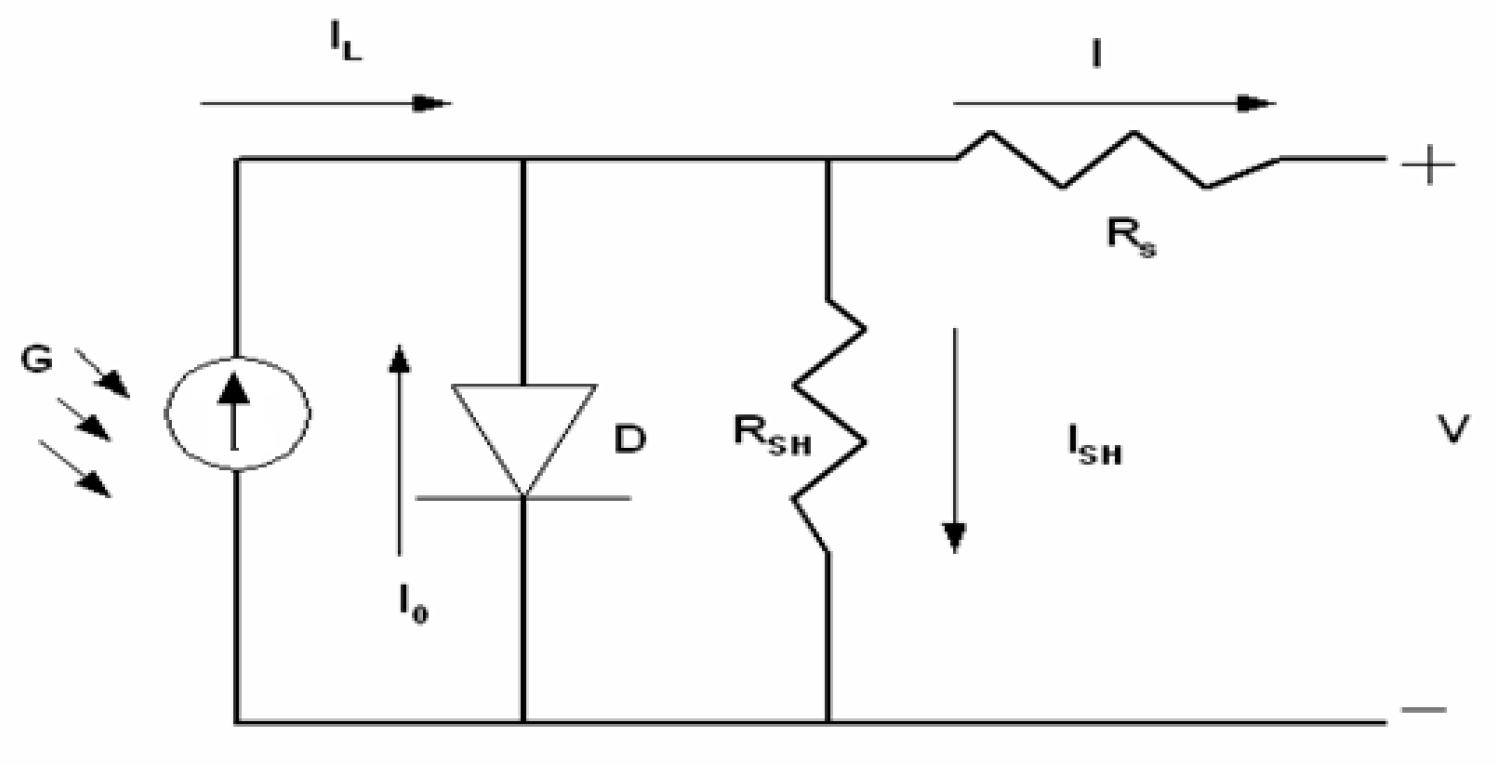
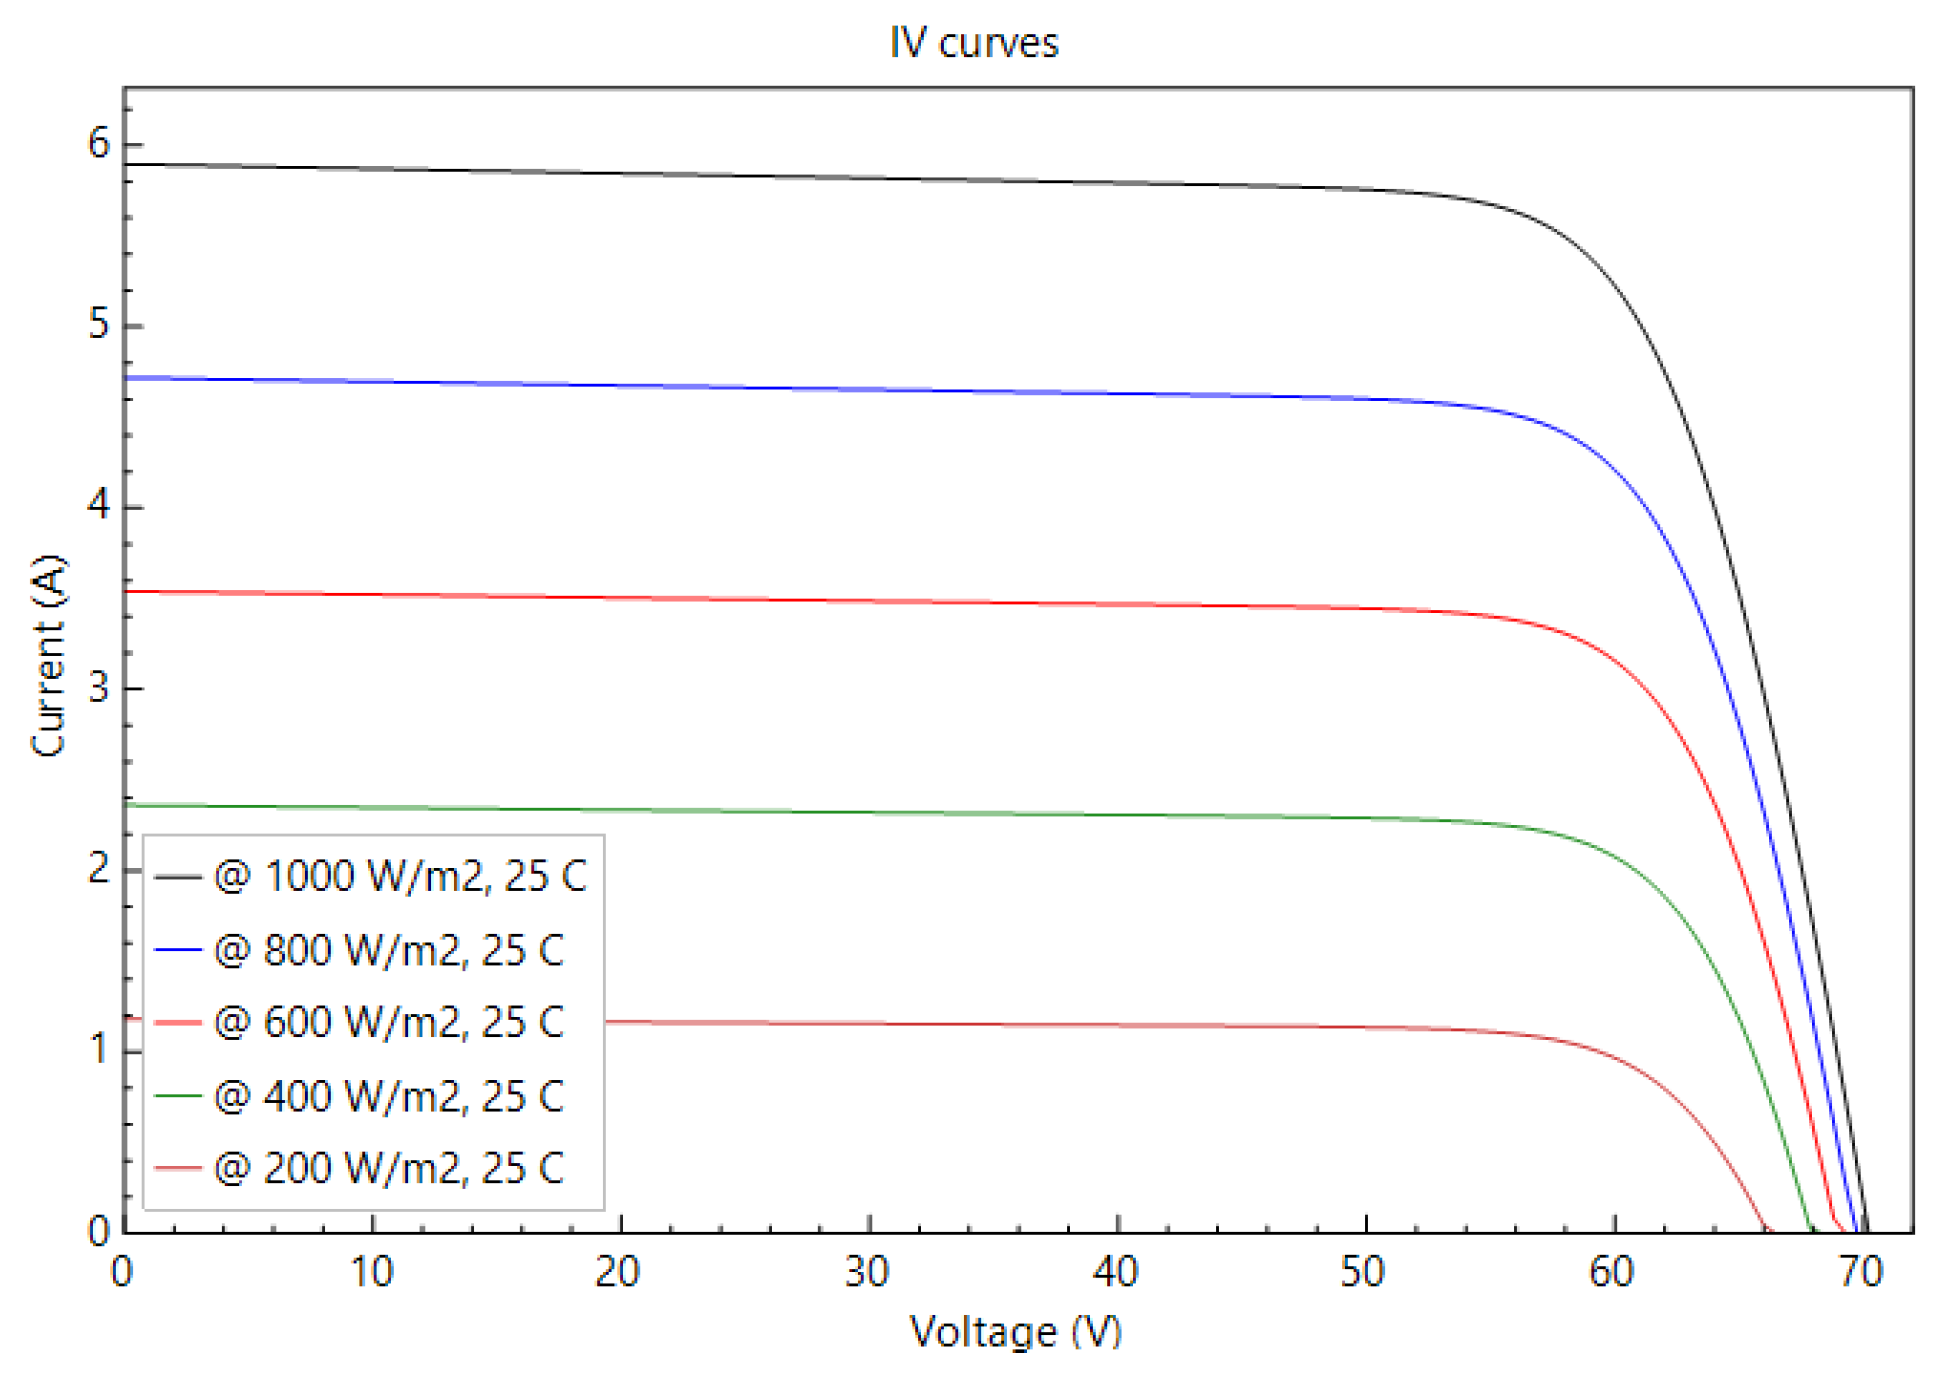
Figure 3.
The P-V and I-V characteristics of the partially shaded PV arrays.
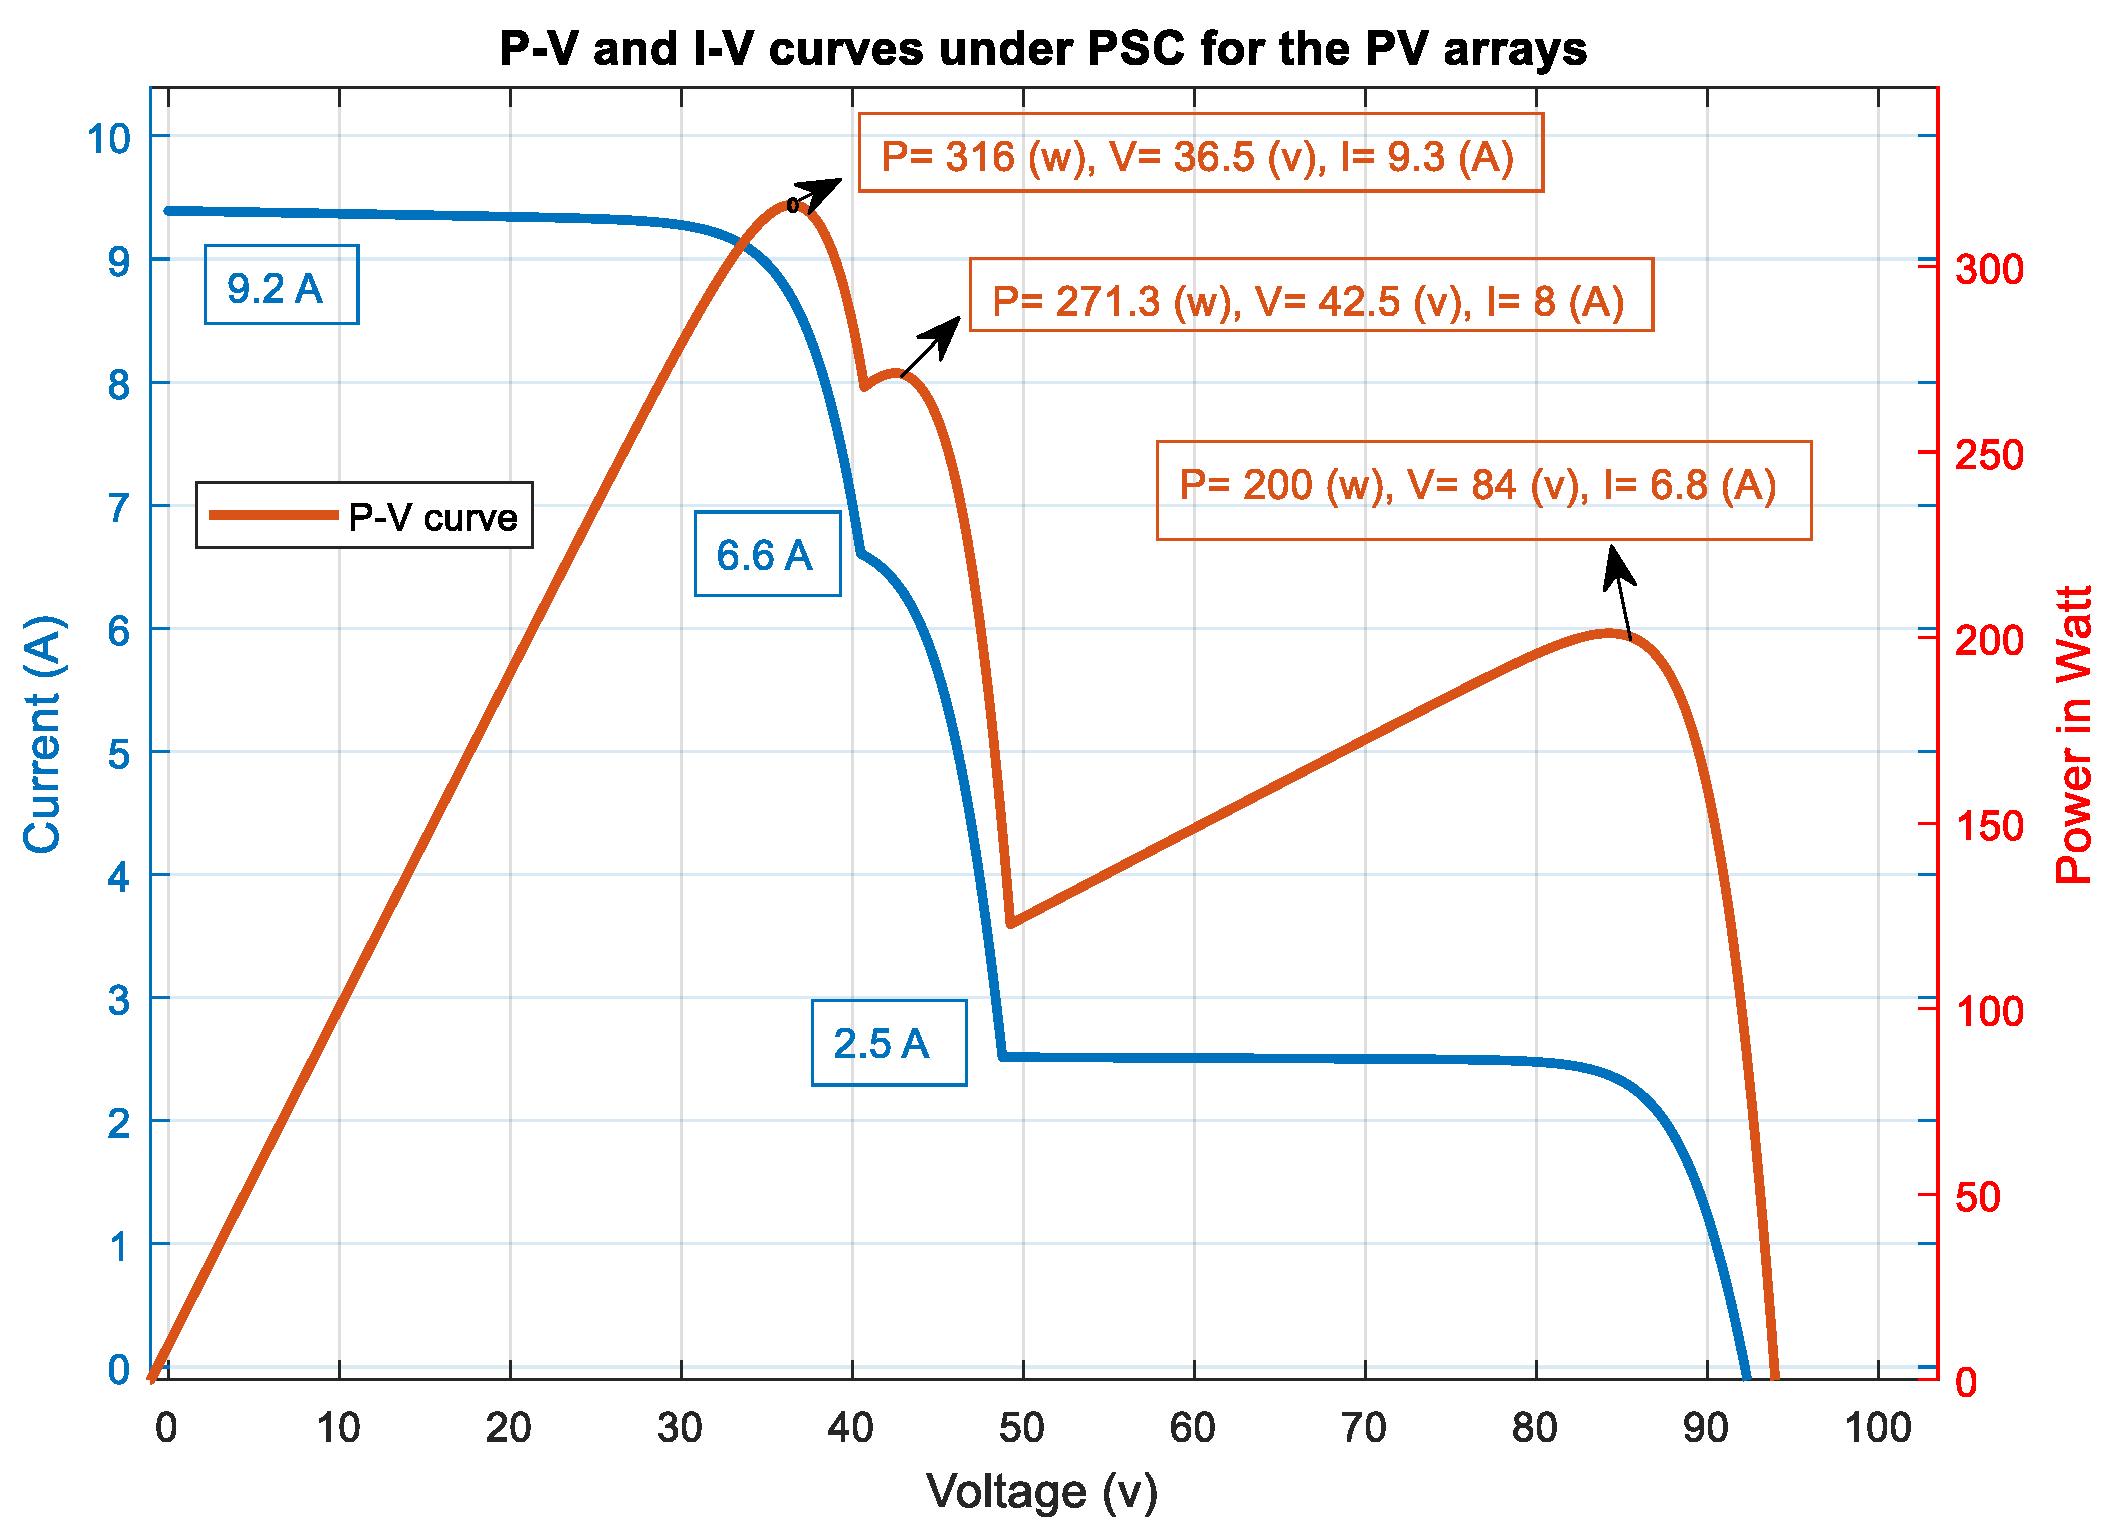
Figure 4.
Monthly power production for the case study.
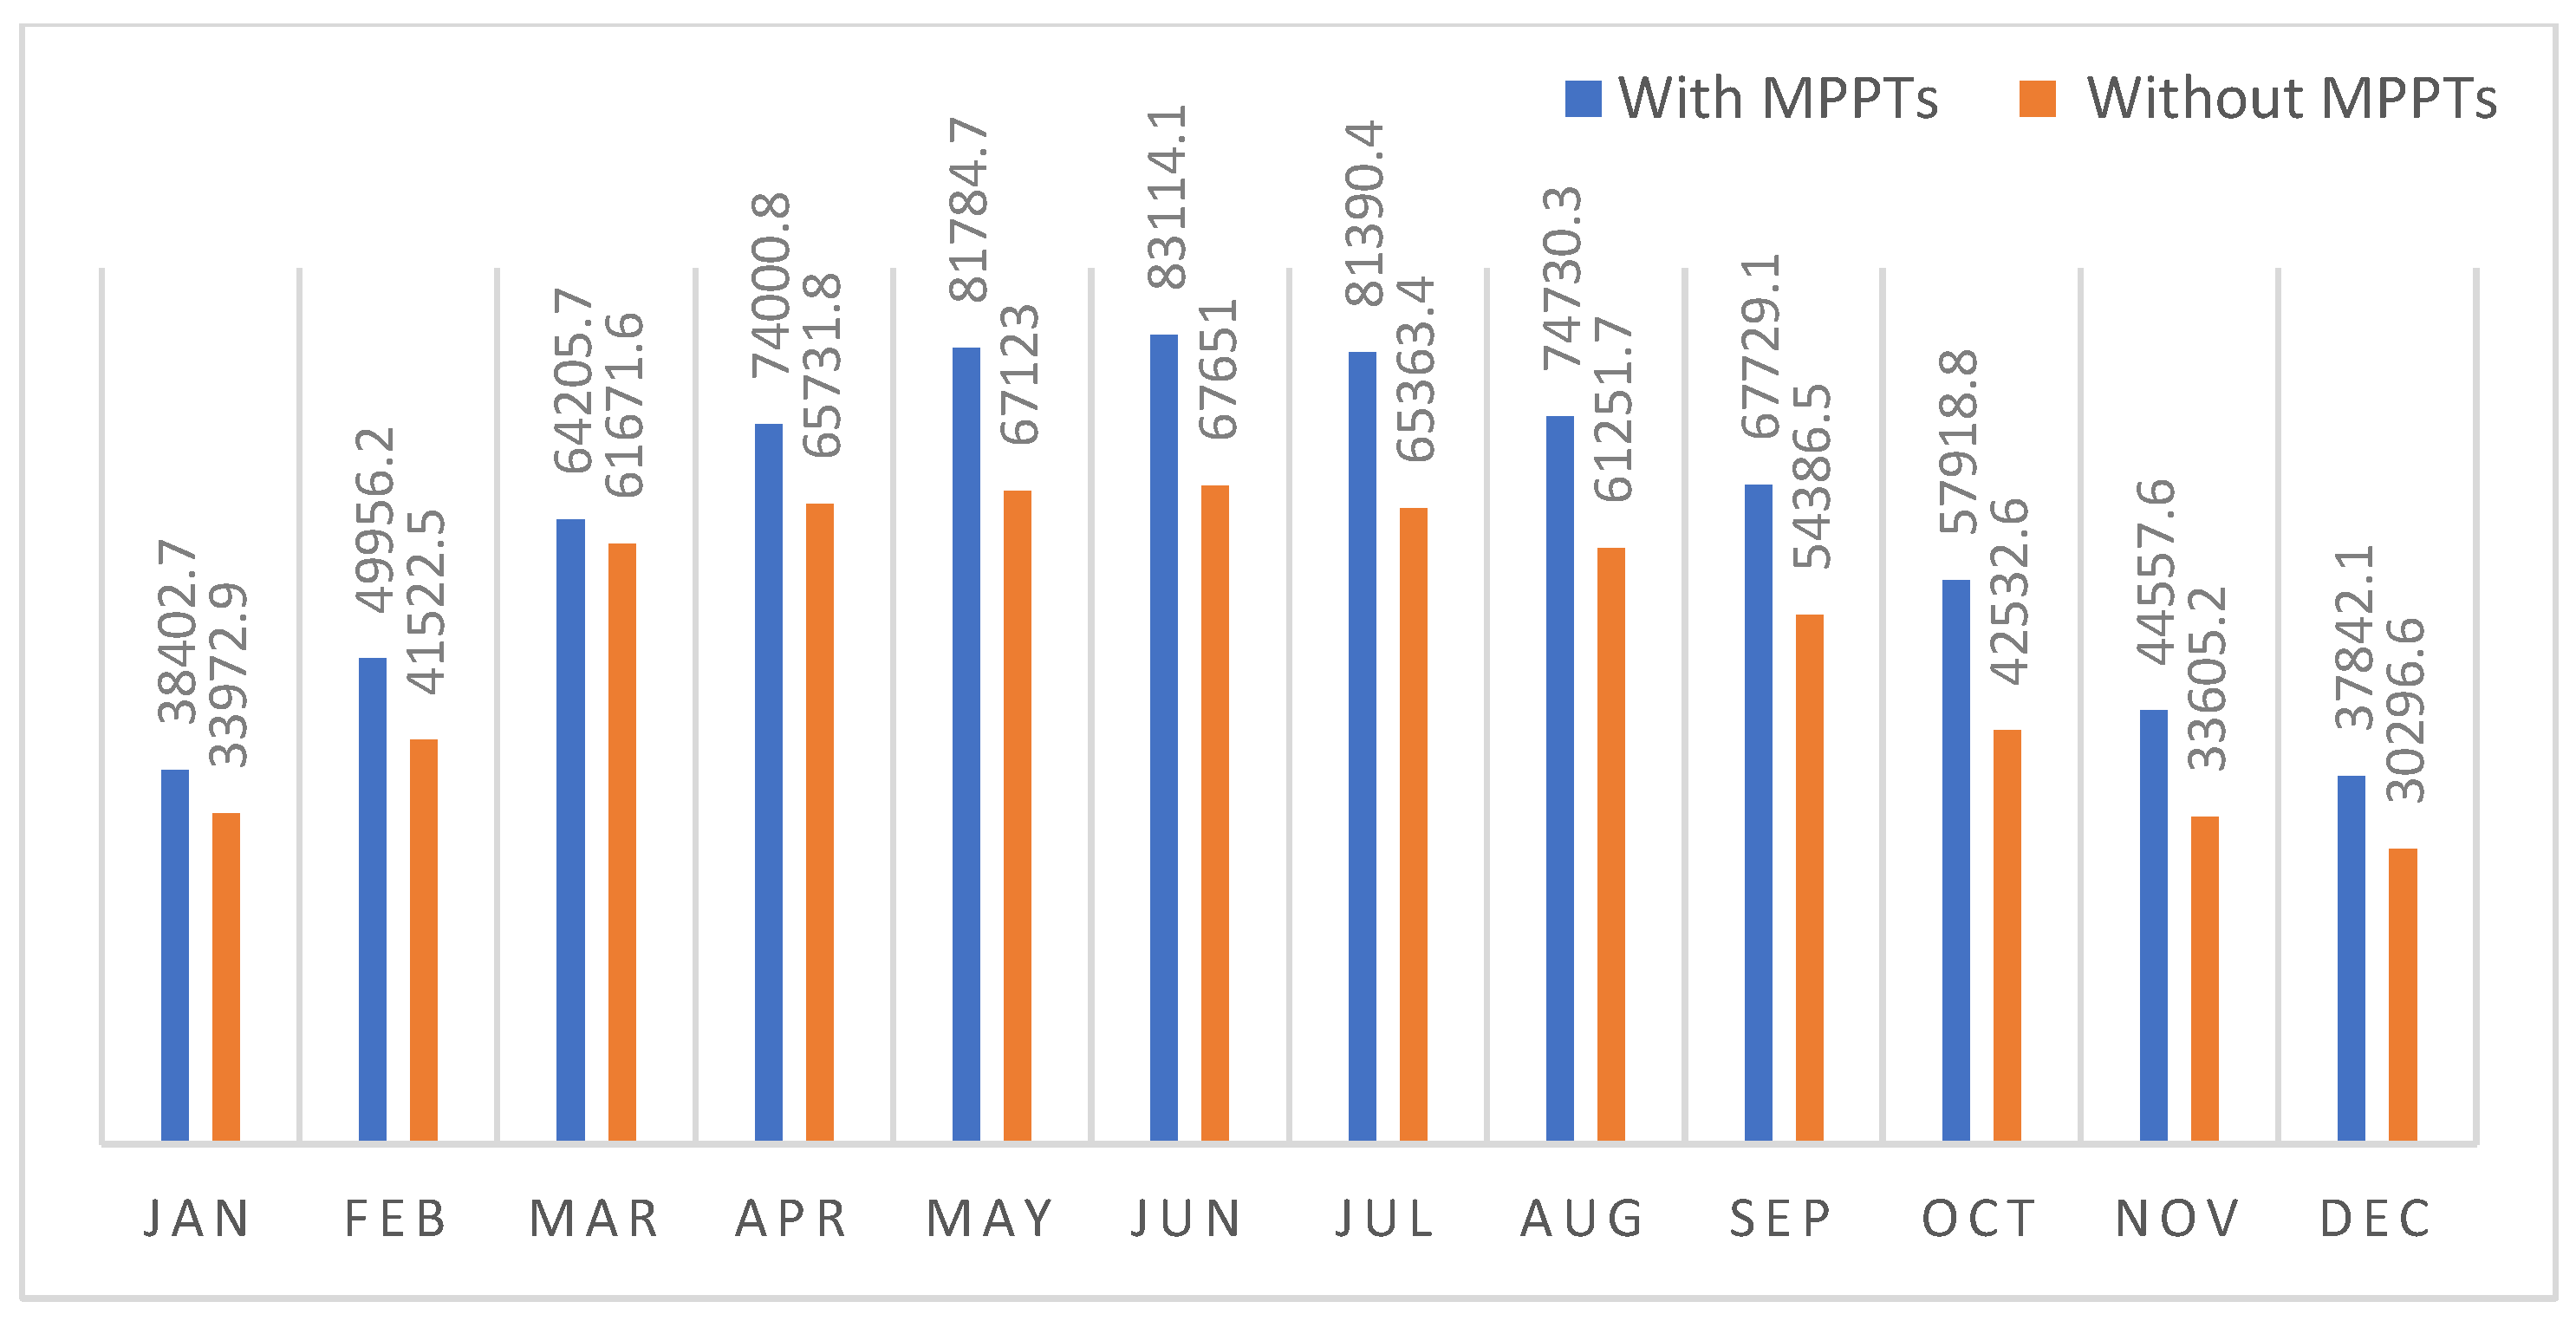

Table 1.
Technical characteristics of the case study without MPPT.
| Technical Term | Value |
| Nameplate DC | 408.3 DC (kW) |
| Modules—number and type | 1,323 (SunPower SPR-E19-310-COM) |
| Strings | 162 |
| Modules per string | 8 |
| Inverters—number and type | 1 (SC2500U) |
| Number of strings | 63 |
Table 2.
Sizing summary of the PV system for NREL’s RSF 2 building.
| Technical Term | Value |
| Nameplate DC | 410.33 DC (kW) |
| Modules—number and type | 1,323 (SunPower SPR-E19-310-COM) |
| Strings | 63 |
| Modules per string | 21 |
| Inverters—number and type | 1 (SC2500U) |
| Number of strings | 63 |
| MPPT voltage range | 800-1500 (V) DC |
Table 3.
t-Test results for monthly productions: adding MPPTs to the PV system (RSF 2).
| With MPPTs | Without MPPTs | |
| Mean | 62969.37 | 52092.4 |
| Variance | 286554699.79 | 214483699.21 |
| Pearson Correlation | 0.9683194 | |
| t Stat | 8.2306124 | |
| P (T< = t) one-tail | 2.4902145E-06 | |
| T Critical one-tail | 1.7958848 | |
Disclaimer/Publisher’s Note: The statements, opinions and data contained in all publications are solely those of the individual author(s) and contributor(s) and not of MDPI and/or the editor(s). MDPI and/or the editor(s) disclaim responsibility for any injury to people or property resulting from any ideas, methods, instructions or products referred to in the content. |
© 2025 by the authors. Licensee MDPI, Basel, Switzerland. This article is an open access article distributed under the terms and conditions of the Creative Commons Attribution (CC BY) license (http://creativecommons.org/licenses/by/4.0/).
Copyright: This open access article is published under a Creative Commons CC BY 4.0 license, which permit the free download, distribution, and reuse, provided that the author and preprint are cited in any reuse.


