Preprint
Article

This version is not peer-reviewed.

Comparing Effects of the Proximity to Tree Trunks on Soil Nutrients and Fluorescence Spectral Characteristics of Dissolved Organic Carbon: A Case-Study of the Daqinggou National Nature Reserve in Southeastern Inner Mongolia

A peer-reviewed article of this preprint also exists.

Submitted:

14 February 2025

Posted:

17 February 2025

You are already at the latest version

Abstract

Vegetation restorations are crucial strategies for combating land degradation, yet their mechanisms on improving soil quality, especially from perspective of soil fertility, remain far from clear. Sparse trees in semi-arid savanna grasslands (i.e., climate communities) offer a provoking reference for vegetation restoration. Here, taking advantage of Ulmus macrocarpa Hance fertile islands of the savanna ecosystem in the Daqinggou National Nature Reserve, this study aimed to investigate the vertical and horizontal distribution patterns of soil physicochemical properties and DOC fluorescence spectral characteristics. Results showed that soil organic carbon (SOC) and DOC were significantly decreased with both the increasing distance from tree and increasing soil depth. Horizontal and vertical treatments significantly enhanced fluorescence intensities of DOC. Additionally, the soil under canopy exhibited slightly richer concentrations of NH4+–N, NO3––N, TN, and TP at topsoil compared with deep soils. The SOC, TN, TP, NH4+–N, and NO3––N showed significantly positive relationships with the DOC. The study provides evidence that trees can form fertile island effects and enhance soil nutrients and DOC. These results are vital for guiding vegetation restoration degraded ecosystem in semi-arid area.

Keywords: 
;  ;  ;  ;  

1. Introduction

Sandy land ecosystem, a fragile and typical terrestrial ecosystem in China, plays critical roles in maintaining global ecological security and the regional carbon balance [1,2] and is threaten by land degradation. Land degradation in these ecosystems (e.g., desertification) due to natural and human factors results in declining in soil fertility and vegetation cover [3,4,5,6]. To protect and restore the ecological environment, ecological engineering projects (e.g., the “Three-North” project, “Zero” Net Land Degradation, and Bonn Challenge, etc.) were conducted by governments or social organizations and show significance in preventing soil degradation (i.e., the core of land degradation) [7,8,9,10,11]. In these projects, vegetation restoration (e.g., artificial restoration, natural restoration, and closure restoration, etc.) demonstrates vital significance on climate change mitigation, carbon sink function enhancement, and soil quality improvement [12,13,14,15]. Although, researchers have demonstrated that both artificial vegetation restoration and natural vegetation restoration can enhance the soil quality and extremely promote the carbon sequestration process, especially in surface soil [16,17,18,19], the mechanisms of vegetation restoration on combating soil degradation, especially from perspective of soil fertility, remains far to clear.
Soil organic carbon (SOC) is a comprehensive index of soil quality in terms of carbon pool, soil fertility, and soil biodiversity. SOC content is reported to be influenced by a variety of factors, including vegetation structure (e.g., vegetation type, diversity, and cover), as well as climatic conditions (e.g., temperature and precipitation) and decomposition rates, which regulate the balance between carbon inputs and losses [20,21,22,23,24]. Despite the growing body of evidence suggesting the significant influence of vegetation on soil carbon storage and sequestration, there remains a lack of comprehensive studies examining the specific effects of trees on SOC and its more labile fractions. Especially, labile fractions of soil OC, such as dissolved organic carbon (DOC), has a short turnover time and been suggested as sensitive indicators of SOC changes [25,26] and process of microbial activities in organic matter mineralization and nutrient releasing [27,28]. DOC is easily accessed and utilized as energy sources by soil microbe biomass, particularly by r-strategy bacteria [27,29], and its complex organic compound is sensitive to soil environmental changes [30,31], thus affecting soil organic C cycling and movement of nutrients [32,33]. Tree presence influences SOC and DOC through mechanisms like litter fall, root exudates, and microclimatic modifications, which often lead to spatially heterogeneous distribution patterns. These effects tend to decrease with increasing distance from the stem. However, not all studies have observed consistent horizontal variation in SOC. For example, Oelbermann & Voroney [34] demonstrated that SOC in a temperate agroforestry system did not necessarily vary with distance from trees, highlighting the complexity of SOC dynamics under different environments. Therefore, understanding the spatial variation of SOC and DOC with tree distance is particularly significant in arid and semi-arid ecosystems. Further, a detailed analysis of DOC at varying distances from tree trunk and soil depths can provide new insights into the spatial dynamics of SOC in these ecosystems.
Soil nutrients, including nitrogen (N) and phosphorus (P), are important indicators of soil fertility and essential for maintaining plant growth and supporting soil biological activity, particularly in nutrient-poor environments. Promotions of soil nutrient is one of the main targets for vegetation restoration in sandy land ecosystem [35,36]. Fang et al. [37] reported that soil nutrients are heterogeneously distributed and can be affected by plant roots and litter fall. Gao et al. [38] demonstrated that the greater organic matter input through litter fall and root turnover under P. fruticosa fed a larger microbial biomass that increased the organic phosphorus content in the topsoil under the shrubs compared to grasses. Ma et al. [39] investigated the differences in soil nitrogen content in open areas and beneath shrub canopies, and found that soil total nitrogen and organic nitrogen were significantly greater beneath plant canopies than in open areas. The distributions of soil nutrients and SOC in sparse wood grasslands have been studied in various regions. However, the role of distance from tree canopies in influencing soil properties remains understudied in semi-arid ecosystems, where trees often create localized “fertile islands” effects in nutrient-poor soils. While many studies have demonstrated that SOC and nutrient levels typically decrease with increasing distance from trees [40], there are cases where this trend is less pronounced for different soil depths due to abiotic drivers such as precipitation and temperature Ma et al. [39]. In addition, plants and soil feedback as a system of mutual effects and limitations during vegetation restoration [41]. While plants often improve soil conditions by increasing organic matter inputs and enhancing nutrient cycling, this can also limit re-vegetation through competition for water and nutrients, invasive plant, or changes in soil properties [42,43,44]. These limitations, particularly in semi-arid ecosystems like sparse wood grasslands, highlight the need to balance the positive and negative effects of plants on soil and vegetation dynamics during restoration efforts. Hence, understanding how tree species influence soil nutrient distribution in savanna would be valuable for better management and guidance of vegetation restoration in the degraded lands.
Feasible and effective restoration approaches obtained by persistently exploring nature may be useful to the harmonious and healthy development of regional ecology and economy. Horqin Sandy Land, one of the four mega-sandy lands in China, is limited by soil nutrients due to poor soil structure and easily threatened by land degradation [5]. Elm-dominated savanna (sparse wood grasslands), the climax community adapting to the semi-arid climate, plays an important role in maintaining ecological stability of the region [45]. While earlier studies have primarily focused on the spatial distribution of woody plants and their interactions with grass species [46,47], the specific role of these woody plants in impacting spatial distribution characteristics of soil nutrient and labile soil organic carbon fraction (such as DOC), particularly in creating fertile islands beneath their canopies, remains unknown [48,49]. The climax community, which represents the stable and final stage of vegetation succession under specific climatic conditions, could provide an important reference for guiding vegetation restoration efforts by reflecting the optimal adaptation of vegetation to the local environment. Therefore, understanding the effects of elm trees on soil fertility (i.e., DOC, N, P, etc.) is beneficial for vegetation restoration and healthy development of fragile sandy lands.
In this investigation, we studied the changes in soil nutrients and fluorescence spectral characteristics of DOC, probing up to 30 cm soil depth in an elm (Ulmus macrocarpa Hance)-dominated sparse wood grasslands ecosystem in the Horqin Sandy Land. This research aims to elucidate the effect of woody plants on the spatial distribution of soil properties and DOC fractions in temperate sparse wood grasslands. We hypothesized that (1) due to tree causing fertile island effect, the distribution patterns of soil nutrient content will decrease with the increase of distance from tree and soil depth, and the decrease intensity depends on the distance from trees; and (2) the changes in soil DOC content and intensity of fluorescence excitation–emission matrix spectra (EEMS) are consistent in the sparse wood ecosystem, which will decrease with the increasing distance from tree and soil depth. The results will help us to have a deeper understanding of the effects of tree, and provide supporting data for carbon sequestration capabilities in savanna grasslands ecosystem. Furthermore, our results will be helpful for guiding afforestation and sustainable managements of degraded ecosystem to improve SOC and nutrient contents in arid and semi-arid area.

2. Materials and Methods

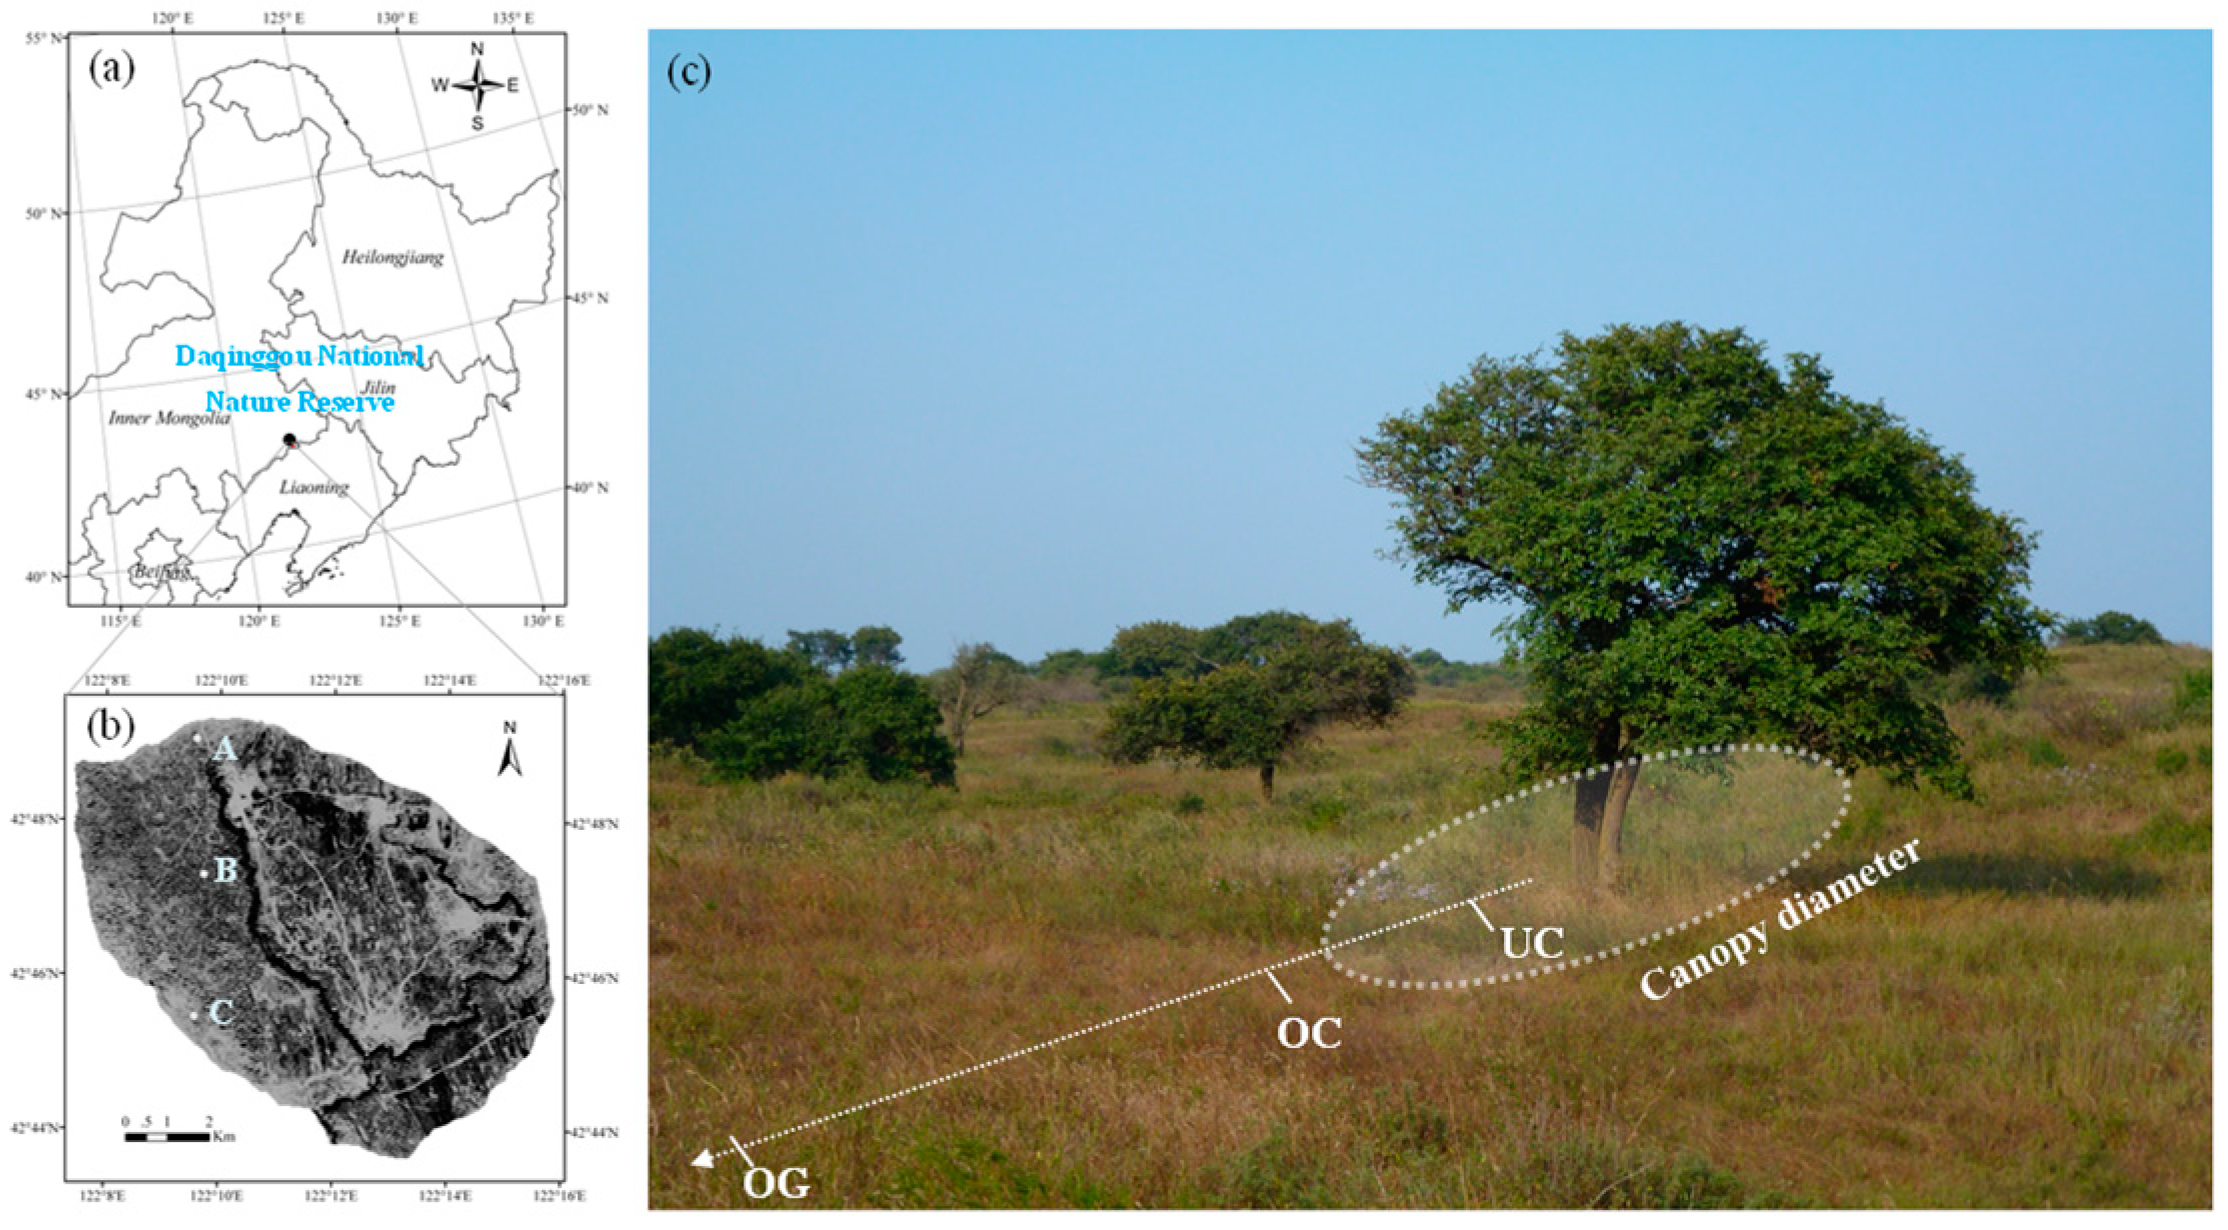
2.1. Study Area Description

The research was conducted in the Daqinggou National Nature Reserve (122°7′25″–122°15′42″E, 42°43′40″–42°49′18″N), southeastern Inner Mongolia, China (approximately 240 m above sea level). The nature reserve has a semi-arid climate and an area of about 8183 hm² (Figure 1). Soil type within the reserve is dominated by aeolian deposits sandy soil (90.9% sand, 5.0% silt, and 4.1% clay) [50]. In this nature reserve, forest and grassland are main types of vegetation cover, which are not allowed to cut down and graze since 1988 (i.e., protected from 1988). Forests in the protected areas mainly consist of elm sparse wood grassland and Mongolian pine plantation. Main species in the grassland are Cleistogeness quarrosa, Artemisia gmelinii, Lespedeza daurica, Thalictrum squarrosum, and Potentilla chinensis.

2.2. Soil Collection

To reduce the damage for soil of the reserve, three sampling plots (50 m × 50 m) were selected within the western site of the Daqinggou (Figure 1). Within each plot, three trees (Ulmus macrocarpa Hance) with similar crown radius (CR), height (H), and diameter at breast height (DBH) were selected to reduce influences of different species and sizes of trees on soil properties. On average, these trees have a CR of 3.83 ± 0.06 m, H of 7.70 ± 0.10 m, and DBH of 28.00 ± 0.46 cm. Referring to Pandey et al. [51] and Gindaba et al. [52], sampling locations were chosen to be 2 m to 20 m away from the tree trunks, i.e., under canopy (UC), outside canopy (OC) and open grassland (OG). In August 2019, soil samples along soil profile (i.e., 0–5, 5–10, and 10–30 cm) were collected by excavating soil profiles in east, south, west, and north around every investigating tree for three horizontal distances (UC, OC, and OG). The samples from the four directions (i.e., east, south, west, and north) at the same distance and depth were combined into one composite sample. In total, 27 soil samples (3 distances × 3 depths × 3 replicates) were collected for laboratory analysis. Meanwhile, four soil cores of each layer were obtained by stainless soil corers (100 cm3) for investigation on soil bulk density (BD). Before analysis, a part of soil samples were air dried at room temperature for several days and passed through a 2 mm sieve to remove debris. The other soil samples was stored under refrigeration for measuring soil moisture, ammonium nitrogen (NH4+–N), nitrate nitrogen (NO3–N), and DOC.

2.3. Laboratory Analyses

A 40-g soil sample was used for pH analysis, performed with a pH meter (PHS-3C, China) in a 1:2.5 soil-water ratio. The air dried soils were grounded with a ceramic mortar, and finally sieved through a 0.25 mm sieve for analysis of SOC, TN, and TP. SOC was determined by K2Cr2O7 and 98% H2SO4 wet oxidation method [53]. TN and TP were quantified with a continuous-flow autoanalyzer (AutoAnalyzer III, Germany) following digestion in 98% H2SO4 and CuSO4. The soil bulk density samples were oven-dried at 105 ℃ until constant mass achieved, then weighed to calculate dry soil mass per unit volume.
Soil moisture was determined via the oven-drying method. NH4+–N and NO3–N were quantified using the continuous-flow autoanalyzer after extracting fresh soil samples with 50 mL of 2 mol L–1 KCl solution [54]. Soil DOC content was measured by a TOC analyzer (Vcpn, Japan). In brief, 20 g of fresh soil was mixed with 50 mL of deionized water, shaken for one hour at 25 ℃, and then centrifuged at 6000 rpm for 30 minutes. The supernatant was filtered through a 0.45 μm membrane and stored at 4 ℃ prior to analysis. To understand the role of trees as micro-environmental factors influencing fluorescence spectral characteristics of DOC, we analyzed the functional components and fluorescence intensity of DOC across different soil depths using three-dimensional fluorescence spectra. The fluorescence EEMS characteristics of DOC were measured using a spectrofluorometer (Varian, USA), with an excitation range of 220–400 nm and emission of 300–600 nm at 5 nm increments. Additionally, fluorescence indicators of DOC including fluorescence index (FI) and biological index (BIX) were calculated. FI and BIX indicate that source of DOC and size of DOC autochthonous contribution, respectively [55,56,57].

2.4. Calculation of SOC Density and DOC Fluorescence Indicators

SOC density (SOCd) was calculated by Eq. (1):
SOCd = SOCc × BD× Depth / 100
where, SOCd represents the SOC density (kg m–2); SOC is soil organic carbon content (g kg–1); BD is the bulk density (g cm–3); and Depth is the thickness of each soil depth (cm).
Fluorescence index (FI) and biological index (BIX) were calculated by Eqs. (2) –(3).
F I = I λ Em = 450 nm I λ Em = 500 nm , with λ Ex = 370 nm
B I X = I λ Em = 380 nm I λ Em = 430 nm , with λ Ex = 310 nm
where IλEm is fluorescence intensity emitted at a certain wavelength (450, 500, 380 or 430 nm); λEx is a fixed excitation wavelength of 370 or 310 nm.

2.5. Statistical Analyses

To test the effects of distances and depth on soil nutrients and fluorescence spectral characteristics, one-way and two–way ANOVA tests were conducted by using the SPSS 16.0 software. The least significant difference analysis (LSD) was performed to determine the differences of the soil variable among treatments. Pearson’s correlation coefficients were used to identify the relationships among all variables. The significance level was set at 0.05.

3. Results

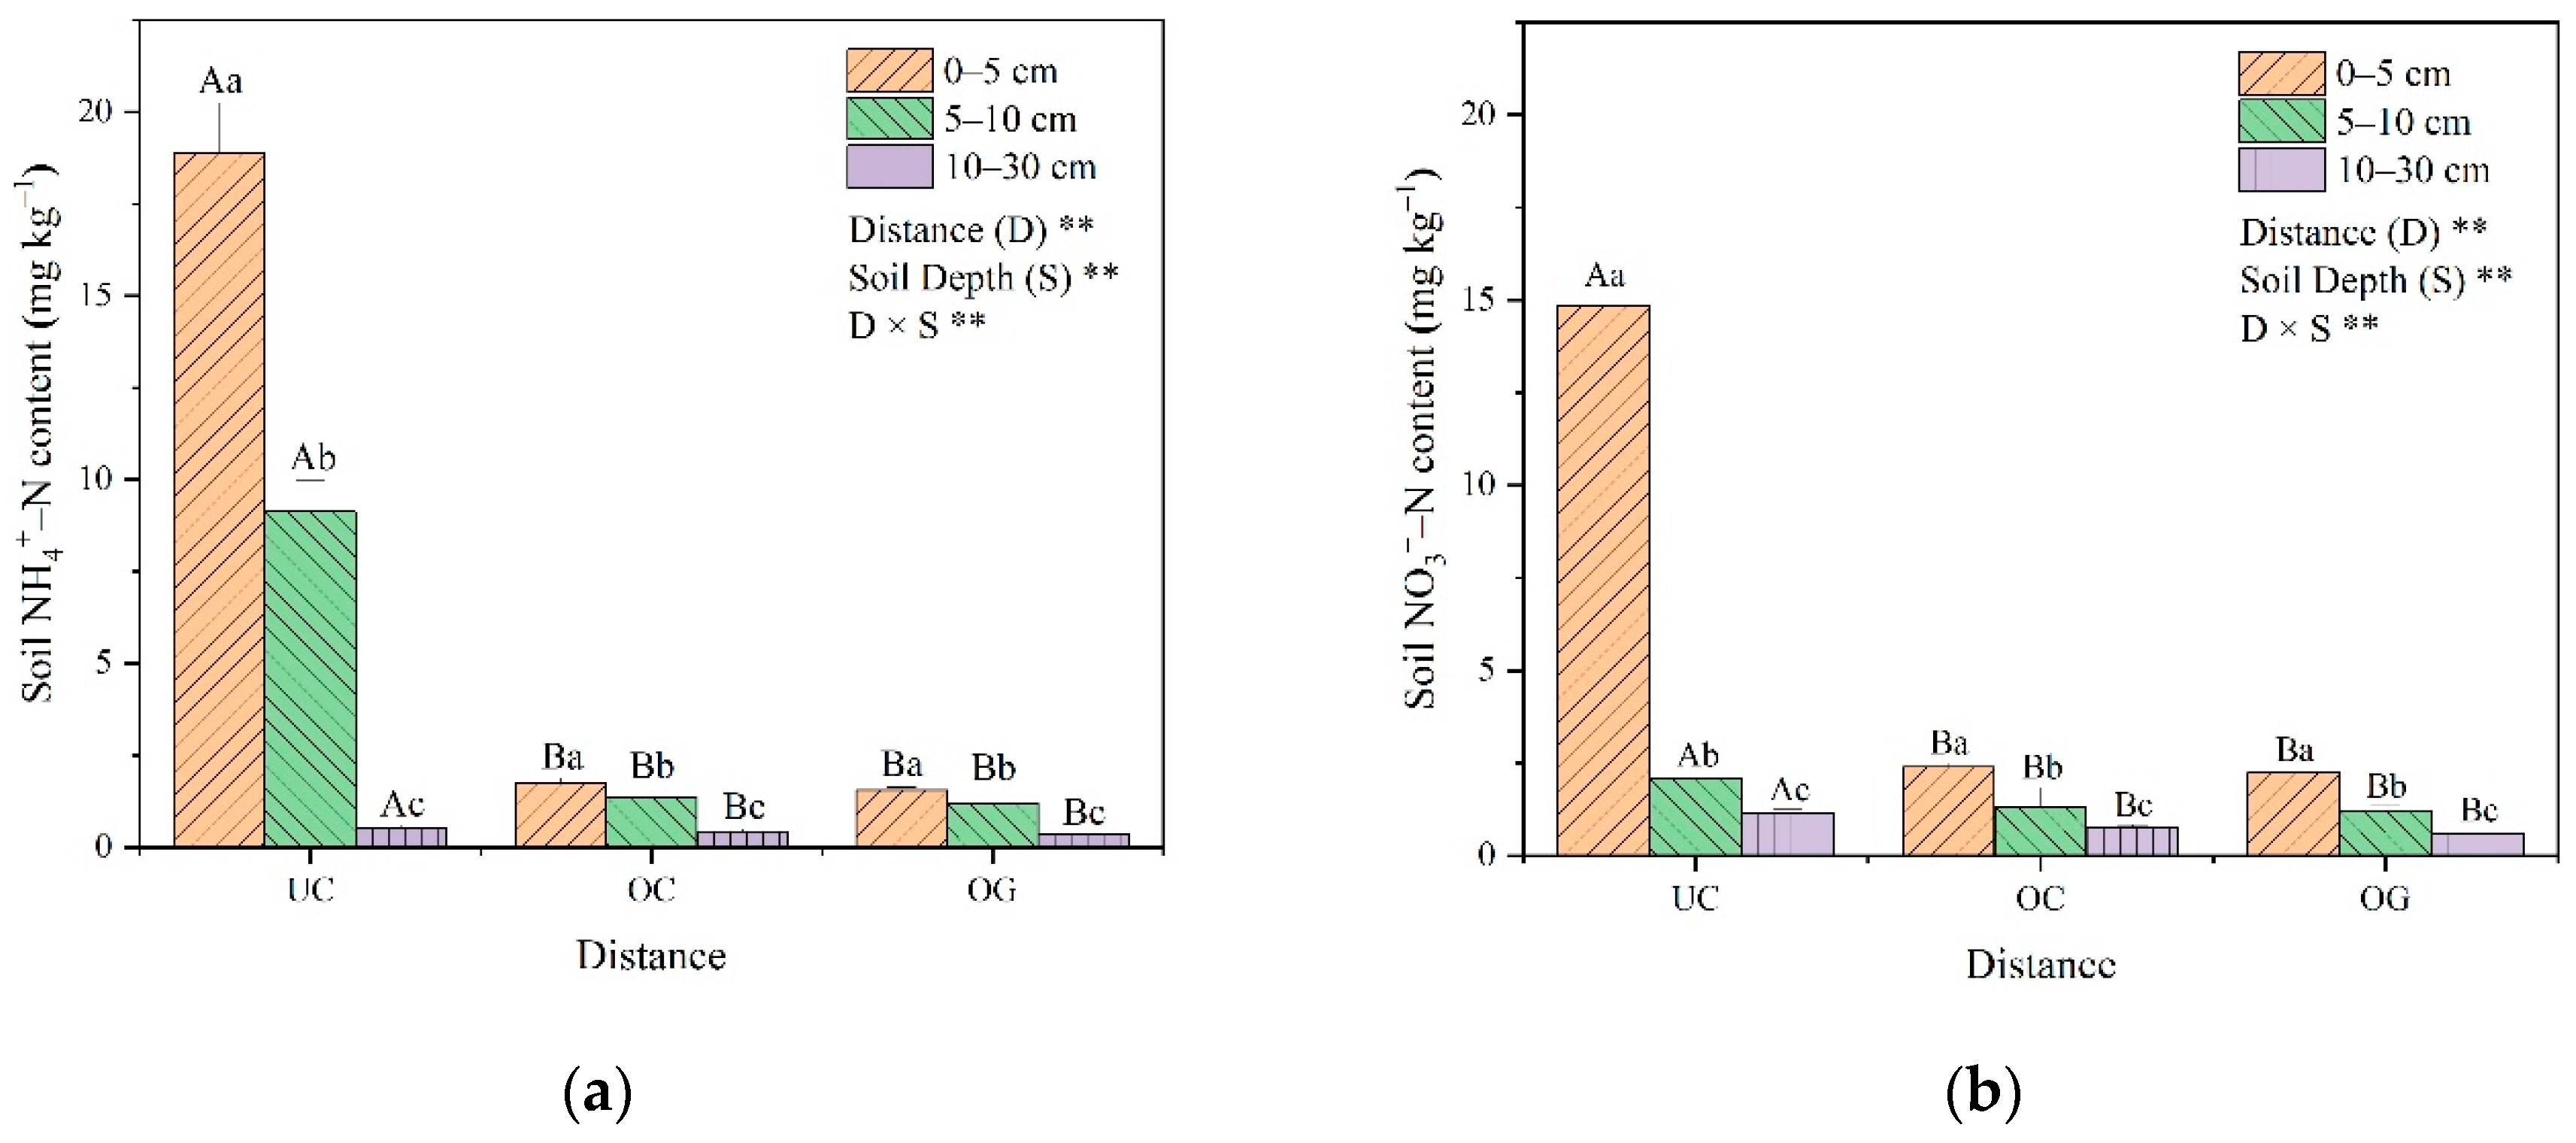
3.1. Soil Characteristics
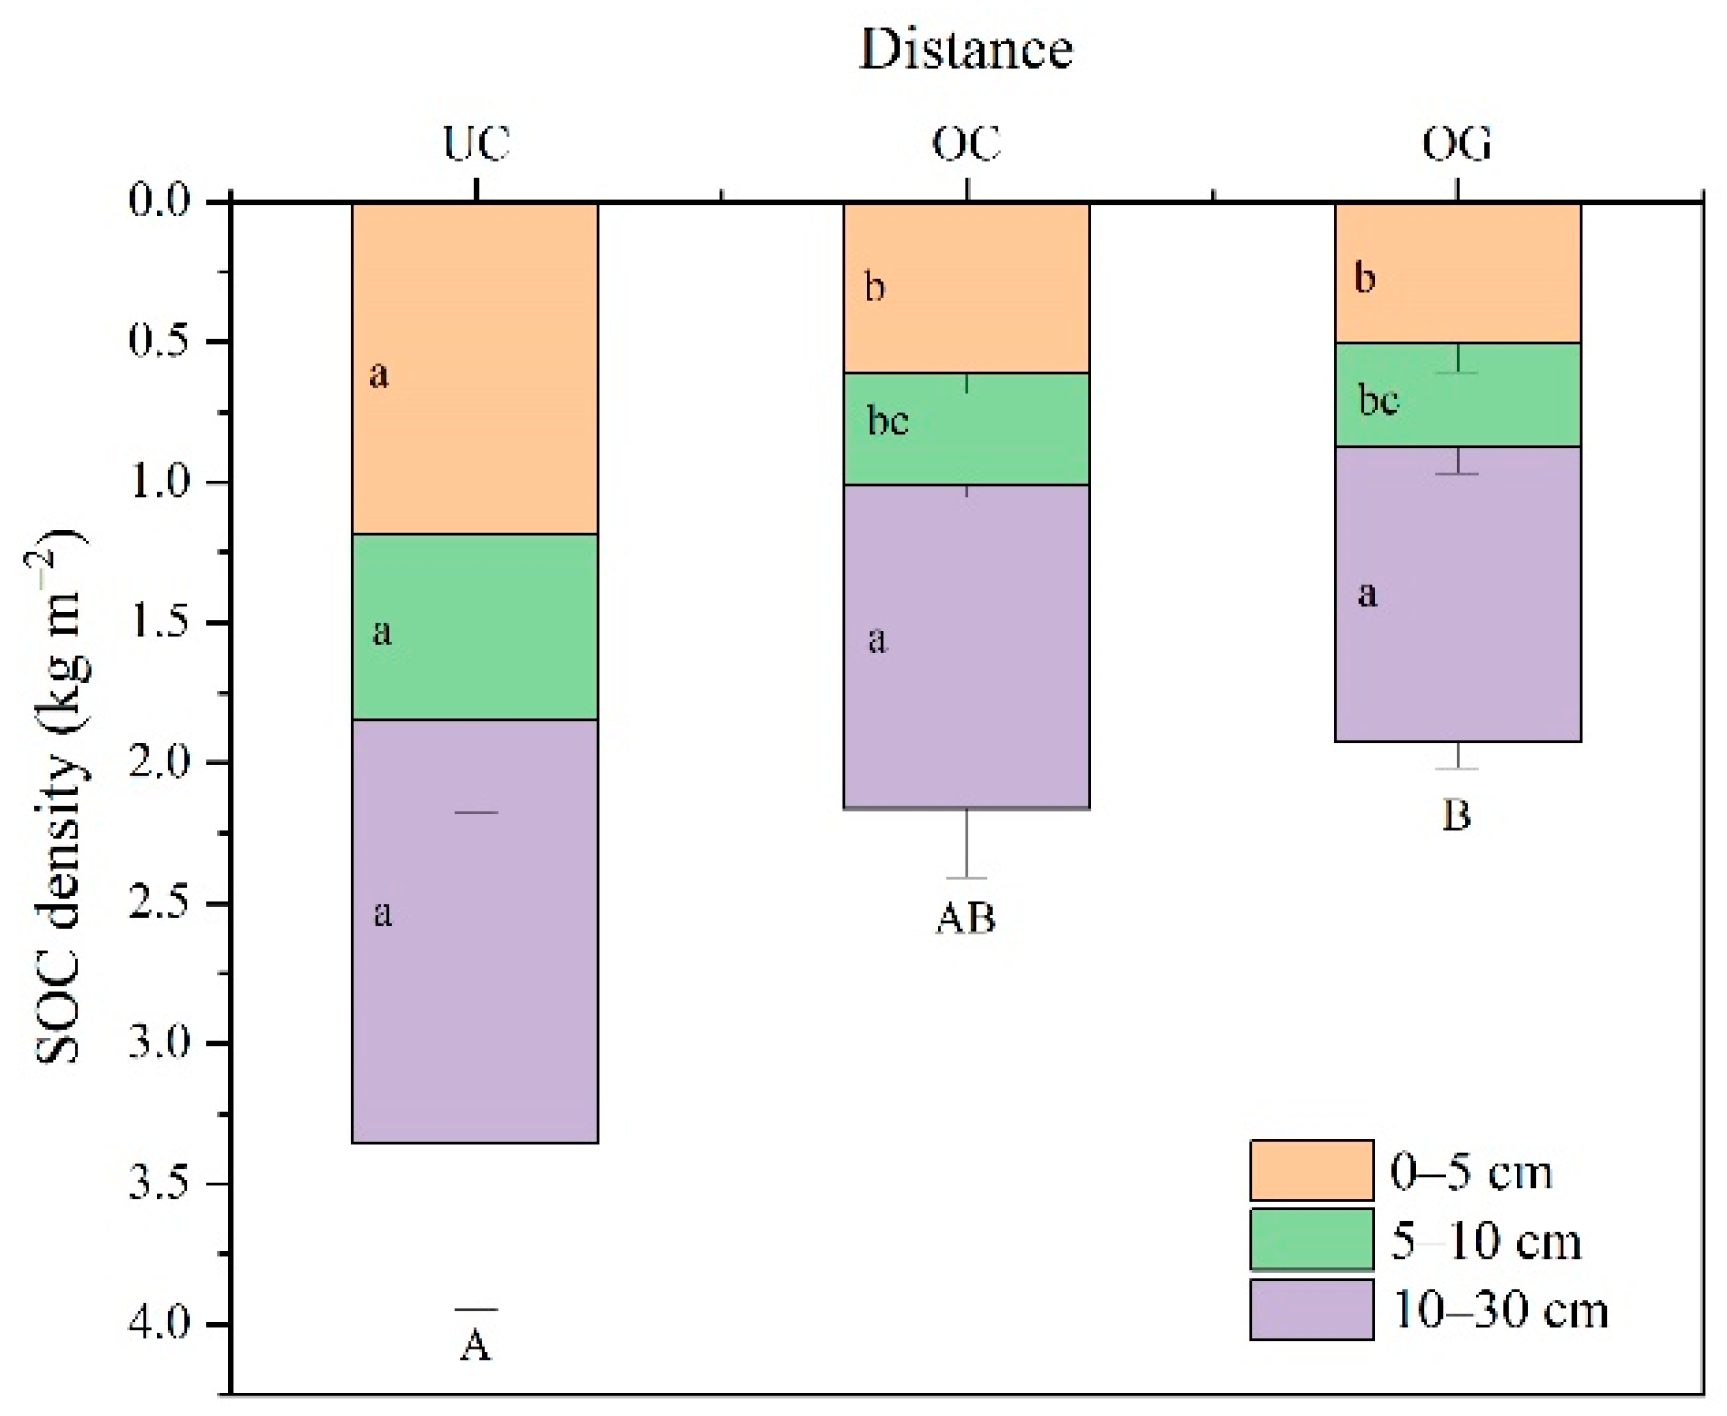
Analysis of soil characteristics, as shown in Table 1, revealed non-uniform distribution patterns across the three horizontal distances and soil depths. The pH, SOC, TN, and TP were significantly influenced by proximity to the tree. At three soil depths (0–5, 5–10 and 10–30 cm), these parameters generally decreased with increased distance from the tree trunk. In addition, the mean values of SOC, TN, and TP in the topsoil (0–5 cm) were significantly higher than those in the other soil depths (5–10 and 10–30 cm) in the same horizontal distance (p < 0.01 and p < 0.05). The effect of distance from the tree showed that significant differences in SOC, TN, and TP were observed between UC and OC, while no significant decreases were found in these parameters at OG, except for pH. Soil moisture and BD showed no significant variation among the distances from the tree trunk (p > 0.05). The soil moisture content was the significantly highest at 0–5 cm, both at sites of UC, OC and OG, with mean values of 12.12 ± 0.82, 11.79 ± 1.02, and 10.71 ± 4.61% (p < 0.01), respectively. On the contrary, soil BD was the significantly lowest at 0–5 cm across the three horizontal distances. Soil C:N ratio (C/N) was not affected by distance or soil depth. Also, there were no significant distance × soil layer interactions on soil characteristics, such as soil moisture, BD, pH, SOC, TN, TP, and C/N.
Regarding the soil inorganic nitrogen, we observed that NH4+–N and NO3–N decreased with the distance from tree trunk and the soil depth (Figure 2). Significant difference (p < 0.01) was noted on the effect of distance on NH4+–N and NO3–N contents of soils collected at 0–5, 5–10 and 10–30 cm depths. The highest amounts of NH4+–N and NO3–N contents were recorded under canopy of tree (UC) at 0–5 cm, and they were 18.90 ± 1.34 mg kg–1 and 14.85 ± 0.25 mg kg–1, respectively. Also, the soil NO3–N and NH4+–N contents measured in layer 0–5 cm were significantly higher than those measured in other layers (p < 0.01) at each horizontal distance. The interactions between distance and soil depth were significant for soil NH4+–N and NO3–N (p < 0.01).

3.2. SOC Density

In Figure 3, the total SOC density at 0–30 cm layer decreased with increasing distance from tree. We found that SOC density in UC (3.35 kg m−2) was significantly higher than that in OG (1.92 kg m−2) (p < 0.05), but there were no significant differences between UC and OC, or between OC and OG (p > 0.05). Across different soil depths, the highest SOC densities were consistently recorded in the UC. The lowest SOC density values were observed at the 5–10 cm depth, registering 0.66 ± 0.33, 0.40 ± 0.04, and 0.37 ± 0.09 kg m−2 for UC, OC, and OG, respectively. For the SOC density in each soil layers, there were no differences in the UC (p > 0.05). Along soil profile, there were no differences between depths of 0–5 and 5–10 cm in the OC and OG (p > 0.05).

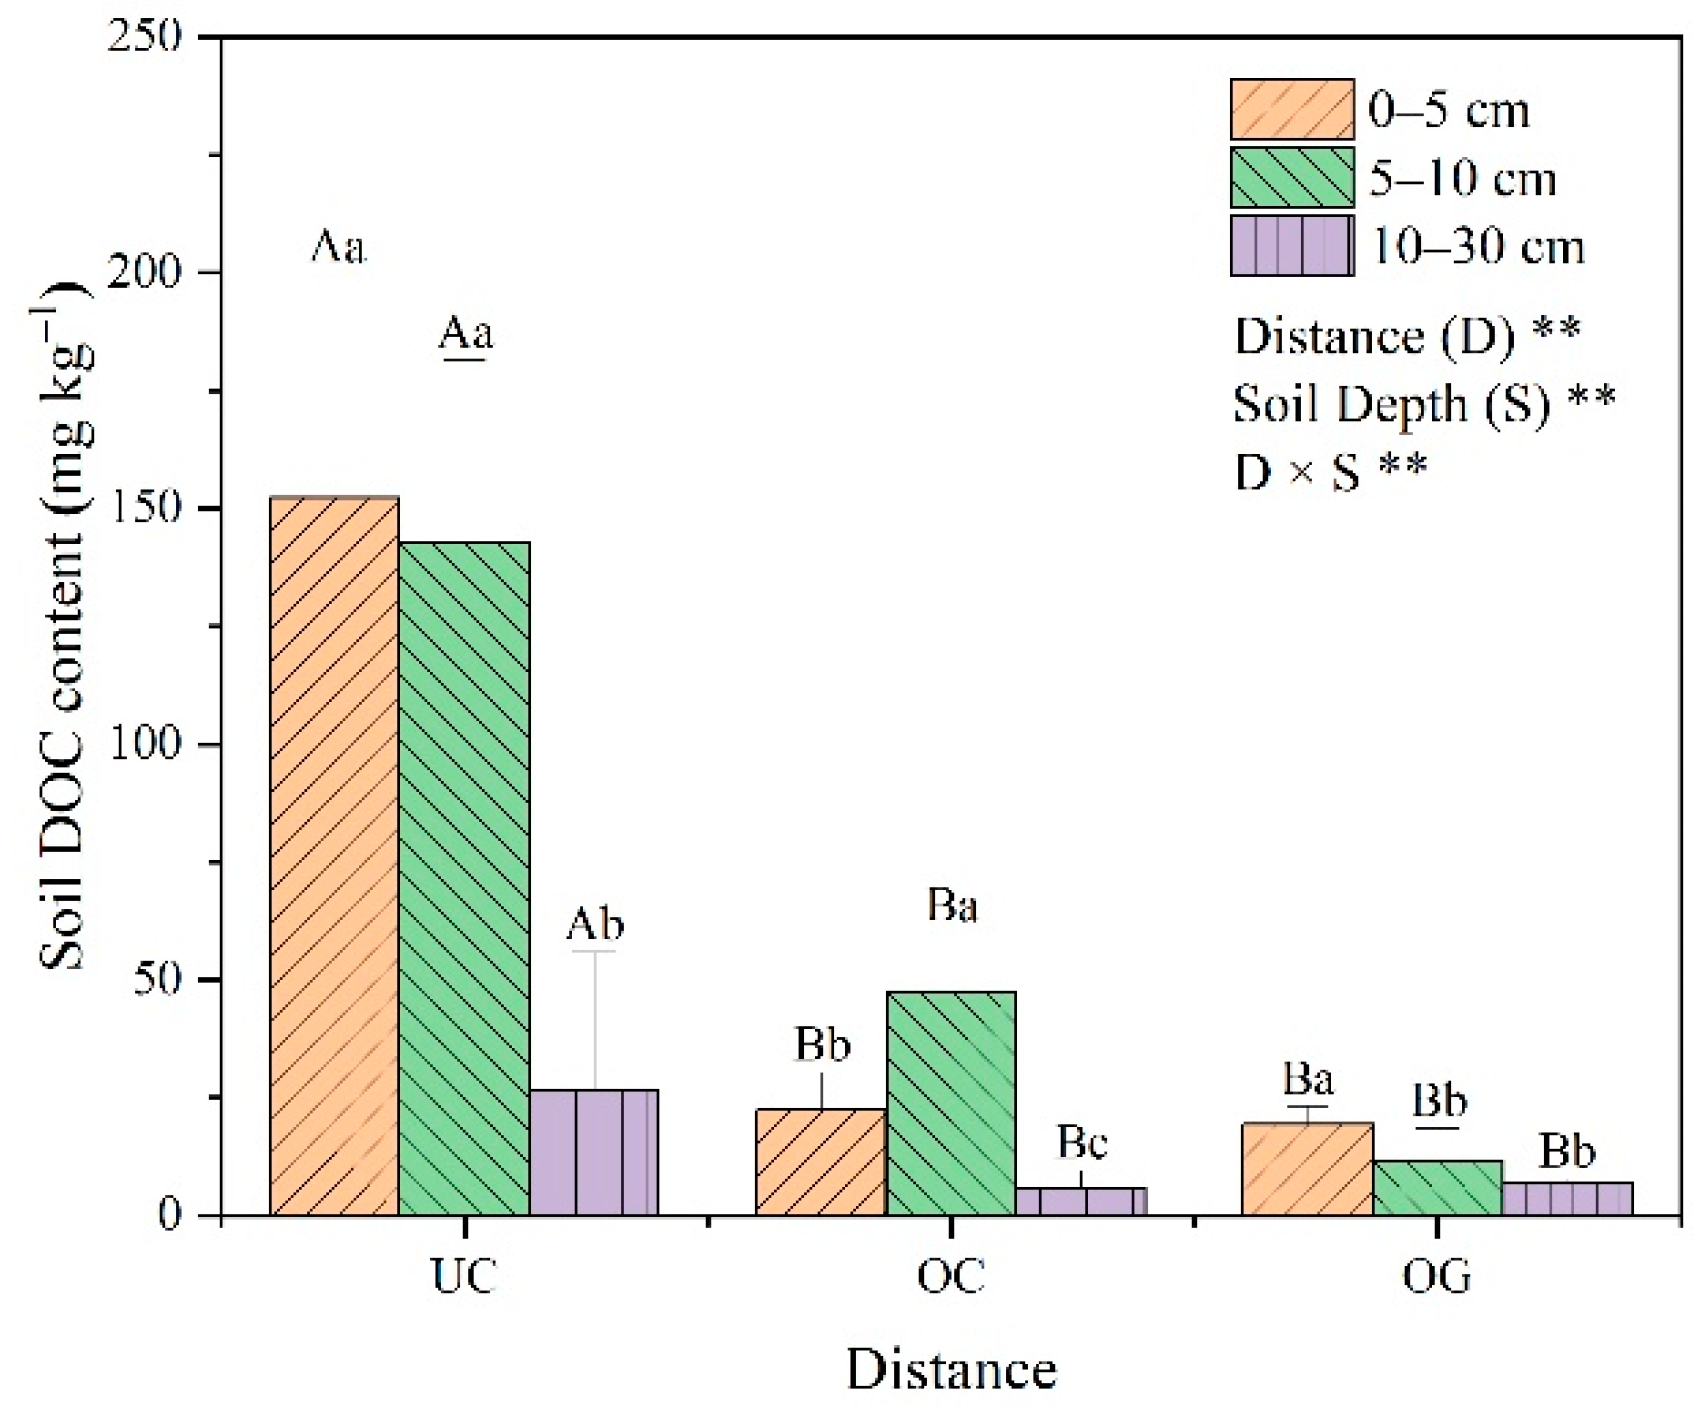
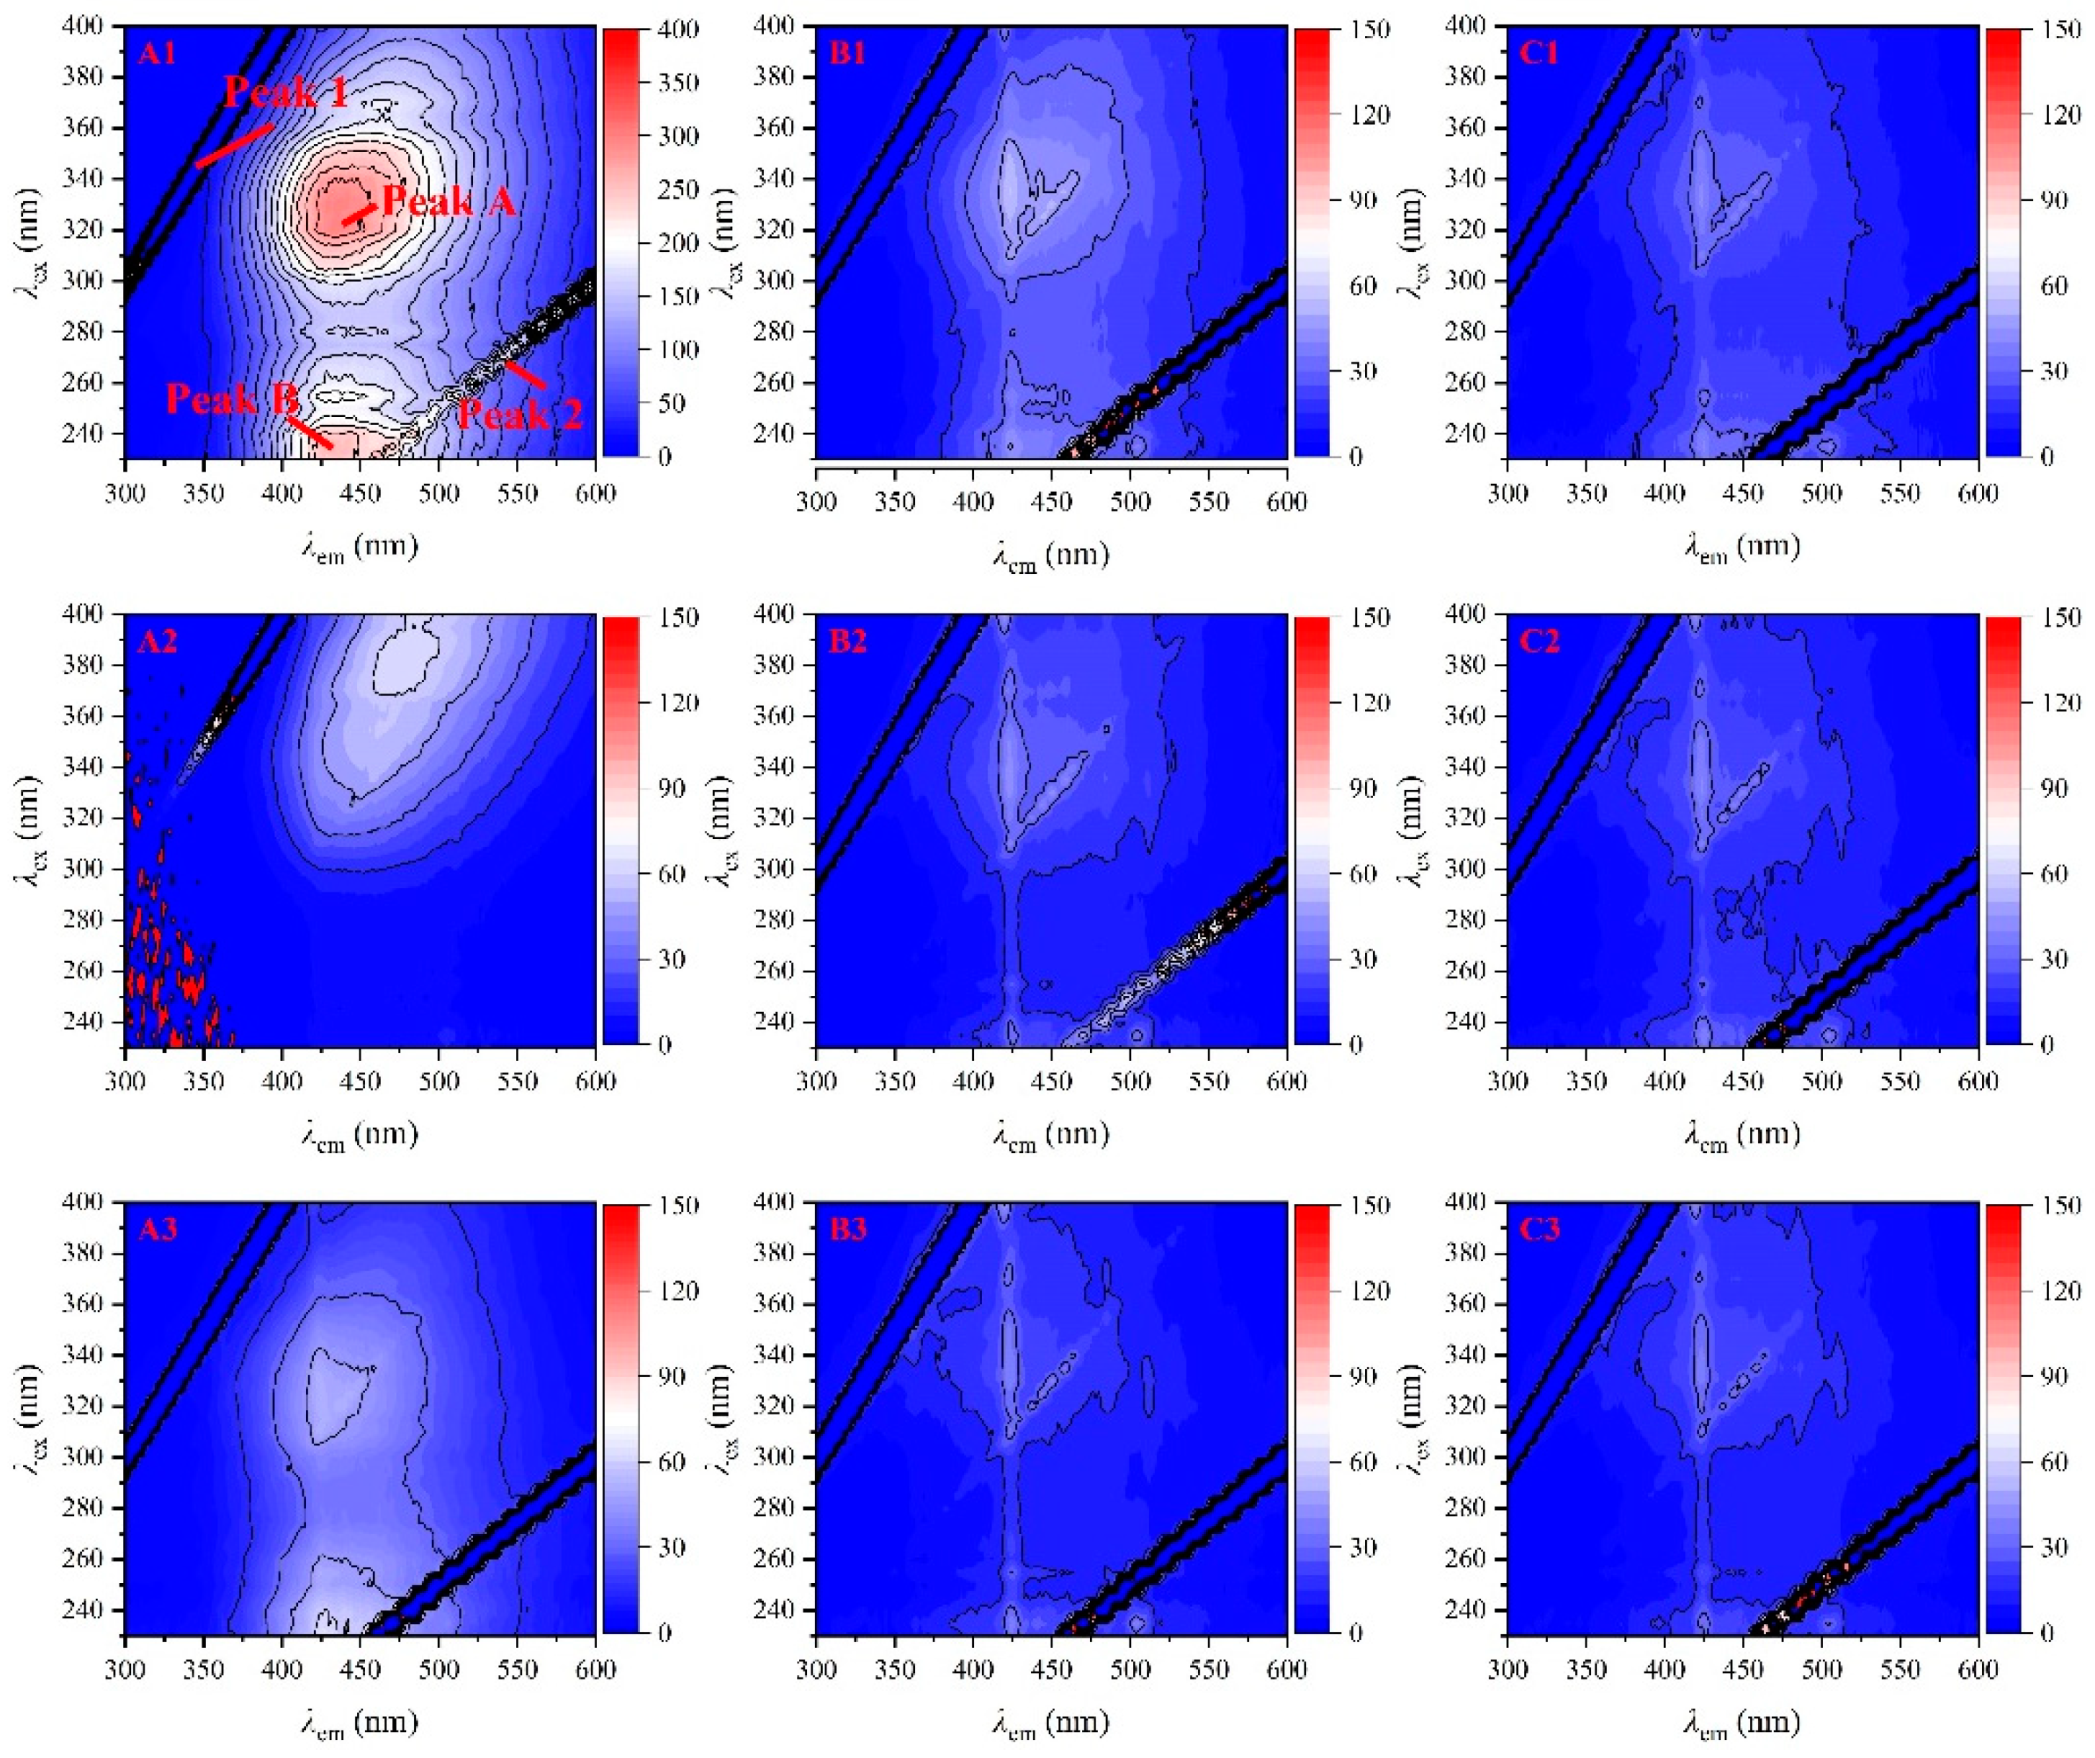
3.3. DOC Content and Fluorescence Excitation–Emission Matrix Spectra

The proximity to tree trunk showed increases in the soil DOC contents of UC (152.21 ± 47.00, 142.65 ± 38.84, 26.41 ± 29.60 mg kg–1, respectively) compared with OC and OG (Figure 4). Significant differences were observed among UC, OC, and OG (p < 0.01). There were significant difference among 0–5, 5–10, and 10–30 cm. In addition, the interactions between distance and soil layer were significant for soil DOC (p < 0.01).
The fluorescence EEMS contour maps of DOC at varying distances from the tree and across three soil depths are presented in Figure 5. DOC samples exhibited two main characteristic peaks (peaks A and B) and two Raleigh scattering peaks (peaks 1 and 2). Peak A (λex/λem/I = 325 nm/440 nm/297.74), with high fluorescence intensity, corresponded to a humic acid-like fluorescence peak, while Peak B (λex/λem/I = 235 nm/430 nm/258.04) indicated a fulvic acid-like fluorescence peak. Generally, Peak B exhibited weaker fluorescence intensity compared to Peak A in all EEMS contour maps. The study also found that the fluorescence intensities of Peaks A and B in soil DOC noticeably declined with increasing distance from the tree and soil depth.

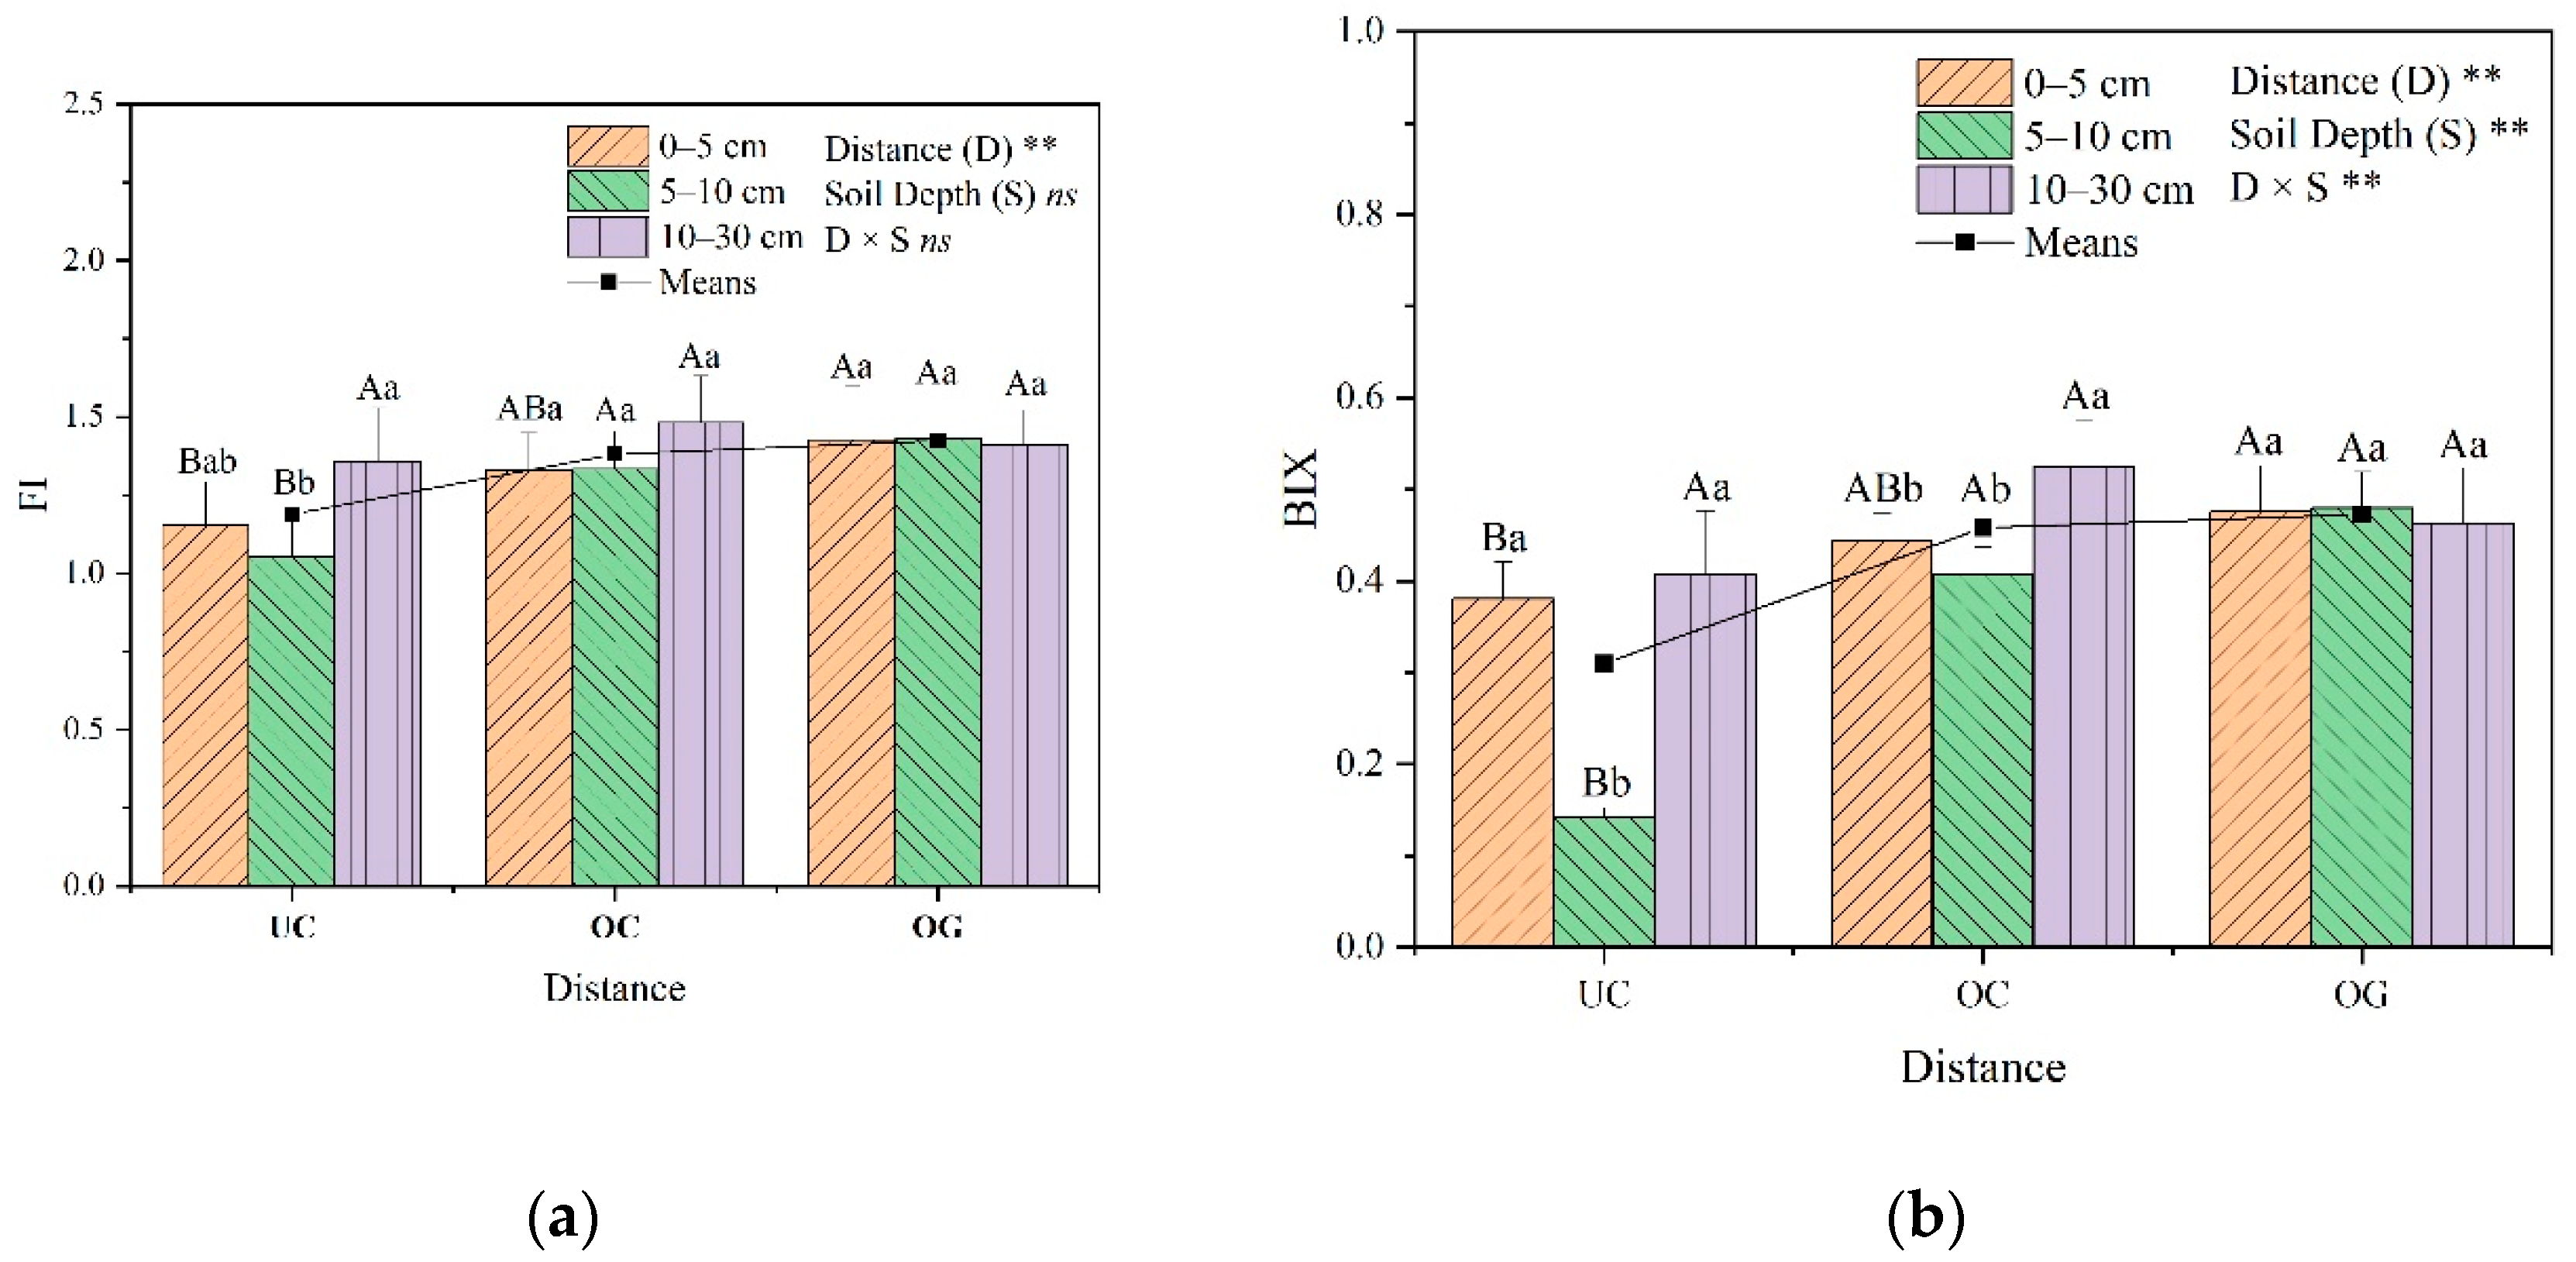
3.4. Fluorescence Indices Analysis

Figure 6 shows the fluorescence indicators (FI and BIX) of soil DOC at different soil layers with distances. Significant difference (p < 0.01) was noted on the effect of distance on FI and BIX. There were no significant soil layer or distance × soil layer interactions on FI, but for BIX. The FI values of UC, OC and OG were in the range of 1.05–1.36, 1.33–1.48 and 1.41–1.43 with mean values of 1.19, 1.38 and 1.42, respectively. The mean values of FI showed an increasing trend with increasing distance from tree (Figure 6a). However, there was little change in FI. In addition, BIX values were low (Figure 6b). The BIX mean value of UC (0.31) was lower than that of OC (0.46) and OG (0.47). The BIX values fluctuated down and up with soil depths at UC and OC. But there was little difference on vertical level at OG.

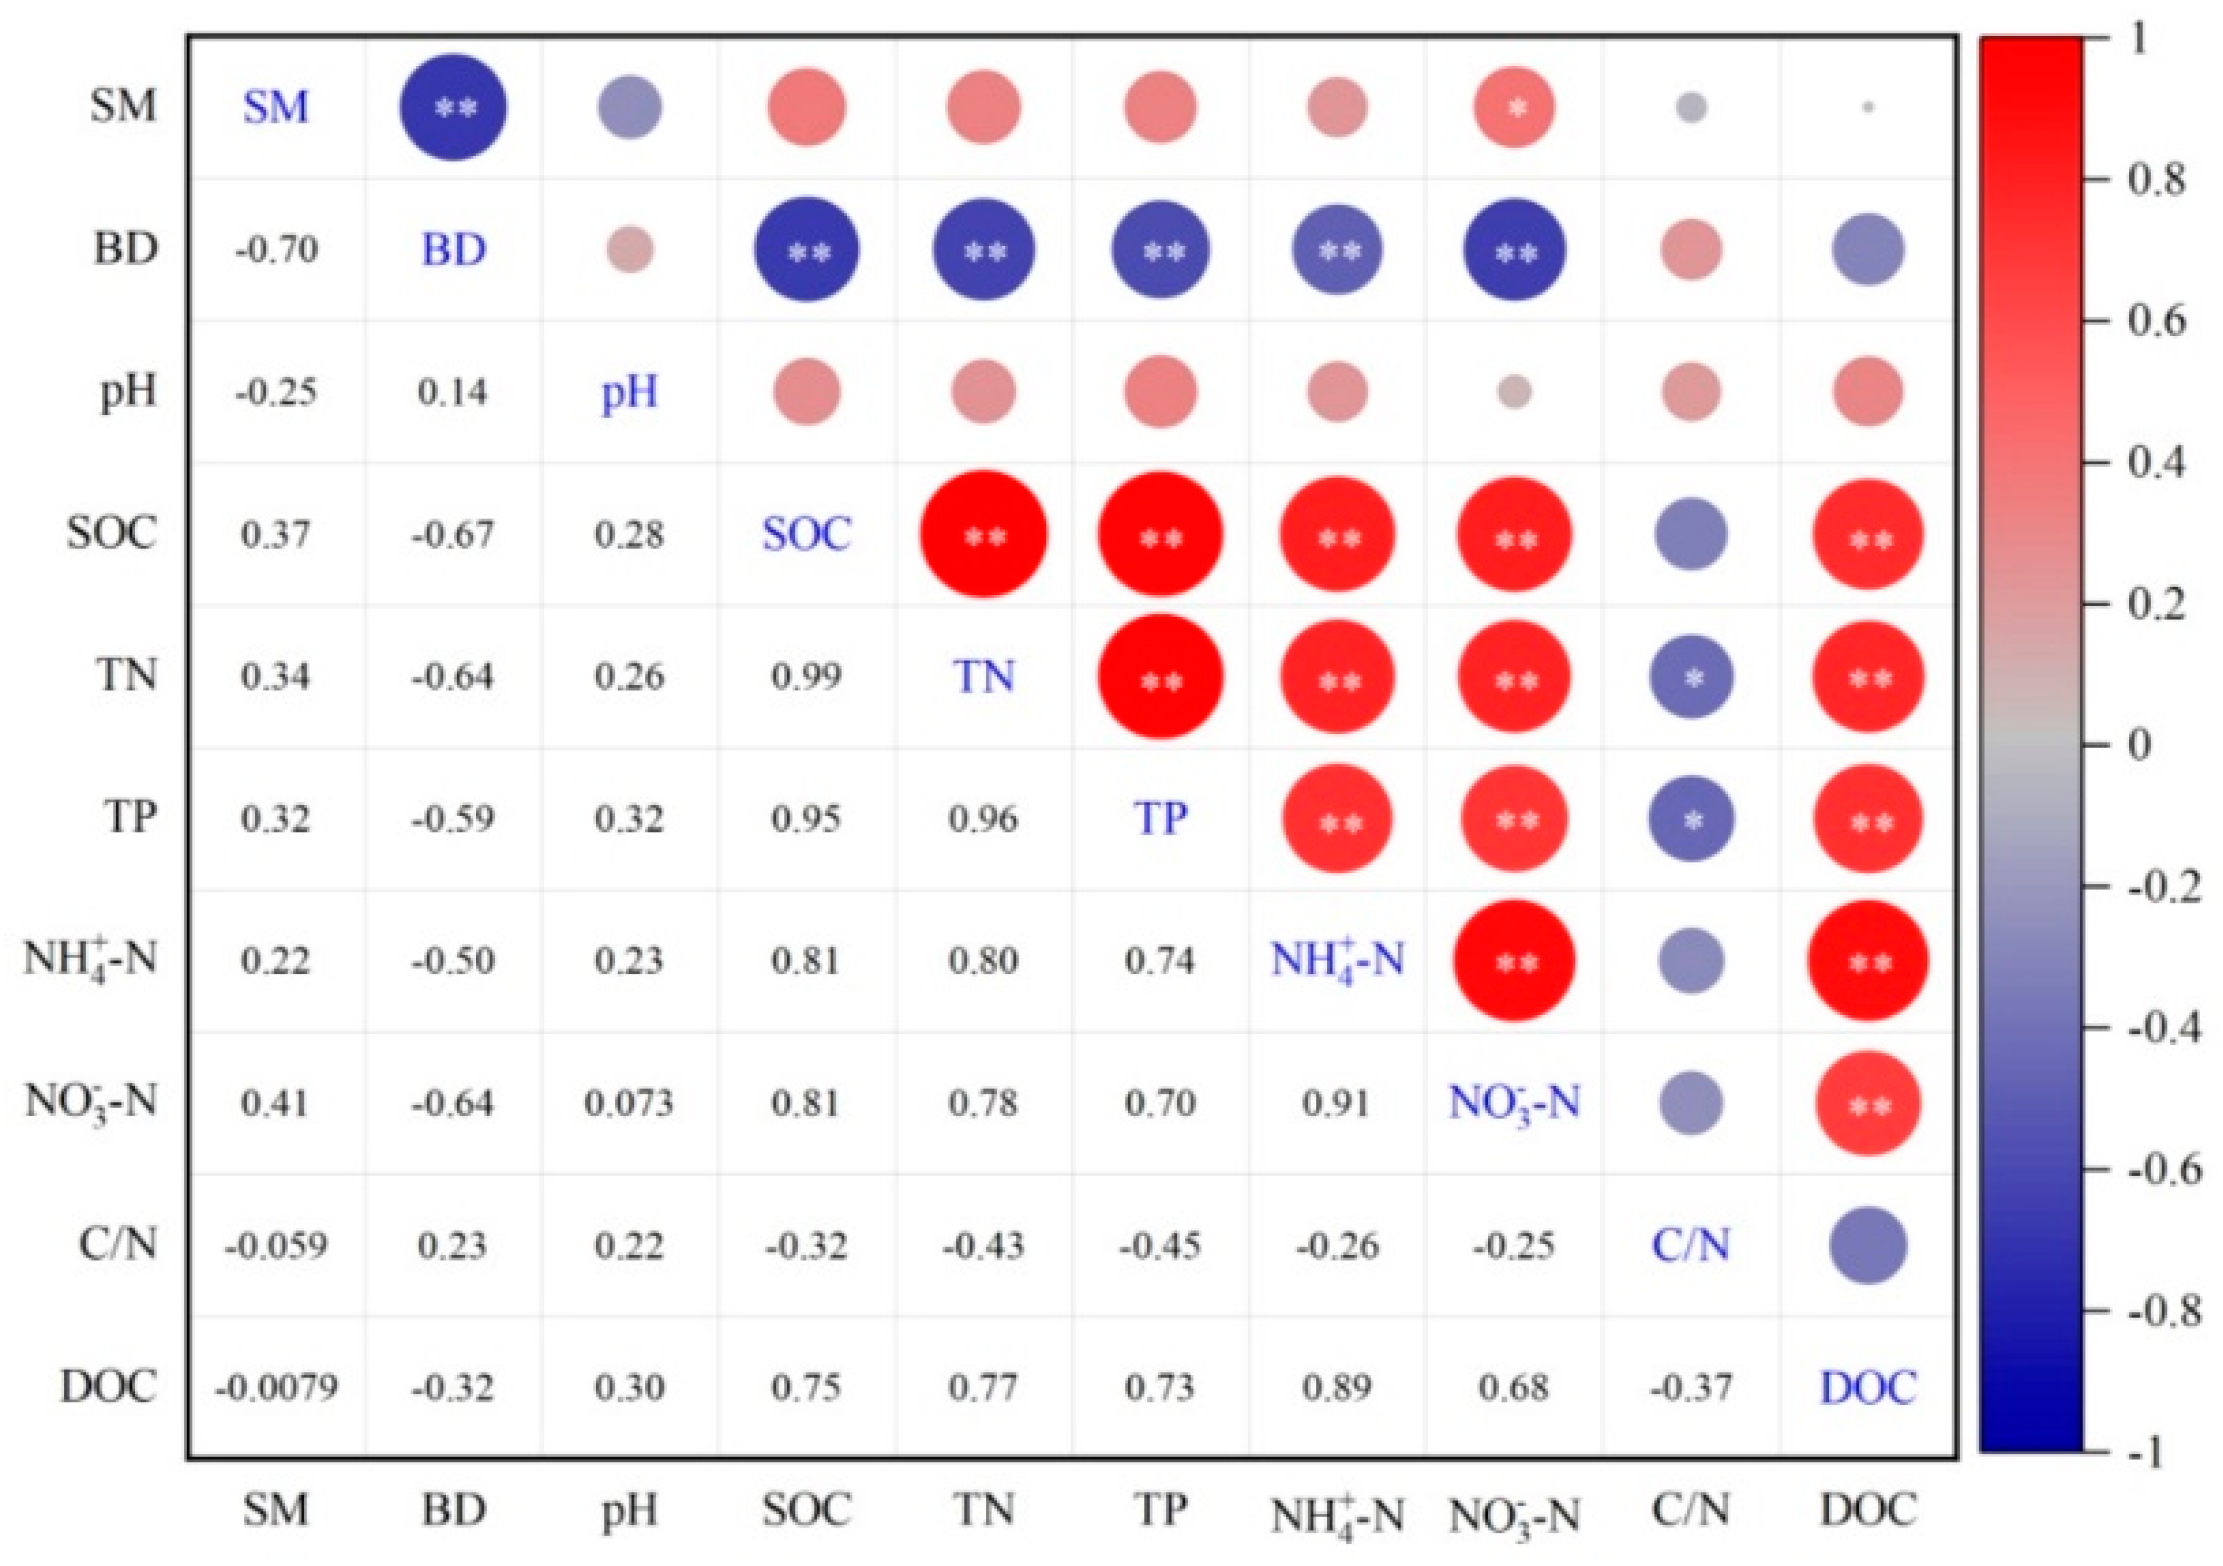
3.5. Correlations Between Soil Properties and DOC Content

The correlation analysis was also performed on soil moisture, BD, pH, SOC, TN, TP, NH4+–N, NO3–N, C/N, and DOC. As shown in Figure 7, a highly significant positive correlation was found among SOC, TN, TP, NH4+–N, NO3–N, and DOC (p < 0.01). A highly significant negative correlation was found between BD vs. SOC, TN, TP, NH4+–N, and NO3–N; soil moisture vs. BD (p < 0.01). Additionally, there was a significant positive correlation between soil moisture vs. NO3–N (p < 0.05) and a significant negative correlation between C/N vs. TN and TP (p < 0.05).

4. Discussion

Our objectives were to investigate the influence of woody plants on the soil nutrients and DOC fluorescence spectral characteristics in temperate sparse wood grasslands ecosystem. The results confirmed that: (1) the proximity to tree trunks significantly increases SOC, TN, TP, and inorganic nitrogen, which with a marked decrease in them with increasing distance from the tree and a pronounced reduction with soil depth; (2) functional components and fluorescence indicators of DOC change little, but the content and fluorescence intensity of DOC decrease with the increasing distance from trees and soil depth. We discuss the results below and provide some insights into the reasons of these effects.

4.1. Impacts of Ulmus Macrocarpa Hance on Soil Nutrient Properties

Plants are proved to be a major factor influencing and soil has complex feedbacks in savanna grasslands [58,59]. Our study revealed that trees influenced the physicochemical properties of soil. For example, the existence of tree was significantly elevated, TN and TP contents across all soil layers (0–5, 5–10 and 10–30 cm) comparing to the areas outside the canopy or in the open grasslands. This aligns with findings by Liu et al. [60], that Ulmus macrocarpa contributes to soil fertility through the decomposition of leaf and root litter, which enriches the soil with organic matter and nutrients. Because of the decomposition of tree litter (leaf and root) have positive effects on soil fertility and nutrient cycling, TN and TP was significantly increased with proximity to trees in semi-arid regions [61,62]. This “fertile island” effects caused by trees, also decreased soil bulk density and improved soil structure and porosity, due to the organic matter accumulation and root growth [63]. Additionally, the canopy of Ulmus macrocarpa creates a unique microenvironment by moderating soil temperature, retaining soil moisture, and increasing organic matter inputs through litter fall and root exudates [40,60]. These mechanisms collectively contribute to the enrichment of soil fertility and could be used in practical land management of degraded ecosystems, particularly in arid and semi-arid regions.
We also found the highest values of NH4+–N and NO3–N under the canopy at top soil in the elm-dominated sparse wood grasslands ecosystem. As we known, microenvironments among UC, OC and OG sites were distinct. For instance, compared with OC and OG, canopy could reduce wind erosion and fix sand, change soil and air moistures, and increased microbe activity due to rainfall from crown interception and litter input [64,65,66]. SOC plays a critical role in soil nutrient cycling, as it serves as a reservoir of organic matter that decomposes to release nitrogen in both NH4+–N and NO3–N forms. Maybe the increases in soil organic matter input near trees enhance microbial activity and nutrient cycling, leading to greater nitrogen mineralization and higher concentrations of NH4+–N and NO3–N. The findings were consistent with previous studies showing that SOC serves as a major source of inorganic nitrogen through microbial decomposition [67,68,69].
Soil pH variations across different sites suggest complex interactions between plant life and soil chemical properties. The soil pH under the tree canopy was higher than in open grassland areas, and was marginally higher than outside the canopy (Table 1). This contrasts with findings by Gebrewahid et al. [70], who noted a decrease in soil pH under Oxytenanthera abyssinica (A. Rich.) canopies. Such discrepancies could stem from the specific influences of different tree species on soil chemistry, including the release of organic acids and CO2 from root respiration and decomposition.

4.2. Horizontal and Vertical Distributions of SOC Content and SOC Density in Ulmus Macrocarpa Hance Dominated Wood Grassland System

Consistent with our hypothesis 1, the SOC content and density decreased horizontally with the distance from the trees increased. In accordance with our study, Ljalem et al. [71] reported a noticeably higher SOC content under the canopy of Anogeissus leiocarpa (DC.) Guill. & Perr. and Stereospermum kunthianum Cham. than that of the canopy gap. Additionally, SOC content decreased vertically across the whole soil profile. SOC density among different soil profiles (UC, OC, and OG) indicated a clear impact of tree canopies on soil fertility, especially in the upper soil surface. Compared with the bare soil between plant canopies, the fertile island can enhance soil resources beneath woody plants, and the strength of fertile islands would change with soil depth [48,68]. Moreover, litter provides the primary source of energy and carbon for microbial communities, while also influencing the availability of nutrients for microbial metabolism [72,73]. Soil microbial activity (e.g., extracellular enzymes) and abundance are strongly influenced by the quantity and quality of litter inputs, as well as the microclimatic conditions (e.g., moisture, temperature) created by plant canopies [73]. The condition under plant canopies, such as more favorable soil moisture and moderated temperature fluctuations, could facilitate nutrient retention and accumulation [72].The production of extracellular enzymes (e.g., chitinase, cellulase, and β-glucosidase) are critical for breaking down complex organic molecules like chitin, cellulose, and polysaccharides and closely linked to litter quality, with high-quality litter (e.g., lower C:N ratio, richer in labile compounds) [72]. However, soil microorganisms were most abundant in the surface layer, and they would decrease continuously with the depth generally [67,74]. Thus, the increase of SOC density with the proximity to tree trunk has great implications for restoration of degraded sandy lands particularly in arid and semi-arid regions where soil carbon densities are typically lower. These findings can guide afforestation projects, including the selection of species and planting densities to maximize nutrient cycling and carbon sequestration benefits. For example, planting patterns should consider the horizontal influence of tree canopies to optimize the restoration of SOC and soil nutrients in degraded areas. It is critical for projects such as the “Three-North Shelterbelt Program”, where the findings can inform decisions on species selection and spatial planting arrangements.

4.3. Effects of Ulmus Macrocarpa Hance on Soil DOC and Fluorescence Indicators

Our study provides a comprehensive understanding of how Ulmus macrocarpa Hance influences soil DOC. This insight is crucial in elucidating the soil carbon dynamics within elm-dominated sparse wood ecosystems, especially in relation to the labile fractions of the soil organic carbon pool. Consistent with our hypothesis 2, the DOC content increased in proximity to the tree under canopy area. The highest DOC content at the surface soil layer under the tree also indicates a pronounced impact of the tree presence on DOC distributions. The increase in DOC content with shortened distance from the trees and decline with deepening of soil depth may probably due to both proximity to the tree trunks and ample organic matter accumulated in the topsoil as well as under the trees [75]. The substantial concentration of DOC in the under canopy area, compared to the outside canopy and open grassland areas, particularly in the upper soil depth, reflects the localized effect of tree canopies in augmenting DOC availability. These results could be applied by policymakers or restoration practitioners to guide and to optimize the enhancement of labile organic carbon pools, which are critical for nutrient cycling and microbial activity in degraded lands.
In addition, the EEMS analysis of DOC revealed distinctive peaks associated with humic and fulvic acid-like substances. This finding suggests that Ulmus macrocarpa Hance influences not only the quantity but also the quality of DOC in the soil. These components, indicative of more complex organic molecules, are integral to the labile organic carbon pool and are influenced by the specific litter and root exudates of the tree species [76], which emphasized the role of tree species in altering the chemical characteristic of DOC.
To better explain the source and quality of DOC, fluorescence indicators including FI and BIX were obtained. The FI mean values at UC and OC were 1.19 and 1.38 (<1.4), indicating that the soil DOC mainly from an exogenous (terrestrial) input. Compared with 0–5 cm and 5–10 cm, the FI value of UC and OC were higher than that at 10–30 cm, which was due to the decreased DOM weight of the soil surface plant residues source along the soil profile, leading to the greater relative contribution of microorganism-derived organic matter with depth [77]. This result was confirmed by the higher proportion of humic-like components at 0–5 cm. The FI mean value at OG (1.42) was between 1.4 and 1.9 suggested that DOC has both exogenous and microbial sources [78]. Zhang et al. [79] reported that a mixed spontaneous source and exogenous input responded for soil DOM included internal microbial functions, and land source inputs (e.g., plant litter and root exudates). The tree may influence on the quantity and quality of soil DOC, and contribute to the exogenous characteristics [77]. In addition, the BIX values (0.14–0.52) for the sandy soils were a slightly lower than that of natural DOC in soils (0.25–1.00) [57]. BIX indicated bioavailability and protein-like substances of DOC [80]. Low BIX values in this study could be attributed to the lower microbial activities in sandy soils with poor nutrient.

4.4. Implications for Relationships Between DOC and Soil Properties

DOC, representing one of the soil labile organic carbon fractions, which is mainly originated from litters and roots, had certain relationships with soil physical and chemical properties. To investigate the relationship between DOC and soil properties in detail, the correlation analysis between variables in the 0–30 cm soil depth is shown in Figure 7. The SOC, TN, TP, NH4+–N, and NO3–N were positively correlated with the DOC in the 0–30 cm soil at the different distances (r = 0.75, p < 0.01; r = 0.77, p < 0.01; r = 0.73, p < 0.01; r = 0.89, p < 0.01; r = 0.68, p < 0.01, respectively). Our results were consistent with the study of Lan et al. [81]. As reported by Cotrufo et al. [82], DOC is derived from soil organic matter decomposition. This indicates that DOC content is depended on SOC. Previous studies showed that two-thirds of DOC is derived from fresh organic matter input and one-third from old carbon [83]. Meanwhile, DOC is main carbon and energy sources used by soil microorganisms, which plays a key role in the soil nutrient cycling [84,85].
The study shows that soil DOC is closely related to soil nutrients, such as TN, TP, NH4+–N, and NO3–N, indicating that soil DOC has strong interaction with soil nutrients, and it can reflect soil nutrient cycling and supply. Additionally, DOC content is also affected by soil moisture, BD, and pH [86]. In the present study, the correlations between DOC content and soil moisture and BD were negative; and the correlation between DOC content and pH was positive. However, the relationships were no significant, respectively (Figure 7). This result indicated that soil moisture, BD, and pH were not the main factor influencing DOC in the Ulmus macrocarpa Hance-dominated sparse wood grasslands in southeastern edge of Horqin Sandy Land.

5. Conclusions

Our research provides novel insights into the spatial and mechanistic effects of Ulmus macrocarpa Hance on soil nutrient dynamics and carbon cycling in a semi-arid sparse wood grassland ecosystem in southeastern Horqin Sandy Land, China. We found that the proximity to tree trunks greatly improved soil nutrients, including TN, TP, and inorganic nitrogen (NH4+–N and NO3–N), especially at the surface soil. The research also highlighted a notable horizontal and vertical variability in SOC content, with a marked decrease in SOC with increasing distance from the trees and a pronounced reduction with soil depths. These findings underscore the fertile effects of trees in savanna ecosystem and the critical role of its surface organic matter inputs in soil nutrient cycling. In addition, our study showed that the tree significantly impacted contents and fluorescence intensities of soil DOC, which enhanced conditions for microbial growth and organic carbon dissolution and influence the composition and availability of DOC. By demonstrating the horizontal and vertical gradients of SOC and DOC, as well as nutrients under tree canopies, we highlight the key role of trees as “ecological engineers” in improving soil fertility through organic matter inputs, root exudates, and microclimatic modifications. Importantly, these findings could underscore the importance of tree planting in restoration practices, with implications for species selection, planting density, and the spatial design of restoration projects to maximize soil fertility improvements.

Author Contributions

Conceptualization, Z.F.; methodology, Z.F.; software, J.B., J.S. and W.S.; formal analysis, L.L. and J.B.; investigation, X.S. and Z.F.; data curation, X.S., Y.H., J.B., and G.A.; writing—original draft preparation, X.S. and Z.F.; writing—review and editing, Z.F., L.L. and Y.H.; funding acquisition, Z.F., X.S. and Y.H. All authors have read and agreed to the published version of the manuscript.

Funding

This research was funded by the National Natural Science Foundation of China (Nos. 41977074, 41401262 and 32071858), the Shenyang Scientific & Technological Projects (23-407-3-12), and the Natural Science Foundation of Liaoning Province (2024-MSBA-88).

Data Availability Statement

Data are contained within the article.

Acknowledgments

We wish to thank Jingshi Li for her considerable help with the laboratory analyses.

Conflicts of Interest

The authors declare no conflicts of interest.

References

  1. Niu, Y.Y.; Li, Y.Q.; Wang, M.M.; Wang, X.Y.; Chen, Y.; Duan, Y.L. Variations in seasonal and inter-annual carbon fluxes in a semi-arid sandy maize cropland ecosystem in China’s Horqin Sandy Land. Environ. Sci. Pollut. Res. 2022, 29, 5295–5312. [CrossRef]
  2. Niu, Y.Y.; Li, Y.Q.; Liu, W.; Wang, X.Y.; Chen, Y. Effects of environment factors on the carbon fluxes of semi-fixed sandy land recovering from degradation. Front. Ecol. Evol. 2023, 11, 1178660. DOI10.3389/fevo.2023.1178660.
  3. De Paola, F.; Ducci, D.; Giugni, M. Desertification and erosion sensitivity. A case study in southern Italy the Tusciano River catchment. Environ. Earth. Sci. 2013, 70, 2179–2190. [CrossRef]
  4. Reed, M.S.; Fazey, I.; Stringer, L.C.; Raymond, C.M.; Akhtar-Schuster, M.; Begni, G.; Bigas, H.; Brehm, S.; Briggs, J.; Bryce, R.; Buckmaster, S.; Chanda, R.; Davies, J.; Diez, E.; Essahli, W.; Evely, A.; Geeson, N.; Hartmann, I.; Holden, J.; Hubacek, K.; Ioris, A.A.R.; Kruger, B.; Laureano, P.; Phillipson, J.; Prell, C.; Quinn, C.H.; Reeves, A.D.; Seely, M.; Thomas, R.; Ten Bosch, M.J.V.; Vergunst, P.; Wagner, L. Knowledge management for land degradation monitoring and assessment: An analysis of contemporary thinking. Land Degrad. Dev. 2013, 24, 307–322. [CrossRef]
  5. Wu, G.L; Jia, C.; Huang, Z.; López-Vicente, M.; Liu, Y. Plant litter crust appear as a promising measure to combat desertification in sandy land ecosystem. Catena, 2021, 206, 105573. [CrossRef]
  6. Xu, D.Y.; Wang, Y.Q.; Wang, Z.Y. Linking priority areas and land restoration options to support desertification control in northern China. Ecol. Indic. 2022, 137, 108747. DOI10.1016/j.ecolind.2022.108747.
  7. Xu, D.Y.; Wang, Z.Y. Identifying land restoration regions and their driving mechanisms in Inner Mongolia, China from 1981 to 2010. J. Arid Environ. 2019, 167, 79–86. [CrossRef]
  8. Takoutsing, B.; Winowiecki, L.A.; Bargués-Tobella, A.; Vågen, T.G. Determination of land restoration potentials in the semi-arid areas of Chad using systematic monitoring and mapping techniques. Agroforest. Syst. 2023, 97, 1289–1305. [CrossRef]
  9. Singh, K.; Tewari, S.K. Does the road to land degradation neutrality in India is paved with restoration science? Restor. Ecol. 2022, 30, e13585. [CrossRef]
  10. Fan, J.Q.; Xu, Y.; Zhang, Y.F. Evaluating land restoration based on the land cover in the Horqin Sandy Land, China. Environ. Sci. Pollut. R. 2023, 30, 88417–88430. [CrossRef]
  11. Verhoeven, D.; Berkhout, E.; Sewell, A.; van der Esch, S. The global cost of international commitments on land restoration. Land Degrad. Dev. 2024, 35, 4864–4874. [CrossRef]
  12. Xu, X.; Zhang, D.J. Comparing the long-term effects of artificial and natural vegetation restoration strategies: A case-study of Wuqi and its adjacent counties in northern China. Land Degrad. Dev. 2021, 32, 3930–3945. [CrossRef]
  13. Cao, Y.; Xiong, K.N. Soil Quality Assessment under different vegetation restoration strategies in the karst rocky deserted area of southwestern China. J. Soil Sci. Plant Nut. 2024, 24, 3249–3264. [CrossRef]
  14. Zhu, J.J.; Sun, Y.R; Zheng, X.; Yang, K.; Wang, G.G.; Xia, C.Z.; Sun, T.; Zhang, J.X. A large carbon sink induced by the implementation of the largest afforestation program on Earth. Ecol. Process. 2023, 12, 44. [CrossRef]
  15. Wang, X.F.; Xiao, F.Y.; Feng, X.M.; Fu, B.J.; Zhou, Z.X.; Chan, C. Soil conservation on the loess plateau and the regional effect: Impact of the 'Grain for Green' project. Earth Environ. Sci. Trans. R. Soc. Edinb. 2019, 109, 461–471. [CrossRef]
  16. Wu, G.L.; Liu, Y.; Fang, N.F.; Deng, L.; Shi, Z.H. Soil physical properties response to grassland conversion from cropland on the semi-arid area. Ecohydrology 2016, 9, 1471–1479.
  17. Dou, Y.X.; Yang, Y.; An, S.S.; Zhu, Z.L. Effects of different vegetation restoration measures on soil aggregate stability and erodibility on the Loess Plateau, China. Catena 2020, 185, 104294. [CrossRef]
  18. Gao, Y.; Dang, P.; Zhao, Q.X.; Liu, J.L.; Liu, J.B. Effects of vegetation rehabilitation on soil organic and inorganic carbon stocks in the Mu Us Desert, northwest China. Land Degrad. Dev. 2018, 29, 1031–1040. [CrossRef]
  19. An, H.; Li, Q.L.; Yan, X.; Wu, X.Z.; Liu, R.T.; Fang, Y. Desertification control on soil inorganic and organic carbon accumulation in the topsoil of desert grassland in Ningxia, northwest China. Ecol. Eng. 2019, 127, 348–355.
  20. Siswo; Kim, H.; Lee, J.; Yun, C.W. Influence of tree vegetation and the associated environmental factors on soil organic carbon; Evidence from “Kulon Progo Community Forestry,” Yogyakarta, Indonesia. Forests, 2023, 14, 365. [CrossRef]
  21. Lange, M.; Eisenhauer, N.; Chen, H.M.; Gleixner, G. Increased soil carbon storage through plant diversity strengthens with time and extends into the subsoil. Global Change Biol. 2023, 29, 2627–2639. [CrossRef]
  22. Wu, L.Z.; Li, L.; Yao, Y.F.; Qin, F.C.; Guo, Y.F.; Gao, Y.H.; Zhang, M.L. Spatial distribution of soil organic carbon and its influencing factors at different soil depths in a semiarid region of China. Environ. Earth Sci. 2017, 76, 654. [CrossRef]
  23. Zhao, G.Y.; Li, S.Y.; Zhou, W.Z.; He, L.B.; Zou, R.S.; Yu, J.T.; Chen, Z.; Bai, X.T.; Zhang, J.S.; Sun, X.Y. Comparative analysis of soil organic carbon and soil oxide minerals across different climates and forest types. Austrian J For. Sci. 2024, 141, 53–78. [CrossRef]
  24. Tan, B.C.; Fan, J.B.; He, Y.Q.; Luo, S.M.; Peng, X.H. Possible effect of soil organic carbon on its own turnover: A negative feedback. Soil Biol. Biochem. 2014, 69, 313–319. [CrossRef]
  25. Sun, X.D.; Wang, G.; Ma, Q.X.; Liao, J.H.; Wang, D.; Guan, Q.W.; Jones, D.L. Organic mulching promotes soil organic carbon accumulation to deep soil layer in an urban plantation forest. For. Ecosyst. 2021, 8, 2. [CrossRef]
  26. Chen, S.M.; Yao, F.Y.; Mi, G.H.; Wang, L.C.; Wu, H.Y.; Wang, Y.J. Crop rotation increases root biomass and promotes the correlation of soil dissolved carbon with the microbial community in the rhizosphere. Front. Bioeng. Biotech. 2022, 10, 1081647. [CrossRef]
  27. Zhang, T.Q.; Drury, C.F.; Kay, B.D. Soil dissolved organic carbon: Influences of water-filled pore space and red clover addition and relationships with microbial biomass carbon. Can. J. Soil Sci. 2004, 84, 151–158. [CrossRef]
  28. Mao, R.; Zeng, D.H.; Li, L.J.; Hu, Y.L. Changes in labile soil organic matter fractions following land use change from monocropping to poplar-based agroforestry systems in a semiarid region of Northeast China. Environ. Monit. Assess. 2012, 184, 6845–6853. [CrossRef]
  29. Gielen, B.; Neirynck, J.; Luyssaert, S.; Janssens, I.A. The importance of dissolved organic carbon fluxes for the carbon balance of a temperate Scots pine forest. Agr. Forest Meteorol. 2011, 151, 270–278. [CrossRef]
  30. Bhattacharyya, R.; Kundu, S.; Srivastva, A.K.; Gupta, H.S.; Prakash, V.; Bhatt, J.C. Long term fertilization effects on soil organic carbon pools in a sandy loam soil of the Indian sub-Himalayas. Plant Soil, 2011, 341: 109–124. [CrossRef]
  31. Staddon, W.J.; Duchesne, L.C.; Trevors, J.T. The role of microbial indicators of soil quality in ecological forest management. Forest. Chron. 1999, 75, 81–86. [CrossRef]
  32. Katsuyama, M.; Ohte, N. Determining the sources of stormflow from the fluorescence properties of dissolved organic carbon in a forested headwater catchment. J. Hydrol. 2002, 268, 192–202. [CrossRef]
  33. Bai, J.; Sun, X.K.; Xu, C.B.; Ma, X.P.; Huang, Y.; Fan, Z.P.; Cao, X.Y. Effects of sewage sludge application on plant growth and soil characteristics at a Pinus sylvestris var. mongolica plantation in Horqin Sandy Land. Forests, 2022, 13, 984. [CrossRef]
  34. Oelbermann, M.; Voroney, R.P. Carbon and nitrogen in a temperate agroforestry system: Using stable isotopes as a tool to understand soil dynamics. Eco. Eng. 2007, 29, 342–349.
  35. Li, Y.F.; Li, Z.W.; Wang, Z.Y.; Wang, W.L.; Jia, Y.H.; Tian, S.M. Impacts of artificially planted vegetation on the ecological restoration of movable sand dunes in the Mugetan Desert, northeastern Qinghai-Tibet Plateau. Int. J Sediment Res. 2017, 32, 277–287. [CrossRef]
  36. Bai, L.H.; Zhang, H.; Zhang, J.G.; Li, X.; Wang, B.; Miao, H.Z.; Sial, T.A.; Dong, Q.; Fu, G.J.; Li, L.M. Long-term vegetation restoration increases carbon sequestration of different soil particles in a semi-arid desert. Ecosphere 2021, 12, e03848. [CrossRef]
  37. Fang, M.K.; Atapattu, A.J.; Lin, L.X.; Xia, S.W.; Yang, X.D. Soil nutrient concentrations, associations and their relationships with canopy tree category and size in the southwestern China tropical rainforests. J. Sustain. Forest. 2023, 42, 1020–1035. [CrossRef]
  38. Gao, X.L.; Li, X.G.; Zhao, L.; Kuzyakov, Y. Regulation of soil phosphorus cycling in grasslands by shrubs. Soil Biol. Biochem. 2019, 133, 1–11. [CrossRef]
  39. Ma, T.; Maestre, F.T.; Eldridge, D.J.; Ke, W.B.; Hu, T.L.; Ye, J.S. Fertile island effects across soil depths in drylands of the Tibetan Plateau. Plant Soil 2024, 503, 385–396. [CrossRef]
  40. Liu, Z.K.; Shao, Y.Y.; Cui, Q.G.; Ye, X.H.; Huang, Z.Y. ‘Fertile island’ effects on the soil microbial community beneath the canopy of Tetraena mongolica, an endangered and dominant shrub in the West Ordos Desert, North China. BMC Plant Biol. 2024, 24, 178. [CrossRef]
  41. Feng, L.Q.; Guo, M.M.; Wang, W.L.; Shi, Q.H.; Guo, W.Z.; Lou, Y.B.; Zhu, Y.A.; Yang, H.; Xu, Y.Y. Evaluation of the effects of long-term natural and artificial restoration on vegetation characteristics, soil properties and their coupling coordinations. Sci. Total Environ. 2023, 884, 163828. [CrossRef]
  42. Garbowski, M.; Avera, B.; Bertram, J.H.; Courkamp, J.S.; Gray, J.; Hein, K.M.; Lawrence, R.; McIntosh, M.; McClelland, S.; Post, A.K.; Slette, I.J.; Winkler, D.E.; Brown, C.S. Getting to the root of restoration: Considering root traits for improved restoration outcomes under drought and competition. Restor. Ecol. 2020, 28, 1384–1395. [CrossRef]
  43. Yan, J.K.; Lou, L.; Bai, W.H.; Zhang, S.Q.; Zhang, N.N. Phosphorus deficiency is the main limiting factor for re-vegetation and soil microorganisms in Mu Us Sandy Land, Northwest China. Sci. Total Environ. 2023, 900, 165770. [CrossRef]
  44. Garbowski, M.; Johnston, D.B.; Baker, D.V.; Brown, C.S. Invasive annual grass interacts with drought to influence plant communities and soil moisture in dryland restoration. Ecosphere 2021, 12, e03417. [CrossRef]
  45. Zhang, Z.Y.; Zhang, B.; Zhang, X.; Yang, X.H.; Shi, Z.J.; Liu, Y.S. Grazing altered the pattern of woody plants and shrub encroachment in a temperate savanna ecosystem. Int. J. Environ. Res. Public Health 2019, 16, 330. [CrossRef]
  46. Priyadarshini, K.V.R.; de Bie, S.; Heitkönig, I.M.A.; Woodborne, S.; Gort, G.; Kirkman, K.P.; Prins, H.H.T. Competition with trees does not influence root characteristics of perennial grasses in semi-arid and arid savannas in South Africa. J. Arid Environ. 2016, 124, 270–277. [CrossRef]
  47. Wang, X.; Jiang, L.N.; Yang, X.H.; Shi, Z.J.; Yu, P.T. Does shrub encroachment indicate ecosystem degradation? A perspective based on the spatial patterns of woody plants in a temperate savanna-like ecosystem of Inner Mongolia, China. Forests, 2020, 11, 1248. [CrossRef]
  48. Ding, J.Y.; Eldridge, D.J. The fertile island effect varies with aridity and plant patch type across an extensive continental gradient. Plant Soil 2021, 459, 173–183. [CrossRef]
  49. Li, J.; Zhao, C.; Zhu, H.; Li, Y.; Wang, F. Effect of plant species on shrub fertile island at an oasis–desert ecotone in the South Junggar Basin, China. J. Arid Environ. 2007, 71, 350–361. [CrossRef]
  50. Fan, Z.P; Huang, Y.; Sun, X.K.; Bai, J.; Lin, L.T.; Ai, G.Y. Effects of fertile islands on soil organic carbon density and labile organic carbon distribution in elm (Ulmus macrocarpa Hance)-dominated sparse wood grasslands in southeastern Inner Mongolia, China. Arid Land Res. Manag. 2024. [CrossRef]
  51. Pandey, C.B.; Singh, A.K.; Sharma, D.K. Soil properties under Acacia nilotica trees in a traditional agroforestry system in central India. Agroforest. Syst. 2000, 49, 53–61. [CrossRef]
  52. Gindaba, J.; Rozanov, A.; Negash, L. Trees on farms and their contribution to soil fertility parameters in Badessa, eastern Ethiopia. Biol. Fert. Soils 2005, 42, 66–71. [CrossRef]
  53. Walkley, A.; Black, I.A. An examination of the Degtjareff method for determining soil organic matter, and a proposed modification of the chromic acid titration method. Soil Sci. 1934, 37, 29–38. [CrossRef]
  54. Lin, L.T.; Sun, X.K.; Yu, Z.Y.; Huang, Y.; Zeng, D.H. Responses of soil respiration to N fertilization and grazing in a Keerqin sandy grassland in northeast China. Arid Land Res. Manag. 2021, 35, 230–245. [CrossRef]
  55. Zsolnay, A.; Baigar, E.; Jimenez, M.; Steinweg, B.; Saccomandi, F. Differentiating with fluorescence spectroscopy the sources of dissolved organic matter in soils subjected to drying. Chemosphere 1999, 38, 45–50. [CrossRef]
  56. Halbedel, S.; Herzsprung, P. Short communication on “Differentiating with fluorescence spectroscopy the sources of dissolved organic matter in soils subjected to drying” [Zsolnay et al. Chemosphere 38, 45–50, 1999]. Chemosphere 2020, 239, 124818. [CrossRef]
  57. Zhang, H.Y.; Qian, W.; Wu, L.; Yu, S.H.; Wei, R.; Chen, W.F.; Ni, J.Z. Spectral characteristics of dissolved organic carbon (DOC) derived from biomass pyrolysis: Biochar-derived DOC versus smoke-derived DOC, and their differences from natural DOC. Chemosphere 2022, 302, 134869. [CrossRef]
  58. de Freitas, A.F.; Carneiro, J.J.; Venturin, N.; Moreira, F.M.D.; Ferreira, A.I.G.; Lara, G.P.D.; Miranda, R.D.; de Siqueira, L.F.; Cardoso, I.M. Inga edulis Mart. intercropped with pasture improves soil quality without compromising forage yields. Agroforest. Syst. 2020, 94, 2355–2366. [CrossRef]
  59. Mao, N.; Huang, L.; Shao, M. Vertical distribution of soil organic and inorganic carbon under different vegetation covers in two toposequences of the Liudaogou watershed on the Loess Plateau, China. J. Soil Water Conserv. 2018, 73, 479–491. [CrossRef]
  60. Liu, Y.; Shangguan, Z.; Deng, L. Vegetation type and soil moisture drive variations in leaf litter decomposition following secondary forest succession. Forests 2021, 12, 1195. [CrossRef]
  61. Asaye, Z.; Zewdie, S. Fine root dynamics and soil carbon accretion under thinned and un-thinned Cupressus lusitanica stands in, Southern Ethiopia. Plant Soil, 2013, 366, 261–271. [CrossRef]
  62. D'Hervilly, C.; Marsden, C.; Capowiez, Y.; Béral, C.; Delapré-Cosset, L.; Bertrand, I. Trees and herbaceous vegetation strips both contribute to changes in soil fertility and soil organism communities in an agroforestry system. Plant Soil, 2021, 463, 537–553. [CrossRef]
  63. Belsky, A.J.; Amundson, R.G.; Duxbury, J.M.; Riha, S.J.; Ali, A.R.; Mwonga, S.M. The effects of trees on their physical, chemical, and biological environments in a semi-arid savanna in Kenya. J. Appl. Ecol. 1989, 26, 1005–1024. [CrossRef]
  64. Gispert, M.; Emran, M.; Pardini, G.; Doni, S.; Ceccanti, B. The impact of land management and abandonment on soil enzymatic activity, glomalin content and aggregate stability. Geoderma, 2013, 202, 51–61. [CrossRef]
  65. Yao, Y.F.; Zhao, Z.N.; Wei, X.R.; Shao, M.A. Effects of shrub species on soil nitrogen mineralization in the desert loess transition zone. Catena, 2019, 173, 330–338. [CrossRef]
  66. Gallardo, A.; Rodríguez-Saucedo, J.J.; Covelo, F.; Fernández-Alés, R. Soil nitrogen heterogeneity in a Dehesa ecosystem. Plant Soil, 2000, 222, 71–82. [CrossRef]
  67. Fall, D.; Diouf, D.; Zoubeirou, A.M.; Bakhoum, N.; Faye, A.; Sall, S.N. Effect of distance and depth on microbial biomass and mineral nitrogen content under Acacia senegal (L.) Willd. trees. J. Environ. Manage. 2012, 95, S260–S264. [CrossRef]
  68. Gao, Y.J.; Tariq, A.; Zeng, F.J.; Sardans, J.; Zhang, Z.H.; Islam, W.; Xu, M.Q.; Penuelas, J. “Fertile islands” beneath three desert vegetation on soil phosphorus fractions, enzymatic activities, and microbial biomass in the desert-oasis transition zone. Catena, 2022, 212, 106090. [CrossRef]
  69. Zhang, J.L.; Lin, G.G.; Zeng, D.H. Long-term nitrogen addition modifies fine root growth and vertical distribution by affecting soil nutrient availability in a Mongolian pine plantation. Sci. Total Environ. 2024, 921, 171168. [CrossRef]
  70. Gebrewahid, Y.; Teka, K.; Gebre-Egziabhier, T.B.; Tewolde-Berhan, S.; Birhane, E.; Eyasu, G.; Meresa, E. Dispersed trees on smallholder farms enhance soil fertility in semi-arid Ethiopia. Ecol. Process. 2019, 8, 38. [CrossRef]
  71. Ljalem, S.; Birhane, E.; Teka, K.; Berhe, D.H. Parkland trees on smallholder farms ameliorate soil physical-chemical properties in the semi-arid area of Tigray, Ethiopia. J. Arid Land 2024, 16, 1–13. [CrossRef]
  72. Arunrat, N.; Sansupa, C.; Sereenonchai, S. Hatano, R. Stability of soil bacteria in undisturbed soil and continuous maize cultivation in Northern Thailand. Front. Microbiol. 2023, 14, 1285445. [CrossRef]
  73. Toled, S.; Peri, P.L.; Correa, O.S.; Montecchia, M.S.; Gargaglione, V.B.; Ladd, B. Structure and function of soil microbial communities in fertile islands in austral drylands. Austral Ecol. 2022, 47, 663–673. [CrossRef]
  74. Bobul'ská, L.; Espíndola, S.P.; Coelho, M.A.; Ferreira, A.S. Impact of land use on soil function and bacterial community in the Brazilian savanna. An. Acad. Bras. Ciênc. 2021, 93, e20201906. [CrossRef]
  75. Li, W.; Jia, X.X.; Li, M.; Wu, H.M. Insight into the vertical characteristics of dissolved organic matter in 5-m soil profiles under different land-use types on the Loess Plateau. Sci. Total Environ. 2019, 692: 613–621. DOI: 10.1016/j.scitotenv.2019.07.339.
  76. Wickland, K.P.; Neff, J.C.; Aiken, G.R. Dissolved organic carbon in Alaskan boreal forest: Sources, chemical characteristics, and biodegradability. Ecosystems 2007, 10, 1323–1340. [CrossRef]
  77. Zhang, R.Q.; Huang, Q.Q.; Yan, T.Y.; Yang, J.F.; Zheng, Y.; Li, H.K.; Li, M. Effects of intercropping mulch on the content and composition of soil dissolved organic matter in apple orchard on the loess plateau. J. Environ. Manage. 2019, 250, 109531. [CrossRef]
  78. McKnight, D.M.; Boyer, E.W.; Westerhoff, P.K.; Doran, P.T.; Kulbe, T.; Andersen, D.T. Spectrofluorometric characterization of dissolved organic matter for indication of precursor organic material and aromaticity. Limnol. Oceanogr. 2001, 46, 38–48. [CrossRef]
  79. Zhang, X.Q.; Li, Y.; Ye, J.; Chen, Z.H.; Ren, D.J.; Zhang, S.Q. The spectral characteristics and cadmium complexation of soil dissolved organic matter in a wide range of forest lands. Environ. Pollut. 2022, 299, 118834. [CrossRef]
  80. Gui, X.Y.; Liu, C.; Li, F.Y.; Wang, J.F. Effect of pyrolysis temperature on the composition of DOM in manure-derived biochar. Ecotox. Environ. Safe. 2020, 197, 110597. [CrossRef]
  81. Lan, Z.L.; Zhang, S.L.; Xie, L.C.; Li, X.; Sial, T.A.; Shar, A.G.; Fan, J.L.; Zhang, J.G.; Dong, Q.; Fu, G.J. Effects of Artemisia ordosica on fine-scale spatial distribution of soil C, N and P and physical–chemical properties in the Mu Us Desert, China. J. Soil. Sediment. 2022, 22, 172–184. [CrossRef]
  82. Cotrufo, M.F.; Soong, J.L.; Horton, A.J.; Campbell, E.E.; Haddix, M.L.; Wall, D.H.; Parton, A.J. Formation of soil organic matter via biochemical and physical pathways of litter mass loss. Nat. Geosci. 2015, 8, 776–779. [CrossRef]
  83. Froberg, M.; Kleja, D.B.; Hagedorn, F. The contribution of fresh litter to dissolved organic carbon leached from a coniferous forest floor. Eur. J. Soil Sci. 2007, 58, 108–114. [CrossRef]
  84. Bongiorno, G.; Bünemann, E.K.; Oguejiofor, C.U.; Meier, J.; Gort, G.; Comans, R.; Mäder, P.; Brussaard, L.; de Goede, R. Sensitivity of labile carbon fractions to tillage and organic matter management and their potential as comprehensive soil quality indicators across pedoclimatic conditions in Europe. Ecol. Indic. 2019, 99, 38–50. [CrossRef]
  85. Lange, M.; Eisenhauer, N.; Sierra, C.A.; Bessler, H.; Engels, C.; Griffiths, R.I.; Mellado-Vázquez, P.G.; Malik, A.A.; Roy, J.; Scheu, S.; Steinbeiss, S.; Thomson, B.C.; Trumbore, S.E.; Gleixner, G. Plant diversity increases soil microbial activity and soil carbon storage. Nat. Commun. 2015, 6, 6707. [CrossRef]
  86. Han, L.; Zhang, Y.L.; Jin, S.; Wang, J.A.; Wei, Y.Y.; Cui, N.; Wei, W. Effect of different irrigation methods on dissolved organic carbon and microbial biomass carbon in the greenhouse soil. Agr. Sci. China 2010, 9, 1175–1182. [CrossRef]
Figure 1. Map of the study area: (a) Location (black dot) of the Daqinggou National Nature Reserve of Inner Mongolia, China. (b) Soil sampling locations (sites A, B and C) in west of the Daqinggou National Nature Reserve. (c) Patches of natural elm (Ulmus macrocarpa Hance)-dominated sparse wood grassland, one of the most abundant and widespread tree species in the reserve, interspersed among the land surrounding the ravines, especially in the area of western the Daqinggou. UC, OC, and OG represent under canopy, outside canopy, open grassland, respectively.
Preprints 149353 g001
Figure 2. Distribution patterns of soil NH4+–N (a) and NO3–N (b) at different distances from tree. Capital letters indicate significant differences among the three horizon distances and lowercase indicate soil depth differences in the same distance at p < 0.05. Error bars denote the standard deviation (n = 3). ** p < 0.01. UC is under canopy; OC is outside canopy; and OG is open grassland.
Preprints 149353 g002
Figure 3. The SOC density at the 0–30 cm depth in each sampling distance. Error bars denote the standard deviation (n = 3). Capital letters indicate significant differences among the three horizon distances and lowercase indicate soil depth differences in the same distance at p < 0.05. UC, OC and OG represent under canopy, outside canopy, open grassland, respectively.
Preprints 149353 g003
Figure 4. Soil DOC contents for each distance from the tree at 0–5, 5–10, and 10–30 cm layers. Capital letters indicate significant differences among the three horizon distances and lowercase indicate soil depth differences in the same distance at p < 0.05. Error bars denote the standard deviation (n = 3). ** p < 0.01. UC, OC and OG represent under canopy, outside canopy, open grassland, respectively.
Preprints 149353 g004
Figure 5. Three-dimensional fluorescence excitation–emission matrix spectra maps. A1–A3, soil DOC of UC at depths of 0–5 cm, 5–10 cm and 10–30 cm, respectively; B1–B3, soil DOC of OC at depths of 0–5 cm, 5–10 cm and 10–30 cm, respectively; C1–C3, soil DOC of OG at depths of 0–5 cm, 5–10 cm and 10–30 cm, respectively. UC, OC and OG represent under canopy, outside canopy, open grassland, respectively. The color scale on the right indicates fluorescence intensity.
Preprints 149353 g005
Figure 6. (a) Variation of Fluorescence index (FI) and (b) biological index (BIX) in profiles at different distance from tree trunk. Capital letters indicate significant differences among the three horizon distances and lowercase indicate soil depth differences in the same distance at ** p < 0.01; ns, not significant. Error bars denote the standard deviation (n = 3). UC, OC and OG represent under canopy, outside canopy, open grassland, respectively.
Preprints 149353 g006
Figure 7. Correlation analysis of soil properties in Ulmus macrocarpa Hance-dominated savanna ecosystem. SM, soil moisture; BD, bulk density; * p < 0.05; ** p < 0.01.
Preprints 149353 g007
Table 1. Characteristics of soil at different distances from the Ulmus macrocarpa Hance tree trunks.
Horizon Soil Layer
(cm)
Soil Moisture
(%)
Bulk Density
(g cm–3)
pH SOC
(g kg–1)
TN
(g kg–1)
TP
(g kg–1)
C/N
UC 0–5 12.12(0.82)Aa 1.27(0.09)Ab 6.71(0.27)Aa 18.65(8.98)Aa 1.51(0.82)Aa 0.21(0.08)Aa 12.65(1.31)Aa
5–10 5.33(2.09)Ab 1.51(0.03)Aa 6.79(0.22)Aa 8.75(4.40)Ab 0.69(0.46)Ab 0.15(0.07)Aa 13.48(2.53)Aa
10–30 5.46(2.59)Ab 1.54(0.06)Aa 6.86(0.18)Aa 4.90(1.93)Ab 0.35(0.15)Ab 0.11(0.04)Ab 14.08(1.35)Aa
OC 0–5 11.79(1.02)Aa 1.33(0.07)Ab 6.62(0.01)ABa 9.18(1.10)Ba 0.63(0.14)Ba 0.13(0.03)Ba 14.69(1.46)Aa
5–10 7.55(1.71)Ab 1.47(0.02)Aa 6.69(0.06)ABa 5.47(0.59)Bb 0.40(0.05)Bb 0.11(0.02)Ba 13.61(0.40)Aa
10–30 7.44(0.84)Ab 1.55(0.07)Aa 6.73(0.07)ABa 3.71(0.79)Bb 0.26(0.05)Bb 0.09(0.02)Bb 14.29(0.74)Aa
OG 0–5 10.71(4.61)Aa 1.35(0.09)Ab 6.51(0.04)Ba 7.45(1.57)Ba 0.57(0.18)Ba 0.13(0.03)Ba 13.32(1.78)Aa
5–10 9.69(4.78)Ab 1.49(0.04)Aa 6.55(0.07)Ba 5.00(1.25)Bb 0.38(0.09)Bb 0.10(0.02)Ba 13.29(0.48)Aa
10–30 7.67(3.21)Ab 1.51(0.06)Aa 6.56(0.04)Ba 3.47(0.32)Bb 0.27(0.02)Bb 0.09(0.01)Bb 12.87(0.30)Aa
Two-way ANOVA analysis
Distance (D) ns ns ** ** * * ns
Soil Depth (S) ** ** ns ** ** * ns
D × S ns ns ns ns ns ns ns
UC, OC and OG represent under canopy, outside canopy, open grassland, respectively. Data are means (SD), n = 3, except for bulk density whose n is 12 (4 directions and 3 replications). Capital letters indicate significant differences among the three horizon distances and lowercase indicate soil depth differences in the same distance at p < 0.05. * p < 0.05; ** p < 0.01; ns, not significant.
Disclaimer/Publisher’s Note: The statements, opinions and data contained in all publications are solely those of the individual author(s) and contributor(s) and not of MDPI and/or the editor(s). MDPI and/or the editor(s) disclaim responsibility for any injury to people or property resulting from any ideas, methods, instructions or products referred to in the content.
Copyright: This open access article is published under a Creative Commons CC BY 4.0 license, which permit the free download, distribution, and reuse, provided that the author and preprint are cited in any reuse.
Prerpints.org logo

Preprints.org is a free preprint server supported by MDPI in Basel, Switzerland.

Subscribe

Disclaimer

Terms of Use

Privacy Policy

Privacy Settings

© 2025 MDPI (Basel, Switzerland) unless otherwise stated