Submitted:
13 February 2025
Posted:
14 February 2025
You are already at the latest version
Abstract
In the present work, the effect of different casting processes on the microstructure and creep properties of the second-generation single-crystal superalloy DD419 was investigated. Under conventional production conditions and a contour-suited thermal insulation method, single crystal rods of types A and B were fabricated, respectively. In comparison to rods A, the solidification process of rods B featured a 1.6-fold increase in the temperature gradient and a 32% reduction in primary dendrite spacing. The γ/γ’ eutectic in the as-cast microstructure, the residual eutectic phase, and porosity after heat treatment were also significantly reduced, resulting in the improved homogeneity of the single crystal castings. Under the testing conditions of 850°C/650MPa and 1050°C/190MPa, the stress rupture life of sample B was enhanced by 25% and 5.2%, respectively, compared to sample A. Therefore, due to dendrite structure refinement, the stress rupture life of the superalloy was evidently improved, especially at medium temperature.
Keywords:
superalloy
; single crystal
; dendrite structure
; stress rupture property
; DD419
1. Introduction
The mechanical properties of single crystal (SC) superalloys are key technical indicators for the hot-end components of aero engines and gas turbines, directly affecting engine reliability and efficiency. According to the current research results, the mechanical properties of SC superalloys are influenced by many factors such as material composition [1,2,3,4,5,6], testing conditions (temperature and stress) [7], heat treatment processes [8,9,10], casting processes, and the metallurgical quality of the castings. The metallurgical quality of the castings includes defects such as inclusions and metallurgical flaws [20,21], crystal misorientation [14,15,16,17,18,19], and primary dendrite arm spacing (hereinafter referred to as dendrite spacing λ) [7,11,12,13].
In the production of superalloy components, the casting alloy is typically selected by the customers, making it hard to improve the microstructure and performance by altering the chemical composition of the alloys. The heat treatment process is generally fixed as a technical standard and cannot be changed. The testing temperature and stress for creep properties are also explicitly specified. Great efforts have been made to improve the product qualification rate by reducing the inclusions and defects in the SC castings. However, even in qualified SC components, the as-cast microstructure can still vary significantly due to the differences in casting process conditions, which, in turn, affect the subsequent heat-treated microstructure and the mechanical properties. Therefore, optimizing the casting process to improve both the as-cast and heat-treated microstructures can effectively enhance the mechanical properties of SC superalloys, thereby improving the efficiency and reliability of aero engines and gas turbines.
2. Materials and Methods
The alloy used in this study is a second-generation SC superalloy DD419, with its chemical composition listed in Table 1.
To fabricate the SC samples, two same wax clusters were assembled with 10 wax rods, each with a diameter of 15 mm and length of 180 mm. The lower part of each rod was connected to a spiral crystal selector and mounted around a central pillar on a base plate, thus forming a ring-shaped wax cluster. Using the conventional lost-wax process, two ceramic molds were prepared for the casting experiments (Experiment A and B) in a vacuum directional solidification furnace (ALD, Germany, Model: VIM-IC/DS/SC). For both experiments, the shell preheating temperature and pouring temperature were set at 1550°C, and the withdrawal speed was maintained at 3.5 mm/min. The only difference between the two experiments lies in the insulation condition between the heating room and the cooling zone of the furnace during the solidification process. Experiment A was conducted under conventional production conditions, while Experiment B involved specialized treatments for both the mold shell and furnace insulation baffle. First, insulating materials were filled into the space between the rods and the central pillar of the mold cluster. In addition, the conventional circular insulation baffle at the bottom of the heating room was replaced with a contour-suited insulation baffle that conformed to the external contour of the mold cluster. This design eliminated the through-hole region in the center of the mold cluster and reduced the gap between the outer surface of the mold and the insulation baffle. The goal of these contour-suited insulation measures was to create effective thermal insulation between the furnace’s heating and cooling zones, enhance the temperature gradient during solidification, and refine the dendrite structure of the SC castings by reducing the dendrite spacing. It was measured that under conventional conditions (Experiment A), the temperature gradient was approximately 1.9 K/mm, while in Experiment B with contour-suited insulation measures, the optimized temperature gradient increased to 4.9 K/mm.
A portion of each set of SC rods (A and B) was selected for as-cast microstructural analysis, while the remaining rods underwent the following heat treatment process: the solution heat treatment at 1305°C for 4 hours, the primary aging treatment at 1140°C for 6 hours, and the secondary aging treatment at 870°C for 16 hours.
Cross-section samples were extracted from the bottom (Position 1), middle (Position 2), and top (Position 3) of both as-cast and heat-treated rods (A and B) using an electric discharge machine. After polishing and grinding, the samples were chemically etched with a solution of HCl (20 ml), FeCl3 (10 g), and H2O (20 ml). The as-cast and heat-treated microstructure were observed and analyzed using a Nikon metallographic microscope, to determine the dendrite spacing (λ), micro-porosity (ρ), as-cast γ/γ’ eutectic, and residual eutectic fraction. Under as-cast conditions, the dendrite spacing was measured in a view field of 2.5mm x 2.5mm in the rod center, and the most severe eutectic and its content were measured in a 1mm x 1.25mm view field for each sample. In the fully heat-treated state, average residual eutectic structure and micro-porosity were measured in a 2.5mm x 2.5mm view field at the center of each sample’s cross-section, while the most severe localized residual eutectic and micro-porosity were measured in a 1mm x 1.25mm view field.
The heat-treated SC rods (A and B) with well-aligned primary crystal orientations (misorientation<5 degrees) were selected for mechanical property testing. The upper sections of these SC rods were cut and used for stress rupture property testing under the conditions of 850°C/650MPa and 1050°C/190MPa respectively.
3. Results and Discussion
3.1. As-Cast Microstructure
Under as-cast conditions, the most severe eutectic phase structure and its content were measured in a 1mm x 1.25mm view field for each sample. Figure 1 shows the worst view fields as-cast microstructures at different heights of rods A and B. In Figure 1(a1), (a2), and (a3), the cross-sections of the bottom, middle and top parts of rod A, are represented respectively. Correspondingly, Figures (b1), (b2), and (b3) show the cross-sections from the bottom to the top of rod B. The as-cast microstructure is mainly composed of cross-shaped γ-phase dendrites (dark regions) and γ/γ’ eutectic islands (bright white regions) with irregular shapes between the dendrites. It can be observed that the dendrite structure in rod A is relatively coarser than that in rod B.
The dendrite spacing (λ) at each cross-section of the two types of rods was measured using the unit area method, and the results are shown in Figure 2. Rod A was fabricated under normal production conditions with a relatively lower temperature gradient, resulting in a coarser dendrite structure. Furthermore, as the height increased, the dendrite spacing also increased from 348 μm at the bottom to 452 μm at the top. In rod B, which was fabricated with modified thermal insulation measures, significantly smaller dendrite spacings were measured. Moreover, as the height of rod B increased, the dendrite spacing became even smaller.
As can be evaluated in Figure 2, the average dendrite spacing of sample A is 391 μm, which is 1.48 times that of rod B (266 μm). At the top of the rods, the dendrite spacing of sample A3 was 1.86 times that of sample B3. This indicates that the use of the contour-suited insulation measures effectively reduced the dendrite spacing in the SC castings. Moreover, the reduction in dendrite spacing was more pronounced toward the upper part of the castings.
The volume fraction of γ/γ’ eutectic (fE) at each cross-section of the as-cast SC rods A and B was measured and summarized in Figure 3. As the solidification process progressed from the bottom to the top, the eutectic fraction in rod A showed an increasing trend, which corresponds to the coarsening trend of the dendrite structure in rod A (Figure 2). In contrast, the eutectic fraction in rod B gradually decreased, which also mirrors the change in dendrite spacing in rod B (Figure 2). The reduction in eutectic fraction was more pronounced towards the rod top. At the top of rod B (B3), the eutectic fraction (fE = 7.43%) was only 70% of that at section A3 (fE = 10.61%).
As shown in Figure 1, the dendrite structure in the as-cast rod A is coarser than that in rod B, leading to the larger size of γ/γ’ eutectic islands. Due to the refinement in dendrite structure, the fraction and the size of eutectic islands in as-cast rod B is reduced.
3.2. Heat-Treated Microstructure
Single crystal rods A and B were subjected to heat treatment under the same conditions. Cross-section samples were taken from the bottom, middle, and top of the rods. The typical metallographic microstructures are shown in Figure 4. Although the dendrite structure became somewhat blurred after high-temperature heat treatment, it can still be distinguished. The positions and spacings of the dendrites remain unchanged, but the size and the fraction of the γ/γ’ eutectic (bright white phase) between the dendrites is significantly reduced compared to the as-cast microstructure (Figure 1).
For the heat-treated SC rods A and B, the residual eutectic fraction fH on the bottom, middle, and top cross-sections was measured and summarized in Figure 5. It can be observed that the residual eutectic fraction fH in both rods A and B decreases with the solidification height. The average residual eutectic fraction in rod A is approximately 1.39%, while in rod B it is only around 0.17%, which is nearly one order of magnitude lower than that of rod A.
It should be noted that the values of residual eutectic fraction shown in Figure 5 are the average ones on each cross-section of the heat-treated rods. In reality, the distribution of residual eutectic in the matrix is very uneven Therefore, for each -section of SC rods A and B, the worst view field (1mm × 1.25mm) containing the most residual eutectic was selected, The correspondingly measured values for residual eutectic fraction fW are shown in Figure 6. For rod A, the fW-values measured in the worst view fields of the three sections exceeded 4.0%, showing an increasing trend with the rod height. In rod B, the corresponding fW-values measured in the worst view fields are only one-third to one-fifth of those in sample A. In comparison with Figure 5, it is clear that the local eutectic fraction fW in the worst view field is approximately 3-7 times higher than the average one fH on the entire cross-section.
Besides the residual eutectic fraction fH on each cross-section, the sizes i.e., the areas of individual residual eutectic islands in heat-treated rods A and B were also quantified. Similar eutectic patterns were observed across different height sections of the same sample. Figure 7(a) and (b) present the statistical results of the residual eutectic sizes on the middle cross-section of rods A and B, respectively. It can be observed that the total number of residual eutectic islands in samples A and B were 176 and 110, respectively, with a relatively small difference. However, the maximum size of the residual eutectic islands was measured to be 3269 μm² for sample A and only 431 μm² for sample B. The average sizes of the residual eutectic islands in samples A and B were 413 μm² and 88.3μm², respectively. This indicates that the implementation of the improved insulation measures for experiment B not only reduced the residual eutectic content in the matrix after heat treatment but also significantly decreased both the average and maximum sizes of the eutectic islands. This has important implications for enhancing the mechanical properties of the material, as larger residual eutectic islands cause greater damage to the material’s mechanical performance.
The main purpose of solution heat treatment for superalloys is to dissolve the coarse γ′/γ eutectic structure, which is characterized by the transformation of the coarse γ′ phase into the γ matrix. This process is essentially the homogenization of alloying elements, achieved through atomic diffusion mechanisms. Key factors influencing the residual eutectic content after solution treatment are solution temperature and time. The higher the solution temperature and the longer the time, the more sufficient the diffusion of alloying elements, resulting in a lower residual eutectic content. The homogenization time t for alloying elements can be expressed as [23]:
where L is the characteristic diffusion distance, equivalent to half of the primary dendrite spacing λ in dendrite structures, and D is the diffusion coefficient of alloying elements in the matrix. From equation (1), it can be observed that the homogenization time t during solution treatment is proportional to the square of the characteristic diffusion distance L. When dendrite spacing λ is reduced, the homogenization time can be significantly shortened. In this experiment, the average dendrite spacing of sample A is 1.48 times that of sample B. To achieve the same solution effect, the homogenization time for sample A needs to be 2.2 times longer than that of sample B. Since the same solution heat treatment temperature and time were used in this experiment, the degree of homogenization in sample A is far inferior to that of sample B, leading to more and larger residual eutectic islands in sample A.
t = L2 / (4π2D)
Micro-porosity was examined on the polished cross-sections without etching. In Figure 8(a1-a3) and (b1-b3) the micro-porosity images of the bottom, middle, and top cross-sections of samples A and B were shown, respectively. It can be observed that the micro-porosity area in sample A is slightly larger than that in sample B.
The micro-porosity area of the three cross-sections of both types of samples was measured. The ratio of the total micro-porosity area to the total area of the view fields was defined as the porosity ratio ρ. The distribution of the ρ-values of the cross-sections of both samples is shown in Figure 9. The porosity ratios of sample A showed little variation, with an average value of 0.26%. In contrast, the average porosity rate of the three cross-sections of sample B was 0.17%, which is better than that of sample A.
The worst view field of 1mm x 1.25mm with the most porosity was selected on each cross-section of SC samples A and B, and the results are shown in Figure 10. It can be observed that the worst view fields in sample A have more severe local porosity than those in sample B.
Figure 11(a) and (b) respectively show the area distribution statistics of all micro-porosity holes in samples A and B. The number of porosity holes in samples A and B were 456 and 342, respectively. The average area of the porosity hole in samples A and B was 110.9 and 92.0 μm². The size distribution of porosity holes in sample A is more dispersed, with more large-sized porosity holes. The area of the largest porosity hole in sample A is 1066 μm², while that in sample B is only 892 μm². There are 6 porosity holes with areas exceeding 600 μm² and 3 holes exceeding 900 μm² in sample A. In contrast, sample B has only 1 porosity hole with an area over 600 μm² and none exceeding 900 μm². This indicates that due to the larger-sized porosity holes in sample A, the mechanical properties are more significantly compromised.
3.3. Stress Rupture Property
After solution and aging heat treatment under the same conditions, sample A and sample B were cut from the upper section to prepare test samples for stress rupture property testing at 850°C/650MPa and 1050°C/190MPa. The crystal misorientation of the samples was less than 5 degrees, and the measured stress rupture life is shown in Figure 12. Under the test condition of 850°C/650MPa, the stress rupture lives of sample A and sample B were measured to be 115.28 h and 143.98 h, respectively, with sample B showing a 25% improvement over sample A. Under the test condition of 1050°C/190MPa, the stress rupture lives of sample A and sample B were 89.08 h and 93.7 h, respectively, with sample B showing a 5.2% improvement over sample A. This indicates that refining the dendrite structure can improve the stress rupture property of SC castings, but the improvement in high-temperature stress rupture property is not as significant as that at mid-range temperatures.
Table 2 summarizes the main measurement results of this study. Compared to sample A prepared under conventional production conditions, sample B with contour-suited insulation measures exhibits better performance across all indicators. This is primarily reflected in the significant refinement of the dendrite structure, with a marked reduction in dendrite spacing. Both the as-cast eutectic and the residual eutectic content after heat treatment are significantly reduced In particular, the reduction in large-sized residual eutectic and porosity is notable, which improves the uniformity of the microstructure and the mechanical properties of the sample, especially the mid-temperature creep performance.
4. Conclusions
- Single crystal rods of types A and B were fabricated under conventional production conditions and with contour-suited insulation measures, respectively. The temperature gradients during the solidification process were measured as 1.9 K/mm and 4.9 K/mm for rod types A and B, and the corresponding dendrite spacing was reduced from 391 μm to 266 μm. This demonstrates the effective role of the contour-suited insulation in refining the dendrite structure.
- The average γ/γ’ eutectic fraction in the as-cast structure of rods A and B was 9.97% and 8.20%, respectively, indicating the effect of dendrite structure refinement on the eutectic reduction in the cast structure.
- After heat treatment, the average residual eutectic fraction in rods A and B was 1.39% and 0.17%, with the latter being only 15% of the former.
- After heat treatment, the average porosity in rods A and B was 0.26% and 0.17%, respectively. Moreover, the number of large porosity holes in rod A was much more than that in rod B, causing more significant damage to the material’s performance.
- Under the test conditions of 850°C/650MPa and 1050°C/190MPa, the endurance performance of rod B was improved by 25% and 5.2%, respectively, compared to rod A. This suggests that the dendrite structure refinement evidently improved the intermediate-temperature property of the SC castings, although the improvement at high-temperature is less significant.
Author Contributions
Conceptualization, H.S., D.M.; methodology, H.S., D.M., Y.Z.; formal analysis, H.S., D.M.; investigation, H.S., Z.S.; resources, J.W., X.G.; data curation, H.S., Z.S.; writing—original draft preparation, H.S.; writing—review and editing, H.S., D.M.; visualization, H.S., D.M.; supervision, J.W.; project administration, Y.Z., J.W.; funding acquisition, D.M.; All authors have read and agreed to the published version of the manuscript.
Funding
This research was funded by the National and Shenzhen City Joint Technology Program of China (JBGS2024-431-029).
Data Availability Statement
The original contributions presented in this study are included in the article. Further inquiries can be directed to the corresponding authors.
Acknowledgments
A special thanks to Hualin Tao, Kexin Wang, and Huchun Zheng for their assistance in the sample preparation process.
Conflicts of Interest
The authors declare no conflicts of interest.
References
- Li, X. W.; Liu, T.; Wang, L.; Liu, X.G.; Lou, L.H.; Zhang, J. Effect of carbon content on the microstructure and creep properties of a 3rd generation single crystal nickel-base superalloy. Materials Science and Engineering: A 2015, 639, 732–738. [Google Scholar] [CrossRef]
- Zhou, Z.; Li, Y.; Tan, Z.; Liu, L.; Wang, X.; Lv, P.; Liang, Z.; Tao, Y.; Yang, Y.; Liu, J.; Liu, J.; Li, J.; Zhou, Y.; Sun, X. Effect of carbon content on the microstructure and stress rupture properties of a 4th-generation nickel-based single crystal superalloy. Materials Science and Engineering: A 2024, 916, 147383. [Google Scholar] [CrossRef]
- Zhao, Y. S.; Zhang, J.; Luo, Y. S.; Tang, D. Z.; Feng, Q. Effects of Hf on high temperature low stress rupture properties of a second generation Ni-based single crystal superalloy DD11. Acta Metallurgica Sinica 2015, 51, 1261–1272. [Google Scholar]
- Wang, X. J.; Liu, L.; Huang, T. W. A review on the influence of carbon addition on the solidification defects in nickel-based single crystal superalloys. Materials Reports 2020, 34, 3148–3156. [Google Scholar]
- Yu, Z. H.; Liu, L. Effect of C on the rupture properties of single crystal superalloys. Acta Metallurgica Sinica 2014, 50, 854–862. [Google Scholar]
- Liu, J. L.; Sun, J. X.; Meng, J.; Li, J. G. Microstructural stability and stress rupture properties of a third-generation Ni base single crystal superalloy. Acta Metallurgica Sinica 2024, 60, 770–776. [Google Scholar]
- Liu, Y.; Wu, J. M.; Wang, Z. C.; Lu, X. G.; Avdeev, M.; Shi, S. Q.; Wang, C. Y.; Yu, T. Predicting creep rupture life of Ni-based single crystal superalloys using divide-and-conquer approach based machine learning. Acta Materialia 2020, 195, 454–467. [Google Scholar] [CrossRef]
- Cao, L. M.; Li, X. H.; Chen, J. Y.; Xue, M.; Zhang, Y. Influence of solution heat treatment temperature on the microstructure of the third generation Ni-based single crystal superalloy DD10. Journal of Materials Engineering 2011, 0, 23–27. [Google Scholar]
- Yu, J.; Sun, X.; Zhao, N.; Jin, T.; Guan, H.; Hu, Z. Effect of heat treatment on microstructure and stress rupture life of DD32 single crystal Ni-base superalloy. Materials Science and Engineering: A 2007, 460, 420–427. [Google Scholar] [CrossRef]
- Fuchs, G. E. Solution heat treatment response of a third generation single crystal Ni-base superalloy. Materials Science and Engineering A 2001, 300, 52–60. [Google Scholar] [CrossRef]
- Zhang, S. H.; Lu, Y. Z.; Zheng, W.; et al. Effect of primary dendrite arm spacing on the anisotropic stress rupture properties in a nickel-base single crystal superalloy DD26. Materials Review 2016, 30, 4. [Google Scholar]
- Li, H. T.; Wang, X. M.; Li, Z. X.; Liu, H.; Qiao, S. Z.; Yv, Z. Y.; Zhang, K.; Li, L. A statistical microstructures-based method for the prediction of mechanical properties in nickel-based single crystal alloys. Materials at High Temperatures 2023, 40, 412–423. [Google Scholar] [CrossRef]
- Sun, J. X.; Liu, J. L.; Chen, C.; et al. Effect of γ′ size on intermediate temperature stress rupture property of the third generation single crystal nickel-base superalloy containing Re. Rare Metal Materials and Engineering 2022, 51, 369–373. [Google Scholar]
- Wang, J.; Liang, J.; Zhang, D.; Peng, Y.; Wen, Z. The effect of small orientation deviation from [001] to [011] on high-temperature creep properties of nickel-based single crystal. International Journal of Plasticity 2023, 166, 103648. [Google Scholar] [CrossRef]
- MacKay, R. A.; Maier, R. D. The influence of orientation on the stress rupture properties of nickel-base superalloy single crystals. Metallurgical Transactions A 1982, 13, 1747–1754. [Google Scholar] [CrossRef]
- Heep, L.; Bürger, D.; Bonnekoh, C.; Wollgramm, P.; Dlouhy, A.; Eggeler, G. The effect of deviations from precise [001] tensile direction on creep of Ni-base single crystal superalloys. Scripta Materialia 2022, 207, 114274. [Google Scholar] [CrossRef]
- Qu, P.; Yang, W.; Wang, Q.; et al. Unveiling the orientation sensitivity of creep life in near [001] oriented Ni-based single crystal superalloys at intermediate temperatures. International Journal of Plasticity 2024, 179, 104035. [Google Scholar] [CrossRef]
- Yue, Z. F.; Lv, Z. Z.; Yang, Z. G.; Cheng, X. M.; Yin, Z. Y. Influence of deviation and randomness of crystallographic orientations on the strength and life of nickel-base single crystal superalloy turbine blades. Journal of Aerospace Power 2003, 18, 477–480. [Google Scholar]
- Rae, C. M. F.; Reed, R. C. Primary creep in single crystal superalloys: Origins, mechanisms, and effects. Acta Materialia 2007, 55, 1067–1081. [Google Scholar] [CrossRef]
- Zhao, J. Q.; Li, J. R.; Liu, S. Z.; Yuan, H. L.; Han, M. Effects of low angle grain boundaries on stress rupture properties of single crystal superalloy DD6. Journal of Aeronautical Materials 2007, 27, 6–10. [Google Scholar]
- Shi, Z. , Li, J., Liu, S., & Zhao, J. Effect of LAB on the Stress Rupture Properties and Fracture Characteristic of DD6 Single Crystal Superalloy. Rare Metal Materials and Engineering 2012, 41, 0962–0966. [Google Scholar]
- Zhang, S.; Xie, G.; Dong, J.; Lou, L. Investigation on Eutectic Dissolution Behavior of Single Crystal Superalloy by Differential Scanning Calorimetry. Acta Metallurgica Sinica 2021, 57, 1559–1566. [Google Scholar]
- Karunaratne, M. S. A.; Cox, D. C.; Carter, P.; Reed, R. C. Modelling of the Microsegregation in CMSX-4 Superalloy and its Homogenisation During Heat Treatment. Superalloys 2000, 263–272. [Google Scholar]
Figure 1.
The cross sections of SC rod A (a1-a3) and B (b1-b3), showing the as-cast microstructure at the bottom, middle, and top portions, respectively.
Figure 1.
The cross sections of SC rod A (a1-a3) and B (b1-b3), showing the as-cast microstructure at the bottom, middle, and top portions, respectively.
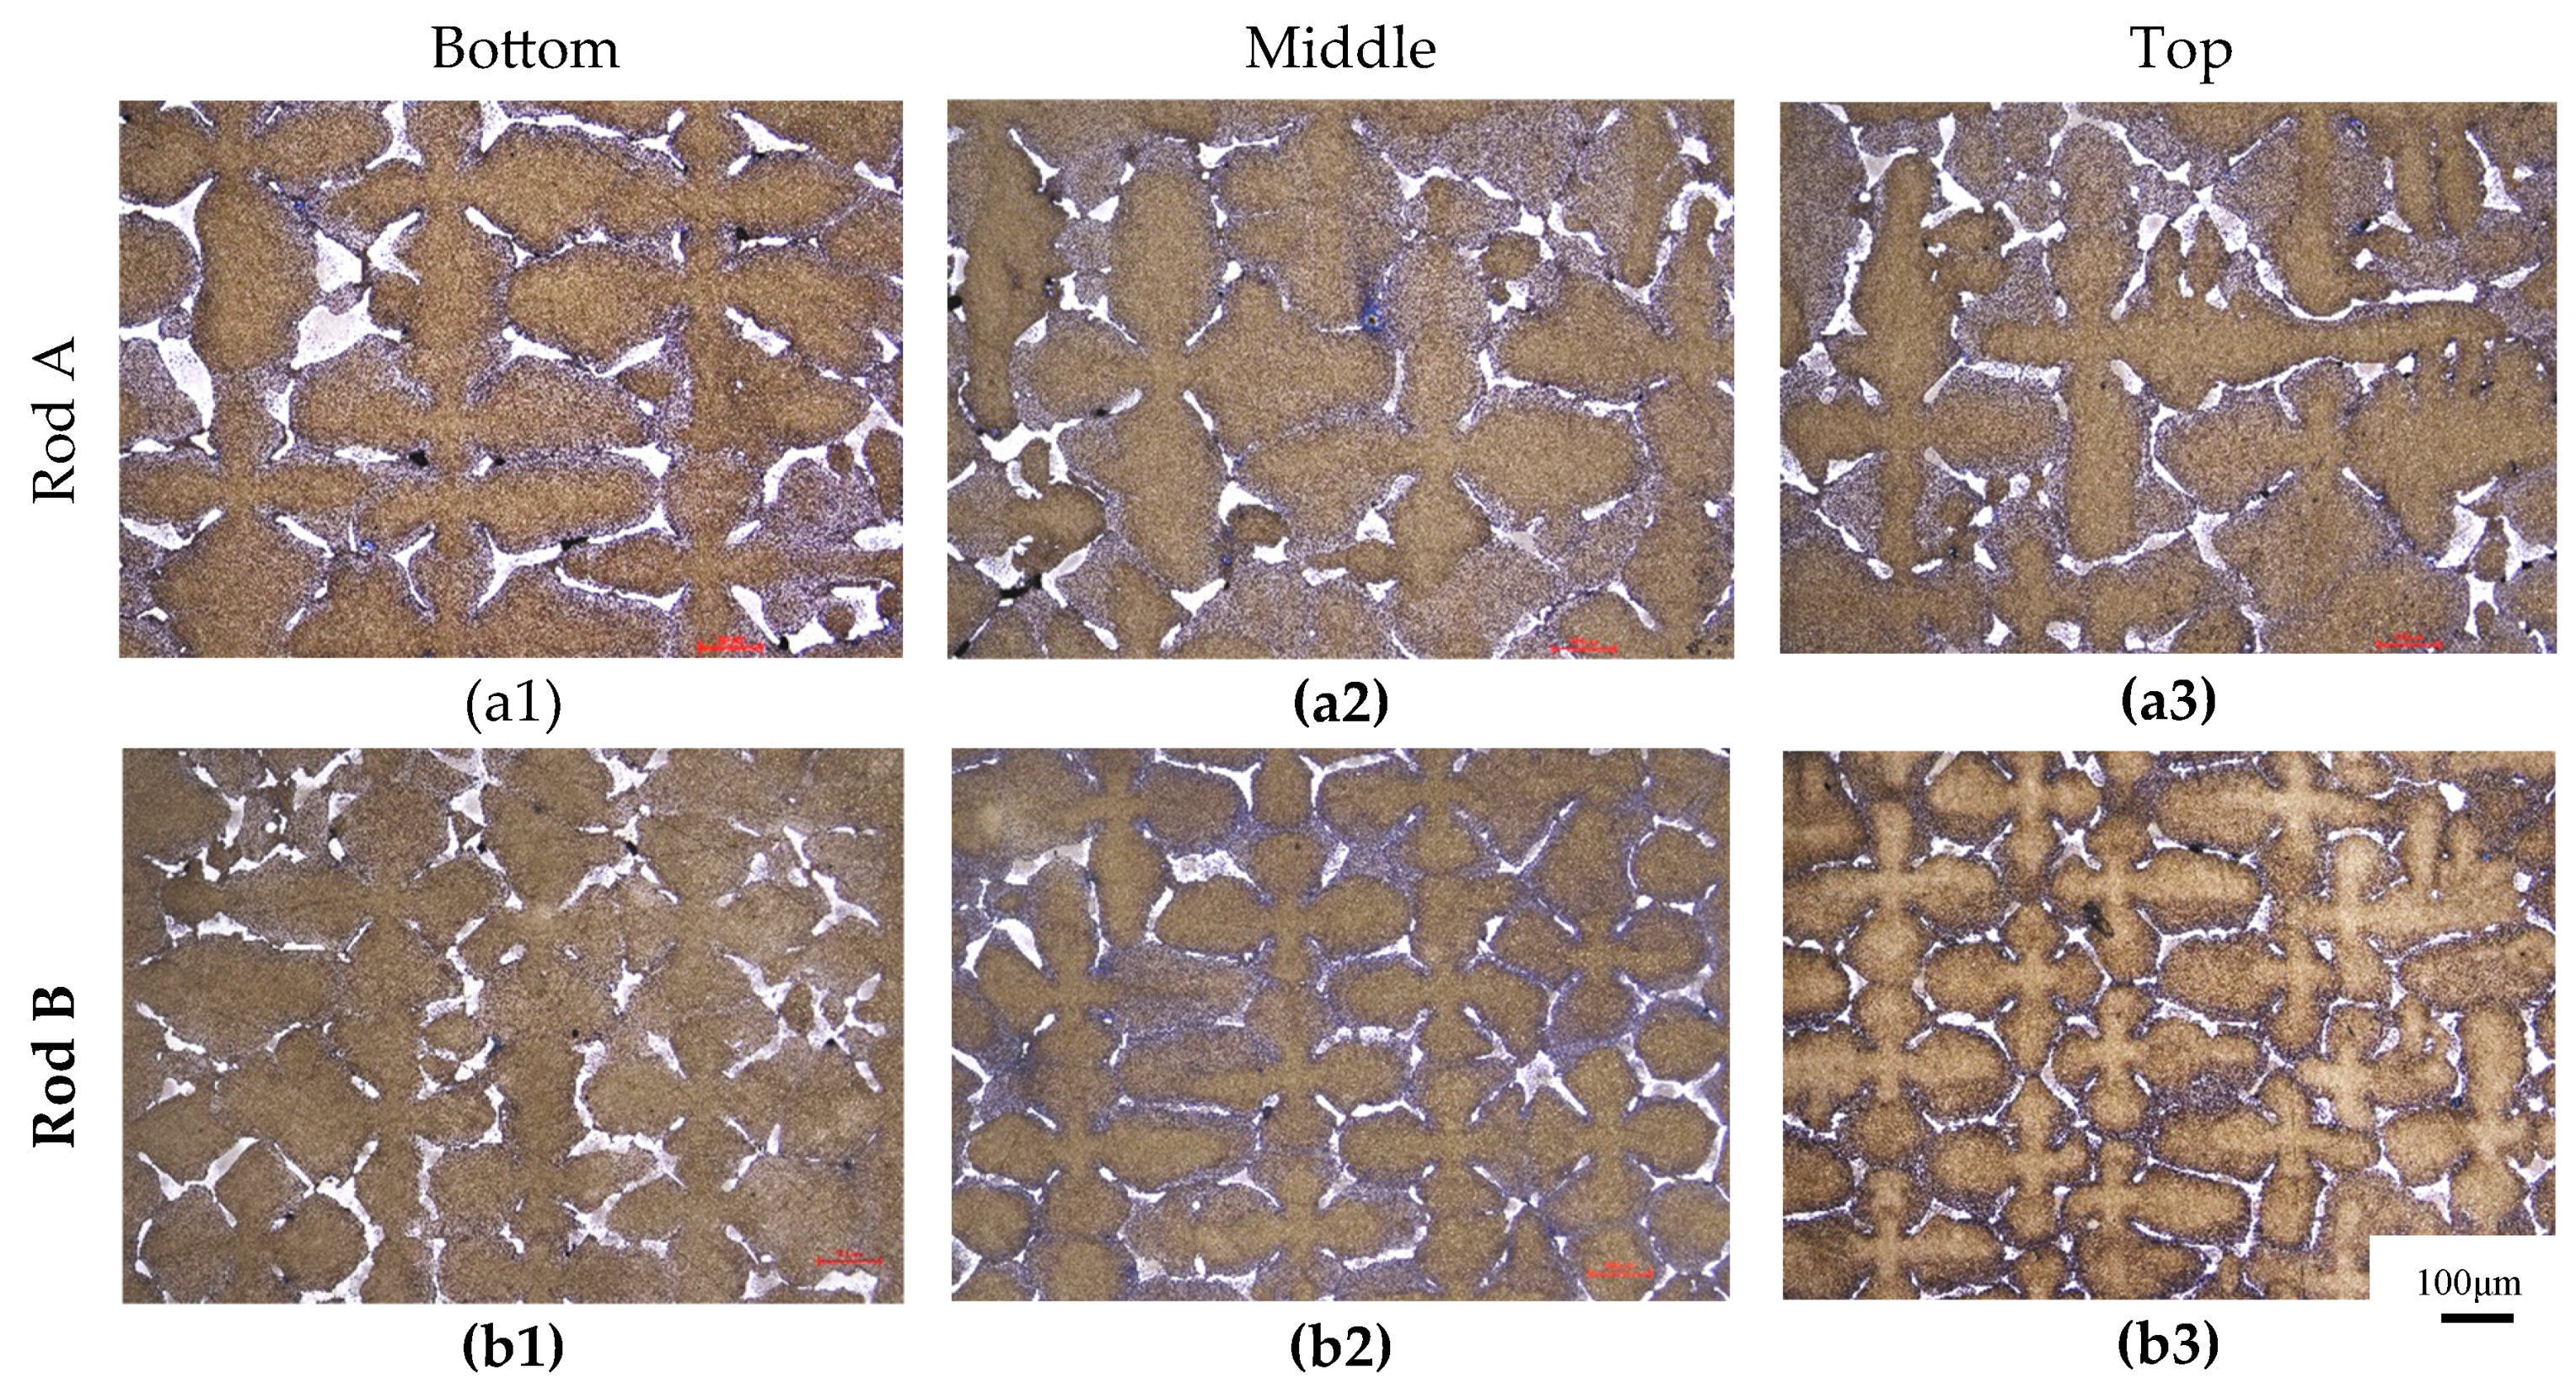
Figure 2.
The measured dendrite spacing (λ) at the bottom, middle, and top cross-sections of rods A and B.
Figure 2.
The measured dendrite spacing (λ) at the bottom, middle, and top cross-sections of rods A and B.
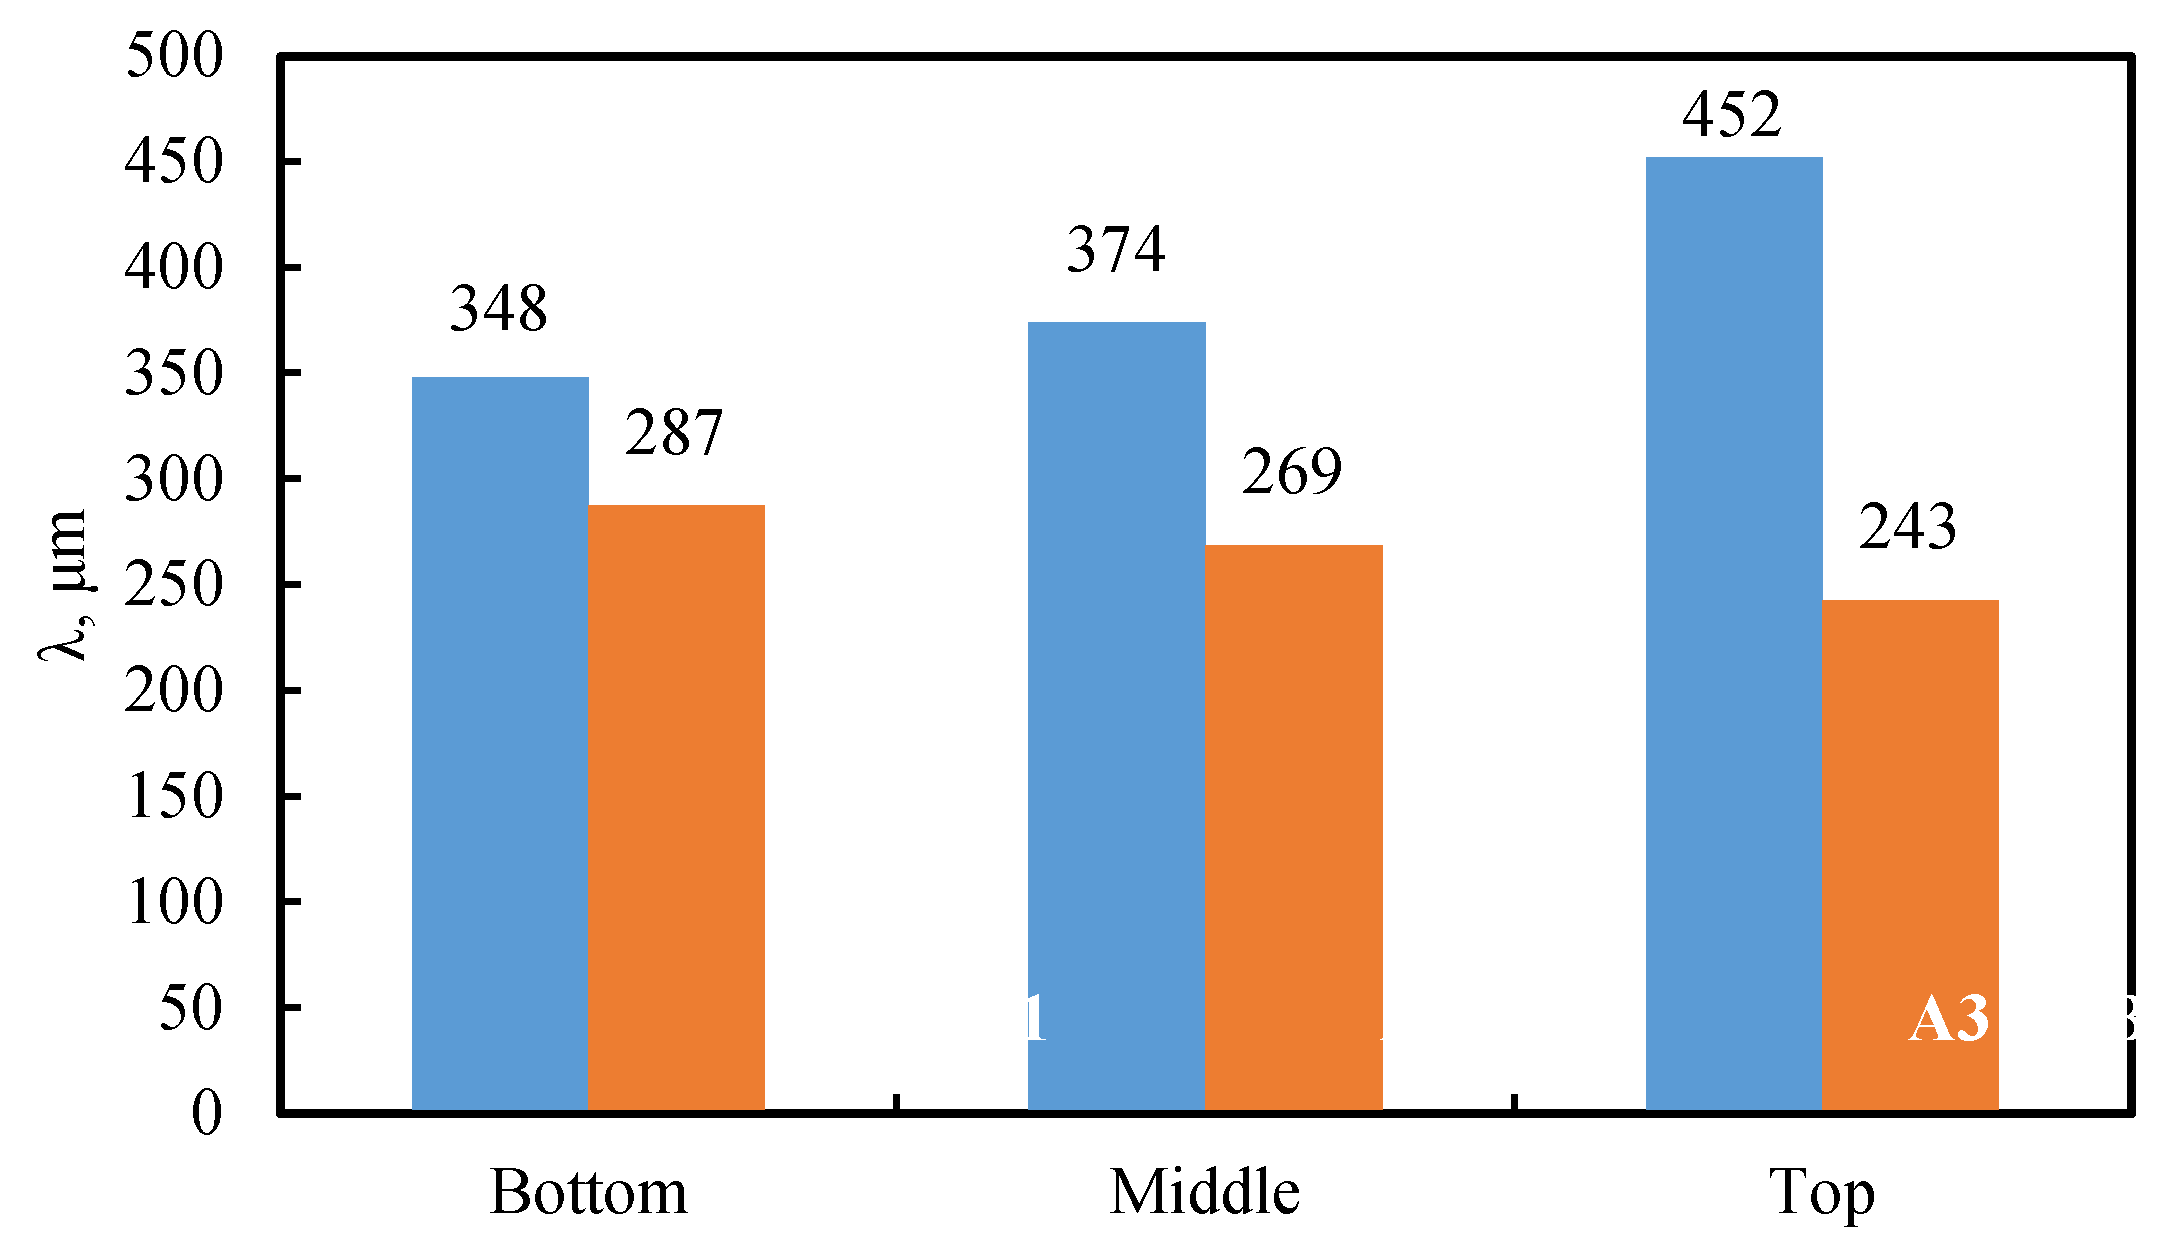
Figure 3.
The fraction of γ/γ’ eutectic(fE)measured at the bottom, middle, and top of as-cast rods A and B.
Figure 3.
The fraction of γ/γ’ eutectic(fE)measured at the bottom, middle, and top of as-cast rods A and B.
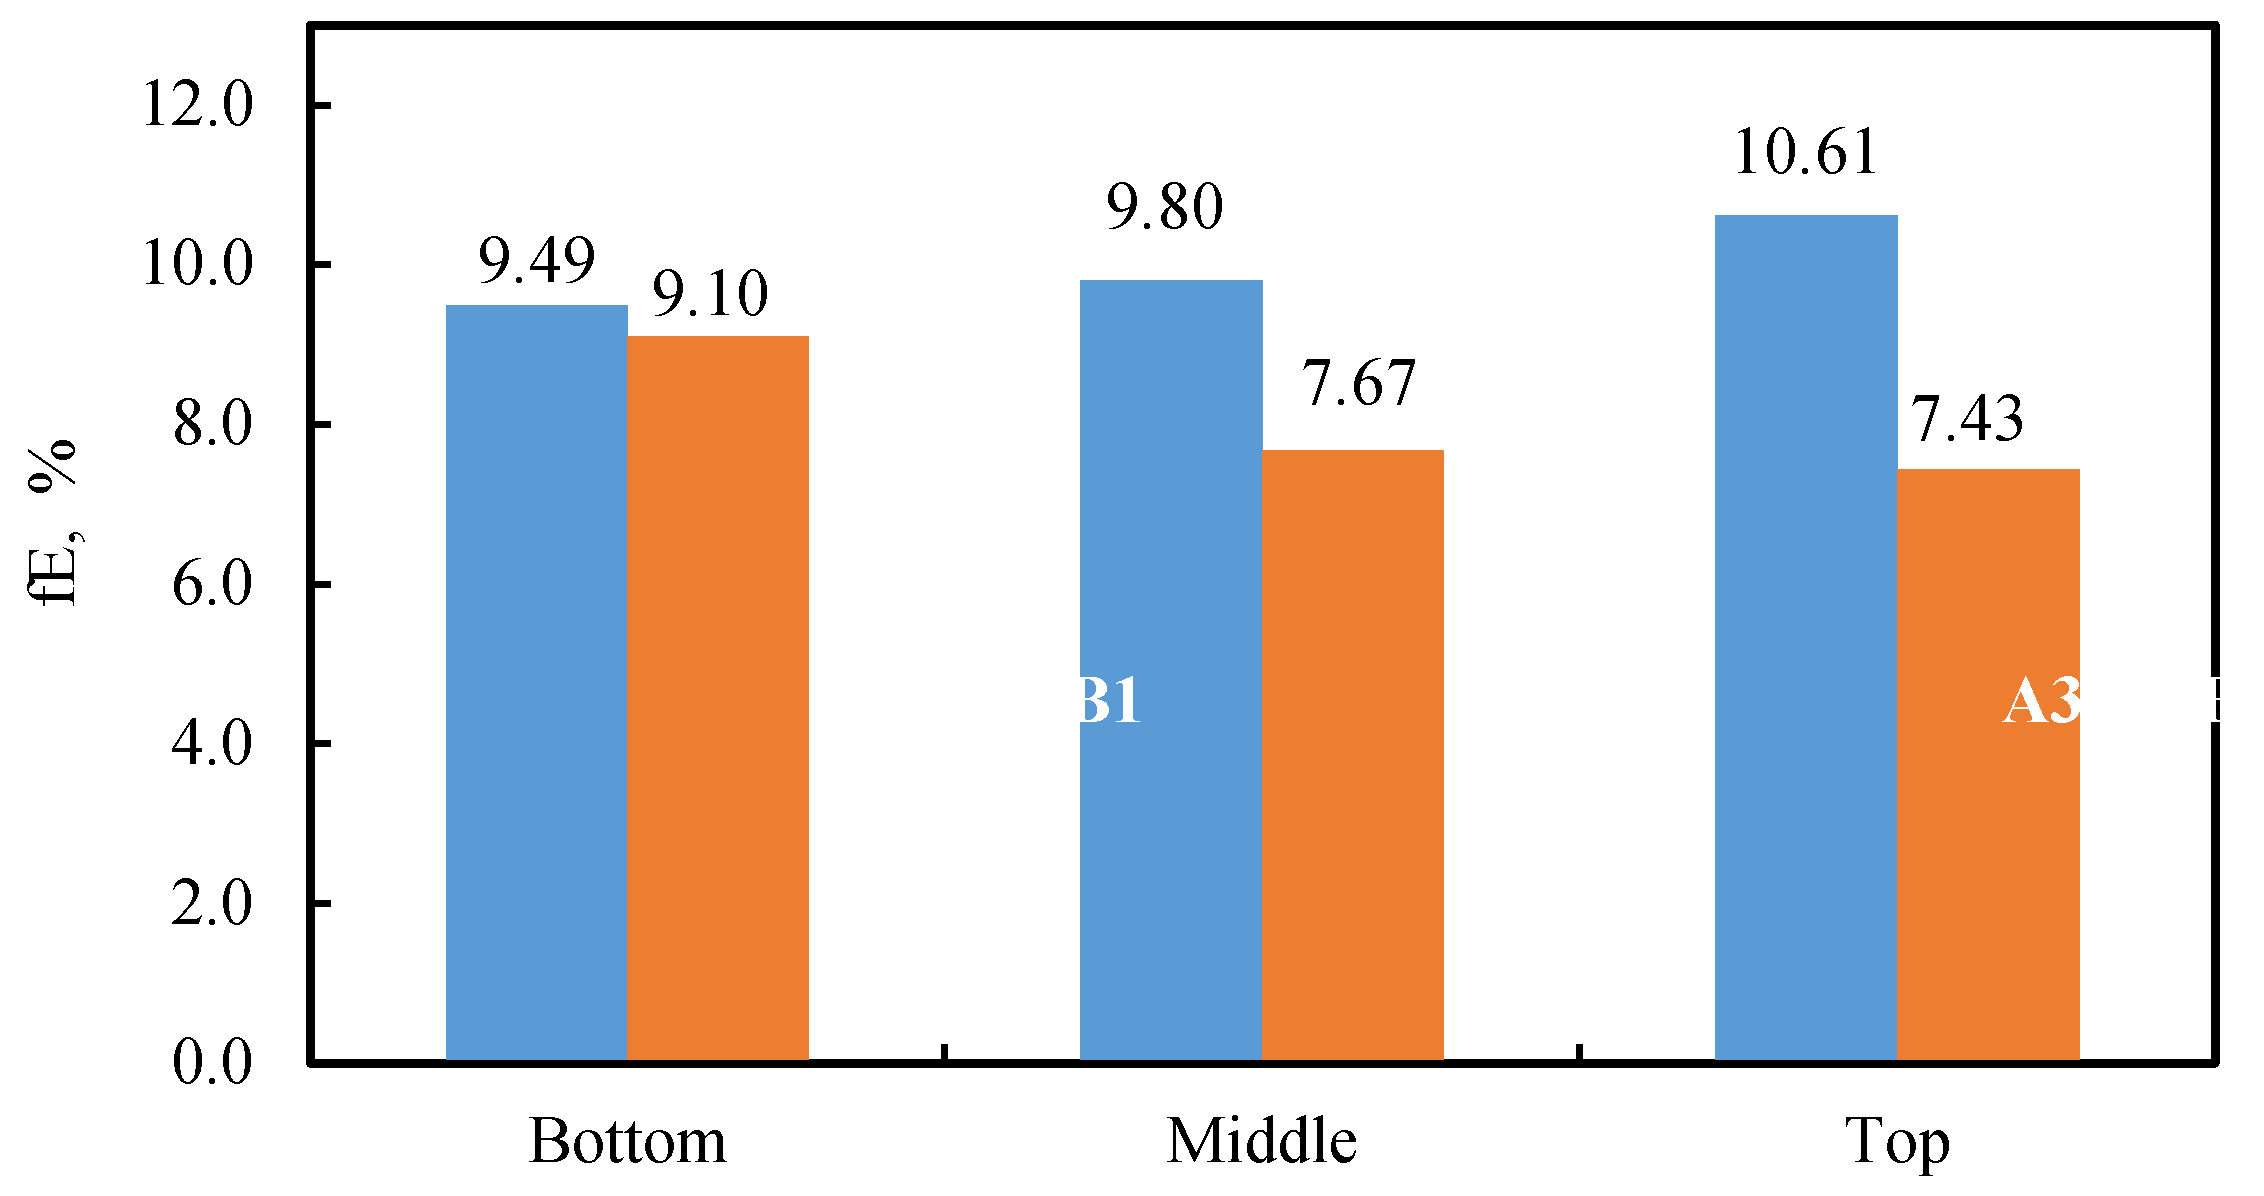
Figure 4.
The cross sections of SC rod A (a1-a3) and B (b1-b3), showing the heat-treated microstructure at the bottom, middle, and top portions, respectively.
Figure 4.
The cross sections of SC rod A (a1-a3) and B (b1-b3), showing the heat-treated microstructure at the bottom, middle, and top portions, respectively.
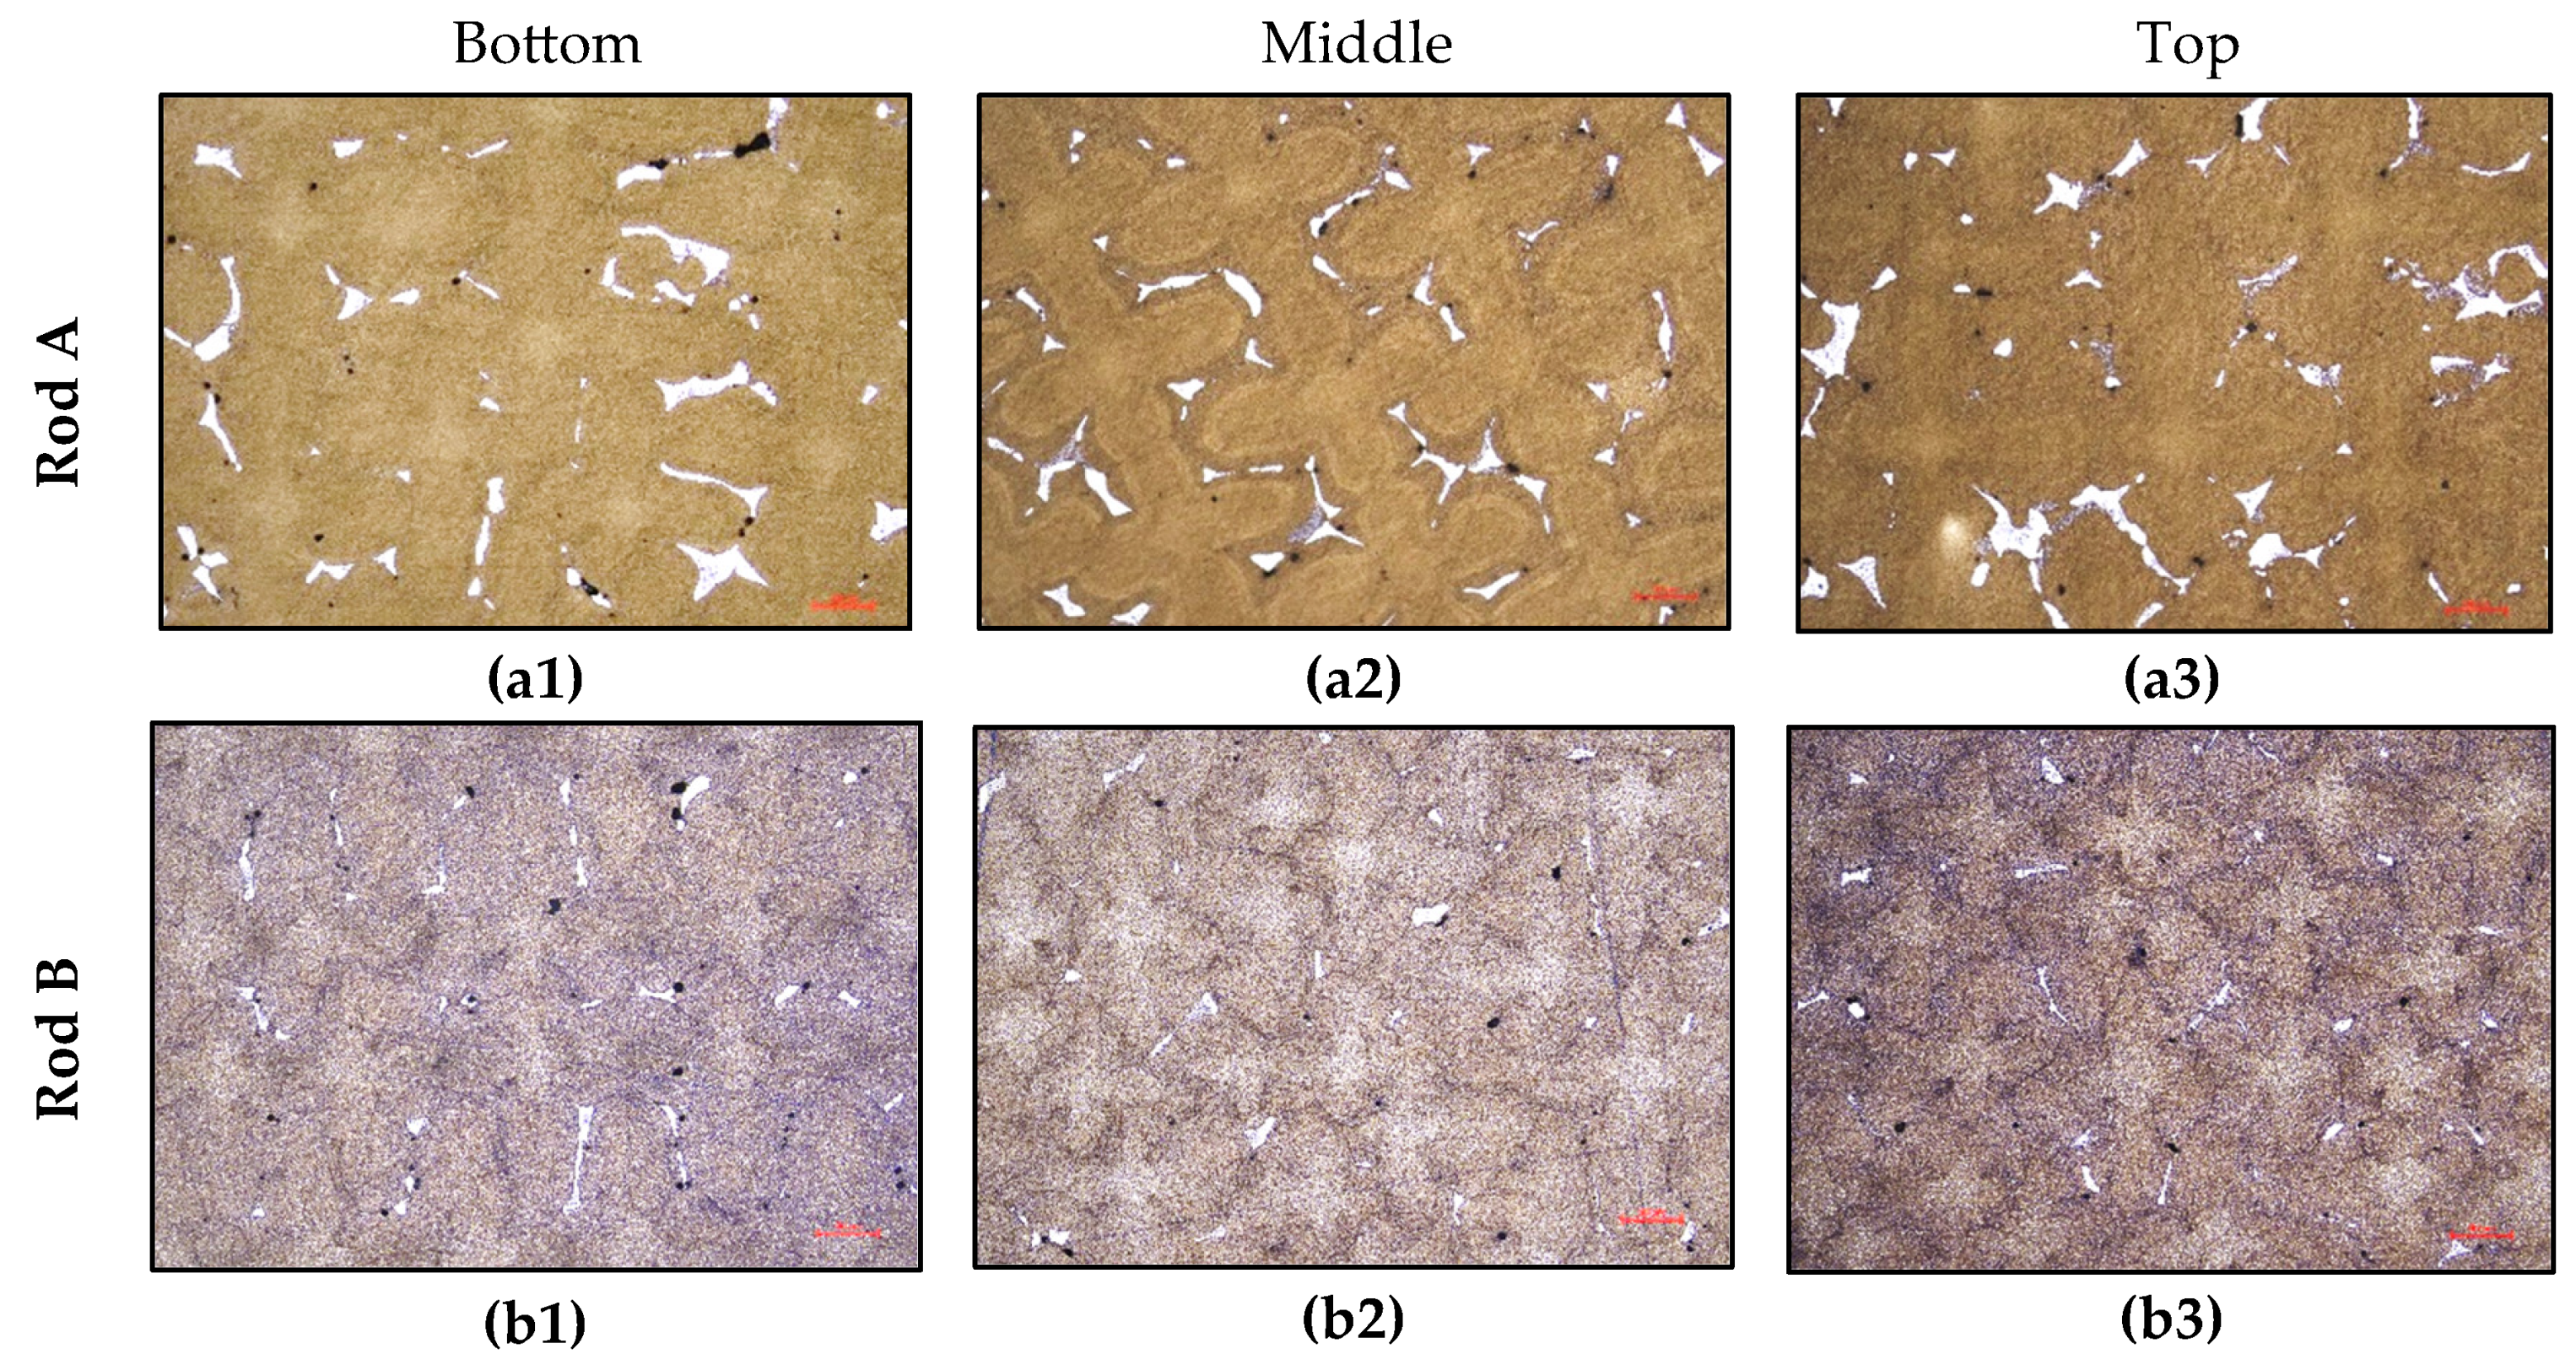
Figure 5.
The average residual eutectic fraction fH measured on each cross-section of heat-treated rods A and B.
Figure 5.
The average residual eutectic fraction fH measured on each cross-section of heat-treated rods A and B.
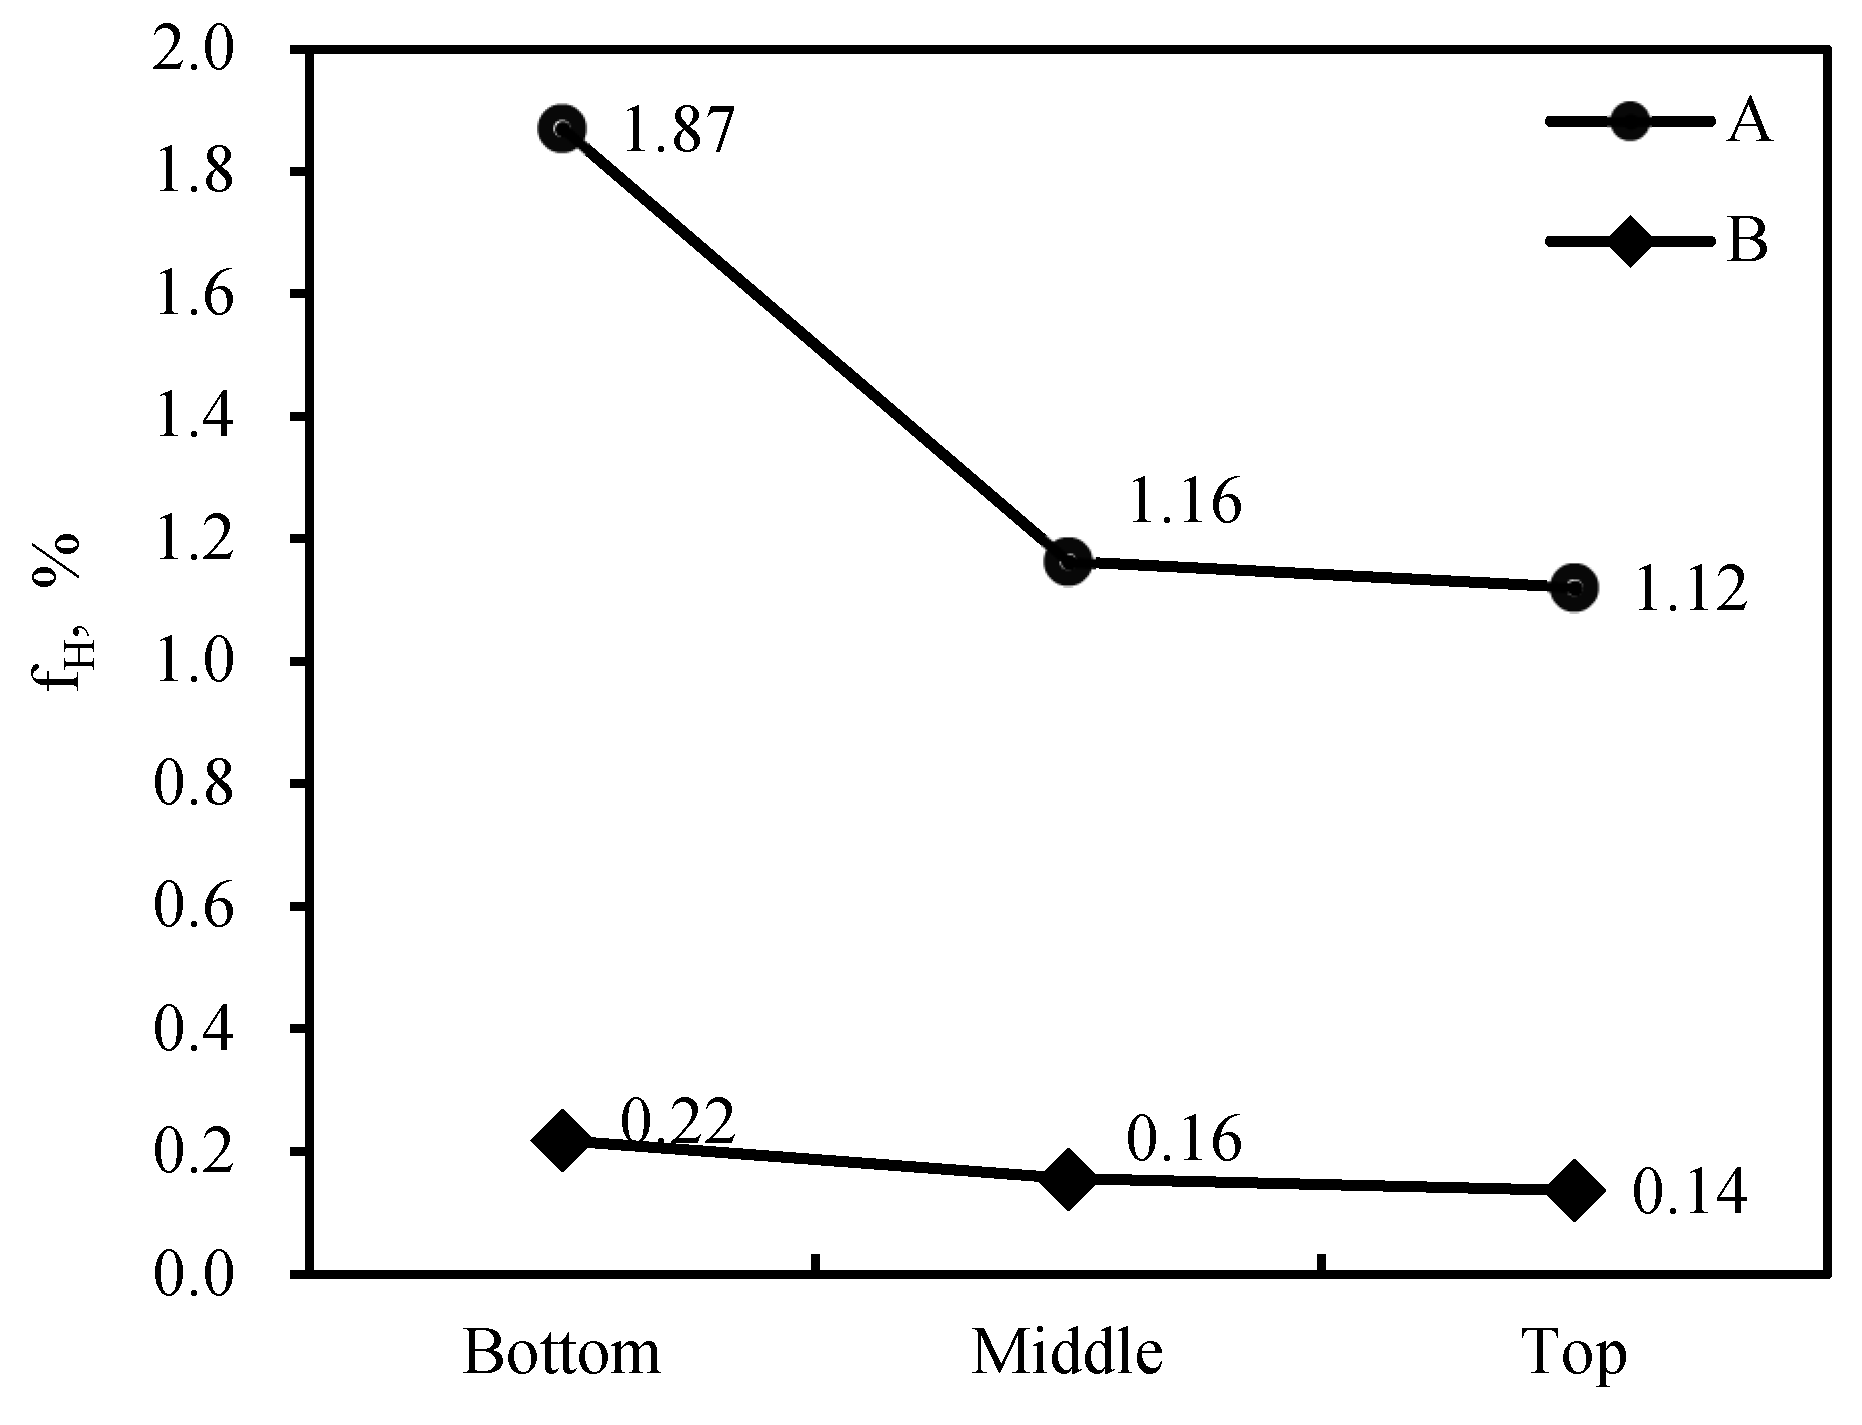
Figure 6.
The residual eutectic fraction fW in the worst view fields on the sections of the heat-treated rods A and B.
Figure 6.
The residual eutectic fraction fW in the worst view fields on the sections of the heat-treated rods A and B.
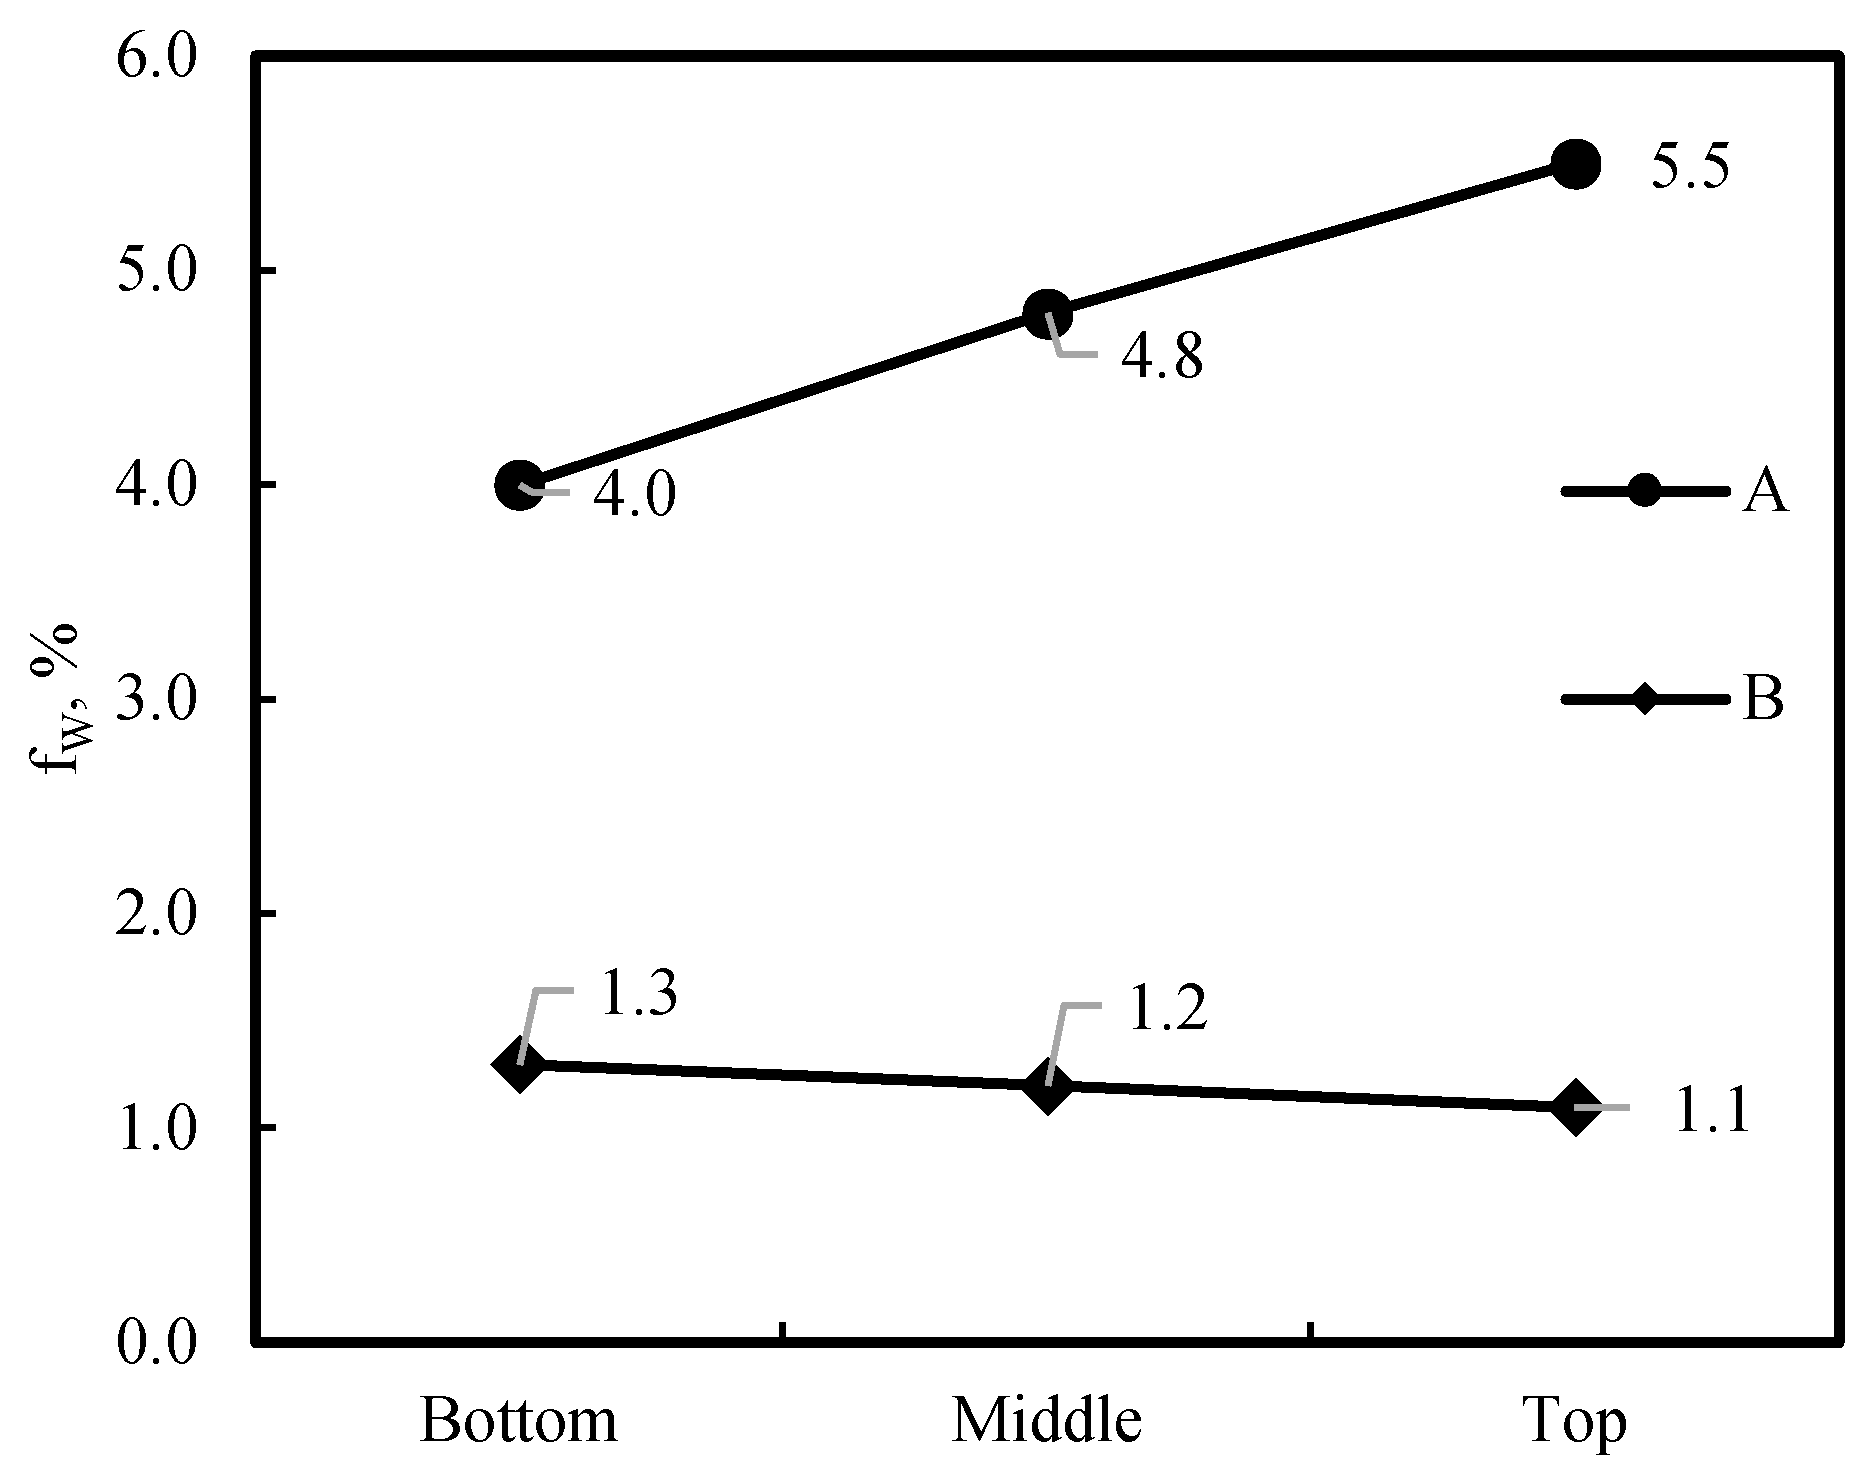
Figure 7.
Size distribution of residual eutectic in heat-treated samples A (a) and B (b).
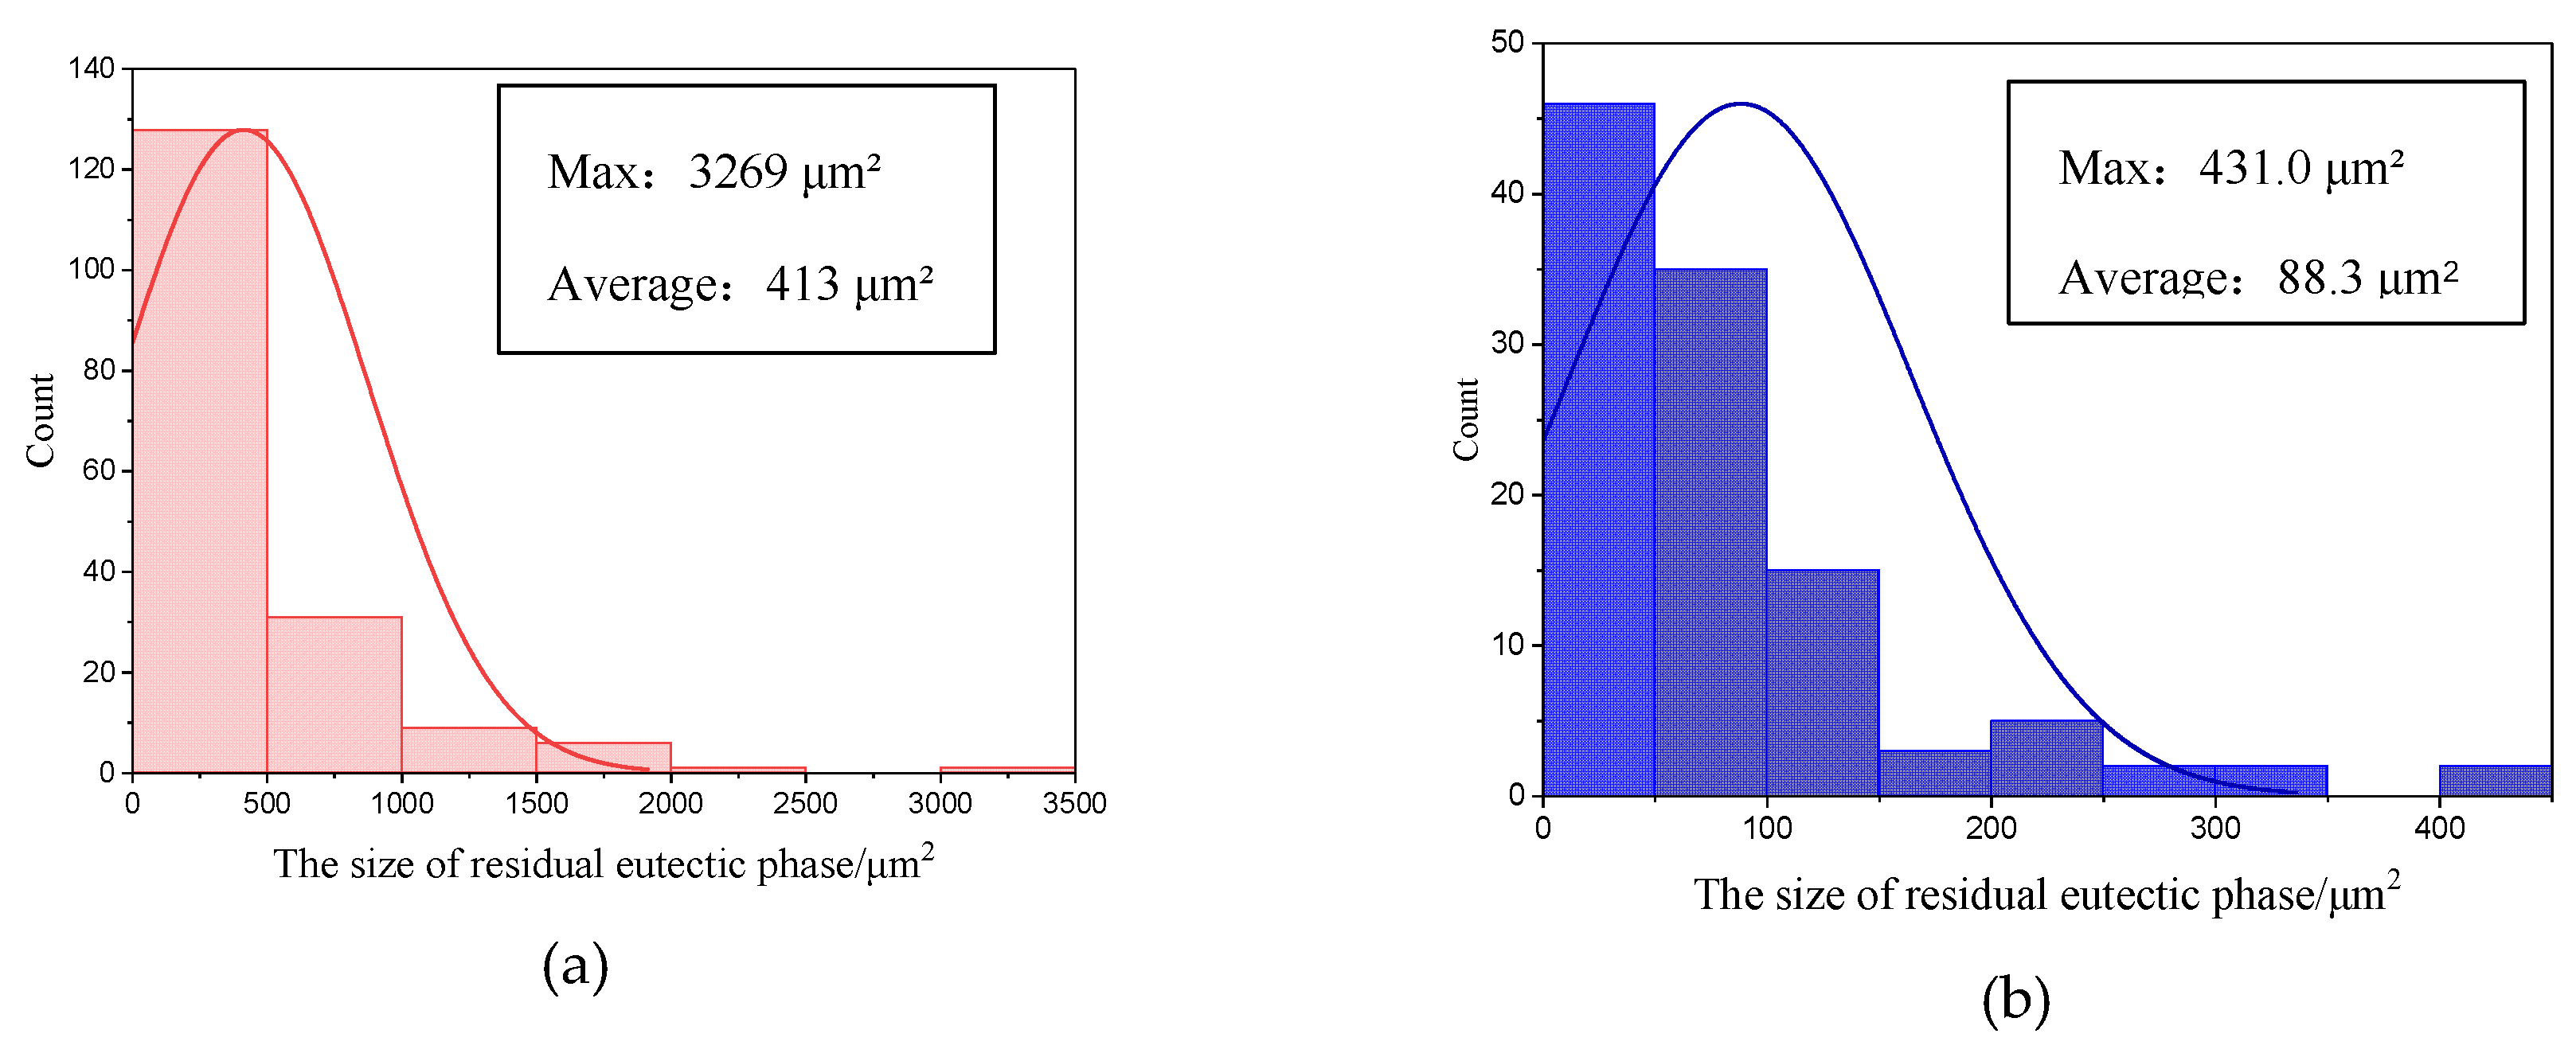
Figure 8.
The microporosity images on the bottom, middle, and top cross-sections of heat-treated samples A (a1-a3) and B (b1-b3), respectively.
Figure 8.
The microporosity images on the bottom, middle, and top cross-sections of heat-treated samples A (a1-a3) and B (b1-b3), respectively.
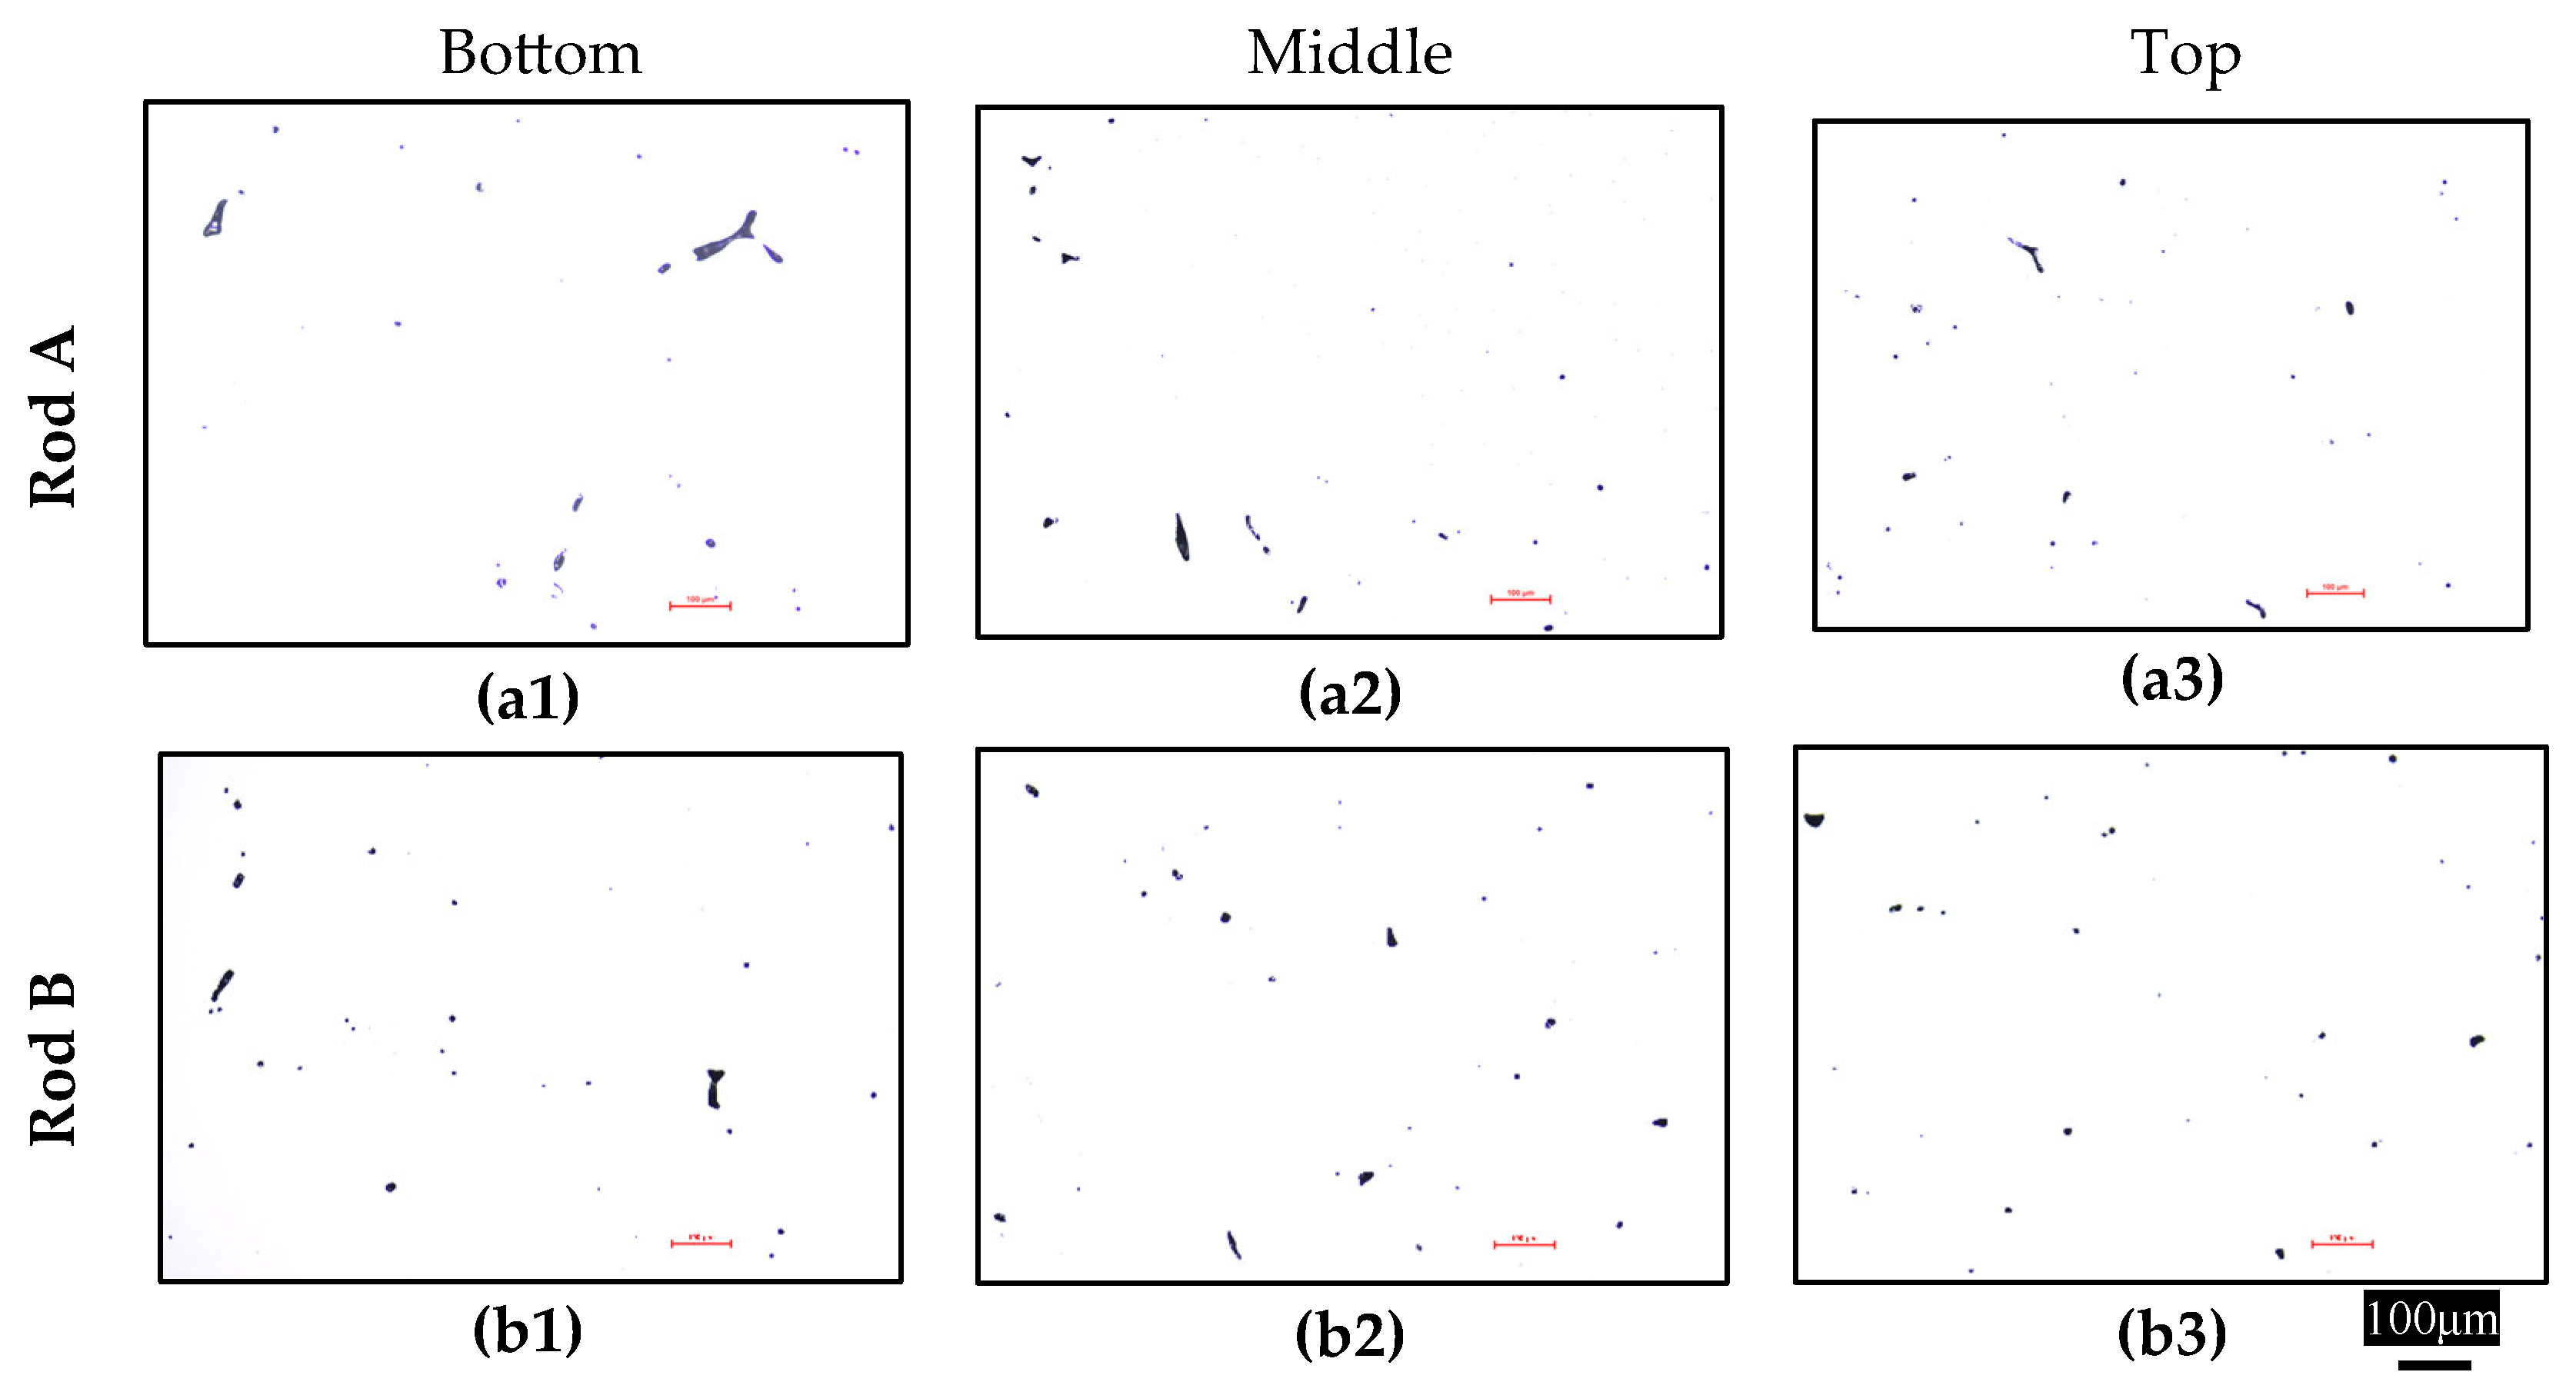
Figure 9.
The measured average microporosity ratio ρ on each cross-section of the heat-treated samples A and B.
Figure 9.
The measured average microporosity ratio ρ on each cross-section of the heat-treated samples A and B.
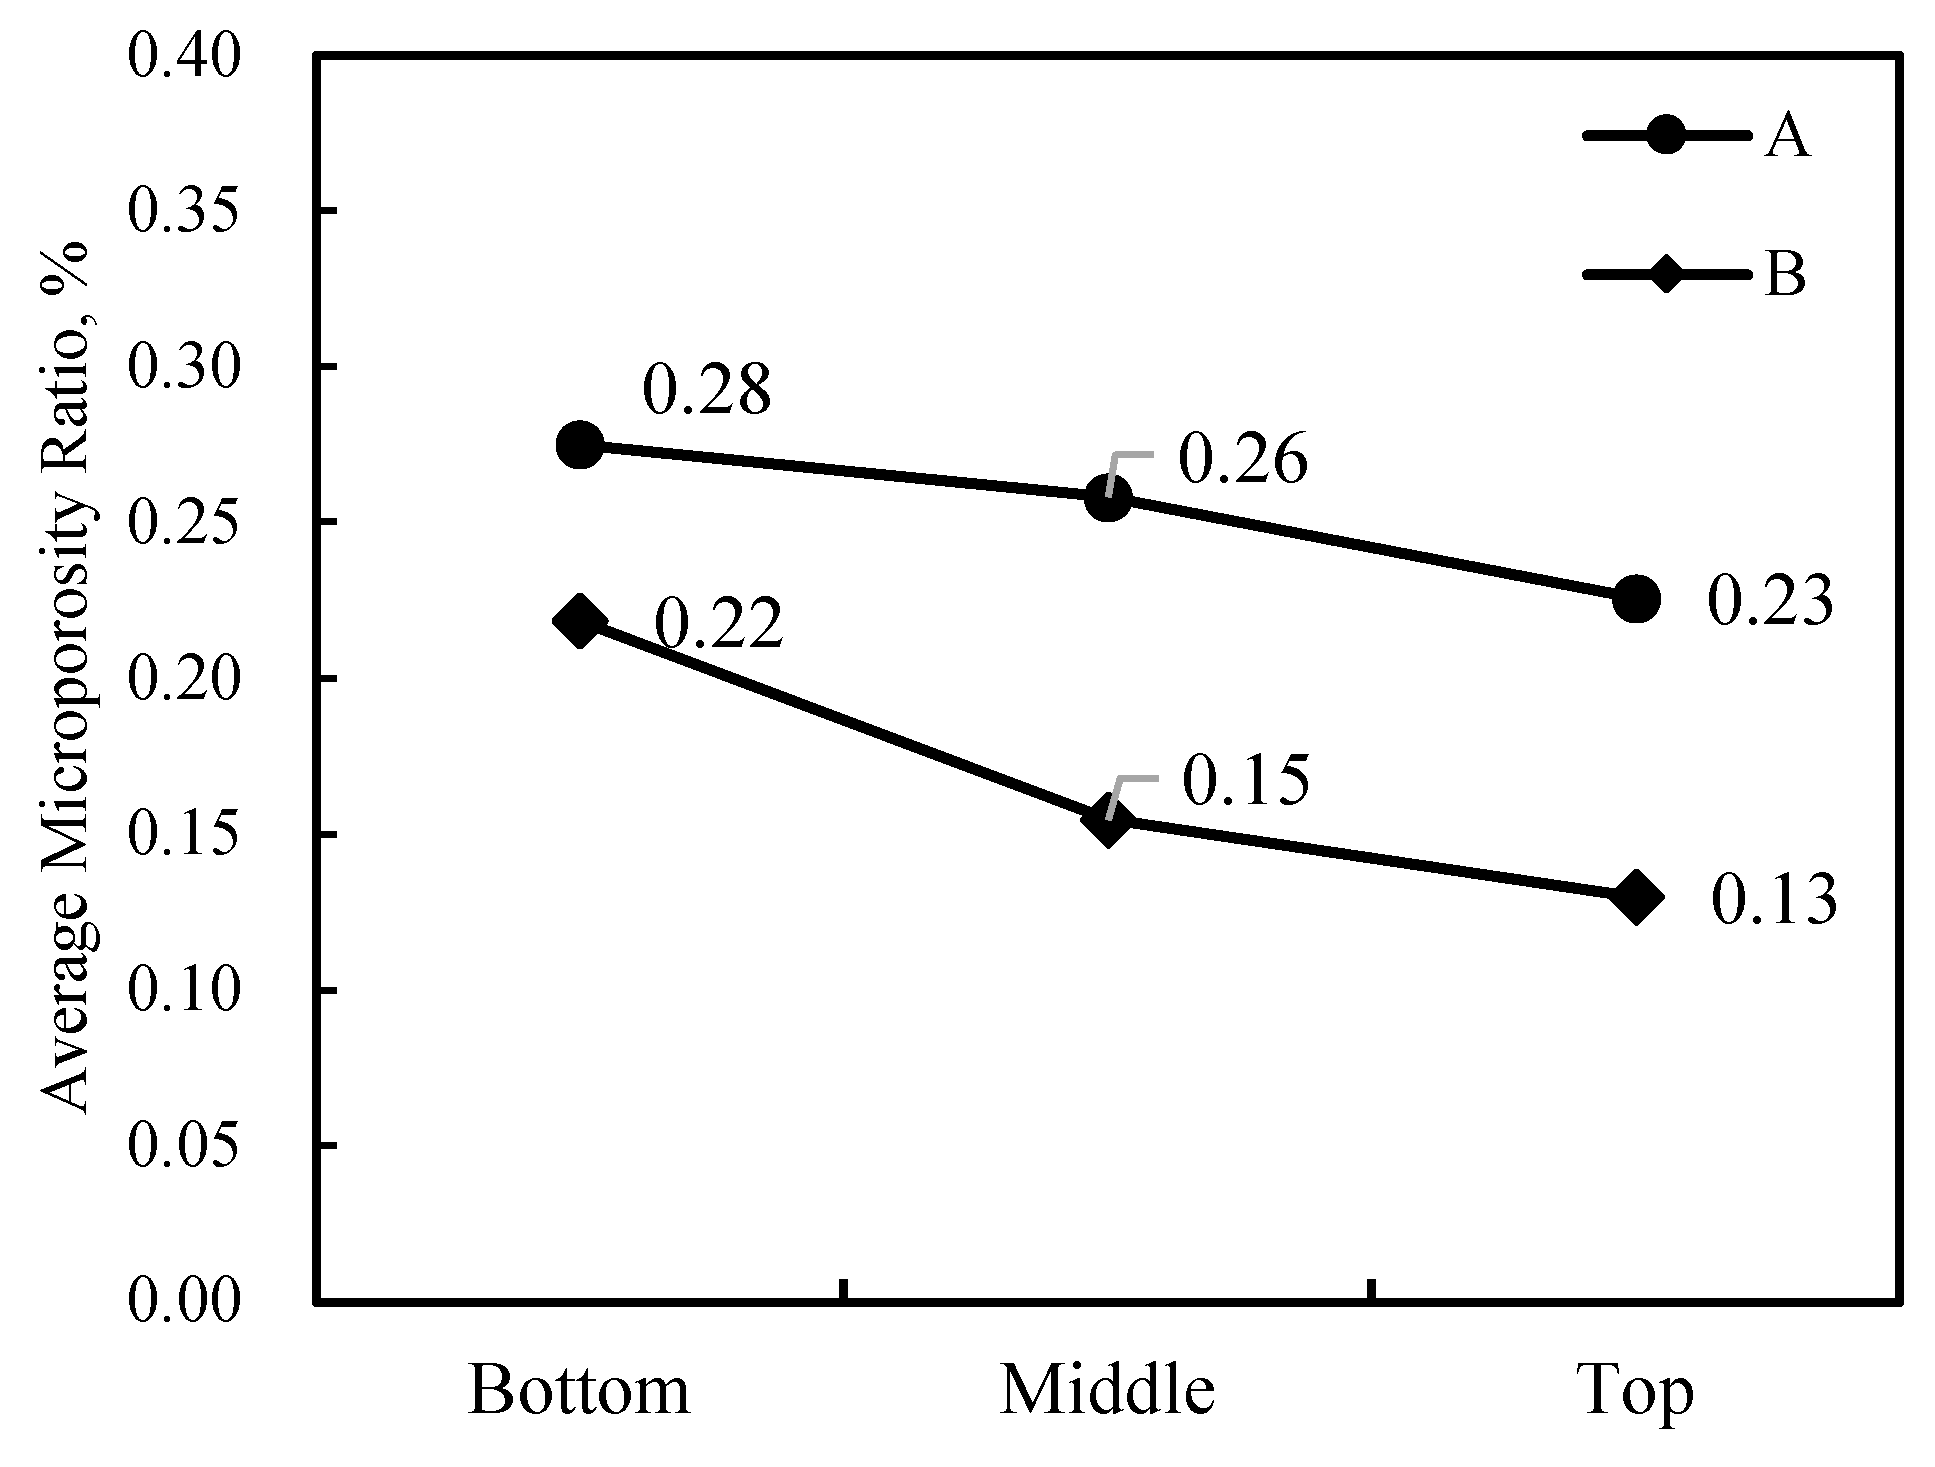
Figure 10.
The local porosity ratio in the worst view field of each cross-section of the heat-treated samples A and B.
Figure 10.
The local porosity ratio in the worst view field of each cross-section of the heat-treated samples A and B.
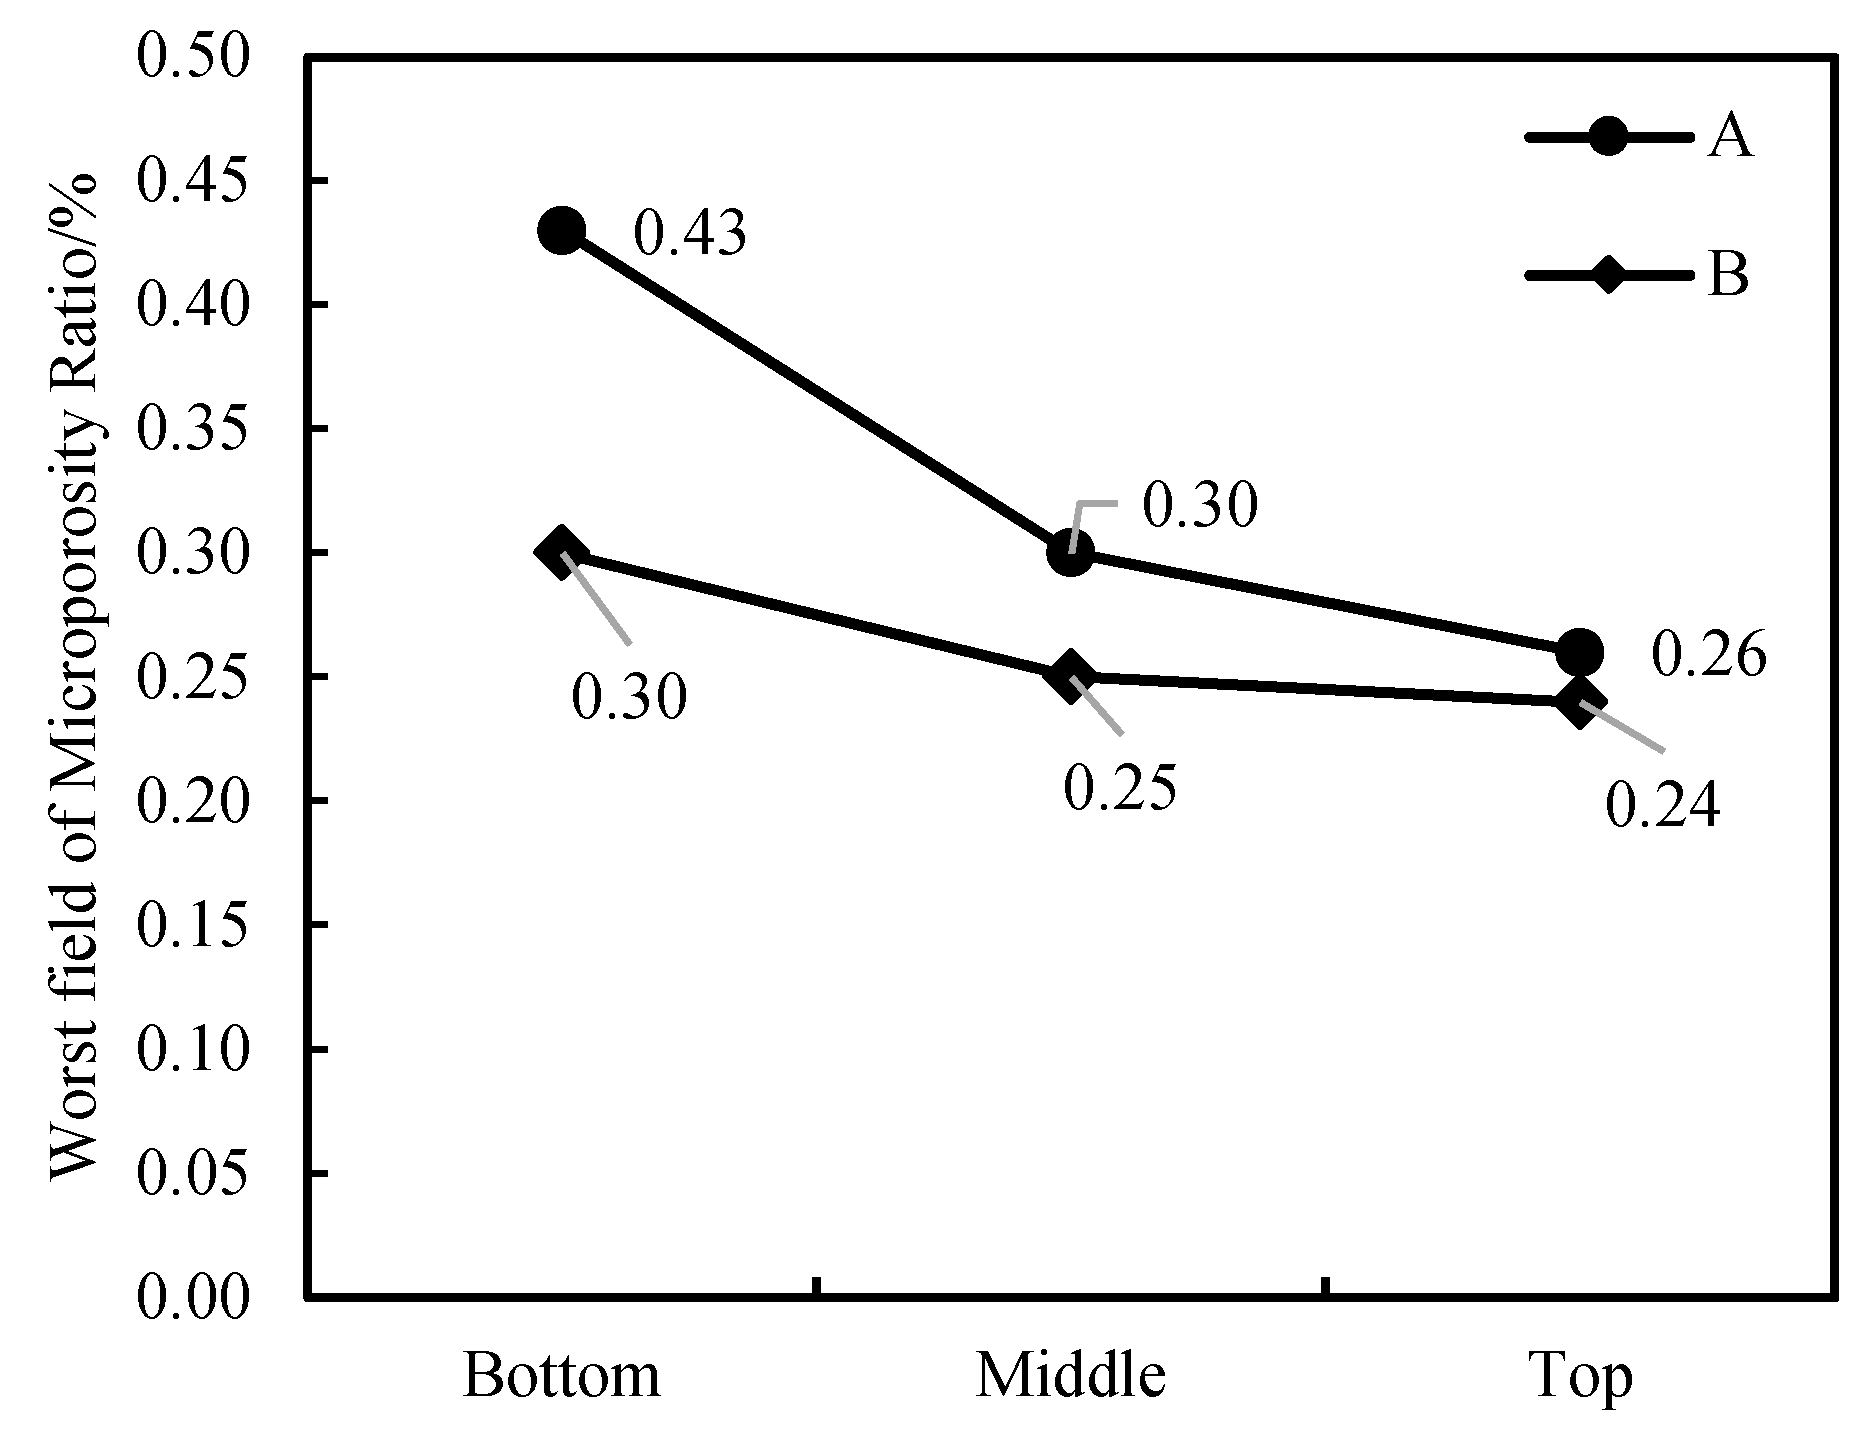
Figure 11.
The area distribution statistics of porosity holes in heat-treated samples A (a) and B (b).
Figure 11.
The area distribution statistics of porosity holes in heat-treated samples A (a) and B (b).
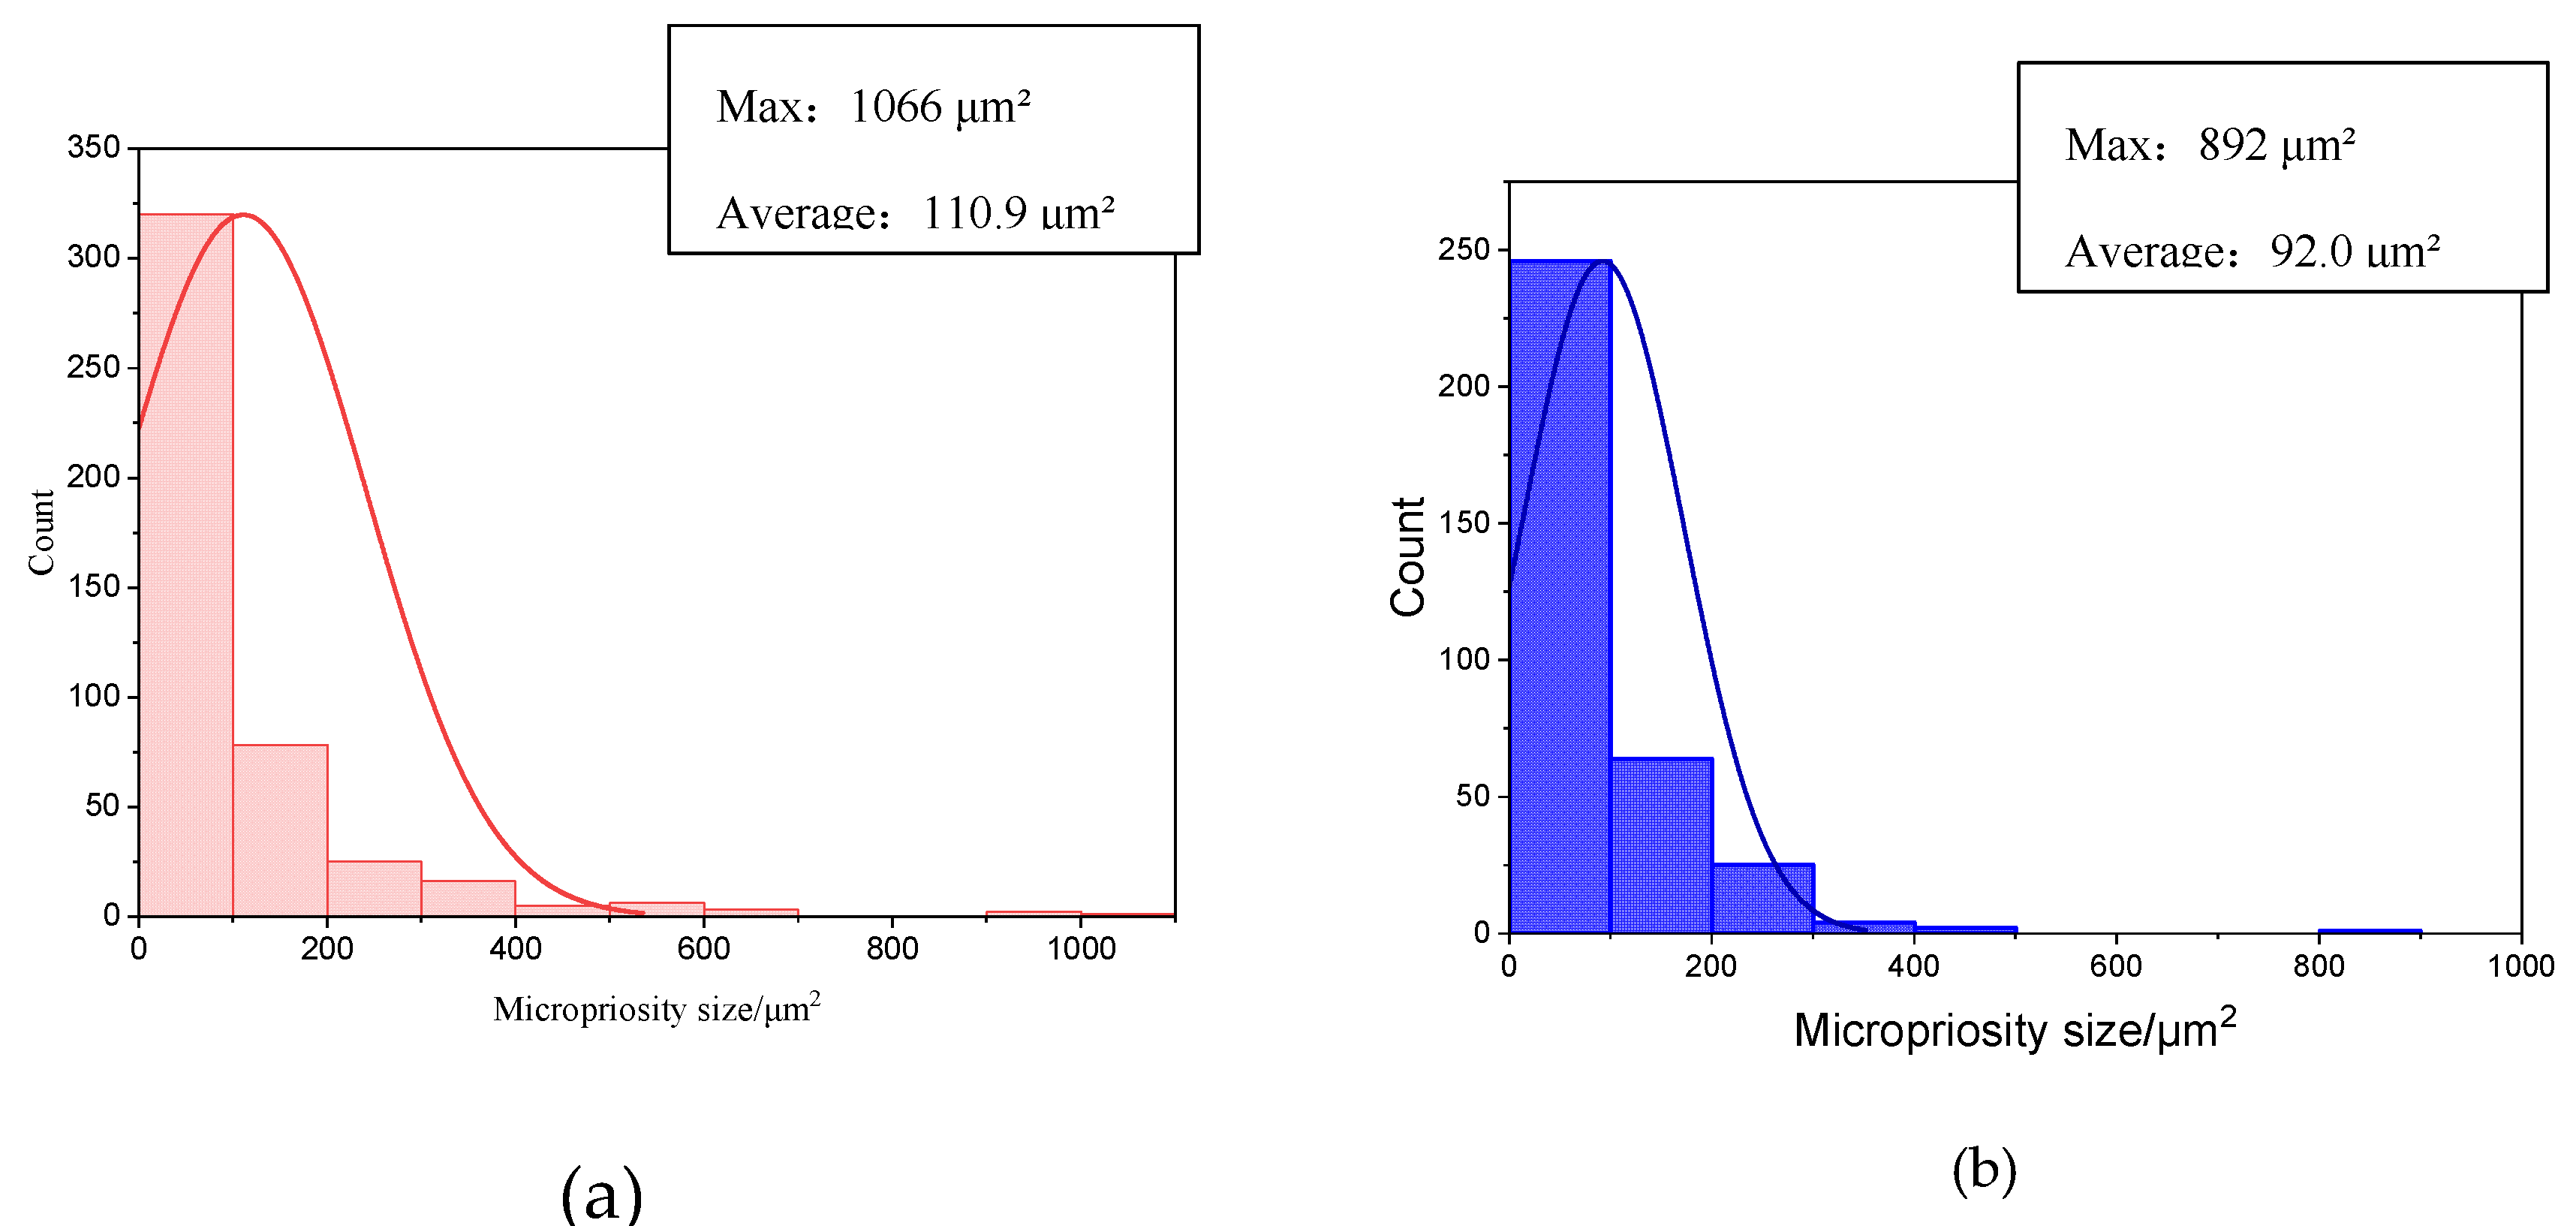
Figure 12.
The stress rupture lives of samples A and B measured under different testing conditions.
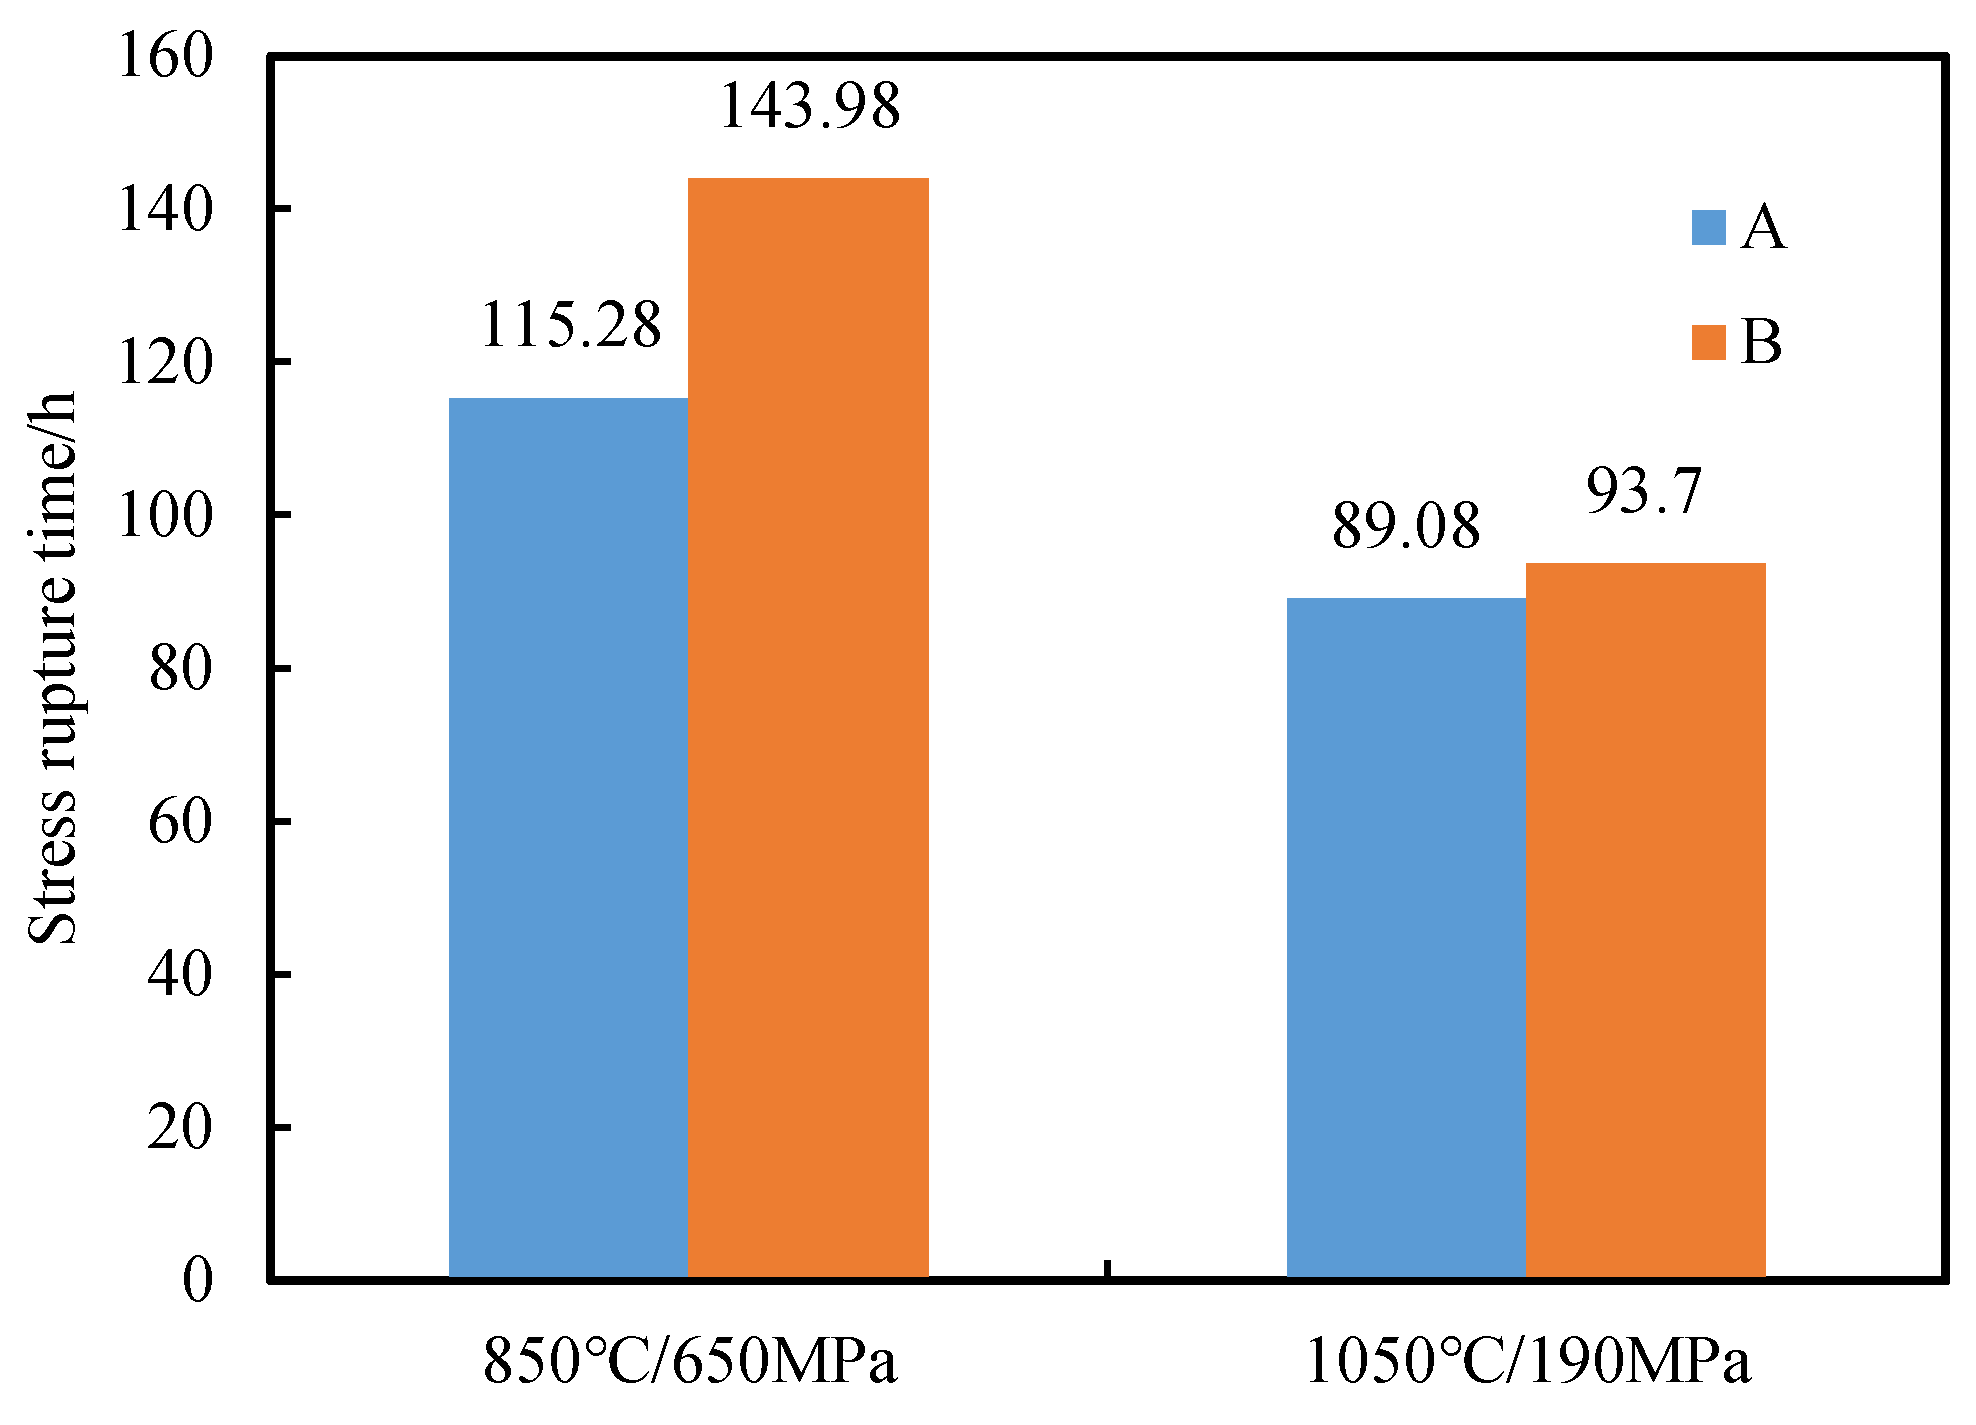

Table 1.
Chemical composition of alloy DD419 (wt.%).
| Cr | Co | Mo | W | Re | Al | Ti | Ta | Hf | Ni |
|---|---|---|---|---|---|---|---|---|---|
| 6.44 | 9.57 | 0.61 | 6.38 | 2.94 | 5.60 | 1.02 | 6.47 | 0.11 | Bal. |
Table 2.
Summary of the main measurement results for samples A and B.
| Rod A | Rod B | |||||||||
| A1 | A2 | A3 | Ave. | B1 | B2 | B3 | Ave. | |||
| Temperature gradient: G (K/mm) | 1.9 | `4.9 | ||||||||
| Dendrite spacing: λ (μm) | 348 | 374 | 452 | 391 | 287 | 269 | 243 | 266 | ||
| As-cast eutectic fraction: fE (%) | 9.50 | 9.80 | 10.61 | 9.97 | 9.10 | 7.67 | 7.43 | 8.20 | ||
| After heat treatment | Residual eutectic fraction | Average: fH (%) | 1.87 | 1.16 | 1.12 | 1.39 | 0.22 | 0.16 | 0.14 | 0.17 |
| Worst: fW (%) | 4.0 | 4.8 | 5.5 | 4.8 | 1.3 | 1.2 | 1.1 | 1.2 | ||
| Microporosity ratio ρ(%) |
Average | 0.28 | 0.26 | 0.23 | 0.27 | 0.22 | 0.15 | 0.13 | 0.17 | |
| Worst | 0.43 | 0.30 | 0.26 | 0.33 | 0.30 | 0.25 | 0.24 | 0.26 | ||
| Stress rupture properties (h) | 850℃/650MPa | 115.28 | 143.98 | |||||||
| 1050℃/190MPa | 89.08 | 93.7 | ||||||||
Disclaimer/Publisher’s Note: The statements, opinions and data contained in all publications are solely those of the individual author(s) and contributor(s) and not of MDPI and/or the editor(s). MDPI and/or the editor(s) disclaim responsibility for any injury to people or property resulting from any ideas, methods, instructions or products referred to in the content. |
© 2025 by the authors. Licensee MDPI, Basel, Switzerland. This article is an open access article distributed under the terms and conditions of the Creative Commons Attribution (CC BY) license (http://creativecommons.org/licenses/by/4.0/).
Copyright: This open access article is published under a Creative Commons CC BY 4.0 license, which permit the free download, distribution, and reuse, provided that the author and preprint are cited in any reuse.


