1. Introduction
The Differential Entangled Topology (DET) model aims to simulate the dynamic nature of consciousness by representing it as an evolving set of entangled points on a sphere. At its core, the model is built on the fundamental premise that consciousness is not a static phenomenon but rather a fluid, highly connected system that undergoes continuous topological transformations. These transformations are mathematically represented as entanglement shifts-small, differential changes in the spatial configuration of points-that collectively mimic the dynamic process of conscious experience.
In this framework, the system is visualized as a set of points distributed over the surface of a unit sphere S^2 embedded in three-dimensional space. Each point on the sphere corresponds to a distinct “neural region” or “conscious element,” echoing the view from modern neuroscience that consciousness emerges from the collective dynamics of spatially distributed neural networks (Sporns, 2011; Bassett & Sporns, 2017). Initially, these points are positioned in a quasi-random configuration, symbolizing the spontaneous activity within neural substrates. As the model evolves, each point undergoes slight, random shifts in its angular coordinates, which represents the process of differential entanglement-the reorganization and continuous adjustment of neural connections that is characteristic of a living brain.
Mathematically, this evolution is captured through iterative updates of the spherical coordinates θ (colatitude) and ϕ (longitude) of each point. At each iteration t, the coordinates are adjusted by small random deviations Δθ_i and Δϕ_i, drawn from a controlled distribution.
This mechanism encapsulates the idea of neural plasticity—small but significant changes in connectivity that can lead to major shifts in the overall network topology over time (Hebb, 1949; Guckenheimer & Holmes, 1983).
The DET model draws inspiration from various branches of mathematics and neuroscience. It borrows from network theory, where the brain is often modeled as a small-world network that efficiently balances local clustering with global integration (Watts & Strogatz, 1998). The model also incorporates principles from dynamical systems and chaos theory, suggesting that even minute changes in the configuration of points can lead to substantial alterations in the emergent behavior of the system-a perspective reminiscent of the sensitivity to initial conditions observed in chaotic systems (Strogatz, 1994).
Moreover, the model introduces the concept of topological entropy as a means to quantify the complexity and unpredictability of the evolving system. Entropy, in this context, serves as a measure of the degree of disorder within the spatial configuration of points. As the system evolves, the increasing entanglement of points leads to a higher entropy value, which can be interpreted as a proxy for the growing complexity of conscious states. This idea parallels approaches in Integrated Information Theory (IIT), where the integration of information is linked to the level of consciousness (Tononi, 2008).
The visualization of the DET model further enhances our understanding of its dynamics. By projecting the evolving points onto a sphere with a soft rosaceous background (representing the fundus), the model not only offers an intuitive visual representation but also symbolically underscores the idea that consciousness is deeply rooted in the underlying structure of the brain. The bright points-each undergoing its differential entanglement-form patterns that shift and transform over time, providing a vivid illustration of the continuous, ever-changing nature of neural dynamics.
In summary, the Differential Entangled Topology model provides a robust mathematical and conceptual framework for exploring the dynamic, emergent properties of consciousness. By integrating concepts from topology, dynamical systems, and network theory, the DET model captures the essence of neural plasticity and the constant reorganization of neural connections. This model opens new avenues for understanding how the complex interplay of countless neural elements gives rise to the rich tapestry of conscious experience, offering a bridge between abstract mathematical theory and the tangible
2. Methodology
2.1. Mathematical Representation of the Sphere
Let
denote the unit sphere. We represent regions of consciousness by a set of
points on
:
Each point
is initially specified in spherical coordinates by
where
is the colatitude and
is the longitude.
The conversion from spherical to Cartesian coordinates is given by:
Thus, the Cartesian representation of each point is:
2.2. Entanglement via Differential Shifts
Entanglement in the Differential Entangled Topology (DET) model is introduced through small, stochastic shifts in the spherical coordinates. At each discrete time step
, the update rules are defined as:
where the perturbations
and
are independent random variables drawn uniformly from the interval
:
The parameter thus controls the magnitude of the perturbations, simulating the fluctuating nature of entanglement between different regions of consciousness.
2.3. Topological Evolution and Phase Transitions
The evolution of the point distribution on
is characterized by a continuous deformation of the configuration. To quantify the increasing complexity of the system, we introduce the concept of topological entropy,
. One formulation for
is based on tracking the separation of initially close points using Lyapunov exponents. Specifically, we define:
where:
is the number of point pairs that remain within an
-neighborhood of one another at time
is the number of such pairs at the initial time.
An increase in indicates a rise in the system’s complexity, culminating in a maximum when the system reaches maximal entanglement.
2.4. Visualization and Graphical Representation
For visualization, the evolving configuration of points on
is rendered in three dimensions. Each point
is displayed as a bright dot, while the sphere itself is depicted with a soft rosaceous hue that serves as the visual “fundus” or background of the system. Formally, we define a rendering function:
which maps the Cartesian coordinates
to their corresponding visual representation. The brightness and positioning of the points are updated at each iteration to reflect the dynamic nature of entanglement.
2.5. Iterative Process and Convergence
The system evolves through an iterative process. At each time step
, the points are updated according to the rules in Section 2.2. To determine when the system has reached a stable state, we monitor the aggregate change in point positions. Let
be the vector of positional changes in Cartesian coordinates. The system is said to have converged when:
where
denotes the Euclidean norm and
is a pre-defined small threshold. This criterion ensures that further iterations result in negligible changes to the system’s configuration.
2.6. Summary of the Methodology
In summary, the DET model for simulating consciousness is established as follows:
Initialization: points are uniformly distributed on the unit sphere using spherical coordinates
Entanglement Mechanism: Differential shifts and , sampled from a uniform distribution, are applied to the coordinates to model stochastic entanglement.
Topological Evolution: The complexity and phase transitions of the system are quantified using the topological entropy , which reflects the divergence of initially close points.
Visualization: The system is dynamically visualized with a 3D plot, where the sphere’s soft rosaceous background enhances the representation of evolving bright points.
-
Convergence: The iterative process continues until the aggregate positional change satisfies , indicating convergence to a stable, maximally entangled state.
This framework provides a robust mathematical basis for modeling the dynamic, entangled properties of consciousness through the evolution of point configurations on a sphere.
3. Results
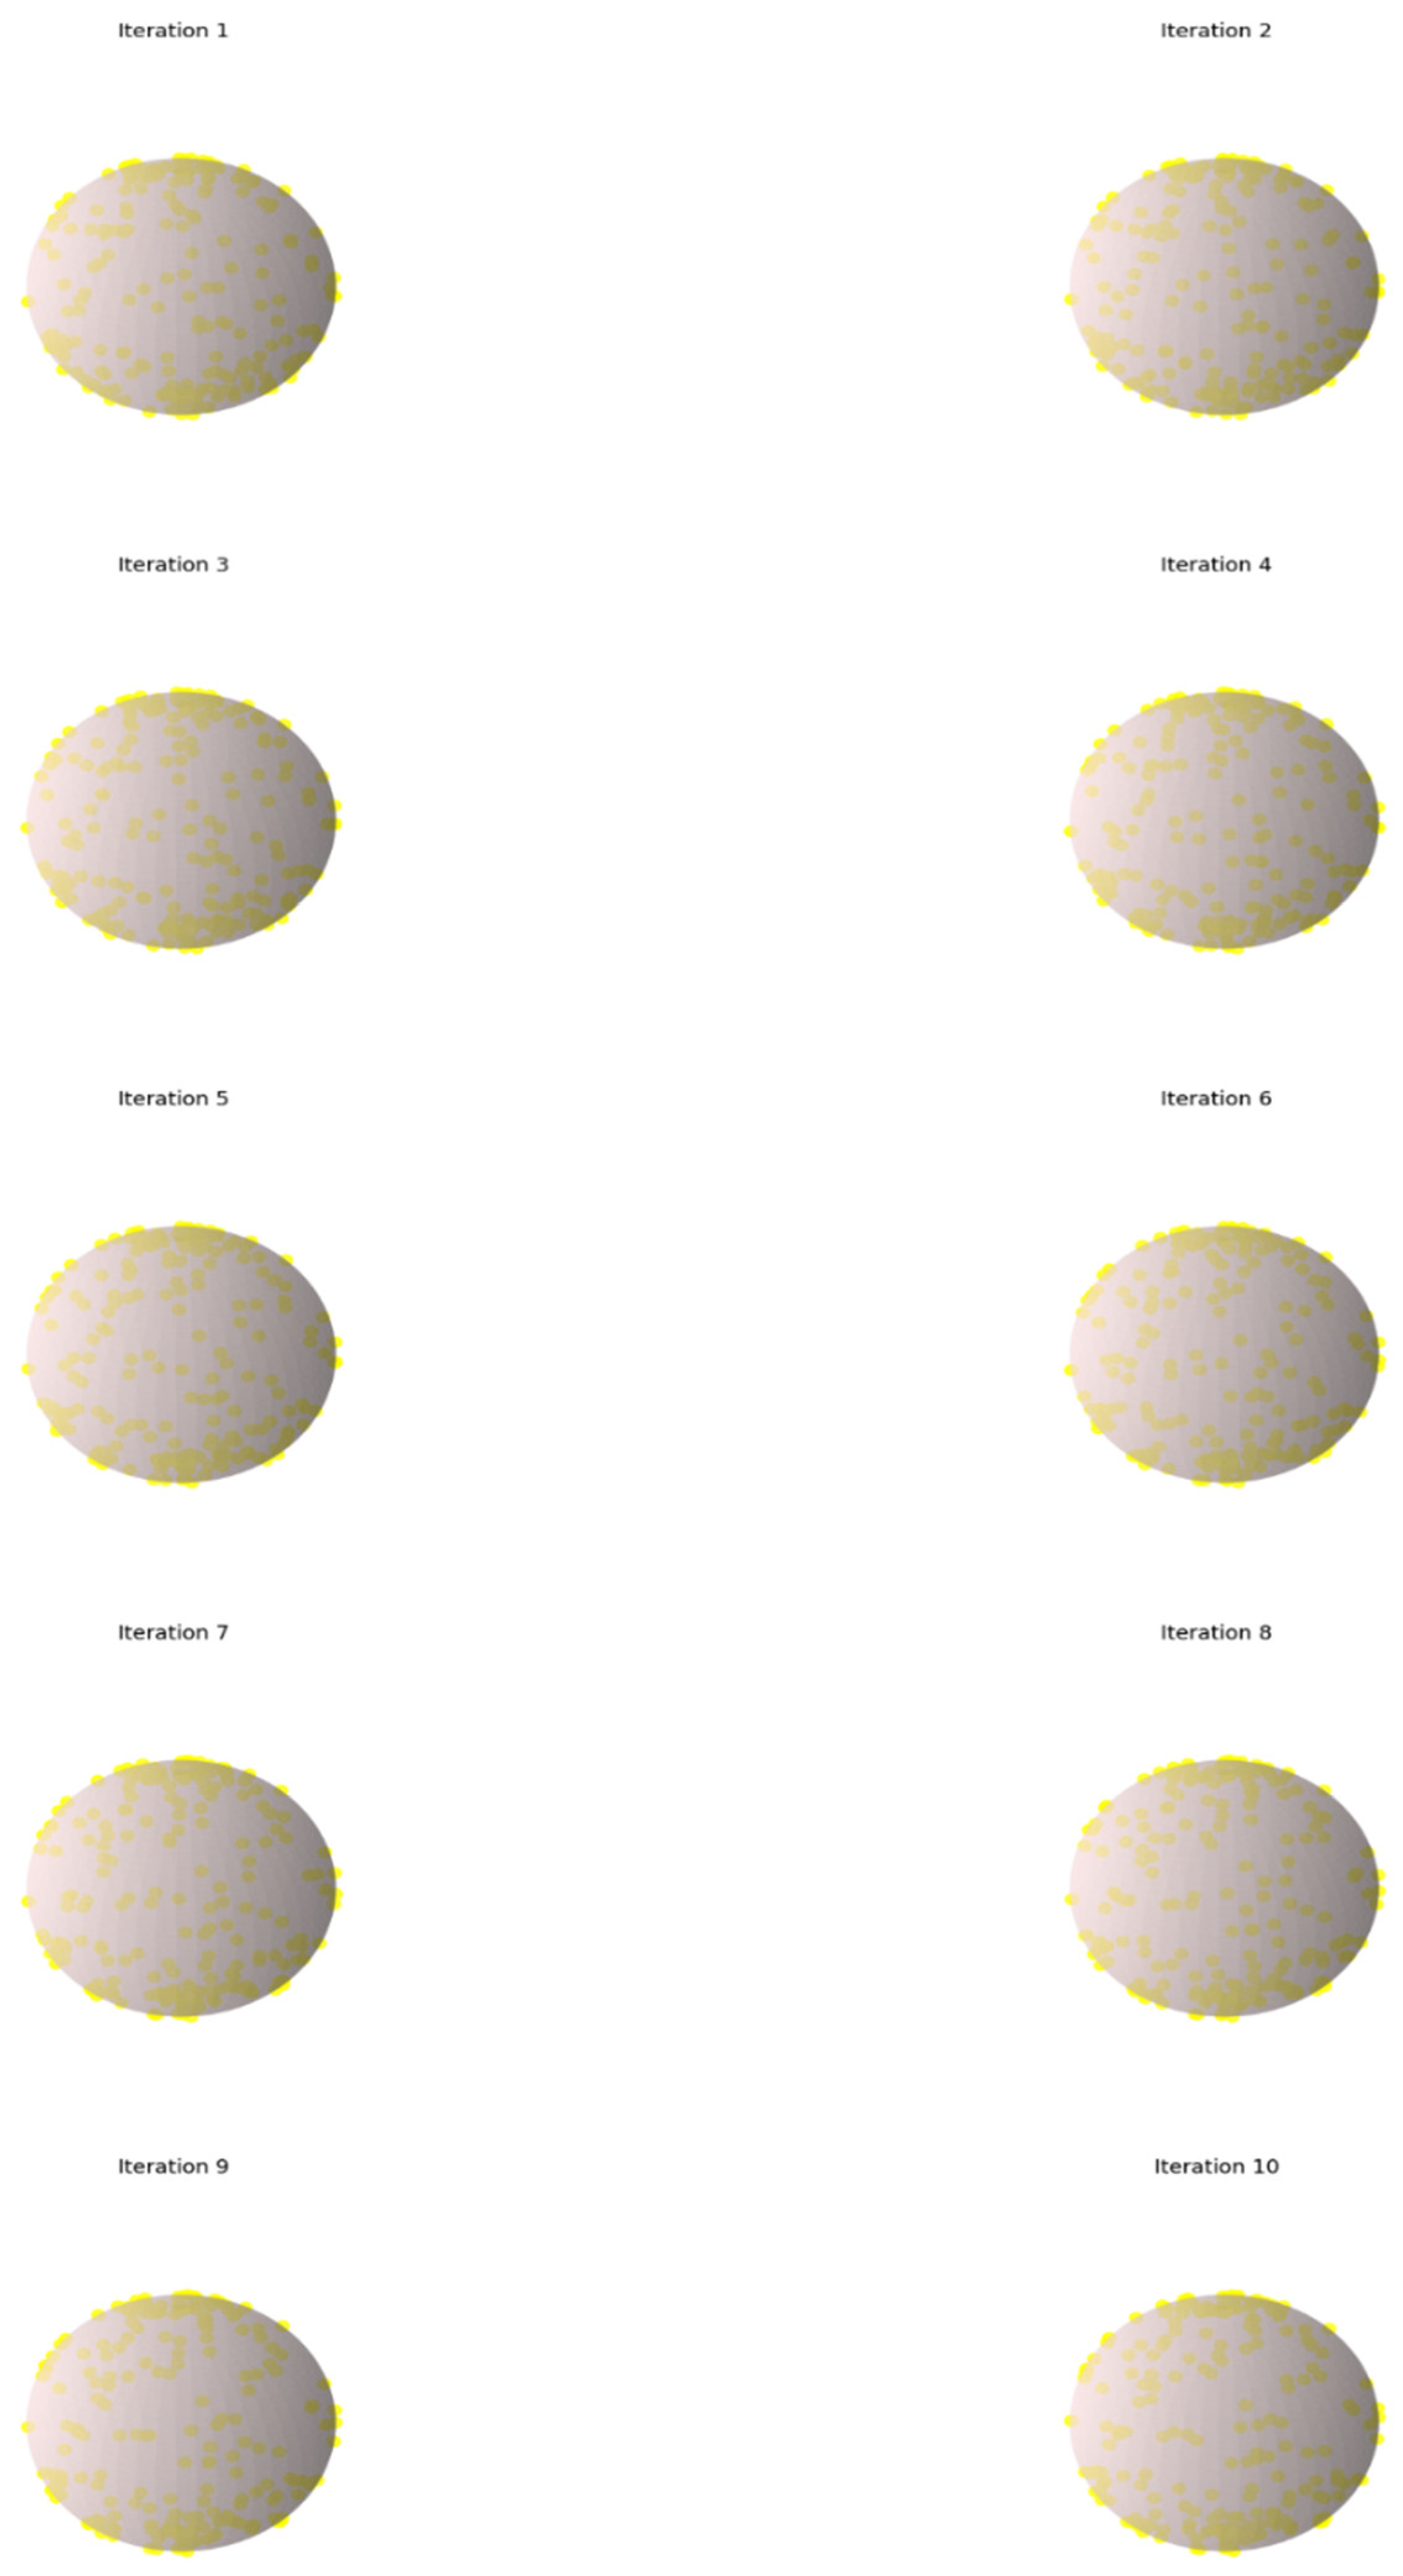
The simulation produces a 5x2 grid of subplots, where each subplot represents one iteration of the sphere’s evolution. Here’s an explanation of what you see:
-
Initial Configuration:
The first subplot shows the sphere with 200 randomly distributed bright yellow points on its surface. This represents the initial state of the system, with the sphere’s surface rendered in a soft, rosaceous hue (pinkish background).
-
Iterative Evolution:
In each subsequent subplot (from Iteration 2 to Iteration 10), the positions of these points are slightly shifted. These shifts are random but controlled by a specified “shift factor.” This simulates the concept of differential entanglement, where the connectivity or configuration of the points (analogous to neural regions) evolves over time.
-
Visualizing Change:
As you move from the first subplot to the tenth:
- ○
You can observe that the configuration of points changes gradually.
- ○
The shifting positions illustrate how the structure of the network is continuously reorganizing.
- ○
Even though the changes might be subtle in each iteration, they cumulatively represent a dynamic process that could correspond to evolving states of consciousness or complex system behavior.
-
Rosaceous Fundus and Bright Points:
The sphere’s soft rosaceous surface remains constant in each subplot, serving as a backdrop (or “fundus”) that highlights the bright yellow points. This contrast makes it easier to see the subtle positional changes of the points over the iterations.
-
Interpreting the Model:
- ○
Dynamic Nature: The gradual shifts in point positions across iterations exemplify how the DET model treats consciousness as a non-static, continuously evolving system.
- ○
Entropy and Complexity: While the simulation visually demonstrates changes in configuration, it also hints at an increasing complexity or entropy as the system evolves.
- ○
Network Reorganization: Each subplot provides a snapshot of the ongoing reconfiguration, analogous to neural plasticity in the brain, where connections are constantly adjusted.
Overall, the 5x2 grid allows you to visually track the progression of the system, illustrating the core idea of the DET model: consciousness (or a similar complex system) can be represented by an ever-changing network of interconnected elements.
Graph 1.
Iterative spheres representing the brain with Differential Entangled Topology Process reaching through iteration a quasi stable state of consciousness.
Graph 1.
Iterative spheres representing the brain with Differential Entangled Topology Process reaching through iteration a quasi stable state of consciousness.
4. Discussion
The Differential Entangled Topology (DET) model, introduced in this article, offers a novel and mathematically grounded approach to understanding the evolving and dynamic nature of consciousness. Unlike previous theories that treat consciousness as a relatively static phenomenon, the DET model provides a framework for simulating consciousness as a continuously evolving system, driven by the differential entanglement of neural regions. This dynamic perspective allows for a more comprehensive understanding of the complexity of conscious experience, addressing a gap in the existing literature and offering new insights into the structure and organization of the brain.
4.1. The Evolving Nature of Consciousness
One of the primary contributions of the DET model is its emphasis on the dynamic nature of consciousness. Traditional models, such as Global Workspace Theory (GWT) and Integrated Information Theory (IIT), have provided valuable insights into the neural mechanisms underlying consciousness, but they often treat consciousness as a relatively stable, static phenomenon (Baars, 1988; Tononi, 2008). GWT proposes that consciousness arises from the integration of information across different brain regions, with a “global workspace” facilitating communication between these regions (Baars, 1988). While this theory offers a compelling account of the neural correlates of consciousness, it does not fully address the fluid, ever-changing nature of conscious experience. On the other hand, IIT focuses on the integration of information within a system, proposing that consciousness arises from the degree of connectivity between neural elements (Tononi, 2008). However, IIT primarily emphasizes the present state of consciousness, without accounting for the continuous evolution of neural connections or the fluctuating nature of consciousness over time. Both of these theories have been instrumental in advancing our understanding of consciousness, but they share a common limitation in their treatment of consciousness as a relatively fixed, well-defined state.
The DET model addresses this limitation by modeling consciousness as an evolving network, where the positions of neural elements are continuously altered through differential shifts.These shifts, which simulate the reorganization of neural connections, reflect the fluidity and complexity of conscious experience. Consciousness, in this view, is not a static entity but a dynamic, ever-changing process that emerges from the ongoing interactions between different neural regions. The DET model thus provides a more nuanced and comprehensive perspective on consciousness, one that acknowledges its dynamic, emergent nature.
4.2. Network Theory and the Brain
A key component of the DET model is its reliance on network theory to describe the structure and behavior of the brain. The human brain is a highly interconnected network of neurons, with each neuron forming synaptic connections with many other neurons. These connections form the basis for the brain’s ability to process information, integrate sensory inputs, and produce behavior. Recent advancements in network theory have provided valuable insights into the organization of the brain, highlighting the importance of network dynamics in cognition and consciousness.
One of the central insights of network theory is the concept of small-world networks. Small-world networks are characterized by a high degree of local clustering and relatively short path lengths between nodes, making them highly efficient for information transmission (Watts & Strogatz, 1998). The brain has been shown to exhibit small-world properties, with brain regions that are not directly connected often sharing a small number of intermediate connections (Sporns, 2011). This network structure allows for efficient communication between distant brain regions, which is thought to be essential for conscious experience.
The DET model builds on this network theory by modeling consciousness as a dynamic small-world network, where the connections between neural regions are constantly shifting and reconfiguring. The random shifts in the positions of points on the sphere in the DET model can be thought of as reflecting changes in the connectivity between brain regions. These shifts simulate the plasticity of the brain, where synaptic connections are continuously strengthened or weakened in response to experience, learning, and environmental changes (Hebb, 1949).
4.3. Topological Entropy and Complexity
The concept of topological entropy plays a crucial role in the DET model, providing a mathematical measure of the complexity and unpredictability of the system. Entropy is a widely used concept in both thermodynamics and information theory, where it is used to quantify the disorder or uncertainty in a system (Shannon, 1948). In the context of the DET model, topological entropy measures the degree of unpredictability in the distribution of neural elements on the surface of the sphere. As the system evolves, the entropy increases, reflecting the growing complexity and entanglement of the network. This approach is inspired by concepts from dynamical systems theory, which studies the behavior of systems that evolve over time according to deterministic or stochastic rules. In particular, the Lyapunov exponent is a measure of how sensitive a system is to initial conditions, and it is often used to quantify the chaotic behavior of nonlinear systems (Guckenheimer & Holmes, 1983). In the DET model, the Lyapunov exponent can be used to quantify the rate at which the positions of the points diverge, reflecting the system’s increasing complexity as the network becomes more entangled.
The use of entropy as a measure of complexity is also consistent with the ideas of Integrated Information Theory (IIT), which proposes that consciousness arises from the integration of information within a system (Tononi, 2008). According to IIT, the degree of integration in a system determines the level of consciousness, with highly integrated systems exhibiting higher levels of consciousness. Similarly, in the DET model, the growing entropy of the system reflects an increasing degree of integration and complexity, suggesting that consciousness becomes more integrated and sophisticated as the network evolves.
4.4. Entanglement and Consciousness
The concept of entanglement in the DET model is closely related to the idea of neural plasticity, which refers to the brain’s ability to change its structure and function in response to experience and environmental factors. Synaptic plasticity is thought to be a fundamental mechanism underlying learning, memory, and adaptation, and it has been shown to play a key role in the dynamics of consciousness (Hebb, 1949; Kandel, 2001). The DET model builds on this idea by modeling consciousness as a network that evolves over time, with the positions of the points representing neural regions being shifted randomly to simulate the process of entanglement.
In the context of the brain, entanglement can be thought of as a metaphor for the interconnectedness of neural regions. As the brain reorganizes itself in response to experience, the connections between different regions become stronger or weaker, creating a constantly shifting network of activity. This process reflects the dynamic, ever-changing nature of consciousness, where the elements of conscious experience are continuously reorganized and reconfigured.
The DET model offers a mathematical representation of this process, allowing for the simulation of consciousness as a dynamic, evolving network. The entanglement process in the DET model reflects the ongoing reorganization of the brain’s network, where the positions of the points are continuously altered to simulate the plasticity of the brain. This provides a powerful framework for studying the dynamics of consciousness, offering a way to explore the relationship between network structure, entropy, and conscious experience.
4.5. The Role of Visualization in Understanding Consciousness
The visualization of the DET model plays a crucial role in understanding its implications for consciousness. By representing the system as a set of points on the surface of a sphere, the model allows for a clear and intuitive visualization of the evolving network. The shifting positions of the points over time reflect the entanglement and reorganization of neural regions, providing a visual representation of the fluid and dynamic nature of consciousness.
The use of a rosaceous fundus in the visualization adds an additional layer of meaning to the model, symbolizing the underlying structure of the system and providing a metaphor for the foundational processes that support consciousness. This visualization allows for a deeper understanding of the complex dynamics at play, offering a way to observe the ongoing changes in the network and the increasing complexity of the system.
4.6. Limitations and Future Directions
While the DET model provides a novel and compelling framework for understanding consciousness, it is not without its limitations. One of the primary challenges of the model is the difficulty in validating its predictions. As with many mathematical models, the DET model relies on assumptions and simplifications that may not fully capture the complexity of real neural networks. Future work will need to explore the relationship between the DET model and empirical data, particularly in terms of how the model’s predictions align with observed patterns of brain activity and conscious experience.
Additionally, the DET model focuses on the topological dynamics of the system but does not explicitly incorporate the biochemical and physiological mechanisms that underlie neural activity. Future versions of the model could benefit from incorporating more detailed representations of neural processes, such as the firing patterns of individual neurons, synaptic dynamics, and neurotransmitter interactions. This would provide a more comprehensive model of consciousness that integrates both the topological and physiological aspects of brain function.
4.7. Summary
The Differential Entangled Topology (DET) model offers a novel approach to understanding the dynamic nature of consciousness. By modeling consciousness as a continually evolving network of entangled points, the model provides a framework for simulating the fluid and unpredictable nature of conscious experience. Through the use of network theory, topological entropy, and the concept of entanglement, the DET model offers new insights into the organization and complexity of consciousness. While there are challenges to be addressed, the DET model represents a promising direction for future research into the nature of consciousness, providing a mathematically grounded perspective on this elusive and complex phenomenon.
5. Conclusion
The Differential Entangled Topology (DET) model provides an innovative mathematical framework to explore the dynamic nature of consciousness. By conceptualizing consciousness as an evolving network of entangled points, the DET model addresses the fluidity and complexity inherent in conscious experience, offering a fresh perspective on the continuous reorganization of neural regions. The model’s reliance on network theory, topological entropy, and the concept of entanglement introduces a new way to simulate and analyze the complex, unpredictable behaviors of conscious systems.
This approach diverges from traditional models that treat consciousness as a relatively stable or static state, such as Global Workspace Theory (GWT) and Integrated Information Theory (IIT). By focusing on the ongoing transformation of network connections, the DET model highlights the dynamic and emergent properties of consciousness, providing valuable insights into the processes that drive cognitive states.
Moreover, the use of topological entropy as a measure of complexity provides a mathematical lens through which the growing unpredictability and sophistication of consciousness can be quantified. This allows for a deeper understanding of the factors that shape conscious experience and provides a robust framework for further exploration.
Despite its promising potential, the DET model also faces challenges, particularly in terms of validating its predictions and incorporating detailed neural mechanisms. Future work will need to explore empirical data and refine the model to integrate both topological dynamics and the underlying physiological processes of the brain. Nonetheless, the DET model represents a significant step forward in the study of consciousness, offering a novel tool for understanding the intricate and ever-evolving nature of the human mind.
6. Attachment Code
Python Code:
import matplotlib.pyplot as plt
import numpy as np
from mpl_toolkits.mplot3d import Axes3D
import random
# Function to generate points on a sphere
def generate_sphere_points(n_points):
# Generate random spherical coordinates
phi = np.random.uniform(0, 2 * np.pi, n_points)
theta = np.random.uniform(0, np.pi, n_points)
# Convert spherical coordinates to Cartesian coordinates
x = np.sin(theta) * np.cos(phi)
y = np.sin(theta) * np.sin(phi)
z = np.cos(theta)
return x, y, z
# Function to simulate entanglement by slightly shifting the points
def entangle_points(x, y, z, shift_factor=0.05):
# Slightly adjust the positions of the points to simulate “entanglement”
theta_shift = np.random.uniform(-shift_factor, shift_factor, len(x))
phi_shift = np.random.uniform(-shift_factor, shift_factor, len(x))
# Update spherical coordinates
phi_new = np.arctan2(y, x) + phi_shift
theta_new = np.arccos(z / np.sqrt(x**2 + y**2 + z**2)) + theta_shift
# Convert back to Cartesian coordinates
x_new = np.sin(theta_new) * np.cos(phi_new)
y_new = np.sin(theta_new) * np.sin(phi_new)
z_new = np.cos(theta_new)
return x_new, y_new, z_new
# Function to visualize the points on the sphere with a rosaceous fundus on a given axis
def visualize_sphere(ax, x, y, z, iteration):
# Create a sphere mesh for the fundus
u = np.linspace(0, 2 * np.pi, 100)
v = np.linspace(0, np.pi, 100)
x_sphere = np.outer(np.cos(u), np.sin(v))
y_sphere = np.outer(np.sin(u), np.sin(v))
z_sphere = np.outer(np.ones(np.size(u)), np.cos(v))
# Plot the sphere surface with a soft rosaceous color
ax.plot_surface(x_sphere, y_sphere, z_sphere, color=(1.0, 0.9, 0.9), alpha=0.5)
# Plot the bright points on the surface of the sphere
ax.scatter(x, y, z, c=’yellow’, marker=’o’, s=50, alpha=0.8)
# Set the aspect ratio and remove axes for a clean look
ax.set_box_aspect([1, 1, 1])
ax.set_axis_off()
# Set the title for this subplot
ax.set_title(f”Iteration {iteration}”)
# Main function to run multiple iterations and visualize the changes in a 5x2 grid
def run_iterations(num_iterations, n_points, shift_factor):
# Generate initial sphere points
x, y, z = generate_sphere_points(n_points)
# Create a figure with a 5x2 grid of subplots
fig = plt.figure(figsize=(20, 25))
for i in range(1, num_iterations + 1):
ax = fig.add_subplot(5, 2, i, projection=’3d’)
visualize_sphere(ax, x, y, z, i)
# Update the points for the next iteration
x, y, z = entangle_points(x, y, z, shift_factor)
plt.tight_layout()
plt.show()
# Run the simulation with 10 iterations (arranged in a 5x2 grid), 200 points on the sphere, and a shift factor of 0.05
run_iterations(10, n_points=200, shift_factor=0.05) |
Conflicts of Interest
The author claims that there are no conflicts of interest
References
- Baars, B. J. (1988). A Cognitive Theory of Consciousness. Springer Science & Business Media.
- Baars, B. J. (1997). In the Theater of Consciousness: The Workspace of the Mind. Oxford University Press.
- Guckenheimer, J., & Holmes, P. (1983). Nonlinear Oscillations, Dynamical Systems, and Bifurcations of Vector Fields. Springer Science & Business Media.
- Hebb, D. O. (1949). The Organization of Behavior: A Neuropsychological Theory. John Wiley & Sons, Inc.
- Kandel, E. R. (2001). Principles of Neural Science (4th ed.). McGraw-Hill.
- Shannon, C. E. (1948). A Mathematical Theory of Communication. The Bell System Technical Journal, 27(3), 379-423. [CrossRef]
- Sporns, O. (2011). Networks of the Brain. MIT Press.
- Tononi, G. (2008). Consciousness as Integrated Information: A Provisional Manifesto. Biological Bulletin, 215(3), 216-242. [CrossRef]
- Watts, D. J., & Strogatz, S. H. (1998). Collective dynamics of ’small-world’ networks. Nature, 393(6684), 440-442. [CrossRef]
|
Disclaimer/Publisher’s Note: The statements, opinions and data contained in all publications are solely those of the individual author(s) and contributor(s) and not of MDPI and/or the editor(s). MDPI and/or the editor(s) disclaim responsibility for any injury to people or property resulting from any ideas, methods, instructions or products referred to in the content. |
© 2025 by the authors. Licensee MDPI, Basel, Switzerland. This article is an open access article distributed under the terms and conditions of the Creative Commons Attribution (CC BY) license (http://creativecommons.org/licenses/by/4.0/).