
Submitted:
12 February 2025
Posted:
13 February 2025
You are already at the latest version
Abstract
Cellulose acetate (CA) motion picture films are subjected to degradation especially due to the “vinegar syndrome”, a de-acetylation process catalyzed by high temperature, humidity, and acidity. Acetic acid is released as a by-product of this reaction and acts as a catalyst that triggers an autocatalytic process. The main aim of this study was to evaluate the use of metal oxide, hydroxide, and carbonate nanoparticles, as well as their composite inorganic-organic systems, for the ad-sorption of acetic acid and the inhibition of the deacetylation process. Various nanoparticles [Ca(OH)2, ZnO and CaCO3] were compared in terms of their ability to adsorb glacial acetic acid vapors through gravimetry analysis, Fourier Transform Infrared (FTIR) Spectroscopy, X-ray dif-fraction (XRD), and Thermogravimetric Analysis (TGA). The variation in the size and morphology of the nanoparticles was investigated via Scanning Electron Microscopy (SEM), too. Subsequently, the most promising nanoparticles (ZnO) were incorporated into composite organic-inorganic systems, made of Whatman paper (WP) and Poly-Vinyl-alcohol Formaldehyde (PVF) xerogels, and their ability to adsorb acetic acid vapors was again evaluated. Finally, the performance of both the pure ZnO nanoparticles and the organic-inorganic composite systems as inhibitors of the “vinegar syndrome” was assessed on artificially degraded motion picture films using a specifically de-veloped and validated multi-analytical protocol.
Keywords:
xerogels
; poly-vinyl-alcohol formaldehyde polymers
; hydroxide
; oxide
; carbonate nanoparticles
; cellulose acetate
; “vinegar syndrome”
; motion picture films conservation
1. Introduction
Motion picture films are fascinating artistic objects with a complex multi-layer structure[1], typically comprising an emulsion layer made of gelatin and a support layer, usually composed of polymeric material. Concerning the support, between the 1920s and 1950s, cellulose acetate (CA) was introduced as a safer alternative to the more flammable and hazardous cellulose nitrate[1,2]. Unfortunately, this material also showed instability issues and from the 1950s CA was replaced by more stable polyesters[1,2]. The “vinegar syndrome” is the common denomination used to describe the main degradation phenomenon affecting CA-based motion picture films, specifically the deacetylation of the CA-backbone with the release of acetic acid as a by-product [3]. This process is catalyzed by high temperature, moisture, and acidity and the acetic acid itself acts as a catalyst for the reaction, triggering an autocatalytic process[3]. Another collateral reaction of the “vinegar syndrome” is the depolymerization of the polymeric backbone [3]. Macroscopic manifestations of the “vinegar syndrome”, such as the deformation and the shrinkage of the films and the detachment of the emulsion layer from the support due to differential deformation (commonly referred to as “channeling”), can severely compromise the usability and the fruition of the films [1,4]. In the view to safeguard these objects, it is important to prevent the occurrence and/or inhibit the evolution of the “vinegar syndrome”. Today, there are two main approaches to deal with this issue: (i) to inhibit the kinetics of the reaction by acting on the regulation of the thermohygrometric conditions of the environments in which these objects are stored (e.g., by conserving the most degraded films at very low temperature and humidity values, according to the Guide published by Image Permance Institute[4]); (ii) to subtract the acetic acid in order to inhibit the autocatalytic process through its adsorption and/or neutralization. Concerning this last point, a lot of inhibitors have been tested in the recent years, such as molecular sieves [5], activated charcoals[6,7], CaCO3[7,8,9,10], Na2CO3, and sodium polyacrylate [11]) and, in each case, there are some positive and negative aspects, as reported in the above-quoted literature. The most recent proposal concerns the use of water-stable Metal-Organic Frameworks (MOFs)[12,13,14,15], which seems the best option, but has the main drawback of needing complex and expensive syntheses.
In the last three decades, inorganic nanoparticles were widely tested for the deacidification of cellulosic media of historical and artistic interest [16,17]: hydroxides of alkaline earth metals (such as calcium and magnesium hydroxides, Ca(OH)2 and Mg(OH)2) have been extensively used for the deacidification of paper, canvas, and archaeological water-logged wood with excellent results. Part of the hydroxides are consumed for the neutralization of the acidity of cellulose, while the remaining particles react with CO2, turning into CaCO3 (Scheme 1) which can act as a buffer against further acidity (Scheme 2). Calcium hydroxide nanoparticles have been also tested for the adsorption of acetic acid vapors emitted by the wood of a church organ [18].
Recently, a very interesting study was conducted on the use of ZnO nanoparticles loaded in castor-oil polyurethane sponges and used for the adsorption of acetic acid[19,20]: the sponge is easy to handle, with no risk of dispersing particulate into the cases near the work of art (as in the case of gel silica or activated charcoal, for example). In addition, polyurethane acts as a vehicle for the gas through physisorption, and acetic acid can reach the surface of ZnO particles. ZnO is converted into zinc acetate, neutralizing the acetic acid (Scheme 3). It was shown how the sizes of nanoparticles play an important role in the adsorption capacity of the system: decreasing the size of nanoparticles, the amount of the adsorbed acetic acid increases, even if aggregation phenomena of the particles during the synthesis procedures can affect their performance. Nevertheless, while these systems can be used for the adsorption of acetic acid on large museum display cases, they seem not to be suitable for the adsorption of acetic acid in restricted volumes where they could be in direct contact with motion picture films. Being those systems composed of biobased chemicals, due to the thermohygrometric conditions of the microenvironment that is formed in the motion picture film cases, they can promote the development of biological contamination.
Thus far, the use of inorganic nanoparticles as a possible solution for the “vinegar syndrome” on CA-based motion picture films has not been proposed and investigated yet. The main aim of this work was to test the performance of metal oxide, hydroxide, and carbonate nanoparticles, first, in the adsorption of acetic acid vapors, and then in the inhibition of the deacetylation process in artificially degraded CA-based motion picture films. Various nanoparticles (Ca(OH)2, CaCO3/Ca(OH)2 mix, and ZnO) were compared in terms of adsorption of glacial acetic acid vapors. Fourier Transform Infrared (FTIR) Spectroscopy, X-Ray Diffraction (XRD), and Thermogravimetric Analysis (TGA) were performed to qualitatively assess the occurrence of the acetate formation and gravimetry tests were used to quantify the amount of acetic acid vapour adsorption. The variation in the morphology of the nanoparticles was investigated through Scanning Electron Microscopy (SEM) micrographs acquired before and after the exposition of acetic acid vapors.
Afterward, the more promising kind of nanoparticles (ZnO) was uploaded on composite organic-inorganic systems made of Whatman paper (WP) and polyvinylalcohol formaldehyde (PVF) xerogels. This step is necessary in order to provide conservators and archivists with an easy-to-handle system. PVF-ZnO xerogels were characterized in terms of chemical composition (Thermogravimetric analysis, TGA), and morphology (Scanning Electron Microscopy, SEM, and X-rays Micro-Tomography, μ-TOM). In addition, preliminary glacial acetic acid vapors adsorption tests were carried out on both composite WP- and PVF-based organic-inorganic systems.
Finally, the performance of pure ZnO nanoparticles and composite organic-inorganic systems in the inhibition of the “vinegar syndrome” on motion picture films in which the de-acetylation reaction was artificially induced with a proper degradation protocol [21]was evaluated. The different behaviors of films stored with and without the proposed inhibitors were tested through a specifically developed and already validated multi-analytical protocol by considering the variation in free acidity, acetyl content (estimated via Heterogeneous Saponification Metod and FTIR-ATR Spectroscopy) and tensile strength (tensile test) [21].
2. Results
2.1. Acetic Acid Adsorption-Desorption Tests on Nanoparticles
2.1.1. Gravimetric Analysis
To evaluate the adsorption capacity of the selected nanoparticles (Ca(OH)2, CaCO3 mixed with Ca(OH)2, ZnO), they were subjected to an adsorption test of glacial acetic acid vapors.
In Table 1 and Figure 1, the increase in weight calculated after six days of exposition to acetic acid vapors and six days of equilibration (AcOHad%, Eq. 1 in Materials and Methods section, column 1 of Table 1), and after the desorption test (AcOHconvert.%, Eq. 2 in Materials and Methods section, column 2 of Table 1) were reported for each kind of nanoparticles and CaCO3 micropowder for comparison. In addition, the last two columns of Table 1 reported the amount of the residual not-converted into acetate adsorbed acetic acid (AcOHresid.%, Eq. 3 in Materials and Methods section, column 3 of Table 1) and the theoretical increase in weight expected from the entire conversion of the starting nanoparticles to the corresponding acetate salt (column 4 of Table 1), calculated as follows:
in which, Mw0 is the molecular weight of the initial compound and the MwAcsalt is the molecular weight of the corresponding acetate salt.
The registered increase in weight could be associated with the almost total conversion of the compounds to the corresponding acetate salts. The very small amount of residual not desorbed acetic acid was due to adsorbed acetic acid which is not reacted to acetate salts. Indeed, the data reported in Table 1 showed that almost the whole acetic acid vapor was converted into acetate that cannot be desorbed under vacuum. These findings were confirmed by FTIR, XRD and TGA analyses.
2.1.2. XRD Analysis
Ca(OH)2 diffractograms acquired before and after the acetic acid adsorption test were reported in Figure 2A: the conversion from calcium hydroxide (portlandite, PDF 44-1481) to calcium acetate hydrate (PDF 19-0199) was evident.
In Figure 2B, the formation of zinc acetate (PDF®02-064-1515) from pure ZnO (zincite PDF®04-020-0364) wasclear by comparing the diffractograms acquired before and after the acetic acid adsorption test.
From the first diffractogram shown in Figure 3A, it was possible to confirm the carbonatation of the calcium hydroxide nanoparticles into different polymorphisms of calcium carbonate - calcite (PDF 83-0578), aragonite (PDF 75-2230) and vaterite (PDF 24-0030) – with some residues of calcium hydroxide (portlandite, PDF 44-1481). This was probably due to the superficial carbonatation of the particles with consequent isolation of the calcium hydroxide core, which was no longer accessible to CO2. Therefore, the experiments were carried out on a mixture of CaCO3/Ca(OH)2 nanoparticles. The conversion into calcium acetate hydrate (PDF 19-0199) after the acetic acid exposition was also appreciable. On the contrary, the diffractograms registered for CaCO3 micropowder both before and after the acetic acid adsorption test (Figure 3B) showed the presence of only calcite (PDF 83-0578), in agreement with the very low conversion (< 10%).
2.1.3. TGA Analysis
From TGA and DTG profiles, further information on the nature of our systems and the reaction that occurred during the acetic acid adsorption test was acquired (Figure 4). In particular, weight losses associated with decomposition reactions and calculated from TGA and DTG profiles were compared to the theoretical weight losses calculated for those transitions in terms of variation in the molecular weights of the involved compounds:
Where MwA was the molecular weight of the reagent and MwB was the molecular weight of the product after the examined reaction.
For Ca(OH)2 in TGA and DTG profiles (Figure 4A), a weight loss of 20% was observed between 350 and 420 °C (peak in DTG at 407 °C) corresponding to the decomposition temperature of the calcium hydroxide into CaO, mainly due to water release (theoretical weight loss : 23%)[22,23]. In the profile of Ca(OH)2_AcOH, collected after the adsorption period, a first weight loss of 6% was observed between 100 and 230 °C (peak at 208 °C) and a second weight loss of 33% between 400 and 480 °C (peak at 435 °C). The first one could be ascribed to an initial mass loss of water molecules, while the second one to the breakdown of the dehydrated calcium acetate into acetone and calcium carbonate (: 37%)[24]. The peak observed at 455 °C was likely to be attributable to the eventual loss of acetone. The further decomposition of calcium carbonate was not seen in this profile because occurs at higher temperatures[25].
In the TGA ZnO profile (Figure 4B), no weight loss was detected, as expected, because the thermal degradation of zinc oxide occurs at temperatures above 500 oC [26]. In the ZnO_AcOH profile, a total weight loss of 91% between 160 and 330 °C was observed and corresponds, in the first range (160-250 °C, ~28%) to the loss of molecular water and adsorbed acetic acid, and in the second range (250-330°C) to the thermal degradation of zinc acetate into zinc oxide (~46%), the sublimation of zinc acetate species or the formation of other volatile zinc organic composition such as Zn4O(CH3CO2)6 (residual ~17%)[27,28].
In the CaCO3 TGA profile (Figure 4C), a weight loss of 13% was visible between 340 and 420 °C (peak at 395 °C), due to residual calcium hydroxide in the starting sample (see diffractogram in Figure 3A). CaCO3_AcOH TGA profile showed two weight losses of 12% between 100 and 222 °C (peak at 190 °C) due to the removal of water molecules and 31% between 391 and 460 °C (peak at 437 °C) due to the thermal degradation of calcium acetate into calcium carbonate (theoretical weight loss: 37%)[23].
2.1.4. SEM Micrographs
SEM micrographs acquired for each compound before and after the exposition to acetic acid vapors are reported below (Figure 5) and in the Supporting Information (Figure SI2 in Paragraph 1.2).
In Figure SI2A hexagonal platelets with hexagon sides of 100±50 nm and thickness of 2–40 nm typical of portlandite are shown [29]. After the exposition to acetic acid, calcium acetate (Figure SI2B) appeared as aggregates with a needle-like shape [30] from a few hundred nanometers to a few micrometers compacted in a sort of cement.
Zinc oxide appears as pseudo-circular nanoparticles with sizes of approximately 100 nm (Figure 5A). After the adsorption test the size of nanoparticles only slighly vary but the presence of bigger aggregates was appreciated (Figure 5B). For zinc-based nanoparticles before and after the acetic acid adsorption test, a dimension analysis was performed with ImageJ software. By approximating all the nanoparticles as rounded objects, zinc oxide nanoparticles showed a calculated radius of 140±80 nm, while zinc acetate has a size distribution of 180±90 nm.
After the carbonatation step (Figure SI2C), calcium carbonate nanoparticles assumed an irregular pseudo-circular shape. Single nanoparticles did not sensibly vary their dimension compared to calcium hydroxide nanoparticles (150±90 nm), but several, bigger aggregates were evident (even up to 0.5-1 μm in diameter). In this case, for calcium acetate crystals obtained after the exposition to acetic acid vapors, the morphology and the dimension seemed not to sensibly vary from the initial ones (190±100 nm), except for the presence of even bigger aggregates (Figure SI2D).
On the other hand, calcium carbonate micropowder showed a rhombohedral habit, typical of calcite, both before and after acetic acid adsorption (particle size was around 2-4 μm for the rhombus side, Figure SI E-F), coherently with previous considerations.
2.2. Acetic Acid Adsorption-Desorption Tests on WP-ZnO and PVF-ZnO
Whatman paper (WP) and polyvinyl alcohol formaldehyde (PVF) xerogels were uploaded with ZnO nanoparticles (WP-ZnO and PVF-ZnO, respectively) since ZnO revealed the best results in acetic acid vapour adsorption and were subjected to an adsorption-desorption test of acetic acid vapors. A physico-chemical and morphological characterization of PVF-ZnO xerogels is reported in Paragraph 2 of the SI.
2.2.1. Gravimetric Analysis
Gravimetric analyses were performed and AcOHad% (Eq. 1), AcOHconvert.% (Eq. 2), and AcOHresid.% (Eq. 3) were calculated and reported in Table 2 and Figure 6. Despite we continue to label AcOHconvert. and AcOHresid. the meaning is completely different for the samples PVF and WP, since there is no conversion to acetate due to the lack of the metal oxide. In these two cases AcOHconvert. was the adsorbed acetic acid strongly bound to the support (WP or PVF) due to chemisorption and AcOHresid. was the acetic acid weakly bound to the support due to physisorption. In the case of the mixed composite WP/ZnO and PVF/ZnO these two parameters contained both acetic acid converted to acetate and residual adsorbed and chemisorbed/physisorbed acetic acid by WP and PVF.
The AcOHad% (Eq. 1) after six days of adsorption and six of equilibration is only 6.7±0.5% for pure WP, 17±1% for WP-ZnO, 17±1% for pure PVF and 27±2% for PVF-ZnO. After the desorption test AcOHconvert.% (Eq. 2) decreased for all the inorganic-organic systems (WP+ZnO: 14±1% and PVF+ZnO: 20±2%), and an analogous decrease was observed for the pure supports WP and PVF. The weight loss detected after the desorption test (AcOHresid.%, Eq. 3) in all the samples was due to the acetic acid physisorbed on the paper or the xerogel. The strong difference with respect to pure ZnO nanoparticles was due to the smaller amount of ZnO in the composite systems that contained approximately 10 w/w% of ZnO.
2.2.2. FTIR-ATR Analysis
In Figure 7, FTIR-ATR spectra of WP (Figure 7A) and PVF (Figure 7B) uploaded with ZnO nanoparticles before and after the adsorption test with glacial acetic acid vapors are reported. It was possible to appreciate the peaks ascribable to zinc acetate: C-O asymmetric and symmetric stretching vibrations modes are detected at about 1550 and 1435 cm-1, respectively [31,32]. In addition, a peak at about 1700 cm-1 is detected, ascribable to the asymmetric stretching of C=O group.
2.2.3. TGA
In Figure 8, TGA and DTG profiles associated with WP-ZnO and PVF-ZnO after the acetic acid adsorption and desorption test are reported.
Concerning WP-ZnO (Figure 8A), a first weight loss of 4.1% at about 60 °C was associated with adsorbed moisture. A weight loss of 83% between 300 and 370 °C (peak at 350 °C in the DTG profile) was ascribable to the decomposition of the Whatman paper. In the thermogravimetric profile of WP-ZnO after the adsorption of acetic acid, the first weight loss at ca. 60 °C was about 5.5%: it was only slightly higher than the one calculated for pure WP-ZnO probably because the amount of weakly adsorbed acetic acid was very low. An additional weight loss of about 13.3% was registered between 150 and 250 °C (peak at 232 °C of the DTG profile) and it was possible to ascribe it to the decomposition of zinc acetate (see ZnO_AcOH profile in Figure 4B). Finally, a last weight loss between 250 and 360 °C (peak at 340 °C) was associated with the thermal decomposition of the Whatman paper.
In the profile associated with PVF-ZnO (Figure 8B) after the adsorption test, a first weight loss of 25.1% was observed between 35 and 180 °C and could be ascribed to the loss of moisture and weakly bonded acetic acid to the xerogel (peak at 65 °C in the DTG profile); a second weight loss between 180 and 350 °C (peak at 267 °C) was due to the thermal degradation of zinc acetate inside the xerogel (the same weight loss of 63% is visible in ZnO_AcOH, see Figure 4B). A last weight loss was registered between 350 and 500 °C (peak at 419 °C) and could be associated with the degradation of PVF (see Figure SI3 in Paragraph 2.2.1 of the Supporting Information). Concerning PVF-ZnO after the desorption test, the first weight loss ascribable to the loss of moisture and weakly bonded acetic acid was lower than immediately after the adsorption test (of 4.6% vs 25.1%) and appeared at lower temperatures (between 44 and 90°C). The weight loss of 52.1% between 150 and 350 °C (peak at 258 °C) also in this case could be ascribed to the presence of zinc acetate inside the xerogel and a second weight loss of 20.85% between 350 and 500 °C (peak at 419°C) to the degradation of PVF sponge.
2.2.4. SEM Micrographs
In Figure 9, SEM micrographs acquired on both WP-ZnO and PVF-ZnO before and after the acetic acid adsorption test are shown.
In both WP-ZnO (Figure 9A) and PVF-ZnO (Figure 9C), it was possible to see a very dense layer of ZnO nanoparticles onto the surface of the systems. In particular, ZnO nanoparticles seemed trapped between the fibers of the Whatman paper and in some porosities and/or on the surface of PVF xerogels, forming some bigger aggregates.
2.3. The Evaluation of the Performance of ZnO Pure Nanoparticles, WP-ZnO and PVF-ZnO Xerogels on Artificially Degraded Real Motion Picture Films
All the samples of real motion picture films (RMPF) subjected to the ATM2.9 degradation protocol are resumed in Table 3 (Paragraph 4.6).
2.3.1. Free Acidity
The trend of the free acidity reported in Figure 10A shows very interesting results: for samples subjected to the ATM2.9 degradation protocol without any inhibitor (NT), free acidity values increased by almost 200% (from ca 0.6±0.07% for the sample P9_HCl5M up to 1.85±0.09% for the sample P48_ATM2.9_NT) [21]. On the other hand, for samples degraded in the presence of pure ZnO nanoparticles, the free acidity decreased after the 24th day (P24_ATM2.9_ZnOnps: 0.3±0.1%) but increased again until the 48th day (P48_ATM2.9_ZnO nps:0.44±0.09%). For samples degraded in the presence of pure PVF, higher free acidity values were detected for the entire duration of the degradation protocol, of ca. 0.8%, even if a sort of stabilization was observed around this value. Similar values of free acidity were detected for film stored with pure WP, even if an increase of the free acidity was monitored for the entire duration of the test (P48_ATM2.9_WP:1.1±0.1%). On the contrary, samples degraded in the presence of both organic-inorganic systems showed very promising results: a stabilization of the free acidity was detected for samples degraded in the presence of Whatman® paper doped with ZnO nanoparticles and, after 12 days, the free acidity decreased from 0.6±0.1% up to ca 0.25±0.1%. The free acidity values kept decreasing for the entire duration of the degradation protocol, ranging between 0.3% and 0.1%.
Also for samples subjected to the ATM2.9 degradation protocol in the presence of PVF+ZnO, a decrease of the free acidity was observed in the first 12 days (P9_HCl5M: 0.60±0.09% vs P12_ATM2.9_PVF+ZnO: 0.2±0.1%) with a subsequent stabilization until the end of the test (P48_ATM2.9_PVF+ZnO: 0.2±0.1%).
2.3.2. Acetyl Content
The initial acetyl content of the motion picture films used for the test was 41.7±0.7%, typical of a cellulose diacetate [3,33]. After the first phase of the degradation protocol (exposition to HCl vapors for 9 days) the deacetylation process was triggered with the consequent decrease in the acetyl content to 39.2±0.4% (Figure 10B).
A significant decrease (almost 23%) was observed not only for the NT samples (P48_ATM2.9_NT: 30±1) but also for the samples degraded at 100% RH in the presence of pure ZnO nanoparticles, pure PVF an pure WP, even if this effect was less pronounced in these last cases (the decrease of the acetyl content after 48 days is almost 10%, 13% and 20% for samples degraded in presence of pure WP, ZnO nanoparticles and pure PVF, respectively). The decrease in the acetyl content started between the 24th and the 36th day for samples stored with no inhibitor (P36_ATM2.9_NT: 36±1%) and with ZnO nanoparticles (P36_ATM2.9_ZnOnps: 34.2±0.4%) and after the 36th for RMPF stored with pure WP (P48_ATM2.9_WP: 35.0±0.9%) and pure PVF (P48_ATM2.9_PVF: 31.5±0.3%).
On the contrary, the trend of the acetyl content was strongly influenced by the presence of both the organic-inorganic systems: the Whatman paper doped with ZnO nanoparticles induced a stabilization of the acetyl content after 24 days of the degradation protocol at about 37% (for samples P24_ATM2.9_WPZnO the acetyl content value is 37.1±0.3%). A similar trend was observed also for the correct acetyl content for RMPF degraded in the presence of PVF+ZnO, which remained almost constant for the entire duration of the degradation process (P9_HCl5M: 39.2±0.4%; vs P48_ATM2.9_PVF+ZnO: 38±1%).
2.3.3. FTIR-ATR Spectroscopy
From the FTIR-ATR spectra (Figure 11A), it was possible to obtain information about the deacetylation process in a non-invasive and destructive way [34,35,36,37]: for films degraded in the absence of inhibitors, after the 24th day, a decrease in the intensity of the peaks associated with the acetyl group (peak at 1220 cm-1 of the C-O stretching, at 1330 cm-1 of the C-H bending and peak at 1730 cm-1 of the C=O stretching) and an increase in the intensity of the peak ascribed to the O-H stretching of the hydroxyl group at ca. 3330 cm-1 were observed if compared to the peak at 1030 cm-1 of the C-O-C stretching of the glycosidic ring, choose as internal standard. This trend was measured for the entire duration of the degradation protocol. Consequently, the ratio between the intensities peaks at 1220 cm-1 and 1030 cm-1 (Figure 11B) slowed down from 0.92±0.08 for P9_HCl5M up to 0.450.04 for P48_ATM2.9_NT, confirming the artificially induction of the deacetylation process.
For samples degraded in the presence of pure PVF and pure WP, the trend was very similar to the one registered for NT motion picture films: a strong decrease of the I1220/I1030 ratio was observed already after the 12th day with a significative diminuition after 48 days, as indicated in Figure 11B (the I1220/I1030 ratio is 0.55±0.03 for P48_ATM2.9_PVF and 0.62±0.03 for P48_ATM2.9_WP). Even if the intensities of the peaks due to the acetyl group (peaks at 1220, 1330 and 1730 cm-1) after 48 days of duration of the degradation protocol were more intense in samples degraded with ZnO nanoparticles (P48_ATM2.9_ZnO nps) than in the NT ones, however, the ratio between the intensities of the peaks at 1220 cm-1 and at 1030 cm-1 until the 36th day, decreased (P9_HCl5M: 0.92±0.09; P36_ATM2.9_NT: 0.65±0.1 vs P36_ATM2.9_ZnO nps: 0.75±0.03) and a slowdown of the degradation process was observed between the 36th and the 48th day (P48_ATM2.9_NT: 0.45±0.04; P48_ATM2.9_ZnO nps: 0.7±0.1%).
In accordance with previous tests, the behavior of RMPF stored with organic-inorganic systems was promising also from FTIR-ATR analysis. For all the motion picture films degraded in the presence of WP-ZnO and PVF-ZnO, the ATR-FTIR spectra indicated that the decrease of the intensities of the peaks associated with the acetyl group (peaks at 1220, 1330 and 1730 cm-1) was very low for all the duration of the ATM2.9 protocol. Even for the intensity of the peak associated with the OH group, only a low increase was observed for all the treated samples after 48 days, probably due to the adsorption of moisture. Indeed, no significative variations in the I1220/I1030 ratio were detected for the samples degraded in the presence of the PVF xerogels containing the nanoparticles (P48_ATM2.9_PVF-ZnO: 0.86±0.03). For RMPF degraded in the presence of WP-ZnO after 12 days a low decrease was observed (from 0.92±0.09 for P9_HCl5M up to 0.9±0.03 for P12_ATM2.9_WP-ZnO) with a subsequent stabilization around this value up to the 48th day of the degradation process (the I1220/I1030 ratio is 0.72±0.04 for P48_ATM2.9_WP-ZnO).
2.3.4. Tensile Tests
Variations in tensile strength during the ATM2.9 degradation protocol were investigated with tensile tests and the results are reported in Figure 12: calculating the slope of the axial force vs strain curve allowed to obtain the Young’s modulus. A higher decrease in the tensile strength was observed for RMPF stored without any inhibitor: a halving in the Young’s Modulus was registered between P9_HCl5M (14±1MPa) and P48_ATM2.9_NT (7.3±0.2 MPa).
On the other hand, for samples stored with pure PVF, pure WP, PVF-ZnO and pure ZnO nanoparticles (9±2 MPa) and WP-ZnO (10±2 MPa) for 48 days of the ATM2.9 degradation protocol a slight decrease in the Young’s modulus was observed, but lower if compared to NT samples.
In addition, it was interesting to note that, while for RMPF stored with WP-ZnO and PVF-ZnO and without any inhibitor, a plastic deformation before 40 N was observed, 3/5 samples stored with ZnO nps and 4/5 samples stored with pure WP and PVF broke at 25±2, 3±2 and 35±3 N, respectively.
3. Discussion
3.1. Acetic Acid Adsorption-Desorption Tests on Nanoparticles and Composed Organic-Inorganic Systems
In this work, the possibility of using nanoparticle-based systems for the inhibition of the “vinegar syndrome” was evaluated.
First of all, we tested the acetic acid vapors adsorption capacity of various nanoparticles (Ca(OH)2, CaCO3/Ca(OH)2, ZnO): all the systems showed good performance both in terms of the total adsorbed acetic acid (AcOHad%, Eq. 1) and the conversion to acetate salts was practically total (AcOHconvert.%, Eq. 2) – ZnO: 121±3% and 120±6%; Ca(OH)2: 113±2% and 111±4%, CaCO3/Ca(OH)2: 64±2% and 62±5%, (see Table 1 and Figure 1). The capacity to strongly bind the adsorbed acetic acid by converting it into the corresponding acetate salt was confirmed by FTIR (Figure SI1), XRD (Figure 2 and 3) and TGA analyses (Figure 4).
On the other hand, the AcOHad% of CaCO3 micropowder (10 ± 1%, Table 1), was sensibly lower than the corresponding nanosized CaCO3 mixed with Ca(OH)2 (64±2%, Table 1), likely due to the lower capacity of micropowder to adsorb acetic acid with respect to the mixture of CaCO3 and Ca(OH)2 nanoparticles having high specific surface area. Diffractograms also confirmed that the reaction between the acetic acid vapors and the metal oxide/hydroxide/carbonate to originate acetate salts occurred only for nanoparticles and not for micropowder (for CaCO3 micropowder only peaks ascribable to calcite were visible in the diffractogram after the acetic acid adsorption test, see Figure 3B), concluding the indispensability of using nanomaterials. It was worthwhile to mention that the present result confirmed what had already been found about CaCO3 micropowder in previous works [10,38], i.e., mediocre results in terms of the inhibition of the “vinegar syndrome” and prevention of infection of other films stored nearby. Our results were coherent with these studies and confirmed the great advantage offered by the use of nano-systems instead of massive materials: it is well-known that the decrease in size corresponds to a decrease in the number of atoms that form the particle; moreover, the smaller the particles, the greater the number of surface atoms, with a consequent improvement in several properties, such as the chemical reactivity[16].
Between the examined kinds of nanoparticles, the higher increase in weight was calculated for ZnO nanoparticles so ZnO was chosen to perform further experiments for the application in real motion picture films affected by the “vinegar syndrome”.
By comparing pure WP and PVF with the corresponding systems loaded with ZnO nanoparticles, it was evident that the latest ones showed higher AcOHad% values (Table 2, Figure 6). Considering that the amount of the ZnO nanoparticles loaded within the support (WP or PVF) was approximatelly 10 w/w% and looking at Table 2 and Figure 6, it was possibile to deduce that ZnO keeps to be totally converted into zinc acetate by acetic acid vapors adsorption. Indeed, 12% (as the 10% of 121%, theAcOHad% of pure ZnO nps) was, in the limit of the experimental error, exactly the difference in the AcOHad% calculated between the pure supports (PVF and WP) and the corresponding inorganic-organic composites (PVF-ZnO and WP-ZnO, see Table 2). The presence of ZnO nanoparticles, which were able to irreversibly transform acetic acid into zinc acetate, could be considered a promising tool to switch off the “vinegar syndrome”, whereas the simple adsorption (both chem- and phys-) by the pure supports (WP and PVF) did not permit the inerting of acetic acid. The presence of peaks ascribable to zinc acetate in FTIR spectra acquired after the desorption test confirmed this result (Figure 7).
Moreover, a higher efficacy was observed for PVF-ZnO comparing this system with WP+ZnO (AcOHad% of PVF+ZnO: 27±2 vs. WP+ZnO: 14±1%, Table 2). A possible explanation could be that PVF xerogel porous structure succeeded in promoting the adsorption of acetic acid onto the surface of ZnO nanoparticles and the xerogel itself if compared to WP.
Concerning both WP-ZnO and PVF-ZnO, the weight increase after each step of the test was comparable, as previously highlighted, to that registered for pure nanoparticles (AcOHconvert.% of ZnO: 120±3%, Table 1). This is notableconsidering that the ZnO nanoparticles in the organic-inorganic nanocomposite represented only 10% by weight. Potential future developments of these new smart materials could involve exploringthe possibility of loading a higher amount of ZnO nanoparticles within the PVF xerogels, in order to enhance the acetic acid adsorption capacity. However, it is not guaranteed that a higher loading would be feasible, nor that it would result in improved performance.Indeed, nanoparticles tended to aggregate during the loading process in the xerogel with a consequent decrease in the surface area, as evidenced bySEM micrographs (Figure 9A and 9C). Nonetheless, we considered the current results promising, as PVF xerogels loaded with 10% of ZnO nanoparticles, toprovideconservators with more user-friendly systems compared to pure nanoparticles, which could contaminate motion picture film cases.
On this basis, we decided to select some of these systems (ZnO nanoparticles, WP-ZnO and PVF-ZnO) in order to test their efficacy in inhibiting the deacetylation process in artificially degraded motion picture films.
3.2. Evaluation of the Performance of Composite Organic-Inorganic Systems in the Inhibition of the “Vinegar Syndrome”
To evaluate the efficacy of the developed smart organic-inorganic systems in the inhibition of the “vinegar syndrome” on real motion picture films, some CA-based frames were subjected to an artificial degradation protocol called ATM2.9 [21]: by exposing motion picture films to a saturated atmosphere of HCl vapours for 9 days, it was possible to trigger the deacetylation process (first step). After the elimination of the excess of HCl (second step), motion picture films artificially affected by the “vinegar syndrome” were stored for different times at 100% RH in order to promote the further evolution of the deacetylation reaction (third step). The meaning of such three steps protocol have been well detailed and explained in ref. 21. In this phase, inhibitors (pure nanoparticlesof ZnO, pure PVF and WP, WP-ZnO and PVF-ZnO) were put inside some of the chambers in order to evaluate the different behavior of motion picture films stored with and without them, in terms of free acidity, acetyl content (evaluated through the Heterogeneous Saponification Method and FTIR-ATR Spectroscopy) and tensile strength [21].
From free acidity (Figure 10A) and acetyl content data (Figure 10B), a clear trend was observed: in the sample stored without any inhibitors the deacetylation process was dramatically pushed until the lowering of the overall degree of substitution of the polymer (from cellulose diacetate to cellulose monoacetate[3,33]); a similar trend was evident also for RMPF stored in the presence of pure PVF and WP, for which the deacetylation was only slowed down. Pure PVF and WP only weakly adsorbed the acetic acid produced by the degraded films by trapping it inside their porosity (in particular PVF) and creating hydrogen bonds without neutralizing it. Moreover, the availability of free hydroxyl groups inside both the structures (cellulose and polyvinylalcohol formaldehyde) probably promoted the adsorption of external moisture, contributing to the slowing down of the deacetylation process.
Concerning pure ZnO nanoparticles, their performance was intermediate between the untreated samples and the ones treated with inorganic-organic systems: free acidity seemed stable around the initial value, without a sensible decrease, and, consequently, a slower but evident decrease was observed for the acetyl content. This could be probably because ZnO nanoparticles were stored inside a glass vial at the bottom of the chamber and the acetic acid adsorption was limited by this asset. However, the storage of nanoparticles inside a proper container was mandatory in the view of easy handling for conservators and archivists, to not risk their dispersion and contaminatio of the real motion picture films by the ZnO nanopwder.
On the other hand, both inorganic-organic systems made of WP and PVF doped with ZnO nanoparticles presented the best performance, being able to inhibit the artificially induced deacetylation process: the free acidity was turned down thanks to the conversion of emitted acetic acid into zinc acetate with the consequent stabilization of the acetyl content. Their capacity to adsorb both acetic acid and moisture was very effective in the inhibition of the induced “vinegar syndrome”, especially for PVF-ZnO xerogels: it was reasonable to assume that their porous structure promoted the interaction between acetic acid and ZnO nanoparticles, as confirmed by preliminary acetic acid adsorption tests. FTIR-ATR spectra (Figure 11) confirmed these hypotheses.
The tensile strength of all the RMPF (Figure 12) was altered by the ATM2.9 degradation protocol: the Young’s Modulus, calculated from the linear fitting of the σ/ε graphs corresponding to the range in which the material shows elastic behavior (0-20 N), was lower for all the samples (treated and untreated) than the one registered for the “time 0” of the third phase of the degradation protocol (P9_HCl5M). This was probably due to the exposition of all the samples to high moisture (RH 100%) for different times: high moisture has an impact not only in the deacetylation process but also in the alteration of the emulsion layer, made of gelatine and soluble in water. As shown in a previous study [21], indeed, this degradation protocol induced a partial loss of the emulsion layer, which surely influenced the tensile strength of the overall motion picture film, independently on the application of any inhibitor. Prefaced that, the Young’s Modulus value was lower for samples stored without any inhibitor than the others, in accordance with previous results. Indeed, the subtraction of acetic acid by the inhibitors, which acts as a catalyst not only for the deacetylation process but also for the depolymerization of the CA backbone [3], contributed to the conservation of the tensile strenght of the films. Comparing the Young’s Modulus calculated for RMPF stored with all the inhibitors, it was not possible to appreciate significant differences, due to the standard deviation.
4. Materials and Methods
4.1. Chemicals and Materials
Nanorestore Plus® of calcium hydroxide, Ca(OH)2, nanoparticles dispersed in ethanol (10 g/L) has been kindly provided by the CSGI Consortium; zinc oxide, ZnO, nanopowder (<100 nm particle size), calcium carbonate (CaCO3) (ACS reagent, ≥99.0% powder), formaldehyde, Triton X100, glutaraldehyde (solution in water 50wt%), hydrochloric acid 37%, glacial acetic acid, cyclohexane (ACS reagent, ≥99.0%) were purchased from Sigma Aldrich. Ethanol anhydrous denatured and sulfuric acid 96% were purchased from Carlo Erba Reagents. Polyvinyl alcohol was purchased from Kuraray (Kuraray Poval 10-98). Sodium Hydroxide (≥ 98.5% pellets anhydrous) was purchased by Acros Organics. All the chemicals have been used without further purification.
To obtain dry Ca(OH)2 nanoparticles, the Nanorestore Plus®dispersion was fluxed with nitrogen for 6 hours in order to promote the evapouration of ethanol. To obtain CaCO3 nanoparticles, Ca(OH)2 dispersion was left for twenty days under hood to promote the carbonatation process.
Whatman paper (WP) sheets (55 mm Ø, Cat. No. 1001-055).
Water used for all the procedures was purified by a Millipore MilliQ Direct-Q® & Direct-Q UV water purification system (Water Resistivity: 18,2 MΩ at 25°C).
Real motion picture films (RMPF) used in the experiments came from a reel called “Vita di una pianta” (The life of a plant), an educational documentary of the “Sezione Cinescolastica Paravia” (Movies for schools Paravia), dated between the 1960 and 1970. The film (support and emulsion) was produced by Ferrania (Savona, Italy) and it was made of cellulose diacetate, as demonstrated by the polarization test[40], the presence of the typical edge code “SAFETY”[1,4] and FTIR-ATR analysis (Figure 10A, [21]). The thickness of the RMPF was 125 ± 3 µm.
4.2. PVF Xerogels Synthesis
PVF sponges have been synthesized following the procedures described in the patents US2,668,153 [41] and US2,609,347 [42] and papers [43,44,45,46].
The synthesis procedure could be summarized as follows: 0.5 g of TritonX-100 were added to 20 g of a solution of PVA 10 wt% in water, then the system was heated at 95 °C under vigorous stirring for 30 min. Then the proper amount of a formaldehyde solution in water(PVAOHmonomer/formaldehyde molar ratio = 2.2) was added dropwise to the mixture, keeping to heat and stirring for at least 5 min, until the foam reached the maximum volume. The solution was left to cool to 60 °C under stirring, then 10 mL of 50% aqueous H2SO4 was added. The solution was poured into a mold and cured in an oven at 60°C for 5 h. Then, the sample is washed with water at least five times to remove the residual solvents and unreacted products. The sponges were dried in an oven at 55-60 °C.
4.3. PVF-ZnO Composed Xerogels Synthesis
PVF+ZnO sponges were obtained by immerging the PVF sponge in a 10 g/L dispersion of ZnO nanoparticles in ethanol, previously sonicated for 30 min in an ultrasonic bath (Elmasonic S 30H, Elma) with a power of 80 W, for 2 hours under vacuum (15 mbar). The complete drying of the sponge was conducted by extracting the sponge from the dispersion and leaving it under vacuum for a further 2 hours (Wdry). The amount of uploaded nanoparticles in the sponge was evaluated by weight and it is about 9.2 ± 0.9 % of the initial weight of the sponge.
4.4. WP-ZnO Synthesis
To obtain WP-ZnO composed systems, a WP disk was immersed in a homogeneous dispersion of 5 g/L in ethanol of ZnO nanoparticles previously sonicated for 30 min in an ultrasonic bath (Elmasonic S 30H, Elma) with a power of 80 W. Then the system was left to dry for 24 hours to promote the complete evaporation of the dispersant. The amount of uploaded nanoparticles on the WP was evaluated by weight and it is about 9 ± 1% of the initial weight of the WP (ca. 1.05±0.3 mg/cm2).
4.5. Acetic Acid Adsorption-Desorption Tests on Nanoparticles
To evaluate the capacity of the systems to adsorb acetic acid vapours, adsorption-desorption tests were performed on various nanoparticles (Ca(OH)2, CaCO3, ZnO) exposed to a saturated glacial acetic acid atmosphere. Nanopowders with nominally similar dimensions (<100 nm) were chosen. Also micropowder of CaCO3 (grain size in the order of 1-5 μm, see Figure SI2G in the Supporting Information) was considered for comparison. All the systems were dried and the weight was registered (Wdry, weight of dry sample) and put in sealed jars (130 mL) with a vial containing 8 mL of glacial acetic for six days (until saturation). Then, they were left to equilibrate for six more days at controlled temperature and humidity (20 °C – RH 50%) and weighed (Wad).
The amount of adsorbed acetic acid after the adsorption test (AcOHad%) was evaluated through gravimetric analysis, using the following equation:
Where Wdry= weight of the dried sample, Wad= weight (g) of the sample after the adsorption test.
To obtain further information about the nature of the interaction between the nanoparticles and the acetic acid vapors, desorption tests were performed[19]. Samples previously subjected to adsorption tests were put under vacuum (15 mbar) until they reached a stable weight value. Assuming that the not desorbed acetic acid completely reacted with the nanoparticles converting them into acetate salts, the amount of such entirely converted acetic acid into acetate salts (AcOHconvert.%) after the equilibration period, was evaluated according to the following equation:
Where = weight (g) of the dried sample, Wdes = weight (g) of the sample after the desorption test.
The residual adsorbed acetic acid (AcOHresid.%) after the adsorption period, was calculated as:
For each test, three samples were prepared and the average values and the corresponding standard deviation are reported below.
For pure nanoparticles, FTIR spectra, XRD diffractograms, SEM micrographs and TGA profiles were acquired before and after the adsorption test with the following methodologies.
Fourier Transform Infrared (FTIR) Spectroscopy. FTIR measurements were performed using a BioRad FTS-40 spectrometer in the range 4000–400 cm-1. Spectra were averages of 64 scans recorded in transmittance mode with 2 cm-1 resolution. KBr pellets were prepared by finely grinding and mixing a few milligrams of sample and 200 mg of pure KBr.
X-ray diffraction (XRD). Powder X-ray diffraction (XRD) analyses were carried out at the CRIST Centre of the University of Florence (Italy). A Bruker D8 Advance diffractometer equipped with a Cu Kα radiation and a Lynx Eye detector was used operating in θ-2θ Bragg–Brentano geometry at 40 kV and 40 mA, in the range of 4–55/65° with a step size of 0.04° and a count time of 1 s.
Thermogravimetric analysis (TGA). Tests were performed in a nitrogen atmosphere at a heating rate of 10 °C/min over a temperature range of 25-500 °C, with an initial sample weight of approximately 5 mg using a SDT 650 thermal analyzer (TA).
Field-Emission Scanning Electron Microscopy (FE-SEM). SEM micrographs were collected by means of a Zeiss Sigma FE-SEM instrument, operating in high vacuum mode with an acceleration potential of 2-3 kV. It was equipped with a GEMINI column and In-Lens detector.. Nanoparticles of Ca(OH)2, CaCO3, and ZnO were dispersed in ethanol, while the corrisponding acetate salts in cyclohexane (0.1 g/L) and sonicated with a Digital Sonifer 250, Branson, equipped with a microtip for 5 minutes at 30% of amplitude. After applying a few drops of dispersions on the stub and after the evaporation of the dispersant, the metallization was made by using gold vapor under vacuum.
For Ca(OH)2, CaCO3, CaCO3_AcOH, ZnO and ZnO_AcOH, a size distribution was calculated from micrographs of 10.000 K magnitude by using Image J software. Nanoparticles have been approximated to rounded systems and the calculation was performed on three micrographs for each sample. The average radius and the corresponding standard deviation are reported.
4.6. Artificial Induction and Evolution of the “Vinegar Syndrome” on Motion Picture Films and Their Characterization
The performance of ZnO pure nanoparticles, WP-ZnO and PVF-ZnO xerogels in the inhibition of the “vinegar syndrome” in real motion picture films (RMPF), on which the deacetylation process has been artificially induced, was evaluated. We chose to apply the ATM2.9 degradation protocol reported in [21]. The RMPF were cut into fragments of 50 ×16 mm (total amount for each chamber ca. 1 g) and hung at the top of the chamber with a Teflon wire, spaced out with glass marbles with a diameter of about 2 mm to avoid their mutual contact during the storage. Pure WP and WP-ZnO sheets were put in between the RMPF fragments spaced out with glass marbles, and pure PVF and PVF-ZnO xerogels were put at the bottom of the chambers at about 0.5 cm from the motion picture films, not in direct contact with them. Pure ZnO nanoparticles were put in a glass vial at the bottom of the chamber.
5. Conclusions
In this study, the possibility of using innovative inorganic-organic nanocomposite systems based on inorganic nanoparticles for the inhibition of the “vinegar syndrome” on cellulose acetate-based motion picture films was evaluated.
First of all, the capacity of various nanoparticles (Ca(OH)2, ZnO and CaCO3) to convert acetic acid vapours into the corresponding acetate salt was confirmed through FTIR, XRD, TGA, SEM and gravimetric analysis. All the systems revealed to be effective for this purpose. Then, the most performative and stable of these species (ZnO) was used to dope two different organic systems made of Whatman paper (WP-ZnO) and porous xerogels of PVF (PVF-ZnO). The intent was to propose effective systems, able to adsorb and neutralize the acetic acid emitted by CA-based motion picture films, and consequently inhibit the “vinegar syndrome”, and to provide easy-to-handle objects for conservators and archivists. Both WP-ZnO and PVF-ZnO could be easly insert inside the cases in which films are stored without the risk of dispersing nanoparticles. Moreover, their shape can be easily adapted according to the needs. To prove the capacity of these systems to inhibit the deacetylation process and its consequences, CA-based real motion picture films were subjected to an artificial degradation process with and without our proposed inhibitors: from the comparison of samples stored with and without the systems and their characterization in terms of free acidity, acetyl content, and tensile strength, both WP-ZnO and PVF-ZnO were found to be effective in the inhibition of the “vinegar syndrome”. Indeed, the decrease in the free acidity, due to the capacity of these inorganic-organic systems to adsorb moisture and neutralize acetic acid, as seen from the preliminary adsorption tests of acetic acid vapors, kept to the stabilization of the acetyl content of the film. Also, the decrease in tensile strength was significantly slowed by the presence of the inhibitors, because of the subtraction of the catalyst for the depolymerization reaction.
Another interesting point was the effectiveness of these systems, even when not in direct contact with the film. It is an important advantage both in terms of ease of application (it is not necessary to ensure the contact between the inhibitor and the film for the entire length of the film) and the risk of altering the visual integrity of the object. Future experiments on films ’naturally’ affected by the ’vinegar syndrome’ will be crucial to assess the performance of these systems in real-world scenarios. Additionally, optimizing the methods for loading nanoparticles into both paper and xerogels should be considered. The use of more sustainable xerogels as an alternative to PVF could also be recommended for future applications. Nonetheless, the results presented in this paper provided a promising proof of concept for the efficacy of inorganic nanoparticles and represent a crucial starting point for evaluating these inorganic-organic nanocomposite systems as innovative inhibitors for the ’vinegar syndrome’ in CA-based motion picture films.
Author Contributions
Conceptualization, L.D., E.C., and F.P.; methodology, F.P., L.D., M.D., and E.C.; validation, F.P., L.D., M.D., and E.C.; formal analysis, L.D., F.P., and E.C.; investigation, F.P., L.L., M.D., C.D. S.B., and E.C..; data curation, F.P.,L.D., S.B., and E.C.; writing—original draft preparation, F.P., and L.D.; writing—review and editing, L.D., M.D., and E.C.; funding acquisition, L.D., M.D., and E.C. All authors have read and agreed to the published version of the manuscript.
Funding
This research was funded by University of Florence Fondi d’Ateneo per la Ricerca, and and by CSGI Consortium.
Review Board Statement
Not applicable.
Institutional Informed Consent Statement
Not applicable.
Data Availability Statement
Data are contained within the article.
Acknowledgments
Thanks are due to the University of Florence for financial support, PhD Course funds and University Research funds provided to the Chemistry Department “Ugo Schiff”. Special thanks go to Dr. Maura Pischedda and Dr. Zoé Rodriguez for their support in setting up the experiments with real motion picture films, to Dr. Rita Gelli for her assistance during SEM analysis and to Dr. Samuele Ciattini and Laura Chelazzi from the CRIST (Centro di Servizi di Cristallografia Strutturale, University of Florence, Italy) for the assistance during XRD and micro-TOM analyses.
Conflicts of Interest
The authors declare no conflicts of interest.
References
- P. Read; M.P. Meyer Restoration of Motion Picture Film; Butterwort.; Oxford, 2000; ISBN 2013206534.
- Valverde, M. Photographic Negatives: Nature and Evolution of Processes. 2005, 9–18.
- McGath, M.; Jordan-Mowery, S.; Pollei, M.; Heslip, S.; Baty, J. Cellulose Acetate Lamination: A Literature Review and Survey of Paper-Based Collections in the United States. Restaurator 2015, 36, 333–365. [Google Scholar] [CrossRef]
- Reilly, J.M. IPI Storage Guide for Acetate Film. Journal of the American Institute for Conservation 1994, 33, 321. [Google Scholar] [CrossRef]
- Ram, A.T. Archival Preservation of Photographic Films-A Perspective. Polym Degrad Stab 1990, 29, 3–29. [Google Scholar] [CrossRef]
- Shashoua, Y. Conservation of Plastics: Materials Science, Degradation and Preservation; Elsevier Ltd.: Oxford, 2008; ISBN 2013206534. [Google Scholar]
- Lavédrine, B. A Guide to the Preventive Conservation of Photograph Collections; Getty Publ.; Los Angeles, 2003; ISBN 9788527729833.
- D. , N. Strategies for the Storage of Cellulose Acetate Film. AIC News 2015, 40, 6–7. [Google Scholar]
- Bigourdan, J.L.; Adelstein, P.Z.; Reilly, J.M. Use of Microenvironments for the Preservation of Cellulose Triacetate Photographic Film. Journal of Imaging Science and Technology 1998, 42, 155–162. [Google Scholar] [CrossRef]
- Bigourdan, J.-L.; Adelstein, P.Z.; Reilly, J.M. Effect of Paper Alkaline Reserve on the Chemical Stability of Acetate Base Sheet Film. 2000, 7, 43–54.
- Yamamoto, D.; Ishii, T.; Hashimoto, A.; Matsui, K. Use of Sodium Carbonate and Sodium Polyacrylate for the Prevention of Vinegar Syndrome. Imaging Science Journal 2019, 67, 171–178. [Google Scholar] [CrossRef]
- Dedecker, K.; Pillai, R.S.; Nouar, F.; Steunou, N.; Dumas, E.; Maurin, G.; Serre, C.; Pinto, L. Metal-Organic Frameworks for Cultural Heritage Preservation : The Case of Acetic Acid Removal. 2018. [CrossRef]
- Dedecker, K.; Pillai, R.; Nouar, F.; Pires, J.; Steunou, N.; Dumas, E.; Maurin, G.; Serre, C.; Pinto, M.; Dedecker, K.; et al. Metal-Organic Frameworks for Cultural Heritage Preservation : The Case of Acetic Acid Removal To Cite This Version : HAL Id : Hal-01791096. 2021.
- Mohtar, A. Al; Severino, M.I.; Tignol, P.; Ranza, L.; Neves, A.; Nouar, F.; Pimenta, V.; Lopes, J.; Ramos, A.M.; Rodrigo, J.I.L.; et al. Iron(III) Based Metal-Organic Frameworks in Cellulose Acetate Film Preservation: Fundamental Aspects and First Application. J Cult Herit 2024, 66, 236–243. [Google Scholar] [CrossRef]
- Al Mohtar, A.; Pinto, M.L.; Neves, A.; Nunes, S.; Zappi, D.; Varani, G.; Ramos, A.M.; Melo, M.J.; Wallaszkovits, N.; Lahoz Rodrigo, J.I.; et al. Decision Making Based on Hybrid Modeling Approach Applied to Cellulose Acetate Based Historical Films Conservation. Sci Rep 2021, 11, 1–13. [Google Scholar] [CrossRef]
- Baglioni, P.; Chelazzi, D. Nanoscience for the Conservation of Works of Art; RSC Publishing, 2013.
- Giorgi, R.; Dei, L.; Ceccato, M.; Schettino, C.; Baglioni, P. Nanotechnologies for Conservation of Cultural Heritage: Paper and Canvas Deacidification. Langmuir 2002, 18, 8198–8203. [Google Scholar] [CrossRef]
- Giorgi, R.; Chelazzi, D.; Fratini, E.; Langer, S.; Niklasson, A.; Rådemar, M.; Svensson, J.E.; Baglioni, P. Nanoparticles of Calcium Hydroxide for Wood Deacidification: Decreasing the Emissions of Organic Acid Vapours in Church Organ Environments. J Cult Herit 2009, 10, 206–213. [Google Scholar] [CrossRef]
- Zuliani, A.; Bandelli, D.; Chelazzi, D.; Giorgi, R.; Baglioni, P. Environmentally Friendly ZnO/Castor Oil Polyurethane Composites for the Gas-Phase Adsorption of Acetic Acid. J Colloid Interface Sci 2022, 614, 451–459. [Google Scholar] [CrossRef] [PubMed]
- Zuliani, A.; Chelazzi, D.; Mastrangelo, R.; Giorgi, R.; Baglioni, P. Adsorption Kinetics of Acetic Acid into ZnO/Castor Oil-Derived Polyurethanes. J Colloid Interface Sci 2023, 632, 74–86. [Google Scholar] [CrossRef] [PubMed]
- Porpora, F.; Dei, L.; Maiano, A.M.; Carretti, E. Artificial Induction of the “Vinegar Syndrome” in Cellulose Acetate Motion Picture Film and Multi-Analytical Protocol for Its Monitoring. J Cult Herit 2025, 71, 184–196. [Google Scholar] [CrossRef]
- Laoutid, F.; Lorgouilloux, M.; Bonnaud, L.; Lesueur, D.; Dubois, P. Fire Retardant Behaviour of Halogen-Free Calcium-Based Hydrated Minerals. Polym Degrad Stab 2017, 136, 89–97. [Google Scholar] [CrossRef]
- Pemberton, A.T.; Brandon, D.; King, D.A. Integrated TGA, FTIR, and Computational Laboratory Experiment. 2018. [CrossRef]
- Niu, S.; Han, K.; Lu, C.; Sun, R. Thermogravimetric Analysis of the Relationship among Calcium Magnesium Acetate, Calcium Acetate and Magnesium Acetate. Appl Energy 2010, 87, 2237–2242. [Google Scholar] [CrossRef]
- Bilton, M.; Brown, A.P.; Milne, S.J. Investigating the Optimum Conditions for the Formation of Calcium Oxide, Used for CO 2 Sequestration, by Thermal Decomposition of Calcium Acetate. Journal of Physics: Conference Series OPEN ACCESS 2012, 371, 12075. [Google Scholar] [CrossRef]
- Horzum, N.; Hilal, M.E.; Isik, T. Enhanced Bactericidal and Photocatalytic Activities of ZnO Nanostructures by Changing the Cooling Route. New Journal of Chemistry 2018, 42, 11831–11838. [Google Scholar] [CrossRef]
- Ghule, A.V.; Ghule, K.; Chen, C.-Y.; Chen, W.-Y.; Tzing, S.-H.; Chang, H.; Ling, Y.-C. In Situ Thermo-TOF-SIMS Study of Thermal Decomposition of Zinc Acetate Dihydrate. JOURNAL OF MASS SPECTROMETRY J. Mass Spectrom 2004, 39, 1202–1208. [Google Scholar] [CrossRef]
- Lin, C.C.; Li, Y.Y. Synthesis of ZnO Nanowires by Thermal Decomposition of Zinc Acetate Dihydrate. Mater Chem Phys 2009, 113, 334–337. [Google Scholar] [CrossRef]
- Ambrosi, M.; Dei, L.; Giorgi, R.; Neto, C.; Baglioni, P. Colloidal Particles of Ca(OH)2: Properties and Applications to Restoration of Frescoes. Langmuir 2001, 17, 4251–4255. [Google Scholar] [CrossRef]
- Bette, S.; Eggert, G.; Emmerling, S.; Etter, M.; Schleid, T.; Dinnebier, R.E. Crystal Structure, Polymorphism, and Anisotropic Thermal Expansion of α-Ca(CH3COO)2. Cryst Growth Des 2020, 20, 5346–5355. [Google Scholar] [CrossRef]
- Yin, H.; Casey, P.S. ZnO Nanorod Composite with Quenched Photoactivity for UV Protection Application. Mater Lett 2014, 121, 8–11. [Google Scholar] [CrossRef]
- Zuliani, A.; Bandelli, D.; Chelazzi, D.; Giorgi, R.; Baglioni, P. Environmentally Friendly ZnO/Castor Oil Polyurethane Composites for the Gas-Phase Adsorption of Acetic Acid. J Colloid Interface Sci 2022, 614, 451–459. [Google Scholar] [CrossRef]
- Heinze, T.; Liebert, T. Celluloses and Polyoses/Hemicelluloses; Elsevier B.V., 2012; Vol. 10; ISBN 9780080878621.
- Fei, P.; Liao, L.; Cheng, B.; Song, J. Quantitative Analysis of Cellulose Acetate with a High Degree of Substitution by FTIR and Its Application. Analytical Methods 2017, 9, 6194–6201. [Google Scholar] [CrossRef]
- Nunes, S.; Neves, A.; Ramos, A.M. Quantification of the Degree of Substitution as a Diagnostic Tool for Assessing the Conservation Condition of Cellulose Nitrate and Acetate Collections.
- Chavez Lozano, M.V.; Elsässer, C.; Angelin, E.M.; Pamplona, M. Shedding Light on Degradation Gradients in Celluloid: An ATR-FTIR Study of Artificially and Naturally Aged Specimens. Polymers (Basel) 2023, 15. [Google Scholar] [CrossRef]
- Al Mohtar, A.; Nunes, S.; Silva, J.; Ramos, A.M.; Lopes, J.; Pinto, M.L. First-Principles Model to Evaluate Quantitatively the Long-Life Behavior of Cellulose Acetate Polymers. ACS Omega 2021, 6, 8028–8037. [Google Scholar] [CrossRef]
- Bigourdan, J.-L.; Adelstein, P.Z.; Reilly, J.M. Acetic Acid and Paper Alkaline Reserve, Assessment of a Pratical Situation in Film Preservation. In Proceedings of the ICOM Committee for Conservation 11th Triennial Meeting Edinburgh 1-6 September 1996; James & James (Science Publishers) Ltd., 1996; Vol. II, pp. 573–579.
- Institute, I.P. User’s Guide for A-D Strips; Seventh Edition 1/22, 2022.
- Fischer, M.C.; Robb, A. Guidelines for Care & Identification of Film-Base Photographic Materials. Topics Photogr Preserv 1993, 5, 117–122. [Google Scholar]
- Hammon, H.G. United States Patent Office: METHOD OF MAKING A SPONGE MATE RAL AND THE PRODUCT RESULTING THEREFROM. United States Patent Office 1994, 28, 131–134. [Google Scholar]
- Wilson, C.L. United States Patent Office: METHOD OF MAKING EXPANDED POLY WNY, ALCOHOL-FORMALDEHYDE REAC TON PRODUCT AND PRODUCT RESULT NG THERE FROM. United States Patent Office 1994, 28, 131–134. [Google Scholar]
- Minju, N.; Ananthakumar, S.; Savithri, S. Superswelling Hybrid Sponge from Water Glass for Selective Absorption of Crude Oil and Organic Solvents. ACS Omega 2019, 4, 17990–18001. [Google Scholar] [CrossRef]
- Pan, Y.; Wang, W.; Peng, C.; Shi, K.; Luo, Y.; Ji, X. Novel Hydrophobic Polyvinyl Alcohol-Formaldehyde Foams for Organic Solvents Absorption and Effective Separation. RSC Adv 2014, 4, 660–669. [Google Scholar] [CrossRef]
- Pan, Y.; Shi, K.; Liu, Z.; Wang, W.; Peng, C.; Ji, X. Synthesis of a New Kind of Macroporous Polyvinyl-Alcohol Formaldehyde Based Sponge and Its Water Superabsorption Performance. RSC Adv 2015, 5, 78780–78789. [Google Scholar] [CrossRef]
- Li, Y.; Deng, J.; Zhang, J. Porous Poly(Vinyl Formal) Foam Prepared Using Poly(Vinyl Alcohol) of Low Degree of Polymerization. Polym Int 2018, 67, 1438–1444. [Google Scholar] [CrossRef]
Figure 1.
Adsorbed AcOHad% after the adsorption test (6 days, Eq. 1, orange) and after the desorption test AcOHconvert.% (48 hours under vacuum, Eq. 2, purple) for Ca(OH)2, CaCO3/Ca(OH)2, ZnO nanoparticles, and CaCO3 micropowder.
Figure 1.
Adsorbed AcOHad% after the adsorption test (6 days, Eq. 1, orange) and after the desorption test AcOHconvert.% (48 hours under vacuum, Eq. 2, purple) for Ca(OH)2, CaCO3/Ca(OH)2, ZnO nanoparticles, and CaCO3 micropowder.
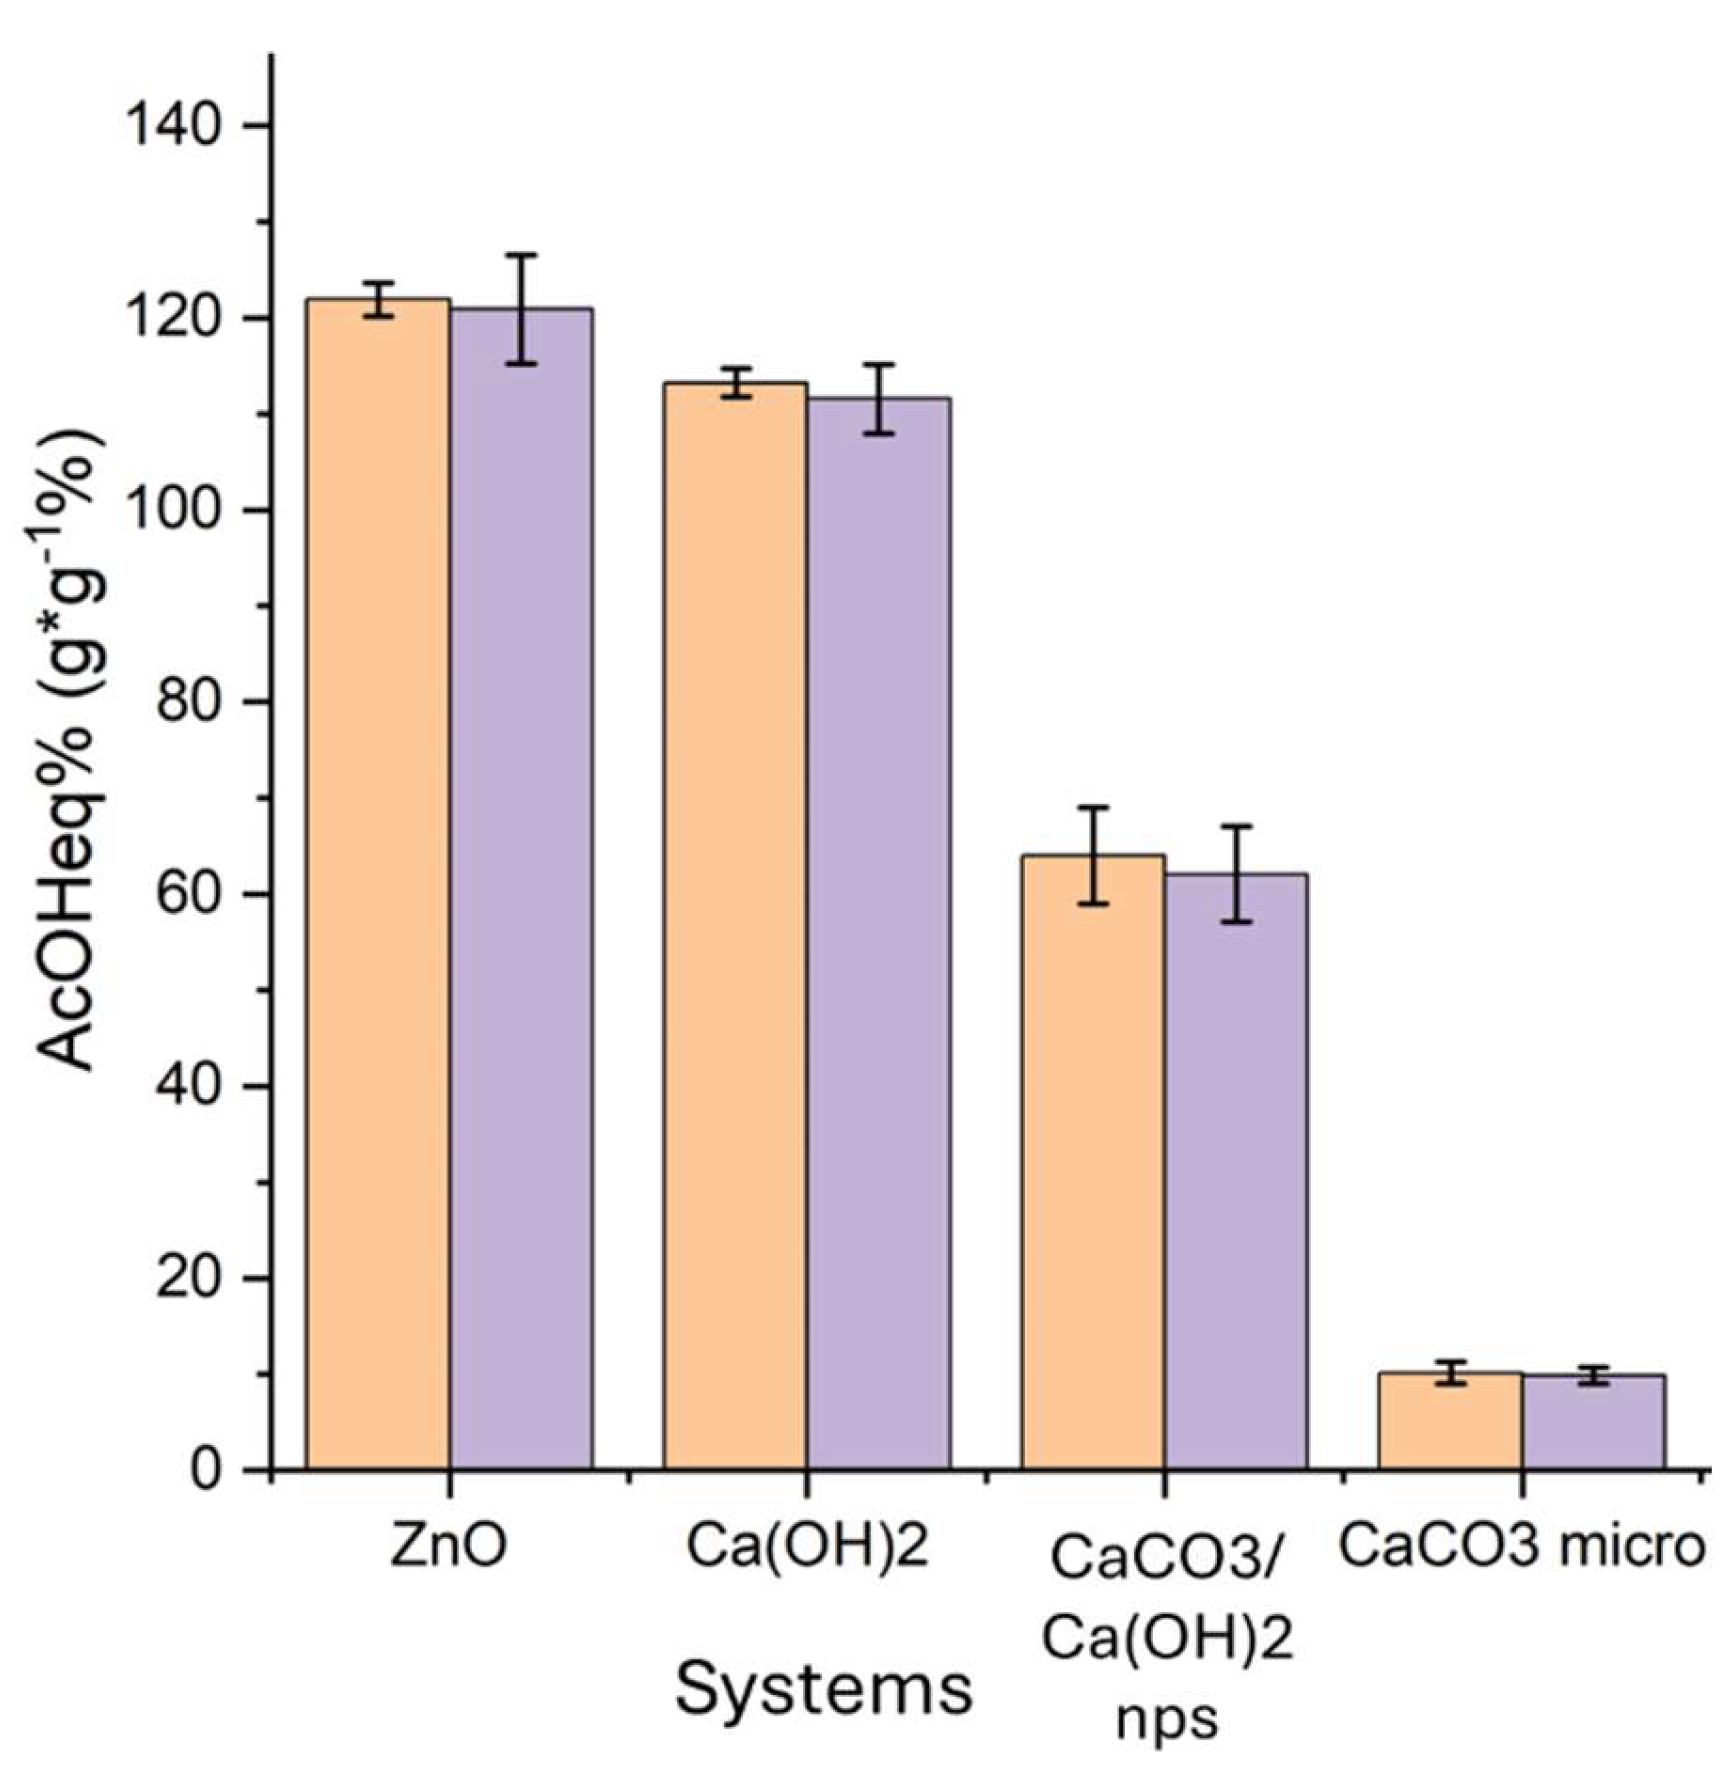
Figure 2.
XRD diffractograms collected for (A) Ca(OH)2 nanoparticles before (black) and after (red) acetic acid adsorption test, peaks assigned to calcium hydroxide (portlandite, PDF 44-1481) are labeled with “*”, and to calcium acetate hydrate (PDF 19-0199) with “+”; (B) ZnO nanoparticles before (black) and after (red) acetic acid adsorption test, peaks assigned to zinc oxide (zincite PDF 04-020-0364) are labeled with “*” and to zinc acetate (PDF 02-064-1515) with “+”.
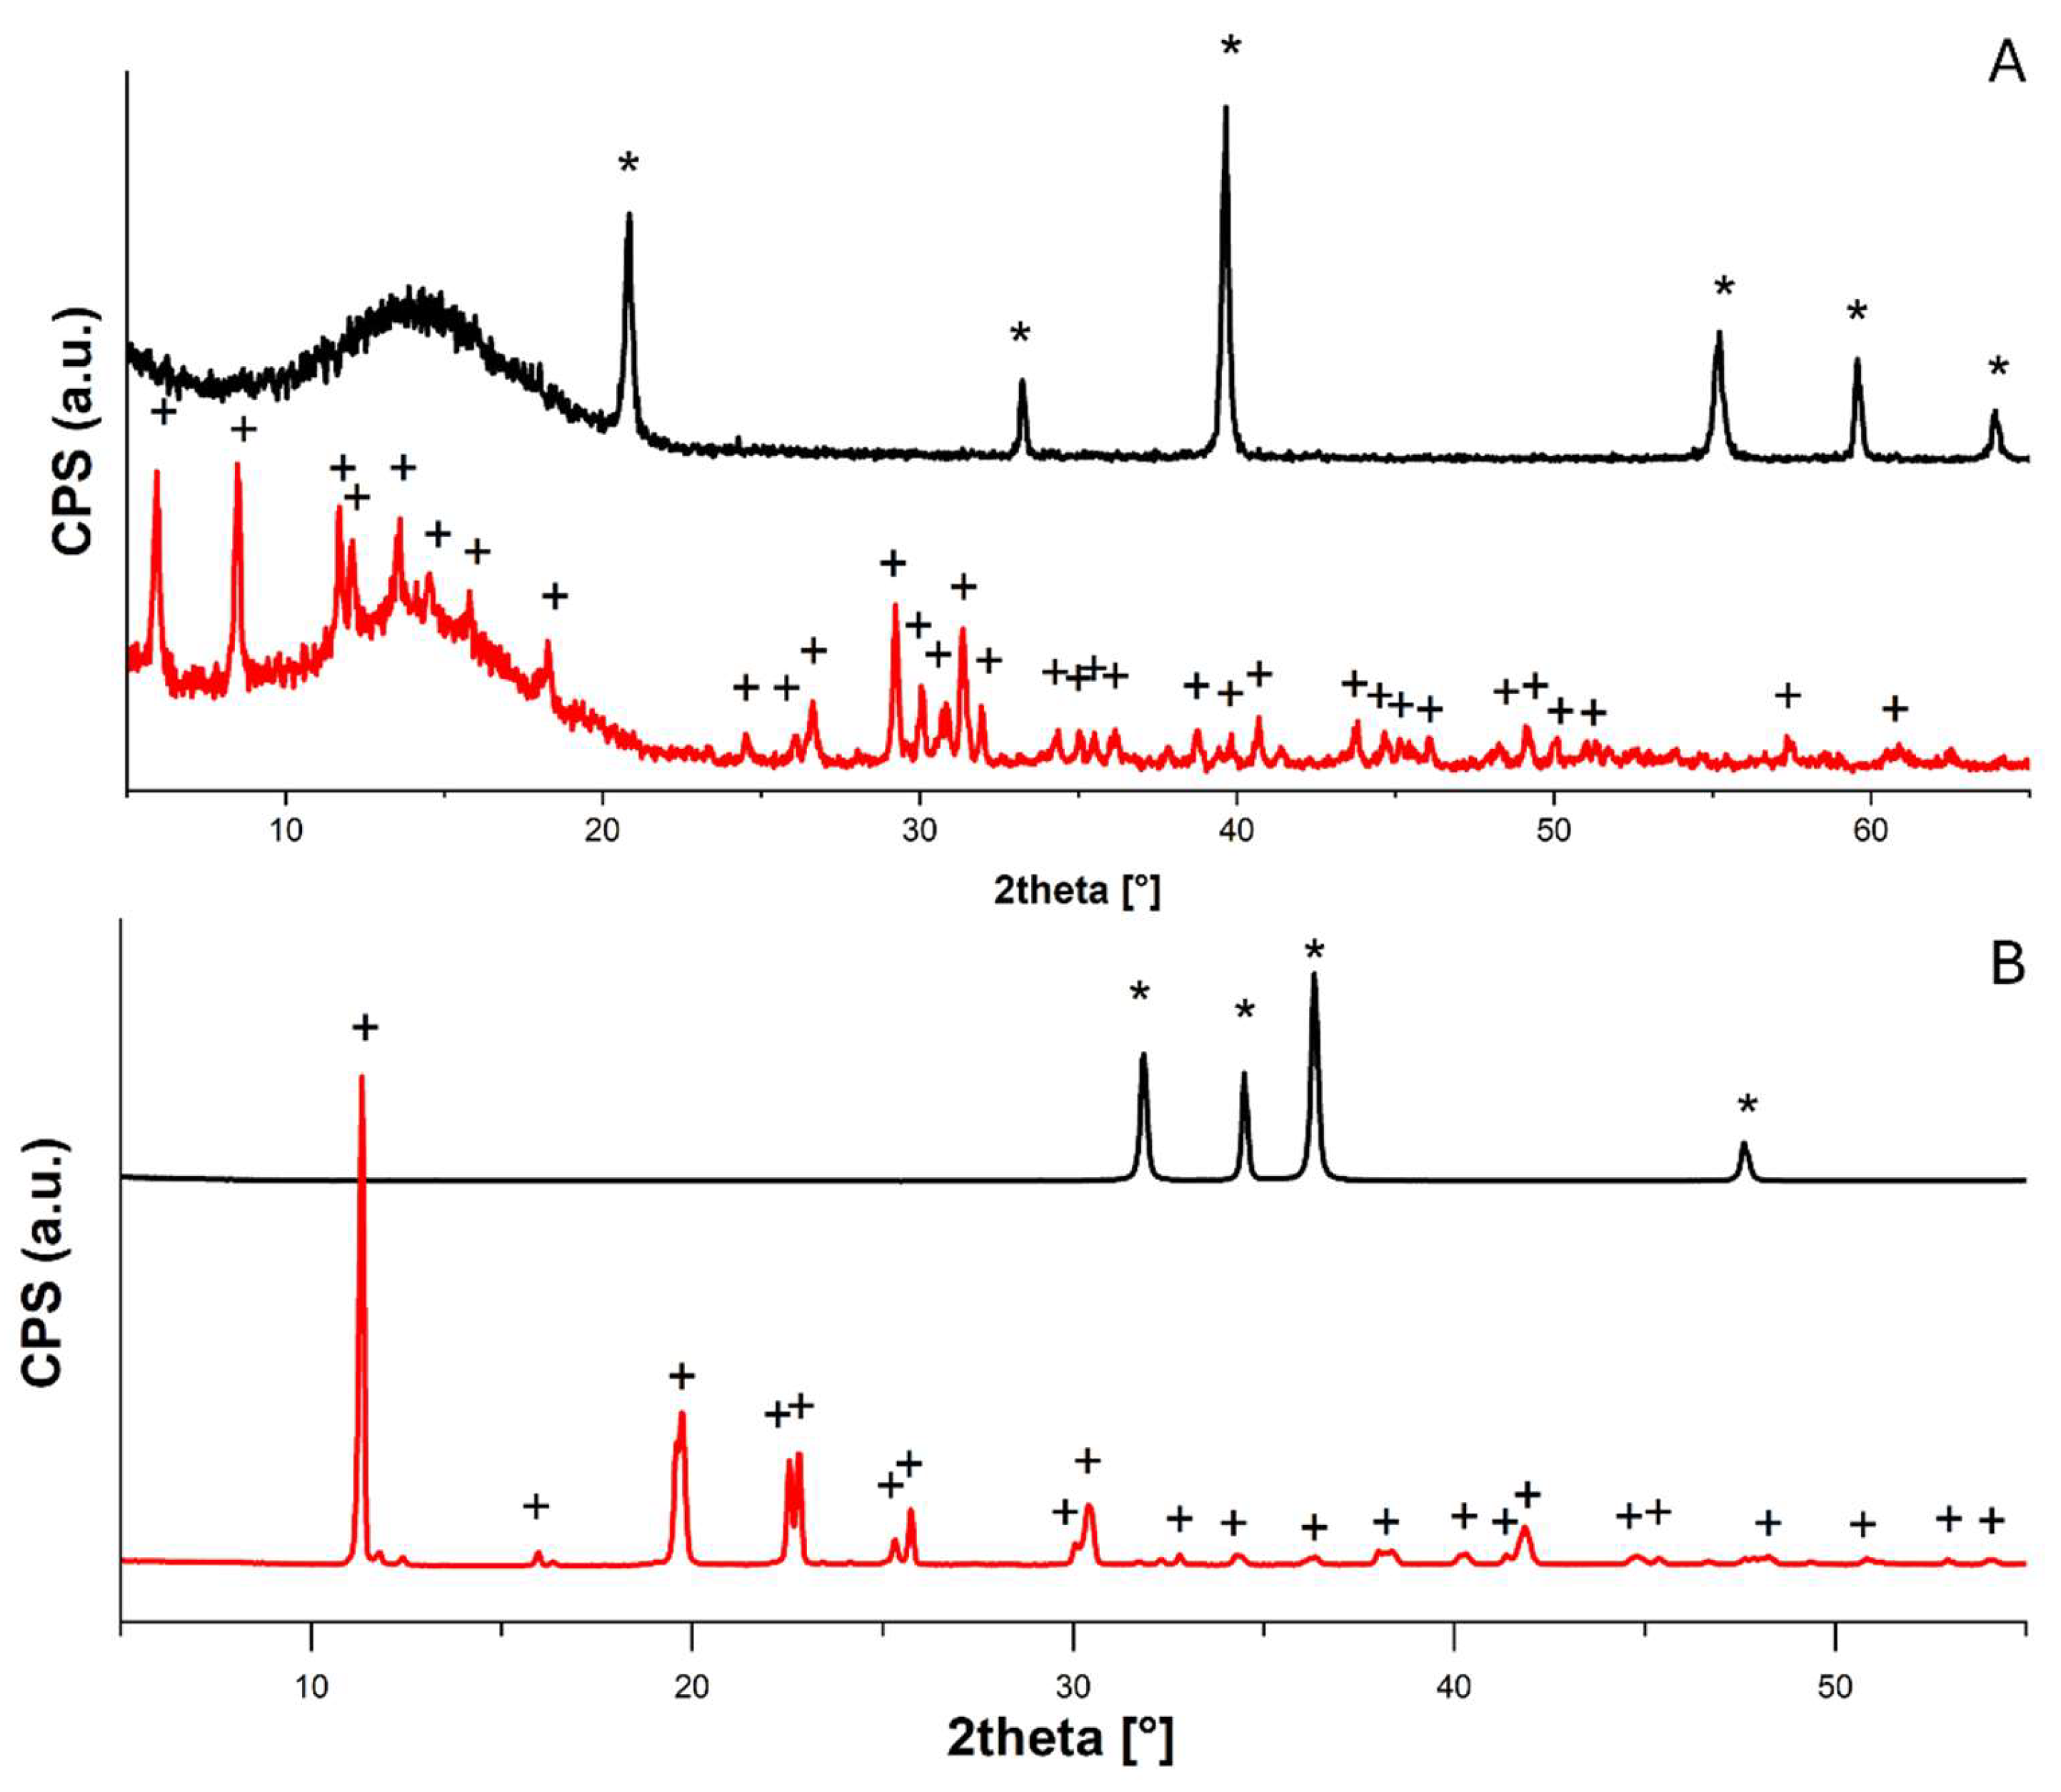
Figure 3.
XRD diffractograms collected for (A) CaCO3/Ca(OH)2 nanoparticles before (black) and after (red) acetic acid adsorption test, peaks assigned to calcite (PDF 83-0578), portlandite (PDF 44-1481), aragonite (PDF 75-2230) and vaterite (PDF 24-0030) are labeled with “*”, “°”. “#” and “§”, respectively, and to calcium acetate (PDF 19-0199) with “+”; (B) CaCO3 micropowder before (black) and after (red) acetic acid adsorption test, peaks assigned to calcite (PDF 83-0578) are labeled with “*”.
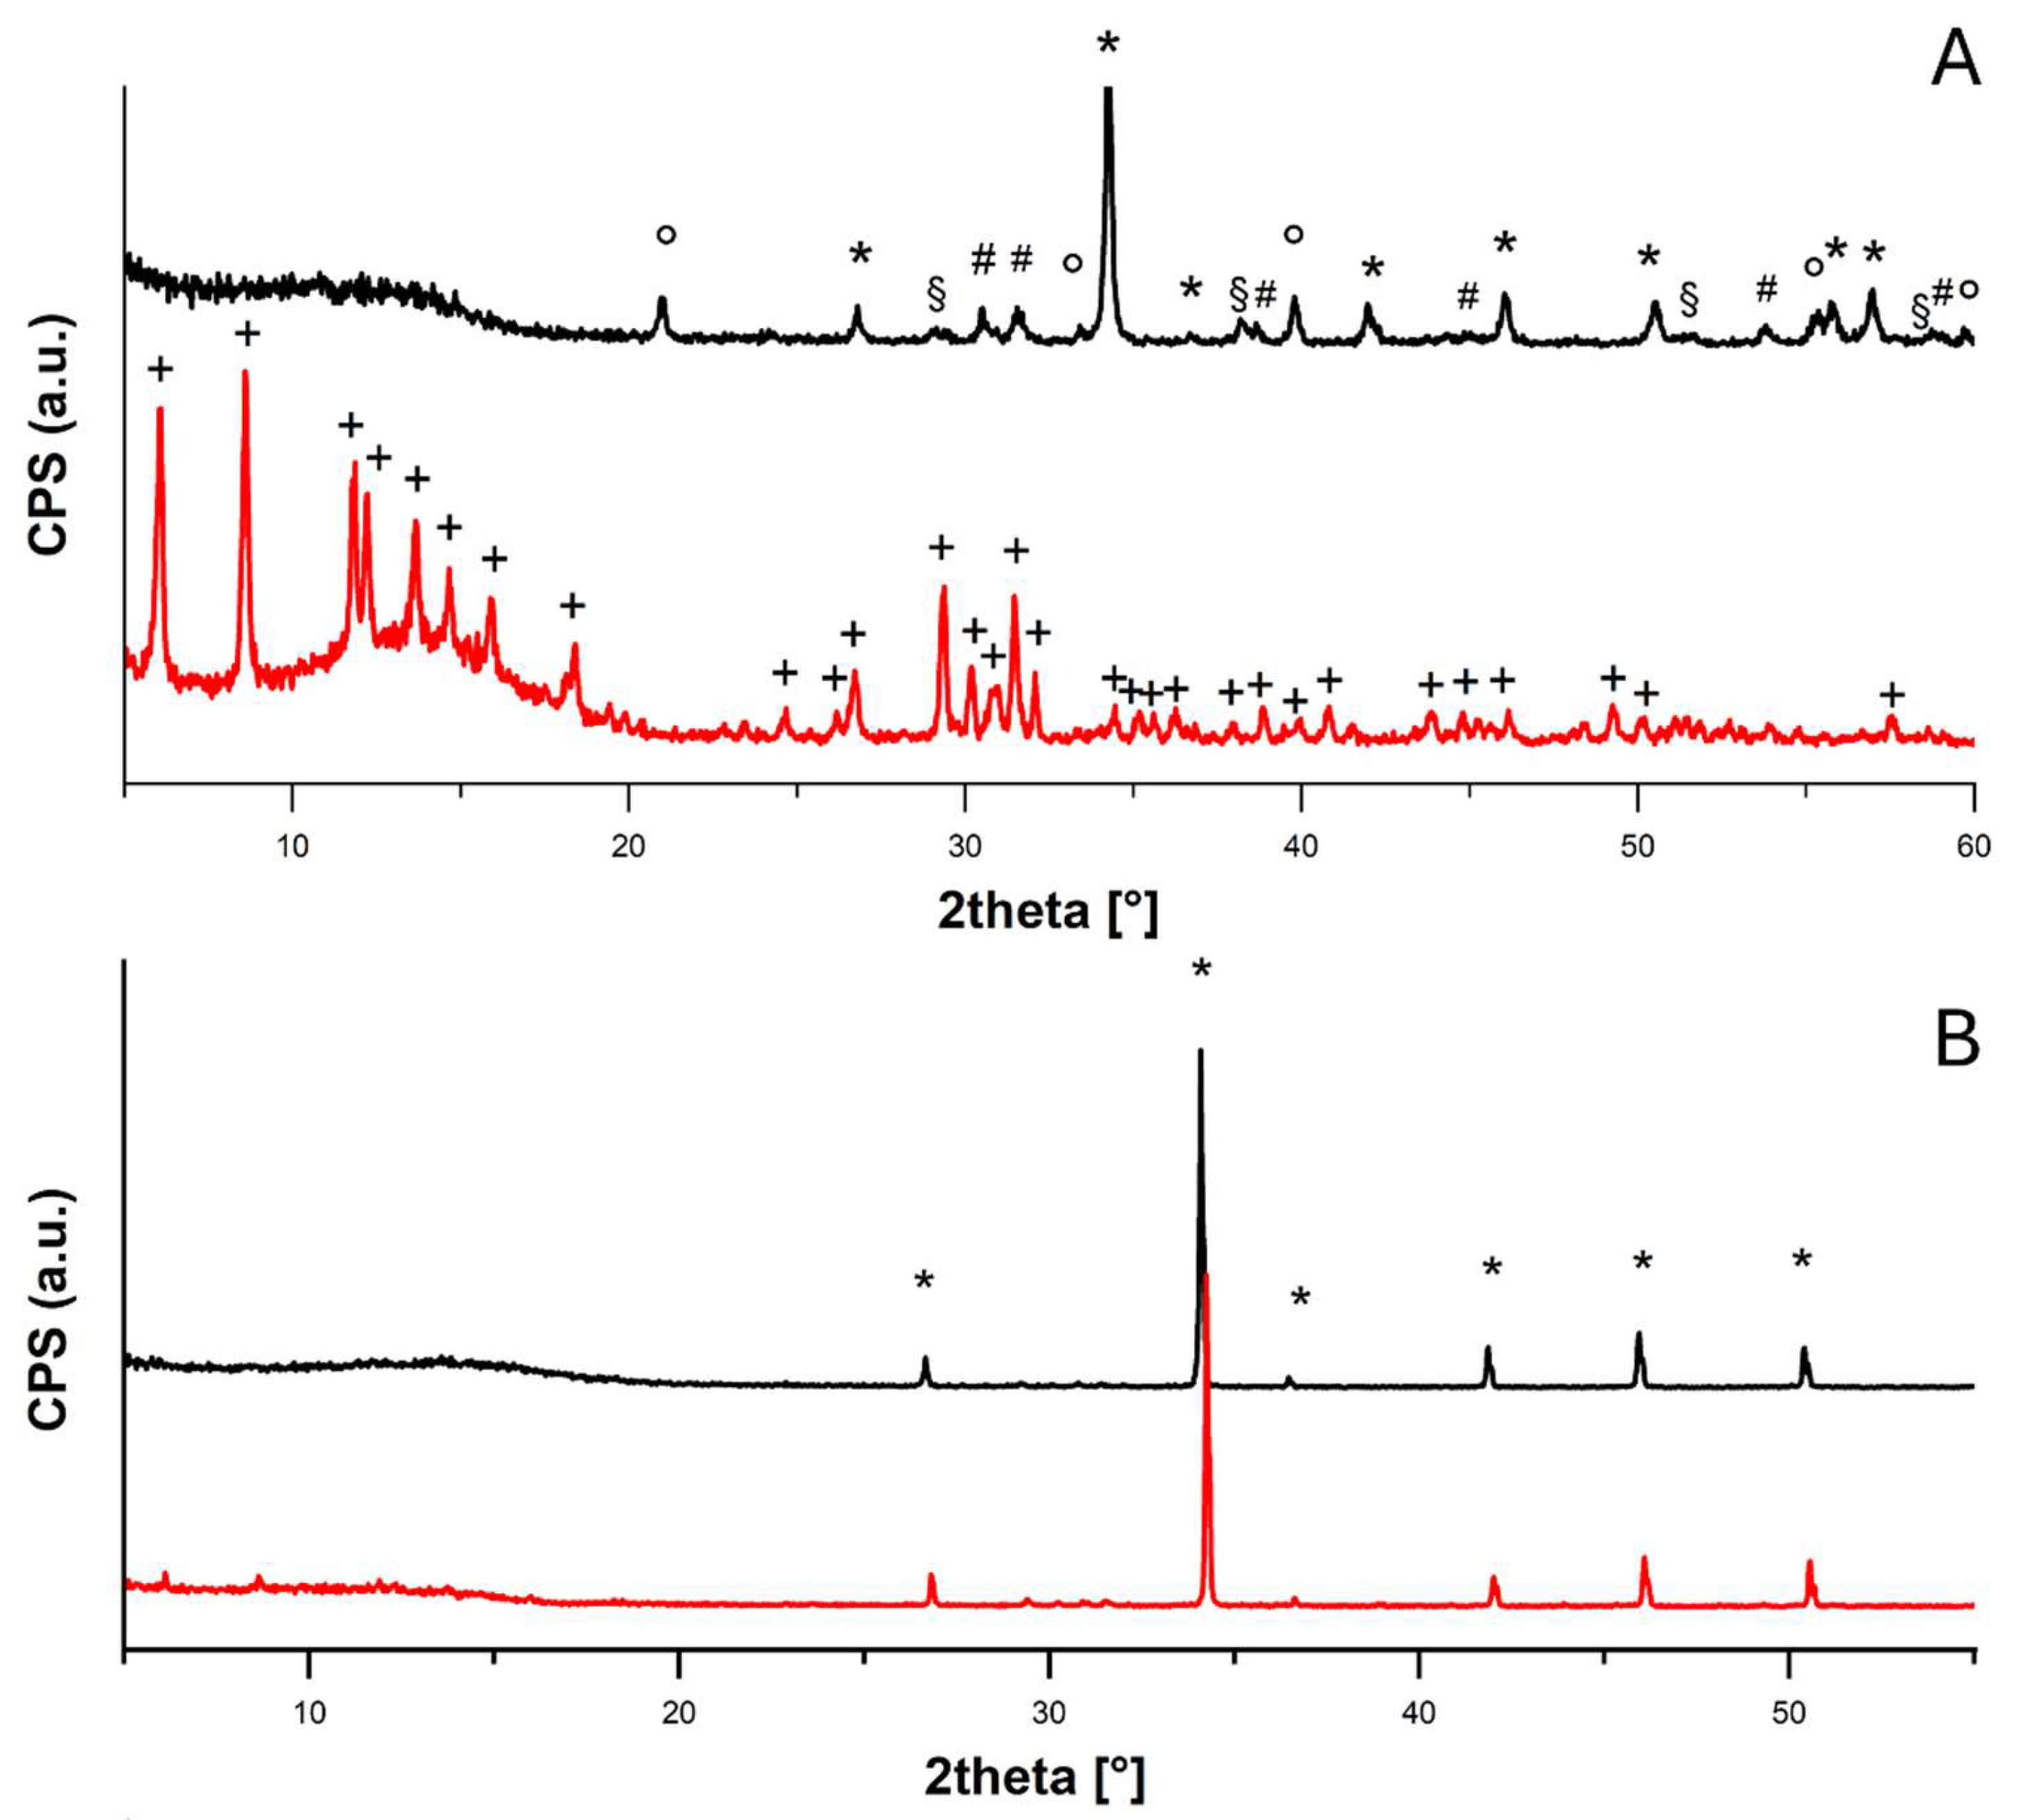
Figure 4.
TGA (solid line) and DTG (dashed line) profiles of (A) Ca(OH)2 nps, (B) ZnO nps and (C) CaCO3 nps before (black) and after (red) the adsorption test in glacial acetic acid.
Figure 4.
TGA (solid line) and DTG (dashed line) profiles of (A) Ca(OH)2 nps, (B) ZnO nps and (C) CaCO3 nps before (black) and after (red) the adsorption test in glacial acetic acid.
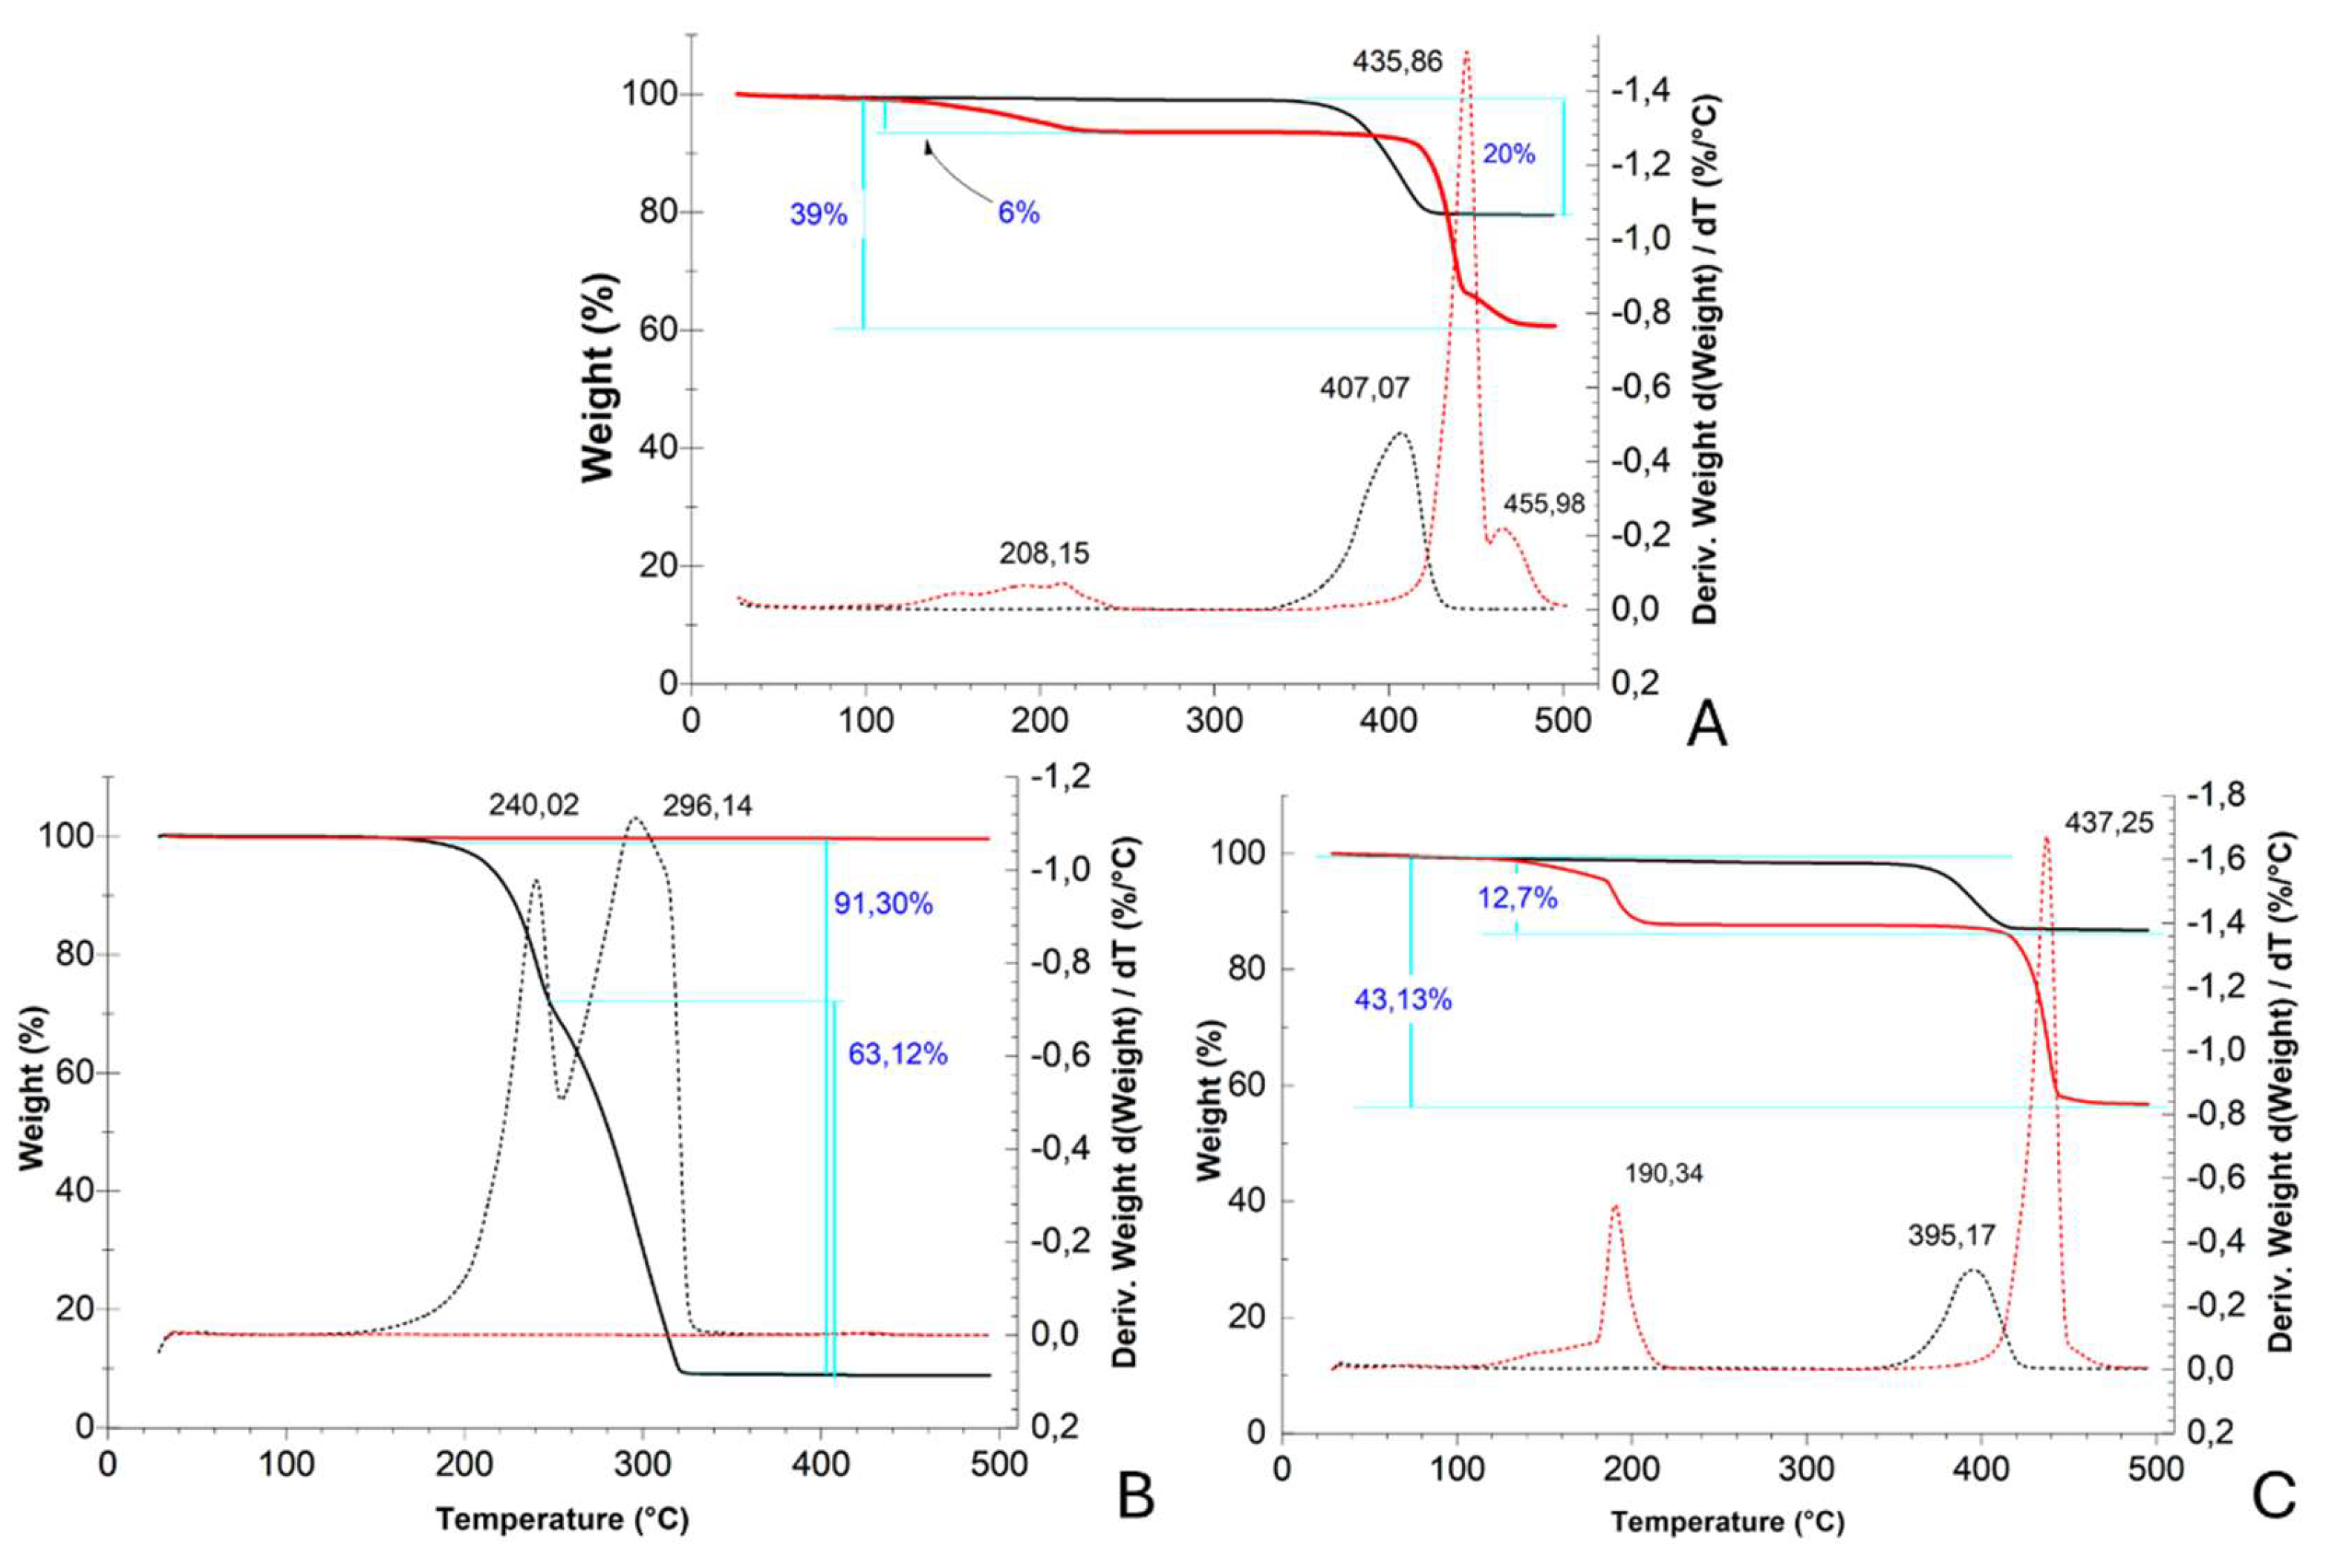
Figure 5.
SEM micrographs acquired for ZnO nanoparticles before (A) and after (B) the acetic acid adsorption test.
Figure 5.
SEM micrographs acquired for ZnO nanoparticles before (A) and after (B) the acetic acid adsorption test.
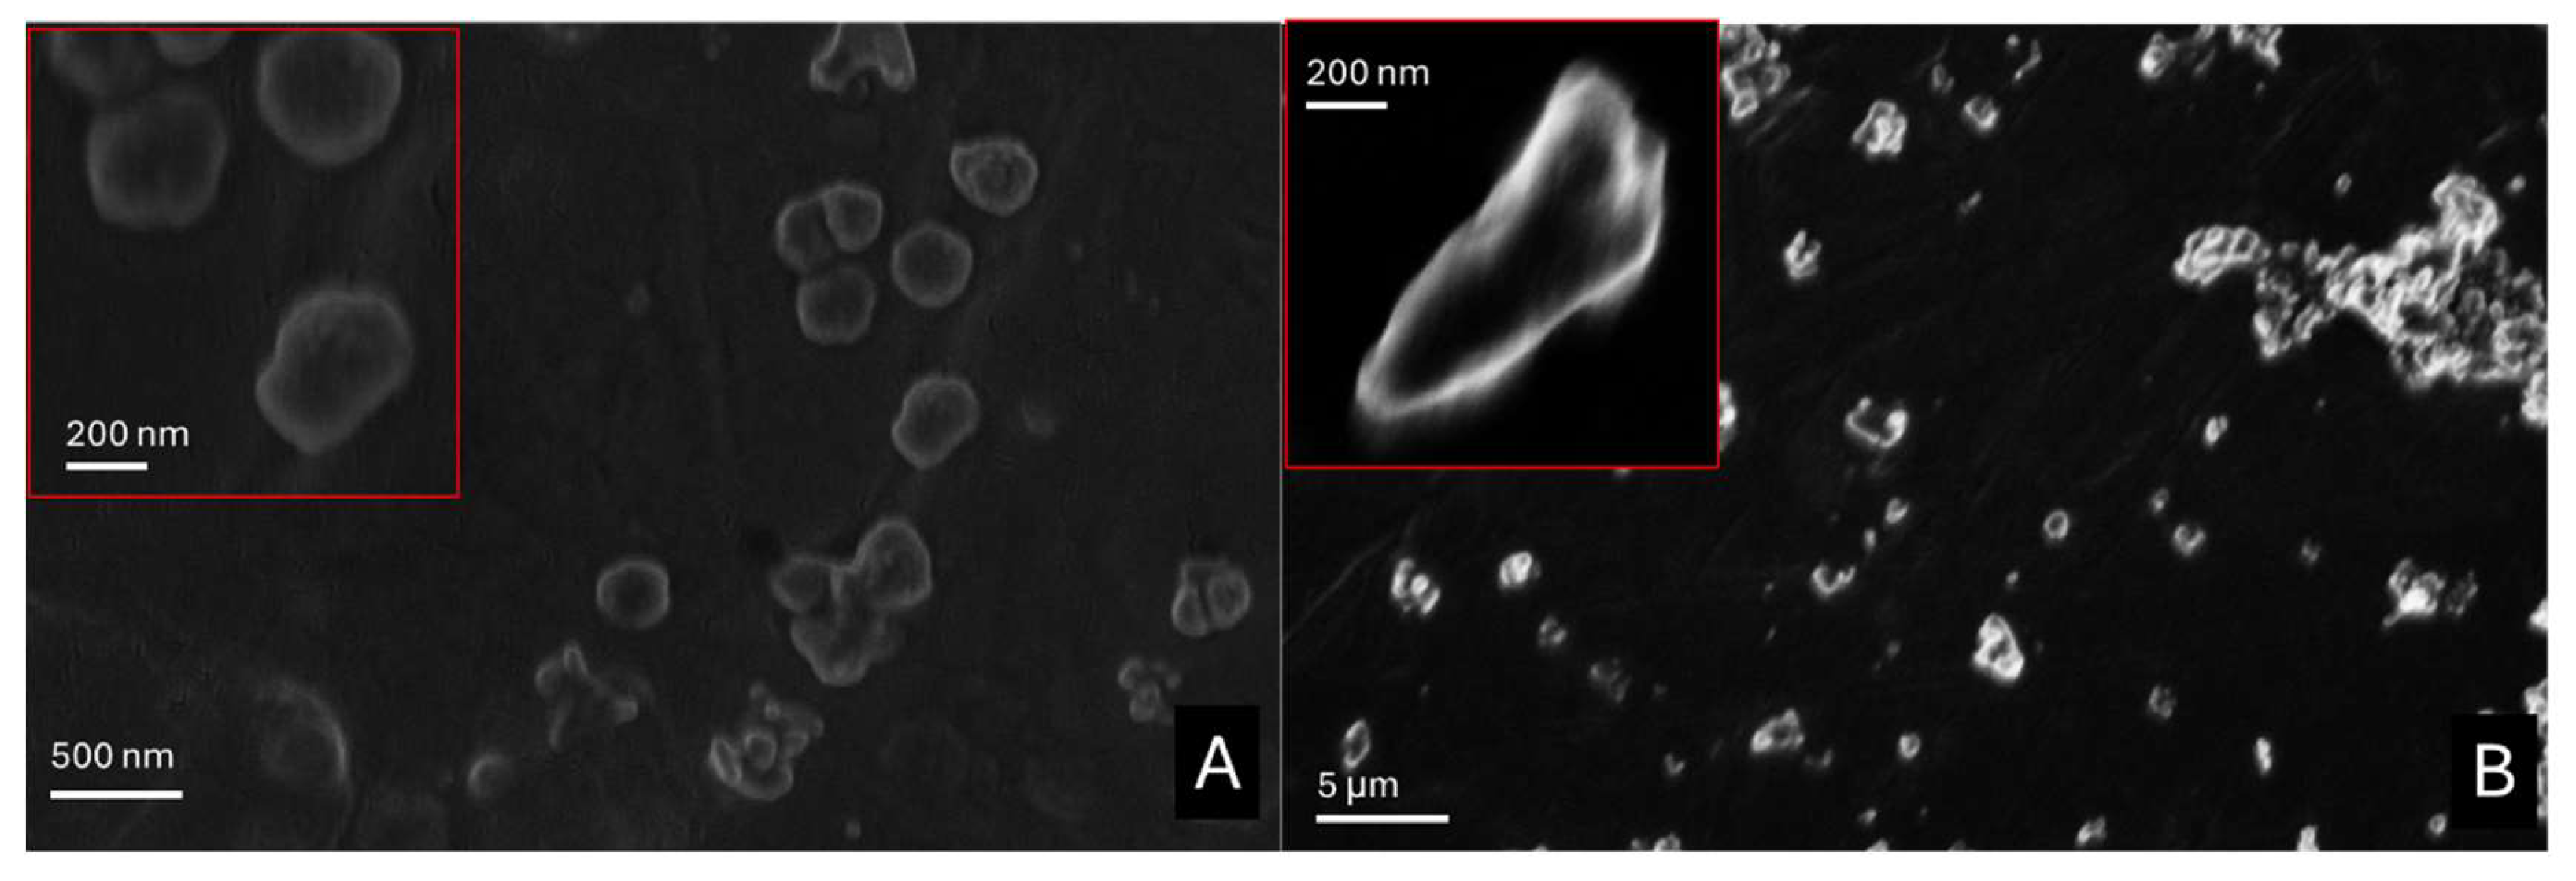
Figure 6.
Adsorbed AcOHad% after the adsorption test (6 days, Eq. 1, orange) and after the desorption test AcOHconvert.% (48 hours under vacuum, Eq. 3, purple) for PVF+ZnO, pure PVF, WP+ZnO, pure WP and ZnO nanoparticles.
Figure 6.
Adsorbed AcOHad% after the adsorption test (6 days, Eq. 1, orange) and after the desorption test AcOHconvert.% (48 hours under vacuum, Eq. 3, purple) for PVF+ZnO, pure PVF, WP+ZnO, pure WP and ZnO nanoparticles.
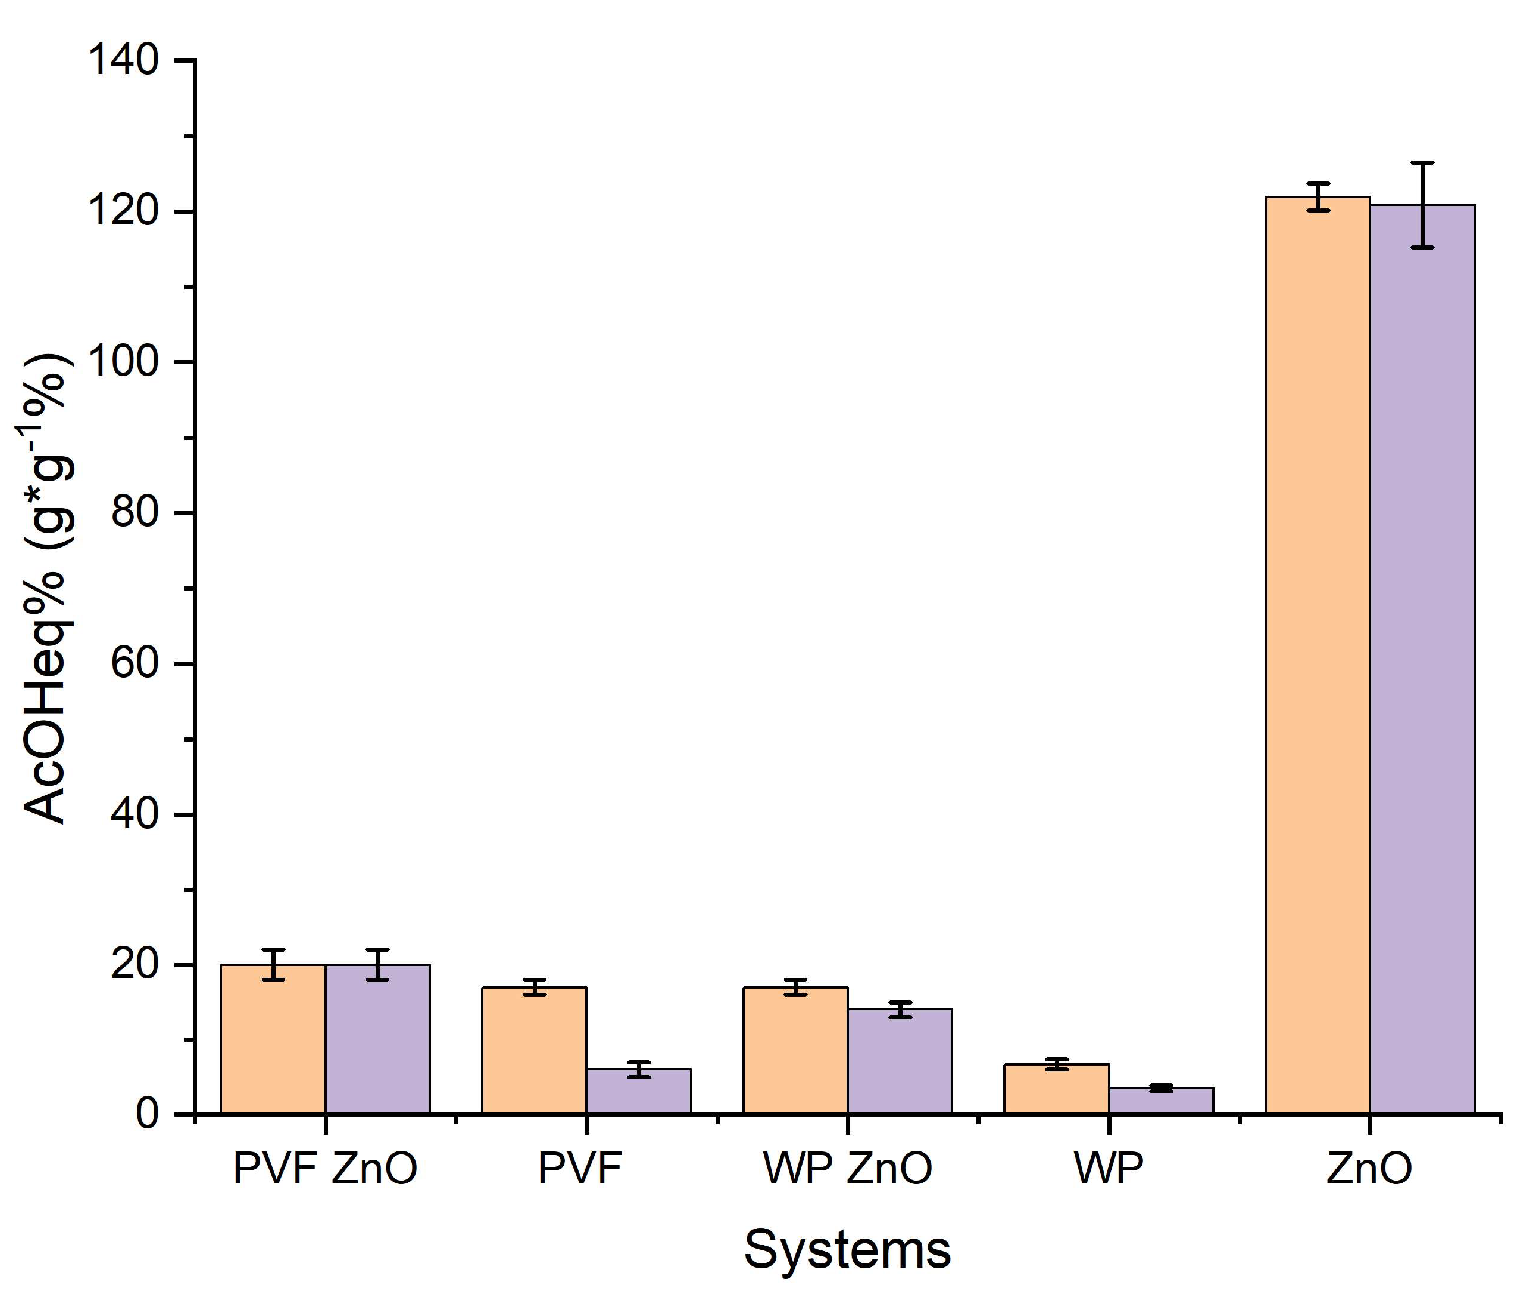
Figure 7.
FTIR-ATR spectra registered on WP-based (A) and PVF-based systems (B) uploaded with ZnO nanoparticles before (blue) and after (red) the adsorption test with glacial acetic acid vapors and the spectrum of glacial acetic acid (green). Peaks associated with the formation of zinc acetate are labeled with “*”.
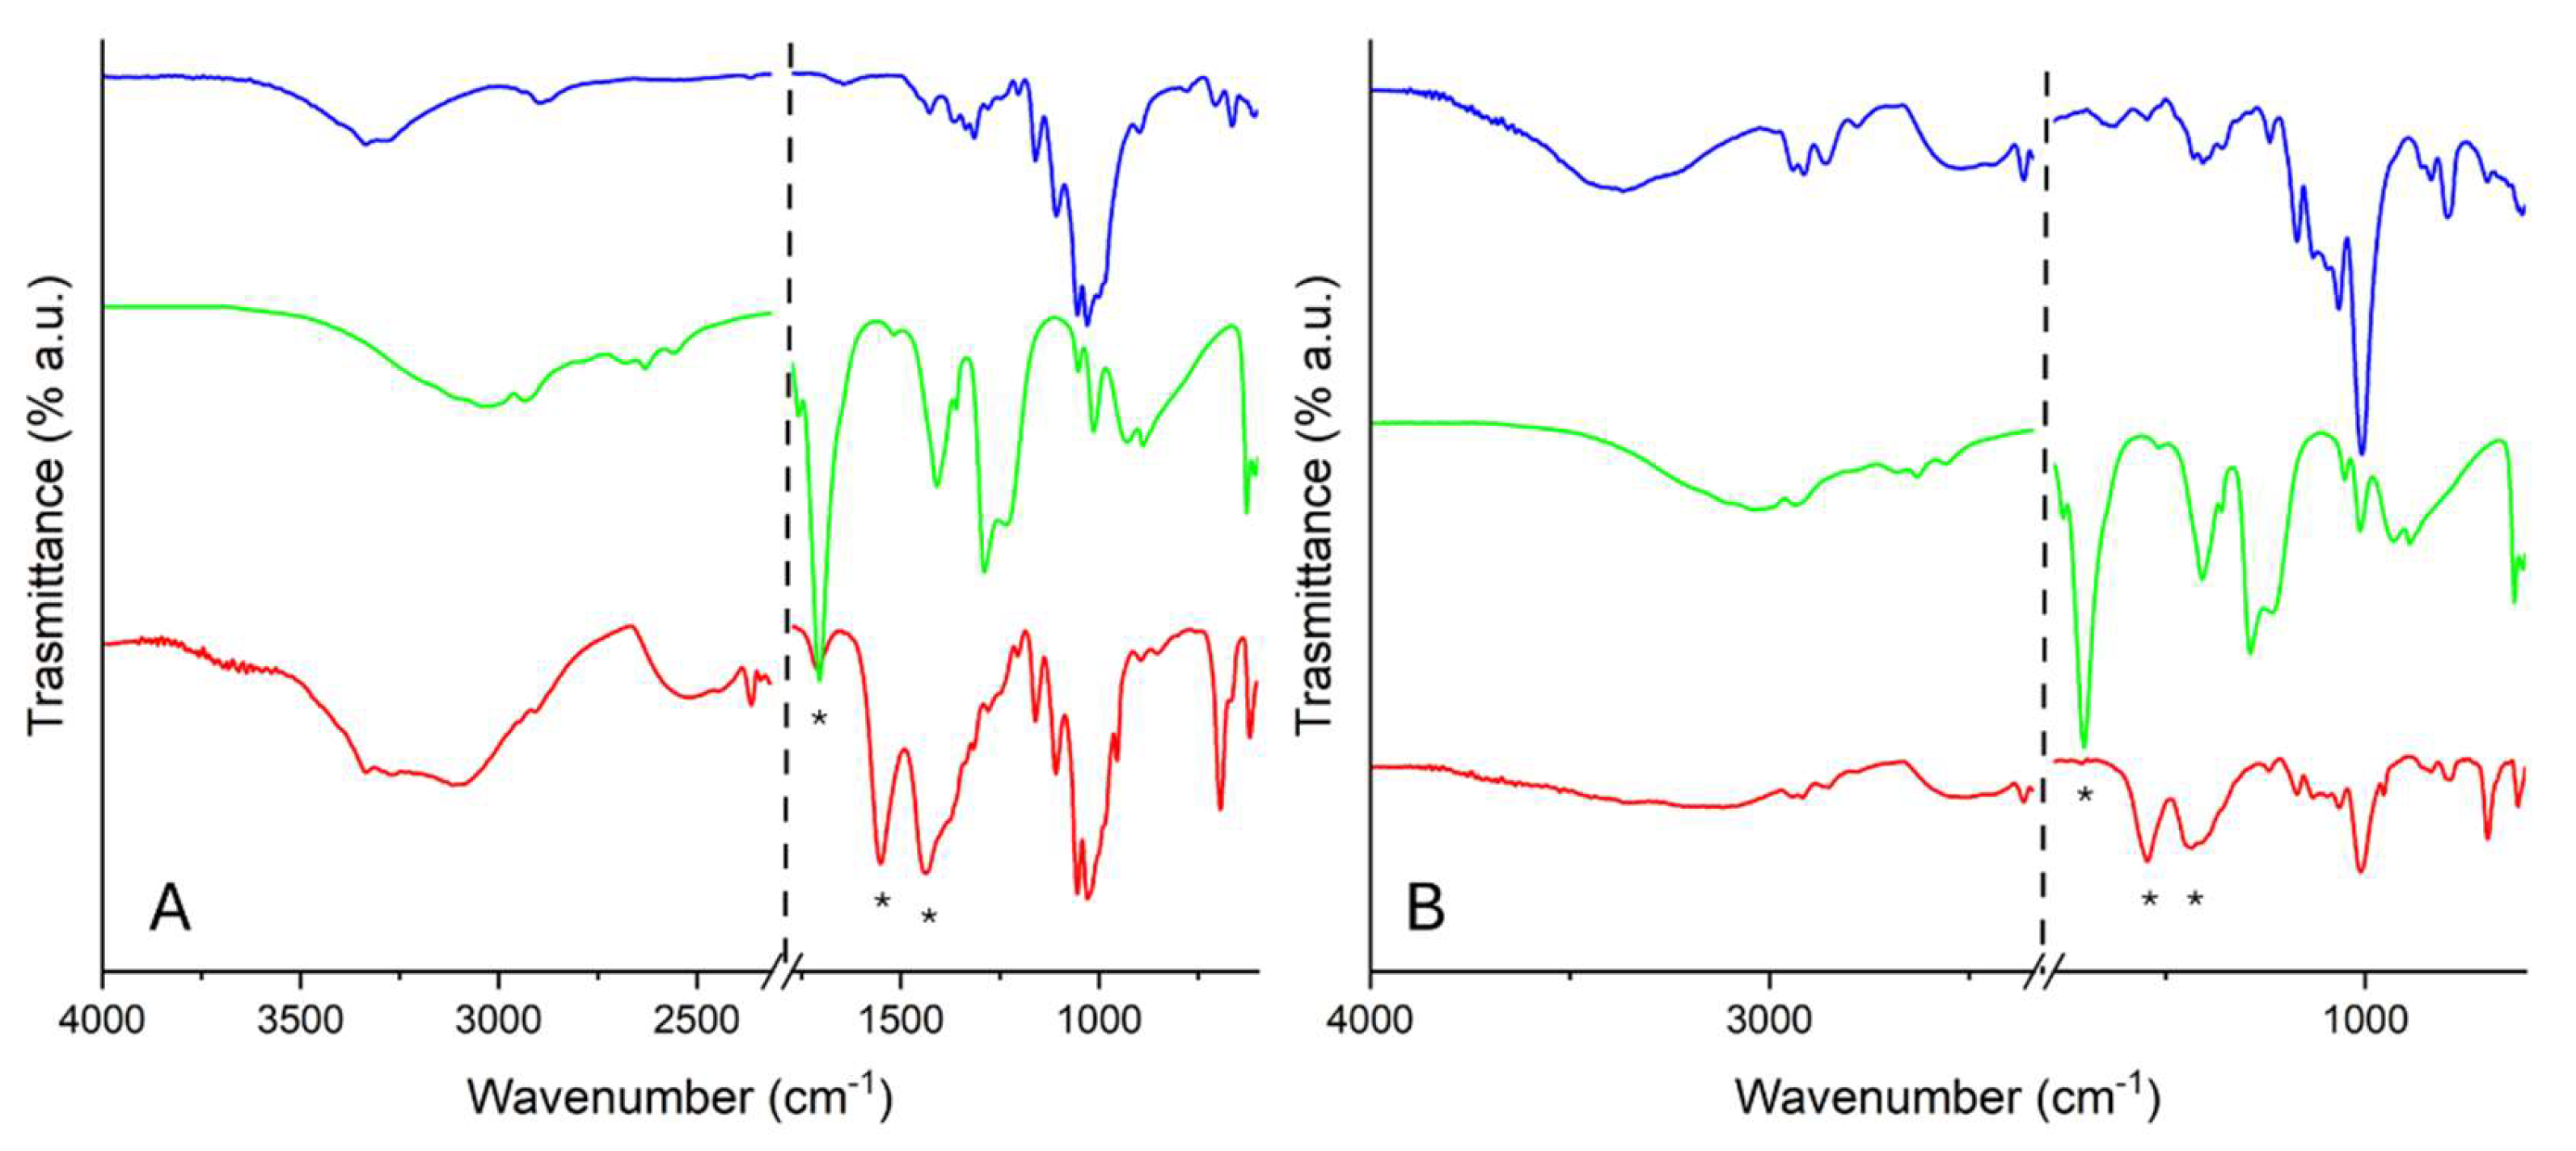
Figure 8.
TGA (solid line) and DTG (dashed line) profiles of WP-ZnO (A) and PVF-ZnO (B) before the adsorption test (black), after the adsorption test of acetic acid vapors (red) and after the desorption test (green).
Figure 8.
TGA (solid line) and DTG (dashed line) profiles of WP-ZnO (A) and PVF-ZnO (B) before the adsorption test (black), after the adsorption test of acetic acid vapors (red) and after the desorption test (green).
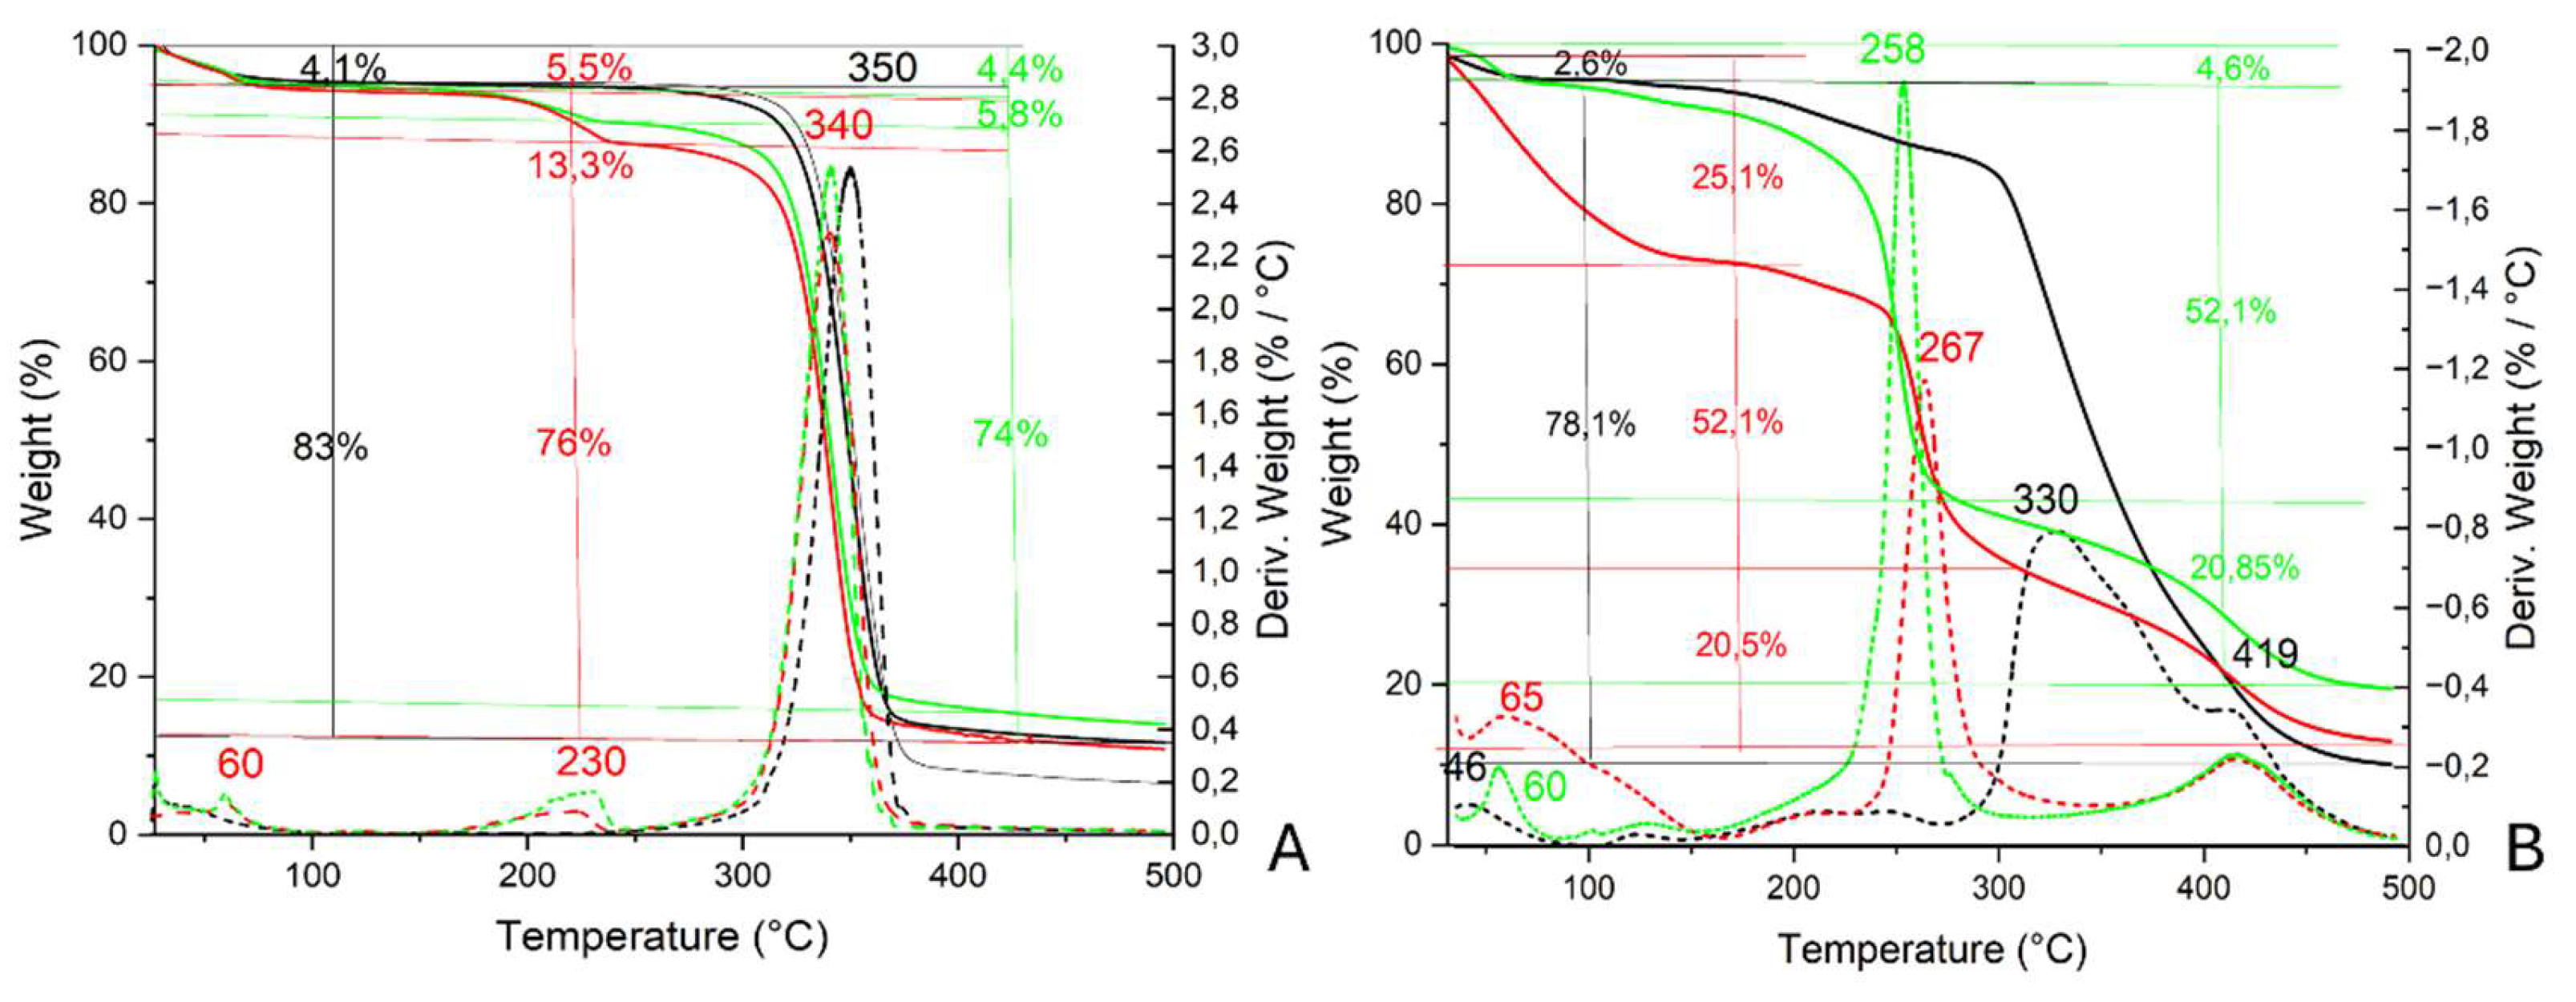
Figure 9.
Whatman paper soaked with ZnO nanoparticles (WP-ZnO) before (A) and after (B) the exposition to acetic acid vapors; PVF xerogels uploaded with ZnO nanoparticles (PVF-ZnO) before (C) and after (D) the exposition to acetic acid vapors.
Figure 9.
Whatman paper soaked with ZnO nanoparticles (WP-ZnO) before (A) and after (B) the exposition to acetic acid vapors; PVF xerogels uploaded with ZnO nanoparticles (PVF-ZnO) before (C) and after (D) the exposition to acetic acid vapors.
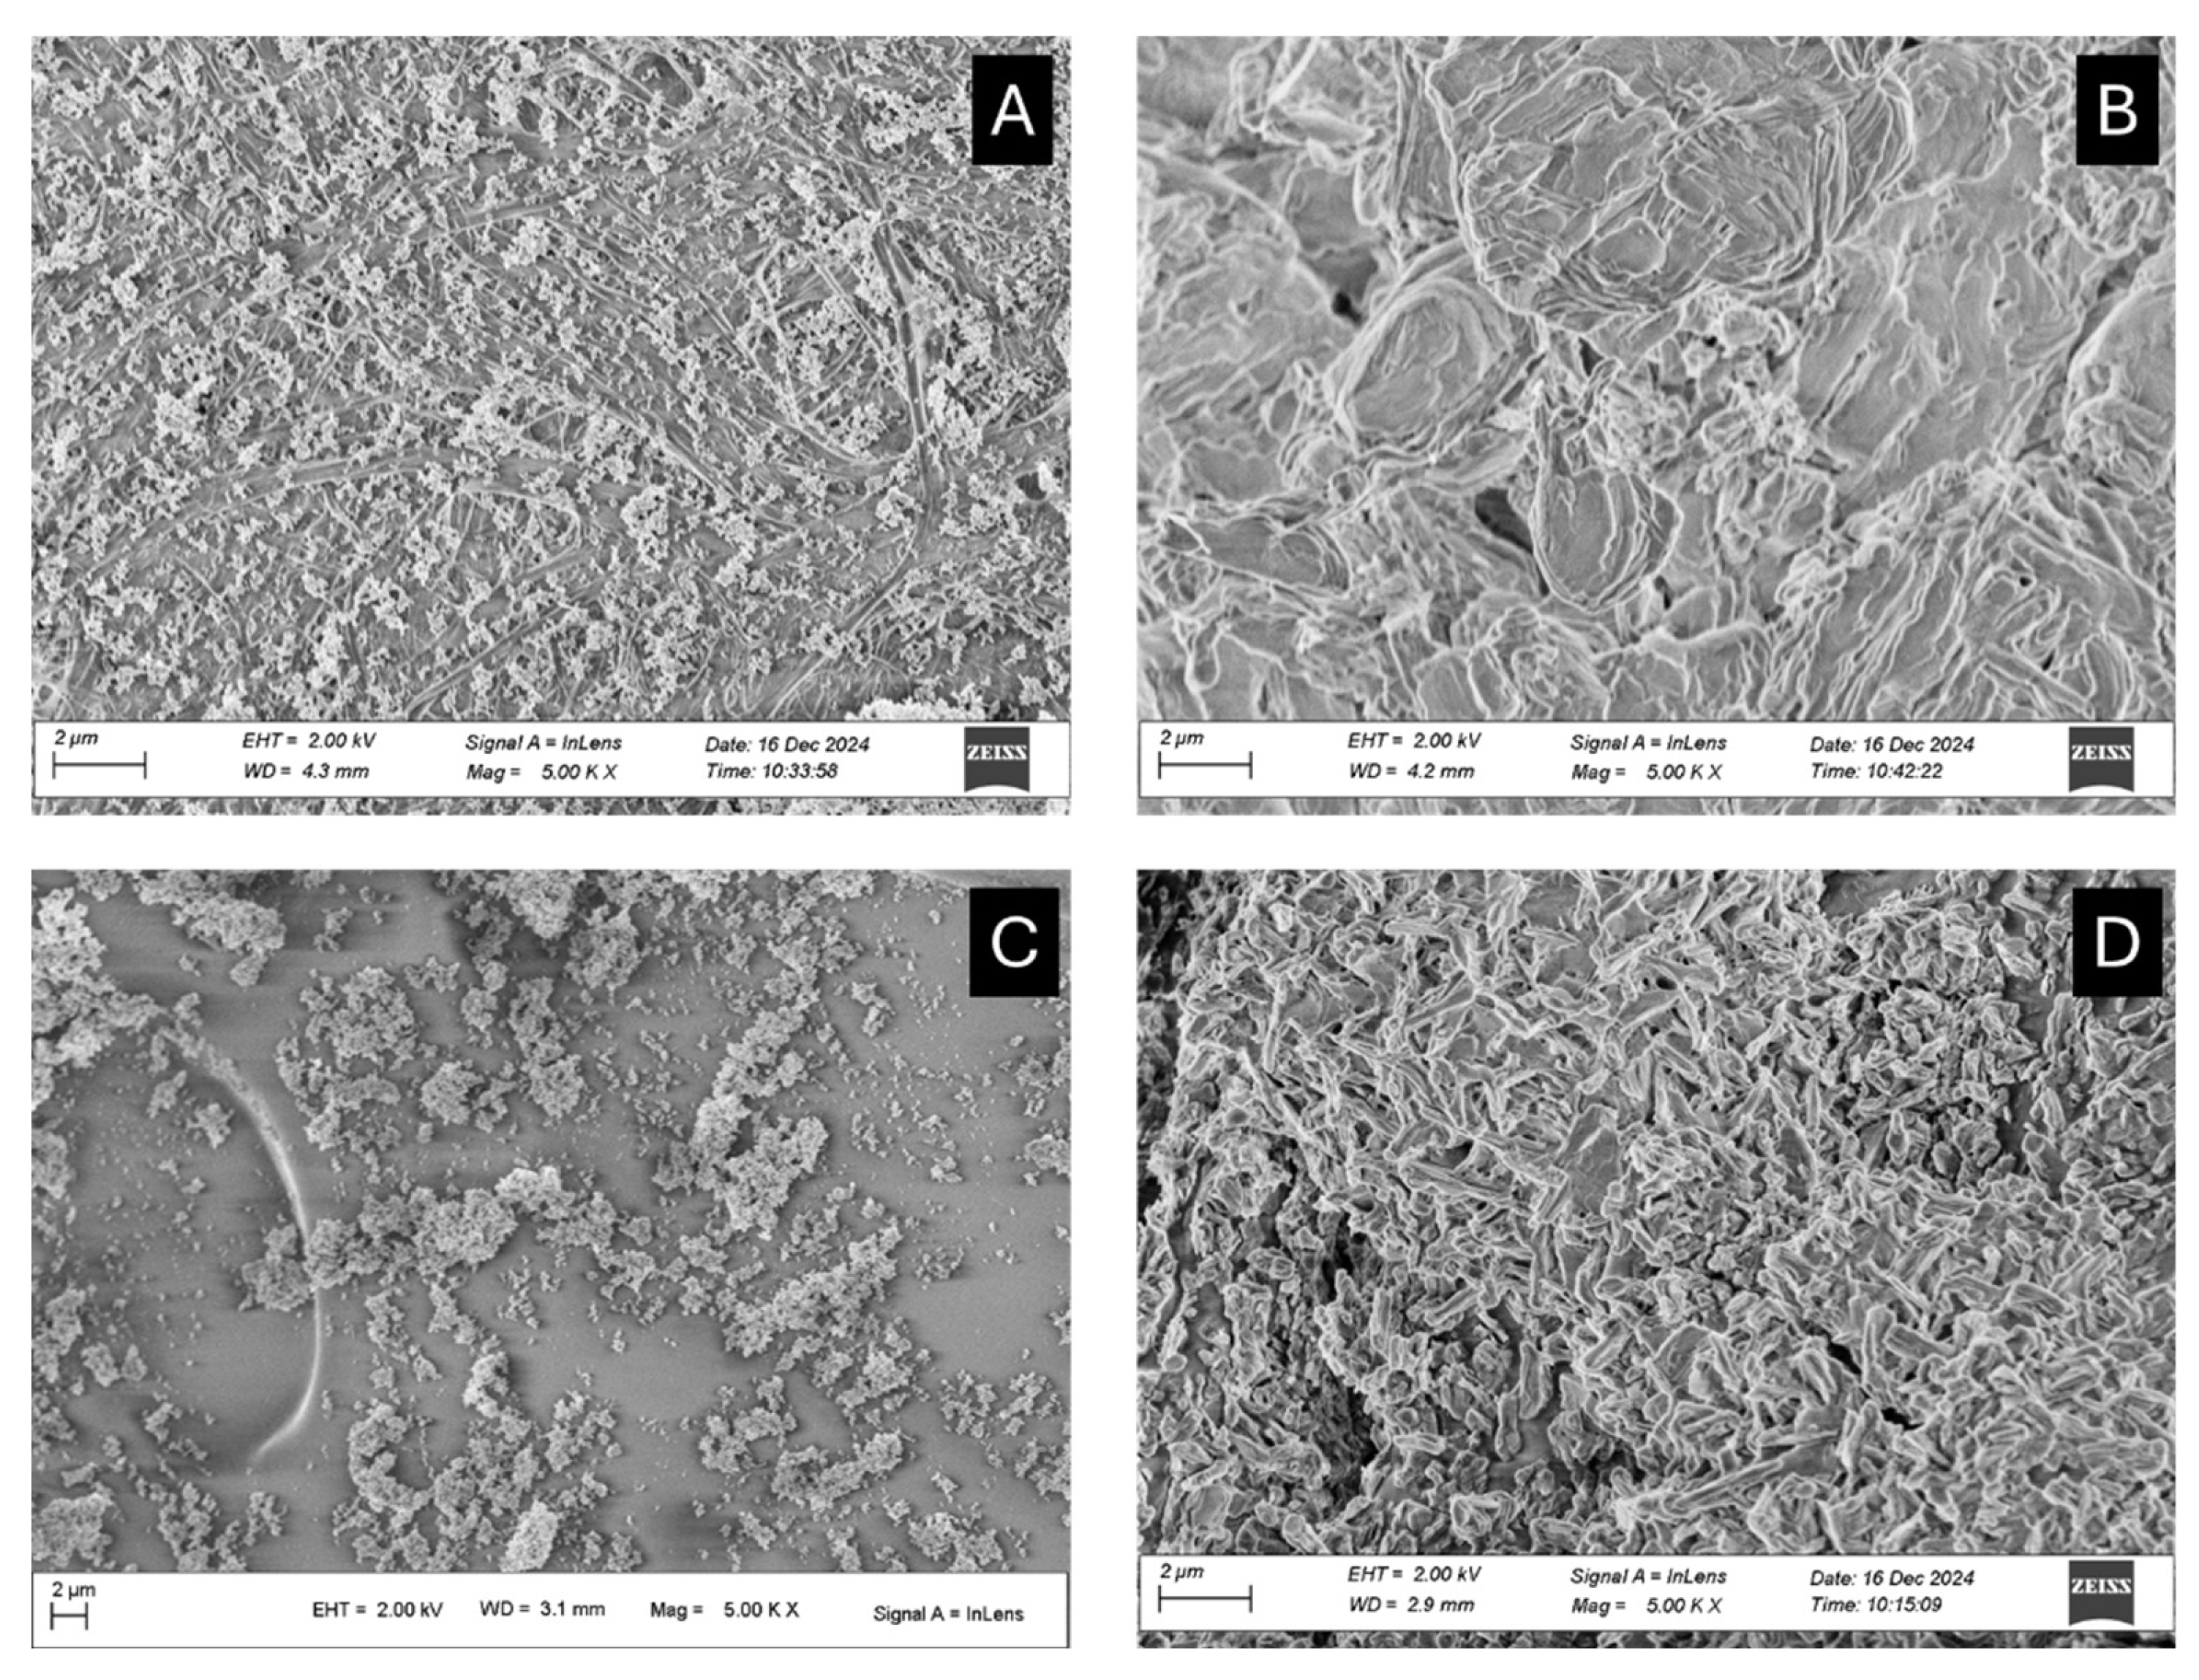
Figure 10.
(A) Free acidity and (B) Correct Acetyl content calculated for RMPF on which the deacetylation process was triggered by the exposition to a saturated atmosphere of HCl (0-point of the graph) and then stored for 12, 24, 36, 48 days at 100% RH without any inhibitor (PX_ATM2.9_NT, black), with pure PVF (PX_ATM2.9_PVF, green), with pure WP (PX_ATM2.9_WP, yellow), with PVF-ZnO (PX_ATM2.9_PVF-ZnO, purple), with WP-ZnO (PX_ATM2.9_WP-ZnO, blue), with ZnO nps (PX_ATM2.9_ZnOnps, red). The results of each measurement are expressed as the average value and the corresponding standard deviation calculated for three fragments of the same film subjected to the same experiment.
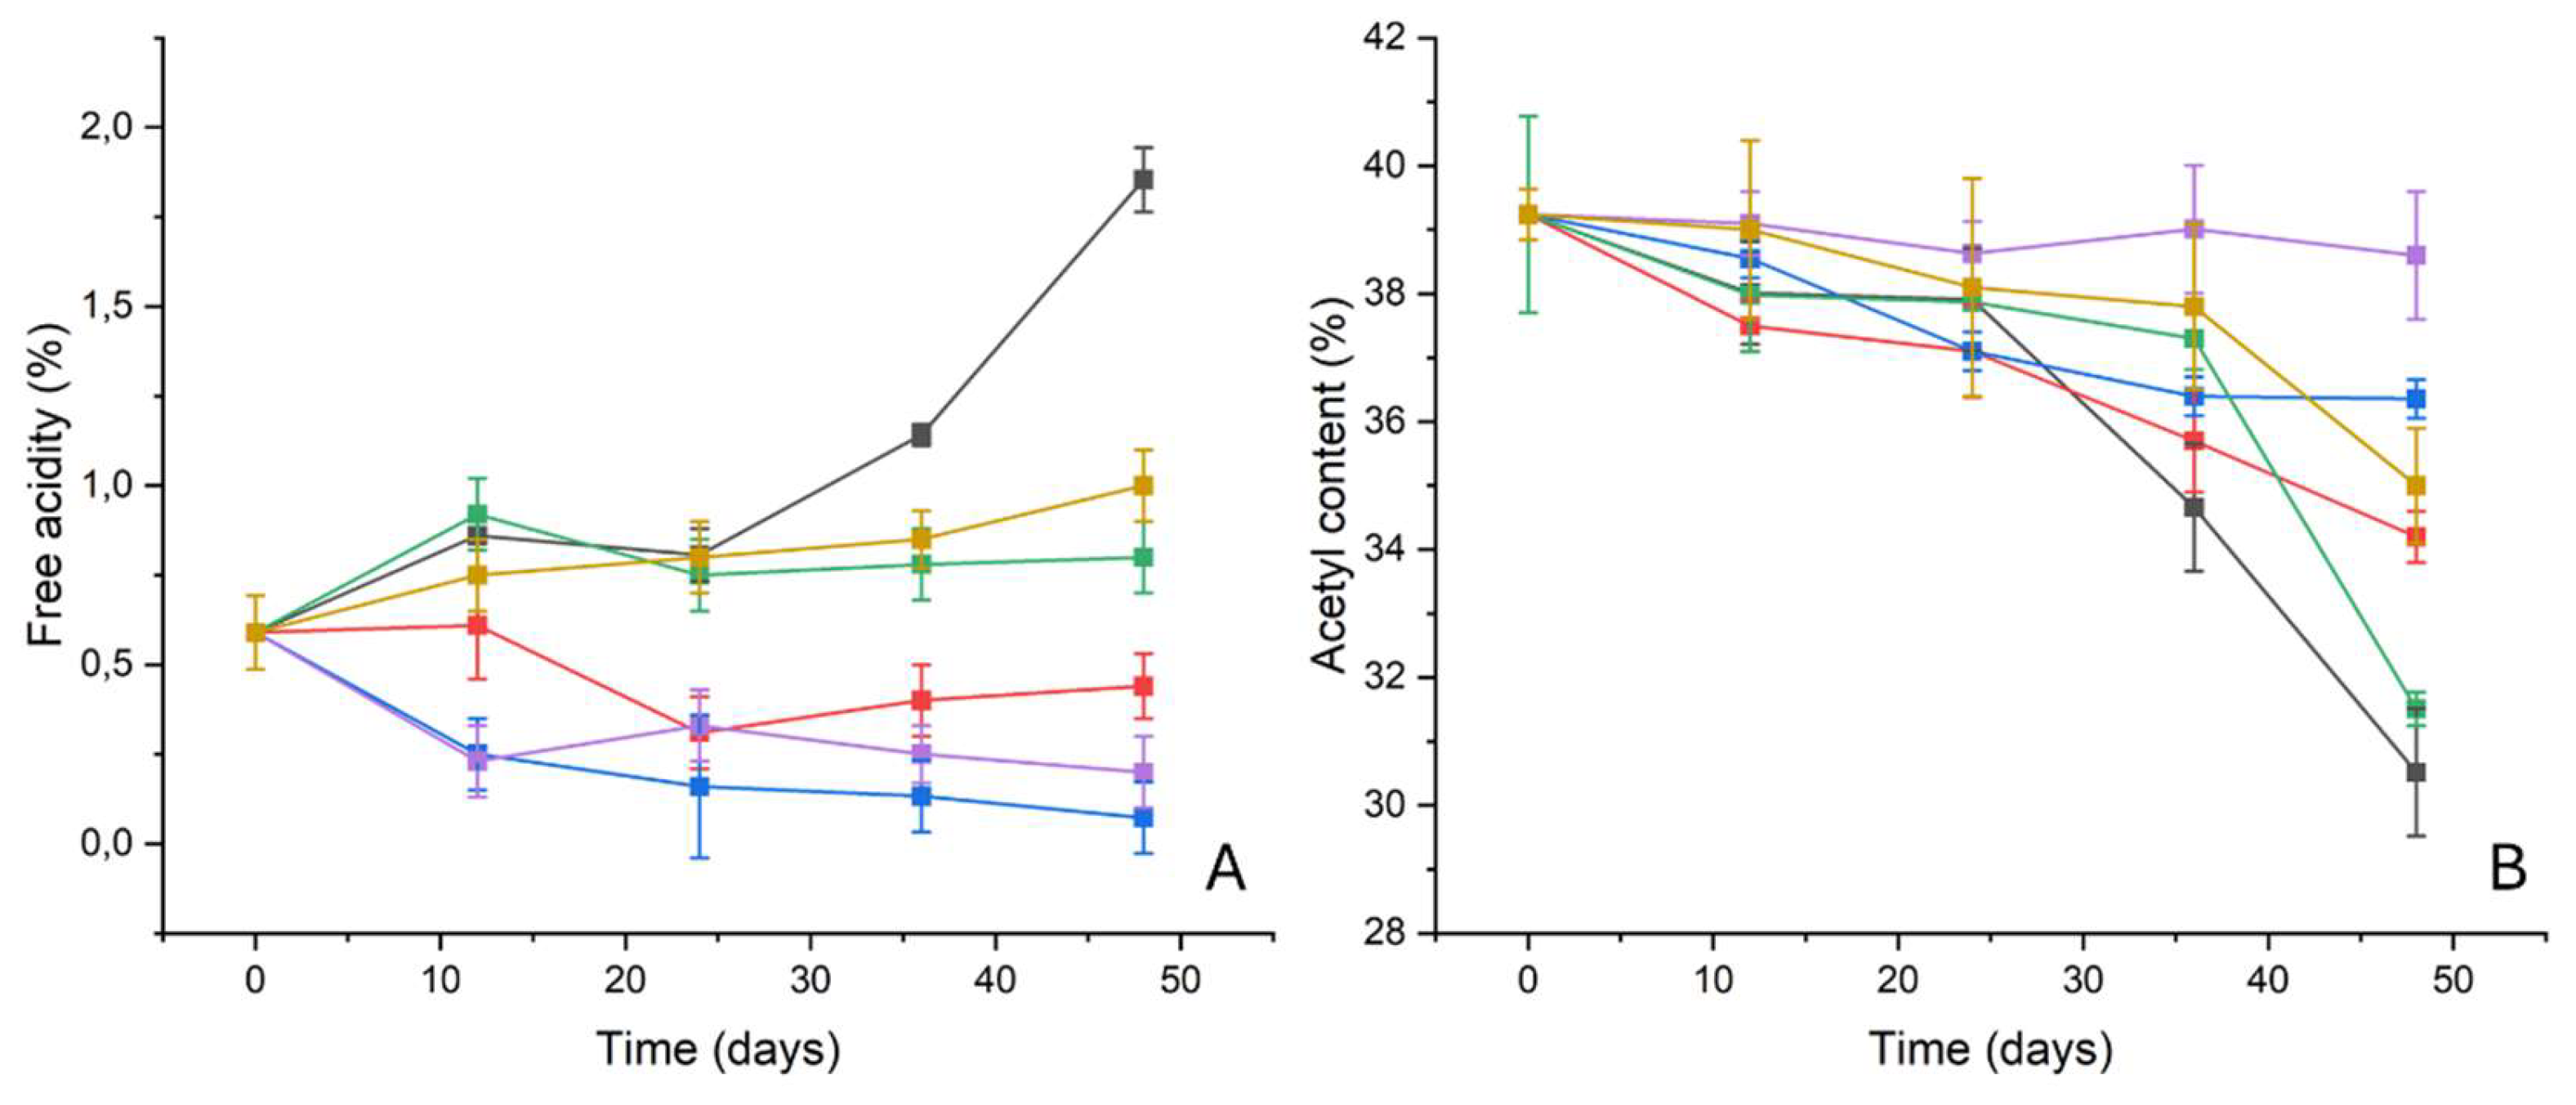
Figure 11.
(A) FTIR-ATR spectra of P0 (black), P9_HCl5M (blue), P48_ATM2.9_NT (red), P48_ATM2.9_PVF-ZnO (green), P48_ATM2.9_WP-ZnO (magenta); (B) FTIR-ATR ratio calculated between the peaks at 1220 and 1030 cm-1 for PX_ATM2.9_NT (black), PX_ATM2.9_WP (yellow), PX_ATM2.9_PVF (green), PX_ATM2.9_PVF-ZnO (purple), PX_ATM2.9_WP_ZnO (blue) and PX_ATM2.9_ZnOnps (red). The results of each measurement are expressed as the average values and the corresponding standard deviations calculated from five spectra acquired in different areas of the film subjected to the same experiment.
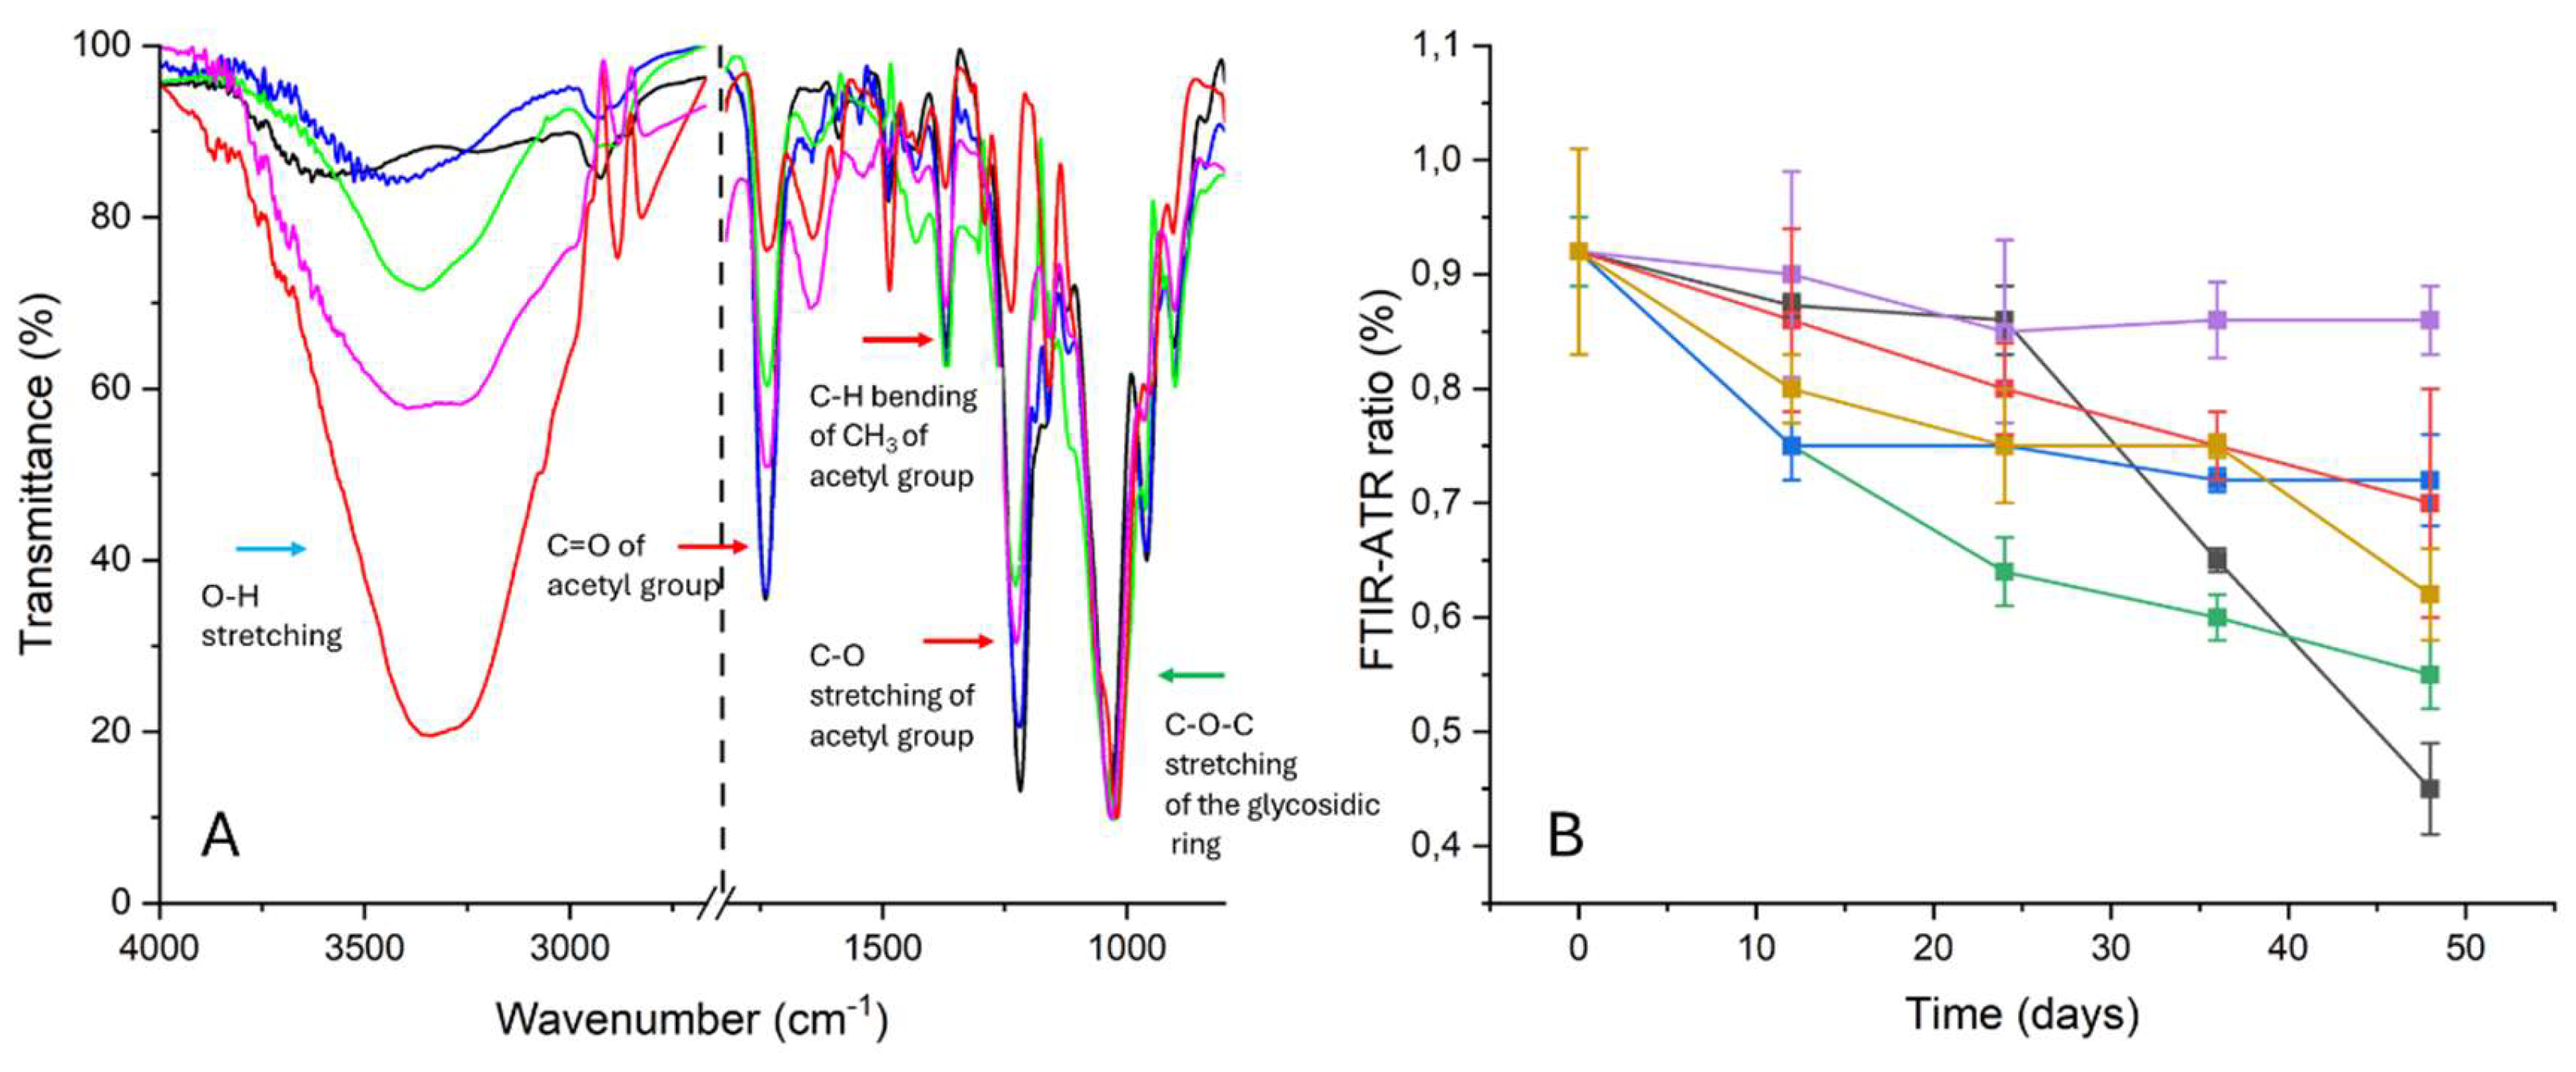
Figure 12.
Axial Force (N/m2) versus Strain graph registered for RMPF samples exposed to the ATM2.9 degradation protocol at different days of exposure and with or without the inhibitors: P0 (black), P9_HCl5M (red), P48_ATM2.9_NT (blue), P48_ATM2.9_WP-ZnO (yellow), P48_ATM2.9_PVF-ZnO (purple), P48_ATM2.9_PVF (green), P48_ATM2.9_WP (brown), P48_ATM2.9_ZnO nps (cyan). For each sample, five replicas are performed; in the figure one of the five replicas is reported as an example for each analyzed sample.
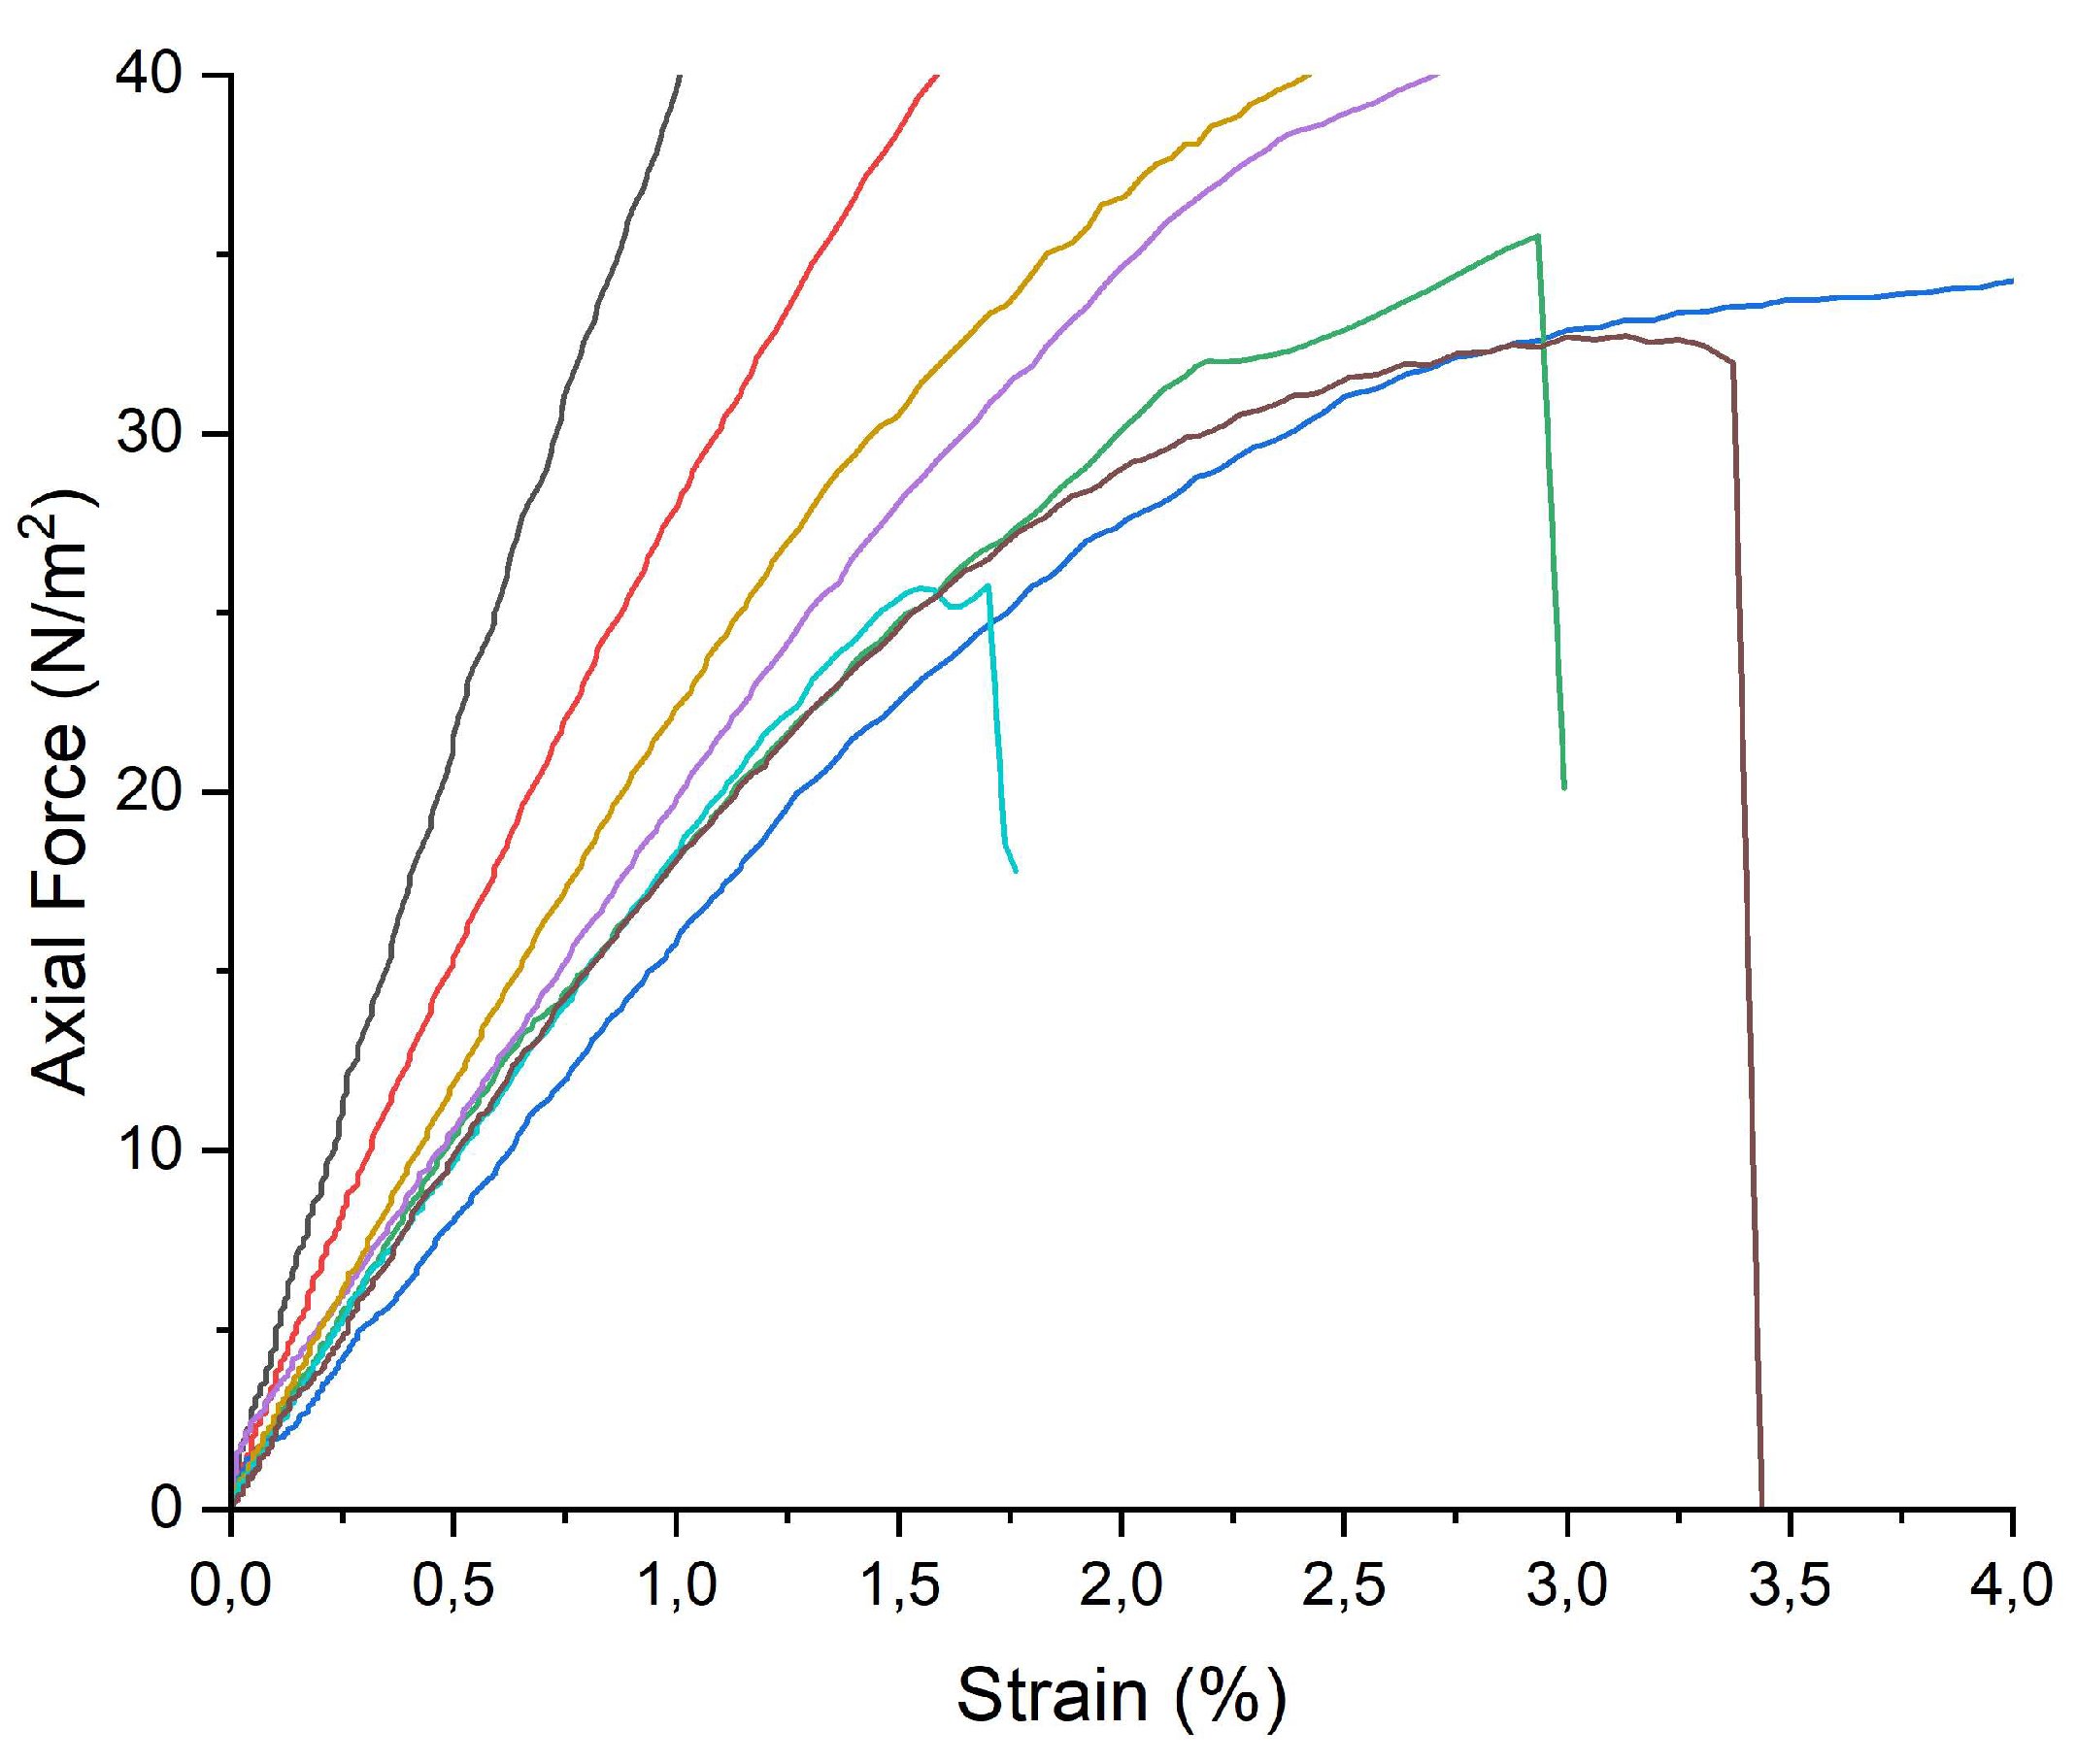

Table 1.
Acetic acid adsorbed values calculated after the adsorption test (AcOHad%) and after the desorption test (AcOHconvert.%: acetic acid entirely converted into acetate salts; AcOHresid.%: residual adsorbed acetic acid not converted into acetate) and theoretical increase in weight expected from the conversion of the whole starting nanoparticles to the corresponding acetate salt (AcOHT%) for Ca(OH)2, CaCO3/Ca(OH)2, ZnO, nanoparticles, and CaCO3 micropowder. For the mixture CaCO3/Ca(OH)2 the the theoretical value AcOHT% of 100% conversion into acetate cannot be determined.
| Sample | AcOHad%* | AcOHconvert.%° | AcOHresid.%§ | AcOHT%@ |
| Ca(OH)2 | 113 ± 1 | 111 ± 4 | 2 ± 3 | 113 |
| CaCO3/Ca(OH)2 | 64 ± 2 | 62 ± 5 | 2 ± 5 | / ** |
| ZnO | 121 ± 3 | 120 ± 6 | 1 ± 2 | 125 |
| CaCO3 micro | 10 ± 1 | 9 ± 1 | 1 ± 2 | 58 |
*Eq. 1: °Eq. 2: §Eq. 3: @ ** for pure CaCO3, AcOHT would be 58%.
Table 2.
Acetic acid adsorbed percentage in weight calculated after the adsorption test (AcOH ad%) and after the desorption test (AcOHcovert.% and AcOHresid.%) for PVF+ZnO, pure PVF, WP+ZnO, pure WP and ZnO nanoparticles.
Table 2.
Acetic acid adsorbed percentage in weight calculated after the adsorption test (AcOH ad%) and after the desorption test (AcOHcovert.% and AcOHresid.%) for PVF+ZnO, pure PVF, WP+ZnO, pure WP and ZnO nanoparticles.
| Sample | AcOHad%* | AcOHconvert.%° | AcOHresid.%§ |
| PVF + ZnO | 27±2 | 20±2 | 7±2 |
| PVF | 17±1 | 6±1 | 11±1 |
| WP+ZnO | 17±1 | 14±1 | 3±1 |
| WP | 6.7±0.7 | 3.5±0.4 | 3.2±0.5 |
| ZnO nps | 121±3 | 120±3 | 1±3 |
*Eq. 1: °Eq. 2: §Eq. 3:
Table 3.
Resume of all the samples used to evaluate the effect of our treatment to inhibit the artificially induced deacetylation process (The labels not yet described refer to: P = duration of the third degradation step (apart P)_HCL5M for which is equal to first degradation step), ATM2.9 = degradation protocol reported in ref. 21, NT = not treated, WP = Whatman paper, nps = nanaparticles).
| Sample |
Duration of the first degradation step (days) |
Duration of the second degradation step (days) |
Duration of the third degradation step (days) |
Treatment |
| P9_HCl5M | 9 | 1 | / | / |
| P12_ATM2.9_NT | 9 | 1 | 12 | / |
| P24_ATM2.9_NT | 9 | 1 | 24 | / |
| P36_ATM2.9_NT | 9 | 1 | 36 | / |
| P48_ATM2.9_NT | 9 | 1 | 48 | / |
| P12_ATM2.9_WP | 9 | 1 | 12 | Pure WP (total weight 0.45 g) |
| P24_ATM2.9_WP | 9 | 1 | 24 | |
| P36_ATM2.9_WP | 9 | 1 | 36 | |
| P48_ATM2.9_WP | 9 | 1 | 48 | |
| P12_ATM2.9_WPZnO | 9 | 1 | 12 | WP uploaded with ZnO nps (total weight: 0.5 g) |
| P24_ATM2.9_WPZnO | 9 | 1 | 24 | |
| P36_ATM2.9_WPZnO | 9 | 1 | 36 | |
| P48_ATM2.9_WPZnO | 9 | 1 | 48 | |
| P12_ATM2.9_PVF | 9 | 1 | 12 | PVF sponge at the bottom of the jar (0.3 g) |
| P24_ATM2.9_PVF | 9 | 1 | 24 | |
| P36_ATM2.9_PVF | 9 | 1 | 36 | |
| P48_ATM2.9_PVF | 9 | 1 | 48 | |
| P12_ATM2.9_PVF+nps | 9 | 1 | 12 | PVF sponge uploaded with ZnO nps at the bottom of the jar (0.3 g) |
| P24_ATM2.9_PVF+nps | 9 | 1 | 24 | |
| P36_ATM2.9_PVF+nps | 9 | 1 | 36 | |
| P48_ATM2.9_PVF+nps | 9 | 1 | 48 |
Disclaimer/Publisher’s Note: The statements, opinions and data contained in all publications are solely those of the individual author(s) and contributor(s) and not of MDPI and/or the editor(s). MDPI and/or the editor(s) disclaim responsibility for any injury to people or property resulting from any ideas, methods, instructions, or products referred to in the content. |
© 2025 by the authors. Licensee MDPI, Basel, Switzerland. This article is an open access article distributed under the terms and conditions of the Creative Commons Attribution (CC BY) license (http://creativecommons.org/licenses/by/4.0/).
Copyright: This open access article is published under a Creative Commons CC BY 4.0 license, which permit the free download, distribution, and reuse, provided that the author and preprint are cited in any reuse.


