
Submitted:
12 February 2025
Posted:
13 February 2025
You are already at the latest version
Abstract
Ensuring effective data governance is essential for delivering transparent, accessible, and equitable public services, particularly for people with disabilities. However, chal-lenges such as gaps in data oversight and accountability hinder service efficiency and transparency. This study examines the relationship between data-driven culture, audit data governance, and public service performance, employing Exploratory Factor Analysis (EFA), Confirmatory Factor Analysis (CFA), and Path Analysis. The findings indicate that a strong data-driven culture enhances audit data governance, improving service transparency, accessibility, and user satisfaction for people with disabilities. Public service delivery significantly influences audit data governance through data accessibility, ethical management, and efficient administrative processes. To promote inclusive governance, this study highlights the need for open data policies, in-ter-agency collaboration, and emerging technologies such as AI and blockchain. Policy recommendations focus on data-driven decision-making frameworks that align with OECD principles, ensuring equitable and accountable public services for people with disabilities.
Keywords:
Data Governance for Accountability
; Data-Driven Culture
; Public Service Delivery
; People with Disabilities
; Thailand
1. Introduction
Ensuring accessible and high-quality public services for people with disabilities remains a pressing challenge in Thailand. Despite national policies promoting inclusivity, people with disabilities continue to face barriers in healthcare, education, employment, and social welfare services. These challenges arise from fragmented service coordination, inconsistent policy enforcement, and inefficient data governance, leading to disparities in service delivery. According to the Department of Empowerment of Persons with Disabilities (2020), only 65% of registered people with disabilities in Thailand receive the full benefits to which they are entitled, highlighting persistent gaps in service accessibility and administrative inefficiencies.
In the era of digital transformation, data governance plays a crucial role in ensuring transparency, accountability, and equitable service provision for people with disabilities. Effective data management enables policymakers to monitor service efficiency, assess policy effectiveness, and implement data-driven reforms. However, Thailand faces significant obstacles in utilizing data to improve public services for people with disabilities, including data fragmentation, lack of interoperability between agencies, and inconsistent data governance frameworks. Without accurate and well-managed data, policymakers struggle to develop responsive and inclusive service models.
Globally, countries such as Australia and the European Union have successfully integrated data-driven governance models to enhance service accessibility and operational efficiency (Australian Government, 2022; European Commission, 2022). These reforms demonstrate how streamlined data governance frameworks contribute to more inclusive and efficient public administration. However, limited research has examined the role of data governance in improving service outcomes for people with disabilities in Thailand, particularly concerning data-driven decision-making, inter-agency collaboration, and policy implementation.
This study examines the impact of data governance on public service delivery for people with disabilities, focusing on how organizational culture, public service mechanisms, and digitalization contribute to inclusive service provision. By employing quantitative modeling techniques, this research provides empirical insights to inform policy innovation, strategic planning, and governance reforms that enhance service accessibility, efficiency, and equity for people with disabilities.
2. Literature Review
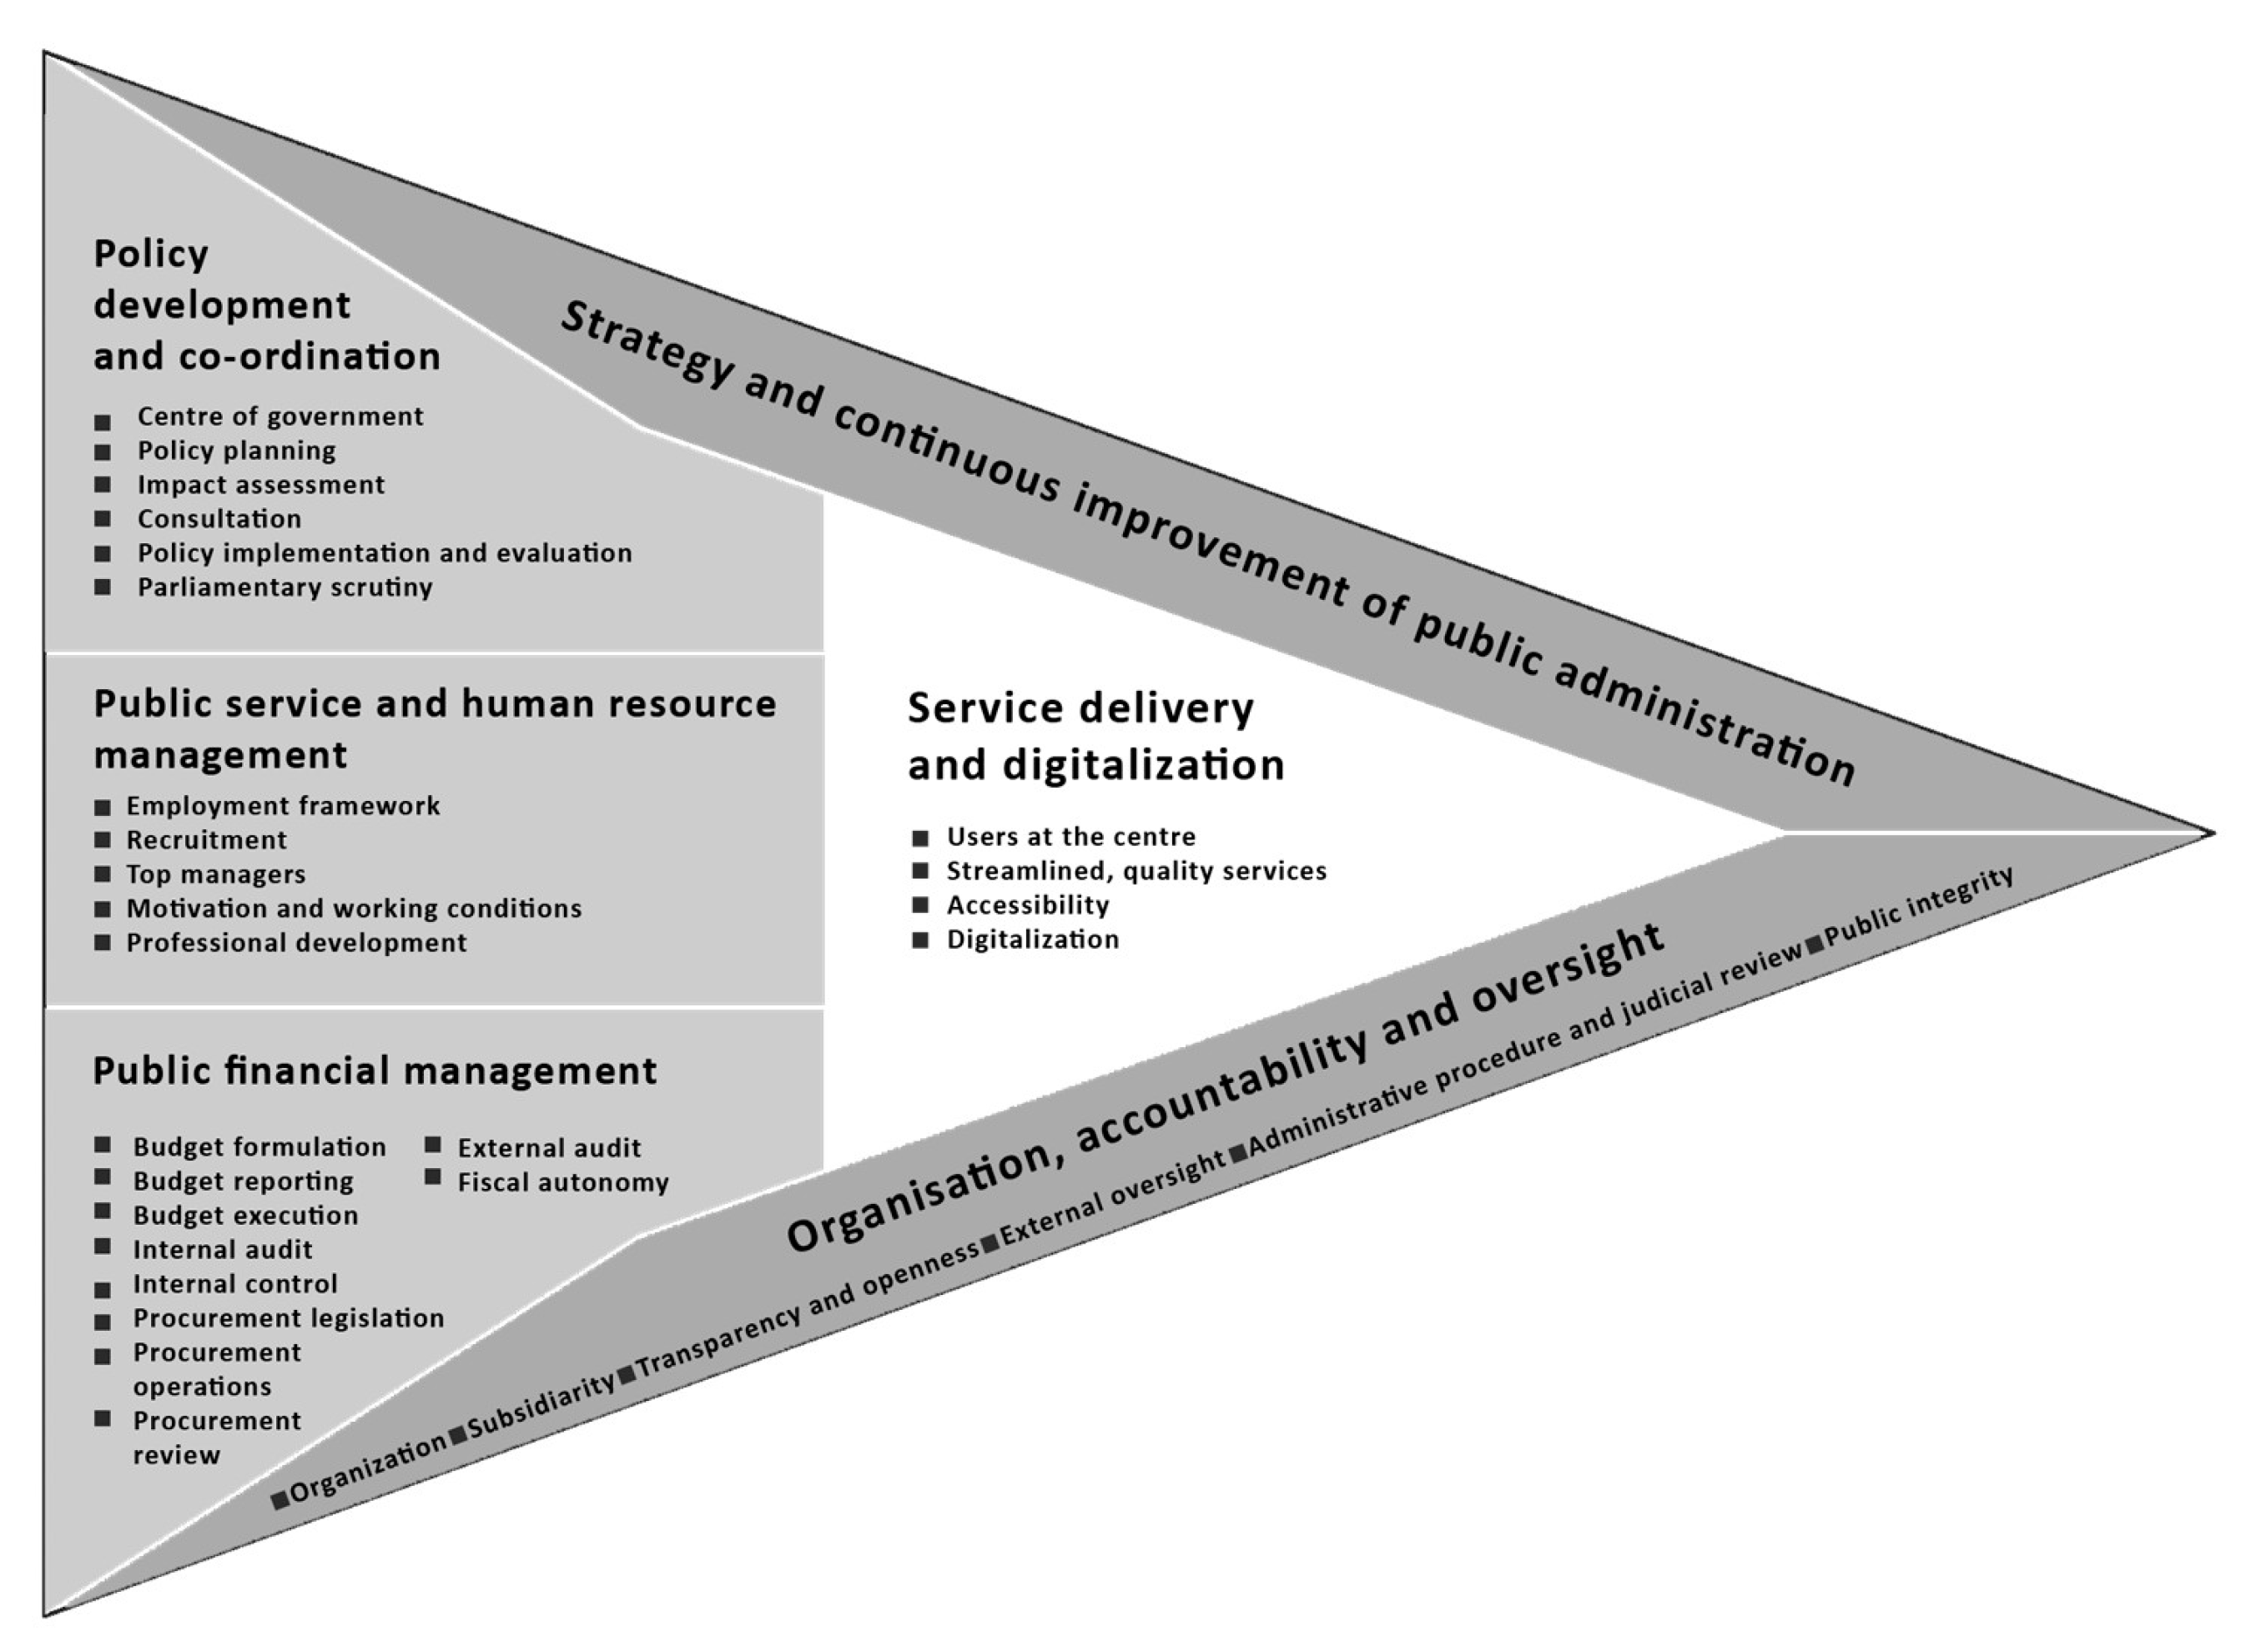
Public service delivery for people with disabilities requires equitable, efficient, and accessible governance mechanisms to ensure full social participation and rights-based inclusion. The OECD (2019) Principles of Public Administration emphasize four key dimensions: (1) citizen-oriented services, (2) fair and efficient administrative procedures, (3) enablers for service delivery, and (4) equitable access to public services. These principles align with the New Public Service (Denhardt & Denhardt, 2000), New Public Governance (Osborne, 2006), and Public Value Management (Bovaird & Löffler, 2003), all of which stress citizen engagement, service co-production, and inclusive policy design.
Incorporating data-driven governance enhances transparency and decision-making in public administration (Anderson, 2015). The DAMA International (2017) Data Governance Framework highlights ethical data handling and structured frameworks to improve public service efficiency and accountability. Audit data governance plays a critical role in ensuring accessibility, financial transparency, and service quality (IDI, 2020). Transform Health (2022) further emphasizes that equity-focused data governance is essential for achieving sustainable and inclusive public sector reforms.
The Biopsychosocial Model (ICF, WHO 2012) is widely used to conceptualize how disability outcomes are shaped by interactions between individuals and their environments. This model highlights the importance of removing systemic barriers to ensure equitable access to education, healthcare, employment, and welfare services. As digital transformation accelerates, Digital Accessibility Governance is increasingly recognized as a core component of inclusive public administration. The Web Content Accessibility Guidelines (WCAG) and United Nations Convention on the Rights of Persons with Disabilities (UNCRPD) provide global standards for ensuring digital inclusion and accessibility in public services.
This study builds upon these frameworks to examine how audit data governance influences People with disabilities service delivery outcomes. It conceptualizes audit governance as a framework ensuring data accuracy, compliance, integration, and accessibility. The State Audit Office of Thailand’s data policies shape service provision in education, employment, and social welfare. Within this framework, Service Delivery and Digitalization is one of the six governance pillars that drive inclusive, transparent, and accountable administration for People with disabilities.
Theoretical Framework
Audit data governance plays a crucial role in ensuring data accuracy, compliance, and integration in People with disabilities service delivery. The State Audit Office of Thailand’s audit data serves as a foundation for public service provision in education, employment, accessibility, and welfare support. Within this governance framework, Service Delivery and Digitalization is one of six key principles influencing audit data governance, alongside Strategy, Organizational Structure, Accountability, Policy Coordination, and Public Financial Management.
Public service delivery for People with disabilities is shaped by four key elements: (1) Citizen-oriented services, (2) Fair and efficient administrative procedures, (3) Enablers for service delivery, and (4) Equitable access to public services. These dimensions align with New Public Service (Denhardt & Denhardt, 2000), New Public Governance (Osborne, 2006), and Public Value Management (Bovaird & Löffler, 2003), emphasizing service quality and citizen engagement.
Figure 1.
Principles of Public Administration (OECD, 2023).
Hypothesis Development
Based on this framework, three key hypotheses are proposed:
H1: Public service delivery for People with disabilities is positively influenced by: (1) Citizen-oriented policies, (2) Efficient administrative procedures, (3) Service enablers, and (4) Access to public services. The European Commission (2022) highlights digitalization as a critical factor in improving People with disabilities service accessibility and efficiency, while the WHO & World Bank (2011) emphasize the role of healthcare and education accessibility in enhancing service outcomes.
H2: Public service delivery for People with disabilities is positively associated with audit data governance. The OECD (2019) framework integrates New Public Management (NPM) principles, reinforcing accountability and efficiency-driven auditing in public service governance (Cordery & Hay, 2024).
H3: A data-driven organizational culture positively impacts audit data governance. Anderson (2015) links data-driven decision-making to improved audit governance. Empirical studies confirm that strong data literacy and big data integration enhance audit accuracy and risk prediction (Fattah, 2024; Prakash, 2024).
3. Materials and Methods
3.1. Data Collection
Audit data governance factors for People with disabilities services were identified based on public administration principles (OECD, 2019) and the concept of data-driven organizations. These factors were refined and validated through an Exploratory Factor Analysis (EFA). The finalized questionnaire was designed to assess expert perceptions of factor relationships and underwent content and face validity checks by an expert panel before being piloted.
The validated questionnaire was then administered to two target groups: 1) Government Officials involved in People with disabilities service delivery (340 valid responses from 500 distributed). 2) Individuals with Disabilities holding disability ID cards (371 valid responses from 500 distributed). In total, 711 valid responses were collected in June 2024 across eight provinces in Thailand.
3.2. Data Analysis
Exploratory Factor Analysis (EFA) was conducted to refine variables, followed by Confirmatory Factor Analysis (CFA) to validate the measurement model. Path Analysis and Structural Equation Modeling (SEM) were then used to test hypotheses and assess causal relationships. The analytical criteria followed established standards for factor analysis, model fit, and validity, as summarized in Table 1.
4. Results
4.1. Exploratory Factor Analysis
This study employed SPSS AMOS 24.0 to conduct reliability testing and Exploratory Factor Analysis (EFA) on the questionnaire items to refine the predefined scale. The Cronbach’s alpha (α) values for all dimensions indicated excellent internal consistency, with values above 0.80 (George & Mallery, 2003). The results confirmed that 49 key factors were identified across six primary dimensions: Citizen-Oriented Services, Fair & Efficient Administrative Procedures, Enablers for Service Delivery, Access to Public Services, Data-Driven Organization, and Audit Data Governance.
Sampling adequacy was evaluated using the Kaiser–Meyer–Olkin (KMO) measure, which yielded a value of 0.970, exceeding the recommended threshold of 0.900, indicating strong factorability of the dataset. Bartlett’s test of sphericity produced a p-value of 0.001, confirming that inter-variable relationships were suitable for factor analysis. The principal component analysis method was used for factor extraction, and based on eigenvalues of 21.359, 7.262, and 1.872, three key dimensions were identified, explaining 60.986% of the total variance.
Varimax rotation was applied to refine the factor structure, generating a matrix that categorized audit data governance factors for public services for People with disabilities in Thailand into three dimensions, as presented in Table 2. The results largely aligned with pre-specified theoretical dimensions. However, variations emerged within public service delivery, where component structures differed from initial assumptions. Furthermore, within the data-driven organizational culture dimension, executive intuitive decision-making did not adequately explain variance due to a communalities value below 0.4, which is considered a lower threshold in social sciences (Preuss, 2014; Hair, 2010). Consequently, this factor was merged with the Anti-HiPPO Culture component, extracted from the same factor category.
4.2. Confirmatory Factor Analysis
CFA was conducted to assess the fit between the measurement model and the actual data. In this study, CFA was used to evaluate the relationships among the various components of audit data governance in public services for People with disabilities. The model’s fit was assessed using structural indicators such as the Comparative Fit Index (CFI), Tucker-Lewis Index (TLI), Root Mean Square Error of Approximation (RMSEA), and Standardized Root Mean Square Residual (SRMR). The results indicated that the measurement model demonstrated a good fit, confirming its consistency with the empirical data, as shown in Table 3.
4.3. Path Analysis and Structural Equation Modeling
A Structural Equation Model (SEM) was developed to examine factors influencing audit data governance, integrating data-driven organizations and public services for People with disabilities within a 3D model framework. The analysis, based on 711 valid responses, was conducted using AMOS 24.0, applying Maximum Likelihood Estimation (MLE) to estimate model parameters. The standardized solution after fitting the model is illustrated in Figure 2.
Analysis of Audit Data Governance, the outcome variable (Table 4), used Standardized Regression Weights (Estimate), along with Total Effect (TE), Direct Effect (DE), and Indirect Effect (IE). Results showed that Data-Driven Organization had the strongest impact, with a TE of 0.796, primarily a direct effect. All observed variables were indirectly affected, and the latent variables within Data-Driven Organization exhibited strong positive relationships with observed variables.
Model fit indices (Table 5) confirmed the model’s adequacy: Relative Chi-square/df = 1.871 (<5), RMSEA = 0.051 (<0.07), SRMR = 0.033 (<0.08), CFI & TLI > 0.92, all meeting established criteria. CFA results indicated a strong model fit, effectively capturing the relationship between public service delivery, data-driven organization, and audit data governance, requiring no further adjustments.
Note: CMIN is the chi-square, df is the degree of freedom, RMSEA is the root mean square error of approximation, CFI is the comparative fit index, TLI is the Tacker-Lewis index.
Path analysis further revealed that Audit Data Governance was significantly influenced by Data-Driven Organization (TE = 0.796, DE = 0.748, IE = 0.048), while Public Service Delivery had a weaker effect (TE = 0.150, direct and indirect). The model explained 65.3% of the variance in Audit Data Governance, whereas Public Service Delivery was influenced solely by Data-Driven Organization (TE = 0.320), with no indirect effects. The R2 value indicated that the model explained only 10.3% of the variance in Public Service Delivery.
5. Discussion
5.1. Enhancing Data-Driven Organizations for Audit Governance in People with disabilities Service Delivery
This study developed a model identifying key factors influencing audit data governance in public services for People with disabilities in Thailand. Findings confirmed that a data-driven organization significantly enhances both public service delivery and audit data governance, aligning with the governance principles of DAMA International (2017) and Transform Health (2022).
Results from EFA and CFA highlighted crucial factors affecting People with disabilities service delivery, particularly public service quality perception (user satisfaction), data accessibility, and enablers for digital service access. International examples illustrate the impact of these factors: Australia’s Disability Gateway enables one-stop access to essential services (Australian Government, 2022), while Sweden’s digital government improves public service accuracy and efficiency through advanced data systems (European Commission, 2022). Additionally, fair administrative procedures and citizen-oriented policies promote equitable access to public information and services for People with disabilities.
Within the data-driven organization dimension, fostering an open, trusting culture encourages transparent data sharing (Abraham et al., 2019), while a questioning culture improves decision-making accuracy by stimulating critical inquiry (Schein, 2010). Furthermore, adherence to data ethics enhances organizational trust and supports evidence-based policymaking (Lemke et al., 2023; Rajasegar et al., 2024). In the audit data governance dimension, factors such as data sharing and metadata management play a critical role in promoting transparency, improving audit quality, and ensuring financial reporting accuracy (Hinrichs & Wilkens, 2000; Thompson et al., 2015; Alshehadeh et al., 2024).
5.2. Policy Recommendations for Strengthening Data Governance in Public Services
This study proposes two policy pathways to enhance service efficiency and audit data governance:
- 1)
-
Main Pathway – Data-Driven Decision-Making for Governance and Efficiency
- Fostering a Data-Driven Culture: Promote data analysis skills, transparent data disclosure, and effective data sharing within public sector organizations to establish high-quality, evidence-based decision-making (OECD, 2019; United Nations, 2020).
- Developing Centralized Data and Cross-Agency Collaboration: Enhance data integration and metadata management across agencies to improve data consistency, accessibility, and auditability, leading to more efficient and transparent governance (United Nations, 2020).
- 2)
-
Supporting Pathway–Data Protection and Technology Integration
- Enhancing Data Protection and Security: Implement robust data security policies (e.g., GDPR and Thailand’s PDPA) to safeguard public trust and ensure People with disabilities’s data is handled securely (European Commission, 2016; World Bank, 2024).
- Leveraging Emerging Technologies for Public Service Innovation: Integrate AI, blockchain, and advanced digital solutions to improve data accuracy, transparency, and responsiveness, particularly in enhancing People with disabilities’s access to public services (World Bank, 2024).
6. Conclusions
6.1. Key Factors Influencing Audit Data Governance in People with disabilities Services
This study confirms that a data-driven organizational culture enhances both People with disabilities service delivery and audit data governance. Additionally, People with disabilities service delivery positively impacts audit data governance, reinforcing its role in ensuring transparency and efficiency.
6.2. Research Findings
Findings revealed that People with disabilities service delivery consists of four key dimensions: Perception of Public Services, Enablers for Data Access, Fair Administrative Procedures, and Citizen-Oriented Policy. Factors with the highest positive influence include service accessibility, management tools, comprehensive legal frameworks, and sufficient ICT budgets with systematic monitoring.
In data-driven organizations, critical elements include an open and trusting culture, a questioning mindset that promotes inquiry, and strong data ethics governing data lifecycle management. For audit data governance, key determinants include data sharing, metadata management, and data quality assurance, all of which significantly enhance transparency and decision-making.
6.3. Research Limitations and Future Research Directions
This study’s findings may be limited by the sample group, requiring broader, more diverse studies for comprehensive insights. Future research should focus on developing data auditing tools and enhancing data quality evaluation to improve audit effectiveness and ensure sustainable, user-centered People with disabilities service delivery.
Author Contributions
Conceptualization, Sitthisak Chaiyasuk, Krish Rugchatjaroen, Somboon Sirisunhirun, Nopraenue Sajjarax Dhirathiti, Somsak Amornsiriphong, and Phut Ploywan; methodology, Sitthisak Chaiyasuk, Krish Rugchatjaroen, Somboon Sirisunhirun, Nopraenue Sajjarax Dhirathiti, Somsak Amornsiriphong, and Phut Ploywan; data curation, Sitthisak Chaiyasuk; formal analysis, Sitthisak Chaiyasuk; investigation, Sitthisak Chaiyasuk; project administration, Sitthisak Chaiyasuk and Krish Rugchatjaroen; resources, Sitthisak Chaiyasuk; software, Sitthisak Chaiyasuk; validation, Sitthisak Chaiyasuk; visualization, Sitthisak Chaiyasuk; supervision, Krish Rugchatjaroen, Somboon Sirisunhirun, Nopraenue Sajjarax Dhirathiti, Somsak Amornsiriphong, and Phut Ploywan; writing—original draft preparation, Sitthisak Chaiyasuk; writing—review and editing, Krish Rugchatjaroen, Somboon Sirisunhirun, Nopraenue Sajjarax Dhirathiti, Somsak Amornsiriphong, and Phut Ploywan. All authors have read and agreed to the published version of the manuscript.
Funding
This research received no external funding.
Institutional Review Board Statement
The study was conducted in accordance with the Declaration of Helsinki and approved by the Committee for Research Ethics (Social Sciences), Mahidol University (Approval No. 2024/041.2903, valid from 29 March 2024 to 28 March 2025).
Informed Consent Statement
Informed consent was obtained from all subjects involved in the study.
Data Availability Statement
The raw data supporting the conclusions of this article will be made available by the authors upon request.
Acknowledgments
We thank Associate Professor Dr. Krish Rugchatjaroen for his guidance, Associate Professor Dr. Poonpong Suksawang for support in structural equation modeling, and the five experts for questionnaire validation. We also appreciate all participants, especially People with disabilities, for their contributions. Additionally, OpenAI’s ChatGPT-4 assisted with language refinement, while all intellectual work was solely by the authors.
Conflicts of Interest
The authors declare no conflicts of interest.
References
- Abraham, R. , Schneider, J., & vom Brocke, J. Data governance: A conceptual framework, structured review, and research agenda. International Journal of Information Management 2019, 49, 424–438. [Google Scholar] [CrossRef]
- Alshehadeh, A. R. , El Refae, G. A., Yaseen, S. G., Aljawarneh, N. M., & Al-Khawaja, H. A. Accounting data governance and its influence on financial report quality: Insights from commercial banks. Journal of Infrastructure, Policy and Development 2024, 8. [CrossRef]
- Al-Ruithe, M. , Benkhelifa, E., & Hameed, K. A conceptual framework for cloud data governance. Personal and Ubiquitous Computing 2018, 22, 1013–1034. [Google Scholar] [CrossRef]
- Anderson, C. (2015). Creating a data-driven organization: Practical advice from the trenches. O’Reilly Media.
- Australian Government. (2022). National Disability Insurance Scheme (NDIS) Quarterly Report. Australian Government. https://www.ndis.gov.au/about-us/publications/quarterly-reports.
- Bartlett, M. S. Tests of significance in factor analysis. British Journal of Psychology 1950, 3, 77–85. [Google Scholar] [CrossRef]
- Bovaird, T. , & Löffler, E. Evaluating the quality of public governance: Indicators, models, and methodologies. International Review of Administrative Sciences 2003, 69, 313–328. [Google Scholar] [CrossRef]
- Brynjolfsson, E., & McElheran, K. (2016). Data in action: Data-driven decision making in U.S. manufacturing. MIT Initiative on the Digital Economy.
- Carlson, J., & Johnston, L. R. (Eds.). (2015). Data information literacy: Librarians, data, and the education of a new generation of researchers. Purdue University Press. http://www.jstor.org/stable/j.ctt6wq2vh.
- Chen, Y. , & Li, Q. The impact of e-government on the new generation productive capacities: Evidence from cross-country data. Sustainability 2024, 16, 3233. [Google Scholar]
- Cordery, C. J., & Hay, D. (2024). Public sector audit: New public management influences and eco-system driven reforms. Journal of Public Budgeting, Accounting & Financial Management. [CrossRef]
- DAMA International. (2017) DAMA-DMBOK: Data management body of knowledge (2nd ed.).
- Data governance: A conceptual framework, structured review, and research agenda. International Journal of Information Management 2019, 49, 424–438. [CrossRef]
- Denhardt, R. B. , & Denhardt, J. V. The new public service: Serving rather than steering. Public Administration Review 2000, 60, 549–559. [Google Scholar] [CrossRef]
- European Commission. (2016). General Data Protection Regulation (GDPR). Official Journal of the European Union. https://eur-lex.europa.eu/eli/reg/2016/679/oj.
- European Commission. (2022). Digital economy and society index (DESI) 2022 digital public services. https://ec.europa.eu/newsroom/dae/redirection/document/88768.
- European Commission. (2022). Digital public services for People with disabilities: Best practices in Europe. European Commission. https://ec.europa.eu/digital-strategy/digital-public-services.
- European Commission. (2022). Union of equality: Strategy for the rights of persons with disabilities 2021-2030. Publications Office of the European Union.
- Fattah, I. A. The mediating effect of data literacy competence in the relationship between data governance and data-driven culture. Industrial Management & Data Systems 2024, 124, 1823–1845. [Google Scholar] [CrossRef]
- George, D., & Mallery, P. (2003). SPSS for Windows step by step: A simple guide and reference (4th ed.). Allyn & Bacon.
- Hair, J. F. , Black, W. C., Babin, B. J., & Anderson, R. E. (2010). Multivariate data analysis: A global perspective (7th ed.). Pearson Education.
- Hinrichs, H. , & Wilkens, T. (2000). Metadata-based data auditing. WIT Transactions on Information and Communication Technologies.
- IDI. (2020). Strategic management handbook for supreme audit institutions. Intosai Development Initiative. https://www.idi.no/.
- Kline, R. B. (2016). Principles and practice of structural equation modeling (4th ed.). Guilford Publications.
- Lemke, C. , Monett, D., & Mikoleit, M. (2023). Digital ethics in data-driven organizations and AI ethics as application example. In T. Barton & C. Müller (Eds.), Apply data science (pp. 45–67). Springer Vieweg, Wiesbaden. [CrossRef]
- Mladenov, T. Disability and social justice. Disability & Society 2016, 31, 1226–1241. [Google Scholar] [CrossRef]
- Norris, M. , & Lecavalier, L. Evaluating the use of exploratory factor analysis in developmental disability psychological research. Journal of Autism and Developmental Disorders 2010, 40, 8–20. [Google Scholar] [CrossRef] [PubMed]
- OECD. (2019). OECD digital government studies: Digital government review of Sweden. OECD Publishing. https://www.oecd.org/digital/digital-government/.
- OECD. (2019). Methodological framework of the principles of public administration. OECD/SIGMA. https://par-portal.sigmaweb.org/.
- OECD. (2019). Public service delivery: Managing the digital transformation OECD Publishing. [CrossRef]
- OECD. (2019). The path to becoming a data-driven public sector OECD digital government studies. OECD Publishing. [CrossRef]
- OECD. (2023). The principles of public administration. OECD. https://www.sigmaweb.org/publications/Principles-of-Public-Administration-2023.pdf.
- OECD. Governing with artificial intelligence: Are governments ready? OECD Artificial Intelligence Papers 2024, 20. [Google Scholar] [CrossRef]
- Osborne, S. P. The new public governance? Public Management Review 2006, 8, 377–387. [Google Scholar] [CrossRef]
- Prabowo, H. , Ikhsan, R. B., & Yuniarty, Y. Student performance in online learning higher education: A preliminary research. Frontiers in Education 2022, 7. [CrossRef]
- Prakash, D. Data-driven management: The impact of big data analytics on organizational performance. International Journal for Global Academic & Scientific Research 2024, 3, 12–23. [Google Scholar] [CrossRef]
- Preuss, C. (2014). Retail marketing and sales performance: A definitive guide to optimizing service quality and sales effectiveness. Springer Gabler.
- Ronchi, E. , & Reimsbach-Kounatze, C. A decade and a half of OECD action on data governance policy-making. Réalités Industrielles 2022, 223, 71–74. [Google Scholar] [CrossRef]
- Rajasegar, R. S. , Gouthaman, P., Vijayakumar Ponnusamy, Arivazhagan, N., & Nallarasan, V. (2024). Data privacy and ethics in data analytics. In P. Singh, A. R. Mishra, & P. Garg (Eds.), Data analytics and machine learning (Vol. 145, pp. 125–150). Springer, Singapore. [CrossRef]
- Schein, E. H. (2010). Organizational culture and leadership (4th ed.). Jossey-Bass.
- Thompson, N., Ravindran, R., & Nicosia, S. (2015). Government data does not mean data governance: Lessons learned from a public sector application audit. Government Information Quarterly. [CrossRef]
- Transform Health. (2022). Governing health data for equity: Unlocking data and digital technology for the benefit of everyone Transform Health Initiative.
- Transform Health. (2022). Health data governance principles. https://transformhealth.org.
- United Nations. (2020). United Nations e-government survey 2020: Digital government in the decade of action for sustainable development. United Nations. https://publicadministration.un.org/egovkb/en-us/Reports/UN-E-Government-Survey-2020.
- United Nations Department of Economic and Social Affairs (UN DESA). (2018). Disability and development report: Realizing the sustainable development goals by, for and with persons with disabilities. United Nations.
- World Bank. (2024). Artificial intelligence in public sector data management. World Bank Publishing. https://www.worldbank.org/.
- World Health Organization. (2011). World report on disability. World Health Organization. https://www.who.int/publications/i/item/world-report-on-disability.
- World Health Organization. (2012). International classification of functioning, disability and health (ICF). WHO Press.
- World Health Organization, & World Bank. (2011). World report on disability. World Health Organization.
Figure 2.
Data Governance Factors for Auditing Public Services for People with disabilities in Thailand Model.
Figure 2.
Data Governance Factors for Auditing Public Services for People with disabilities in Thailand Model.
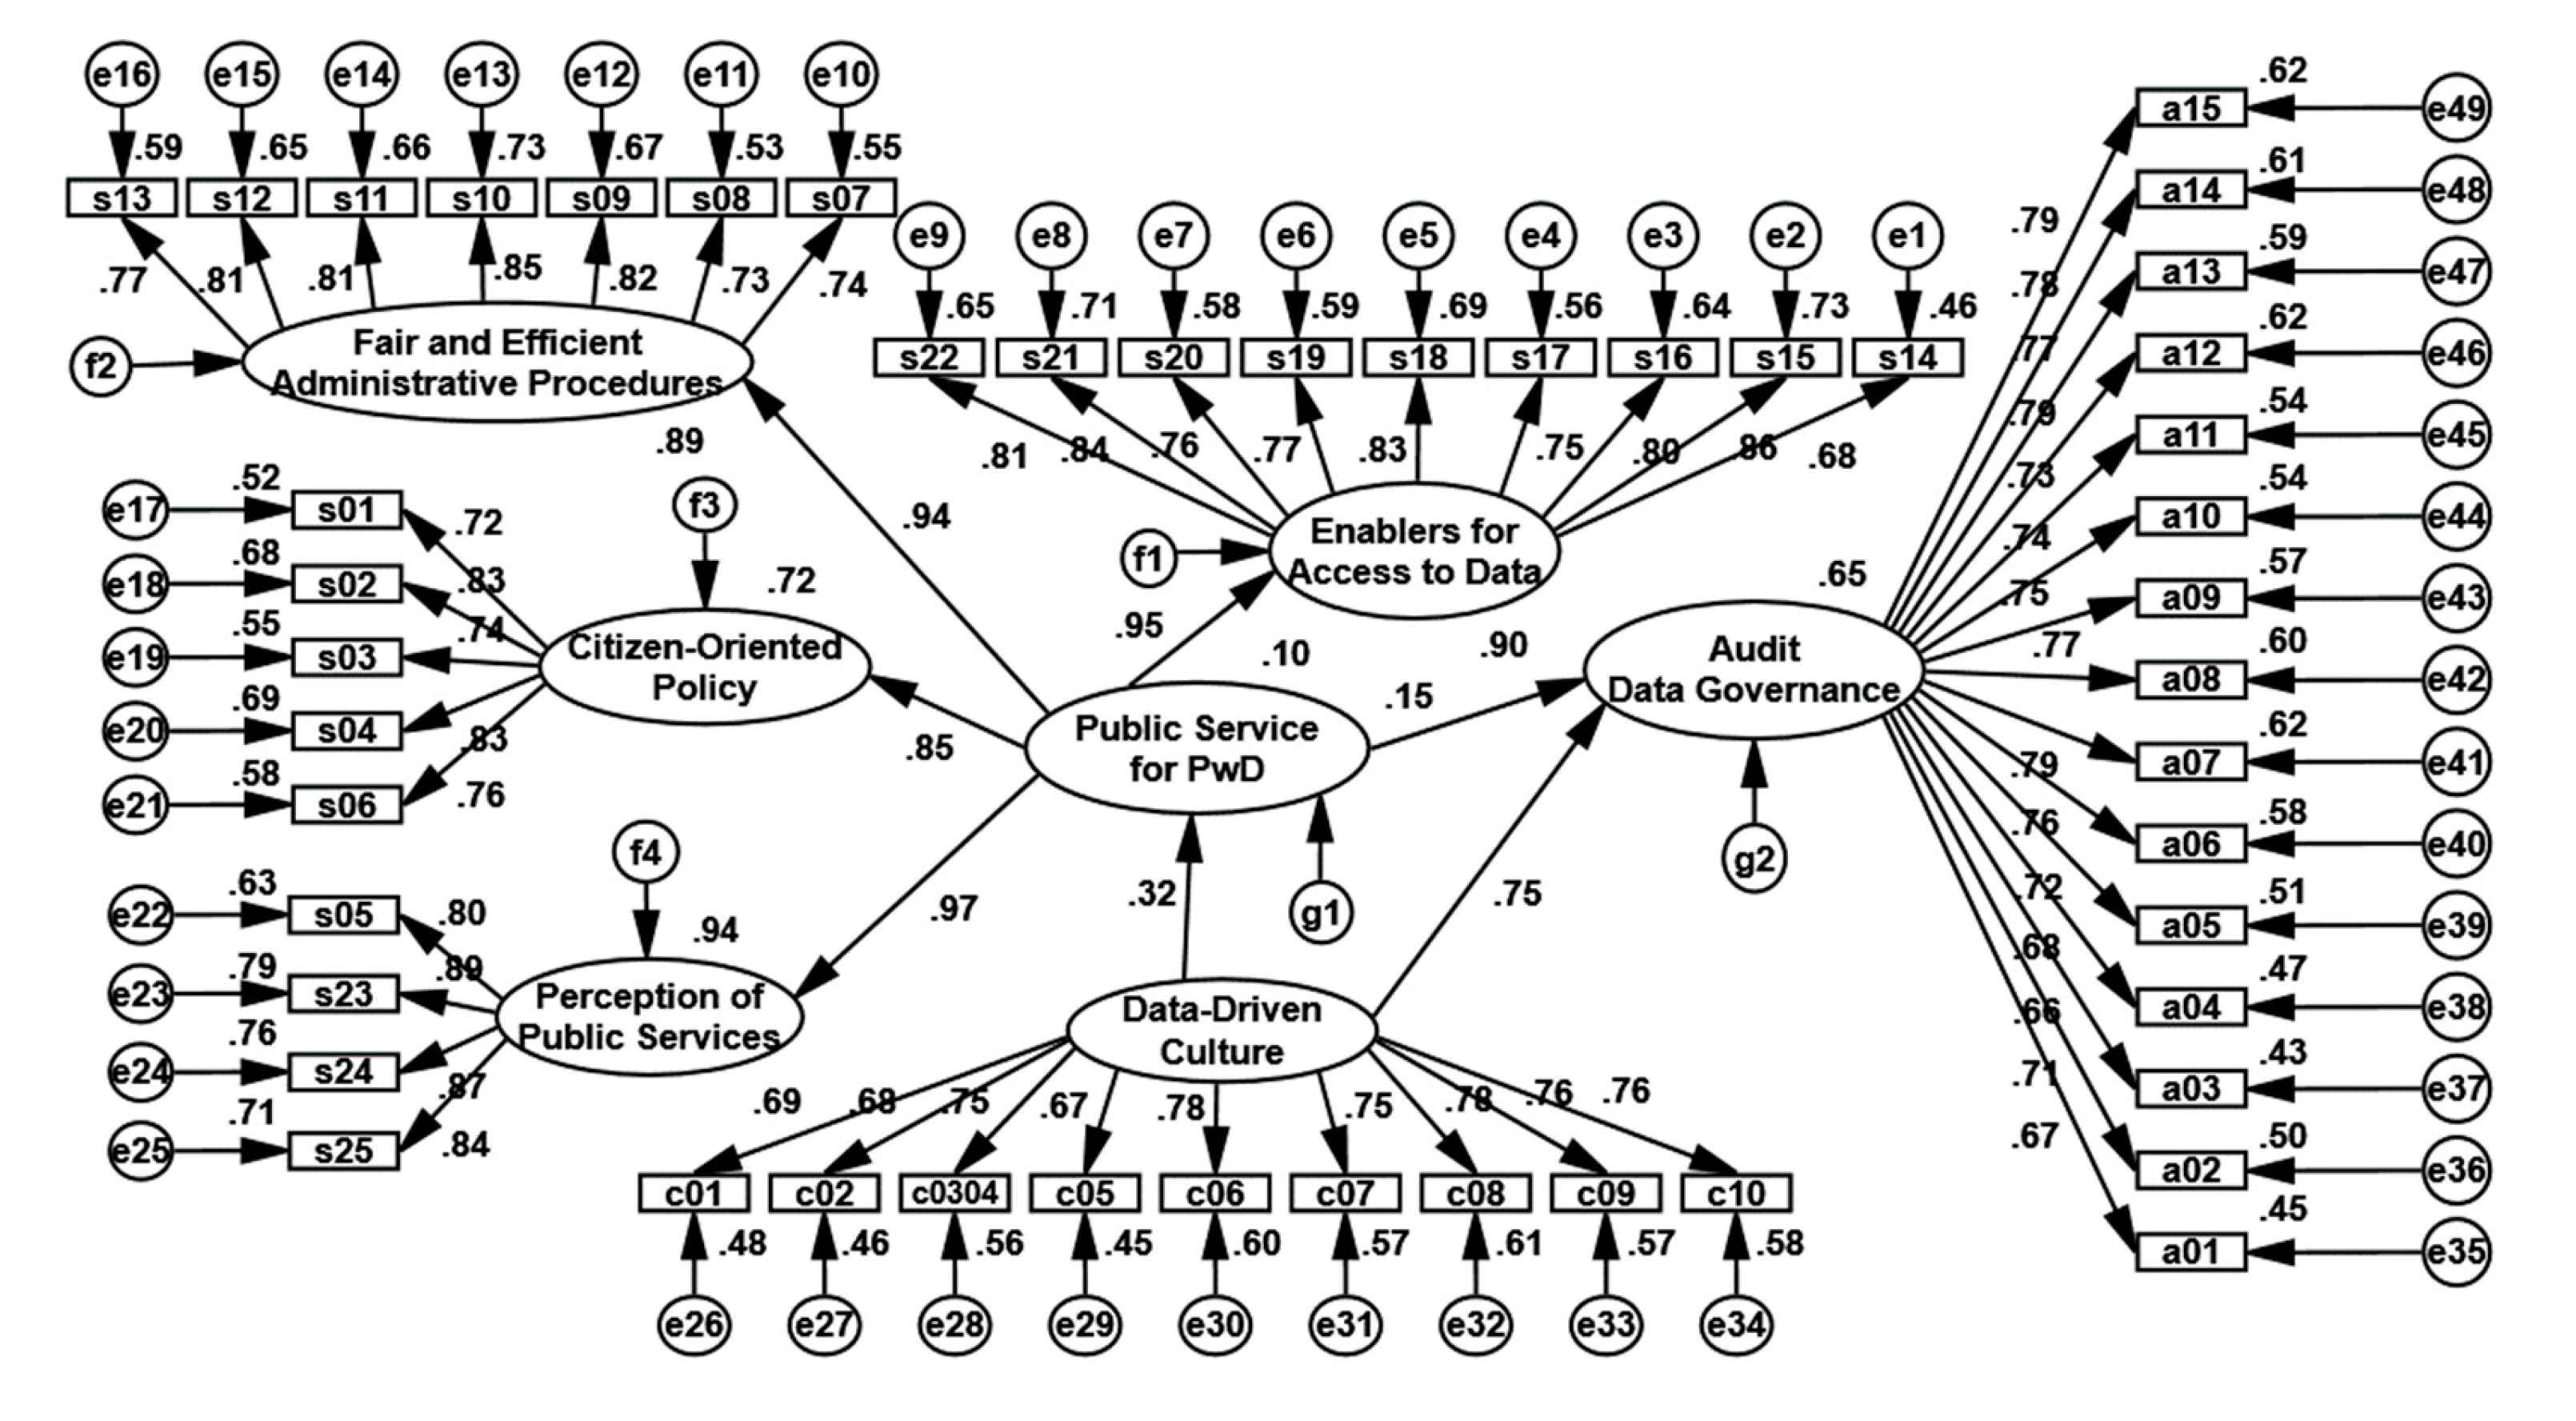

Table 1.
Standards and Thresholds for EFA, CFA, and SEM.
| Measure | Criteria | Source |
|---|---|---|
| EFA (Exploratory Factor Analysis) | ||
| KMO | > 0.80 (excellent), 0.70–0.79 (good), 0.60–0.69 (moderate), < 0.50 (unacceptable) | Kline (2016) |
| Bartlett’s Test | p-value < 0.05 (H1 acceptance) |
Bartlett (1950) |
| Eigenvalues | > 1.00 | Kaiser (1960) |
| Communalities | > 0.50 | Hair et al. (2019) |
| Factor Loadings | > 0.40 | |
| CFA (Confirmatory Factor Analysis) | ||
| Relative Chi-Square or χ2/df | < 5 | Hair et al. (2019) and Prabowo et al. (2022) |
| T-Value or C.R. (Critical Ratio) | > 3.29 (p-value < 0.001) | Kline (2016) |
| ASV & MSV | < AVE (Discriminant Validity) | Fornell & Larcker (1981) |
| AVE (Average Variance Extracted) | > 0.50 | Fornell & Larcker (1981) and Hair et al. (2019) |
| CR (Composite Reliability) | > 0.70 | |
| Chi-Square or χ2 | Significant p-values expected | Hair et al. (2019) |
| CFI or TLI | > 0.92 | |
| RMSEA | < 0.07 | |
| SRMR | < 0.08 | |
| Path Analysis | ||
| Relative Chi-Square or χ2/df | < 5 | Hair et al. (2019) and Prabowo et al. (2022) |
| R2 (Coefficient of Determination) | 0.75 (substantial), 0.50 (moderate), 0.25 (weak) | Hair et al. (2019) |
| Chi-Square or χ2 | Significant p-values expected | |
| CFI or TLI | > 0.92 | |
| RMSEA | < 0.07 | |
| SRMR | < 0.08 | |
| SEM (Structural Equation Modeling) | ||
| Relative Chi-Square or χ2/df | < 5 | Hair et al. (2019) and Prabowo et al. (2022) |
| Chi-Square or χ2 | Significant p-values expected | Hair et al. (2019) |
| CFI or TLI | > 0.92 | |
| RMSEA | < 0.07 | |
| SRMR | < 0.08 | |
Table 2.
Model matrix and dimension comparison of influence factors of Data Governance for Auditing Public Services for People with disabilities in Thailand.
Table 2.
Model matrix and dimension comparison of influence factors of Data Governance for Auditing Public Services for People with disabilities in Thailand.
| Dimension | EFA Factor | Composition | Commu-nalities | KMO | p-Value | ||||||
| 1 | 2 | 3 | |||||||||
| Public Service Delivery: Perception of Public Services | s23 | General service accessibility satisfaction | 0.696 | 0.825 | 0.970 | 0.001 | |||||
| s05 | Service quality satisfaction | 0.644 | 0.755 | ||||||||
| s24 | Digital service accessibility satisfaction | 0.626 | 0.788 | ||||||||
| s25 | Time and cost accessibility satisfaction | 0.585 | 0.738 | ||||||||
| Public Service Delivery: Enablers for Access to Data |
s20 | Public disclosure of disability statistics | 0.747 | 0.686 | |||||||
| s17 | Digital disability registry | 0.744 | 0.682 | ||||||||
| s22 | WCAG compliance testing | 0.740 | 0.716 | ||||||||
| s21 | Government website accessibility | 0.713 | 0.700 | ||||||||
| s18 | Interoperable data exchange framework | 0.687 | 0.708 | ||||||||
| s14 | Use of electronic or digital signatures | 0.648 | 0.545 | ||||||||
| s19 | One-stop service for People with disabilities | 0.637 | 0.594 | ||||||||
| s15 | Service management tools | 0.608 | 0.695 | ||||||||
| s16 | Consultation services for people with disabilities | 0.597 | 0.657 | ||||||||
| Public Service Delivery: Fair&Efficient Administrative Procedures |
s10 | Comprehensive public service legislation | 0.711 | 0.763 | |||||||
| s11 | Service quality audit against resource usage | 0.710 | 0.763 | ||||||||
| s09 | Efficiency and resource optimization | 0.696 | 0.748 | ||||||||
| s08 | Legal framework for service delivery | 0.677 | 0.667 | ||||||||
| s12 | Value-for-money reporting | 0.656 | 0.738 | ||||||||
| s07 | Service process efficiency | 0.585 | 0.679 | ||||||||
| s13 | Compliance with international service standards | 0.508 | 0.620 | ||||||||
| Public Service Delivery: Citizen-Oriented Policy | s01 | Joint planning and responsibility assignment | 0.744 | 0.691 | |||||||
| s02 | Budget allocation and monitoring | 0.740 | 0.745 | ||||||||
| s03 | Information Tech. Policy | 0.730 | 0.697 | ||||||||
| s04 | Budget allocation and monitoring | 0.705 | 0.701 | ||||||||
| s06 | Provincial-level coordination | 0.348 | 0.568 | ||||||||
| Data-Driven Organization | c08 | Open, Trusting Culture | 0.841 | 0.707 | 0.939 | 0.000 | |||||
| c06 | Inquisitive, Questioning Culture | 0.831 | 0.690 | ||||||||
| c07 | Goals-First Culture | 0.805 | 0.648 | ||||||||
| c09 | Data analysis training and team communication skills | 0.800 | 0.640 | ||||||||
| c10 | Data Handling Ethics | 0.783 | 0.612 | ||||||||
| c01 | Data Leadership | 0.768 | 0.590 | ||||||||
| c0304 | Anti-HiPPO Culture | 0.765 | 0.586 | ||||||||
| c05 | Iterative, Learning Culture | 0.761 | 0.578 | ||||||||
| c02 | Data leadership career paths and incentives | 0.724 | 0.525 | ||||||||
| Audit Data Governance |
a12 | Metadata management | 0.842 | 0.708 | 0.970 | 0.000 | |||||
| a07 | Data sharing and collaboration | 0.842 | 0.708 | ||||||||
| a08 | Big data management | 0.828 | 0.686 | ||||||||
| a11 | Innovation creation | 0.828 | 0.686 | ||||||||
| a15 | Data quality | 0.827 | 0.684 | ||||||||
| a14 | Promotion of equitable data benefits | 0.824 | 0.680 | ||||||||
| a06 | Data model design and development/ Data Architecture | 0.819 | 0.671 | ||||||||
| a09 | In-depth data analysis/ Data Science | 0.818 | 0.670 | ||||||||
| a13 | Data ownership and access rights | 0.815 | 0.664 | ||||||||
| a02 | Trust-building in data systems | 0.807 | 0.652 | ||||||||
| a05 | Master and reference data management | 0.800 | 0.639 | ||||||||
| a10 | Application of data to emerging digital technologies | 0.798 | 0.638 | ||||||||
| a03 | Ensure data security | 0.796 | 0.633 | ||||||||
| a04 | Data system and service enhancement | 0.789 | 0.623 | ||||||||
| a01 | Protection of individuals or communities | 0.782 | 0.612 | ||||||||
| % of Variance | 3.257 | 3.698 | 5.860 | 57.068 | 61.956 | 66.358 | |||||
| Extraction Method: Principal Component Analysis. | |||||||||||
| Rotation Method: Varimax with Kaiser Normalization. | |||||||||||
Table 3.
CFA results.
| Path | b | S.E. | T-Value | R2 | ASV | MSV | AVE | CR | Fit index | |
|---|---|---|---|---|---|---|---|---|---|---|
| Perception of Public Services <--- Public Service Delivery for People with disabilities |
1.000 | 0.901 | - | - | 0.811 | 0.705 | 0.832 | 0.839 | 0.954 | χ2 = 742.855, df = 249, Relative χ2= 2.983, p-value = .000, RMSEA = .053, SRMR = .025, CFI = .965, TLI = .958 |
| Citizen-Oriented Policy <--- Public Service Delivery for People with disabilities |
0.904 | 0.894 | 0.047 | 21.283 | 0.799 | |||||
| Fair & Efficient Admin. Procedures <--- Public Service Delivery for People with disabilities |
0.959 | 0.955 | 0.045 | 19.864 | 0.912 | |||||
| Enablers for Access to Data <--- Public Service Delivery for People with disabilities |
0.918 | 0.912 | 0.04 | 22.676 | 0.832 | |||||
| s15 <--- Enablers for Access to Data | 1.000 | 0.850 | - | - | 0.723 | 0.378 | 0.523 | 0.609 | 0.933 | χ2 = 719.291, df = 247, Relative χ2= 2.912, p-value = .000, RMSEA = .052, SRMR = .023, CFI = .967, TLI = .960 |
| s17 <--- Enablers for Access to Data | 0.986 | 0.788 | 0.042 | 23.419 | 0.622 | |||||
| s18 <--- Enablers for Access to Data | 0.985 | 0.840 | 0.034 | 28.501 | 0.705 | |||||
| s19 <--- Enablers for Access to Data | 0.958 | 0.728 | 0.042 | 22.866 | 0.531 | |||||
| s14 <--- Enablers for Access to Data | 0.940 | 0.690 | 0.044 | 25.572 | 0.476 | |||||
| s22 <--- Enablers for Access to Data | 0.938 | 0.780 | 0.037 | 21.143 | 0.608 | |||||
| s16 <--- Enablers for Access to Data | 0.933 | 0.824 | 0.034 | 24.329 | 0.679 | |||||
| s20 <--- Enablers for Access to Data | 0.927 | 0.760 | 0.038 | 27.242 | 0.577 | |||||
| s21 <--- Enablers for Access to Data | 0.868 | 0.751 | 0.036 | 24.177 | 0.565 | |||||
| s13 <--- Fair & Efficient Admin. Procedures | 1.000 | 0.778 | - | - | 0.606 | 0.410 | 0.520 | 0.638 | 0.925 | |
| s11 <--- Fair & Efficient Admin. Procedures | 0.974 | 0.827 | 0.040 | 23.961 | 0.683 | |||||
| s10 <--- Fair & Efficient Admin. Procedures | 0.966 | 0.849 | 0.039 | 24.826 | 0.721 | |||||
| s12 <--- Fair & Efficient Admin. Procedures | 0.944 | 0.801 | 0.041 | 23.581 | 0.642 | |||||
| s09 <--- Fair & Efficient Admin. Procedures | 0.941 | 0.813 | 0.040 | 23.063 | 0.661 | |||||
| s07 <--- Fair & Efficient Admin. Procedures | 0.859 | 0.744 | 0.040 | 21.152 | 0.554 | |||||
| s08 <--- Fair & Efficient Admin. Procedures | 0.849 | 0.776 | 0.041 | 21.987 | 0.602 | |||||
| s02 <--- Citizen-Oriented Policy | 1.000 | 0.763 | - | - | 0.583 | 0.311 | 0.370 | 0.555 | 0.861 | |
| s04 <--- Citizen-Oriented Policy | 0.902 | 0.780 | 0.040 | 22.216 | 0.608 | |||||
| s06 <--- Citizen-Oriented Policy | 0.846 | 0.772 | 0.048 | 18.461 | 0.596 | |||||
| s03 <--- Citizen-Oriented Policy | 0.790 | 0.724 | 0.043 | 19.902 | 0.523 | |||||
| s01 <--- Citizen-Oriented Policy | 0.738 | 0.681 | 0.037 | 20.616 | 0.464 | |||||
| s23 <--- Perception of Public Services | 1.000 | 0.860 | - | - | 0.739 | 0.525 | 0.601 | 0.724 | 0.913 | |
| s24 <--- Perception of Public Services | 0.999 | 0.881 | 0.032 | 30.855 | 0.775 | |||||
| s25 <--- Perception of Public Services | 0.982 | 0.851 | 0.034 | 29.062 | 0.725 | |||||
| s05 <--- Perception of Public Services | 0.916 | 0.809 | 0.036 | 25.844 | 0.654 | |||||
| c06 <--- Data-Driven Organization | 1.000 | 0.826 | - | - | 0.682 | 0.321 | 0.483 | 0.559 | 0.919 | χ2 = 63.382, df = 22, Relative χ2= 2.881, p-value = .000, RMSEA = .051, SRMR = .008, CFI = .989, TLI = .982 |
| c08 <--- Data-Driven Organization | 0.990 | 0.834 | 0.038 | 25.842 | 0.682 | |||||
| c09 <--- Data-Driven Organization | 0.926 | 0.759 | 0.041 | 22.843 | 0.695 | |||||
| c07 <--- Data-Driven Organization | 0.923 | 0.803 | 0.038 | 24.594 | 0.577 | |||||
| c05 <--- Data-Driven Organization | 0.897 | 0.726 | 0.042 | 21.189 | 0.644 | |||||
| c10 <--- Data-Driven Organization | 0.860 | 0.726 | 0.041 | 21.205 | 0.527 | |||||
| c01 <--- Data-Driven Organization | 0.817 | 0.706 | 0.040 | 20.444 | 0.527 | |||||
| c0304 <--- Data-Driven Organization | 0.816 | 0.690 | 0.041 | 19.925 | 0.498 | |||||
| c02 <--- Data-Driven Organization | 0.721 | 0.632 | 0.041 | 17.689 | 0.477 | |||||
| a08 <--- Audit Data Governance | 1.000 | 0.821 | - | - | 0.675 | 0.400 | 0.503 | 0.630 | 0.962 | χ2 = 228.482, df = 77, Relative χ2= 2.967, p-value = .000, RMSEA = .053, SRMR = .009, CFI = .983, TLI = .977 |
| a09 <--- Audit Data Governance | 0.998 | 0.820 | 0.038 | 26.345 | 0.673 | |||||
| a12 <--- Audit Data Governance | 0.993 | 0.842 | 0.036 | 27.409 | 0.709 | |||||
| a06 <--- Audit Data Governance | 0.977 | 0.805 | 0.038 | 25.568 | 0.648 | |||||
| a15 <--- Audit Data Governance | 0.963 | 0.818 | 0.037 | 26.228 | 0.669 | |||||
| a14 <--- Audit Data Governance | 0.959 | 0.815 | 0.040 | 24.093 | 0.665 | |||||
| a07 <--- Audit Data Governance | 0.954 | 0.827 | 0.036 | 26.659 | 0.684 | |||||
| a10 <--- Audit Data Governance | 0.951 | 0.795 | 0.038 | 25.118 | 0.631 | |||||
| a05 <--- Audit Data Governance | 0.946 | 0.783 | 0.039 | 24.559 | 0.613 | |||||
| a11 <--- Audit Data Governance | 0.929 | 0.814 | 0.036 | 26.029 | 0.663 | |||||
| a13 <--- Audit Data Governance | 0.922 | 0.794 | 0.037 | 25.028 | 0.630 | |||||
| a03 <--- Audit Data Governance | 0.882 | 0.745 | 0.039 | 22.892 | 0.555 | |||||
| a02 <--- Audit Data Governance | 0.856 | 0.759 | 0.036 | 23.491 | 0.576 | |||||
| a04 <--- Audit Data Governance | 0.854 | 0.737 | 0.038 | 22.518 | 0.543 | |||||
| a01 <--- Audit Data Governance | 0.810 | 0.717 | 0.035 | 23.447 | 0.514 |
Note: b is the estimate, is standardized estimate, S.E. is standard error, R2 is squared multiple correlations, ASV is average shared variance, MSV is maximum shared variance, AVE is average variance extracted, CR is composite reliability, χ2 is chi-square, df is the degree of freedom, RMSEA is the root mean square error of approximation, SRMR is standardized root mean square residual, CFI is the comparative fit index, TLI is the Tacker-Lewis index.
Table 4.
Key Drivers of Audit Data Governance: Standardized Effects of a Data-Driven Organization Model.
Table 4.
Key Drivers of Audit Data Governance: Standardized Effects of a Data-Driven Organization Model.
| Explanatory Variable | Data-Driven Organization | ||||
|---|---|---|---|---|---|
| Latent Variable | Observed Variable | TE | DE | IE | Estimate |
| Data-Driven Organization | c08 | 0.783 | 0.783 | 0 | 0.783 |
| c06 | 0.777 | 0.777 | 0 | 0.777 | |
| c10 | 0.759 | 0.759 | 0 | 0.759 | |
| c09 | 0.756 | 0.756 | 0 | 0.756 | |
| c07 | 0.752 | 0.752 | 0 | 0.752 | |
| c0304 | 0.745 | 0.745 | 0 | 0.745 | |
| c01 | 0.692 | 0.692 | 0 | 0.692 | |
| c02 | 0.681 | 0.681 | 0 | 0.681 | |
| c05 | 0.674 | 0.674 | 0 | 0.674 | |
| Audit Data Governance | Outcome Variable | 0.796 | 0.748 | 0.048 | 0.748 |
| a07 | 0.629 | 0 | 0.629 | 0.790 | |
| a12 | 0.625 | 0 | 0.625 | 0.786 | |
| a15 | 0.625 | 0 | 0.625 | 0.785 | |
| a14 | 0.622 | 0 | 0.622 | 0.781 | |
| a08 | 0.615 | 0 | 0.615 | 0.772 | |
| a13 | 0.609 | 0 | 0.609 | 0.765 | |
| a06 | 0.607 | 0 | 0.607 | 0.763 | |
| a09 | 0.598 | 0 | 0.598 | 0.752 | |
| a10 | 0.585 | 0 | 0.585 | 0.735 | |
| a11 | 0.582 | 0 | 0.582 | 0.732 | |
| a05 | 0.571 | 0 | 0.571 | 0.717 | |
| a02 | 0.561 | 0 | 0.561 | 0.705 | |
| a04 | 0.544 | 0 | 0.544 | 0.683 | |
| a01 | 0.533 | 0 | 0.533 | 0.670 | |
| a03 | 0.522 | 0 | 0.522 | 0.656 | |
Note: TE is the total effect, DE is the direct effect, IE is the indirect effect, and Estimate is standardized regression weights.
Table 5.
Fit index calculation.
| Index Name | Results | Evaluation |
|---|---|---|
| χ2 | 1983.192 | Significant |
| df | 1060 | |
| p-value | .000 | |
| Relative χ2 (χ2 /df) | 1.871 | Well |
| RMSEA | .051 | Well |
| SRMR | .033 | Well |
| CFI | .930 | Well |
| TLI | .922 | Well |
Table 6.
Path Analysis.
| Path coefficient | Latent Exogenous Variables | ||||||
|---|---|---|---|---|---|---|---|
| Data-Driven Organization | Public Service Delivery for People with disabilities |
R2 | |||||
| Latent Endogenous Variables | TE | DE | IE | TE | DE | IE | |
| Audit Data Governance | 0.796 | 0.748 | 0.048 | 0.150 | 0.150 | 0 | 0.653 |
| Public Service Delivery for People with disabilities | 0.320 | 0.320 | 0 | 0 | 0 | 0 | 0.103 |
| Perception of Public Services | 0.311 | 0 | 0.311 | 0.972 | 0.972 | 0 | 0.944 |
| Enablers for Access to Data | 0.303 | 0 | 0.303 | 0.948 | 0.948 | 0 | 0.898 |
| Fair & Efficient Admin. Procedures | 0.302 | 0 | 0.302 | 0.942 | 0.942 | 0 | 0.887 |
| Citizen-Oriented Policy | 0.271 | 0 | 0.271 | 0.848 | 0.848 | 0 | 0.718 |
Note: TE is the total effect, DE is the direct effect, IE is the indirect effect, and R2 is the coefficient of determination.
Disclaimer/Publisher’s Note: The statements, opinions and data contained in all publications are solely those of the individual author(s) and contributor(s) and not of MDPI and/or the editor(s). MDPI and/or the editor(s) disclaim responsibility for any injury to people or property resulting from any ideas, methods, instructions or products referred to in the content. |
© 2025 by the authors. Licensee MDPI, Basel, Switzerland. This article is an open access article distributed under the terms and conditions of the Creative Commons Attribution (CC BY) license (http://creativecommons.org/licenses/by/4.0/).
Copyright: This open access article is published under a Creative Commons CC BY 4.0 license, which permit the free download, distribution, and reuse, provided that the author and preprint are cited in any reuse.


