
Submitted:
12 February 2025
Posted:
13 February 2025
You are already at the latest version
Abstract
One of the main plants that people grow is the fig (Ficus carica L.). Nearly every component of the fig is utilized for food and medicine, but handling and storing them after harvest is challenging because of their extreme perishability. Response Surface Methodology (RSM) and mixture design were used to optimize the composition of the fig gum jelly. The percentages of fig paste (x1), k-carrageenan (x2), and honey (x3) are independent variables. Nine reactions were assessed by the sensory panel, which included ten elements of both sexes. Y1: Exceptional, Y2: Openness, Y3: Fragrant, Texture A in Y4, Texture C in Y5, Sweetness A (Y6), Sweetness B (Y7), Mouthfeel in Y8 and Y9 - nine polynomial models were created by the overall opinion. With 55 % fig paste, 15 % k-carrageenan, and 30 % honey, the optimal fig gum jelly composition was obtained through numerical optimization. With an astounding 0.3 desirability, the same panel's validation favored the best formulation for every response.
Keywords:
K-carrageenan
; fig
; fig gum jelly
; shelf life & RSM
1. Introduction
Although its origin is unknown, figs have been a staple in the diets of people of the Middle East and Mediterranean region since ancient times due to their lifespan [1]. Out of all the fig species, Ficus carica is the most important commercially [2]. With approximately 800 species of epiphytes, trees, and shrubs in tropical and subtropical climates worldwide, it is one of the largest genera of Angiosperms and an evergreen tree of the mulberry family moraceae with significant nutritional value [3]. In the Mediterranean and Middle East regions, figs are part of their staple diet since the ancient years and it has been considered because of the sign of longevity [1]. Because figs are low in fat and cholesterol and abundant in amino acids and phenolic compounds, they are utilized as a delicious source of minerals, vitamins, carbohydrates, and dietary fiber [4,5].
Fig fruits can be consumed raw, dried, canned, or preserved in various ways, such as jam and sweets, which can be consumed right away or used to make cakes and other treats. According to USDA data, among dried fruits, dried figs have the greatest nutrient score since they are a significant source of vitamins and minerals [6]. Iron, protein, calories, and fiber are all abundant in figs. Compared to milk, it has the highest calcium content. According to Gani et al. [7], the nutritive index of fig is 11, whereas that of date palm and apple are 6, 8, and 9.
According to Villalobos et al. [8], the fig is classified as a climacteric fruit with a moderate rate of ethylene production and respiration. The fruit's commercial quality is mostly determined by the maturity stage at which it is picked. Figs are extremely perishable, just like other fruits and vegetables. Numerous packing methods created by researchers have the potential to increase the shelf life of figs by up to 21 days following harvest. Due to the afore-mentioned facts, a large portion of the figs that are collected are often processed into dried figs. Currently, this approach is evolving because of growing market demand.
According to a recent study [9], some packaging forms can quadruple the shelf life of fresh figs, extending the shelf life of fig varietals. Their use of ultrasonic pre-treatments to save drying times and enhance fruit handling is one of their most intriguing advances. Unlike typical sun drying methods, which need an average of fifteen days, the fruit can be dried in as little as one to three days.
Because the thin fruit skin can easily rupture, causing rapid loss of nutritional contents and increased permeability for microbial invasion, figs are extremely perishable and difficult to handle and store after harvest [10]. Only a small percentage of figs can occasionally be sold as fresh fruits while maintaining all their nutritional and sensory qualities.
Traditionally, to extend the shelf life, figs are dried and eaten in this manner or in snack bars or cookies. [11]. This study aims to add value by producing fig gum jelly which can be available all year round with longer shelf life and evolution of new products.
Table 1 is a summary of the nutritional content of both fresh and dried figs.
This crop could be valued by producing a fig product with nutritional properties close to fresh fruit but with longer shelf life which is the basis of this research.
2. Materials and Methods
The gum used in product formulation was created by combining several thickeners (K-carrageenan, gellan and alginate) in varying ratios with water to produce a paste that was heated to between 82 and 85 °C. To create fig gums, fig was mixed with different natural food ingredients in different proportions until an optimum design was produced. To determine the product's ideal texture, firmness was examined. This is shown in Figure 1A,B.
Through the investigation to develop fig gum jelly, the best result was obtained as shown in Table 1.
2.1. Mixture Design
Four ingredients were used to create fig jelly gum: water, honey, k-carrageenan, and fig paste. The K-carrageenan always contained water at a fixed percentage (92.5%). Each component's minimum and maximum levels were determined, as shown in Table 2.
According to Anderson and Whitcomb [12], to choose the optimal amount of experience, polynomial was chosen to obtain a prediction model for the result obtained. In this instance, we chose Scheffée's quadratic polynomial model:
Yi= β1x1 + β2x2 + β3x3 + β12x1x2 + β23x2x3 + β13x1x3 eq. (1)
Where Yi is the value of the dependent variable of parameter I and x1, x2 and x3 represent the three components of the film; β1, β2 and β3 represent the linear regression coefficients; β12, β23 and β13 are the quadratic regression coefficients [12].
First, it selected each component's lowest and maximum values based on Table 2. To fit the selected polynomial model, the software then produced a design with several surplus points. In order to minimize the standard deviation error in the most central region, which was of the greatest interest, and to balance the number of degrees of freedom between those destined to evaluate the pure error (g.l. 3; error inherent to the experimental procedure) and the lack of adjustment of the model to the experimental points (g.l. 3; Table 2 and Table 3, and Figure 2), an evaluation was conducted after the design was obtained.
Because the studies were conducted on three separate days, the design was split into three blocks to minimize or eliminate error. To assess the pure error, the center and vertices were duplicated. A total of eighteen experiences were used to obtain a design.
2.2. Sensory Evaluation
The judges were asked to rate how much they liked or disliked the product using six points on the hedonic scale.
2.3. Optimization of Fig Jelly Gum
Through experimental design and sensory research, the optimal formulation of fig jelly gum was optimized. The numbers of independent parameters that produce the least variation on the desired quality were chosen using an experimental methodology.
To learn more about the system, it was also utilized to fit experimental data to an empirical function. Following the establishment of objectives and constraints (minimum and maximum) for every response, the estimates were transformed to produce a desired range (13).
2.4. Validation of the Optimum Formulation
Desirability, a multiple response technique, was used to optimize. A process for defining the connection between expected answers on a dependent variable and the attractiveness of the responses was included in this optimization approach, along with preferences and priorities for every variable created.
The same sensory panel used the optimal value and a close-to-optimal but deviant choice to confirm the optimal formulation. The optimal value was then maintained with the higher value after the mean and standard deviation were computed.
3. Results and Discussion
3.1. Fig Gum Jelly Prediction Models
3.2. Optimization
Optimization and validation of the parameters with higher effect on the model were considered as restrictions. For each response, a restriction was imposed according to the requirements for the film developed. This restriction was either minimum or maximum value (Table 5). In the optimization of the best formulation, a desirability value (di) (eq. 1) was obtained for each response, through the transformation of the Yi responses (14).
The percentage value for the optimized fig jelly product is shown in Table 6
The ANOVA for the optimized fig jelly product and the other product with their responses. This shows that the responses are significantly different from one another with P< 0.05 while the two samples are not significantly different from each other.

Table 7.
Statistical analysis of variance (ANOVA) for responses and the of optimum versus another sample.
Table 7.
Statistical analysis of variance (ANOVA) for responses and the of optimum versus another sample.
| ANOVA | ||||||
|---|---|---|---|---|---|---|
| Source of Variation | SS | df | MS | F | P-value | F crit |
| Responses | 1.372272 | 1 | 1.372272 | 9.868222 | 0.013777 | 5.317655 |
| Samples | 2.762478 | 8 | 0.34531 | 2.483176 | 0.109923 | 3.438101 |
| Error | 1.112478 | 8 | 0.13906 | |||
| Total | 5.247228 | 17 |
The Figure 5 below shows the radar representation of the sensory characteristics of the optimized and other sample, which is close to the optimized product, in terms of responses.
3.3. Statistical Analysis
An analysis of variance (ANOVA) was performed by the design expert for model adjustment of responses which helps to screen for vital factors and detect ideal process settings to accomplish peak performance and to discover the optimal product formulations.
4. Conclusions
Figs are extremely valuable fruits with high nutritional content that shouldn't be wasted on the field or at the table of customers. The process of valuing figs extends their shelf life and creates products like fig gum that are enjoyable for both young and elderly and promote good health. This investigation found that the blanched goods and the solar oven dryer dried more quickly. Kappa carrageenan provided the best option for the gums tested with fig paste and honey, which led to the formulation of fig gum jelly after studying for the ideal composition for a superior sensory opinion.
Response Surface Methodology (RSM) and a mixture design were used to optimize the gum composition. The independent variables were the percentage of fig paste (x1), k-Carrageenan (x2), and honey (x3). Six (6) responses were evaluated by a sensory panel consisting of ten components of both sexes: brilliance (Y1), transparency (Y2), fragrance (Y3), texture (Y4), sweetness (Y5), and overall opinion (Y6). Six polynomial models were produced.
With significant reactions, the optimal fig gum jelly composition was determined by numerical optimization to contain 55% fig paste, 15% k-carrageenan, and 30% honey.
Following validation, the panelists’ average values matched the best predicted answers.
A fig gum jelly recipe that the panelists approved of was produced. According to study, fig gum jelly has a shelf life of up to 25 days when refrigerated and 21 days when not, which is longer than the fresh fig's one-week shelf life. Future studies could further extend the shelf life of the fig gum jelly by using appropriate packaging materials with a modified atmospheric state, even if properly sealed plastic pouches could have been utilized to extend the product's shelf life. The product is in Figure 6.
References
- Arvaniti, O S., Samarasa, Y., Gatidoub, G., Thomaidisc, N. S. and Stasinakisb, A. S (2019). Review on fresh and dried figs: Chemical analysis and occurrence of phytochemical compounds, antioxidant capacity and health effects. Food Research International. [CrossRef]
- Borola, M.I. , Mostacero, N.R. and Lopez, S.N. (2014). Ficus carica. [CrossRef]
- Mitrofanova, I. , Mitrofanova, O., Lesnikova-Sedoshenko, N., Chelombit, S. and Shishkina, E (2016). Phytosanitary status of Ficus carica collection. Acta Hortic. [CrossRef]
- Sandhu, A.K.; Islam, M.; Edirisinghe, I. ; Burton-Freeman, B (2023). Phytochemical Composition and Health Benefits of Figs (Fresh and Dried): A Review of Literature from 2000 to 2022. Nutrients,. [CrossRef]
- Shukranal, M. , Khairana, H and Ibrahim, J (2013). Ficus carica L. (Moraceae): Phytochemistry, Traditional Uses and Biological Activities. Evid Based Complement Alternat Med. [CrossRef]
- Nikhat, S. , Ansari, S., Shamsi, Y. and Salma, S. (2020). Ficus carica L.: A panacea of Nutritional and medicinal benefits. Review Article. TANG. [CrossRef]
- Gani, G. , Fatima, T. and Qadri, T.B. (2018). Phytochemistry and Pharmacological activities of Fig (Ficus carica): A Review. Int. J. of Research in Pharm. and Pharmaceutical Sci.
- Villalobos, M.C. , Serradilla, M.J., Martin, A., Lopez-Corrales, M., Pereira, C. and Cordoba, M.G. (2016). Preservation of different fig cultivars (Ficus carica L.) under modified atmosphere packaging during cold storage. Journal of Science of Food and Agriculture. [CrossRef]
- Souza, J.M.A.; Leonel, S.; Leonel, M.; Garcia, E.L.; Ribeiro, L.R.; Ferreira, R.B.; Martins, R.C.; de Souza Silva, M.; Monteiro, L.N.H.; Duarte, A. S (2023). Calcium Nutrition in Fig Orchards Enhance Fruit Quality at Harvest and Storage. Horticulturae. [CrossRef]
- Reyes-Avalos, M.C. , Femenia, A., Minjares-Fuentes,R., Contreras-Esquivel, J.C., Aguilar- Gonzalez, C.N., Esparza-Rivera, J.R. and Meza-Velazguez, J.A. (2016). Improvement of the quality and the shelf life of figs (Ficus carica) using an Alginate-Chitosan Edible Film. Food Bioprocess Technol. /: https, 1007. [Google Scholar]
- USDA National Nutrient Database for Standard References (2019). https://ndb.nal.usda.
- Anderson, M. J and Whitcomb, P.J. (1996). Optimization of paint formulations is made easy with computer-aided design of experiments for mixtures. J coatings Technol. 68(858),71-75.
- Myers, R.H. , Montgomery, D.C. and Anderson-Cook, C. M. (1995). Response surface methodology: Process and product optimization using designed experiments, Third Ed, A John Wiley & Sons, INC., Publication, New Jersey, USA, pg 220-222.
Figure 1.
A, B - Textural analysis of fig gum using flat end and knife edge probe, respectively.
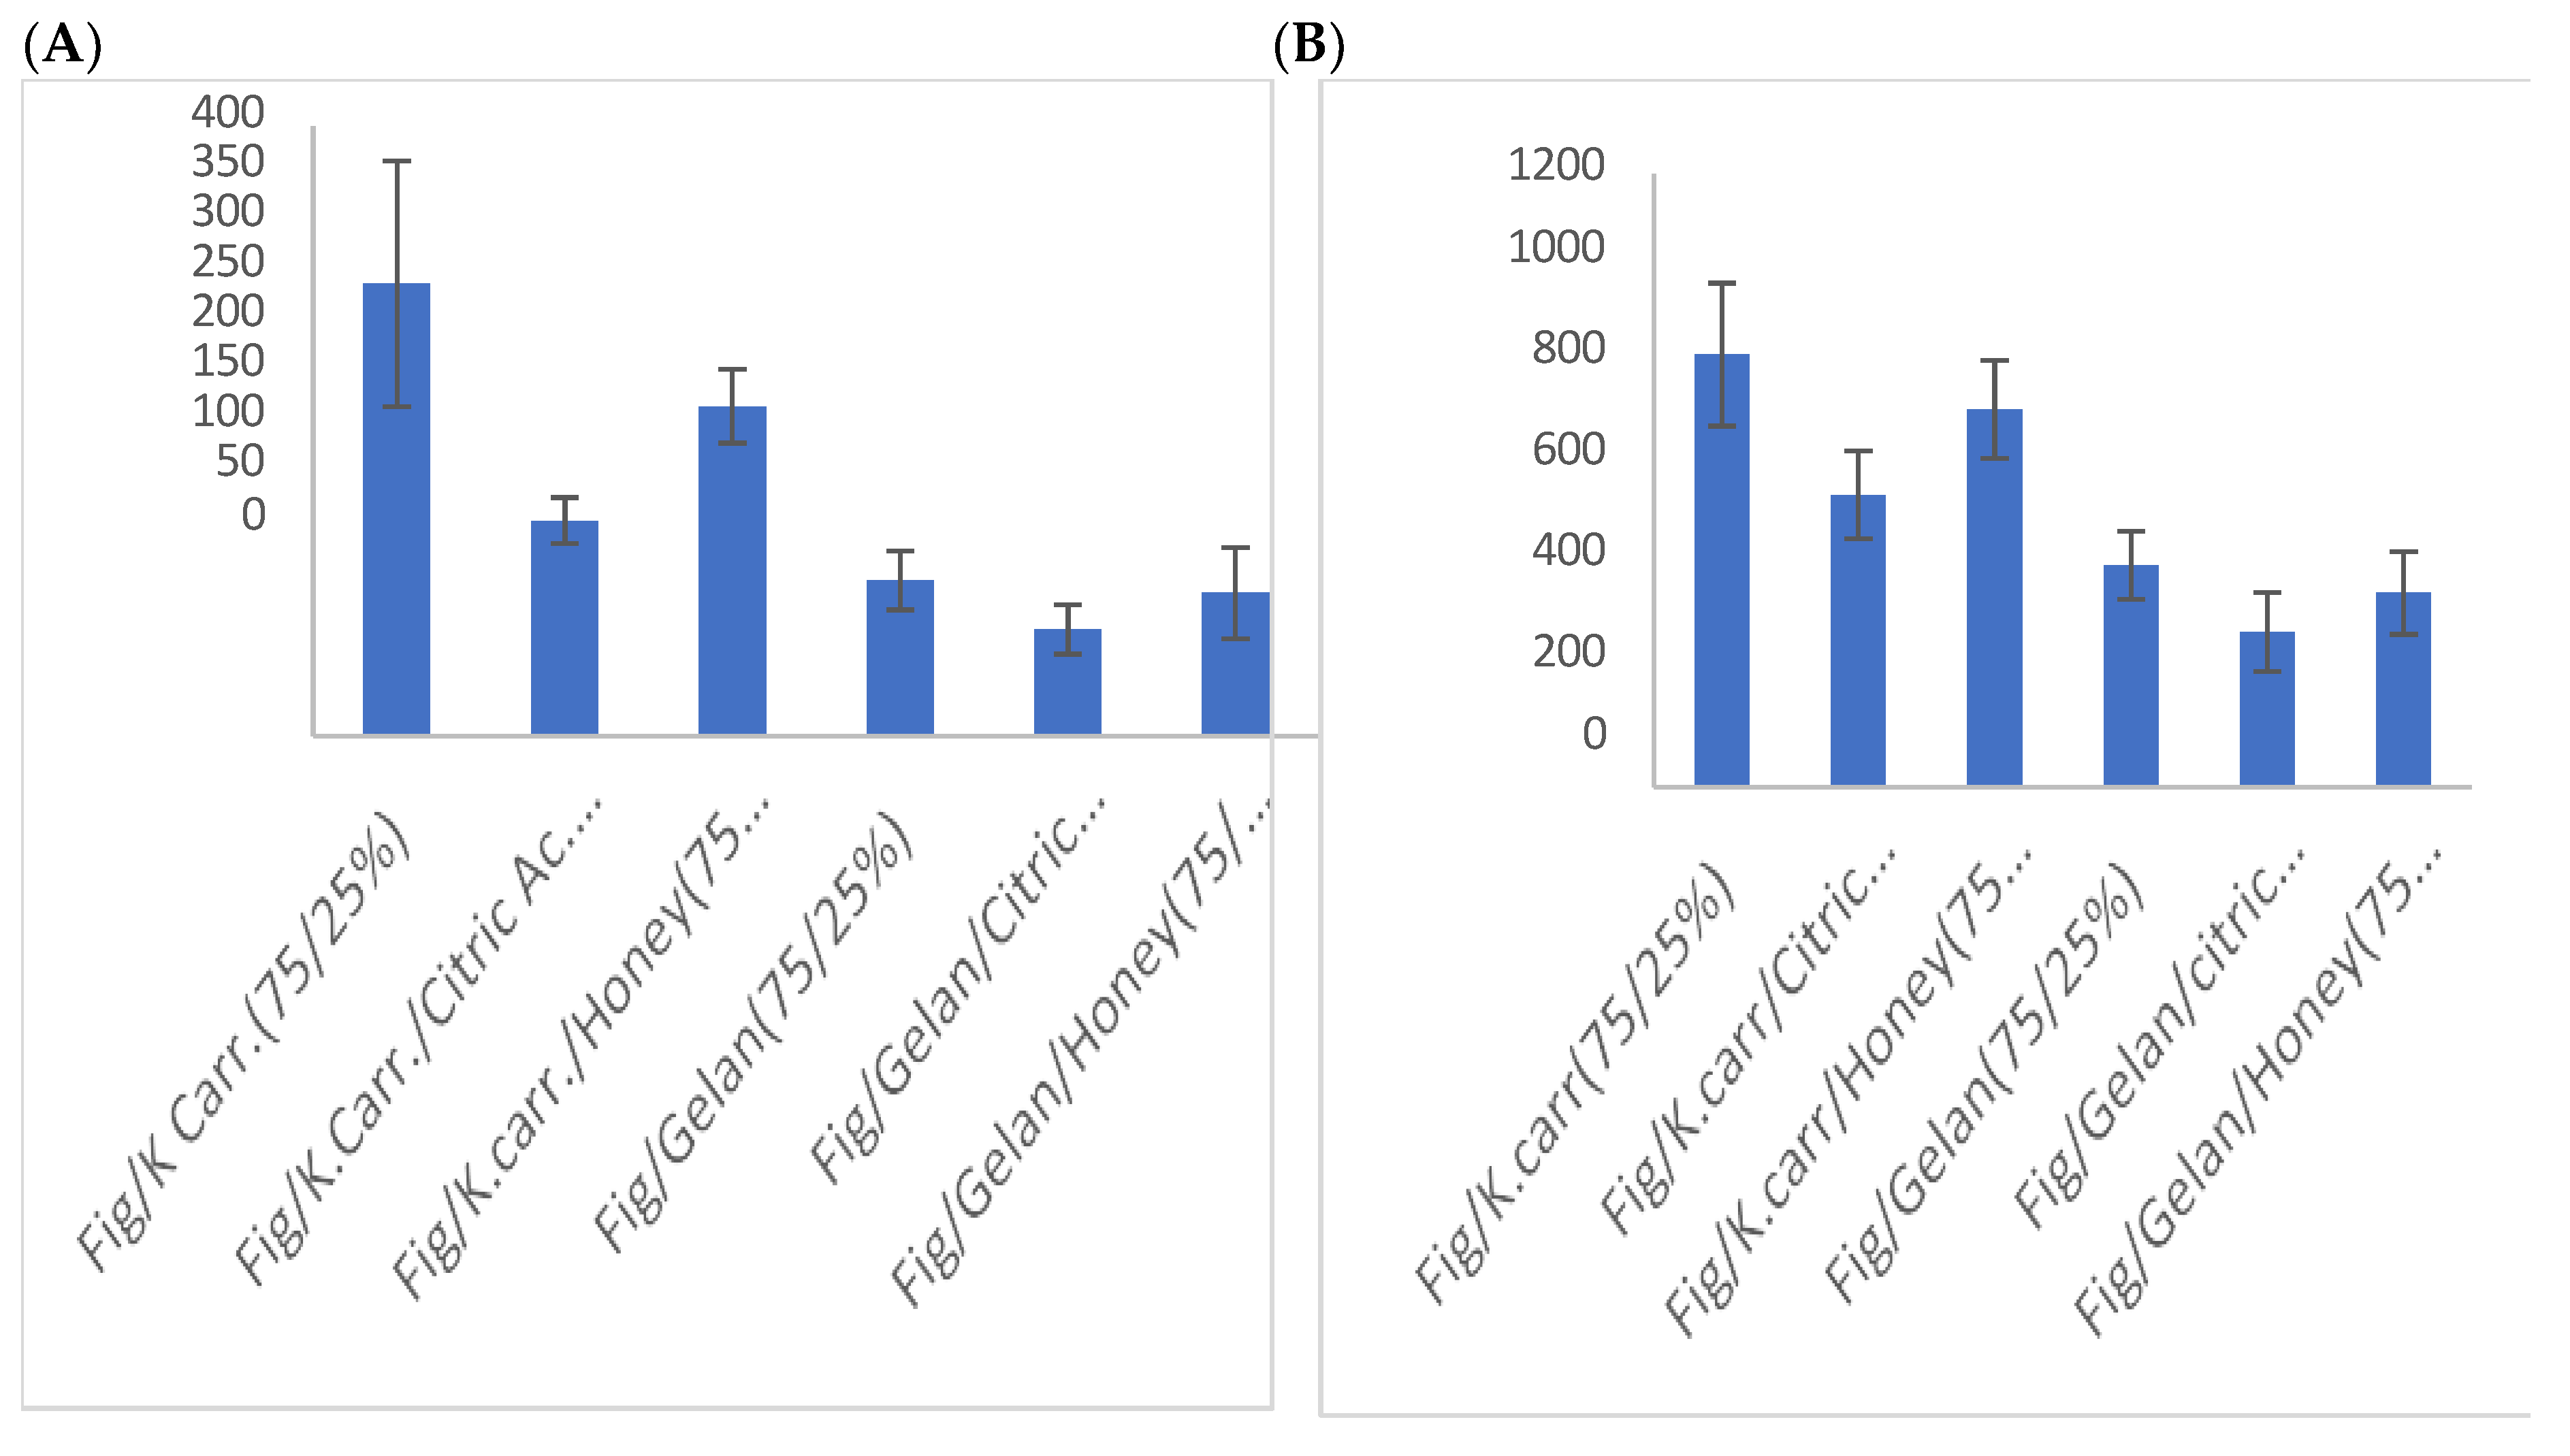
Figure 2.
Standard Error estimation within the design triangular area and experimental points distribution.
Figure 2.
Standard Error estimation within the design triangular area and experimental points distribution.
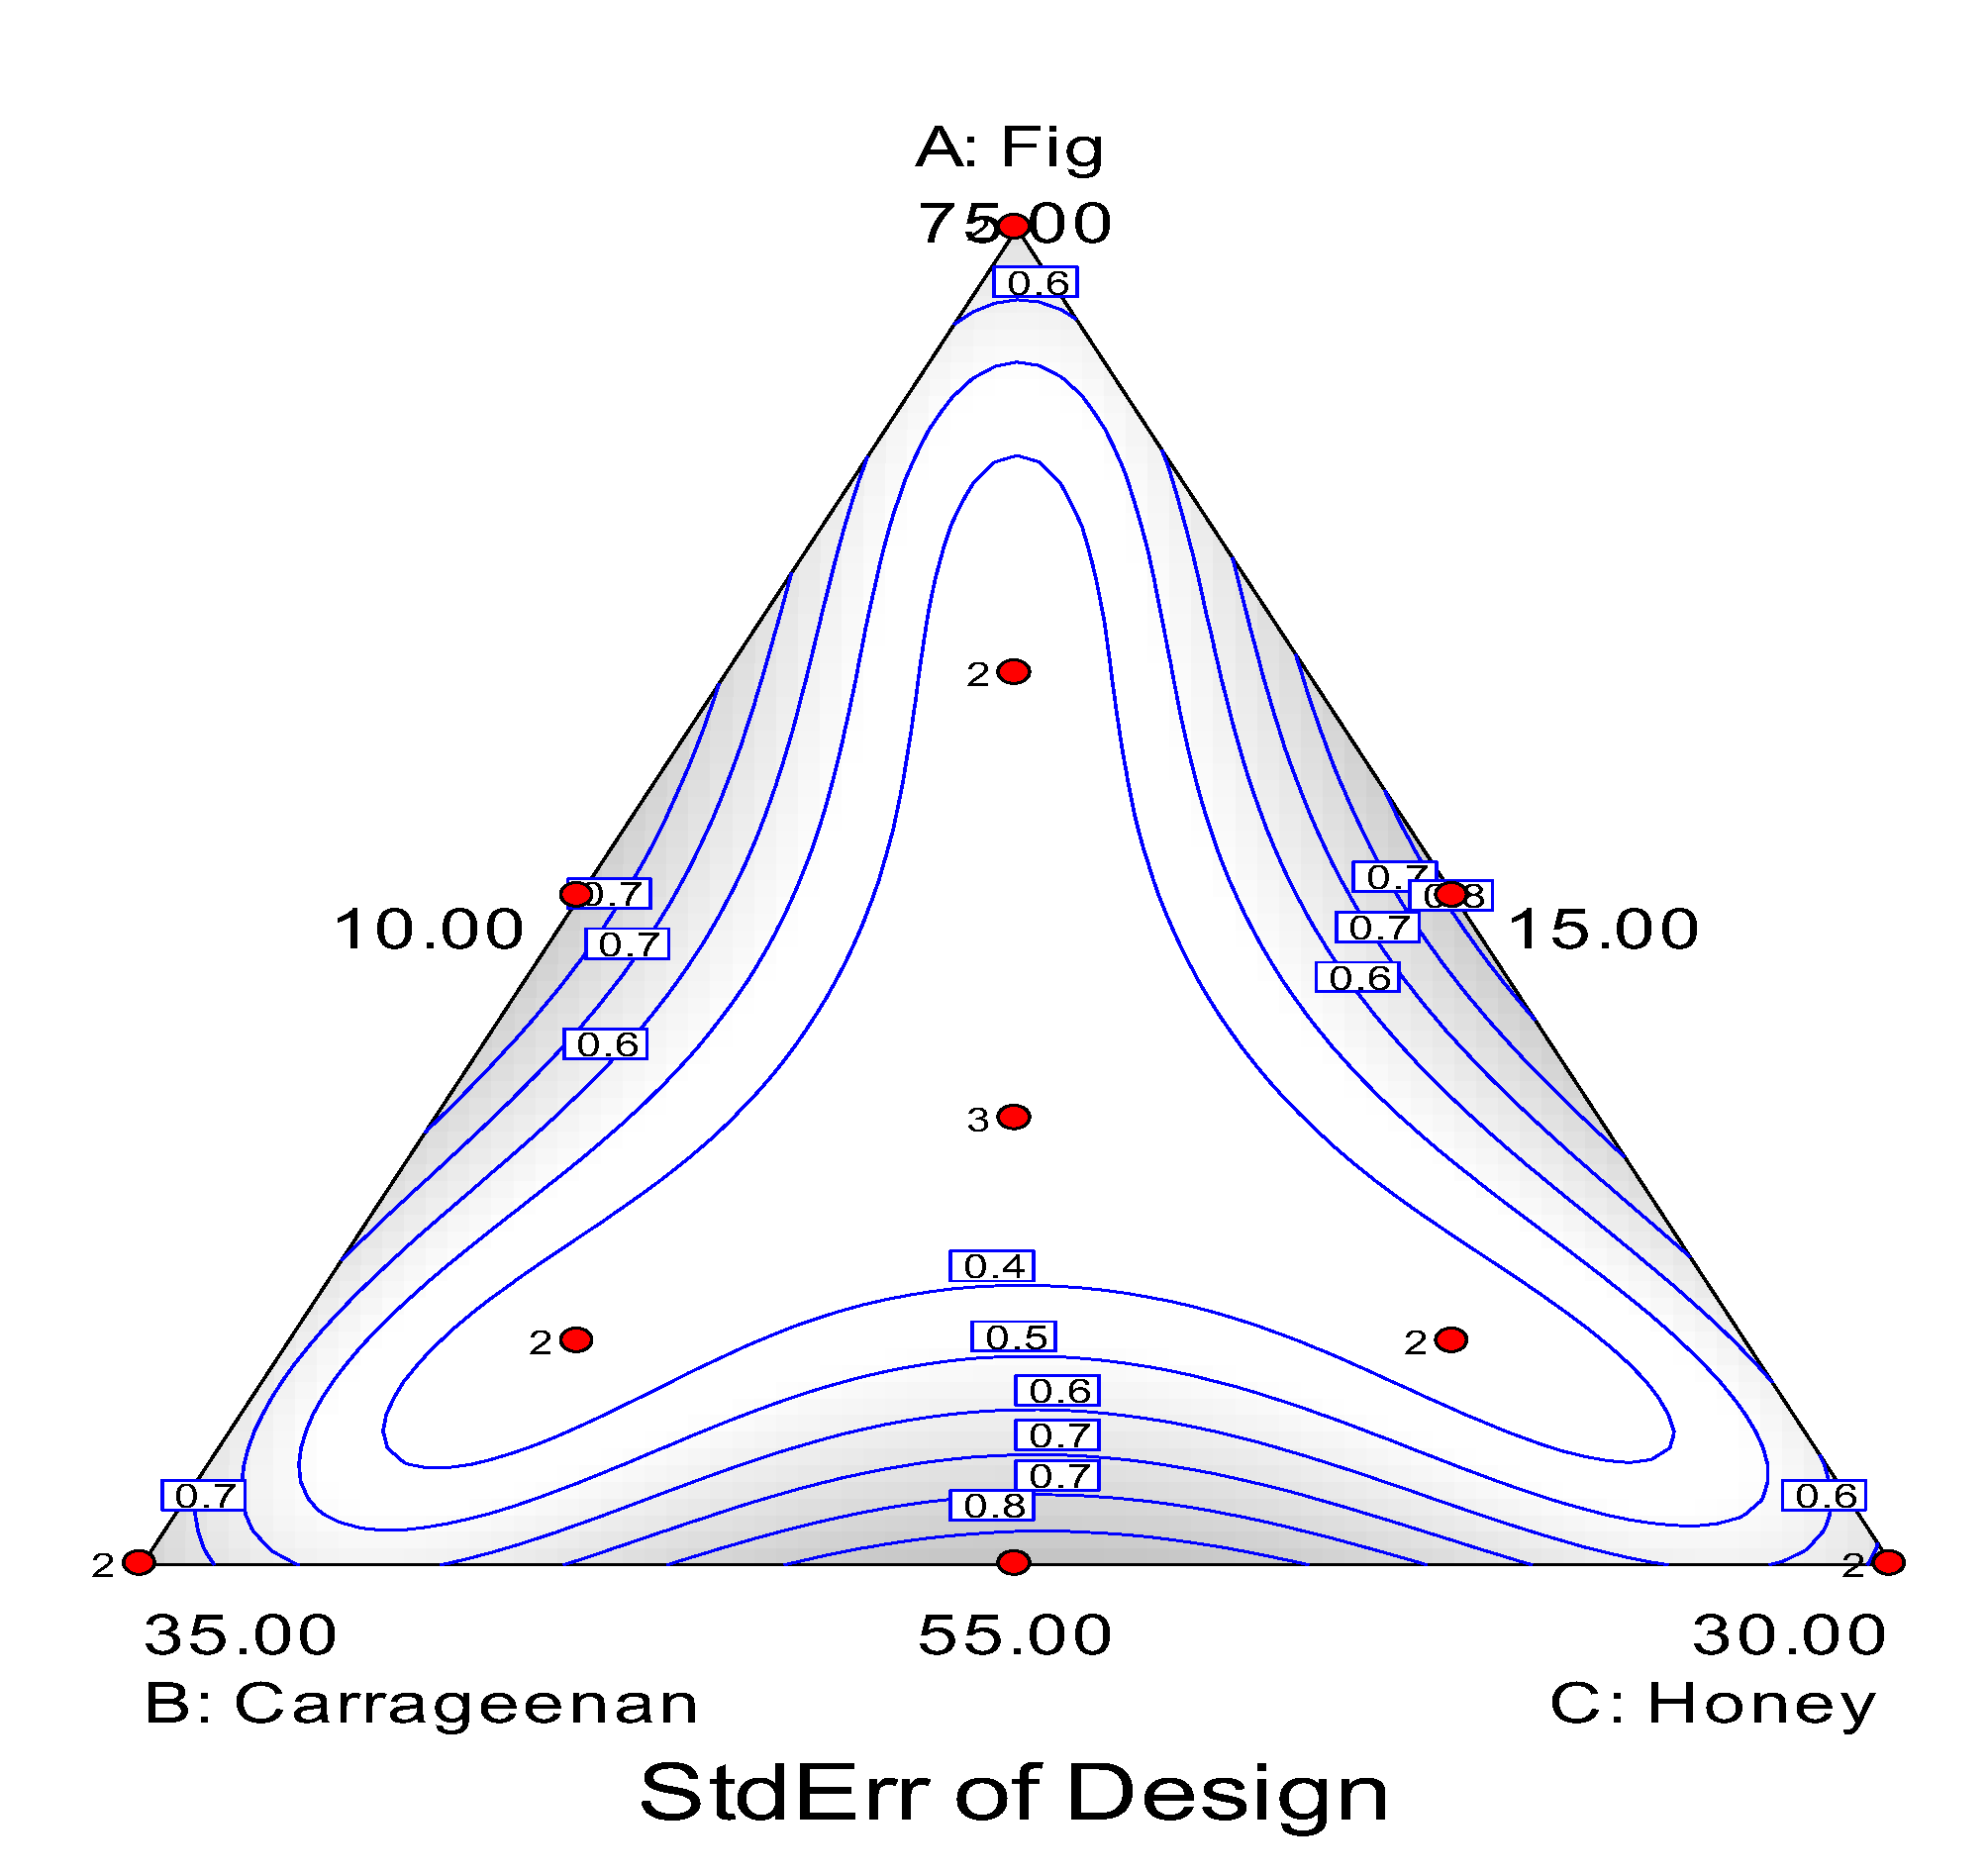
Figure 3.
Contour plots of the response Y1, Y2, Y3, Y4, Y5, Y6, Y7, Y8 and Y9 respectively.
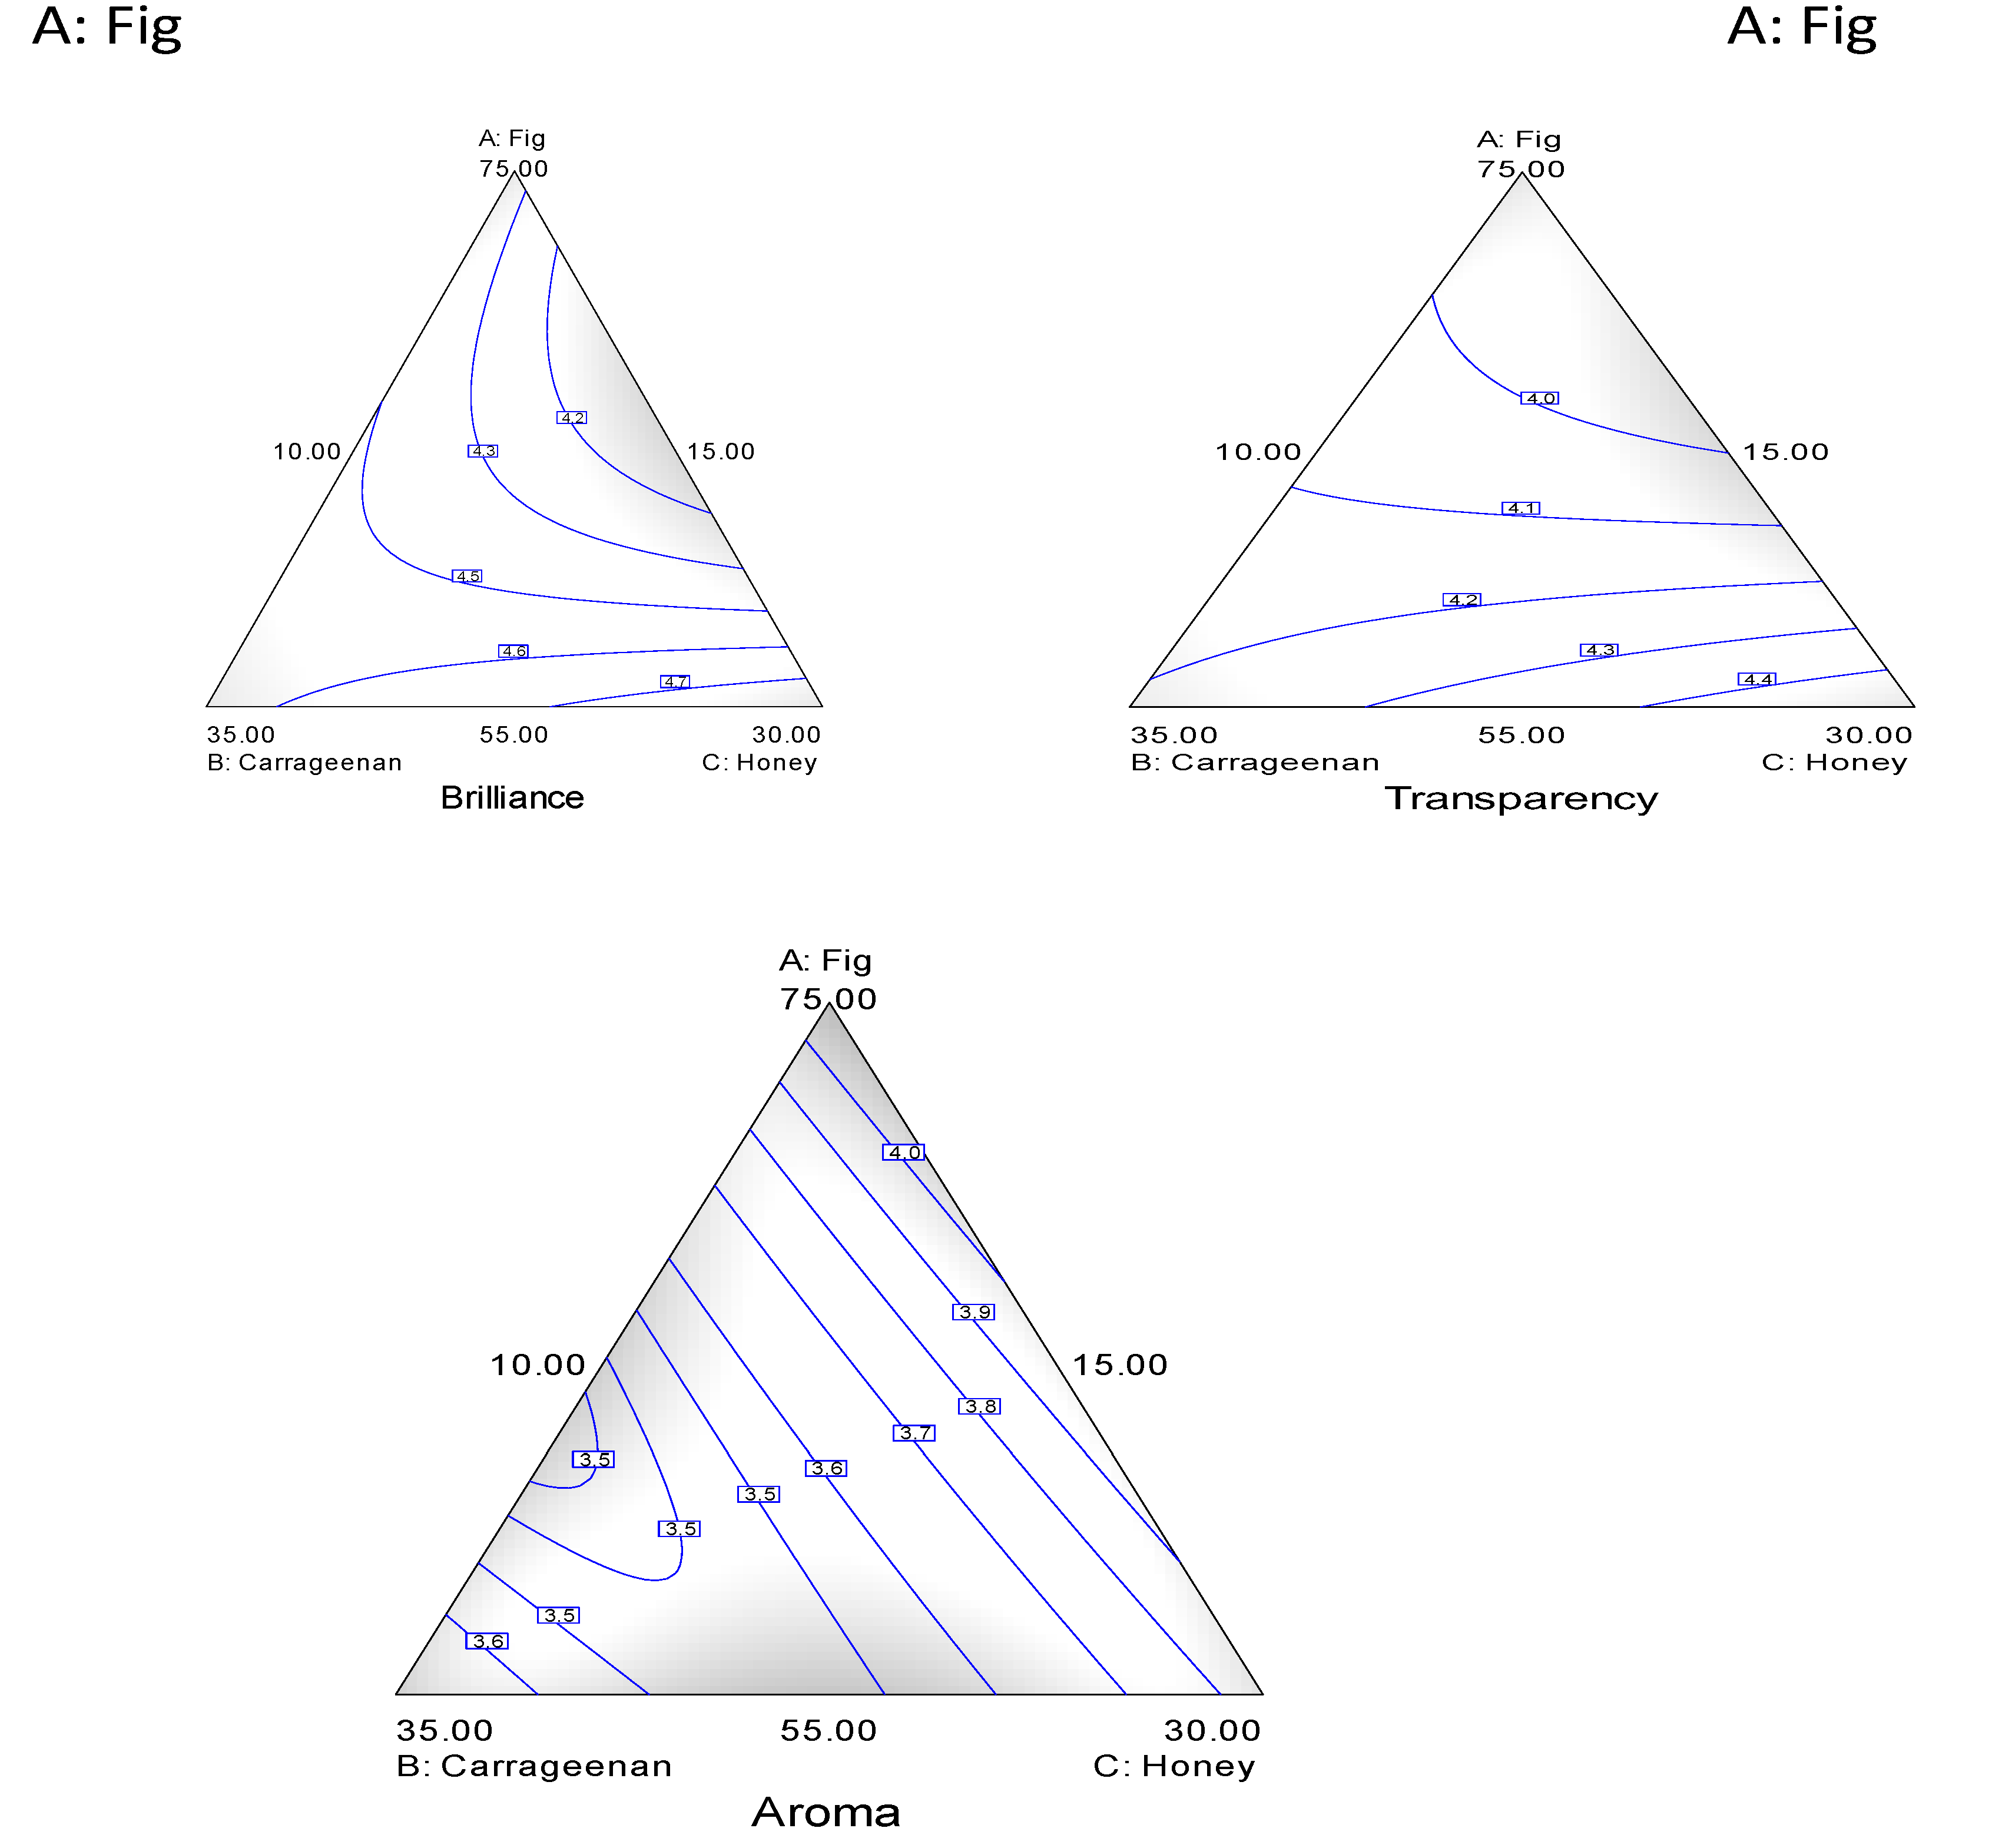
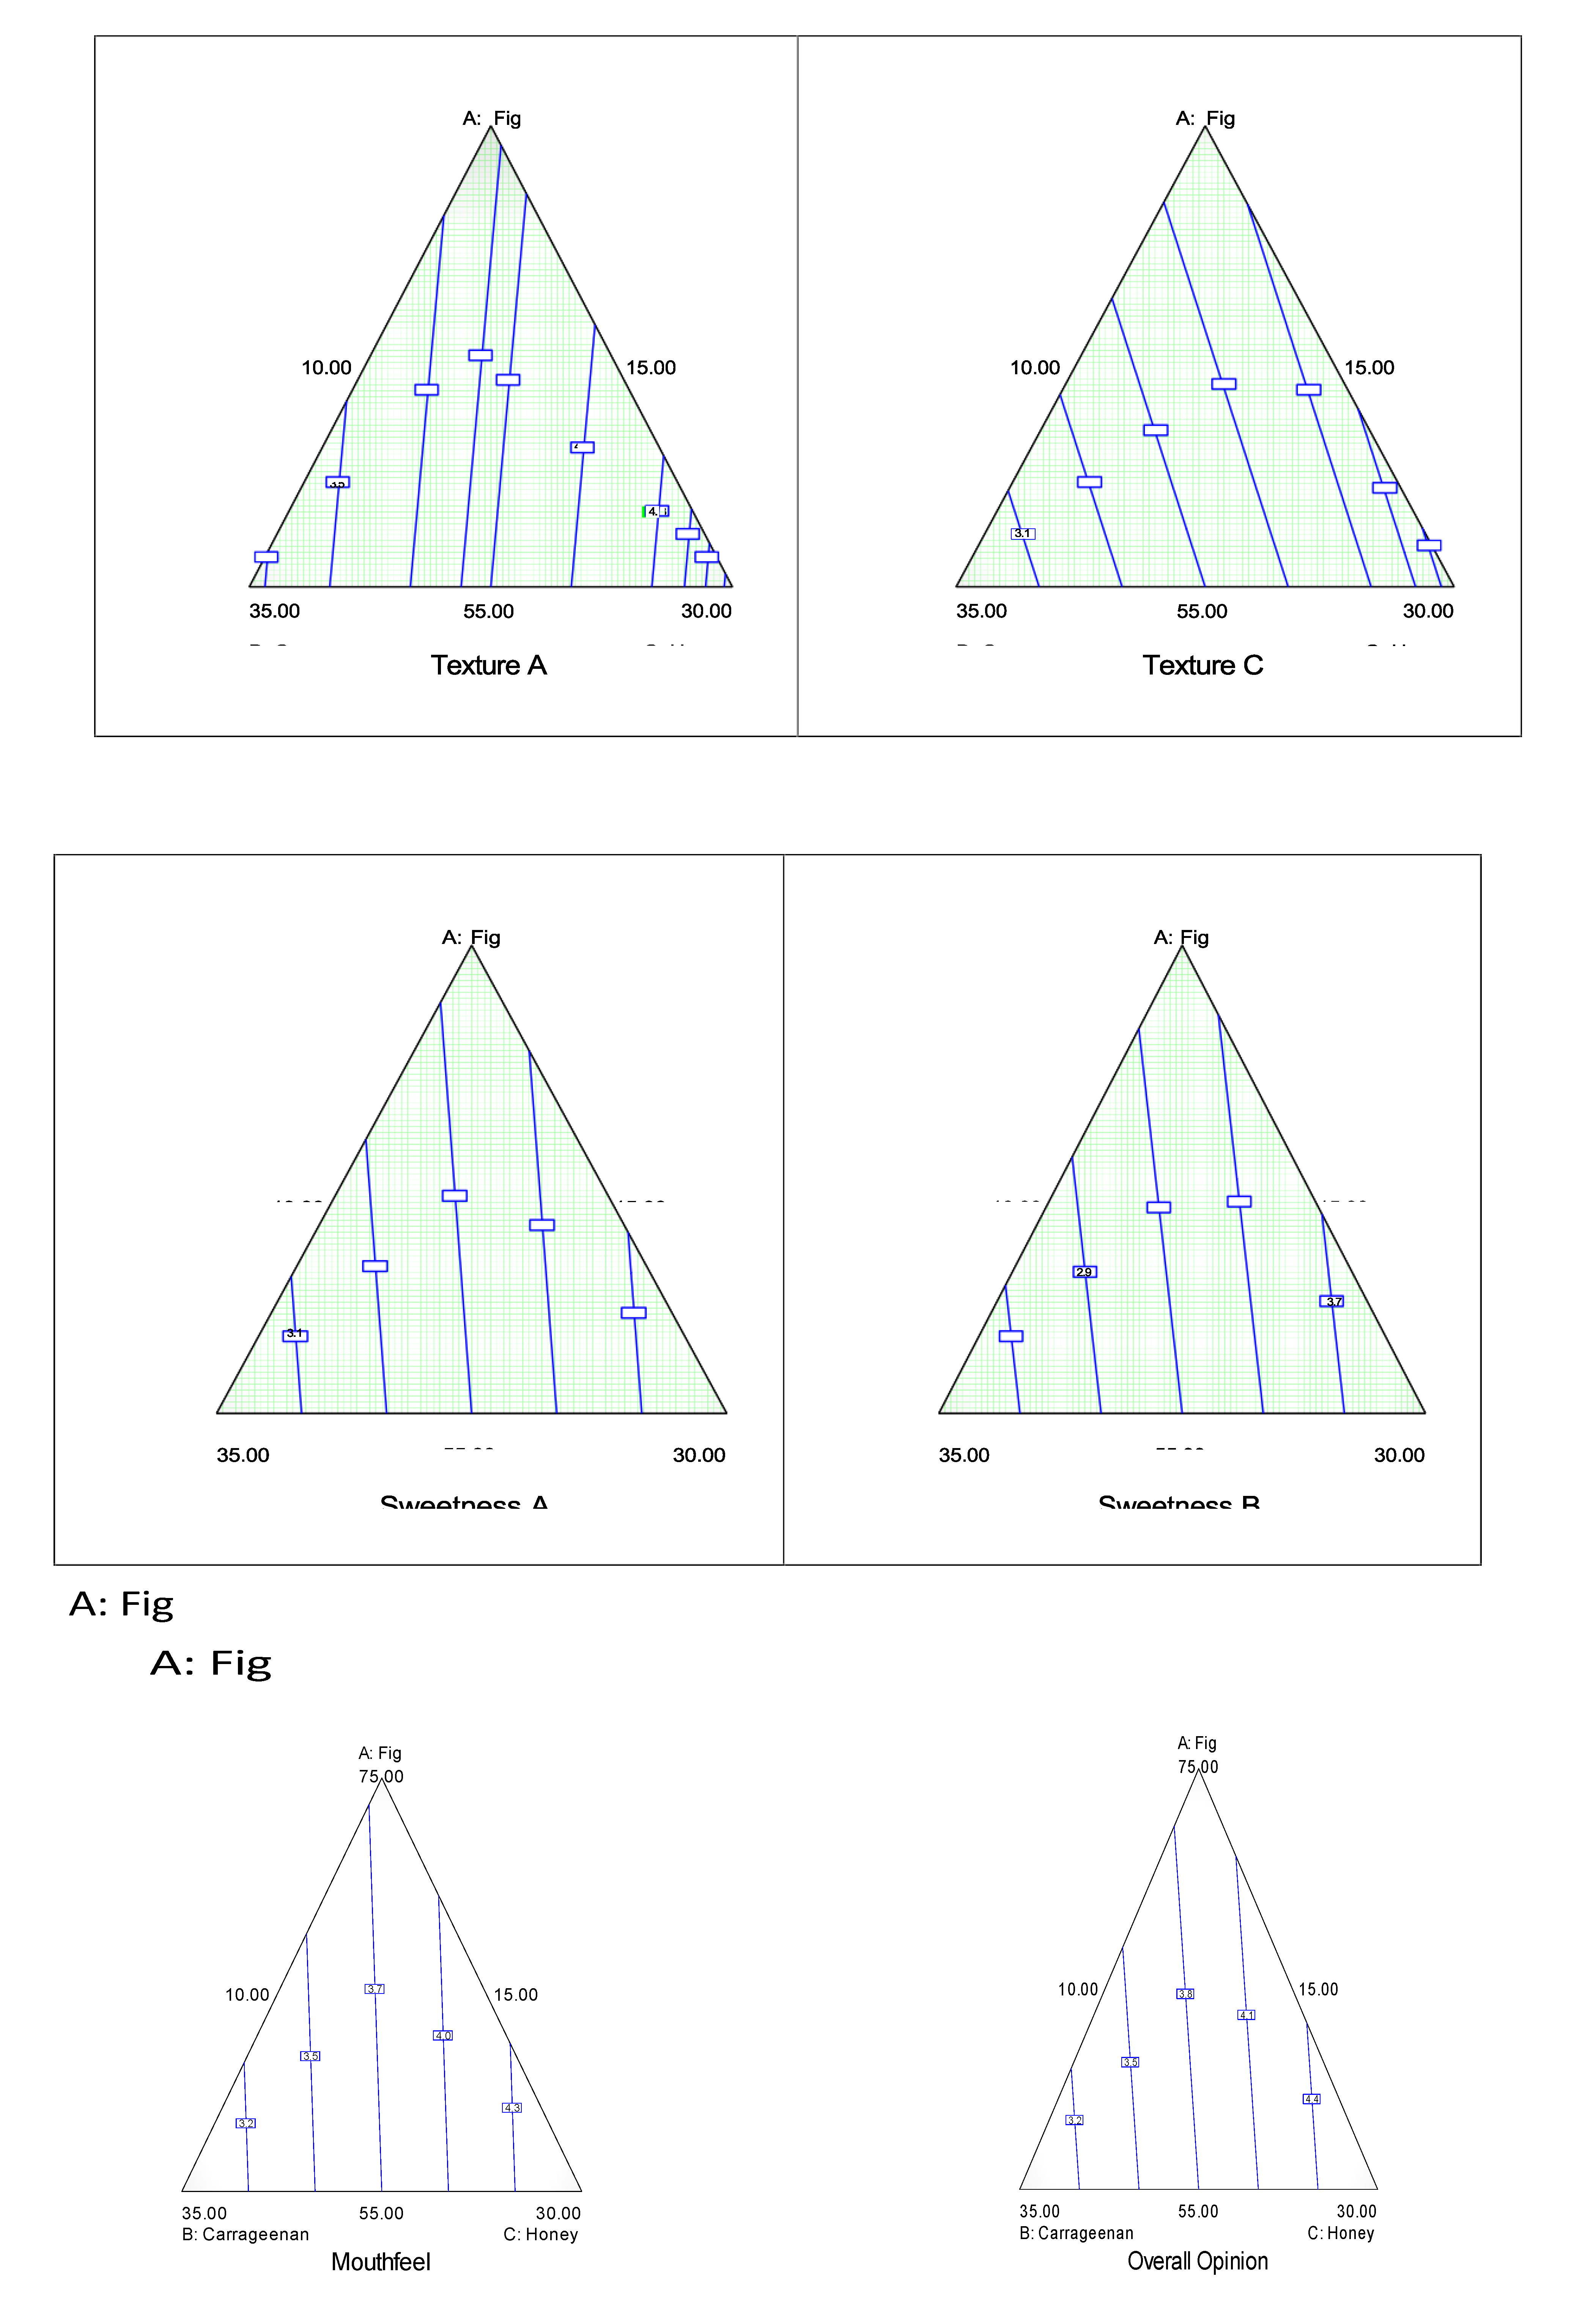
Figure 4.
Response Surface of the optimization result.
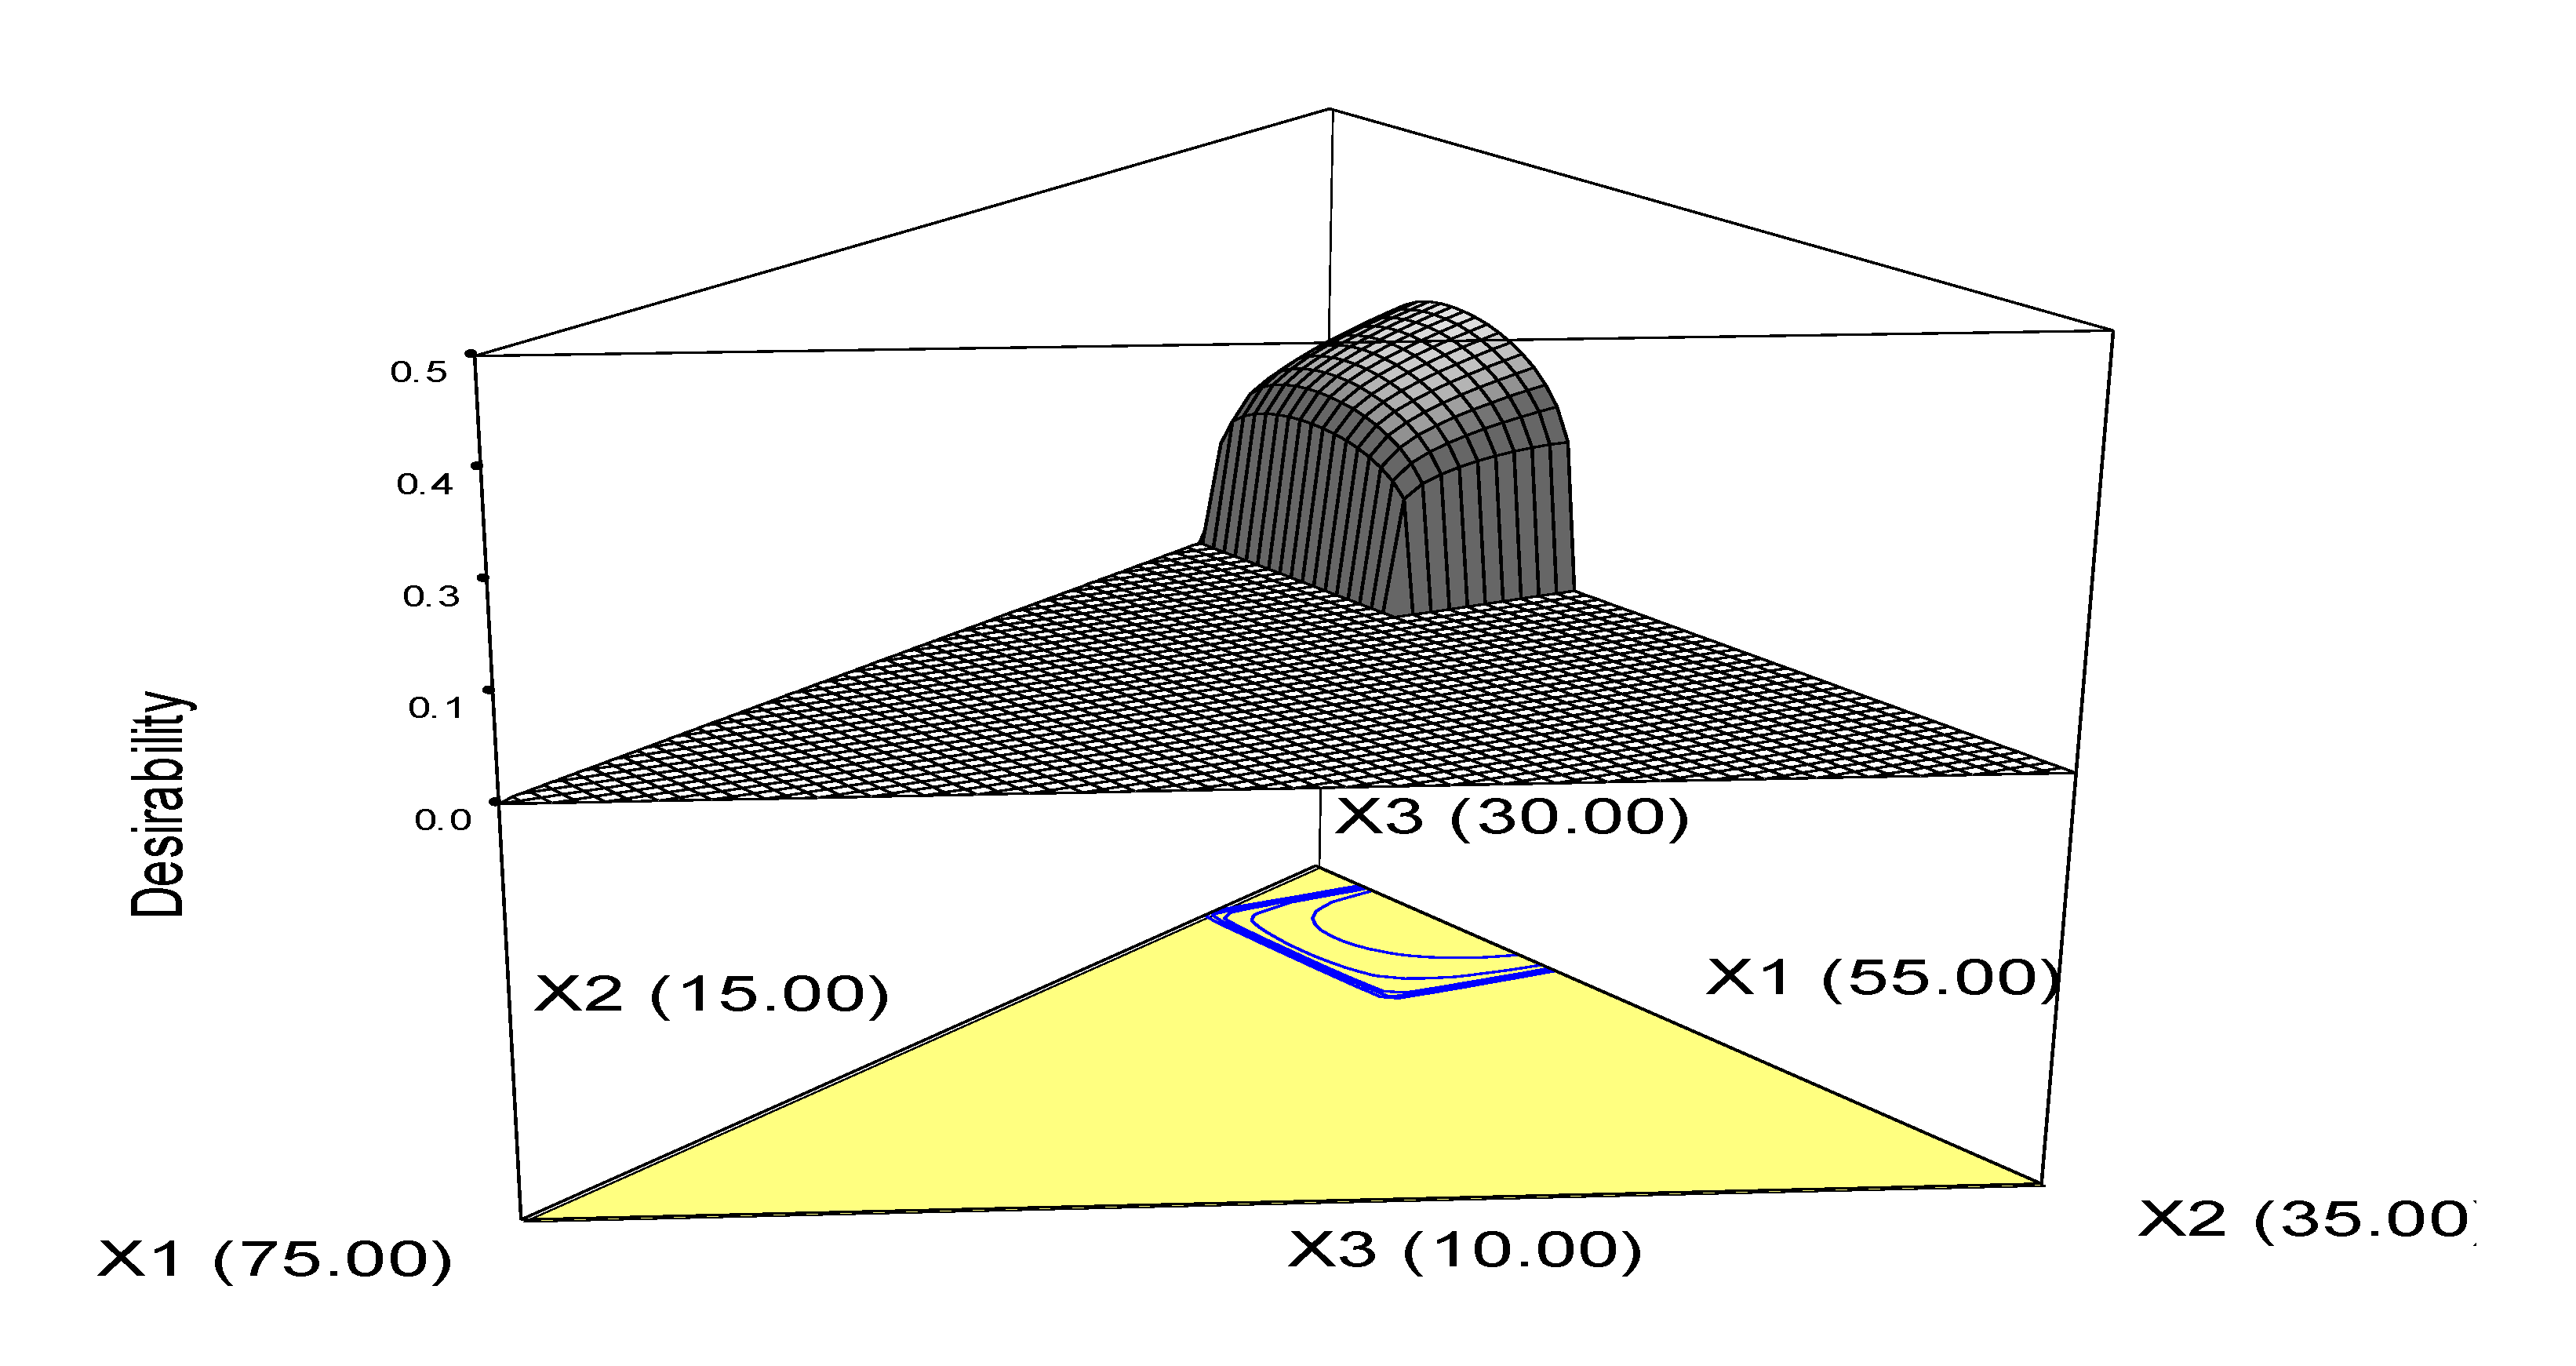
Figure 5.
Radar representation for comparison of the optimum and non-optimum points.
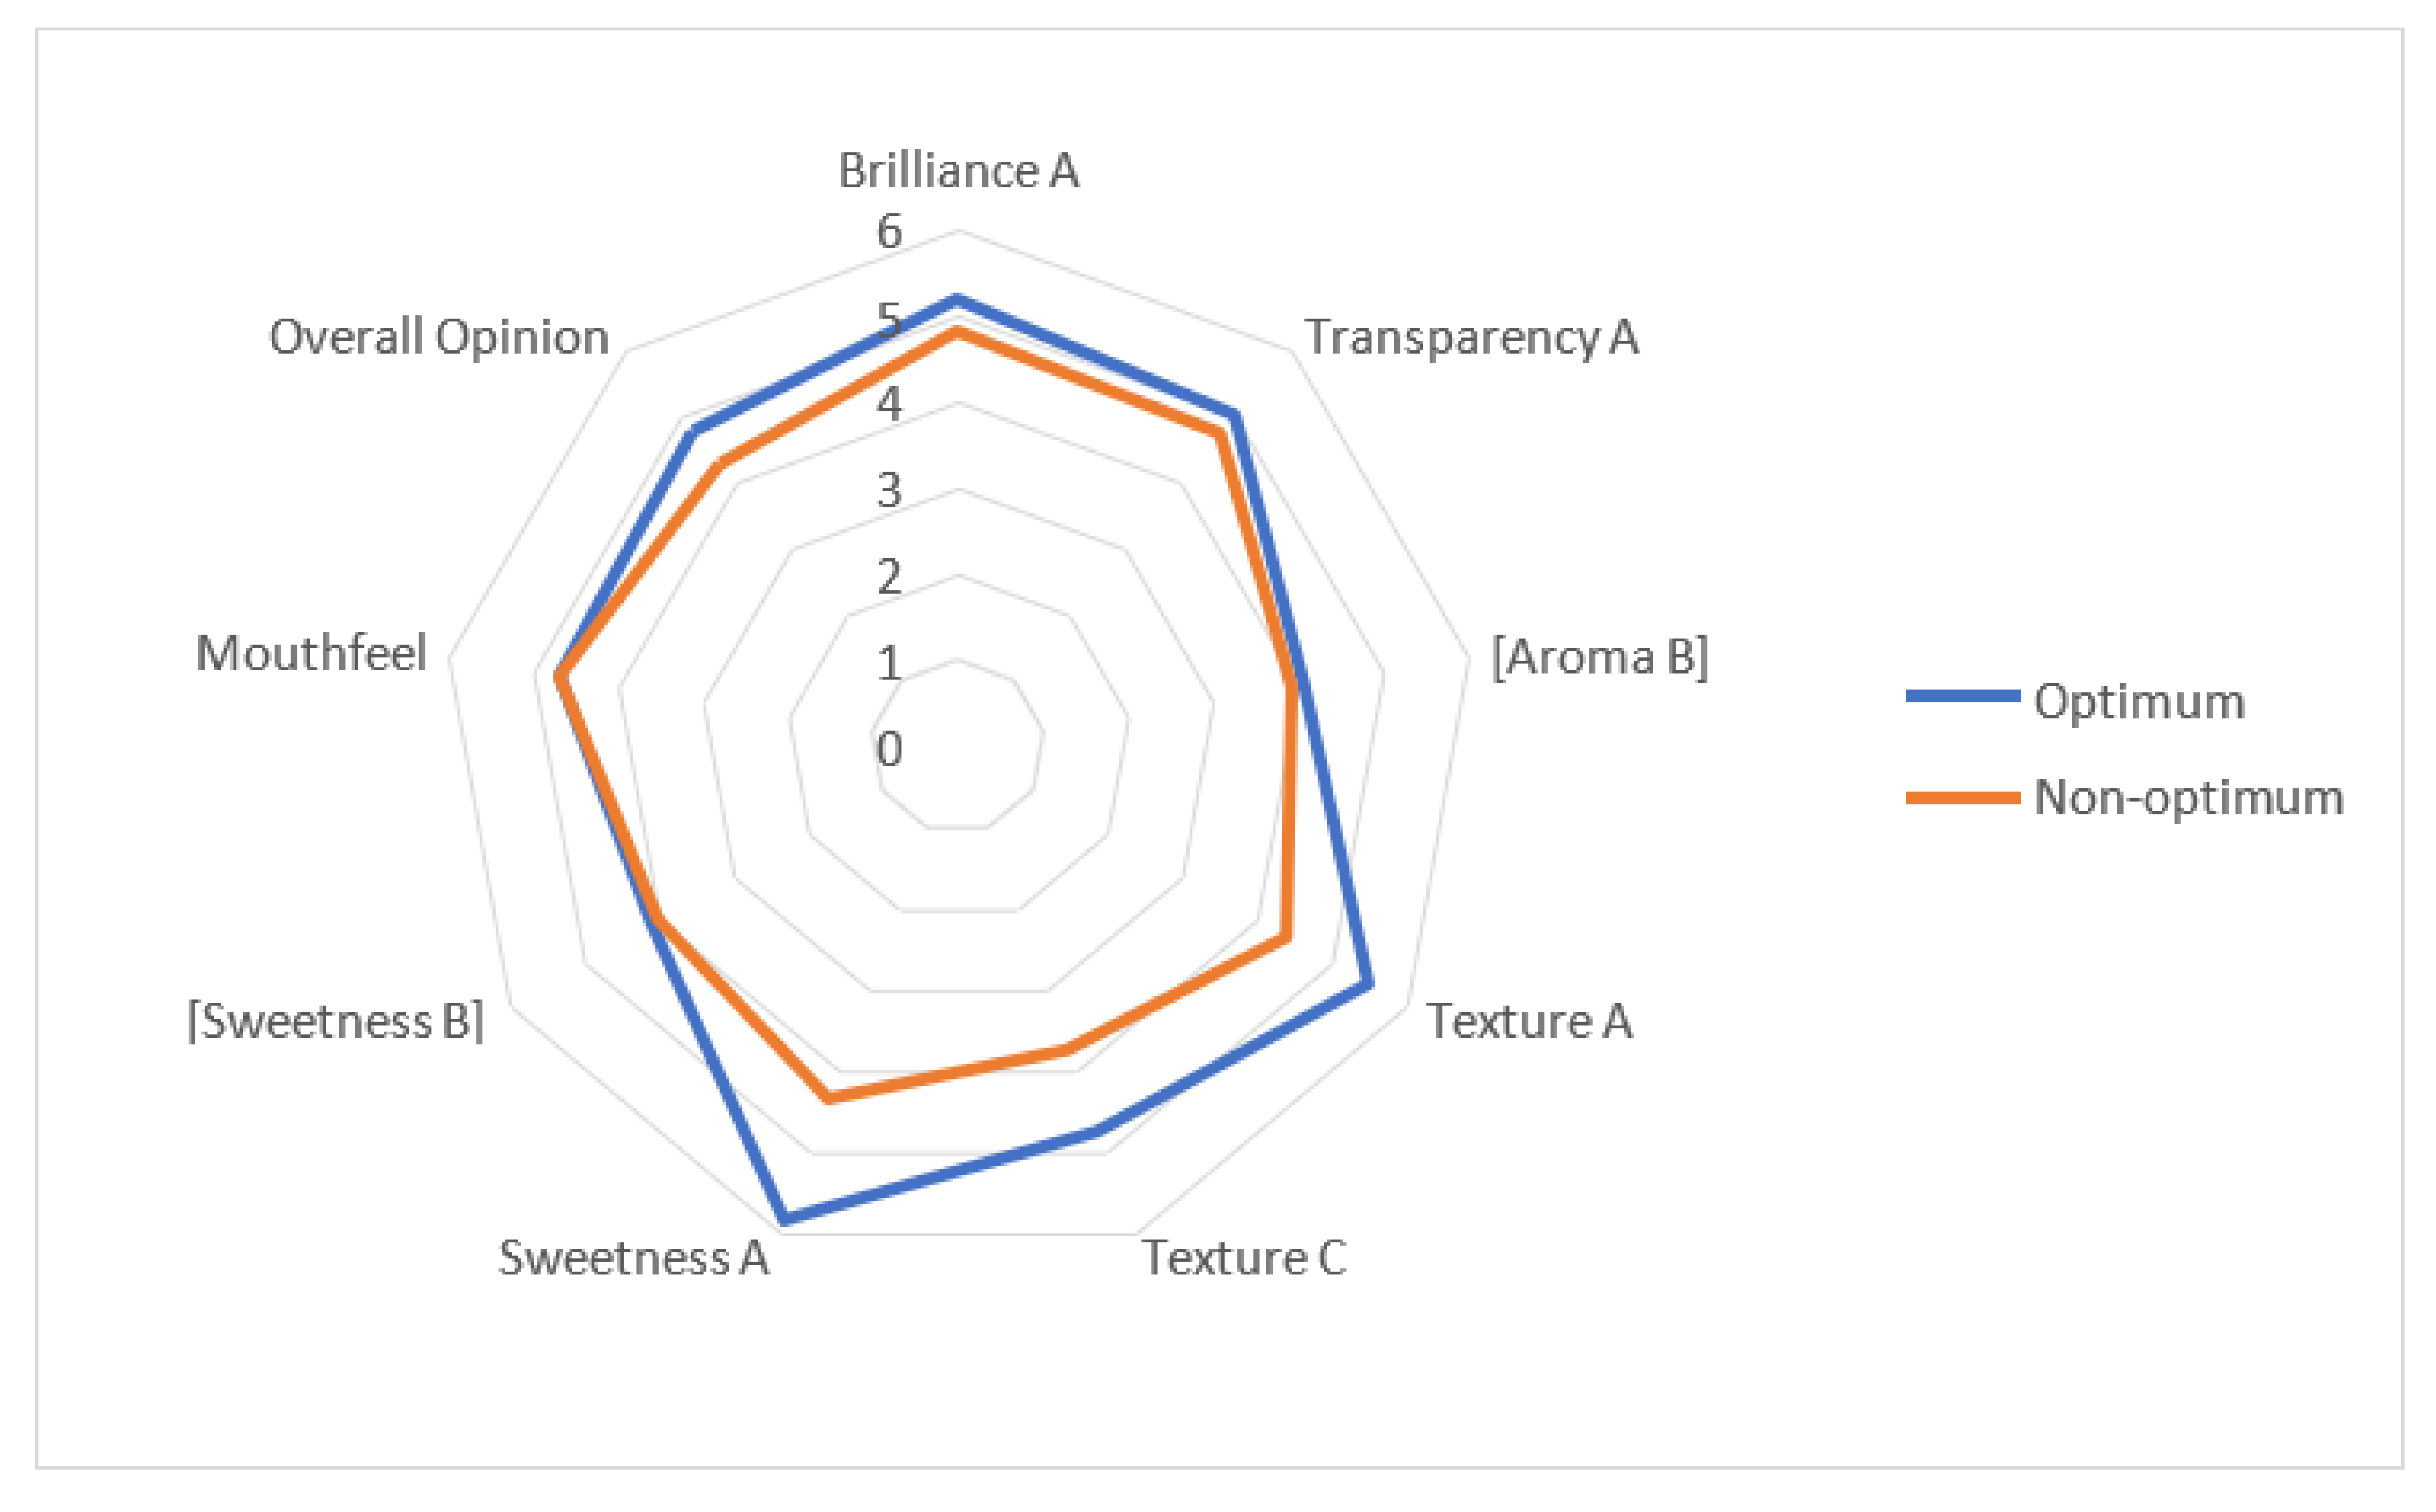
Figure 6.
Fig gum jelly product.
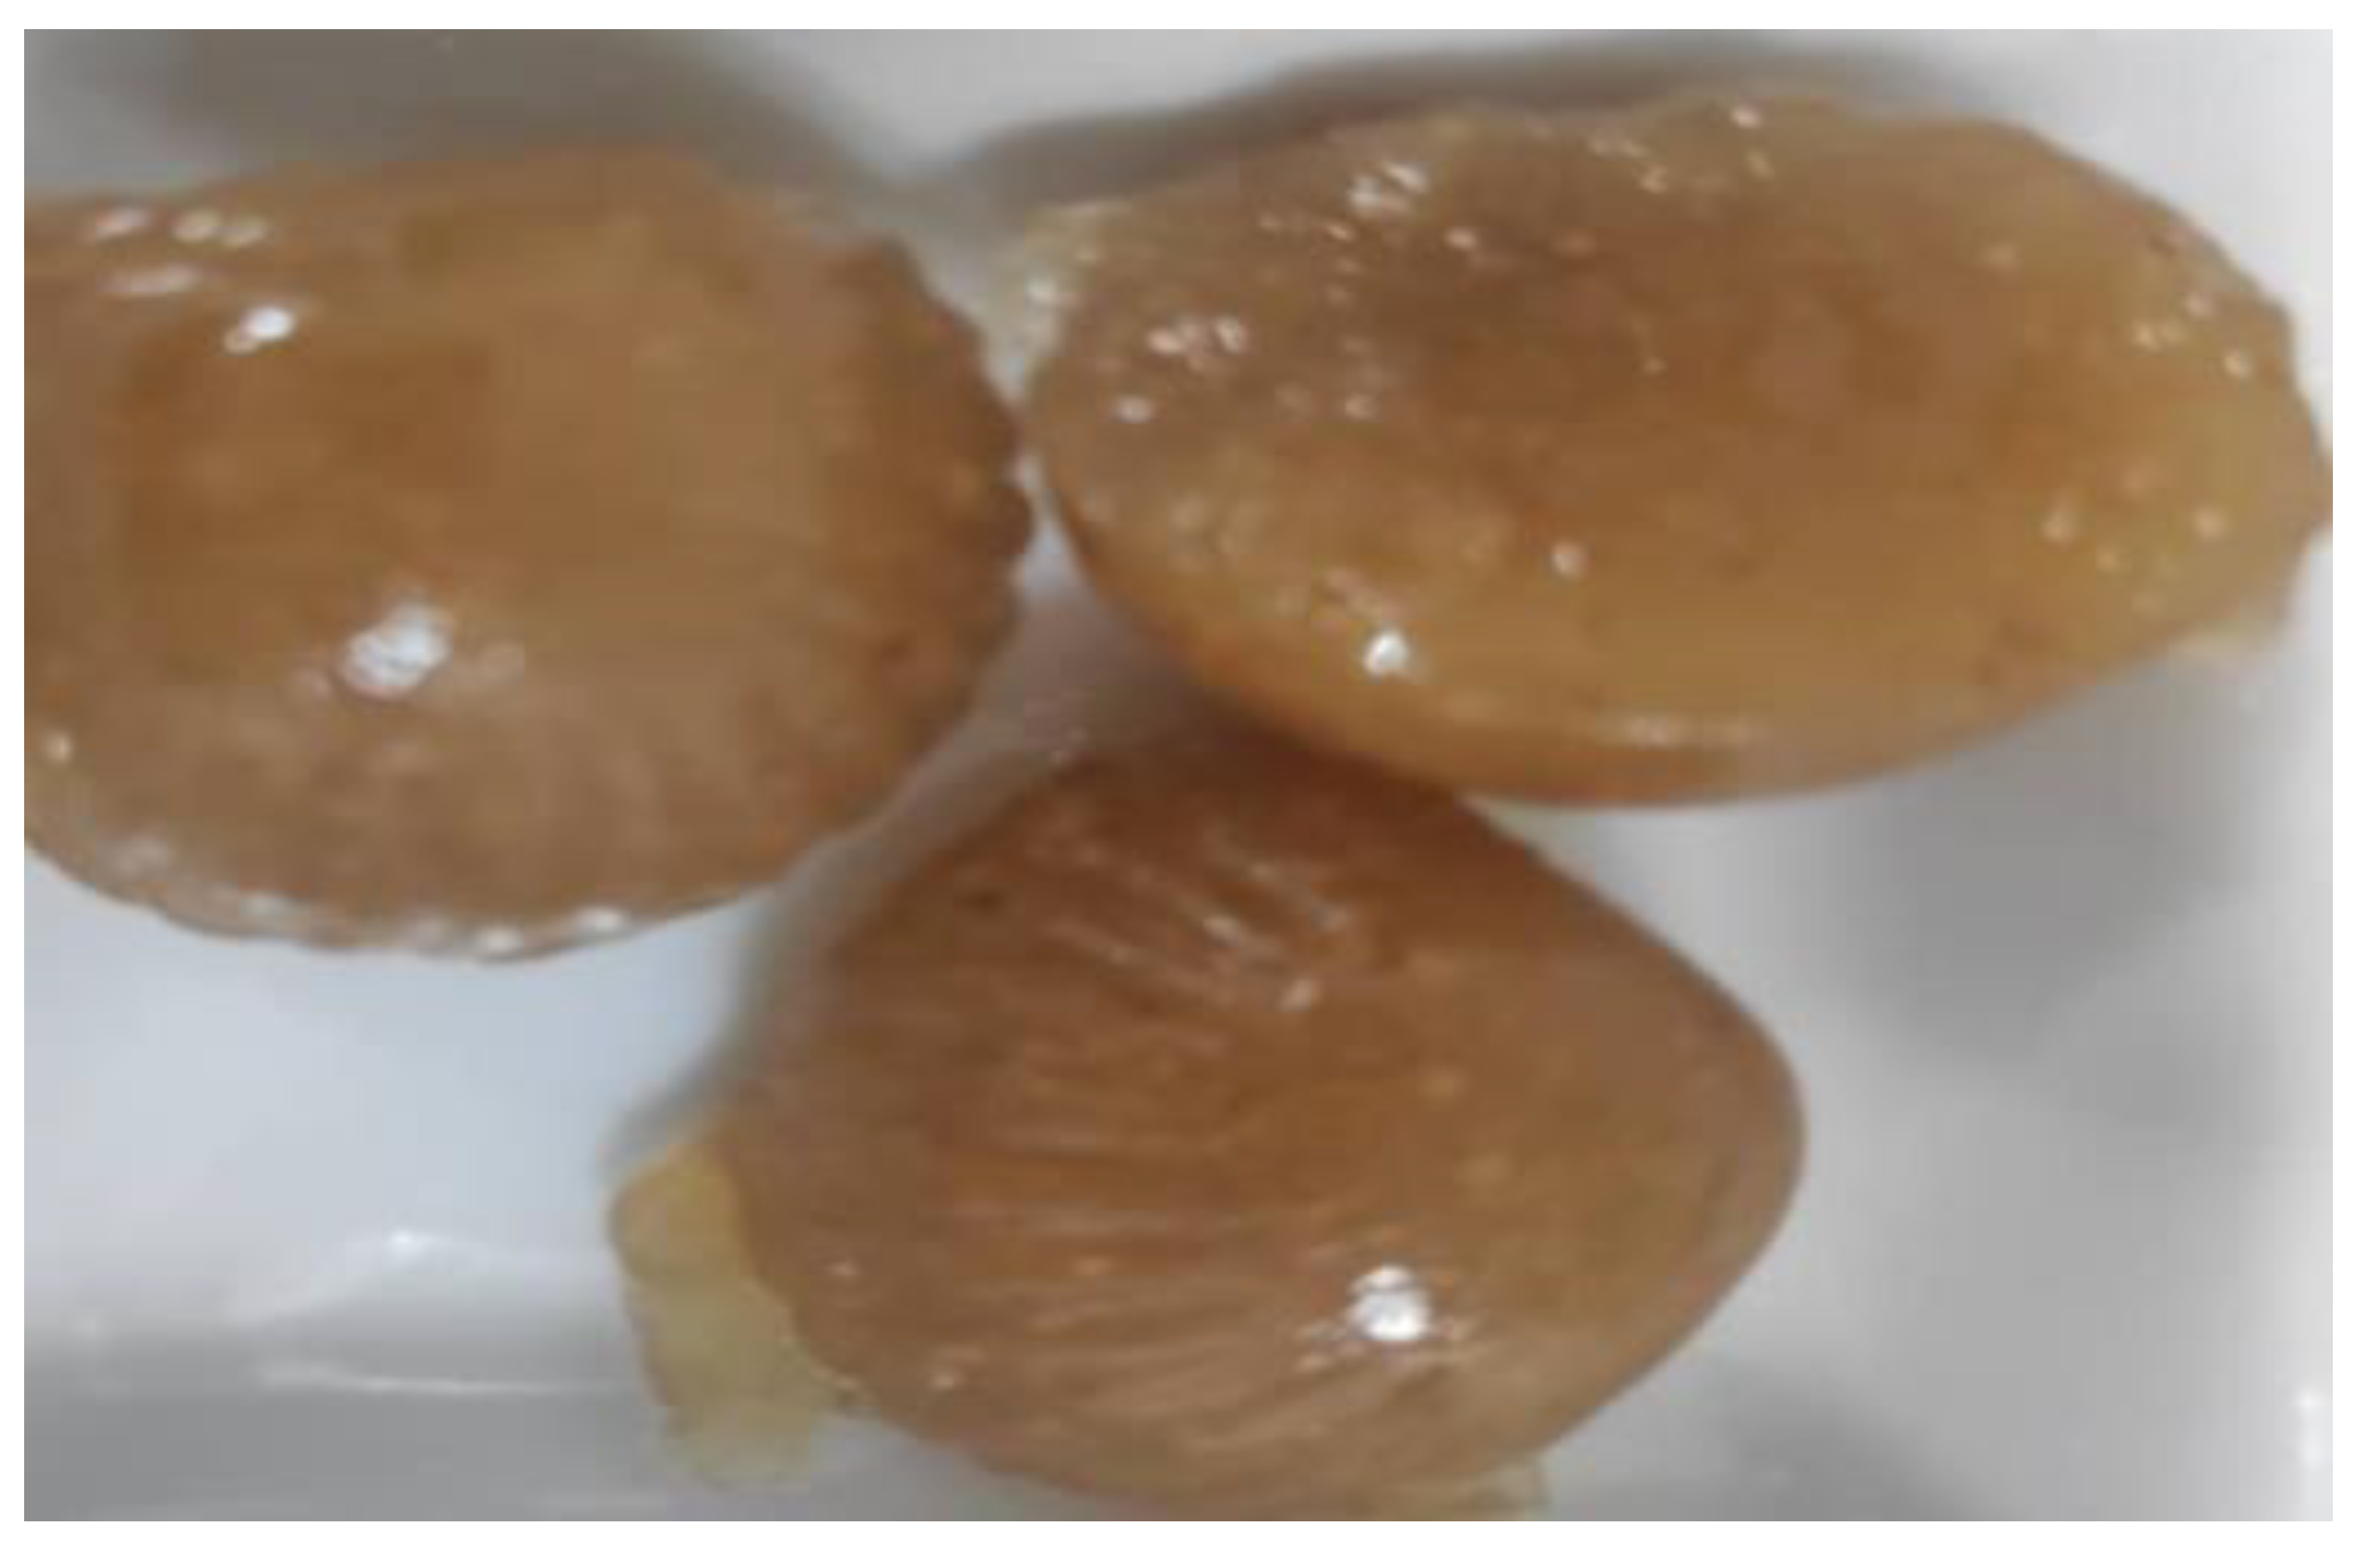
Table 1.
Nutritional content of fresh and dried figs.
| Dietary component | Value/100g fresh | Value/100g dried |
| Water (g) | 79.11 | 30.05 |
| Total Calories (Kcal) | 74 | 249 |
| Protein (g) | 0.75 | 3.3 |
| Total fat (g) | 0.3 | 0.93 |
| Saturated fat (g) | 0.06 | 0.93 |
| Fiber (g) | 2.9 | 9.8 |
| Sugars (g) | 16.26 | 47.92 |
| Cholesterol (mg) | 0 | 0 |
| Calcium (mg) | 35 | 162 |
| Iron (mg) | 0.37 | 2.03 |
| Magnesium (mg) | 17 | 68 |
| Phosphorus (mg) | 14 | 67 |
| Potasium (mg) | 232 | 680 |
| Sodium (mg) | 1 | 10 |
| Zinc (mg) | 0.15 | 0.55 |
| Vitamin A (IU) | 142 | 10 |
| Vitamin C (mg) | 2 | 1.2 |
| Thiamin (mg) | 0.06 | 0.085 |
| Riboflavin (mg) | 0.05 | 0.082 |
Table 1.
Constitution of Kappa carrageenan solution.
| Water(mL) | Gum(g) |
|---|---|
| 92.5 | 7.5 |
Table 2.
Minimum and maximum limits for x1; x2 and x3 to establish the mixture design.
| Mínimum (%) | Máximum (%) | |
|---|---|---|
| x1 Fig paste | 55 | 75 |
| x2 k-carrageenan | 15 | 35 |
| x3 Honey | 10 | 30 |
Table 3.
Mixture Design.
| Component 1 | Component 2 | Component 3 | |||
| Std | Run | Block | A: Fig pastes | B: carrageen | C: honey |
| 10 | 1 | Block 1 | 65 | 25 | 10 |
| 6 | 2 | Block 1 | 61.7 | 21.7 | 16.7 |
| 5 | 3 | Block 1 | 58.3 | 18.3 | 23.3 |
| 2 | 4 | Block 1 | 55 | 25 | 20 |
| 15 | 15 | Block 1 | 58.3 | 18.3 | 23.3 |
| 7 | 5 | Block 1 | 75 | 15 | 10 |
| 1 | 6 | Block 2 | 65 | 15 | 20 |
| 4 | 7 | Block 2 | 58.3 | 28.3 | 13.3 |
| 11 | 11 | Block 2 | 61.7 | 21.7 | 16.7 |
| 14 | 14 | Block 2 | 58.3 | 28.3 | 13.3 |
| 16 | 16 | Block 2 | 75 | 15 | 10 |
| 8 | 9 | Block 2 | 55 | 15 | 30 |
| 3 | 8 | Block 3 | 68.3 | 18.3 | 13.3 |
| 9 | 10 | Block 3 | 55 | 35 | 10 |
| 12 | 12 | Block 3 | 61.7 | 21.7 | 16.7 |
| 13 | 13 | Block 3 | 68.3 | 18.3 | 13.3 |
| 17 | 17 | Block 3 | 55 | 15 | 30 |
| 18 | 18 | Block 3 | 55 | 35 | 10 |
Table 4.
Predicted models for responses in actual components.
| Mode l | Reduced Quadratic | Reduced Quadratic | Reduced Quadratic | Linear | Linear | Linea r | Linea r | Linea r | Linea r |
| Coefi. | Y1 | Y2 | Y3 | Y4 | Y5 | Y6 | Y7 | Y8 | Y9 |
| β1 | 0.066 | 0.045 | 0.067 | 0.038 | 0.044 | 0.043 | 0.038 | 0.04 | 0.04 |
| β2 | 0.017 | 0.035 | 0.228 | 0.012 | -2.278E- 3 | - 0.013 | - 0.016 | -6.31E- 3 | -0.01 |
| β3 | 0.351 | 0.193 | 0.034 | 0.075 | 0.056 | 0.085 | 0.073 | 0.08 | 0.08 |
| β12 | ------ | ----- | -3.896E-3 | ----- | ---- | ---- | ---- | ---- | ---- |
| β13 | -5.772E-3 | -2.59E-3 | ------ | ----- | ---- | ---- | ----- | ---- | ---- |
| β23 | ------- | -2.499E-3 | ----- | ---- | ---- | ---- | ---- | ---- |
Table 5.
Optimization Criteria.
| Name | Goal | Lower limit | Upper limit | Lower weight | Upper weight | Importance |
| Fig | is in range | 55 | 75 | 1 | 1 | 3 |
| Carrageenan | is in range | 15 | 35 | 1 | 1 | 3 |
| Honey | is in range | 10 | 30 | 1 | 1 | 3 |
| Brilliance | maximize | 4.5 | 6 | 1 | 1 | 3 |
| Transparency | maximize | 4 | 6 | 1 | 1 | 3 |
| Aroma | is target = 3.5 | 3 | 4 | 1 | 1 | 3 |
| Texture A | maximize | 4 | 6 | 1 | 1 | 3 |
| Texture C | is target = 3.5 | 2.5 | 4.5 | 1 | 1 | 3 |
| Sweetness A | maximize | 4 | 6 | 1 | 1 | 3 |
| Sweetness B | is target = 3.5 | 2.5 | 4.5 | 1 | 1 | 3 |
| Mouthfeel | is target = 3.5 | 2.5 | 4.5 | 1 | 1 | 3 |
| Overall Opinion | maximize | 4 | 6 | 1 | 1 | 3 |
Table 6.
Percentage value of the optimized fig jellies components.
| Components | fig | K.carrageenan | honey |
|---|---|---|---|
| % | 55 | 15 | 30 |
Disclaimer/Publisher’s Note: The statements, opinions and data contained in all publications are solely those of the individual author(s) and contributor(s) and not of MDPI and/or the editor(s). MDPI and/or the editor(s) disclaim responsibility for any injury to people or property resulting from any ideas, methods, instructions or products referred to in the content. |
© 2025 by the authors. Licensee MDPI, Basel, Switzerland. This article is an open access article distributed under the terms and conditions of the Creative Commons Attribution (CC BY) license (http://creativecommons.org/licenses/by/4.0/).
Copyright: This open access article is published under a Creative Commons CC BY 4.0 license, which permit the free download, distribution, and reuse, provided that the author and preprint are cited in any reuse.


