Submitted:
12 February 2025
Posted:
12 February 2025
You are already at the latest version
Abstract
The purpose of this study was to examine whether supplementation of the ultra- and nanofiltered colostrum-based products, combined with egg yolk extract, NMN, quercetin, alpha-ketoglutarate, white button mushroom, and celery seed extracts (the formula was patented by 4Life Research Company, USA and named as AgePro) modulate the functional activity of NK cells in vivo. We found that this supplement taken orally at 2 capsules twice a day for 30 days significantly enhanced the cytotoxic activity of NK cells. This was evidenced by the increased NK cell-mediated killing of carboxyfluorescein diacetate succinimidyl ester-labeled (CFSE)-labeled K562 human myeloid leukemia cells. As expected, this effect was dependent on the ratio between effector (E) (i.e., PBMCs) and target (T) (i.e., K562) cells illustrating maximal killing of K562 cells at 50:1 E/T ratio. Of note, increased NK-mediated killing of K562 cells after taking AgePro correlated with the increased perforin release, evidenced by the CD107a degranulation assay. In concordance with these findings, taking of AgePro for 1 month increased production of several cytokines and chemokines, including IL-1β, IL-1Rα, IL-6, IL-8, IL-10, IFN-γ, TNF-α, G-CSF, PDGF-AA, PDGF-AB/BB, GRO, MCP-1, MCP-3, and MIP-1α by PBMCs co-cultured with K562 cells. Of note, increased production of the cytokines correlated with the activation state of PBMCs, as evidenced by increased expression of the surface activation markers (e.g., the interleukin-2 receptor alpha chain - CD25). A strong correlation was found between NK-based cytotoxic activity and the production of IL-1β, IL-6, TNF-α, and MIP-1α. Importantly, no increase of the aforementioned soluble factors and activation markers was detected in PBMCs cultured alone, thereby illustrating the potent immunoregulatory activity of AgePro only in the presence of the harmful target cells. Hematological parameters also remained unchanged over the entire study period.
Collectively, we show here for the first time the significant enhancement of the cytotoxic activity of NK cells against target tumor cells after taking AgePro for 1 month. Notably, this effect was observed for all age groups, including young, adult, and elderly participants. Moreover, a significant improvement in NK cytotoxic activity was also detected for participants with low basal (i.e., before taking AgePro) numbers of NK-mediated killing. The enhancement of NK-based cytotoxicity was associated with the increased release of several cytokines and chemokines involved in regulating a broad spectrum of mechanisms outside the cell-mediated cytotoxicity and killing of target cells. Of note, spontaneous activation of PBMCs, particularly NK cells, was not detected after taking AgePro. Given that spontaneous activation of autoreactive lymphocytes is a feature associated with autoimmunity and taking into account our data illustrating the AgePro-induced activation of NK cells detected only in the presence of the potentially harmful cells, we conclude that our innovative product exhibits potent immunoregulatory activity and high safety profile.
Keywords:
Bioactive compounds
; AgePro
; NK cells
; activation
; cytokines
; K562-based cytotoxicity
; CD107a degranulation assay
Introduction
The role of bioactive compounds in modulating the activity of the immune system is an emerging field of clinical significance, as it highlights the close interplay between nutrients and the efficacy of innate and adaptive immune responses, which is pivotal in preventing a broad spectrum of human diseases. Indeed, apart from interleukins, which belong to the best-characterized group of compounds exhibiting immunostimulatory capacities, nutrients and constituents extracted from plants also display the ability to stimulate and/or modulate the activity of diverse immune cells, including NK cells, T- and B-lymphocytes, dendritic cells, macrophages, neutrophils, etc. In particular, the activity of NK cells might be effectively regulated by vitamins A, B, C, D, and E [1,2,3,4,5,6,7], polysaccharides, lectins, and several phytochemicals (e.g., genistein, curcumin, resveratrol, quercetin, etc.) [8,9,10,11], which results in the increased NK-mediated killing of target cells, higher levels of their degranulation, and/or enhanced IFN-γ and TNF-α production [reviewed in more detail in [12]. In particular, apart from the well-known antioxidative, anti-inflammatory, and neuroprotective activities, a flavonol compound quercetin was shown recently to increase the proportion and maturation of NK cells without affecting T or B cells, thereby improving cognitive performance in mice. In contrast, the depletion of NK cells significantly reduced their cognitive abilities [11]. Moreover, quercetin was proposed to mitigate the immunosenescence hallmarks in human peripheral blood mononuclear cells (PBMCs) in vitro by restoring the proliferative capacity of aged cells and increasing their iNOS activity assessed by nitric oxide release [13], thereby suggesting about the senolytic activity of this bioactive supplement.
Similarly, nicotinamide mononucleotide (NMN), a key nicotinamide adenine dinucleotide (NAD+) intermediate, was shown to mitigate age-associated physiological decline in mice on the multiple levels, including age-associated body weight gain, enhanced energy metabolism, improved insulin sensitivity and plasma lipid profile [14]. The results of placebo-controlled, randomized, double blind trials clearly illustrated that oral supplementation of NMN (250 mg/day) for 12 weeks significantly increased NAD+ levels in whole blood without obvious adverse effects and abnormalities in physiological and laboratory tests. [15]. Additionally, NMN, has also been shown to augment NK cell cytotoxic activity in preclinical and clinical models. For example, oral administration of NMN increased NK-based cytotoxicity in young and elderly mice without affecting the number of NK cells. Of note, NMN did not enhance NK-mediated cytotoxic activity in IFN-γ deficient mice, suggesting that NMN administration augments NK cell cytotoxic activity in an IFN-γ-dependent manner [16]. Of note, NK cells cultured in the presence of NAD exhibited potent metabolic changes associated with elevated glucose flux and protection against oxidative stress. As expected, NAD-treated NK cells displayed enhanced cytotoxicity and inflammatory cytokine production. Moreover, NK cells cultured with NAD and interleukin-15 (IL-15) exhibited the increased expression of L-selectin (CD62L), a well-known lymphocyte adhesion molecule playing a crucial role in lymph node homing. Strikingly, in a phase 1 trial of NAD-expanded allogeneic NK cells, rituximab (the monoclonal antibodies targeting CD19 molecule), and IL-2, 11 of 19 patients with relapsed or refractory non-Hodgkin lymphoma (NHL) and multiple myeloma (MM) (NCT03019666) demonstrated complete response, suggesting that supplementation with NAD during ex vivo NK cell culture should be further investigated in detail for NHL therapy [17].
Besides the essential immunomodulatory role of the aforementioned bioactive compounds, bovine colostrum comprising a broad spectrum of bioactive molecules, including immunoglobulins and antimicrobial peptides, was also shown to effectively modulate the functional activities of both (i.e., innate and adoptive) branches of immunity [18]. In particular, ultrafiltered bovine colostrum and hydrolyzed whey significantly increased NK activity in vivo, which was evidenced by the increased production of cytokines (e.g., IL-2, IFN-γ, and TNF-α) after their oral administration to mice [1,2,3,4,5,6,7,8,9,10,11,12,13,14,15,16,17,18,19,20,21]. Our recent study also demonstrated the high immunomodulatory potency of colostrum-based natural products, whey extract, and their combinations with egg yolk extract and mushroom extracts on peripheral blood mononuclear cells (PBMCs). Indeed, we observed the increased production of cytokines in lipopolysaccharide (LPS)-treated PBMC cultured in the presence of colostrum-based natural products when compared with control (i.e., PBMC cultured with LPS alone). In contrast, a decreased amount of cytokines was found in the supernatants of phytohemagglutinin (PHA)-activated PBMC cultured in the presence of colostrum-based natural products, thereby illustrating their potent immunomodulatory activities and ability to prevent excessive activation of immune cells [22].
The present study aimed to examine the immunomodulatory activities of the ultra- and nanofiltered colostrum-based natural products combined with egg yolk extract, NMN, quercetin, alpha-ketoglutarate, white button mushroom, and celery seed extracts. 4Life Research Company, USA, patented this formula and named AgePro. This product was given orally to healthy participants to assess its immunomodulatory activity in vivo. We showed here for the first time that taking this supplement at 2 capsules twice a day for 30 days significantly improved the cytotoxic activity of NK cells. This was evidenced by the increase of PBMC-mediated killing of carboxyfluorescein diacetate succinimidyl ester-labeled (CFSE)-labeled K562 human myeloid leukemia cells. As expected, this effect was ratio-dependent and illustrated the maximal killing of K562 target (T) cells by PBMC effector (E) cells used at a 50:1 E/T ratio. Of note is that the NK-mediated killing of K562 cells correlated with NK-based degranulation, as evidenced by the CD107a degranulation assay. Lastly, AgePro significantly increased the production of several cytokines (e.g., IL-1β, IL-1Rα, IL-6, IL-8, IL-10, TNF-α, G-CSF, etc.) and chemokines (e.g., GRO, MCP-1, MCP-3, MIP-1α, etc.) by PBMCs co-cultured in presence with K562 cells. Importantly, no evidence of spontaneous activation of PBMCs was found in the absence of K562 target cells, thereby highlighting the immunomodulatory potency of AgePro.
Collectively, we showed a significant increase in NK-based cytotoxic activity after taking AgePro as an oral supplement for 1 month. This effect was observed for all age groups, including young and adult participants (age < 35 and >50, respectively). Moreover, a substantial improvement in NK cytotoxic activity was detected for the participants with very low basal (i.e., before AgePro) PBMC-mediated cytotoxicity levels, illustrating this bioactive supplement's potent immunomodulatory activity.
Results
AgePro Uptake Increases the Cytotoxic Activity of NK Cells and Enhances K562 Killing In Vitro in a Ratio-Dependent Manner
Given that the primary goal of the study was to examine whether the AgePro supplement taken orally at 2 capsules twice a day for 30 days has an impact on the cytotoxic activity of NK cells, we performed K562-based cytotoxicity assay according to the standard protocol, as shown elsewhere [23]. For this purpose, we used purified PBMCs and co-cultured them with K562 target cells pre-labeled with carboxyfluorescein diacetate succinimidyl ester (CFSE), which is a stable, protein-binding fluorescent dye that allows for discrimination of target cells from effector NK cells [24]. K562 cells cultured alone were used as a negative control (Figure 1A), whereas K562 cells exposed to Tween-20 served as a positive control of cell lysis, which was detected by FACs staining due to increased uptake of propidium iodide (Figure 1B). Different ratios between effector (E) and target (T) cells were used. As expected, maximal killing of K562 cells was observed for the highest (e.g., 50:1) E:T ratio (Figure 1C), whereas lower E:T ratios (e.g., 25:1; 12:1; 6:1) exhibited less amount of the lyzed K562 target cells (Figures 1D, E, F - respectively).
Strikingly, AgePro supplement taken orally at 2 capsules twice a day for 30 days significantly increased the cytotoxic activity of NK cells. The representative histograms in Figure 2 illustrate the significant increase in K562 killing after taking AgePro compared to the baseline (i.e., before taking AgePro). As shown in Figure 2 and Figure 3, enhanced killing of K562 cells was detected for all E:T ratios. Importantly, such an effect was found for all age groups (i.e., <35 and >50 years old participants), as shown in Table 1.
AgePro Increases CD107a Expression in NK Cells, Correlating with Their Cytotoxic Activity
Given that CD107a (LAMP-1) is a molecule expressed on activated NK and CD8+ T cells, and considering that functional CD107a is required for efficient perforin delivery to lytic granules and NK-mediated cytotoxicity [25], we further examined whether the AgePro supplement, taken orally at 2 capsules twice a day for 30 days, increases the expression of this molecule on NK cells cultured in the presence of K562 cells. PBMCs cultured alone were used as a negative control, whereas PBMCs cultured with IL-2 (20 ng/ml) were used as a positive control.
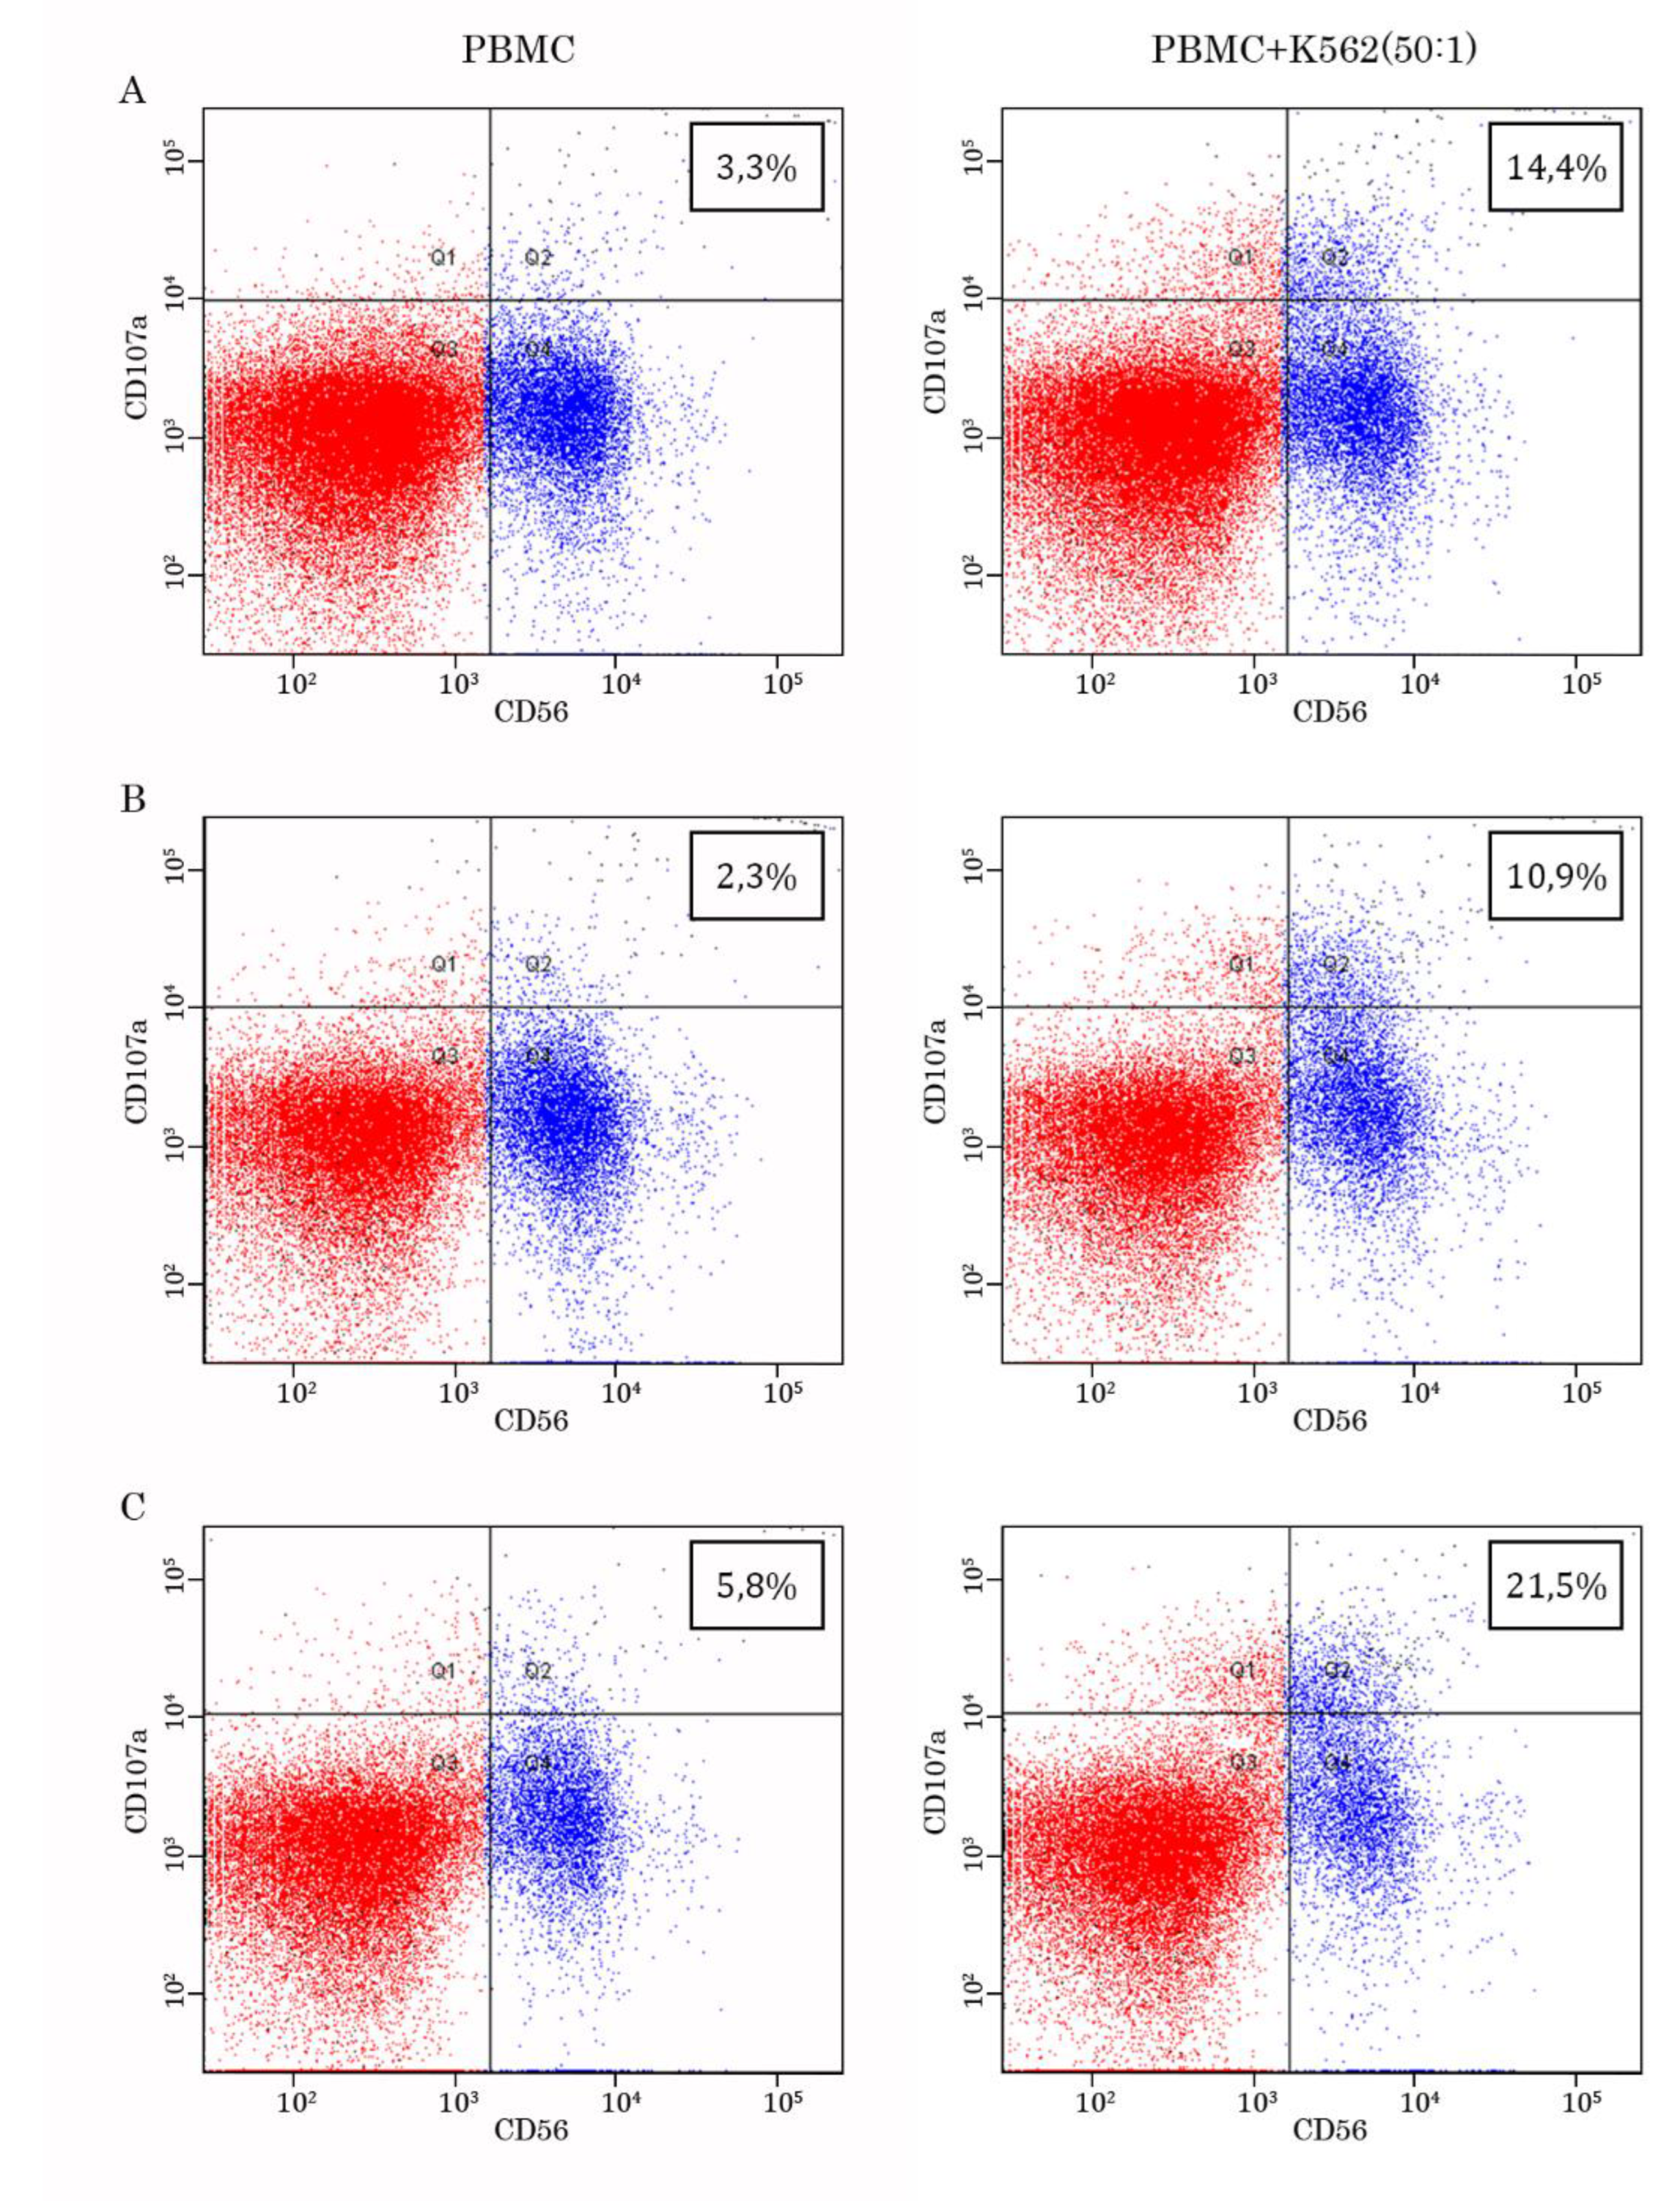
We initially examined whether the co-culture of PBMCs with K562 target cells increases CD107a expression in NK cells. As shown in Figures 4A-C - left panel, in PBMCs cultured alone, CD56-positive cells exhibited low expression of CD107a marker, whereas the presence of K562 target cells significantly increased numbers of double-positive (e.g., CD56/CD107 cells) (Figures 4A-C - right panel), thereby illustrating an overall increase of degranulation in PBMCs cultured with K562 target cells. Table 2 illustrates the increased numbers of CD107a-positive cells among PBMCs cultured in the presence of IL-2 or K562 cells or in combination compared to baseline numbers.
Figure 4.
Representative dot-plots illustrating the expression of CD107a molecule on the CD56-positive cells. Data is shown for 3 participants (A, B, and C, respectively). Left panel - PBMCs cultured alone, right panel - PBMCs cultured in the presence of K562 target tumor cells.
Figure 4.
Representative dot-plots illustrating the expression of CD107a molecule on the CD56-positive cells. Data is shown for 3 participants (A, B, and C, respectively). Left panel - PBMCs cultured alone, right panel - PBMCs cultured in the presence of K562 target tumor cells.
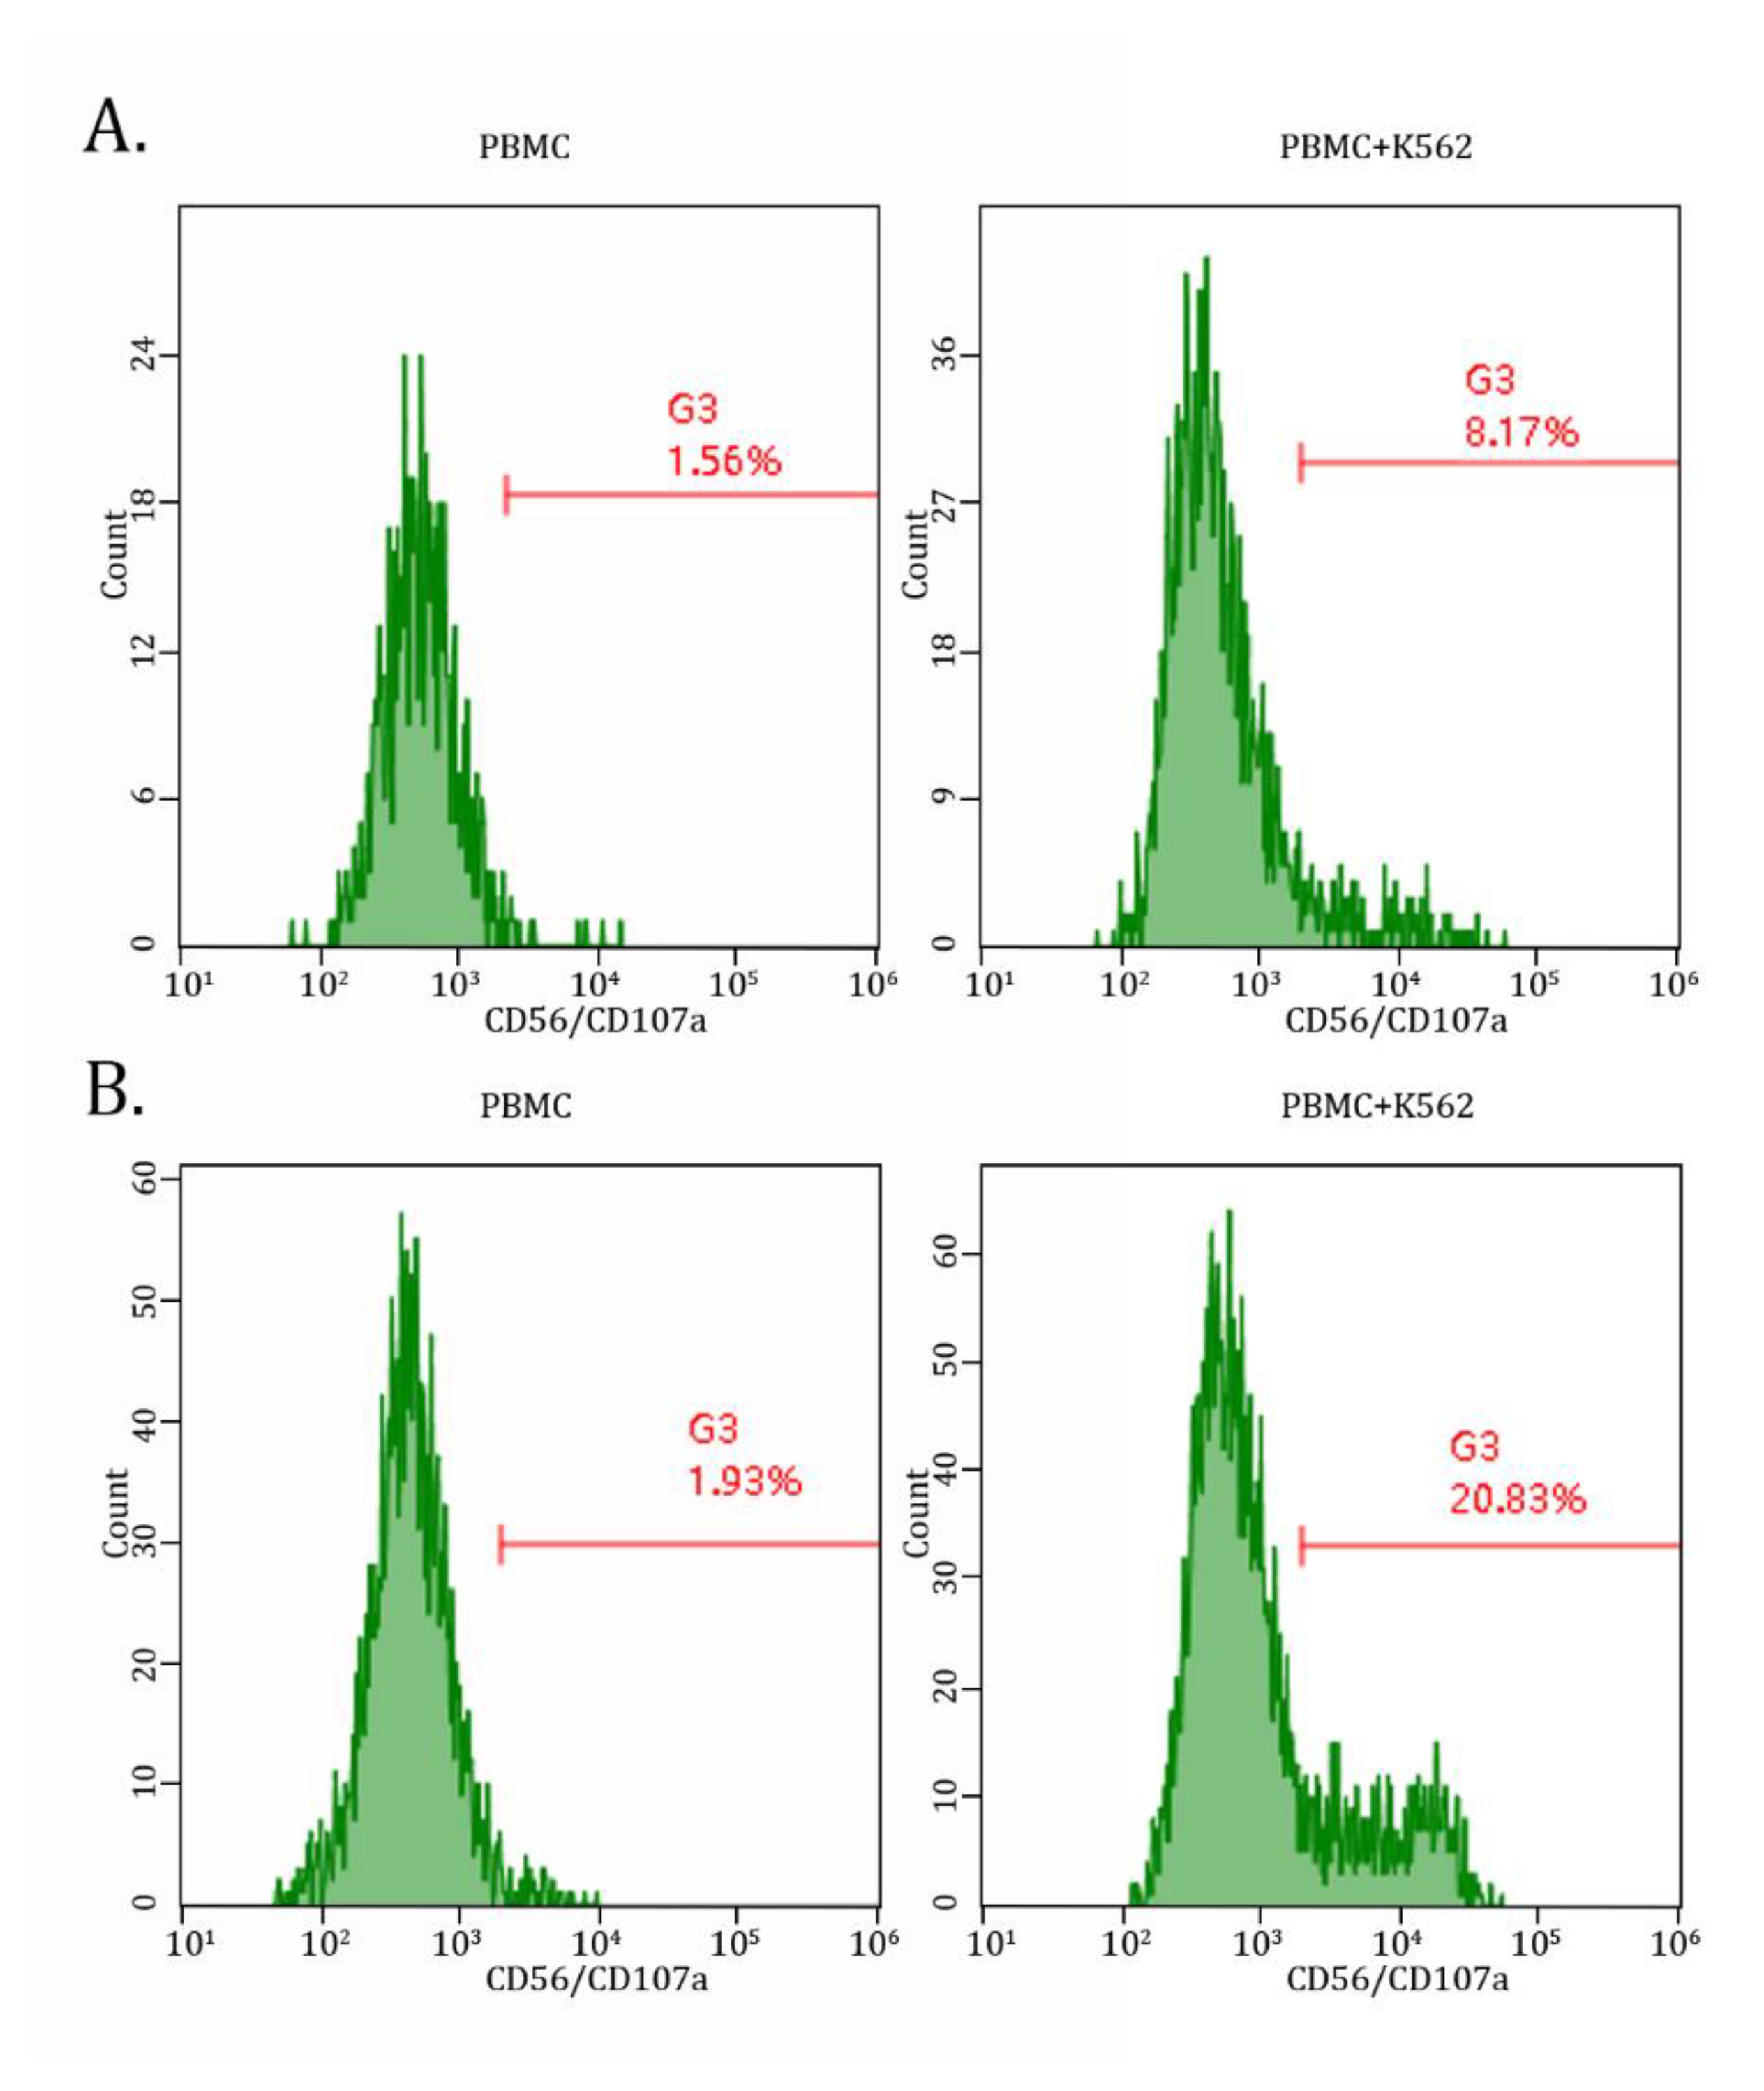
Next, we found a significant (~ 5-fold) increase of double-positive (i.e., CD56/CD107a) cells after taking AgePro. Importantly, this was observed only in PBMCs cultured in the presence of K562 target cells, whereas no increase of degranulating NK cells was detected in PBMCs cultured alone (Figures 5A, B).
Figure 5.
AgePro increases NK-based degranulation in PBMCs cultured with K562 target cells. Representative histograms illustrate the expression of CD107a molecules in PMBCs cultured with K562 target cells (right) when compared with PBMCs alone (left). Data shown in B illustrates increased CD107-positive cells after taking AgePro compared to the AgePro-naive sample (A).
Overall, this data suggests that increased cytotoxic activity of NK cells after taking AgePro is related to enhancing their degranulation, as evidenced by increased numbers of CD107a-positive cells.
AgePro Stimulates the Production of Cytokines/Chemokines by PBMCs Cultured with K562 Target Cells
Next, we examined whether the AgePro supplement can modulate the production of cytokine/chemokines by PBMCs cultured with K562 target cells in 200 μL culture media at 50:1 ratio for 4 hours at 37°C. PBMCs cultured alone were used as a negative control. The concentrations of 41 chemokines (MCP-1, MCP-3, MIP-1α, RANTES, GRO, VEGF, FGF, EGF, etc.) and cytokines (IL-1β, IL-2, IL-3, IL-4, IL-5, IL-6, IL-7, IL-8, IL-9, IL-10, IL-12p70, IL-15, IL-17, IFN-γ, TGF-α, TNF-α, G-CSF, GM-CSF, etc.) in culture supernatants were measured with MILLIPLEX MAP human cytokine/chemokines panel (Merck, Kenilworth, NJ, USA). Initially, we examined whether PBMCs released the aforementioned soluble factors upon four hours of incubation with K562 target cells. As anticipated, stimulation of NK cells by K562 target cells increased the production of IL-1Rα, IL-4, -6, -8, IFN-2α, and TNF-α (Figures 6A, Supplementary Table 1). Additionally, IL-1β, IL-7, -7, -10, -12, IFN-γ, and both colony-stimulating factors (e.g., G-CSF and GM-CSF) were found in PBMC/K562 supernatants only (Figures 6A, Supplementary Table 1). Of note, the levels of several cytokines, including IL-1Rα, IL-6, and IFN-2α in PBMCs cultured alone, were very low, thereby illustrating K562-induced stimulation of PBMCs, including NK cells. Additionally, K562-induced stimulation of NK cells enhanced the secretion of several chemokines, including eotaxin, FGF-2, GRO, MCP-1, MCP-3, VEGF, and MIP-1α (Figure 6B, Supplementary Table 1). Again, much lower levels of the chemokines mentioned above were detected in the supernatants of PBMCs cultured in the absence of K562 target cells, suggesting a degree of constitutive secretion. Lastly, IL-2, -3, -5, -9, -13, -15, -17α, and TGF-α were not detected in PBMCs and PBMC/K562 cultures (Figures 6A and B).
Given that the production and secretion of cytokines and chemokines is a signature of cell activation, we also examined expression of activation markers, including the CD25 molecule, a well-known receptor for the alpha chain of IL-2, and HLA-DR late activation marker, on PBMCs. As shown in Supplementary Figure 1 and Supplementary Table 2, we observed a ~ 60% increase in CD25-positive cells in PBMCs cultured in the presence of K562 target cells compared with PBMCs alone, thereby illustrating K562-induced activation of mononuclear cells. In contrast, no increase in the number of HLA-DR-positive cells in PBMC/K562 cultures was observed, probably due to their co-cultures short period (12h). As expected, PHA-stimulated PBMCs that served as a positive control for these experimental settings exhibited a substantial increase in CD25-positive cells (Supplementary Figure 1A).
Next, we compared the levels of the aforementioned soluble factors in PBMC/K562 supernatants between before and after taking AgePro. Strikingly, we observed the elevated levels of 26 chemokines/cytokines in PBMC/K562 supernatants compared to the AgePro-naive samples. This included IL-1β, IL-1Rα, IL-4, -6, -7, -8, -10, -12, TNF-α, TNF-β, G-CSF, GM-CSF, EGF, FGF-2, PDGF-AA, PDGF-AA/AB, VEGF, GRO, MCP-1, MCP-3, MIP-1α, eotaxin, and MDC. The most prominent increase (>100%) was found for IL-1Rα, IL-6, -8, -10, TNF-α, MCP-1, -3, and MIP-1α (Table 3). This is also shown in Figure 7A. A moderate increase (>50%) after taking AgePro was observed for IL-1β, IL-12p40, GRO, and PDGF-AA (Figure 7B, Table 3). A minor increase in ranking between 20 - 50% was found for IL-4, -7, -12p70, TNF-β, G-CSF, GM-CSF, EGF, PDGF-AA/AB, VEGF, eotaxin, and MDC (Figure 7C, Table 3). Even though the role of several cytokines, including TNF-α and IFN-γ in the NK-mediated killing of target cells is well-documented by multiple studies, we did not find a significant increase of IFN-γ in PBMC/K562 supernatants after taking AgePro (Figure 7C, Table 3). No increases of sCD40L, IP-10, MIP-1β, RANTES, FLT-3l, fractalkine, INF-α2, and -γ were also observed after taking AgePro. Lastly, IL-1α, -2, -3, -5, -9, -13, -15, -17α, and TGF-α were not detected in PBMC/K562 supernatants (data is not shown).
The increased levels of several chemokines in PBMC/K562 supernatants after taking AgePro (e.g., GRO, MCP-1, MCP-3, IL-8, MIP-1α, PDGF-AA, and PDGF-AA/AB (Figure 7 and Table 3), illustrates AgePro’s ability in regulating the other processes besides of NK-based cytotoxic activity, including the priming, homing and recruitment of diverse immune cells. Despite the lack of evidence illustrating NK’s ability to produce some of these chemokines directly, the increased amounts of the aforementioned chemokines in PBMC/K562 supernatants might also be due to the NK-based activation of the other subsets of immune cells in bulk PBMC cultures. Further studies are needed to elucidate these possibilities.
NK-Based Cytotoxicity Correlates with Increased Production of TNF-α, IL-6, and IL-1β.
Next, we examined whether increased levels of cytokines/chemokines in PBMC/K562 cultures detected after taking AgePro correlated with the cytotoxic activity of NK cells. For this purpose, the cytokines and chemokines were previously divided into three groups based on the increased values after taking AgePro (i.e., high > 100%, moderate between 50 -100% increase, low - < 50%), as shown in Figure 7 and Table 3. The cytokines that belonged to groups 1 and 2 were chosen for the correlation analysis. For this analysis, all the participants were also divided into two groups based on the intensity of cytotoxic response rate (RR) measured as % of the increased killing of K562 cells after taking AgePro - i.e., group 1 with RR < 20% and group 2 with RR > 20%, as shown in Figure 8. Based on this segregation approach, we found that the levels of several cytokines in supernatants of PMBC/K562 cultures correlated with NK-mediated cytotoxic activity. This belonged to IL-1β, IL-6, and TNF-α (Figure 8). Similarly, increased expression of chemokine MIP-1α after taking AgePro correlated with enhanced NK-based cytotoxicity against K562 target cells (Figure 8). In contrast, group 1 exhibited lower cytokine responses after K562-based stimulation of NK cells (Figure 8), thereby revealing the strong relationship (i.e., φ>0.7) between NK-based cytotoxic activity and production/secretion of the cytokines/chemokines mentioned above (Supplementary Table 3). Additionally, by using Spearman's rank correlation assay, we found a strong correlation pattern between NK-based killing of K562 cells and the production of IL-6, TNF-α, and MIP-1α (Table 4).
AgePro Does Not Induce Spontaneous Activation of PBMCs
Notably, after taking AgePro, no increase in cytokines/chemokines was observed in the supernatants of PBMCs cultured without K562 target cells (Supplementary Figure 2 and Supplementary Table 4).
This was in concordance with the low expression of activation markers (e.g., CD25 and HLA-DR) on PBMCs after taking AgePro, as was described above. Similarly, no increase of spontaneous degranulation of NK cells measured by CD107a degranulation assay was detected after taking AgePro (Figure 5 and Table 5).
Lastly, AgePro did not induce hematological changes in all participants enrolled in the present study. This included the number of red blood cells (RBC), white blood cells (WBC), hemoglobin (HGB), hematocrit (HCT), mean corpuscular volume (MCV), mean corpuscular HGB (MCH), mean corpuscular HGB concentration (MCHC), RBCl distribution width coefficient of variation (RDW-CV), RBC distribution width standard deviation (RDW-SD), platelets (PLT), mean platelet volume (MPV), platelet distribution width by volume (PDW), platelet large cell ratio (P-LCR), platelet crit (PCT), immature granulocytes (IG), neutrophils (Neu), lymphocytes (Lym), monocytes (Mon), eosinophils (Eos), basophils (Bas), nucleated RBC (NRBC), and erythrocyte sedimentation rate (ESR) (Supplementary Table 5).
Discussion
Natural killer (NK) cells belong to the family of innate lymphoid cells (ILCs), which play a key role in the early phase of innate immune responses against infections and malignancies due to the potent killing capacities against virus-infected and transformed cells that are dangerous to the host [26,27]. Besides infections and malignancies, NK cells also play a regulatory role in autoimmune [28,29] and metabolic diseases [30]. Indeed, this fact was proven for systemic lupus erythematosus, type 1 diabetes mellitus, and autoimmune liver disease [31,32,33]. Mechanistically, activated NK cells release perforins and granzymes to exert antibody-dependent and independent cytotoxicities and induce apoptosis to remove hostile cells. They also secrete several cytokines, including IFN-γ, IL-12, IL-15, and IL-18, thereby regulating both branches of innate and adaptive immunity [34,35]. Thus, maintaining NK cells' appropriate functional and metabolic activities is crucial for immunosurveillance in a broad spectrum of human diseases by preventing the development and progression of cancer, viral infections, autoimmune and metabolic disorders, etc.
Besides interleukins, the well-known activators of the immune system, vitamins, and natural compounds also display potent immunomodulatory activities for T- and B-lymphocytes, dendritic cells, macrophages, neutrophils, and NK cells. Multiple reports, including our own, demonstrate immunomodulatory properties of colostrum-based products affecting the activity of the diverse components of the immune system [18,19,20,22]
The present study aimed to examine the immunomodulatory activities of ultra- and nano-filtered colostrum-based natural products combined with egg yolk extract, white button mushroom and celery seed extracts, quercetin, alpha-ketoglutarate, and nicotinamide mononucleotide. This innovative formula, AgePro, was patented by 4Life Research Company, USA, and was used to assess its immunomodulatory activities in vivo.
Most studies illustrating the low NK count and dysfunction of the NK activity (NKA) are underlying in the cancer research area. Indeed, the decreased number of NK cells and dysfunction of their activity are well-documented for a broad spectrum of human malignancies, including follicular lymphoma [35], multiple myeloma [37], a broad spectrum of solid tumors, including head and neck cancer, breast and lung cancer, etc. [38]. NK cells were also shown to target circulating tumor cells, thereby preventing the disease progression and formation of metastatic lesions [39,40]. Besides the high prognostic values of NK counts in human diseases, the assessment of NKA provides a more precise and accurate approach to determining potential dysfunctions of these immune cells. The current approaches aimed to assess the functional state of NK cells are the following:
- the cytotoxicity assays based on the direct measurement of the killing of previously labeled (e.g., with carboxyfluorescein diacetate succinimidyl ester-labeled (CFSE)) target cells (e.g., K562 human myeloid leukemia cells). Due to the reduced expression of HLA class I molecules present in K562 cells and increased expression of ligands for activatory NK receptors, these cells are considered the most suitable target cells to examine the functional activity of NK cells and NK cell-mediated cytotoxicity [41]. Indeed, the loss or aberrant expression of MHC-I molecules on tumor cells was shown as the most critical signal for NK cell recognition [42,43];
- CD107a degranulation assay designed to count the amount of secreted cytotoxic granules, including perforin and granzyme, which trigger target cell death [44];
- Assays aimed to examine the cytokines release activity. Based on these assays, impaired NKA was found to be a driving force for several human diseases. Notably, low or absent NKA is currently established as a significant characteristic of hemophagocytic lymphohistiocytosis (HLH) [45,46]. Impaired NKA was also shown for liver diseases, including hepatocellular carcinomas (HCC) and cirrhosis [47], other types of human malignancies, and viral infections, as well.
Using these approaches, we showed here for the first time that our innovative product, AgePro, taken twice a day for 1 month, significantly improved NKA in healthy subjects. This was evidenced by the increased killing of K562 target cells, as shown in Figure 2, Table 1. Notably, the enhancement of NK cell-mediated killing of K562 cells was evenly detected for all the participants independently from their age (Table 1). Of note, the increased lysis of K562 cells was more pronounced for the participants who initially (i.e., before taking AgePro) exhibited low NK-mediated killing of target cells. In concordance with this data, we also detected increased CD56/CD107a-positive cells in PBMC/K562 cultures, thereby illustrating the increased degranulation of NK cells. Important, AgePro induced a substantial increase of CD56/CD107a-positive cells in PBMC/K562 cultures, whereas no increase of the degranulating NK-cells was found in PBMCs cultured alone (Figure 5B). These results are consistent with literature data illustrating the CD107a molecule as a functional marker for identifying NK-based cytotoxic activity [44,48]. Interestingly, it was also shown that besides the tight relationship between NK degranulation and the expression of CD107a molecules on NK cells, these molecules might also protect these immune cells from self-destruction during degranulation-associated damage [49]. Thus, increased expression of CD107a molecule on the surface of NK cells after taking AgePro illustrates the ability of this bioactive supplement to maintain the proper functional activity of NK cells and their survival.
Next, we observed the significant changes in PBMC’s secretome after taking AgePro. Noteworthy, this was evidenced only for PBMC/K562 cultures (Figure 7, Table 3), whereas the cytokine/chemokines profile in PBMCs cultured alone remained unchanged. This illustrates the absence of excessive activation of immune cells after taking AgePro and highlights the potent immunomodulatory activity of this supplement, activating the immune cells only in the presence of harmful cells. In particular, we detected elevated levels of 13 cytokines and chemokines in PBMC/K562 supernatants after taking AgePro. This included IL-1β, IL-1Rα, IL-6, -8, -10, TNF-α, G-CSF, GRO, MCP-1, MCP-3, MIP-1α, PDGF-AA, and PDGF-AA/BB. Given that K562 cells lacking MHC class I molecules on their surfaces are known as the primary targets for NK cells, we postulated that several cytokines and chemokines that were increased in PBMC/K562 cultures were produced by activated NK cells. Indeed, K562 cells are a human myeloid cell line with reduced expression of HLA class I and increased expression of ligands for activatory NK receptors, making them susceptible to NK cell-mediated cytotoxicity [41]. Moreover, unlike adaptive T lymphocytes, NK-cell-mediated killing of target cells does not require prior priming and is independent of human leukocyte antigen (HLA) restriction. The activity of NK cells is generally regulated by the activatory and inhibitory receptors recognizing the germline-encoded molecules on the target cells [50,51].
Even though the most prominent cytokines involved in NK-based cytotoxicity are known as TNF-α and IFN-γ, the strong correlation pattern between NK-based cytotoxic activity and production was also found for IL-1β, IL-6, and MIP-1α (Figure 8, Table 4). Besides these factors, the activated NK cells have been reported to produce several other factors, including immunoregulatory cytokines such as IL-5, IL-8, IL-10, IL-13, FLT3LG, TGF-α, the chemokines MIP-1α, MIP-1β, XCL1/2, CCL3/4/5 and RANTES, and several growth factors, including GM-CSF, G-CSF, M-CSF, which recruit other immune cells and regulate their anti-tumor responses [52,53,54,55,56,57,58]. Thus, elevated TNF-α, IL-10, G-CSF, GM-CSF, and MIP-1α in PBMC/K562 supernatants indicate K562-induced activation of NK cells. In contrast, the sources of the remaining cytokines and chemokines that were increased in PBMC/K562 cultures remain to be further elucidated. It might be due to NK-induced activation of the remaining populations of mononuclear cells (monocytes and remaining subsets of lymphocytes) that were present in PBMC cultures. Alternatively, the increased levels of IL-1β, IL-1Rα, IL-6, -8, GRO, MCP-1, MCP-3, PDGF-AA, and PDGF-AA/BB in PBMC/K562 cultures might illustrate a novel pattern of soluble factors produced by activated NK cells. To delineate between these possibilities, the flow cytometry-based detection of the intracellular levels of the aforementioned cytokines and chemokines in the selected populations of lymphocytes is desirable. Alternatively, culturing K562 cells with purified NK cells might help determine the NK-based cytokine/chemokines profile.
Importantly, the vast majority of the soluble factors that were increased in PBMC/K562 cultures after taking AgePro exhibit potent immunomodulatory properties and therefore might potentiate the cytotoxic activities of NK- and CD8-lymphocytes (e.g., TNF-α, IFN-γ, IL-1β), facilitate antigen presentation, and enhance the homing and chemotaxis of the diverse subpopulations of immune cells (e.g., GRO, MCP-1, MCP-3, etc.), etc. Two soluble factors exhibit opposite activities among 26 cytokines/chemokines that were elevated in PBMC/K562 supernatants. This includes IL-10 and IL-1Rα (interleukin-1 receptor antagonist). Indeed, like TGF-β, IL-10 was known as an immunosuppressive cytokine that limits an excessive NK cell activation by dampening the secretion of IL-12, -15, and -18 by antigen-presenting cells [59,60]. However, several studies also illustrated the immunomodulatory activity of IL-10. For example, in the presence of IL-12 and -18, IL-10 stimulated NK cell proliferation, cytotoxic activity, and IFN-γ production via activation of STAT3 signaling pathway [59,61,62]. Similarly, the upregulation of anti-inflammatory IL-1Rα was proposed to play a protective role from cytokine-mediated toxicities [63].
Collectively, we show here for the first time the significant enhancement of cytotoxic activity of NK cells against target tumor cells after taking AgePro for 1 month. This was associated with the increased release of several cytokines and chemokines (e.g., TNF-α, IL-1β, IL-6, -8, MCP-1, -3, and MIP-1α), involved in the regulation of a broad spectrum of mechanisms outside the cell-mediated cytotoxicity and killing of target cells. A strong correlation pattern was found between NK-based cytotoxic activity and the production of TNF-α, IL-1β, IL-6, and MIP-1α. Of note, no evidence of spontaneous (i.e., in the absence of target cells) activation of PBMC, particularly NK cells, was detected after taking AgePro. Given that spontaneous activation of autoreactive lymphocytes is a feature associated with autoimmunity and taking into account our current data illustrating the AgePro-induced activation of NK cells detected only in the presence of the malicious and potentially harmful (i.e., cancerous) cells, we conclude that our innovative product exhibits potent immunoregulatory activity and high safety profile.
Materials and Methods
This study involved 17 individuals (9 women and 8 men). The participants ranged in age from 23 to 89, with the largest group comprising individuals aged between 23 and 35 (53%). The mean age was 45.8 ± 18.0 years. The respondents voluntarily agreed to participate in the study and freely provided written, informed consent before participation.
Blood Sample Preparation
Peripheral blood was collected in heparinized tubes from 17 healthy volunteers (8 men and 9 women aged 23 to 89). Peripheral blood was used for determining the hematological parameters of the participants, including the following: red blood cells (RBC), white blood cells (WBC), hemoglobin (HGB), hematocrit (HCT), mean corpuscular volume (MCV), mean corpuscular HGB (MCH), mean corpuscular HGB concentration (MCHC), RBCl distribution width coefficient of variation (RDW-CV), RBC distribution width standard deviation (RDW-SD), platelets (PLT), mean platelet volume (MPV), platelet distribution width by volume (PDW), platelet large cell ratio (P-LCR), platelet crit (PCT), immature granulocytes (IG), neutrophils (Neu), lymphocytes (Lym), monocytes (Mon), eosinophils (Eos), basophils (Bas), nucleated RBC (NRBC), and also erythrocyte sedimentation rate (ESR) (Westergren method (as shown in Supplementary Table 5). The hematological parameters were measured on a Cube 30 touch (DIESSE Diagnostica Senese S.p.A. Società Benefit, Italy) and Sysmex XN 1000 (Sysmex, Singapore).
Peripheral blood mononuclear cells (PBMC) were used for the NK cytotoxicity, CD107a degranulation and activation assays. Human PBMCs were purified from healthy adult participants using density-gradient centrifugation with Ficoll-Hypaque (d = 1.077) (Paneco, Moscow, Russia), washed twice with phosphate-buffered saline (PBS), and further used for the aforementioned assays, as shown below. For negative and positive controls, PBMC were either unstimulated or stimulated for 12 h with mitogen phytohaemagglutinin (PHA) (Paneco, Moscow, Russia) (final concentration of 5 μg/ml). PHA-induced activation of PBMC was assessed by flow cytometry due to the increased expression of CD25 and HLA-DR molecules as the markers of lymphocyte’s activation.
Cells and Cell Culture
Human myelogenous leukemia K562 cells were obtained from the American Type Culture Collection (ATCC, Manassas, VA, USA) and cultured in Roswell Park Memorial Institute (RPMI) 1640 medium (Paneco, Moscow, Russia) supplemented with 10% heat-inactivated fetal bovine serum (Gibco, Grand Island, NY, USA), 100 U/mL penicillin, and 100 μg/mL streptomycin (Paneco, Moscow, Russia) in a humidified atmosphere of 5% CO2 at 37°C (LamSystems, Myass, Russia).
Antibodies
The antibodies used for flow cytometry were as follows: FITC- and PE-conjugated anti-human HLA-DR mAb and PE/Cy7-conjugated anti-human CD25 mAb (Biolegend, San Diego, CA, USA), APC-conjugated anti-human CD3 mAb, FITC-conjugated anti-human CD56 mAb, and PE-conjugated anti-human CD107 mAb(BD Biosciences, Franklin Lakes, NJ, USA).
PBMC NK Cytotoxicity Assay
The PBMC NK cytotoxicity assay using K562 cells was performed as previously described [23]. Briefly, K562 target cells were labeled with carboxyfluorescein diacetate succinimidyl ester (CFSE; Lumiprobe Life Science Solutions, Moscow, Russia) for 10 min at 37°C in the dark and washed twice with complete culture medium to quench the labeling reaction. CFSE is a stable, protein-binding fluorescent dye that allows discrimination of target cells from effector NK cells [24,64]. CFSE-stained K562 cells (0.5×10⁵) were transferred to FACs tubes and co-cultured with the effector cells (PBMC) at 6:1, 12:1, 25:1, and 50:1 effector: target (E:T) ratios for four hours at 37°C in a humidified 5% CO2 incubator. Finally, mixed cells were labeled with 1 μL of 1 mg/mL propidium iodide (PI)(Sigma-Aldrich, St. Louis, Missouri, USA) and analyzed by FACSCanto II cytometer (Becton Dickinson Biosciences, Franklin Lakes, NJ, USA) to determine the percentage of dead (i.e. PI-positive) CFSE-positive target cells according to the manufacturer’s protocols. BD FACSDiva Software was used to analyze the samples.
CD107a Degranulation Assay
To analyze NK cell degranulation, their CD107a expression was measured according to the protocol, as described previously [48,65]. Briefly, 1 × 10⁷ PBMCs were mixed with 1 mL of RPMI medium and cultured alone (negative control) or in the presence of IL-2 (20 ng/mL)(ProSpec-Tany TechnoGene Ltd., Ness-Ziona, Israel)(positive control) for four hours at 37°C in a humidified 5% CO2 incubator. 1×10⁷ PBMC were also cultured in 200μL of complete culture medium with 10 μL PE-conjugated anti-CD107a mAb (BD Biosciences, Franklin Lakes, NJ, USA) in the absence or presence of 2×10⁵ K562 cells. Monensin (2 μM; eBiosciences, USA) was introduced into the cell culture following a one-hour incubation, and cells were further incubated for an additional three hours. Thereafter, cells were stained with APC-conjugated anti-human CD3 mAb and FITC-conjugated anti-human CD56 mAb (BD Biosciences, Franklin Lakes, NJ, USA) for 25 min at room temperature in the dark. Cells were washed with PBS and analyzed on a FACSCanto II cytometer (BD Biosciences, Franklin Lakes, NJ, USA).
Multiplex Analysis of Cytokines
A 41-multiplex analysis of an array of granules (MILLIPLEX MAP Human cytokine/ chemokine magnetic bead panel, Merck, Kenilworth, NJ, USA) was used to examine the levels of cytokines/chemokines in PBMCs supernatants. MAGPIX® reader (Bio-Rad, Hercules, CA, USA) was used with xPONENT software (Luminex Corp., Austin, Texas, USA). The Luminex MAGPIX® instrument was previously calibrated with the MAGPIX® Calibration Kit (EMD Millipore, Merck, Kenilworth, NJ, USA); performance was verified with the MAGPIX® Performance Verification Kit (EMD Millipore, Merck, Kenilworth, NJ, USA). MILLIPLEX® Analytes were used to count the results and optimize the performance of the MAGPIX reader.
Statistics
Data were statistically processed in R software, version 4.0.2 (R Foundation for Statistical Computing, Vienna, Austria; URL https://www.R-project.org/).
The Shapiro–Wilk test was used to assess the normality in the sample distribution. Normally distributed data is presented as mean ± standard deviation, whereas data not normally distributed is presented as median (quant 25; quant 75).
Statistical significance between two dependent samples was determined by paired Student’s t-test (in the case of normally distributed data) or Wilcoxon signed-rank test (in the case of not normally distributed data). r -value was used to interpret the value of the effect in the Wilcoxon signed-rank test. Interpretation of effect size r according to Cohen (1988): r < 0.1 illustrates no or minimal effect, 0.1-0.3 – small effect, 0.3-0.5 – moderate effect, 0.5-1 – high effect.
The parametric statistical method (Welch Two Sample t-test) determined statistical significance between two normally distributed independent samples. A nonparametric statistical method assessed statistical significance between two independent samples that were not normally distributed (Wilcoxon–Mann–Whitney test).
Statistical significance between more than two experimental groups was determined by one-way analysis of variance (ANOVA). Pairwise comparisons were then performed with the Benjamini-Hochberg (BH) correction.
A two-tailed Fisher's exact test was used to examine the significance of the relationship between two variables in a contingency table (in particular, between cytokines production and NK-based cytotoxic activity). φ criterion was used to interpret the strength of the relationship. Interpretation of the φ criterion values according to the recommendations of Rea & Parker: < 0.1 – the strength of the relationship is insignificant, 0.1-0.2 – weak, 0.2-0.4 – average, 0.4-0.6 – relatively strong, 0.6-0.8 – strong, 0.8-1.0 – very strong.
Spearman's rank correlation was used to determine the relationship between two non-normally distributed variables. The correlation’s strength was interpreted according to r value: r value between 0 and 0.1 indicates no correlation, between 0.1 and 0.3 - low correlation, between 0.3 and 0.5 - moderate correlation, between 0.5 and 0.7 - potent correlation, r value between 0.7 and 1 indicates robust correlation.
The differences were considered significant at p<0.05.
Disclosure of potential conflicts of interest
None.
Author Contributions
Conception and design: S. Boichuk, D. Vollmer; Development of methodology: S. Boichuk, A. Galembikova; Acquisition of data (acquired and managed patients, provided facilities, etc.): S. Boichuk, A. Galembikova; Analysis and interpretation of data (e.g., statistical analysis, biostatistics, computational, analysis): S. Boichuk, А. Galembikova, D. Vollmer; Writing, review, and/or revision of the manuscript: S. Boichuk, A. Galembikova, D. Vollmer; Administrative, technical, or material support (i.e., reporting or organizing data, constructing, databases): S. Boichuk, A. Galembikova, D. Vollmer; Study supervision: S. Boichuk, D. Vollmer; Financial support: Russian Science Foundation (RSF) (grant no. 25-25-00391).
Grant Support
This study was supported by a grant from the Russian Science Foundation (RSF) (grant no. 25-25-00391).
References
- Fraker, L.D.; Halter, S.A.; Forbes, J.T. Effects of orally administered retinol on natural killer cell activity in wild type BALB/c and congenitally athymic BALB/c mice. Cancer Immunol. Immunother. 1986, 21(2), 114–118. [CrossRef]
- Recchia, F.; Saggio, G.; Cesta, A.; Candeloro, G.; Di Blasio, A.; Amiconi, G.; Lombardo, M.; Nuzzo, A.; Lalli, A.; Alesse, E.; et al. Phase II study of interleukin-2 and 13-cis-retinoic acid as maintenance therapy in metastatic colorectal cancer. Cancer Immunol. Immunother. 2007, 56(5), 699-708. [CrossRef]
- Tamura, J.; Kubota, K.; Murakami, H.; Sawamura, M.; Matsushima, T.; Tamura, T.; Saitoh, T.; Kurabayshi, H.; Naruse, T. Immunomodulation by vitamin B12: augmentation of CD8+ T lymphocytes and natural killer (NK) cell activity in vitamin B12-deficient patients by methyl-B12 treatment. Clin. Exp. Immunol. 1999, 116(1), 28-32.
- Partearroyo, T.; Úbeda, N.; Montero, A.; Achón, M.; Varela-Moreiras, G. Vitamin B12 and folic acid imbalance modifies NK cytotoxicity, lymphocytes B and lymphoproliferation in aged rats. Nutrients 2013, 5(12), 4836–4848.
- Vojdani, A.; Ghoneum, M. In vivo effect of ascorbic acid on enhancement of human natural killer cell activity. Nutr. Res. 1993, 13(7), 753–764. [CrossRef]
- Kim, H.; Jang, M.; Kim, Y.; Choi, J.; Jeon, J.; Kim, J.; Hwang, Y.I.; Kang, J.S.; Lee, W.J. Red ginseng and vitamin C increase immune cell activity and decrease lung inflammation induced by influenza A virus/H1N1 infection. J. Pharm. Pharmacol. 2016, 68(3), 406-420. [CrossRef]
- Ota, K.; Dambaeva, S.; Kim, M.W.; Han, A.R.; Fukui, A.; Gilman-Sachs, A.; Beaman, K.; Kwak-Kim, J. 1,25-Dihydroxy-vitamin D3 regulates NK-cell cytotoxicity, cytokine secretion, and degranulation in women with recurrent pregnancy losses. Eur. J. Immunol. 2015, 45(11), 3188-3199. [CrossRef]
- Guo, T.L.; Chi, R.P.; Hernandez, D.M.; Auttachoat, W.; Zheng, J. F. Decreased 7,12-dimethylbenz[a]anthracene-induced carcinogenesis coincides with the induction of antitumor immunities in adult female B6C3F1 mice pretreated with genistein. Carcinogenesis 2007, 28(12), 2560–2566. [CrossRef]
- Yadav, V.S.; Mishra, K.P.; Singh, D.P.; Mehrotra, S.; Singh, V.K. Immunomodulatory effects of curcumin. Immunopharmacol. Immunotoxicol. 2005, 27(3), 485–497. [CrossRef]
- Rauf, A.; Imran, M.; Butt, M.S.; Nadeem, M.; Peters, D.G.; Mubarak, M.S. Resveratrol as an anticancer agent: a review. Crit. Rev. Food Sci. Nutr. 2018, 58(9), 1428–1447. [CrossRef]
- Su, T.; Shen, H.; He, M.; Yang, S.; Gong, X.; Huang, C.; Guo, L.; Wang, H.; Feng, S.; Mi, T.; et al. Quercetin promotes the proportion and maturation of NK cells by binding to MYH9 and improves cognitive functions in aged mice. Immun. Ageing. 2024, 21(1), 29. [CrossRef]
- Grudzien, M.; Rapak, A. Effect of Natural Compounds on NK Cell Activation. J. Immunol. Res. 2018, 2018, 4868417. [CrossRef]
- Bouamama, S.; Bouamama, A. Quercetin handles cellular oxidant/antioxidant systems and mitigates immunosenescence hallmarks in human PBMCs: An in vitro study. bioRxiv 2021, 16, 2021.10.23.465570.
- Cichocki, F.; Zhang, B.; Wu, C.Y.; Chiu, E.; Day, A.; O'Connor, R.S.; Yackoubov, D.; Simantov, R.; McKenna, D.H.; Cao, Q.; et al. Nicotinamide enhances natural killer cell function and yields remissions in patients with non-Hodgkin lymphoma. Sci. Transl. Med. 2023, 15(705), eade3341. [CrossRef]
- Okabe, K.; Yaku, K.; Uchida, Y.; Fukamizu, Y.; Sato, T.; Sakurai, T.; Tobe, K.; Nakagawa, T. Oral Administration of Nicotinamide Mononucleotide Is Safe and Efficiently Increases Blood Nicotinamide Adenine Dinucleotide Levels in Healthy Subjects. Front. Nutr. 2022, 9, 868640. [CrossRef]
- Takeda, K.; Okumura, K. Nicotinamide mononucleotide augments the cytotoxic activity of natural killer cells in young and elderly mice. Biomed. Res. 2021, 42(5), 173-179. [CrossRef]
- Mills, K.F.; Yoshida, S.; Stein, L.R.; Grozio, A.; Kubota, S.; Sasaki, Y.; Redpath, P.; Migaud, M.E.; Apte, R.S.; Uchida, K.; et al. Long-Term Administration of Nicotinamide Mononucleotide Mitigates Age-Associated Physiological Decline in Mice. Cell Metab. 2016, 24(6), 795-806. [CrossRef]
- Ghosh, S.; Iacucci, M. Diverse Immune Effects of Bovine Colostrum and Benefits in Human Health and Disease. Nutrients 2021, 13(11), 3798. [CrossRef]
- Vetvicka, V.; Fernandez-Botran, R. Non-specific immunostimulatory effects of transfer factor. Int. Clin. Pathol. J. 2020, 8, 1-6.
- Vetvicka, V.; Vetvickova J. Antigen-Specific Immunomodulatory Effects of Transfer Factor. Austin. J. Clin. Pathol. 2020, 7, 1062.
- Vetvicka, V.; Vetvickova J. Effects of Transfer Factor Supplementation on Immune Reactions in Mice. J. Nutr. Health Sci. 2019, 6, 301.
- Han, X.; Vollmer, D.; Enioutina, E.Y. Immunomodulatory Effects of Modified Bovine Colostrum, Whey, and Their Combination with Other Natural Products: Effects on Human Peripheral Blood Mononuclear Cells. Curr. Ther. Res. Clin. Exp. 2023, 99, 100720.
- Kandarian, F.; Sunga, G.M.; Arango-Saenz, D.; Rossetti, M.A. Flow Cytometry-Based Cytotoxicity Assay for the Assessment of Human NK Cell Activity. J. Vis. Exp. 2017, 126, 56191.
- Lecoeur, H.; Fevrier, M.; Garcia, S.; Riviere, Y.; Gougeon, M.L. A novel flow cytometric assay for quantitation and multiparametric characterization of cell-mediated cytotoxicity. J. Immunol. Methods 2001, 253(1-2), 177–187. [CrossRef]
- Krzewski, K.; Gil-Krzewska, A.; Nguyen, V.; Peruzzi, G.; Coligan, J.E. LAMP1/CD107a is required for efficient perforin delivery to lytic granules and NK-cell cytotoxicity. Blood 2013, 121, 4672–4683.
- Savoy, S.K.A.; Boudreau, J.E. The evolutionary arms race between virus and NK cells: diversity enables population-level virus control. Viruses 2019, 11, 959. [CrossRef]
- Wu, S.Y.; Fu, T.; Jiang, Y.Z.; Shao, Z.M. Natural killer cells in cancer biology and therapy. Mol. Cancer 2020, 19, 120. [CrossRef]
- Liu, M.; Liang, S.; Zhang, C. NK cells in autoimmune diseases: protective or pathogenic? Front. Immunol. 2021, 12, 624687.
- Kucuksezer, U.C.; Aktas, Cetin, E.; Esen, F.; Tahrali, I.; Akdeniz, N.; Gelmez, M.Y.; Deniz, G. The Role of Natural Killer Cells in Autoimmune Diseases. Front. Immunol. 2021, 12, 622306.
- Li, Y.; Wang, F.; Imani, S.; Tao, L.; Deng, Y.; Cai, Y. Natural killer cells: friend or foe in metabolic diseases? Front. Immunol. 2021, 12, 614429. [CrossRef]
- Segerberg, F.; Lundtoft, C.; Reid, S.; Hjorton, K.; Leonard, D.; Nordmark, G.; Carlsten, M.; Hagberg, N. Autoantibodies to Killer Cell Immunoglobulin-Like Receptors in Patients With Systemic Lupus Erythematosus Induce Natural Killer Cell Hyporesponsiveness. Front. Immunol. 2019, 10, 2164. [CrossRef]
- Berhani, O.; Glasner, A.; Kahlon, S.; Duev-Cohen, A.; Yamin, R.; Horwitz, E.; Enk, J.; Moshel, O.; Varvak, A.; Porgador, A.; et al. Human anti-NKp46 antibody for studies of NKp46-dependent NK cell function and its applications for type 1 diabetes and cancer research. Eur. J. Immunol. 2019, 49(2), 228-241. [CrossRef]
- Hudspeth, K.; Pontarini, E.; Tentorio, P.; Cimino, M.; Donadon, M.; Torzilli, G.; Lugli, E.; Della, Bella, S.; Gershwin, M.E.; Mavilio, D. The role of natural killer cells in autoimmune liver disease: a comprehensive review. J. Autoimmun. 2013, 46, 55-65. [CrossRef]
- Björkström, N.K.; Ljunggren, H.G.; Michaëlsson, J. Emerging insights into natural killer cells in human peripheral tissues. Nat. Rev. Immunol. 2016, 16, 310–320. [CrossRef]
- Chiossone, L.; Dumas, P.Y.; Vienne, M.; Vivier, E. Natural killer cells and other innate lymphoid cells in cancer. Nat. Rev. Immunol. 2018, 18, 671–688. [CrossRef]
- Shafer, D.; Smith, M.R.; Borghaei, H.; Millenson, M.M.; Li, T.; Litwin, S.; et al. Anad, R.; Al-Saleem, T. Low NK cell counts in peripheral blood are associated with inferior overall survival in patients with follicular lymphoma. Leuk. Res. 2013, 37(10), 1213-1215. [CrossRef]
- Seymour, F.; Cavenagh, J.D.; Mathews, J.; Gribben, J.G. NK cells CD56bright and CD56dim subset cytokine loss and exhaustion is associated with impaired survival in myeloma. Blood Adv. 2022, 6, 5152–5159. [CrossRef]
- Nersesian, S.; Schwartz, S.L.; Grantham, S.R.; MacLean, L.K.; Lee, S.N.; Pugh-Toole, M.; Boudreau, J.E. NK cell infiltration is associated with improved overall survival in solid cancers: A systematic review and meta-analysis. Transl. Oncol. 2021, 14(1), 100930. [CrossRef]
- Ichise, H.; Tsukamoto, S.; Hirashima, T.; Konishi, Y.; Oki, C.; Tsukiji, S.; Iwano, S.; Miyawaki, A.; Sumiyama, K.; Terai, K.; Matsuda, M. Functional visualization of NK cell-mediated killing of metastatic single tumor cells. Elife 2022, 11, e76269. [CrossRef]
- Vyas, M.; Requesens, M.; Nguyen, T.H.; Peigney, D.; Azin, M.; Demehri, S. Natural killer cells suppress cancer metastasis by eliminating circulating cancer cells. Front. Immunol. 2023, 13, 1098445. [CrossRef]
- West, W.H.; Cannon, G.B.; Kay, H.D.; Bonnard, G.D.; Herberman, R.B. Natural cytotoxic reactivity of human lymphocytes against a myeloid cell line: characterization of effector cells. J. Immunol. 1977, 118(1), 355–361. [CrossRef]
- Melaiu, O., Lucarini, V., Cifaldi, L.; Fruci, D. Influence of the tumor microenvironment on NK cell function in solid tumors. Front. Immunol. 2019, 10, 3038. [CrossRef]
- Hu, Z., Xu, X.; Wei, H. The adverse impact of tumor microenvironment on NK-Cell. Front. Immunol. 2021, 12, 633361. [CrossRef]
- Alter, G.; Malenfant, J.M.; Altfeld, M. CD107a as a functional marker for the identification of natural killer cell activity. J. Immunol. Methods. 2004, 294, 15–22. [CrossRef]
- Zhang, J.; Wang, Y.; Wu, L.; Wang, J.; Tang, R.; Li, S.; Chen, J.; Gao, Z.; Pei, R.; Wang, Z. Application of an improved flow cytometry-based NK cell activity assay in adult hemophagocytic lymphohistiocytosis. Int. J. Hematol. 2017, 105(6), 828-834. [CrossRef]
- Lee, H.; Kim, H.S.; Lee, J.M.; Park, K.H.; Choi, A.R.; Yoon, J.H.; Ryu, H.; Oh, E.J.; Natural Killer Cell Function Tests by Flowcytometry-Based Cytotoxicity and IFN-γ Production for the Diagnosis of Adult Hemophagocytic Lymphohistiocytosis. Int. J. Mol. Sci. 2019, 20(21), 5413. [CrossRef]
- Kim, J.; Phan, M.T.; Kweon, S.; Yu, H.; Park, J.; Kim, K.H.; Hwang, I.; Han, S.; Kwon, M.J.; Cho, D. A Flow Cytometry-Based Whole Blood Natural Killer Cell Cytotoxicity Assay Using Overnight Cytokine Activation. Front. Immunol. 2020, 11, 1851. [CrossRef]
- Aktas, E.; Kucuksezer, U.C.; Bilgic, S.; Erten, G.; Deniz, G. Relationship between CD107a expression and cytotoxic activity. Cell. Immunol. 2009, 254(2), 149-154. [CrossRef]
- Cohnen, A.; Chiang, S.C.; Stojanovic, A.; Schmidt, H.; Claus, M.; Saftig, P.; Janßen, O.; Cerwenka, A.; Bryceson, Y.T.; Watzl, C. Surface CD107a/LAMP-1 protects natural killer cells from degranulation-associated damage. Blood 2013, 122(8), 1411-1418. [CrossRef]
- Kim, S.; Poursine-Laurent, J.; Truscott, S.M.; Lybarger, L.; Song, Y.J.; Yang, L.; French, A.R.; Sunwoo, J.B.; Lemieux, S.; Hansen, T.H.; et al. Licensing of natural killer cells by host major histocompatibility complex class I molecules. Nature 2005, 436, 709–713. [CrossRef]
- Lanier, L.L. Up on the tightrope: Natural killer cell activation and inhibition. Nat. Immunol. 2008, 9, 495–502. [CrossRef]
- Cuturi, M.C.; Anegón, I.; Sherman, F.; Loudon, R.; Clark, S.C.; Perussia, B.; Trinchieri, G. Production of hematopoietic colony-stimulating factors by human natural killer cells. J. Exp. Med. 1989, 169(2), 569-583. [CrossRef]
- Smyth, M.J.; Zachariae, C.O.; Norihisa, Y.; Ortaldo, J.R.; Hishinuma, A.; Matsushima, K. IL-8 gene expression and production in human peripheral blood lymphocyte subsets. J. Immunol. 1991, 146(11), 3815-3823. [CrossRef]
- Warren, H.S.; Kinnear, B.F.; Phillips, J.H.; Lanier, L.L. Production of IL-5 by human NK cells and regulation of IL-5 secretion by IL-4, IL-10, and IL-12. J. Immunol. 1995, 154(10), 5144-5152. [CrossRef]
- Bluman, E.M.; Bartynski, K.J.; Avalos, B.R.; Caligiuri, M.A. Human natural killer cells produce abundant macrophage inflammatory protein-1 alpha in response to monocyte-derived cytokines. J. Clin. Invest. 1996, 97(12), 2722-2727. [CrossRef]
- Oliva, A.; Kinter, A.L.; Vaccarezza, M.; Rubbert, A.; Catanzaro, A.; Moir, S.; Monaco, J.; Ehler, L.; Mizell, S.; Jackson, R.; et al. Natural killer cells from human immunodeficiency virus (HIV)-infected individuals are an important source of CC-chemokines and suppress HIV-1 entry and replication in vitro. J. Clin. Invest. 1998, 102(1), 223-231. [CrossRef]
- Fehniger, T.A.; Shah, M.H.; Turner, M.J.; VanDeusen, J.B.; Whitman, S.P.; Cooper, M.A.; Suzuki, K.; Wechser, M.; Goodsaid, F.; Caligiuri, M.A. Differential cytokine and chemokine gene expression by human NK cells following activation with IL-18 or IL-15 in combination with IL-12: implications for the innate immune response. J. Immunol. 1999, 162(8), 4511-4520. [CrossRef]
- Roda, J.M.; Parihar, R.; Magro, C.; Nuovo, G.J.; Tridandapani, S.; Carson, W.E. 3rd. Natural killer cells produce T cell-recruiting chemokines in response to antibody-coated tumor cells. Cancer Res. 2006, 66(1), 517-526. [CrossRef]
- Mannino, M.H.; Zhu, Z.; Xiao, H.; Bai, Q.; Wakefield, M.R.; Fang, Y. The paradoxical role of IL-10 in immunity and cancer. Cancer Lett. 2015, 367, 103–107. [CrossRef]
- Konjević, G.M.; Vuletić, A.M.; Mirjačić, Martinović, K.M.; Larsen, A.K.; Jurišić, V.B. The role of cytokines in the regulation of NK cells in the tumor environment. Cytokine 2019, 117, 30–40.
- Shibata, Y.; Foster, L.A.; Kurimoto, M.; Okamura, H.; Nakamura, R.M.; Kawajiri, K.; Justice, J.P.; Van, Scott, M.R.; Myrvik, Q.N.; Metzger, W.J. Immunoregulatory roles of IL-10 in innate immunity: IL-10 inhibits macrophage production of IFN-gamma-inducing factors but enhances NK cell production of IFN-gamma. J. Immunol. 1998, 161(8), 4283-4288.
- Park, J.Y., Lee, S.H.; Yoon, S-R.; Park, Y-J.; Jung, H.; Kim, T-D.; Choi, I. IL-15-induced IL-10 increases the cytolytic activity of human natural killer cells. Mol. Cells. 2011, 32(3), 265-272. [CrossRef]
- Tahtinen, S.; Tong, A.J.; Himmels, P.; Oh, J.; Paler-Martinez, A.; Kim, L.; Wichner, S.; Oei, Y.; McCarron, M.J.; Freund, E.C.; et al. IL-1 and IL-1ra are key regulators of the inflammatory response to RNA vaccines. Nat. Immunol. 2022, 23(4), 532-542.
- Jedema, I.; van der Werff, N.M.; Barge, R.M.; Willemze, R.; Falkenburg, J.H. New CFSE-based assay to determine susceptibility to lysis by cytotoxic T cells of leukemic precursor cells within a heterogeneous target cell population. Blood 2004, 103(7), 2677–2682. [CrossRef]
- Claus, M.; Greil, J.; Watzl, C. Comprehensive analysis of NK cell function in whole blood samples. J. Immunol. Methods 2009, 341, 154–164. [CrossRef]
Figure 1.
Assessment of K562 lysis in PBMC/K562 cultures. K562 target cells were selected from PMBC/K562 cultures based on the CFSE-induced intensity, which was examined on the FL1 channel (FITC-A). These cells were gated in the R2 region, as shown in the blue in the multi-color plots. The PBMCs exhibiting low intensity of CFSE stain are shown in red color. Next, the histograms were generated for the R2 region to examine the intensity of propidium iodide staining, which was assayed on the FL2 channel (PE-A) and used as a marker of cell lysis (shown in percentages on the upper right corner of each histogram). K562 cells cultured alone were used as a negative control (A), whereas K562 cells exposed to Tween-20 served as a positive control of cell lysis, which was detected by FACs staining due to increased uptake of propidium iodide (B). Effector (E) PBMCs were cultured with K562 target (T) cells were co-cultured at different E:T ratios (e.g., 50:1; 25:1; 12:1; 6:1) (C-F) to illustrate dose-dependent cytotoxicity of PBMCs against K562 tumor cells.
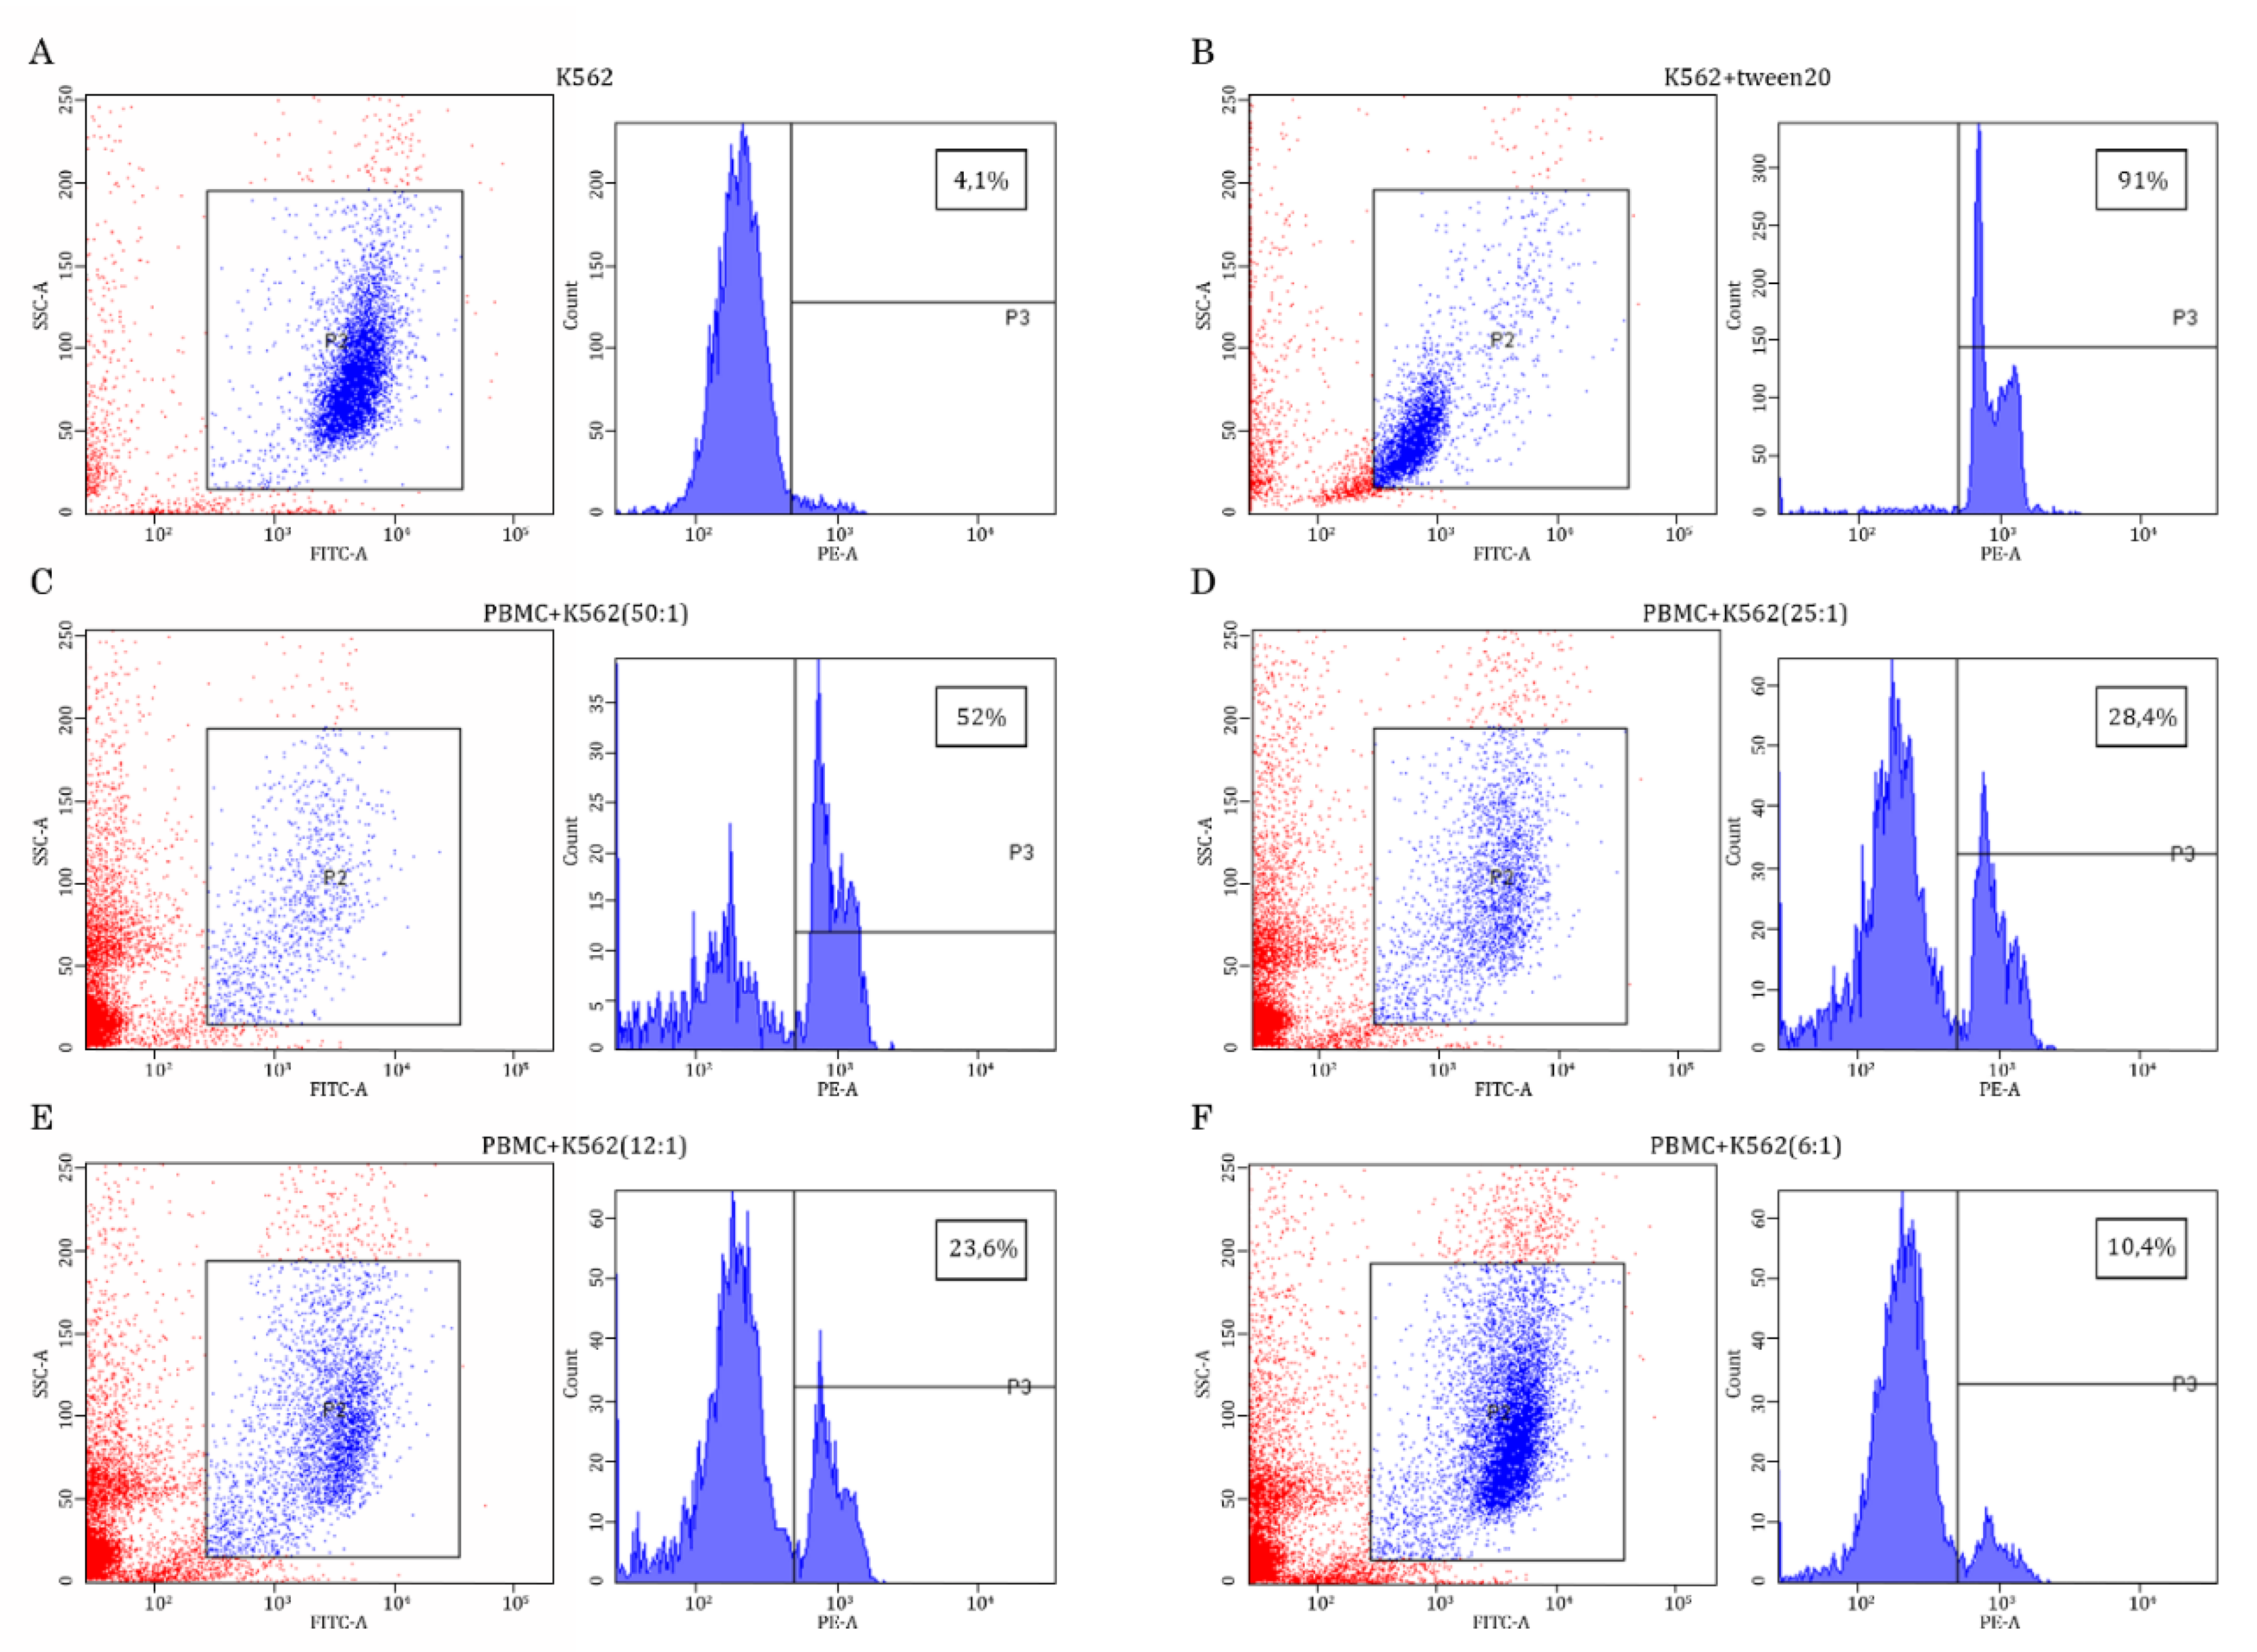
Figure 2.
AgePro increases the NK-mediated lysis of K562 target tumor cells. Representative histograms illustrating the intensity of propidium iodide (PI)-based fluorescence of K562 target cells cultured alone (negative control) (A), in the presence of Tween-20 (B) (positive control), or the presence of PBMCs used at the different ratios with K562 cells (C-F). The histogram contains the samples before and after taking AgePro for 30 days. The increased PI-based fluorescence was used as a marker of lysis of K562 cells calculated in %, as shown in the quadrants on the upper right corner of each histogram.
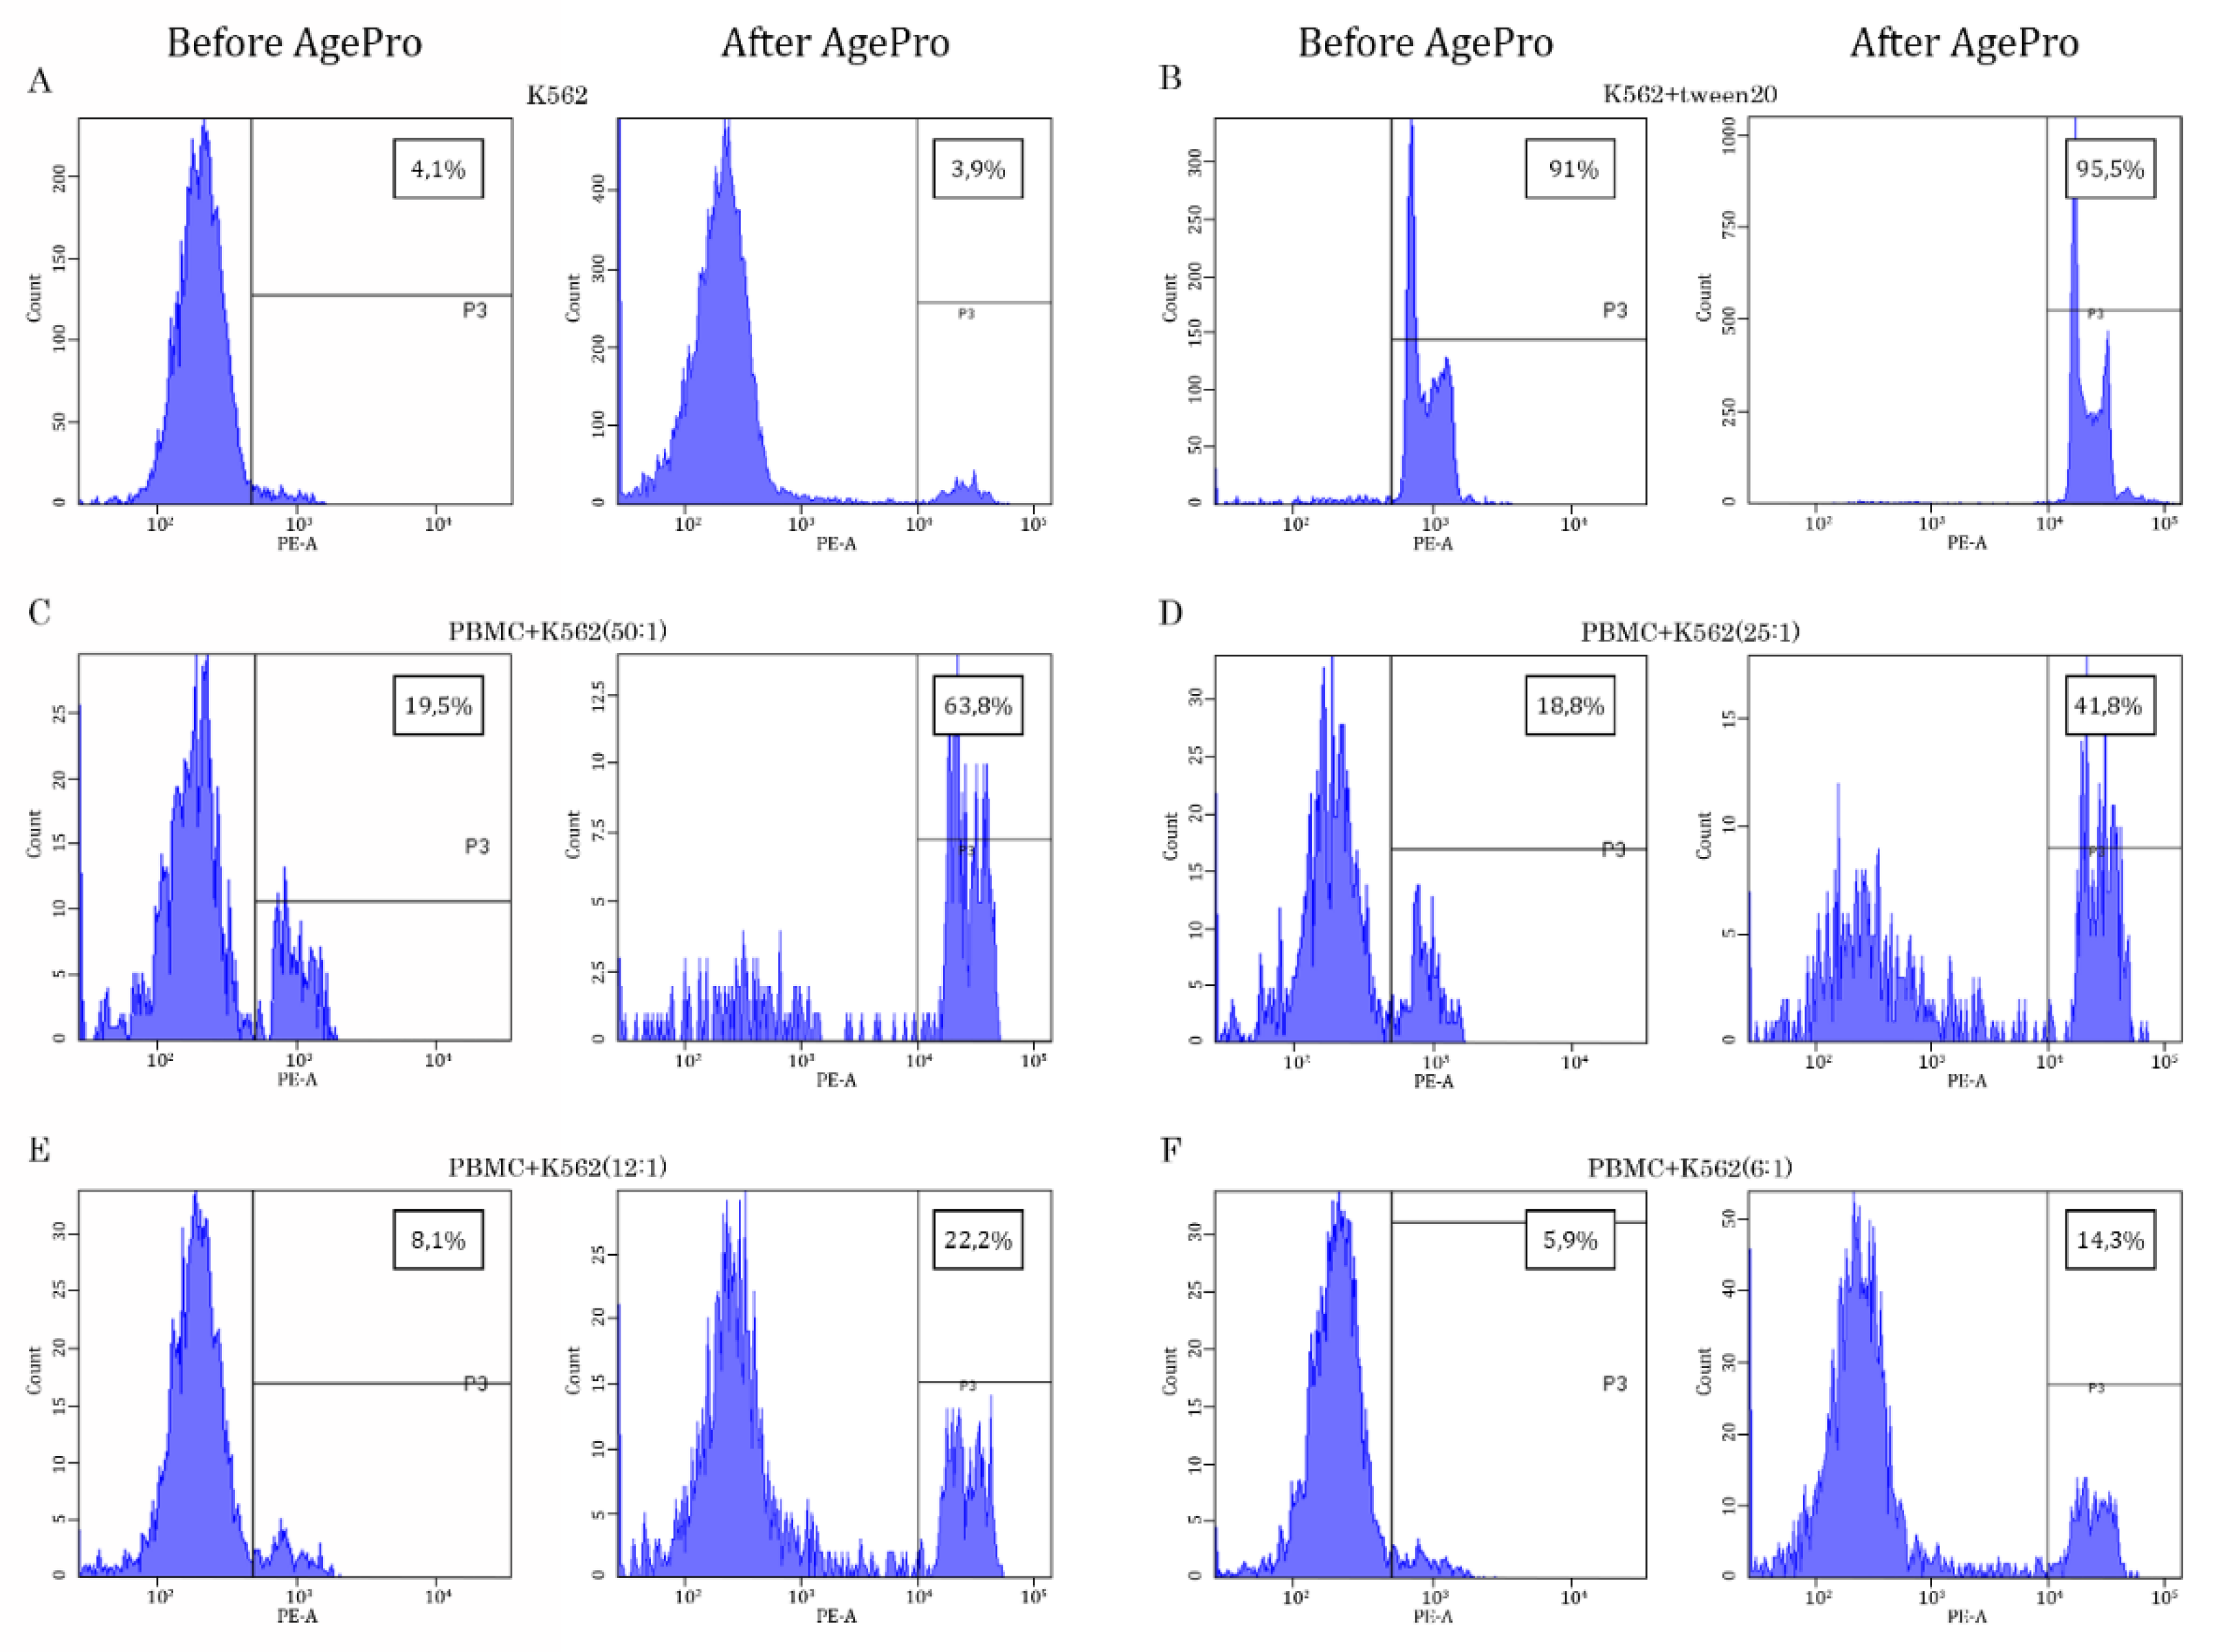
Figure 3.
Ratio-dependent cytotoxicity of PBMCs effector (E) cells against K562 target (T) cells. (A) PBMC-mediated cytotoxicity against CFSE-labeled K562 tumor cells was assessed at various E:T ratios (50:1, 25:1, 12:1, and 6:1) and determined by FACs staining. (B) Boxplots represent the cytotoxicity of PBMC cells against K562 cancer cells cultured at various E:T ratios (50:1, 25:1, 12:1, and 6:1). Number of participants (n=17). Statistical significance between 2 samples (day 1/day 30) was determined by paired Student’s t-test (in the case of normally distributed data) or Wilcoxon signed-rank test (in the case of not normally distributed data). All data are shown as mean±SD (A) and median (quant 25 - quant 75) (B). *P<0.05, **P<0.01, ***P<0.0001.To further corroborate these findings and illustrate whether the efficacy of AgePro does not depend on the age of the participants, they were divided into two groups based on the increased value of K562 cell killing after taking AgePro (i.e., enhancement of K562 cell lysis for less or more than 20%, respectively). Using Fisher's exact two-sided test, we found similar efficacy of NK-based killing of K562 for both groups. Again, this was shown for all E:T ratios utilized in this study (p>0.05). Strikingly, the substantial improvement of NK cytotoxic activity was also detected for the participants with low basal (i.e., before AgePro) numbers of PBMC-mediated killing, thereby illustrating the potent immunomodulatory activity of this supplement.
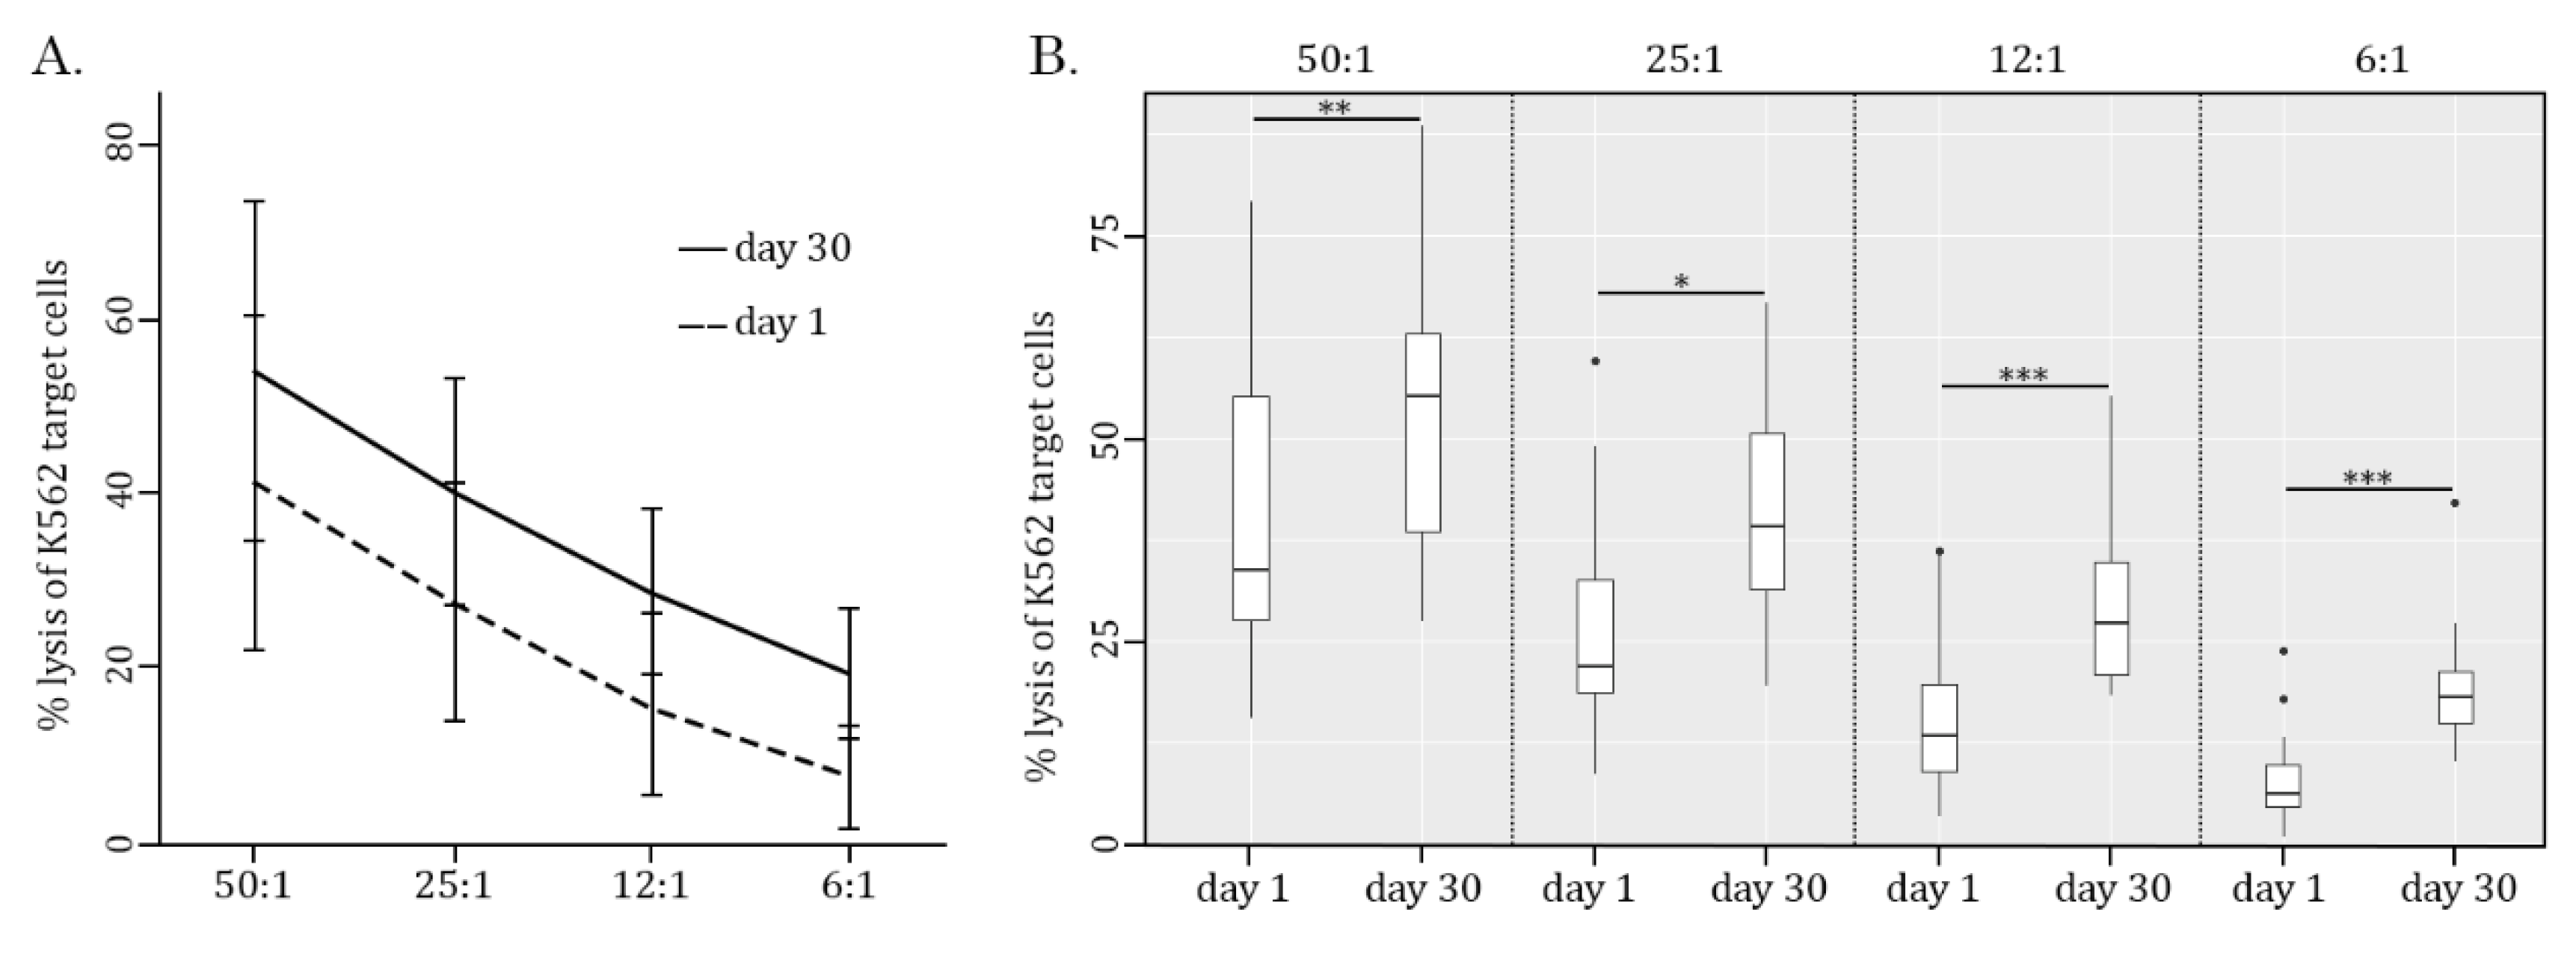
Figure 6.
The concentration of cytokines and chemokines (pg/ml) in the supernatants of PBMCs cultured alone (gray columns) and in the presence of K562 target cells (white columns) (ratio 50:1) before taking AgePro. (A) IL-1Rα, -1α, -1β, -2, -3, -4, -5, -6, -7, -8, -9, -10, -12p40, -12p70, -13, -15, -17α, INF-2α, INF-γ, TNF-α, TNF-β, TGF-α, G-CSF, and GM-CSF; (B) EGF, eotaxin, FGF-2, FLT-3l, fractalkine, GRO, IP-10, MCP-1, MCP-3, MDC, MIP-1α, MIP-1β, PDGF-AA, PDGF-AA/AB, RANTES, VEGF, and sCD40L. *P<0.05, **P<0.01.
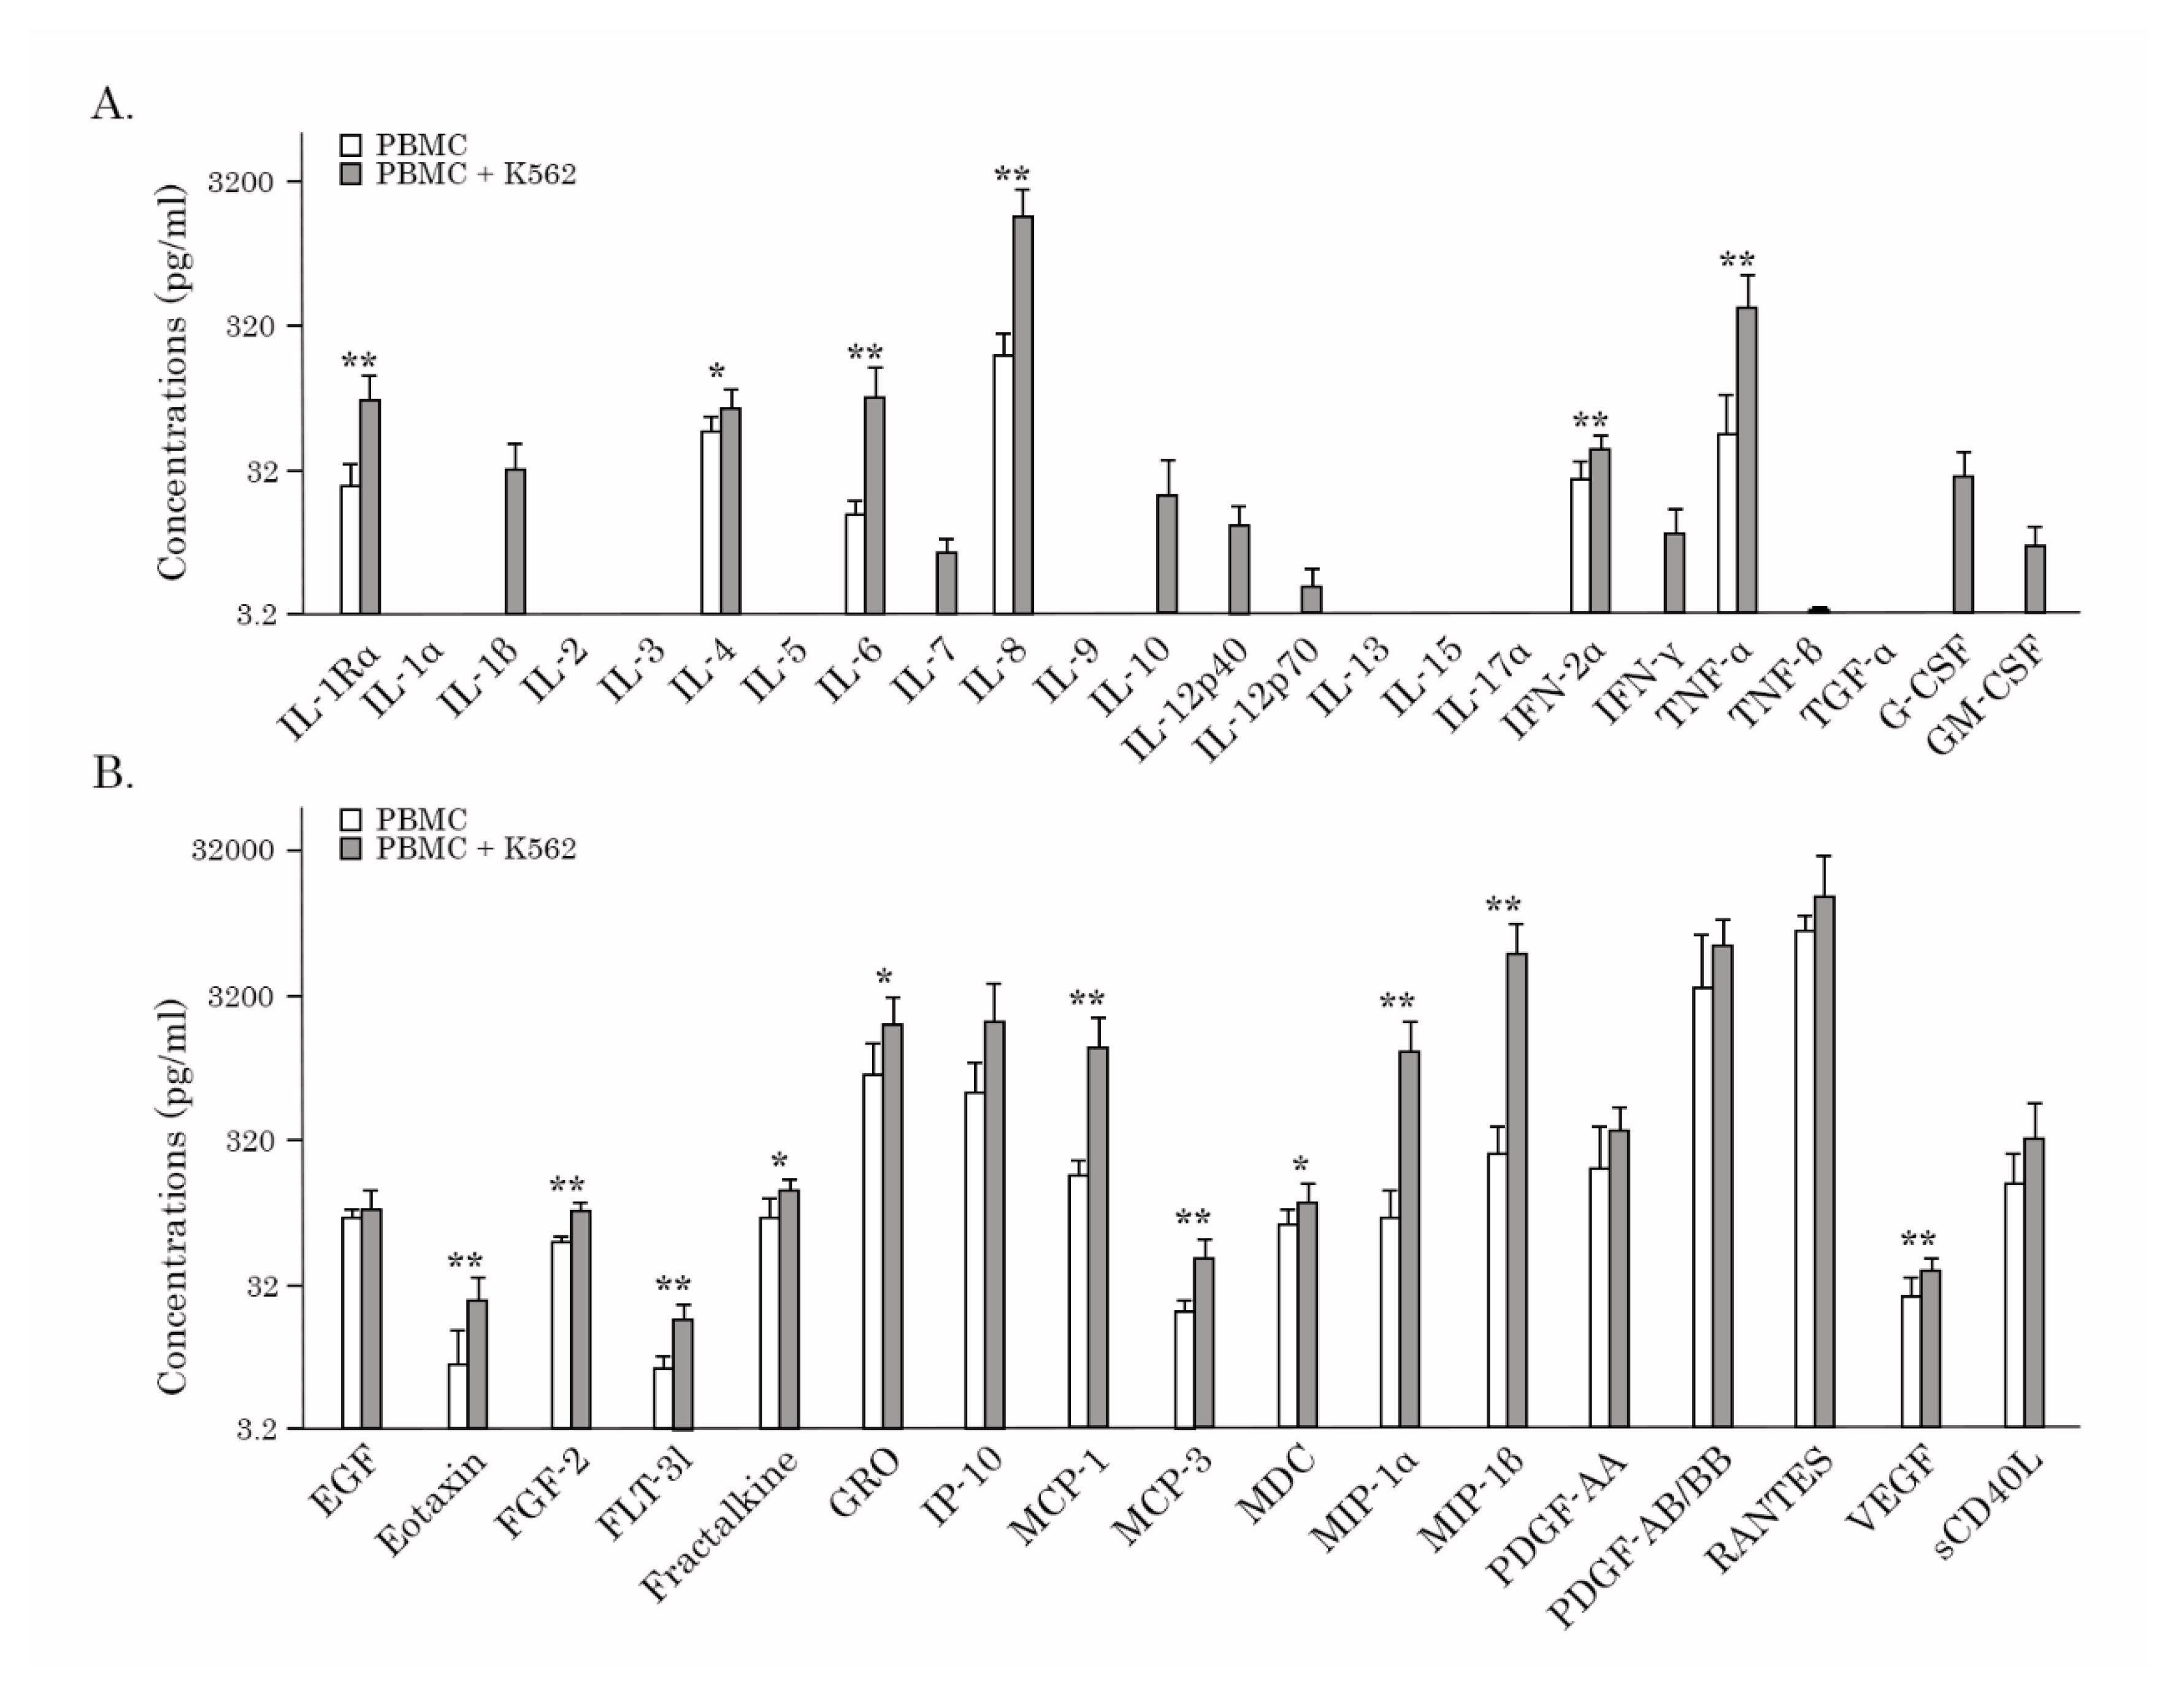
Figure 7.
Changes in cytokine/chemokines levels in PBMC/K562 supernatants before (Day 1) and after taking AgePro (Day 30). Boxplots illustrate concentrations of cytokines/chemokines, as shown in pg/ml. (A) IL-8, MCP-1, MIP-1α, TNF-α, IL-6, MCP-3, IL-1Rα, and IL-10 are exhibiting >100% increase after taking AgePro; (B) IL-1β, IL-12p40, PDGF-AA, and GRO are exhibiting >50% increase after taking AgePro; (C) IL-4, EGF, FGF-2, MDC, IL-7, IL-12p70, TNF-β, GM-CSF, G-CSF, VEGF, eotaxin, INF-γ, sCD40L, and PDGF-AA/AB are exhibiting <50% increase after taking AgePro. Statistical significance between 2 samples (day 1/day 30) was determined by paired Student’s t-test (in the case of normally distributed data) or Wilcoxon signed-rank (in the case of not normally distributed data). All data are shown as median (quant 25 - quant 75). *P<0.05; **P<0.01; ***P<0.001; ns, non significant.
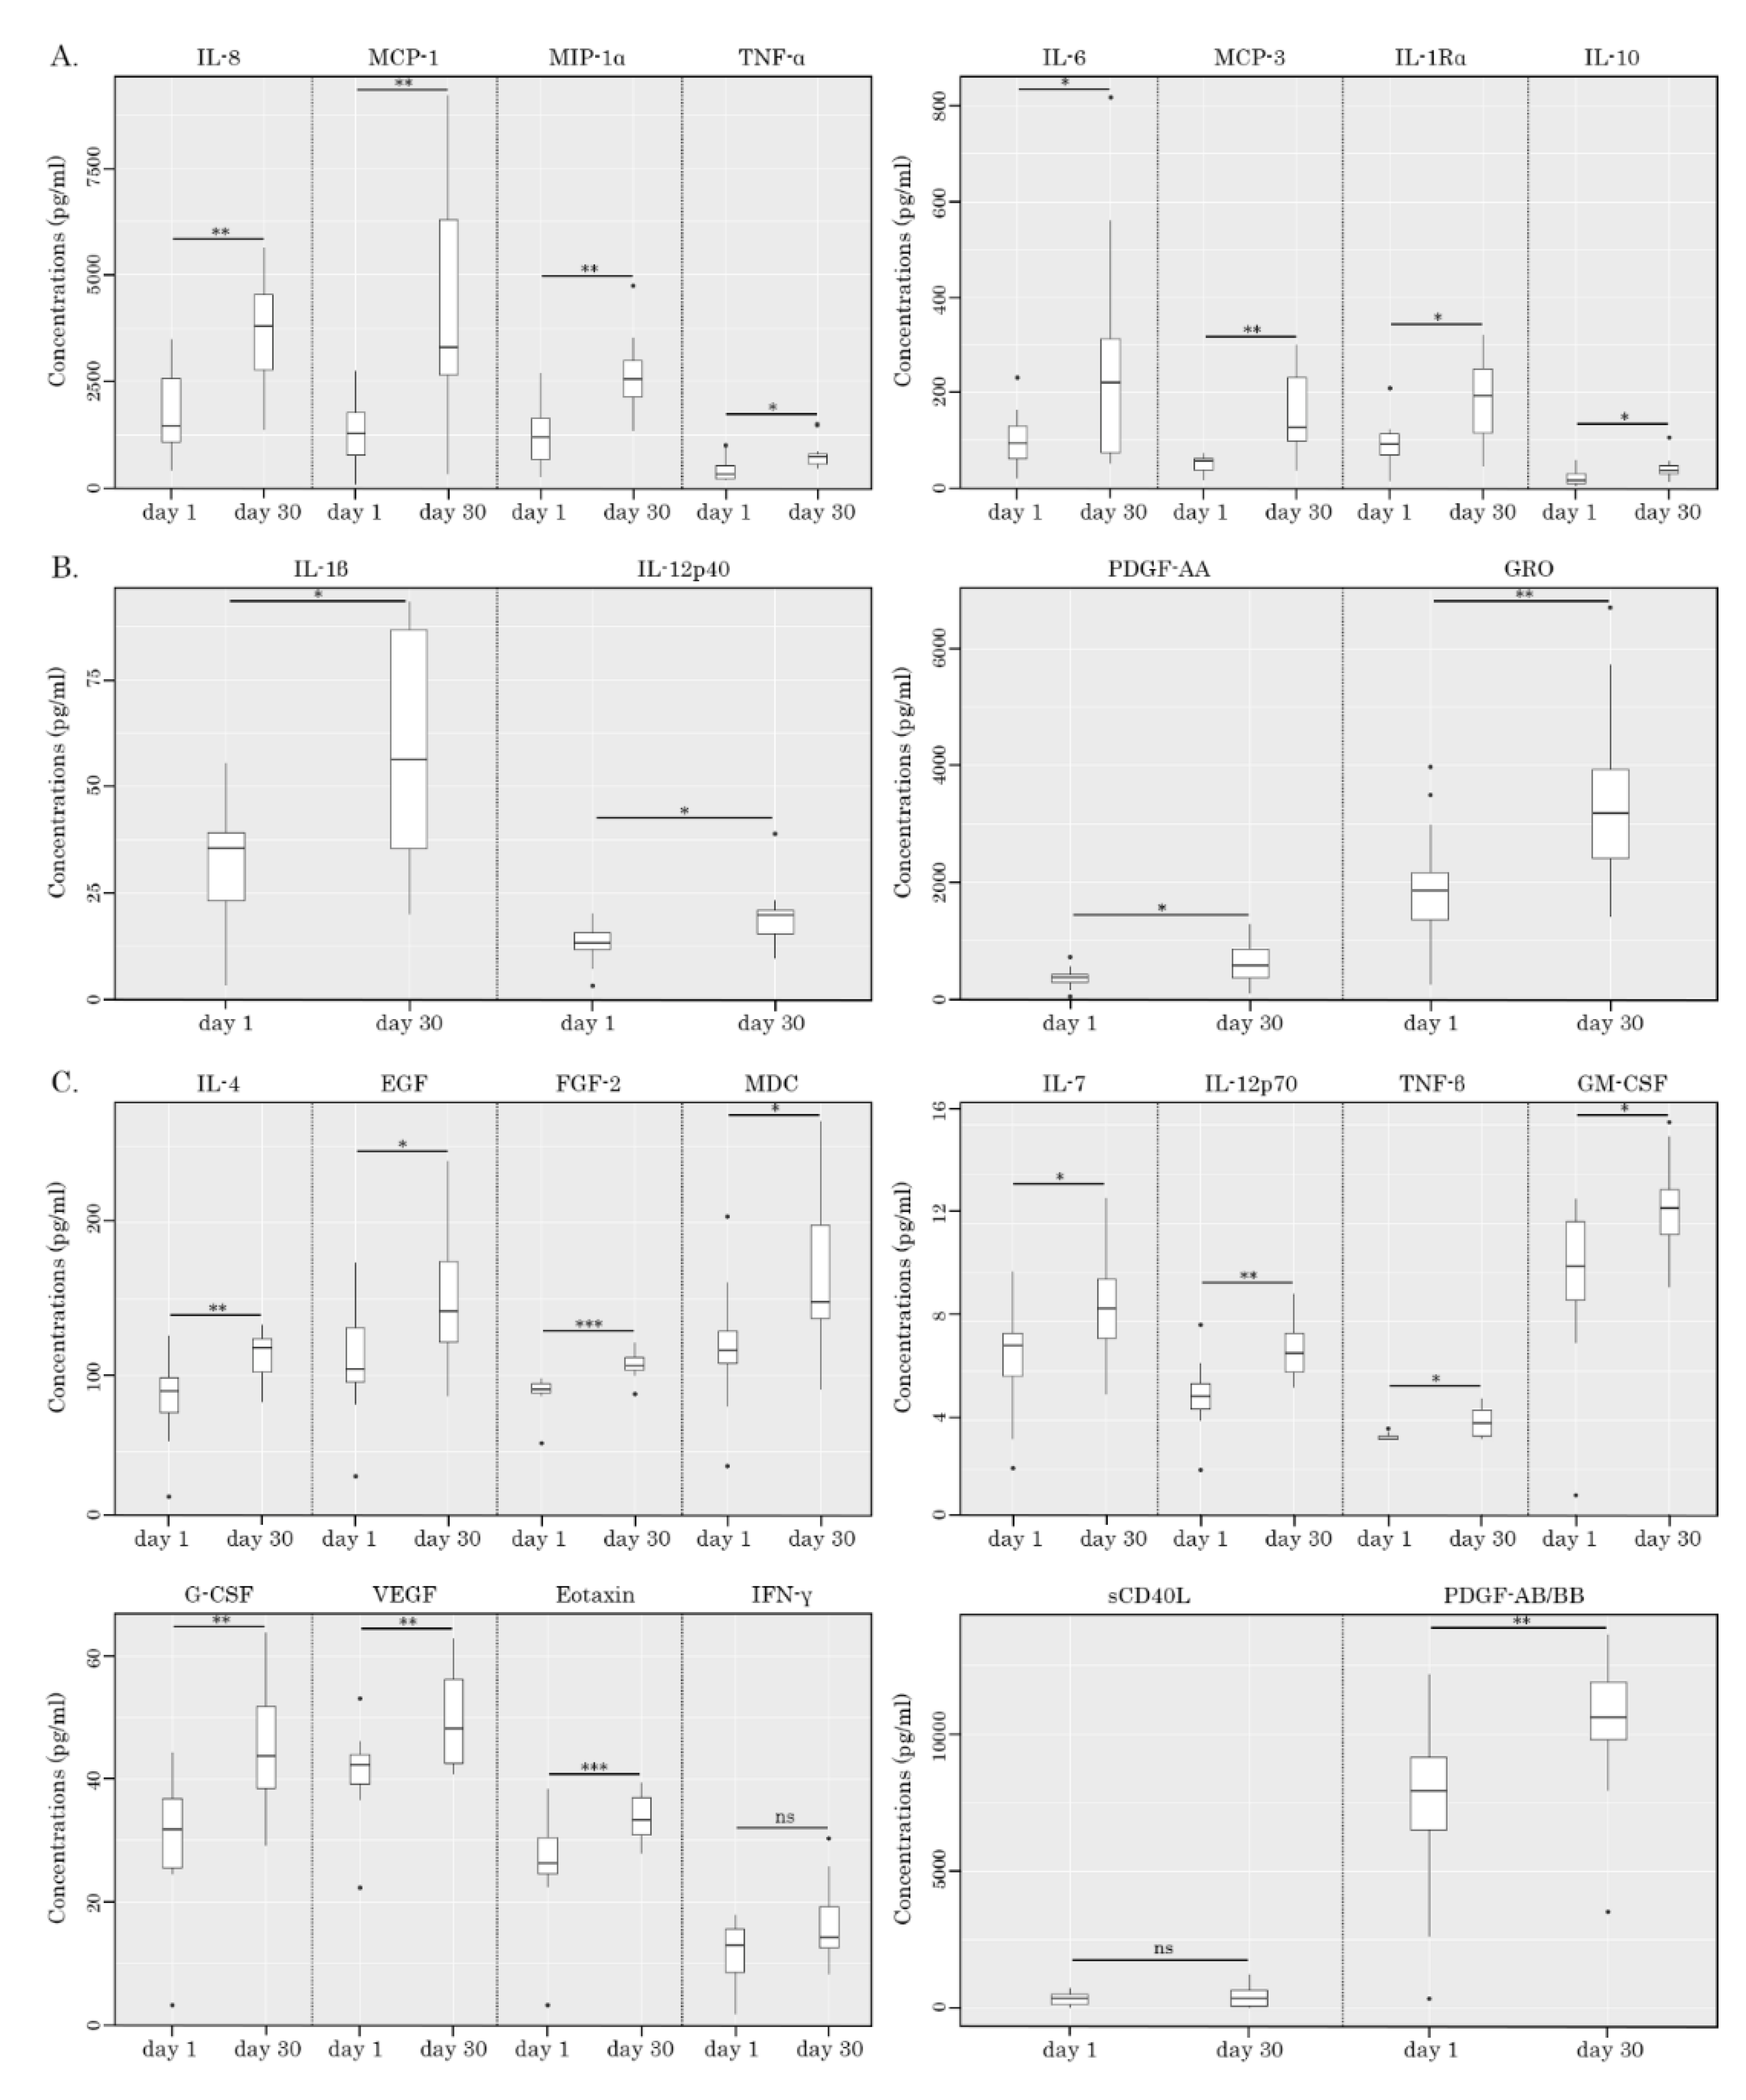
Figure 8.
The significance of the relationship between cytokine/chemokines production (< 50% and > 50% Inc after taking AgePro) and NK-based cytotoxic activity was assessed by a two-tailed Fisher's exact test. Comparison of two independent groups: group 1 with RR < 20% and group 2 with RR > 20%. * - the significance between aforementioned parameters was found (p < 0.05); ns - relationship was not significant.
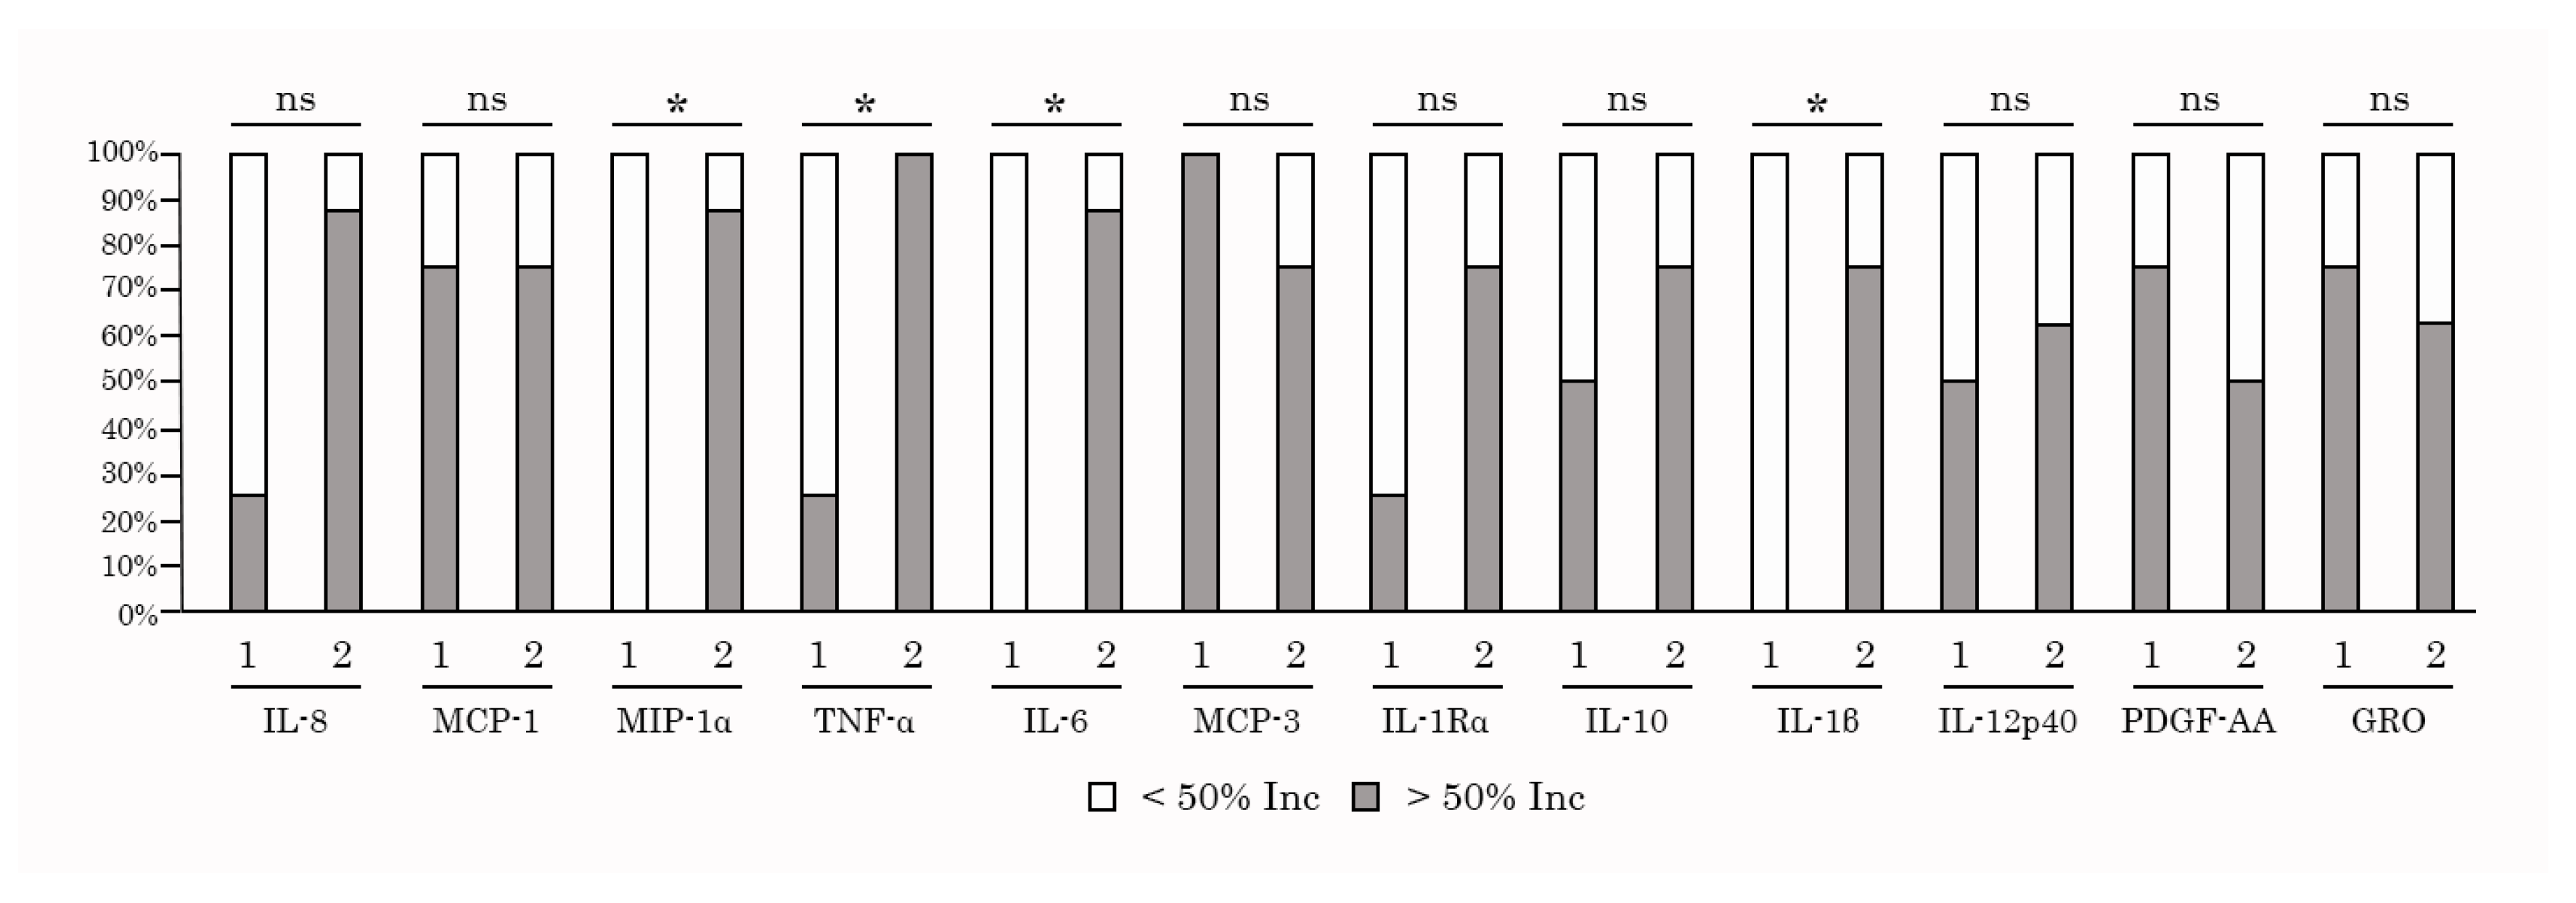

Table 1.
The killing of K562 target (T) cells by PBMC effector (E) cells was calculated for different E:T ratios before (Day 1) and after taking AgePro (Day 30). .
Table 1.
The killing of K562 target (T) cells by PBMC effector (E) cells was calculated for different E:T ratios before (Day 1) and after taking AgePro (Day 30). .
| Criteria | Avg Age | Day 1 | Day 30 | % Inc | p | r | |
| E:T ratio 50:1 | All | 45.9±18.0 | 41.1±19.1 | 54±19.3 | 31% | 0.0008 | |
| Age <=35 | 32±3.6 | 42.7±17.5 | 55.3±19.3 | 30% | 0.03 | ||
| Age >=50 | 61.5±14.2 | 39.3±21.8 | 52.5±20.5 | 34% | 0.02 | ||
| E:T ratio 25:1 | All | 45.9±18.0 | 21.9(18.7-32.7) | 39.2(31.5-50.5) | 79% | 0.03 | 0.46 |
| Age <=35 | 32±3.6 | 21.9(20.2-30.1) | 40.1(30.1-50.9) | 83% | 0.008 | 0.47 | |
| Age >=50 | 61.5±14.2 | 28.6±17.4 | 39.0±9.81 | 36% | 0.08 ns | ||
| E:T ratio 12:1 | All | 45.9±18.0 | 13.3(8.9-19.7) | 27.3(20.9-34.7) | 105% | 0.00002 | 0.58 |
| Age <=35 | 32±3.6 | 13.3(10.9-18.5) | 27.3(23.2-33.0) | 105% | 0.004 | 0.68 | |
| Age >=50 | 61.5±14.2 | 15.6±12.6 | 27.3±8.15 | 75% | 0.0009 | ||
|
E:T ratio 6:1 |
All | 45.9±18.0 | 6.2(4.6-9.7) | 18.1(15-21.3) | 192% | 0.00008 | 0.72 |
| Age <=35 | 32±3.6 | 6.2(4.6-8.7) | 19.3(15.9-24.7) | 211% | 0.004 | 0.84 | |
| Age >=50 | 61.5±14.2 | 7.6(2.0-14.3) | 17.3(13.6-18.9) | 128% | 0.04 | 0.45 | |
The Shapiro–Wilk test was used to assess the normality in the sample distribution. Normally distributed data is presented as mean ± standard deviation, whereas data not normally distributed is presented as median (quant 25; quant 75). р-value was used to calculate the differences between normally distributed samples by the parametric statistical method (paired Student’s test); r-value was used to interpret the value of the effect between samples that were not normally distributed. This was assessed using a nonparametric statistical method (Wilcoxon signed-rank test). r< 0.1 illustrates no effect / very small effect, r = 0.1 - small effect, r = 0.3 moderate effect, r = 0.5 - high effect. The differences were considered significant at p<0.05, ns - non significant.
Table 2.
Expression of CD107a, the degranulation marker, on PBMCs cultured alone (negative control), in the presence of IL-2 (positive control), K562 target cells, or a combination of IL-2 and K562 cells.
Table 2.
Expression of CD107a, the degranulation marker, on PBMCs cultured alone (negative control), in the presence of IL-2 (positive control), K562 target cells, or a combination of IL-2 and K562 cells.
| CD107a expression | PBMC | PBMC+IL-2 | PBMC+K562 | PBMC+K562+IL-2 |
|---|---|---|---|---|
| Mean | 3.09 | 4.34 | 6.77 | 6.80 |
| Standard deviation | 0.91 | 1.42 | 2.08 | 2.08 |
| % increased relative to PBMC | - | 41 % | 120 % | 120 % |
| P | - | 0.13 | 0.007 | 0.02 |
Statistical significance between the experimental groups was determined by one-way analysis of variance (ANOVA). To determine the increase of CD107a-positive cells (in %) in the aforementioned experimental groups when compared to PBMCs alone (i.e., negative control), Benjamini–Hochberg (BH) correction was used. The differences were considered significant at p<0.05.
Table 3.
The levels of cytokines/chemokines (pg/ml) in supernatants of PBMCs cultured with K562 cells before (Day 1) and after taking AgePro (Day 30).
Table 3.
The levels of cytokines/chemokines (pg/ml) in supernatants of PBMCs cultured with K562 cells before (Day 1) and after taking AgePro (Day 30).
| Cytokine | Day 1 | Day 30 | % Inc | p | r |
|---|---|---|---|---|---|
| IL-1β | 32.8±15.6 | 56.9±27.4 | 74% | 0.044 | |
| IL-1Rα | 77.9±52.0 | 199±93.7 | 156% | 0.0025 | |
| IL-4 | 89.4(75.2-98.0) | 118(102-124) | 32% | 0.0024 | 0.54 |
| IL-6 | 92.7(61.4-128) | 220(74.1-313) | 137% | 0.027 | 0.4 |
| IL-7 | 6.45±2.23 | 8.61±2.12 | 34% | 0.032 | |
| IL-8 | 1766±1044 | 3645±1253 | 106% | 0.0024 | |
| IL-10 | 14.4(9.94-30.2) | 34.8(29.8-45.7) | 142% | 0.012 | 0.45 |
| IL-12p40 | 13.0±4.79 | 19.6±7.19 | 51% | 0.0296 | |
| IL-12p70 | 4.99±1.42 | 6.90±1.16 | 38% | 0.0066 | |
| IFN-γ | 11.5±5.34 | 16.3±6.41 | 41% | 0.054 ns | |
| TNF-α | 292(202-509) | 720(551-784) | 147% | 0.012 | 0.52 |
| TNF-β | 3.2(3.2-3.34) | 3.86(3.34-4.43) | 21% | 0.014 | 0.53 |
| G-CSF | 31.8(25.6-36.8) | 43.6(38.4-51.9) | 37% | 0.0068 | 0.59 |
| GM-CSF | 9.61±3.25 | 12.6±2.09 | 31% | 0.024 | |
| EGF | 109±36.2 | 150±43.5 | 38% | 0.011 | |
| FGF-2 | 90.4(88.1-94.0) | 106(103-112) | 17% | 0.00098 | 0.74 |
| PDGF-AA | 355(290-415) | 576(355-857) | 62% | 0.027 | 0.37 |
| PDGF-AB/BB | 7921(6514-9160) | 10588(9800-11888) | 34% | 0.0049 | 0.55 |
| VEGF | 41.1±7.2 | 49.6±7.66 | 21% | 0.0054 | |
| sCD40L | 335±230 | 412±400 | 23% | 0.48 ns | |
| GRO | 1946±1079 | 3418±1630 | 76% | 0.0075 | |
| MCP-1 | 1254(765-1766) | 3297(2647-6300) | 163% | 0.0068 | 0.61 |
| MIP-1α | 1301±862 | 2638±891 | 103% | 0.0041 | |
| MCP-3 | 55.7(37.0-60.9) | 126(97.8-232) | 126% | 0.0015 | 0.72 |
| Eotaxin | 26.2(24.5-30.5) | 33.3(30.9-36.9) | 27% | 0.00098 | 0.54 |
| MDC | 118±39.6 | 163±49.6 | 38% | 0.014 |
The Shapiro–Wilk test was used to assess the normality in the sample distribution. Normally distributed data is presented as mean ± standard deviation, whereas data not normally distributed is presented as median (quant 25; quant 75). р-value was used to calculate the differences between normally distributed samples by the parametric statistical method (paired Student’s test); r-value was used to interpret the value of the effect between samples that were not normally distributed. This was assessed using a nonparametric statistical method (Wilcoxon signed-rank test). r< 0.1 illustrates no effect / very small effect; r = 0.1 - small effect; r = 0.3 - moderate effect; r = 0.5 - high effect. The differences were considered significant at p<0.05, ns - non significant.
Table 4.
Spearman’s rank correlation between NK-based cytotoxicity and cytokine/chemokines production.
Table 4.
Spearman’s rank correlation between NK-based cytotoxicity and cytokine/chemokines production.
| Cytokine/chemokine | Spearman's rank correlation rho (r) | p |
|---|---|---|
| MIP-1a | 0.769697 | 0.014 * |
| TNF-alpha | 0.6969697 | 0.031 * |
| IL-6 | 0.7575758 | 0.016 * |
| IL-1beta | 0.4060606 | 0.247 ns |
Spearman's rank correlation was used to determine the relationship between two non-normally distributed variables. The correlation’s strength was interpreted according to r value: r value between 0 and 0.1 indicates no correlation, between 0.1 and 0.3 - low correlation, between 0.3 and 0.5 - moderate correlation, between 0.5 and 0.7 - potent correlation, r value between 0.7 and 1 indicates robust correlation. The differences were considered significant at p<0.05 (*), ns - relationship was not significant.
Table 5.
The numbers of CD56/107a-positive cells (in %) in PBMC cultured alone (control) or in the presence of K562 target cells.
Table 5.
The numbers of CD56/107a-positive cells (in %) in PBMC cultured alone (control) or in the presence of K562 target cells.
| Day 1 | Day 30 | Day 1 / Day 30 | ||||
|---|---|---|---|---|---|---|
| PBMC | PBMC+K562 | PBMC | PBMC+K562 | PBMC | PBMC+K562 | |
| Mean±SD | 1.95(1.84-2.06) | 8.78(7.96-9.45) | 2.46(1.88-3.2) | 18.40(16.3-20.7) | - | - |
| Fold increase | - | 4.5 | - | 7.5 | 1.2 | 2.1 |
| P | - | 0.0022 | - | 0.0022 | 0.44 ns | 0.031 |
| r | 0.83 | |||||
The Shapiro–Wilk test was used to assess the normality in the sample distribution. Not normally distributed data is presented as median (quant 25 - quant 75). р-value of the effect between two independent samples was assessed by a nonparametric statistical method (Wilcoxon–Mann–Whitney test). Statistical significance between two dependent samples was determined by the Wilcoxon signed-rank test. r -value was used to interpret the value of the effect in the Wilcoxon signed-rank test. r < 0.1 illustrates no or minimal effect, 0.1-0.3 – small effect, 0.3-0.5 – moderate effect, 0.5-1 – high effect. The differences were considered significant at p<0.05, ns - non significant. The differences were considered significant at p<0.05, ns - non significant.
Disclaimer/Publisher’s Note: The statements, opinions and data contained in all publications are solely those of the individual author(s) and contributor(s) and not of MDPI and/or the editor(s). MDPI and/or the editor(s) disclaim responsibility for any injury to people or property resulting from any ideas, methods, instructions or products referred to in the content. |
© 2025 by the authors. Licensee MDPI, Basel, Switzerland. This article is an open access article distributed under the terms and conditions of the Creative Commons Attribution (CC BY) license (http://creativecommons.org/licenses/by/4.0/).
Copyright: This open access article is published under a Creative Commons CC BY 4.0 license, which permit the free download, distribution, and reuse, provided that the author and preprint are cited in any reuse.


