
Submitted:
22 May 2025
Posted:
23 May 2025
You are already at the latest version
Abstract
The increasing demand for computer science (CS) skills underscores the importance of integrating CS education into K–12 curricula to best prepare students for a digitally-driven society. Despite significant progress in expanding access to CS courses, disparities in participation persist, especially among historically underrepresented groups. This study examines the transition from 8th to 9th grade (occurring in the U.S. around age 15) as a pivotal juncture in CS education, analyzing factors linked to 9th-grade CS course-taking among 5,505 students across eight diverse school districts in a northeastern state of the U.S. using logistic regression. Findings show that high academic achievers, male students, Asian students, and those with exposure to CS and Algebra 1 in middle school were more likely to enroll in 9th-grade CS courses. Conversely, participation is lower for females, English Language Learners, and students receiving special education services. These results point to persistent barriers to CS participation extending beyond access alone. We discuss practical implications for middle and high schools, emphasizing the need for targeted outreach and early exposure to CS to foster a sense of belonging and applicability of CS. By identifying actionable strategies to address participation gaps, this study provides data-driven recommendations for advancing equity in CS education during the critical middle-to-high school transition.
Keywords:
computer science education
; K-12 STEM education
; broadening participation in computing
; secondary education
; STEM course-taking
1. Introduction
Jobs in computing and related fields are experiencing rapid growth (US Bureau of Labor Statistics, 2024), highlighting the continued and increasing demand for computer science (CS) skills. At the same time, as technology, artificial intelligence (AI), and automation permeate nearly every sector of society, these skills are no longer relevant only for those pursuing careers in software development or technical fields but are seen as critical for all students to become responsible, informed, and productive members of society. Thus, meaningfully incorporating computer science education (CSE) into K-12 curricula continues to gain momentum as a national priority. Recent efforts in computer science education (CSE) are focused on both addressing persistent participation gaps among underrepresented groups (CSTA et al., 2024; NASEM, 2024; TeachAI & CSTA, 2024) as well as promoting more universal participation in CSE (Barr, 2022; Li et al., 2020; Michaeli et al., 2023). Broadening participation in CSE is paramount, ensuring that all students not only have access to CSE, but participate as well.
Over the past decade in the United States, significant investments have been made in K-12 CSE at the local, state, and federal levels. Notable initiatives, such as Computer Science for All, the Computer Science Education Act, the Future of Work, and Broadening Participation in Computing, have contributed to progress in expanding CSE. For instance, while only 45% of public high schools offered foundational computer science in 2019, this figure rose to 60% by 2024 (Code.org, 2024). Although access has improved, it is not yet universal (Fletcher & Warner, 2021; NCES, 2019), and it remains skewed based on student demographics and locale. Rural, urban, and smaller high schools, as well as those with higher percentages of economically disadvantaged students, are less likely to offer foundational CS (Code.org, 2024). Further, U.S. K-12 students that are Black/African American, Hispanic/Latinx, or Native American/Alaskan are less likely to attend schools that offer such courses (Code.org, 2024).
We know, however, that increasing CSE access does not imply increases in participation (Adrion et al., 2020; Code.org, CSTA et al., 2024, ECEP Alliance, 2024; Warner et al., 2021), a dimension to broadening participation efforts that has been discussed for over a decade (Margolis et al., 2012). In the 2023-2024 school year, only 6.4% of high school (HS) students in the U.S. enrolled in a foundational CS course. In the U.S. CS courses are typically offered as opt-in electives, and specifics on elective processes vary across schools. Despite ongoing efforts to encourage participation, males are still twice as likely to enroll in these courses as females, a statistic that has remained unchanged over the past four years (Code.org, 2024).
Participation among racial and ethnic groups has also been relatively stable over this period: broadly speaking, Black/African American, Hispanic/Latinx, Native Hawaiian/Pacific Islander, multiracial, English Language Learners (ELLs), students with disabilities, and economically disadvantaged students remain underrepresented in their CSE participation (Code.org, 2024). For example, while 53% of students nationally qualify for free and reduced lunch, they comprise only 38% of foundational computer science classes. Disparaties like these point to more than an access issue (Code.org 2024; Fletcher & Warner, 2021; Warner et al, 2022).
To address low CS participation, both overall and particularly among learners from underrepresented groups, recent efforts have increasingly focused on introducing CS instruction at lower grade levels (English, 2017; Madrigal et al., 2020; Wiebe et al., 2019; Weintrop et al, 2018). Research suggests that these early interventions are critical because students are still forming their perceptions of gender roles and career trajectories (Barker & Aspray, 2006; Whitecraft & Williams, 2010) and can benefit from early exposure to CS concepts that encourage continued engagement in high school and beyond (Lee et al., 2023; Denner, 2011; Ryoo et al., 2012). Notably, middle school (MS) CS classrooms tend to reflect a more demographically representative student population than high school CS classrooms (Code.org, 2024). This is likely attributable to the fact that MS CS instruction is often integrated into mandatory curricula in the U.S., making it not only accessible to students, but required.
Considering the prior research described above as a whole, a clear message emerges: despite the US’ increasing efforts to broaden participation in CSE, data consistently show that participation remains closely tied to sociodemographic factors and CS classrooms often do not represent the diversity of the schools they serve. Many initiatives and projects are working to address this, but systemic changes of this size require sustained efforts and impacts may not be immediate. For instance, changes to K-12 educational policies may take over a decade to realize their impacts and may be difficult to study at earlier points in time. Nevertheless, a deeper understanding of CS pathways overall is crucial for identifying when, how, and why students choose to engage with CS. This paper contributes to the growing body of research by examining the transition from 8th grade to 9th grade as a pivotal decision point in the K-12 CS pipeline.
2. Methods
Through a federally funded grant centered on the enhancement of CS and related instruction at the MS level, eight U.S. public school districts in a northeastern state of the provided MS and HS administrative data. Data was considered for all students in grades 6-12 between 2018 and 2024, and included sociodemographic characteristics for each student, along with their courses, marking period grades, and final course grades for each academic year. Data from the eight districts and six academic years were combined, retaining student, school, and year identifiers. Variables were standardized to account for variations in individual schools’ reporting.
Prior to analysis, racial and ethnic categories with small sample sizes (Indigenous, Multiracial, and Pacific Islander) were recoded to an “Other” category. Similarly, students’ gender was recoded as “male” or “female and non-binary” to retain students with other gender identities (supported only by some schools’ SISs) and to address their small group size. Several key indicator variables were created to capture student characteristics: English Language Learner (ELL) status, receipt of special education services, economically disadvantaged status, enrollment in Algebra 1 (the U.S. elementary algebra course that introduces variables and equations), in middle school, and enrollment in a CS and CS-related course in 9th grade. Two composite variables were created for this analysis: (1) the total number of CS and CS-related classes taken in middle school and (2) the average final course grade across all middle school courses. These variables were designed to provide an understanding of students' academic preparation and course-taking patterns that may impact the critical transition from middle to high school.
The unit of analysis in this study was an individual student enrolled in any participating district with available data for both 8th and 9th grades. A total of 5,505 students met this inclusion criteria, and their characteristics are presented in Table 1. The sample comprises a diverse population of students, with a varied racial composition: 46% Hispanic, 34% White, 11% Black, 7% Asian, and 2% Other. Additionally, the sample includes representation from key subgroups: 18% of students receive Special Education services, 9% are ELLs, and 56% are classified as Economically Disadvantaged. To examine predictors of CS-related course enrollment in 9th grade, we applied a binary logistic regression model using the sociodemographic variables described above.
For the purposes of this study, "CS courses" were defined as a manually verified subset of courses classified under either category 11 (Communication and Audio/Visual Technology) or category 21 (Engineering and Technology) in the School Courses for the Exchange of Data (SCED) classification system (National Forum on Education Statistics, 2014). Additional predictor variables, discussed above, were included based on prior research and theoretical relevance, such as the relationship between Algebra 1 completion and computer science outcomes (Torbey et al., 2020) and the role of pre-high school exposure to computer science in fostering longer-term CS participation (McGee et al., 2017). To facilitate interpretation of effect sizes, odds ratios (ORs) and 95% confidence intervals (CIs) were calculated. All analyses were conducted using R version 4.4.1 (R Core Team, 2024).
3. Results
This study examines the predictors of 9th grade CS enrollment using a logistic regression model, shown in Table 2. The model was constructed using a sample of 5,505 9th grade students from eight public school districts in a northeastern state in the U.S., of whom 1,463 (27%) enrolled in a CS course. The model demonstrates a statistically significant improvement over the null model (χ² = 351.5, p < 0.001), indicating that the included predictors collectively contribute to explaining variability in students’ enrollment. Below, we describe the patterns observed across sociodemographic and academic factors.
3.1. Sociodemographic Factors
Gender emerged as one of the strongest predictors of enrollment. Male students were substantially more likely to take a CS course compared to non-male students (log-odds = 0.90, p < 0.001). In descriptive terms, 35% of male students enrolled, while fewer than 18% of female and non-binary students did so. This resulted in classrooms where male students outnumbered female and non-binary students by nearly two to one.
Racial and ethnic differences were also evident. Asian students showed significantly higher odds of enrolling in CS compared to White students (log-odds = 0.45, p < 0.001), with nearly 40% of Asian students in the sample participating, compared to 26% of White students. Hispanic students also showed higher odds than White students (log-odds = 0.17, p = 0.044), with about 26% enrolling. The participation rate for Black students, 22%, did not differ significantly from that of White students (log-odds = 0.05, p = 0.7).
Additionally, English Language Learner (ELL) status was negatively associated with CS course enrollment. Only 19% of ELL students participated in 9th grade CS, compared to 27% of their non-ELL peers (log-odds = -0.34, p = 0.008). The model also tested for differences by students’ economically disadvantaged status, but no significant relationship was found between students’ economic status and their likelihood of enrolling in CS (log-odds = 0.08, p = 0.3) in this sample.
3.2. Academic Factors
Overall academic achievement, measured by middle school course grades, was a significant and positive predictor (log-odds = 2.3, p < 0.001). Although grade differences were small in absolute terms, the strength of the association suggests that students with higher academic performance overall are more likely to pursue CS in high school, as illustrated in Figure 1.
The strongest academic predictor in this model was prior CS-related course participation in middle school (log-odds = 1.1, p < 0.001), meaning that students with prior exposure to CS content were substantially more likely to continue in the CS pathway in high school. Results also suggest that Algebra I plays a role in 9th grade CS enrollment: completion of this course in middle school was a significant predictor (log-odds = 0.19, p = 0.022). Among students who completed Algebra I before high school, 33% went on to take CS in 9th grade, compared to 24% of those who took Algebra I in high school.
Students who received special education services at any point were less likely to enroll in a CS course (log-odds = -0.27, p = 0.002). While 27% of students without special education services took a CS course, this figure dropped to 23% for students receiving such services.
4. Discussion
This study provides a novel perspective by focusing specifically on 9th grade students, a critical entry point for CSE; the study examined academic and sociodemographic predictors of 9th grade CS course enrollment. In our sample, 27% of 9th grade students enrolled in a CS course. Recent data from Code.org (2024) shows that 6.4% of high school students (grades 9–12) took a CS course in the 2023–2024 school year. While these percentages describe different populations and cannot be directly compared, their stark difference raises important considerations. Specifically, our results suggest that 9th grade may represent a particularly promising entry point for expanding participation in computing. It is possible that students are more open to trying new subjects like CS at the start of high school, when they are building their academic identities and course patterns (Alhadabi & Li, 2020; Gottfried, 2022). While more longitudinal research is needed to confirm this progression, these findings point to 9th grade as a strategic moment to concentrate outreach and recruitment efforts, both to boost immediate participation and to support sustained engagement over time.
At the same time, our data show that even when courses are available, participation is not evenly distributed. Our model revealed persistent disparities based on gender, race, language status, and academic background. However, it is important to note that our model is predicated on a CS course being available to 9th graders. This mirrors patterns reported in national studies (Code.org, 2024; Warner et al., 2021) and reinforces a critical message from the literature: expanding access to CS courses is necessary, but not sufficient, to achieve broad or equitable participation. Moving toward universal participation requires not only offering courses, but also ensuring that all students feel invited, supported, and capable of succeeding in them.
4.1. Sociodemographic Factors: Interpretation and Implications
Figure 2 illustrates participation in 9th grade CS courses by students’ sociodemographic groups. Gender emerged as the strongest sociodemographic predictor in our model, with male students significantly more likely to enroll in 9th grade CS than their female and non-binary peers. This pattern is consistent with long-standing national trends (Code.org, 2024) and existing research (Jaccheri & Fast, 2020). These early imbalances are concerning because they reinforce the perception of CS as a male-dominated space, which can discourage participation and persistence among students who do not see themselves reflected in these classrooms (Venkataraman et al., 2019; Weston et al., 2019). Addressing this imbalance requires not just offering CS courses, but also actively challenging gendered stereotypes about who belongs in CS.
Racial and ethnic patterns in our findings both align with and complicate national trends. National data show that Black, Hispanic, and Native American students are less likely to attend schools that offer CS courses (Code.org, 2024), reflecting systemic disparities in access. In our sample, limited to schools where CS was already available, we found that Hispanic students were slightly more likely than White students to enroll, and while Black students participated at slightly lower rates, though the difference was not statistically significant. These findings suggest that when CS is made available, participation gaps may narrow for some groups, though not universally. Asian students in our sample were the most likely to enroll, consistent with research (Code.org, 2024). However, we note that aggregating subgroups into a single category risks masking disparities among AAPI communities.
Economic disadvantage was not a significant predictor in our model. However, this result should be viewed considering the study’s design. As discussed earlier, schools with higher economically disadvantaged student populations are less likely to offer CS, so the present study likely systematically excludes schools (and by extension, students) that serve these communities. Thus, while our model did not find a statistically significant relationship, this does not mean that economic inequality is irrelevant and should not be interpreted as a contradiction or argument against current research. Rather, it once again highlights the difference between access and participation, both of which must be addressed to achieve broader equity in CSE.
Finally, students identified as English Language Learners (ELLs) and those receiving special education services were significantly less likely to enroll in 9th grade CS. While this could partially reflect language barriers or the need for differentiated instruction, it may also reflect deeper structural and social barriers, such as stigma associated with language learning or special education status (Hagiwara & Rodrigues, 2021; Lei & Allen, 2022). Additionally, scheduling conflicts with required support services may limit students’ ability to take elective courses like CS (Blitz et al., 2025).
4.2. Academic Factors: Interpretation and Implications
Figure 3 illustrates participation in 9th grade CS courses with students grouped along vexplored academic factors. Among the academic factors examined, prior CS course-taking in middle school emerged as the strongest predictor of 9th grade enrollment, reinforcing the growing body of research highlighting the value of early exposure (English, 2017; Lee et al., 2023; McGee et al., 2017). This finding strengthens the case for making CS an integrated part of middle school curricula, particularly in formats that reach all students, not just those who opt in.
Completion of Algebra I in middle school also showed a statistically significant positive relationship with 9th grade CS enrollment. This aligns with prior work that links math acceleration to increased engagement in technical subjects (Amiel & Blitz, 2022; Torbey et al., 2020). However, this pattern raises important considerations: unlike math, which is typically structured with differentiated pathways that allow for both advanced and on-grade-level progression, CS is rarely offered in similarly tiered models. This risks creating a pipeline that disproportionately favors students already on accelerated academic tracks. This is further supported by our finding that students with higher overall academic performance were significantly more likely to enroll in CS in 9th grade.
As shown earlier in Figure 1, 9th grade CS enrollment steadily increases with students’ average middle school grades, suggesting that students who see themselves as “average” or who struggle academically may self-select out of CS, viewing it as too difficult or specialized. This is consistent with concerns raised in the literature about the positioning of CS as a domain requiring advanced mathematical or analytical aptitude (Amiel & Blitz, 2022; CSTA et al., 2022; NASEM, 2024).
5. Conclusion
This study adds to the conversation on broadening participation in CSE by presenting the transition from middle school to high school (the transition to 9th grade, for U.S. studnets) as a pivotal moment in the CS pipeline. While recent policies have expanded the availability of CS courses, our findings reinforce that access alone is not enough. Participation remains uneven, with significant disparities by gender, language status, special education status, and academic achievement.
The start of high school represents both a reflection of students’ prior experiences and a critical opportunity for schools to influence future engagement. In our sample, 27% of 9th graders enrolled in a CS course; although not directly comparable, a interesting figure to consider alongside the national 6.7% (Code.org, 2024) for all HS students. This suggests that 9th grade may be an effective point to invite a wide, diverse student population to CS. However, gaps are already present by this point, shaped by factors such as students’ earlier exposure to CS, their academic histories, and their sense of who “belongs” in CS.
Our results show that academic background strongly predicts 9th grade enrollment. Students who took CS in middle school, completed Algebra I early, and achieved higher middle school grades were more likely to enroll in CS in 9th grade. This raises concerns about how CS is presented in school systems; often positioned as advanced or math-intensive, accessible primarily to students already on accelerated tracks. This framing risks turning academic performance into an unintended gatekeeper.
Because of this, the 8th-to-9th grade transition stands out as a practical checkpoint both for researchers and for educators. For researchers, it provides a timely opportunity to study how early exposure and systemic factors shape students’ course-taking decisions. For educators and school systems, it is a strategic moment to intervene. Schools that limit CS to upper grades should consider opening enrollment earlier, adjusting schedules, and reducing unnecessary barriers. Outreach efforts must begin before course selection, reaching all students and clearly communicating that CS is for everyone, not just those with advanced math skills or prior coding experience.
At the same time, schools must reflect on how internal structures and resource limitations might unintentionally undermine their goals. While not all schools can offer specialized sections or fully differentiated instruction, they can work to ensure that scheduling, prerequisites, and messaging do not systematically exclude students who require additional supports. Addressing misconceptions about the difficulty or exclusivity of CS is essential, not only to increase participation but to advance the broader goal of more universal participation in CSE, which provides a critical skillset for today’s, and tomorrow’s, society and workforce.
5.1. Limitations & Future Work
This study focuses on schools where 9th grade CS courses were already available, excluding students in schools without such offerings from the model; these students are more likely to be from populations typically underrepresented in CSE. As such, results should be interpreted through this lens, drawing a clear distinction between predicting access and predicting participation, as presented in the discussion. Additionally, while our dataset included a large and diverse student population, smaller subgroup sizes for certain characteristics, such as ELL and special education status, may limit the precision of some subgroup-specific findings.
Future research should build on this work by further investigating 9th grade as a pivotal transition point, including the factors that influence course selection when CS is available. Mixed-methods studies could deepen understanding of how students make enrollment decisions, including the roles of prior experience, perceptions of course difficulty, and school-level messaging. Larger or multi-site studies could also strengthen subgroup analyses, particularly for multilingual learners and students receiving special education. We also note that the analysis conducted in this study, a binary logistic regression, does not yield causal findings, and controlled experiments that can generate causal insight may offer a promising area for future work. Additional research of any kind could contrinbute to a more nuanced understanding of the interplay between access and participation, identifying how expanding course availability interacts with student-level factors to shape engagement in CS over time.
Acknowledgments
This research was conducted with support from the U.S. Department of Education Office of Elementary & Secondary Instruction under Educational Innovation & Research (EIR) Award #S411C200084.
References
- Adrion, W. R.; Dunton, S. T.; Ericson, B.; Fall, R.; Fletcher, C.; Guzdial, M. U.S. states must broaden participation while expanding access to computer science education. Commun. ACM; 2020; 63, pp. 22–25. [Google Scholar] [CrossRef]
- Alhadabi, A.; Li, J. Trajectories of Academic Achievement in High Schools: Growth Mixture Model. Journal of Educational Issues 2020, 6(1), 140. [Google Scholar] [CrossRef]
- Amiel, D.; Blitz, C. Computer science teacher capacity: The need for expanded understanding. International Journal of Computer Science Education in Schools 2022, 5(4), 38–47. [Google Scholar] [CrossRef]
- Barker, L. J.; Aspray, W. The state of research on girls and IT. In J. M. Cohoon and W. Aspray, Women and Information Technology: Research on Underrepresentation; MIT Press; Cambridge, MA, 2006; pp. 3–54. [Google Scholar]
- Barr, V. What must all post-secondary students learn about computing? Commun. ACM; 2022; 65, pp. 29–31. [Google Scholar] [CrossRef]
- Blitz, C.L.; Duncan, T.; Amiel, D.J. The Intersection of computer science education and ELL services: Understanding the impact on underrepresented learners; Unpublished manuscript, 2025. [Google Scholar]
- Bureau of Labor Statistics; U.S. Occupational outlook handbook: Computer and information technology occupations. 2024. Retrieved from. Available online: https://www.bls.gov/ooh/computer-and-information-technology/.
- Code.org 2024 state of computer science education. 2024. Retrieved from. Available online: https://advocacy.code.org/stateofcs.
- CSTA; IACE; ACM; Code.org; College Board; CSforALL; ECEP Alliance. Reimagining CS pathways: Every student prepared for a world powered by computing; Association for Computing Machinery, 2024. [Google Scholar] [CrossRef]
- Denner, J. What predicts middle school girls’ interest in computing? International Journal of Gender, Science and Technology 2011, 3(1), 53–69. [Google Scholar]
- English, L. Advancing elementary and middle school STEM education. International Journal of Science and Mathematics Education 2017, 15(S1), 5–24. [Google Scholar] [CrossRef]
- Fletcher, C.L.; Warner, J.R. CAPE: A framework for Assessing equity throughout the computer science education ecosystem. Communications of the ACM, February; 2021; 64, pp. 23–25. [Google Scholar]
- Hagiwara, S.; Rodriguez, N. J. Keengwe, J., Tran, Y., Eds.; English learners (EL) and computer science (CS) learning: Equity issues. In Handbook of Research on Equity in Computer Science in P-16 Education; IGI Global Scientific Publishing, 2021; pp. 70–87. [Google Scholar] [CrossRef]
- Gottfried, M. Linking applied STEM coursetaking beyond STEM outcomes: Examining high school completion and college-going behavior. The High School Journal 2022, 105(3), 175–198. [Google Scholar] [CrossRef]
- Jaccheri, J; Pereira, C; Fast, S. Gender Issues in Computer Science: Lessons Learnt and Reflections for the Future. 2020 22nd International Symposium on Symbolic and Numeric Algorithms for Scientific Computing (SYNASC); 2020; pp. 9–16. [Google Scholar] [CrossRef]
- Lee, H.; Closser, F.; Alghamdi, K.; et al. Current experiences and factors of future enrollment in computer science for high school students. TechTrends 2023, 67, 955–964. [Google Scholar] [CrossRef]
- Lei, Y.; Allen, M. English language learners in computer science education: A scoping review. Proceedings of the 53rd ACM Technical Symposium on Computer Science Education- 2022, Volume 1, 57–63. [Google Scholar] [CrossRef]
- Li, Y.; Schoenfeld, A. H.; diSessa, A. A.; Graesser, A. C.; Benson, L. C.; English, L. D.; Duschl, R. A. Computational Thinking Is More about Thinking than Computing. Journal for STEM Education Research 2020, 3(1), 1–18. [Google Scholar] [CrossRef] [PubMed]
- Madrigal, V.; Yamaguchi, R.; Hall, A.; Burge, J. Promoting and supporting computer science among middle school girls of color: Initial findings from BRIGHT-CS. In In Proceedings of the 51st ACM Technical Symposium on Computer Science Education (SIGCSE '20). Association for Computing Machinery, New York, NY, USA; 2020; pp. 247–253. [Google Scholar] [CrossRef]
- Margolis, J.; Ryoo, J. J.; Sandoval, C. D. M.; Lee, C.; Goode, J.; Chapman, G. Beyond access: Broadening participation in high school computer science. ACM Inroads; 2012; 3, pp. 72–78. [Google Scholar] [CrossRef]
- McGee, S.; McGee-Tekula, R.; Duck, J.; Greenberg, R. I.; Dettori, L.; Reed, D. F.; Wilkerson, B.; Yanek, D.; Rasmussen, A. M.; Chapman, G. Does a taste of computing increase computer science enrollment? Computing in Science & Engineering 2017, 19(3), 8–18. [Google Scholar] [CrossRef]
- Michaeli, T.; Seegerer, S.; Romeike, R. What Students Can Learn About Artificial Intelligence–Recommendations for K-12 Computing Education. 2023. Available online: https://arxiv.org/abs/2305.06450.
- National Academies of Sciences, Engineering, and Medicine (NASEM; 2024). Equity in K-12 STEM education: Framing decisions for the future; The National Academies Press; Washington, DC. [CrossRef]
- National Center for Education Statistics (NCES; 2019). Percentage of persons’ ages 18-29 enrolled in colleges or universities, by age group, 4-category local, and sex. Available online: https://nces.ed.gov/pubs2015/2015144.pdf.
- National Forum on Education Statistics. Forum guide to school courses for the exchange of data (SCED) classification system. (NFES 2014-802). U.S. Department of Education. Washington, DC: National Center for Education Statistics. 2014. Available online: https://nces.ed.gov/forum/pub_2014802.asp.
- R Core Team. R: A language and environment for statistical computing. R Foundation for Statistical Computing. 2024. Available online: https://www.R-project.org/.
- Ryoo, J.J.; Margolis, J.; Lee, C.H.; Sandoval, C.D. M.; Goode, J. Democratizing computer science knowledge: Transforming the face of computer science through public high school education. Learning, Media and Technology 2012, 38(2), 161–181. [Google Scholar] [CrossRef]
- TeachAI and CSTA Guidance on the future of computer science education in an age of AI. 2024. Available online: https://www.teachai.org/cs.
- Torbey, R.; Martin, N. D.; Warner, J. R.; Fletcher, C. L. Algebra I Before High School as a Gatekeeper to Computer Science Participation. In Proceedings of the 51st ACM Technical Symposium on Computer Science Education; 2020; pp. 839–844. [Google Scholar] [CrossRef]
- Venkataraman, R.; Agarwal, E.; Brown, D. W. Marks, G. H., Ed.; Engaging K-12 Students Essential for Reducing Gender Gap in Computer Science Education. In Proceedings of International Journal on E-Learning 2019 Association for the Advancement of Computing in Education (AACE); 2019; pp. 331–343. Available online: https://www.learntechlib.org/p/149070.
- Warner, J. R.; Fletcher, C. L.; Martin, N. D.; Baker, S. N. Applying the CAPE framework to measure equity and inform policy in computer science education. Policy Futures in Education 2022, 1–19. [Google Scholar] [CrossRef]
- Weston, T. J.; Dubow, W. M.; Kaminsky, A. Predicting Women’s Persistence in Computer Science-and Technology-Related Majors from High School to College. ACM Trans. Comput. Educ. 2019; 20. [Google Scholar] [CrossRef]
- Wiebe, E.; Barnes, T.; Freeman, S.; Frye, D.; Maher, M. L.; Cao, L.; Dorodchi, M.; Pugalee, D.; Rorrer, A.; Boulden, D.; Cateté, V. Developing a systemic, scalable model to broaden participation in middle school computer science. In 2019 Research on Equity and Sustained Participation in Engineering, Computing, and Technology (RESPECT), February; IEEE, 2019; pp. 1–2. [Google Scholar]
- Weintrop, D; Hansen, A.K.; Harlow, D.B.; Franklin, D. Starting from scratch: Outcomes of early computer science learning experiences and implications for what comes next. In In Proceedings of the 2018 ACM Conference on International Computing Education Research (ICER '18). Association for Computing Machinery, New York, NY, USA; 2018; pp. 142–150. [Google Scholar] [CrossRef]
- Whitecraft, M.A.; Williams, W.M.; Oram, ed. A.; Wilson, G. Why aren’t more women in computer science? In Making Software: What Really Works and Why We Believe It; O’Reilly Media, Inc; Sebastopol, CA, 2010; pp. 221–238. [Google Scholar]
Figure 1.
Middle School Academics & 9th Grade CS Participation.
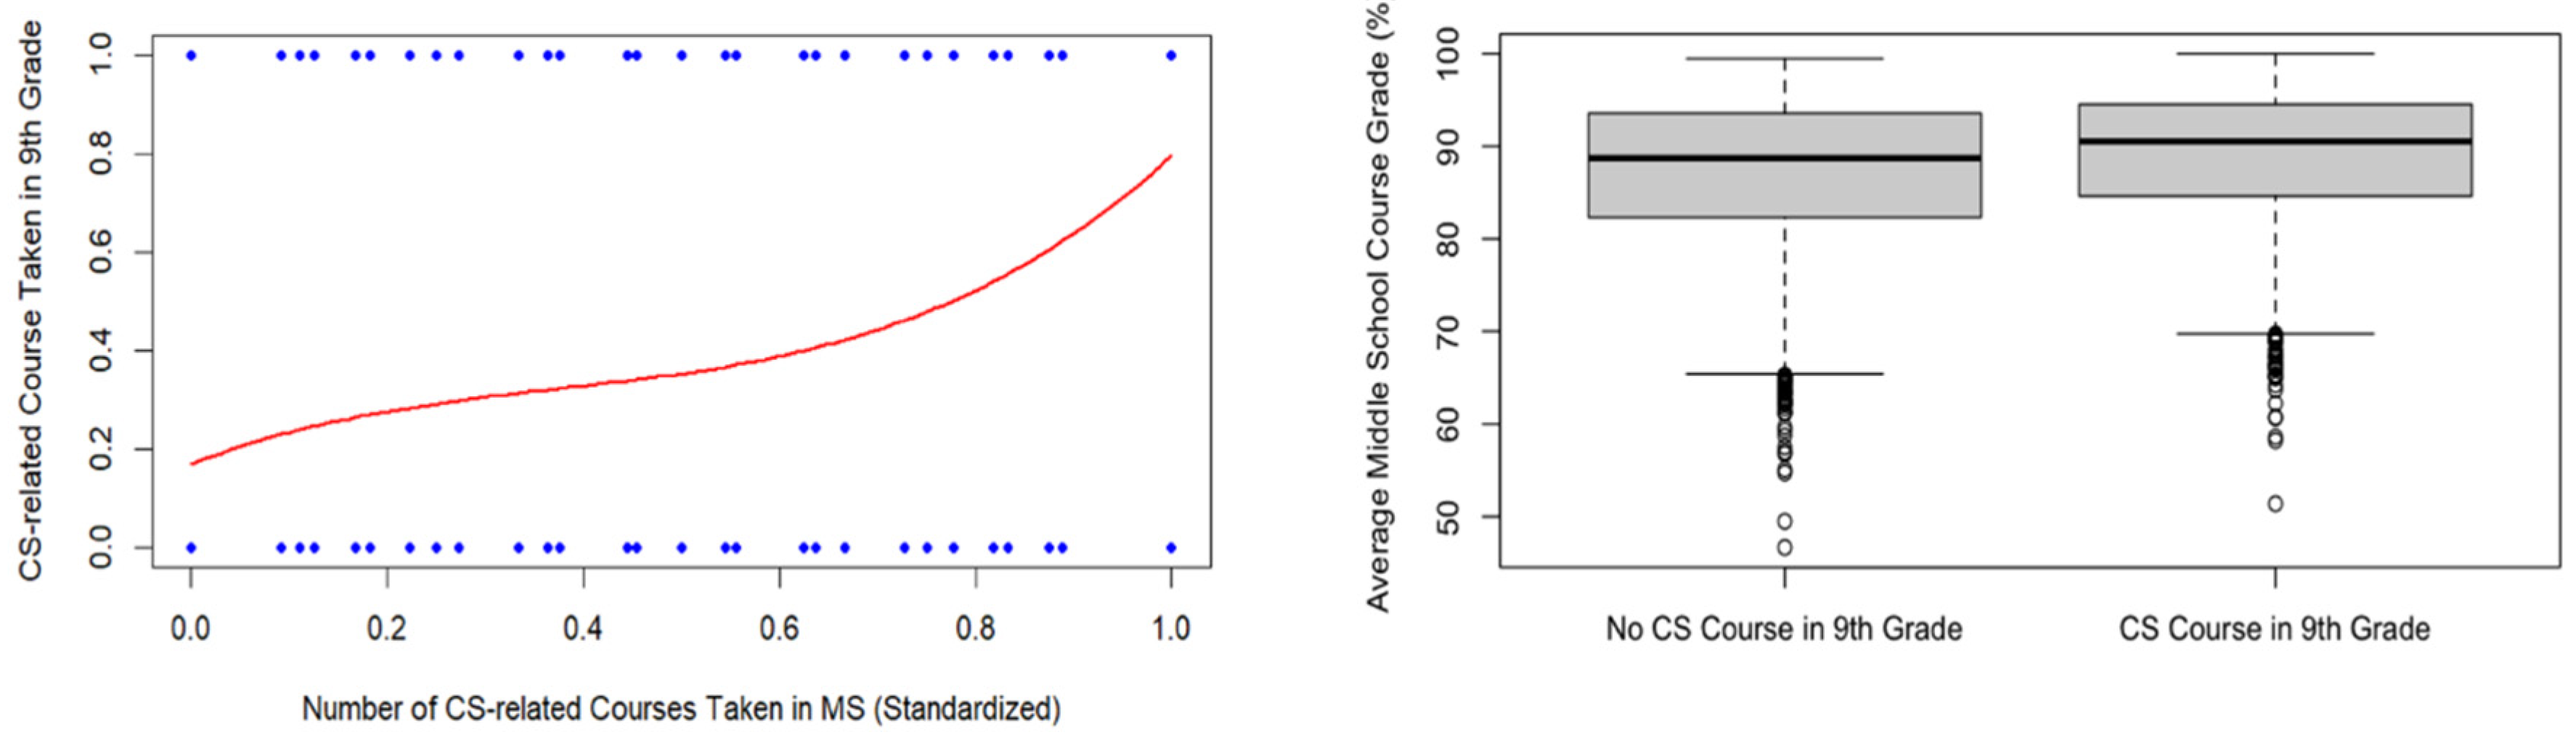
Figure 2.
Sociodemographic Characteristics & 9th Grade CS Participation.
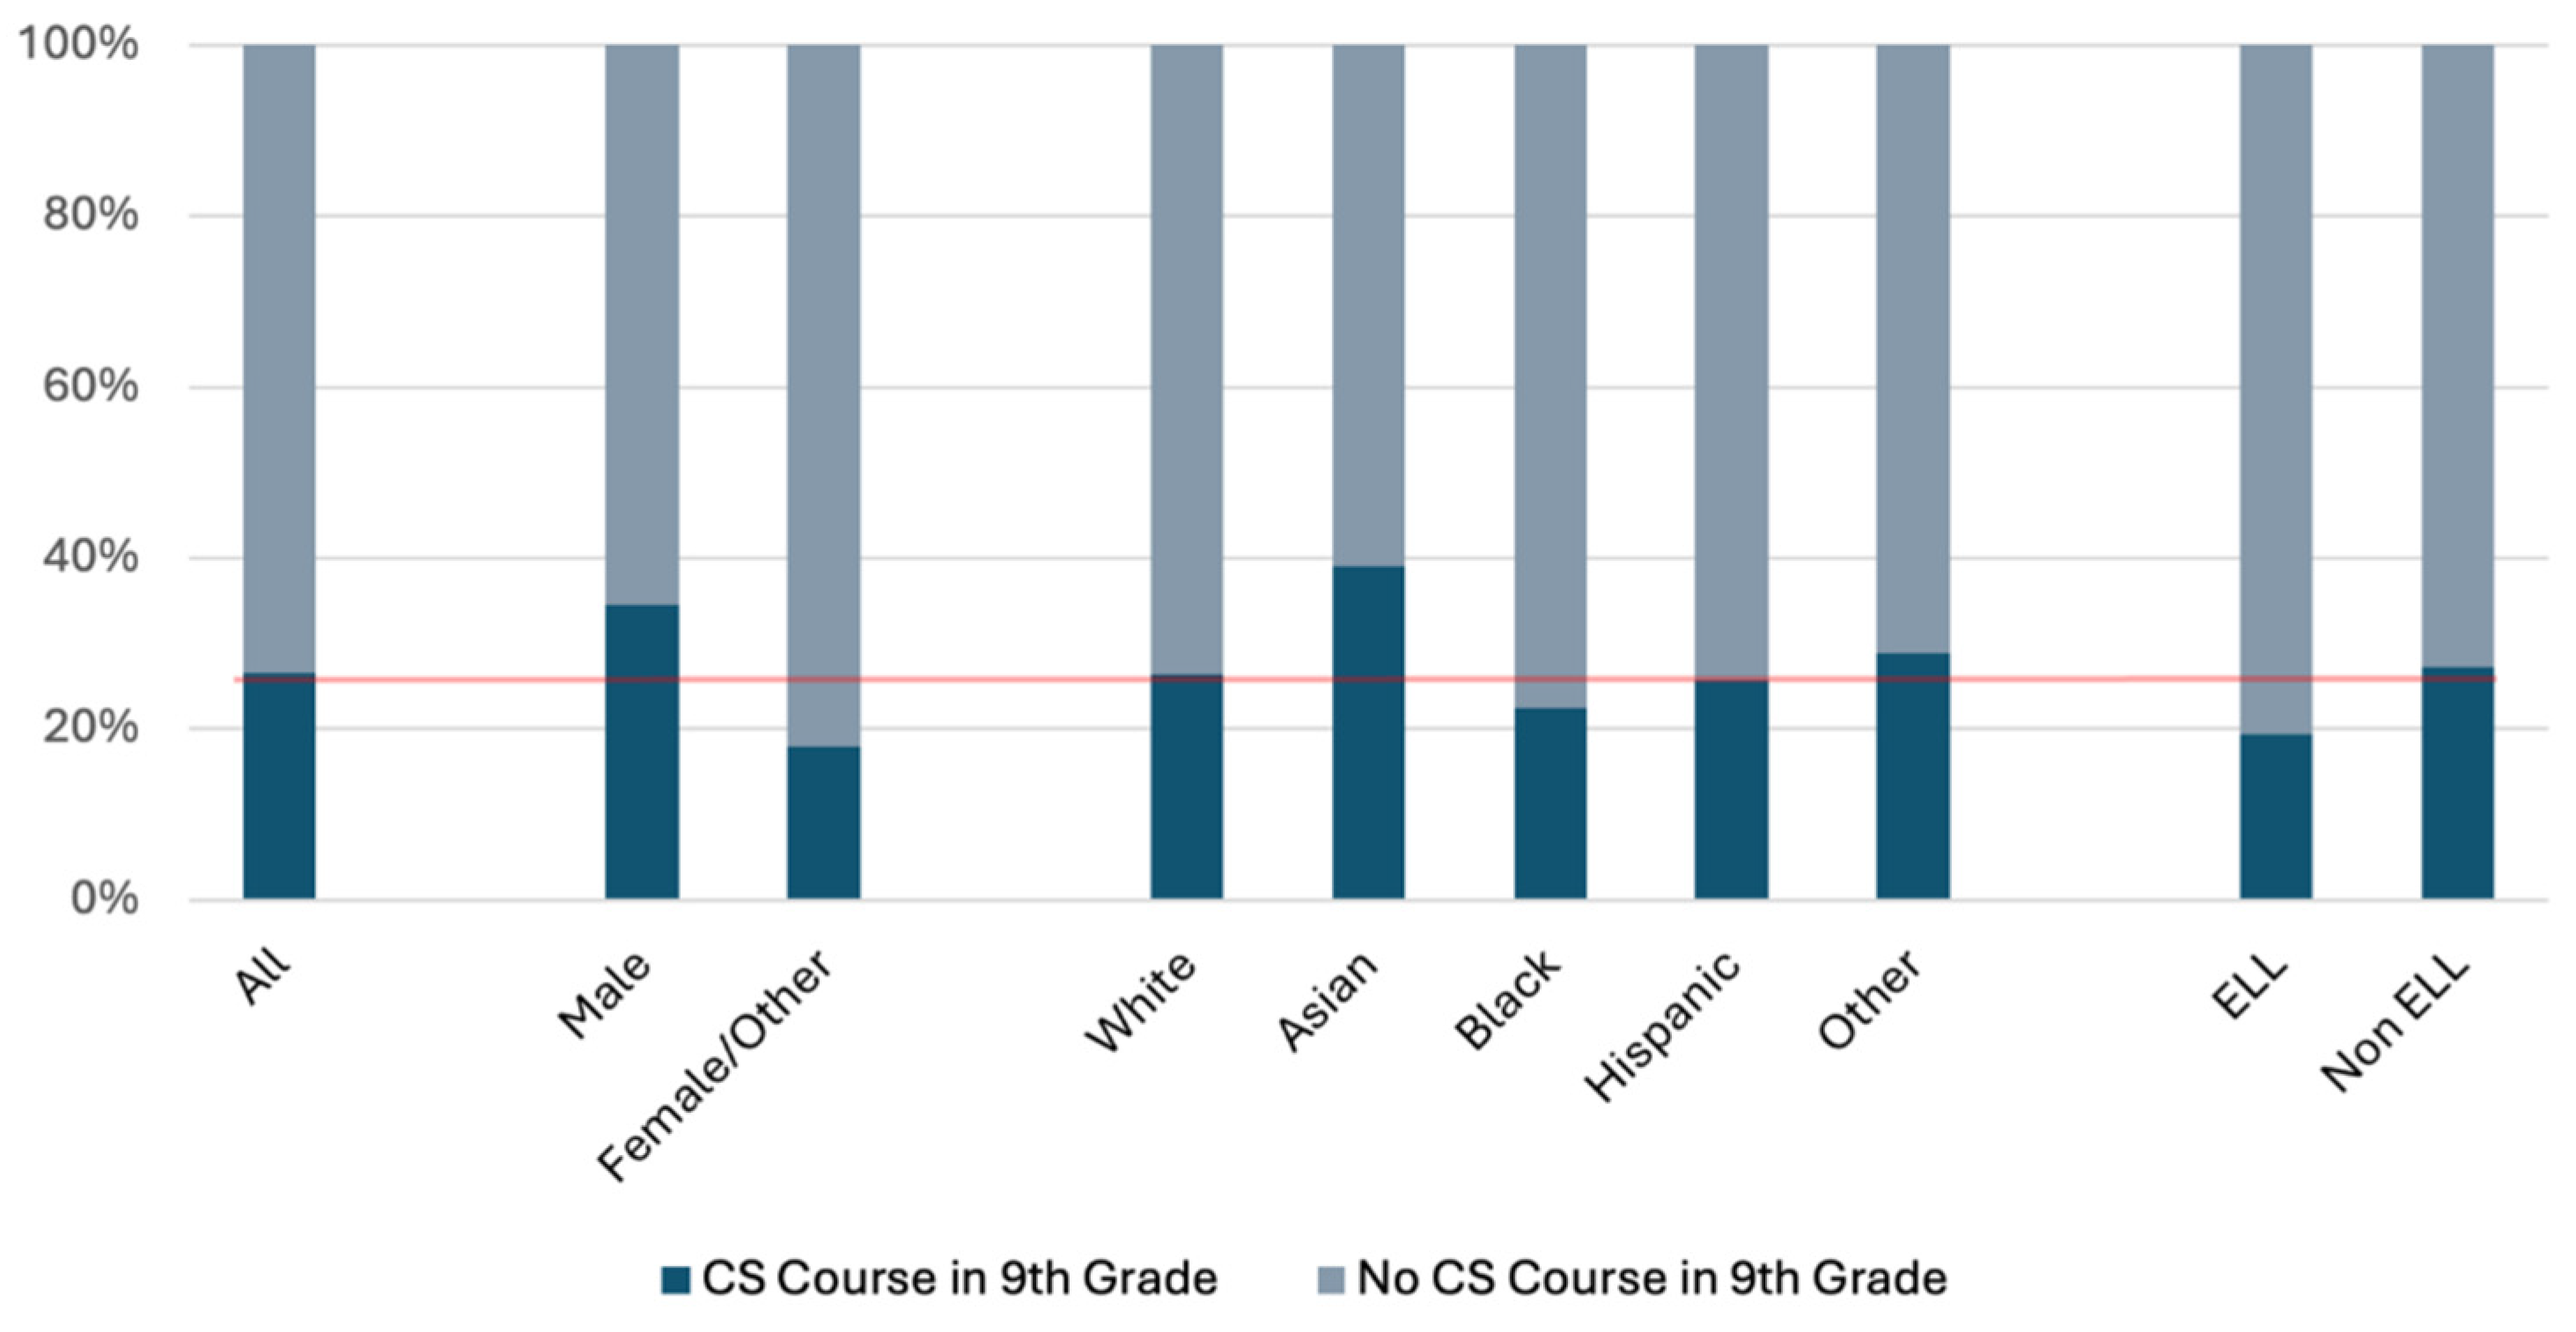
Figure 3.
Academic Predictors & 9th Grade CS Participation.
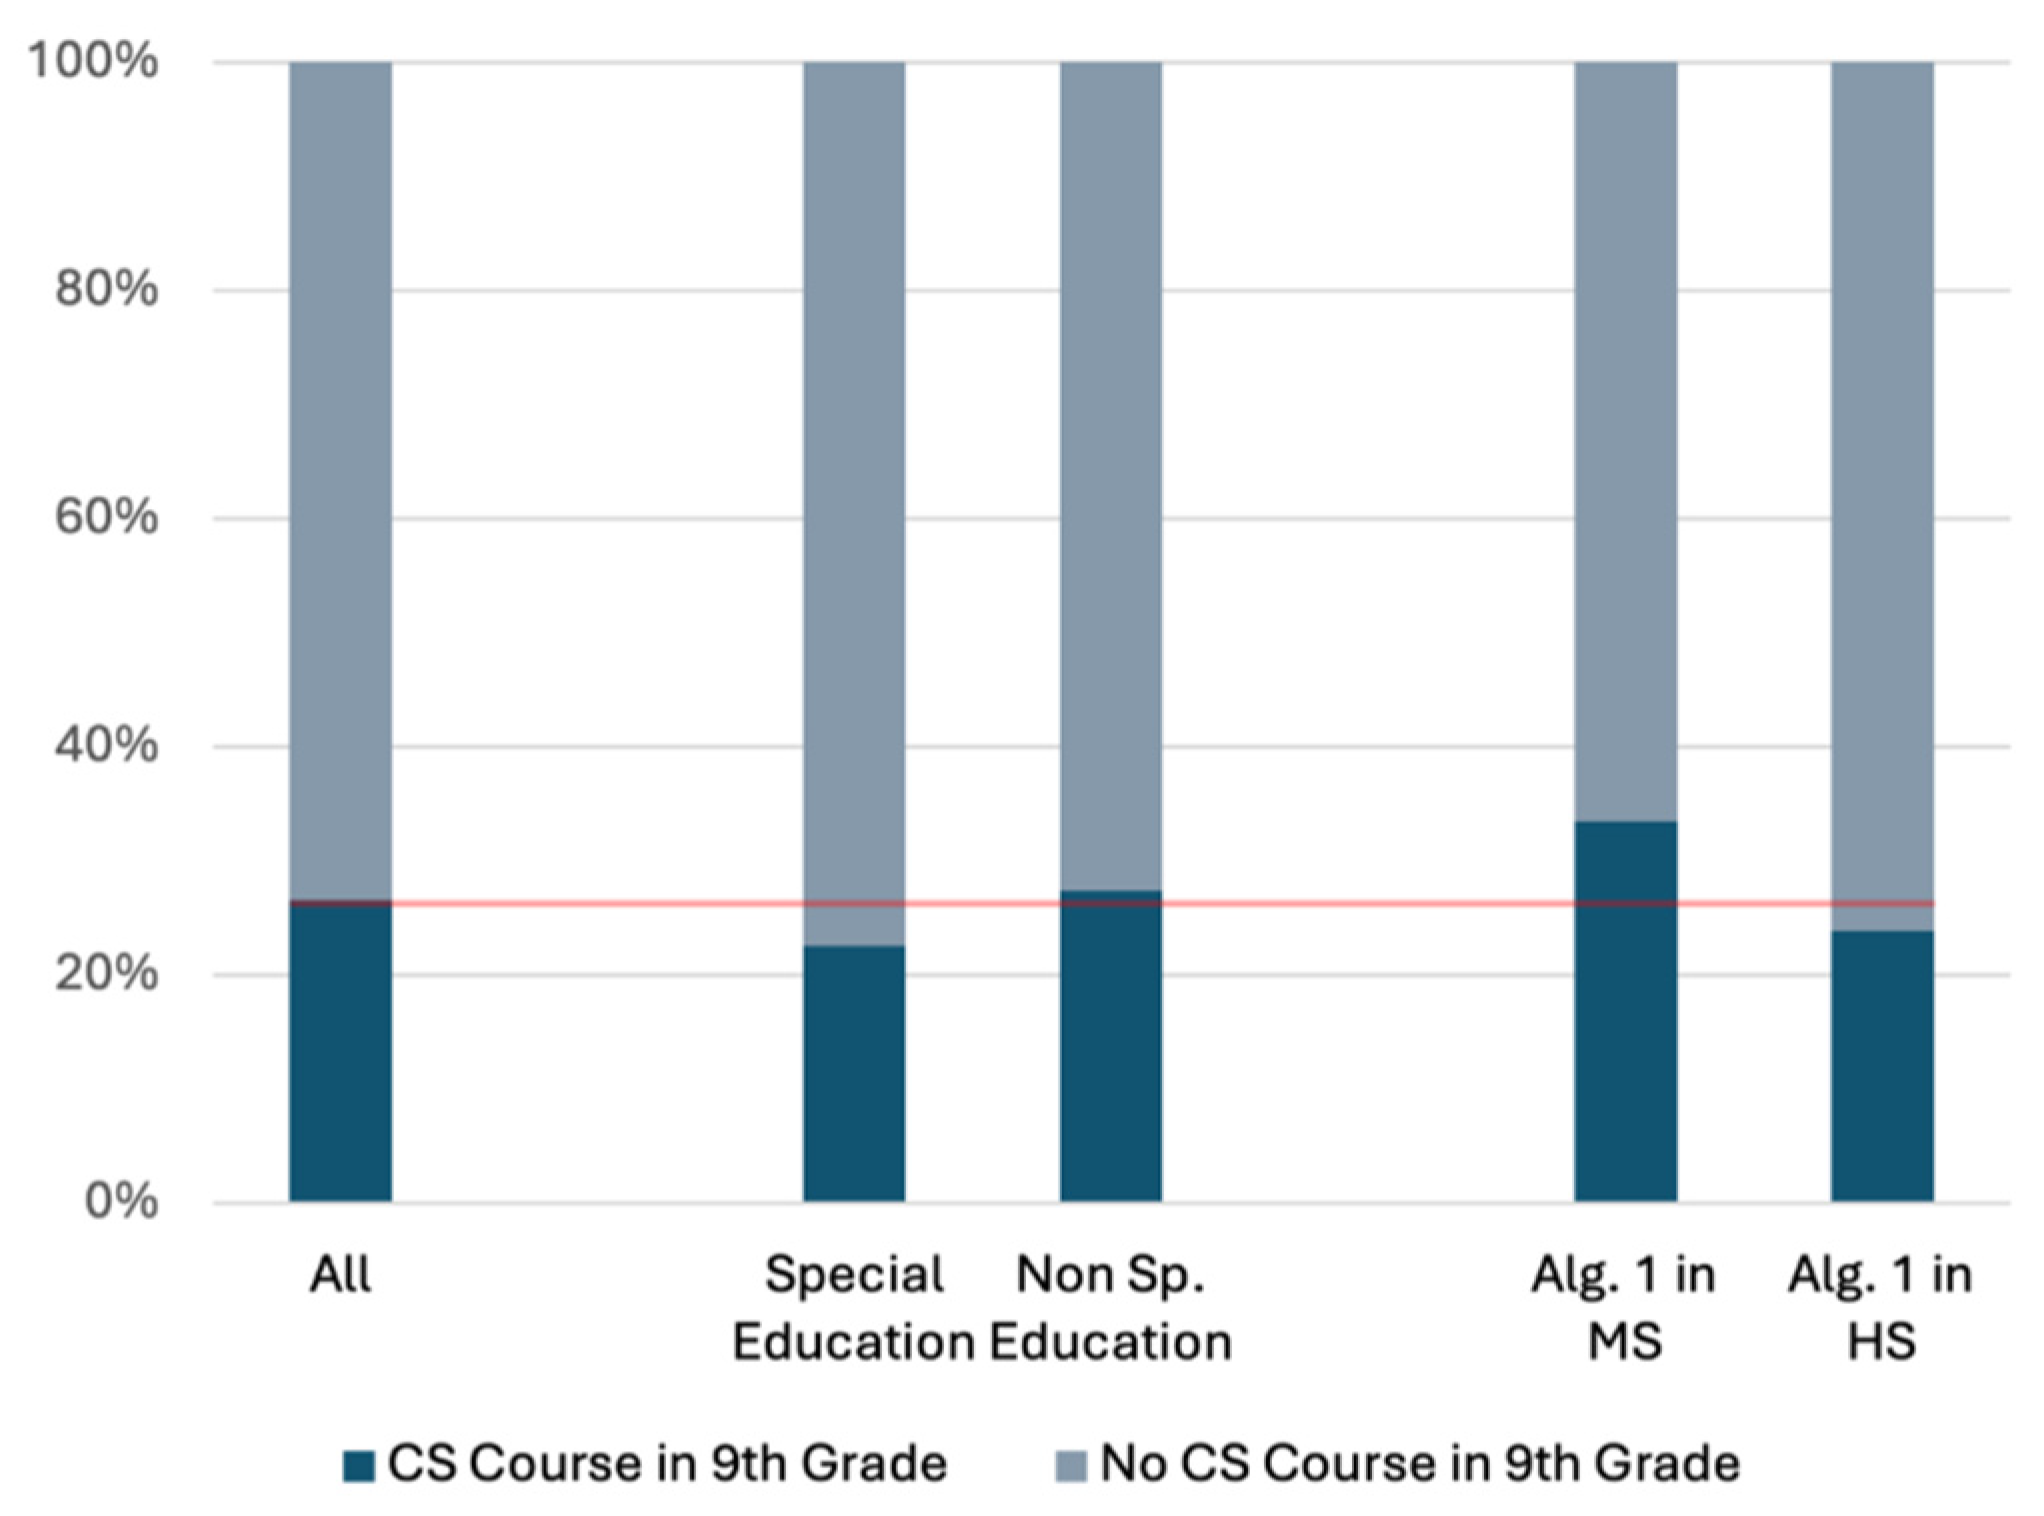

Table 1.
Sample Characteristics.
| Characteristic | N = 5,5051 |
| Gender | |
| Male | 2,860 (52%) |
| Female | 2,642 (48%) |
| Other | 3 (<0.1%) |
| Race/Ethnicity | |
| White | 1,860 (34%) |
| Asian | 387 (7.0%) |
| Black | 606 (11%) |
| Hispanic | 2,510 (46%) |
| Indigenous | 2 (<0.1%) |
| Multiracial | 123 (2.2%) |
| Pacific Islander | 17 (0.3%) |
| Sp. Education | 992 (18%) |
| ELL | 488 (8.9%) |
| Economically Disadvantaged | 3,104 (56%) |
| Avg. MS Course Grade | 0.89 (0.83, 0.94)2 |
| Algebra I in MS | 1,563 (28%) |
| 1 n (%); 2 median (Q1, Q3) | |
Table 2.
Fitted Logistic Regression Model.
| Characteristic | log(OR)1 | 95% CI2 | p |
| Gender (male) | 0.90 | 0.77, 1.0 | <0.001 |
| Race/Ethnicity | |||
| White | — | — | |
| Asian | 0.45 | 0.21, 0.69 | <0.001 |
| Black | 0.05 | -0.19, 0.28 | 0.7 |
| Hispanic | 0.17 | 0.00, 0.34 | 0.044 |
| Other | 0.36 | -0.05, 0.75 | 0.076 |
| Sp. Education | -0.27 | -0.45, -0.10 | 0.002 |
| ELL | -0.34 | -0.59, -0.09 | 0.008 |
| Economically Disadvantaged | 0.08 | -0.07, 0.23 | 0.3 |
| CS-related Courses Taken by Grade 8 | 1.1 | 0.69, 1.5 | <0.001 |
| Avg. MS Course Grade | 2.3 | 1.2, 3.3 | <0.001 |
| Algebra I in MS | 0.19 | 0.03, 0.35 | 0.022 |
| 1 OR: Odds Ratio; positive log-odds associated with increases in predicted response; 2 CI: Confidence Interval | |||
Disclaimer/Publisher’s Note: The statements, opinions and data contained in all publications are solely those of the individual author(s) and contributor(s) and not of MDPI and/or the editor(s). MDPI and/or the editor(s) disclaim responsibility for any injury to people or property resulting from any ideas, methods, instructions or products referred to in the content. |
© 2025 by the authors. Licensee MDPI, Basel, Switzerland. This article is an open access article distributed under the terms and conditions of the Creative Commons Attribution (CC BY) license (http://creativecommons.org/licenses/by/4.0/).
Copyright: This open access article is published under a Creative Commons CC BY 4.0 license, which permit the free download, distribution, and reuse, provided that the author and preprint are cited in any reuse.


