Preprint
Article

This version is not peer-reviewed.

Expansion of Mechanical Biological Residual Treatment Plant with Fermentation Stage for Press Water from Organic Fractions; Involving a Screw Press

A peer-reviewed article of this preprint also exists.

Submitted:

12 February 2025

Posted:

12 February 2025

You are already at the latest version

Abstract

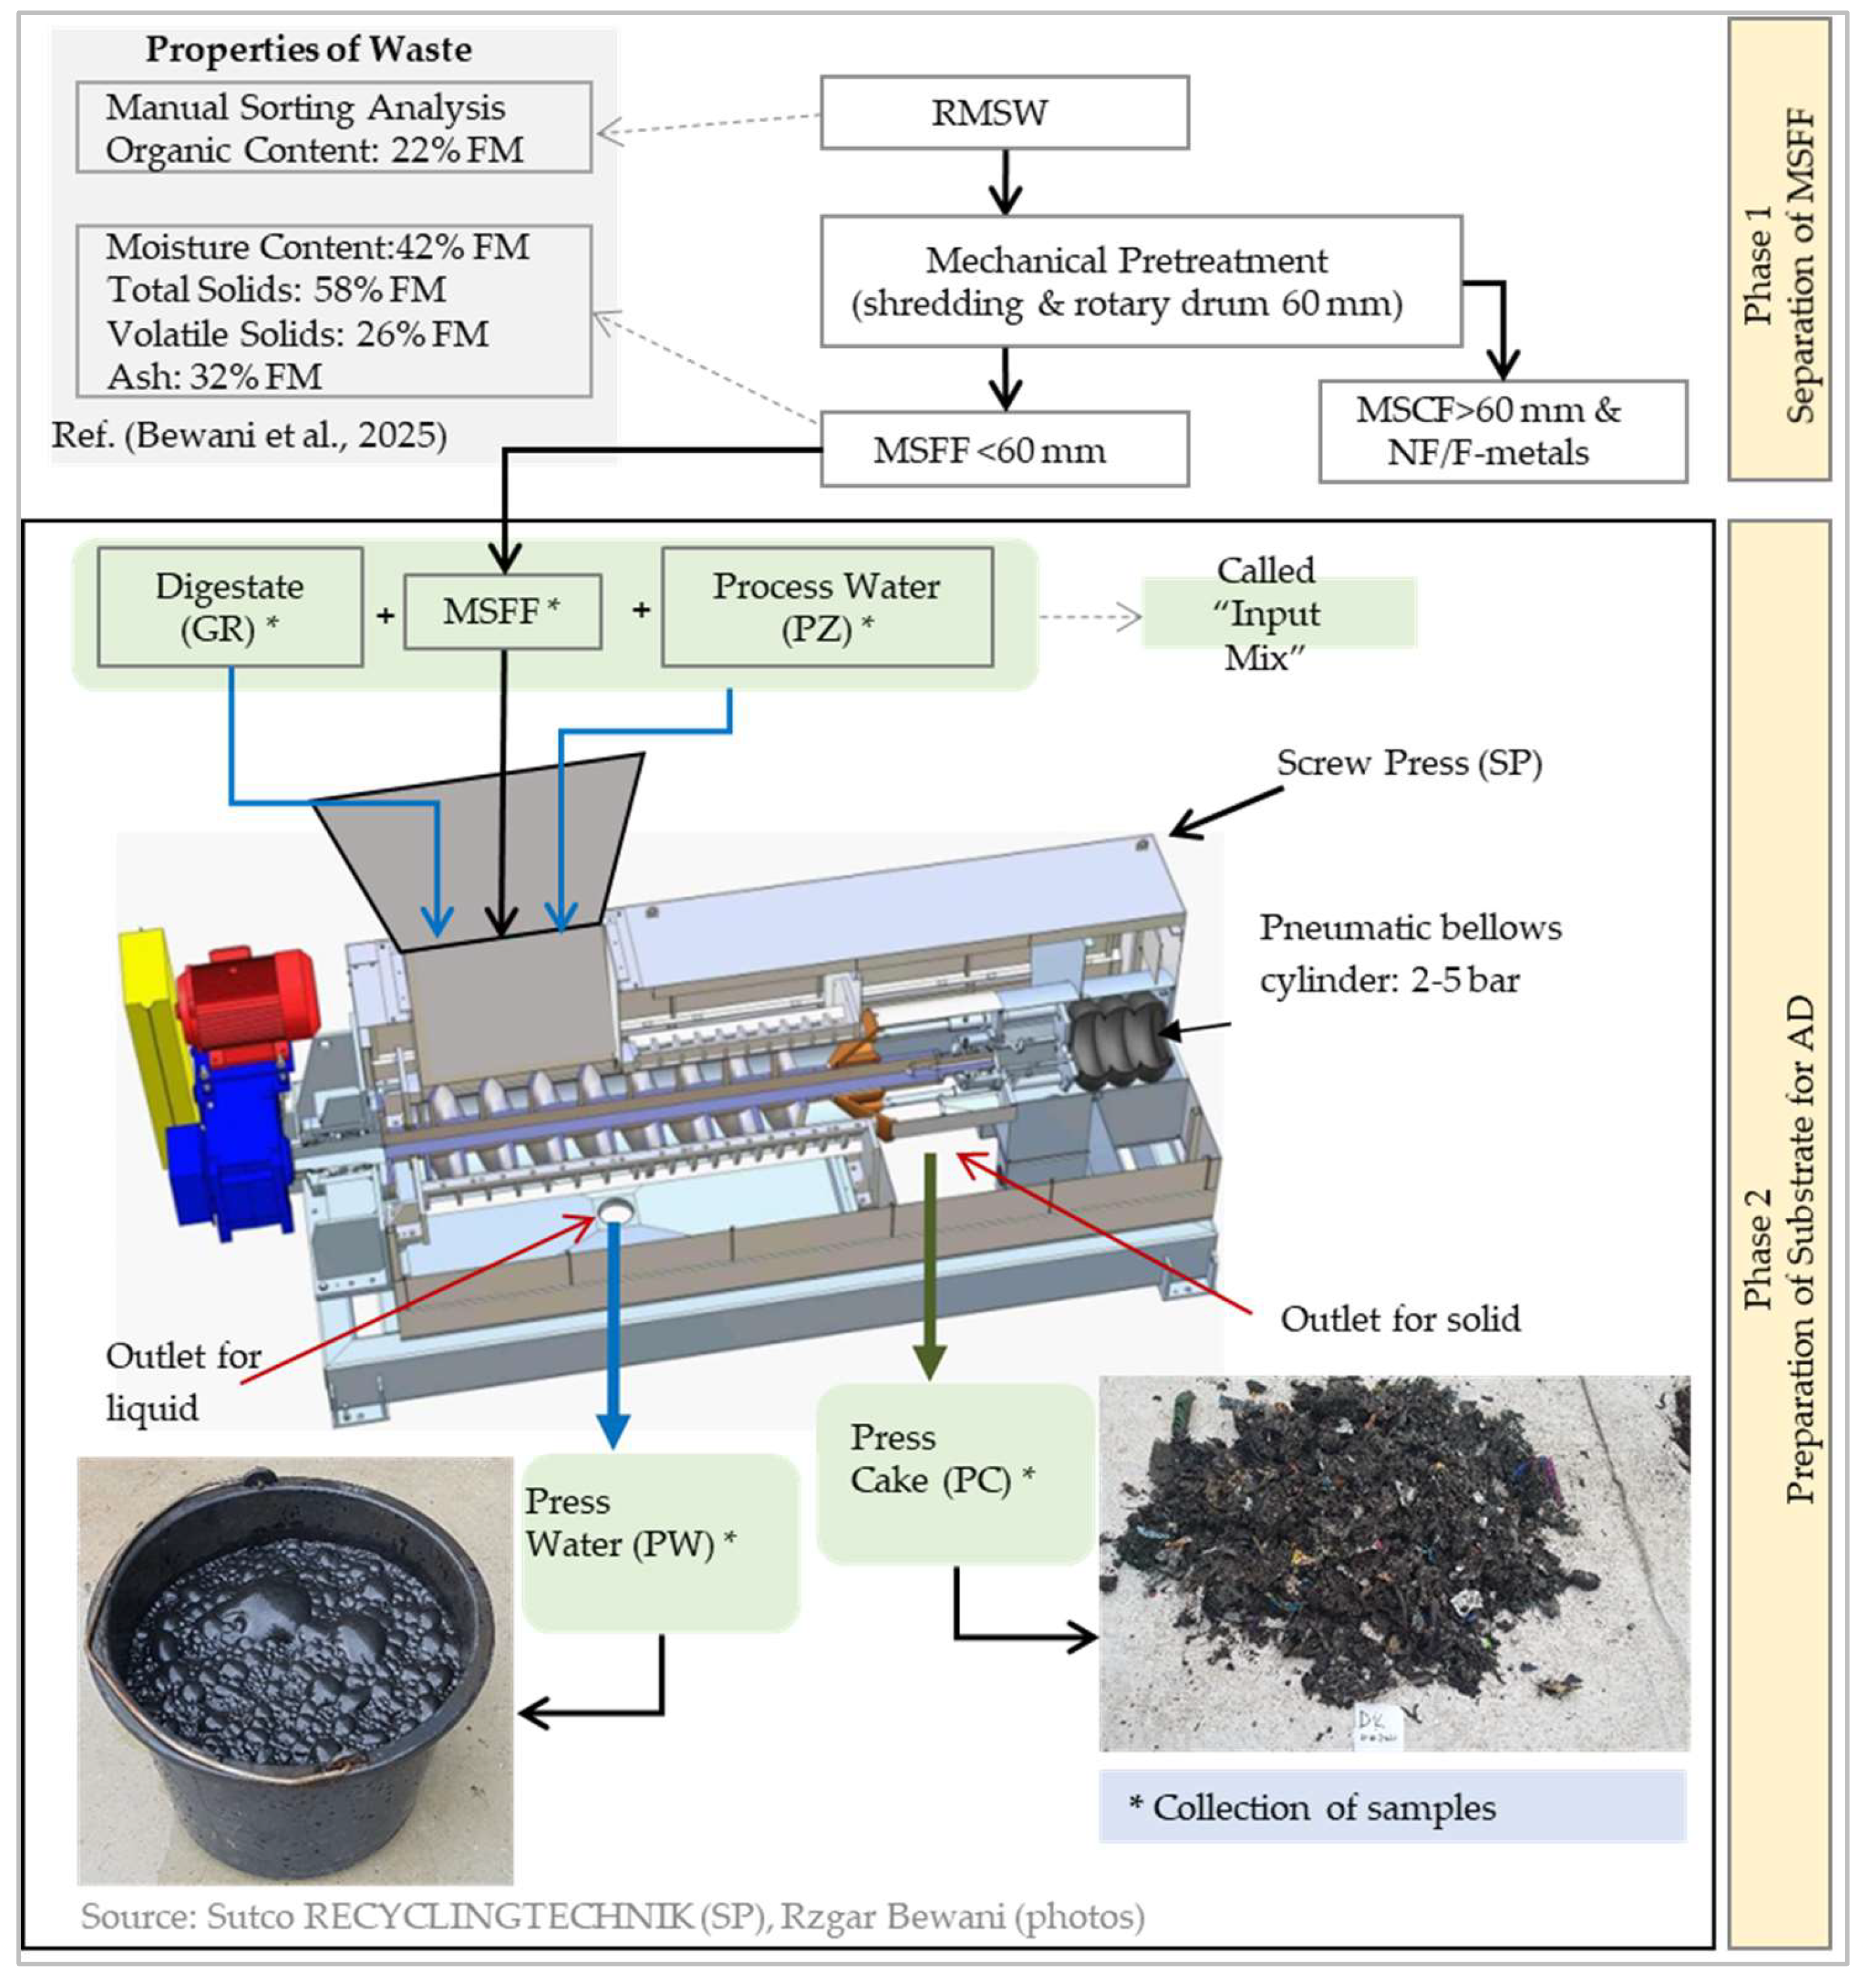
A three-year optimization study was conducted at a mechanical biological treatment (MBT) plant using a screw press to extract organic fractions from mechanically separated fine fractions (MSFF). The study aimed to optimize key operating parameters for the employed screw press (SP) such as pressure, liquid-to-MSFF, feeding quantity per hour, and press basket mesh size to enhance volatile solids and biogas recovery in the generated press water (PW) for anaerobic digestion (AD). Experiments were performed at the full-scale MBT facility to evaluate the efficiency of screw press extraction with other pretreatment methods like press extrusion, wet pulping, and hydrothermal treatment. The results indicated that hydrolysis of the organic fractions in MSFF was the most important factor for improving organic extraction from the MSFF to press water for fermentation. The optimal hydrolysis efficiency was achieved with a digestate and process water-to-MSFF of approximately 1,000 l/ton, with a feeding rate between 8.8 and 14 tons per hour. Increasing pressure from 2.5 to 4.0 bar had minimal impact on press water properties or biogas production, regardless of the press basket size. The highest volatile solids (29%) and biogas (50%) recovery occurred at 4.0 bar pressure with a 1,000 L/ton liquid-to-MSFF. Further improvements could be achieved with longer mixing times before pressing. These findings demonstrate the technical feasibility of the pressing system for preparing an appropriate substrate for the fermentation process and underscore the potential for optimizing the system. However, further research is required to assess the cost-benefit balance.

Keywords: 
;  ;  ;  ;  ;  

1. Introduction

With there currently being ongoing discussions about including incineration plants in the European Union (EU) emissions trading system, the waste fees for thermal treatment are rising [1]. As a result, scenarios predict an increasing demand for mechanical-biological treatment (MBT) with anaerobic digestion (AD) plant capacity [2]. In particular, the wet AD could play a key role due to its promising advantages [3]. One of the critical aspects of this system is the quality of the substrate used during the fermentation stage, which directly impacts the efficiency of biogas production [4]. To address the growing demand in MBT plants with fermentation, optimizing the pretreatment phase, which prepares raw residual municipal solid waste (RMSW) into a suitable substrate for AD, is crucial. This pretreatment is typically divided into two phases as shown in Figure 5: (1) separation of organic-rich fine fractions and (2) preparation of the substrate for AD [4].
In the first phase, organic-rich fine fractions are extracted from RMSW, with mechanical methods such as shredding and screening used to recover fractions typically under 40 to 80 mm. These fine fractions, termed Mechanically Separated Fine Fractions (MSFF), are rich in biodegradable material. This first phase is thoroughly examined in several previous studies including research conducted in Austria [5, 6], Latvia [7, 8], and France [9]. A detailed overview of the MSFF prepared to be used in the present paper is explained in a previous paper [4] and relevant characteristics are shown in phase 1 in Figure 5.
The second phase focuses on converting the MSFF into a substrate with a high organic content for fermentation, aiming to minimize impurities in the generated substrate [10]. Pretreatment methods for substrate preparation are diverse, ranging from dry, wet, thermal, and pressing techniques. Each method offers distinct advantages and limitations. For example, dry processes are often less efficient, yielding low organic recovery into the substrate (P4 in Figure 1) [6, 9, 11]. Recent studies in the EU have highlighted the limitations of using sieving [12] and disc screening for substrate preparation, as these methods often produce substrates with higher impurity levels compared to the screw press, which exhibits high selective efficiency [10].
Wet methods such as pulping and hydrocyclone techniques, rely on gravity to separate organic matter from impurities [13]. It has been adapted for separately collected biowaste in Germany [14, 15]. The practical experience in using wet process for RMSW did not succeed [16]. Wet preparation is sensitive to the input’s total solids content and particle size [14, 16, 17]. Materials with a TS of less than 20% were tested with pulping [11] or hydrocyclone [17, 18]. Given the properties of the MSFF in this study with TS 58% (Figure 5) [4], it is unfeasible to use a pulping system. In addition, a notable limitation of these processes is their reliance on only a portion of the MSFF, which means that a significant amount of organic material may be excluded from substrate preparation. For instance, approximately 50% of the organic content in shredded RMSW is found in fractions between 20 and 60 mm, as noted by [4]. Meanwhile, the literature indicates that fractions below 12 mm have been utilized for substrate preparation (P5 and P6 in Figure 1) [19].
The thermal process involves high-temperature treatment to enhance organic solubilization. Significantly a wide range of temperatures was reported such as 65 °C [20], 50-70 °C [21], and 60-90 °C [22]. For MSW at the MBT plant, [23] reported a positive outcome at about 150 °C at 4 bar using water steam (P3 in Figure 1). However, temperatures exceeding 170 °C have been associated with the formation of undesirable chemical compounds [22]. The optimal retention time for these temperature ranges has yet to be established [24], so that increased biogas yields can offset the energy consumed during heating [25]. The thermal treatment is combined with other pretreatment methods, such as the wet process described above, before being used as feedstock for AD [23].
The pressing process extracts organic matter from MSFF to produce press water (PW). While pressing has long been used in wastewater treatment, its application in MBT plants for RMSW pretreatment is less common. Despite that recent research has evaluated various pressing models at MBT plants, confirming the suitability of PW for AD [26], though optimal operating conditions of pressing remain undefined. Recent PhD research conducted in Austria [11] tested various pressing models at different facilities, with the examined systems illustrated in process P2 of Figure 1. MSFF separated from RMSW were pressed using equipment from various manufacturers, including with or without the addition of water. The study concluded that pressing systems are suitable for preparing substrates for AD. However, similar to other studies [19, 27, 28], it did not identify the optimal operating conditions, which are recommended in the literature [12] for the effective implementation of pressing techniques at MBT plants. This lies in the fact that these studies mainly focus on assessing the PW quality, leaving gaps in identifying ideal operating parameters for MBT plants, which put the evaluation of the process efficiency and its duplication in challenge in the academy and practice.
Concerning Germany, the VMpress system, used at a German MBT plant, operates at 50 bar and has shown high efficiency in producing PW with minimal impurities bar [29]. However, high pressure is associated with increasing operational costs and a high concentration of impurities, which necessitates advanced pretreatment before it can be used in AD. The SP, investigated in this study, is operated with a low pressure of up to 5,5 bar, presenting a promising optimization opportunity for the current 8 MBT plants without an AD unit [4]. This approach could also benefit MBT plants with AD, enabling a shift to a more cost-effective operation, similar to the recent changes made at a German MBT plant [30]. In particular, the SP is a single-stage process, requires less space, and low energy consumption, and demands low maintenance cost [31, 32]. P1 in Figure 1 illustrates the proposed method's simplicity, where a single SP replaces the multiple components and equipment used by other processes.
Previous studies have primarily focused on the quality of PW generated from pressing, without considering the influence of the operating parameters. The results of this work indicated that evaluating PW properties alone, while ignoring the input mix fed to the SP, leads to inaccurate conclusions. For instance, increasing the liquid-to-MSFF diluted the generated PW, resulting in a lower VS concentration. However, this could also wash out more organic matter in the PW when assessing outputs in relation to the input fed to the SP. This paper aims to identify the optimal operating condition of each parameter as outlined in Table 1. Therefore, the experiment design evaluates the operational conditions of the pressing system (SP), including SP pressure, liquid-to-MSFF, feeding rate of input mix to the SP per hour, and SP basket opening. Each operating condition was evaluated with various tests. The quantity of materials mixed was precisely recorded. In addition to PW quality, a balance was created for each test to identify the optimal conditions with regard to the recovery rate of VS, TS, and biogas from the input mix to the PW. This evaluation method simulates real operational conditions, enhancing the replicability of results and simplifying the values for academic assessment purposes. The four parameters evaluated generated PW for each test were Total Solid (TS), Volatile Solid (VS), Dissolved Organic Carbon (DOC), and Biogas Yield (BY). An additional novelty of this research lies in the practical insights gained from approximately three years of operation at a full-scale MBT plant, demonstrating smooth, uninterrupted performance. This bridges gaps in the literature by providing practical insights into the successful application of pressing systems in MBT plants, a key aspect that remains underexplored in previous studies.
Figure 1. Overview of the process flow diagram for preparing the substrate for anaerobic digestion, in the literature.
Preprints 149147 g001
References: P1: This study, P2 & P4: [11], P3: [23], P5: [19], P6: [33].
Abbreviations: AD: Anaerobic Digestion, CF: Coarse Fractions, HF: Heavy Fractions, LF: Light Fractions, MSFF: Mechanically Separated Fine Fractions, RMSW: Residual Municipal Solid Waste, SL: Swimming Layer.

2. Results

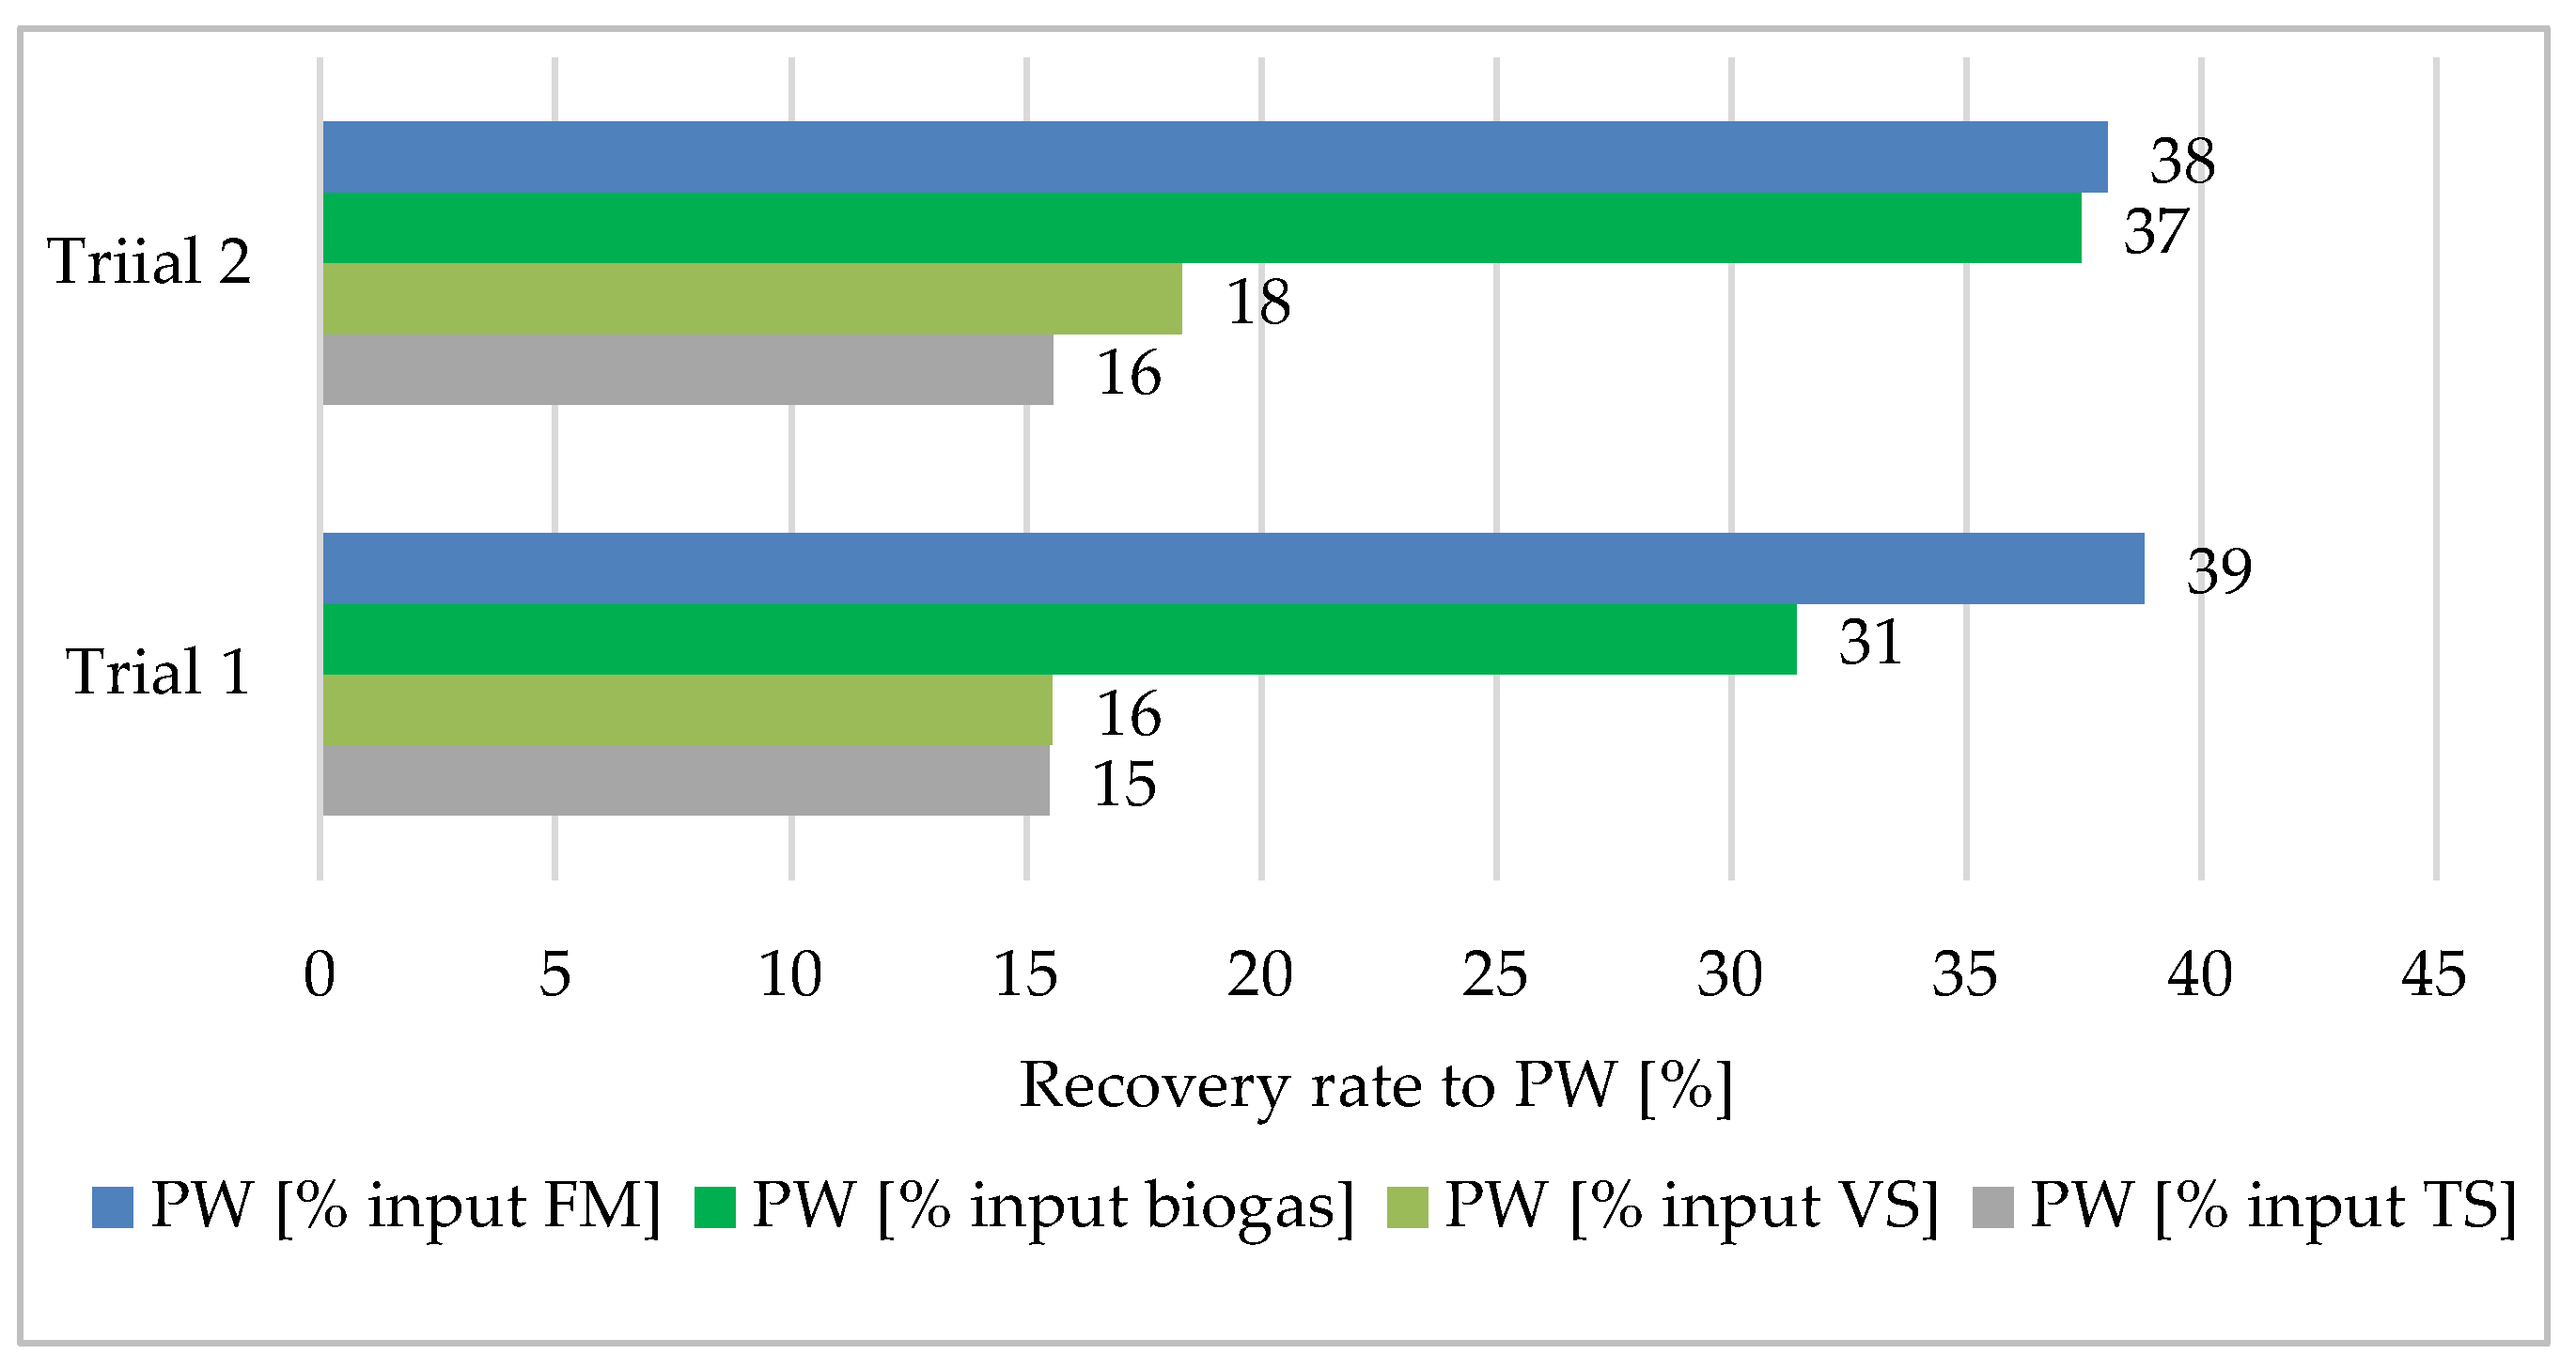
2.1. Impact of Screw Press Pressure on Press Water Properties and Recovery Rate from MSFF

The range of specific SP pressures investigated in this section is summarized in Table 3 (PE1). The effects of pressure were tested while keeping other operating parameters constant, and the influence was evaluated based on the quality of the generated PW. The characteristics of PW samples produced under various SP pressures indicated that a minor increase in pressure did not result in a significant change in PW quality. To illustrate the improvements more clearly, the results from 2.5 and 4.0 bars were analyzed. Table 1 (PE1) presents the properties of the generated PW in terms of the parameters investigated in the laboratory: TS, VS, DOC, and BY.
As pressure forces the input mixture against the openings of the SP basket, the mixture passes through the mesh into the PW. A minor increase in TS (from 14.8 to 15.4) and VS (from 8.4 to 10.6) was observed when pressure increased from 2.5 bar (Trial 1) to 4 bar (Trial 2). These values are in the range of 9-24% TS and 6-16% VS reviewed for several pressing experiments in the literature [4]. The VS in all trials is comparable to the PW generated from organic waste (11% FM) [34]. However, experiments using a piston press at 250 bars have resulted in a clear increase in TS, reaching 35% FM. This increase is due to more minerals being pressed through the 8 mm press basket. While this method offers an advantage in terms of VS content, the PW requires additional treatment steps before being fed to AD [35]. In contrast, the method used in this study does not necessitate such additional treatment.
The PW from T1 showed a higher DOC concentration of 1000 mg/l compared to T2
Similarly, biogas yields were 7% higher for T1, probably caused by the input mix properties. The efficiency of the SP is assessed by examining the recovery rate from the input mix to the PW. To identify the pressure that demonstrates better efficiency, overall mass and energy balances were developed for Trials 1 and 2 (Figure 2).
The recovery rate from the input mix to PW was assessed across four parameters: fresh mass (FM), total solids (TS), volatile solids (VS), and biogas yield (BY):
Fresh Mass (FM): FM represents the ratio of PW generated from the total quantity of the input mix. At a pressure of 2.5 bars, 39% of the FM from the input mix was converted into wet PW, while 61% remained in the solid Press Cake (PC). Increasing the pressure to 4 bars, with other parameters held constant, did not alter this ratio. The 1% higher FM for Trial 1 is attributed to the volume of GR and PZ per ton of MSFF, which was 790 liters per ton compared to 750 liters for Trial 2.
Several factors, including the origin and properties of MSFF, pretreatment methods, and applied pressure influence the distribution of fresh mass between PW and PC. For instance, using organic waste resulted in a higher recovery of mass into the PW (55%) [14]. In addition, pressing fractions smaller than 40 mm, separated from RMSW, at high pressure of 40 bars, achieved a recovery of 67% of the input mix into PW [11]. However, it is important to consider the preparation of the input mix when interpreting these values.
Total Solids (TS) and Volatile Solids (VS): A direct correlation exists between TS and VS content. Increasing the pressure from 2.5 to 4 bars raised the TS recovery rate from 15% to 16% and the VS recovery rate from 16% to 18%. These results are lower than the 22% TS and 24% VS recovery rates reported in other experiments [4]. The variation is likely due to the higher pressure of 4.5 bars applied in [4]'s study.
Biogas: The findings indicate a positive relationship between pressure and biogas recovery. At 4 bars, it was possible to recover 37% of biogas from the input mix for AD. This recovery rate is more than double that achieved with a dry preparation process without pressure, which yielded only 17% [36]. The process flow diagram of the dry method is presented as P4 in Figure 1.
In summary, pressing a mixture of MSFF with GR and PZ using the PW at 4 bars resulted in a higher recovery rate compared to pressing a mixture of MSFF<40 and tap water with a piston press at over 40 bars. The piston press achieved a biogas recovery rate of 30-34%, which is 4% lower than the results of this study. Additionally, the SP produced PW with very low inert content [4]. Conversely, the high-pressure piston with pressure above 40 bars transformed a greater percentage of inert material from waste into the generated PW [11]. The process flow diagram of the piston press is presented under P2 in Figure 1.

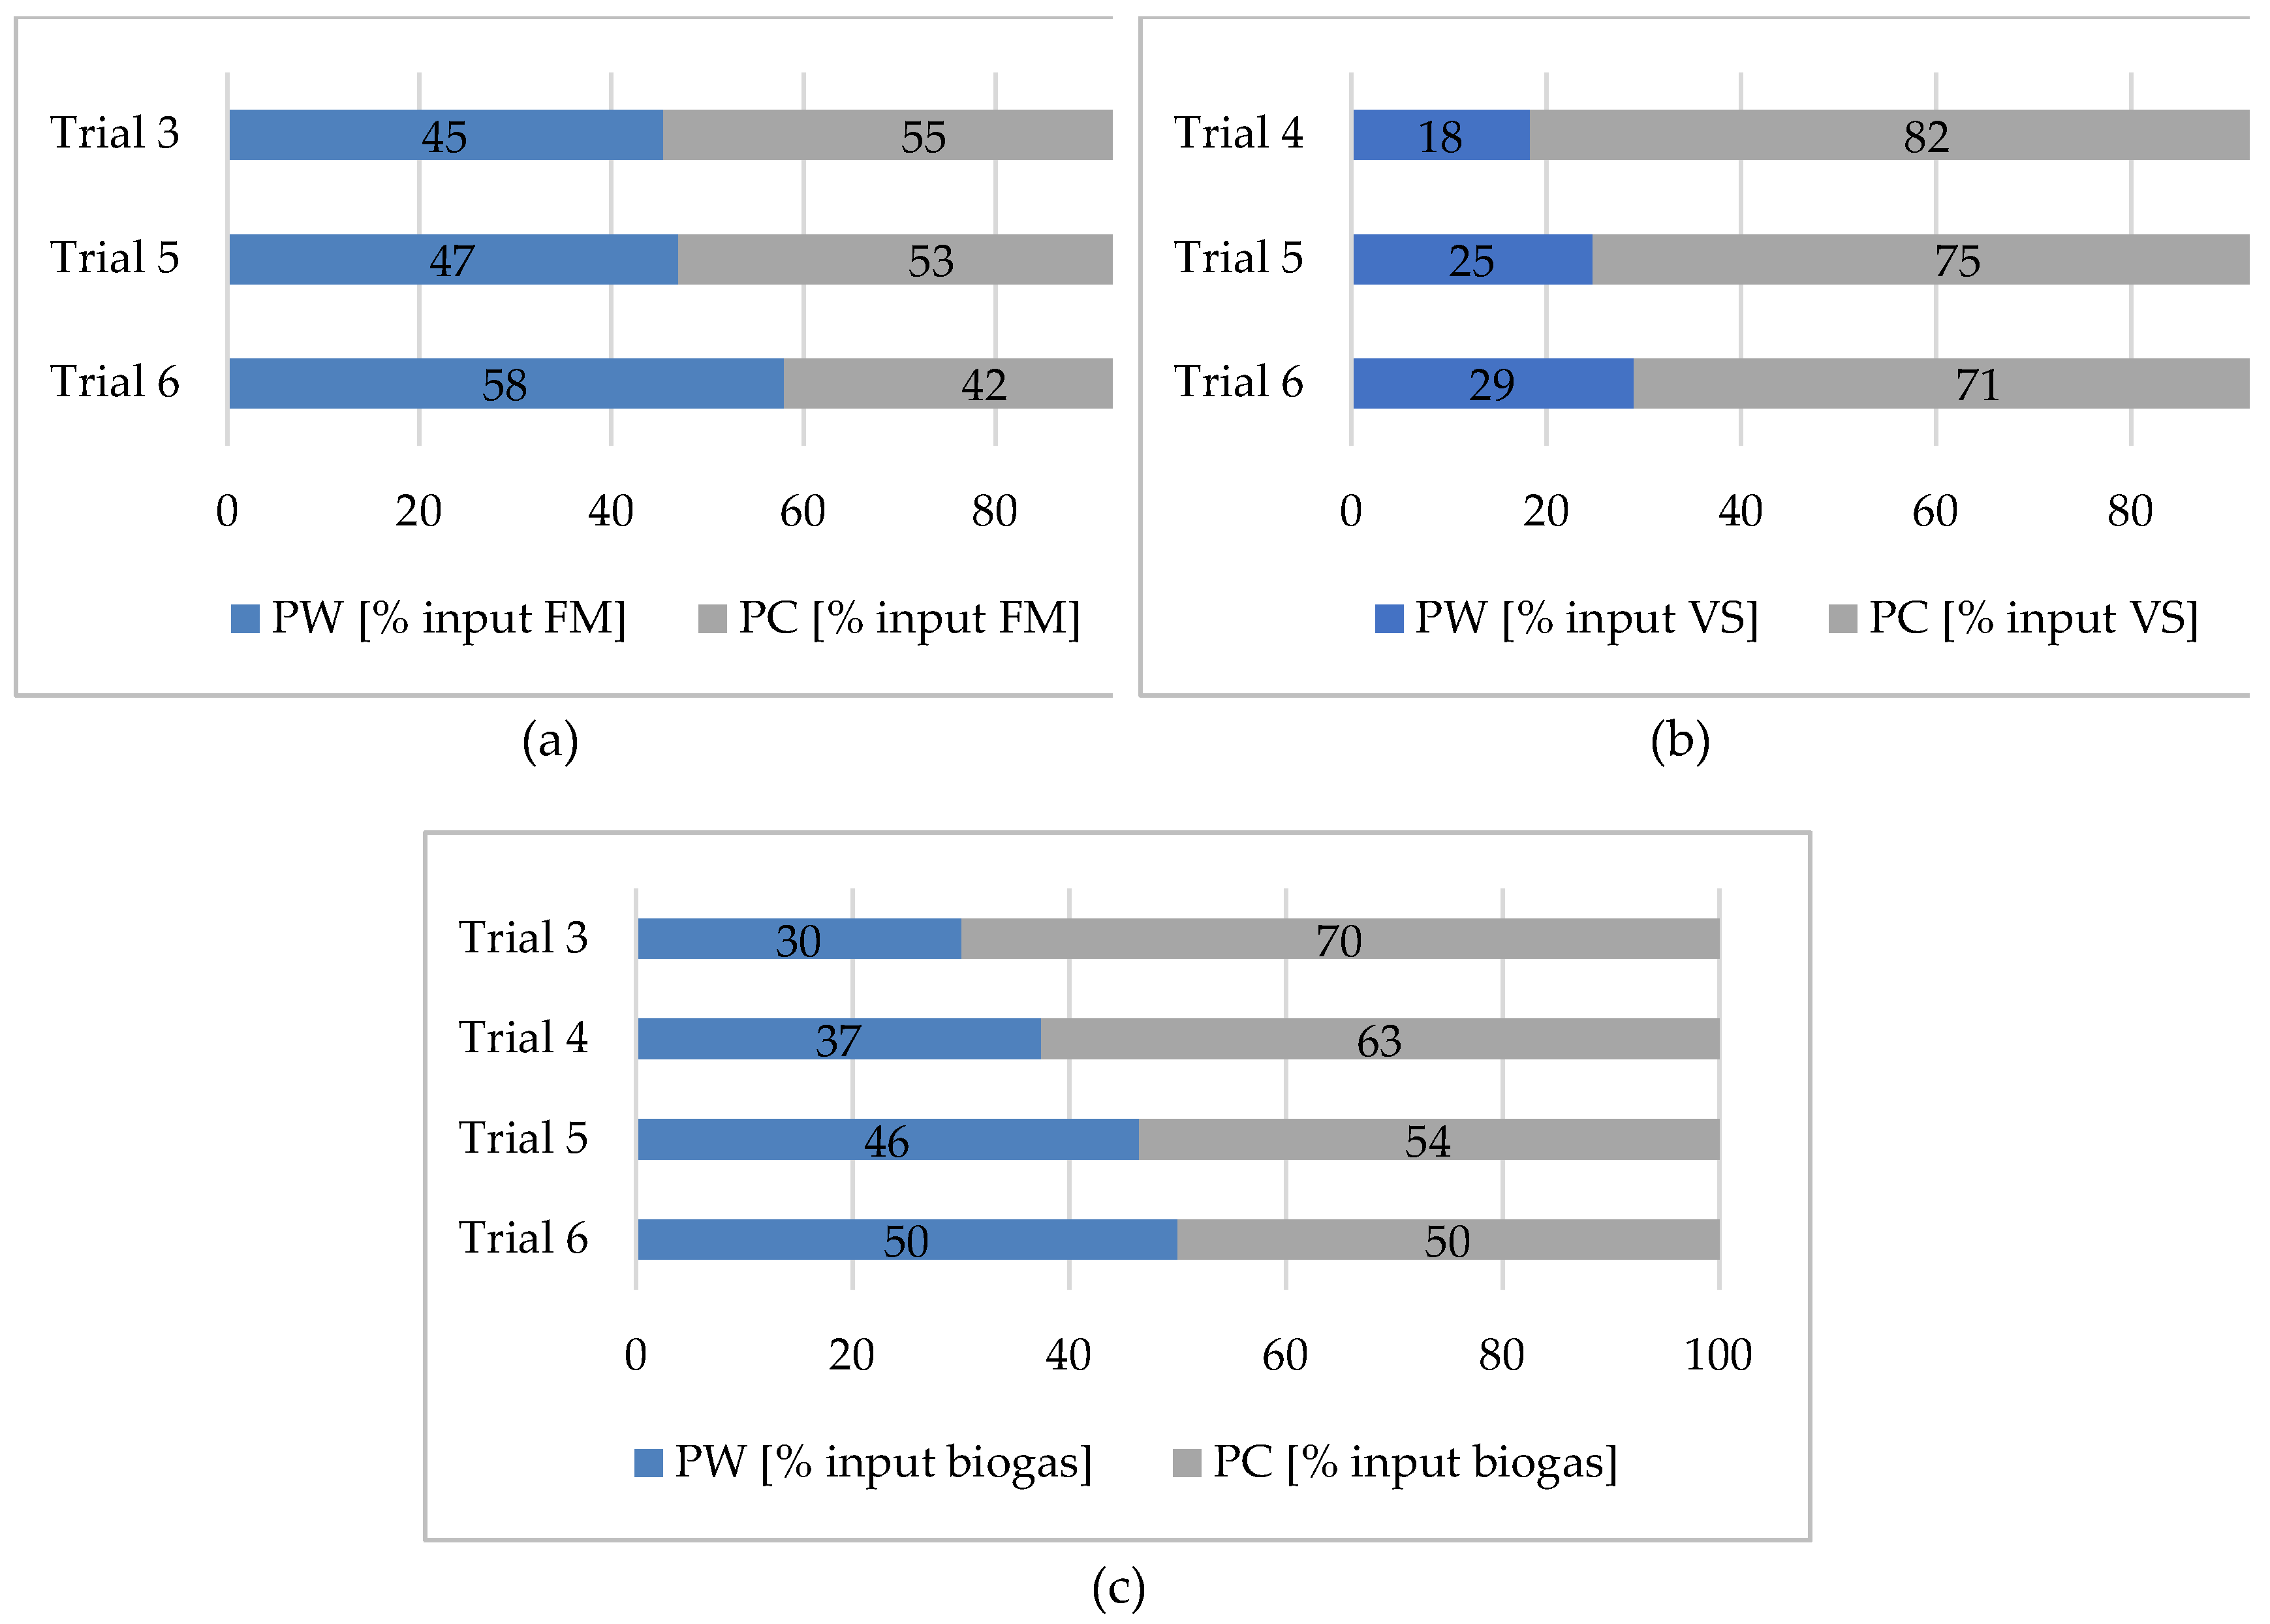
2.2. Impact of the Mixing of GR and PZ per ton MSFF on Press Water Properties and Recovery Rate from MSFF

The trials conducted in PE2 and summarized in Table 3 were designed to investigate the impact of the added GR and PZ to the MSFF (l/ton) on the characteristics of the PW. This operating parameter was recommended for testing in the literature [14]. For these trials, different ratios, ranging from 690 to 1050 l/ton were examined.
The mass of MSFF was measured using two methods: the standard front-end wheel loader for each batch fed to the shredder during mechanical pretreatment, and more accurately via a conveyor belt scale, which was permanently installed to continuously measure the mass of MSFF directly before the SP. An integrated system was used to regulate the volume of GR and PZ, ensuring the correct proportion was maintained [37]. The GR:PZ ratio was kept constant at 85:15 across all trials, and its impact is not discussed in this paper as it remained unchanged. Additionally, separate experiments conducted as part of the broader research project confirmed that no significant effect from PZ:GR ratio was observed, probably due to its low share in the total liquid volume (15%). All trials were carried out using the same waste material from the project area, with consistent operating parameters, such as pressure and perforated press basket configuration in the SP. This controlled setup allowed for an accurate assessment of the influence of the GR+PZ-to-MSFF on PW quality and quantity.
The results with regard to PW quality from the PE2 trials are summarized in Table 1. Due to the minor increase of liquid per ton MSFF of Trials 3 to 5, no significant changes in PW quality were detected concerning TS content, which ranged from 18% to 15.4%. This finding may support the conclusions of [14, 38], who could not draw definitive conclusions from varying the water-to-waste or when conducting experiments with or without water addition, even though they used separately collected biowaste. It is therefore suggested that there is a need to change the volume of liquid per ton MSFF significantly to see the effect on the PW properties.
To clarify the impact, a gradual change in the PW properties in terms of different water additions is closely assessed. Increasing the GR+PZ-to-MSFF from 690 to 750 l/ton increased VS load in PW. A similar improvement was observed for biowaste [14]. Further increasing the amount of water to 1050 reduced the VS concentration from 10% to 7% FM. This could be interpreted as a dilution effect due to the higher volume of liquids. Despite that, the recovery rate improved with regard to PW. An improvement was evidenced for biogas yield when increasing the GR+PZ from 750 (trial 6) to 1000 l/ton (trial 7). Further increases of liquid did not significantly enhance biogas yield. However, the recovery rate of biogas continued to improve and reached 50% for 1050 l/ton. Furthermore, despite the considerable fluctuation in biogas yields across all trials, ranging from 554 to 729 l/kg VS, these yields were substantially higher than those from the dry screening process, which ranged from 290 to 320 l/kg VS (Table 1).
The PW generated in this study is considered favorable in terms of its TS content (12-17%), which is comparable to that of substrates generated by other wet process components such as pulping and the use of hydrocyclones. In contrast, significantly higher TS levels (55-65%) were observed in substrates produced via dry screening [11]. There was considerable fluctuation in biogas yields of the PW across all trials, ranging from 554 to 729 l/kg VS. These yields were substantially higher than those from the dry screening process, which ranged from 290 to 320 l/kg VS (Table 1).
The recovery rate from the input mix to PW was evaluated across three parameters: fresh mass (FM), volatile solids (VS), and biogas yield (BY).
Fresh Mass: As the experimental method involved a wet process, a key factor influencing the distribution of fresh mass to PW and PC was the water content of the input mix after pressing. With an approximately constant TS content of 58% in the MSFF (Figure 5) measured across all trials, it was observed that the higher the GR+PZ-to-MSFF, the greater the water content in the input mix. For instance, the water content of the input mix was 62%, 63%, and 67% for 690, 740, and 1000 l of GR+PZ per ton MSFF, respectively. Similarly, the water content of the input mix varied between 58% and 75% [11].
As expected, increasing water content resulted in a higher recovery rate based on the FM of the input mix (Figure 3 (a)). At a 690 l/ton ratio, 45% of the input mix was pressed through the mesh into the PW, while 55% remained as solid PC. A higher efficiency was achieved at 1,050 l/ton ratio, with 58% of the input mix recovered as PW for AD. Moreover, the maximum tested volume of 1,350 l/ton in the laboratory showed a 25% improvement over the previously highest 58% winning rate of 1,050 l/ton at full-scale plant operation, resulting in a recovery rate of 77% of the input mix into PW.
Summary: Given the relatively stable water content and water-holding capacity of the MSFF throughout the year, a minimum of 700 l/ton is required for the input mix to exceed the maximum water retention capacity of the MSFF (60%) and allow for PW spillage after adding to MSFF without applying pressure. This ensures that all organic fractions in the MSFF are adequately exposed to water, facilitating the dissolution of organic matter during the application of pressure. However, this 700 l/ton was also found to be optimal for processing pure biowaste [31]. Further investigation with ratios exceeding 1,050 l/ton is recommended to assess potential improvements in recovery efficiency.
Abbreviations: PW: Press Water, PC: Press Cake
Volatile Solids: The primary source of VS is the MSFF, with only a minor contribution from GR and PZ [31]. This is because the recirculated GR has already undergone degradation in the AD process, while PZ is highly diluted and constitutes only 15% of the liquid added to the MSFF. However, an important function of both GR and PZ is to enhance the dissolution of organic matter from the MSFF into the PW. In particular, the GR, which is heated, contributes positively to the hydrolysis of organic matter and produces a high-temperature PW. This PW reaches a temperature similar to that in the AD reactors, promoting microbial activity, as microorganisms are already adapted to this temperature and can more efficiently convert VS into biogas [31].
As shown in Figure 3 (b)), when 750 l/ton was mixed, only 18% of the total VS is recovered in the PW, while the remaining 82% was discharged unvalorized in the PC, undesirable state of affairs. A gradual improvement in recovery rate was observed with increasing GR and PZ volumes, with the highest transfer rate of 29% achieved at 1,050 l/ton MSFF. This result is considered very good for MSFF from RMSW. In comparison, using a screw press with additional treatment steps for pure biowaste resulted in recovery rates of 60-80% [38]. This suggests that there is potential for improvement in RMSW recovery, despite its lower organic content.
The positive impact of liquid addition on washing out more VS into the PW was demonstrated with both sizes of the SP press basket5 - mm and 10 mm - as detailed in the project report published in German [37].
Biogas: The change in biogas yield based on the mixing of GR+PZ and MSFF is shown in Table 3. Overall, the biogas yields were similar across all trials, except for trial 3 involving 690 l/ton, which showed significant deviation. This variation is most likely due to personal or equipment errors in the laboratory. Increasing the GR+PZ-to-MSFF by 250 l/ton (from 750 to 1000 l/ton) did not increase biogas yield. [14] explained that this could be because the additional water washed out more minerals during the washing process when pure biowaste was washed with tap water, and these minerals do not contribute to biogas production. Despite the unchanged biogas yield, the overall biogas recovery rate improved when increasing the GR and PZ volume (Figure 3(c)).
The lowest recovery rate of 30% was determined at the minimum GR+PZ-to-MSFF in trial 3, while the highest recovery rate of 50% was achieved in trial 6. In the literature, biogas recovery from separately collected biowaste ranged from 30% to 35% [14]. The recovery of VS and biogas are positively correlated; an increase in VS transfer corresponds to a higher biogas extraction rate. For instance, increasing the volume of GR and PZ from trial 5 to trial 6 resulted in a 4% improvement in both.

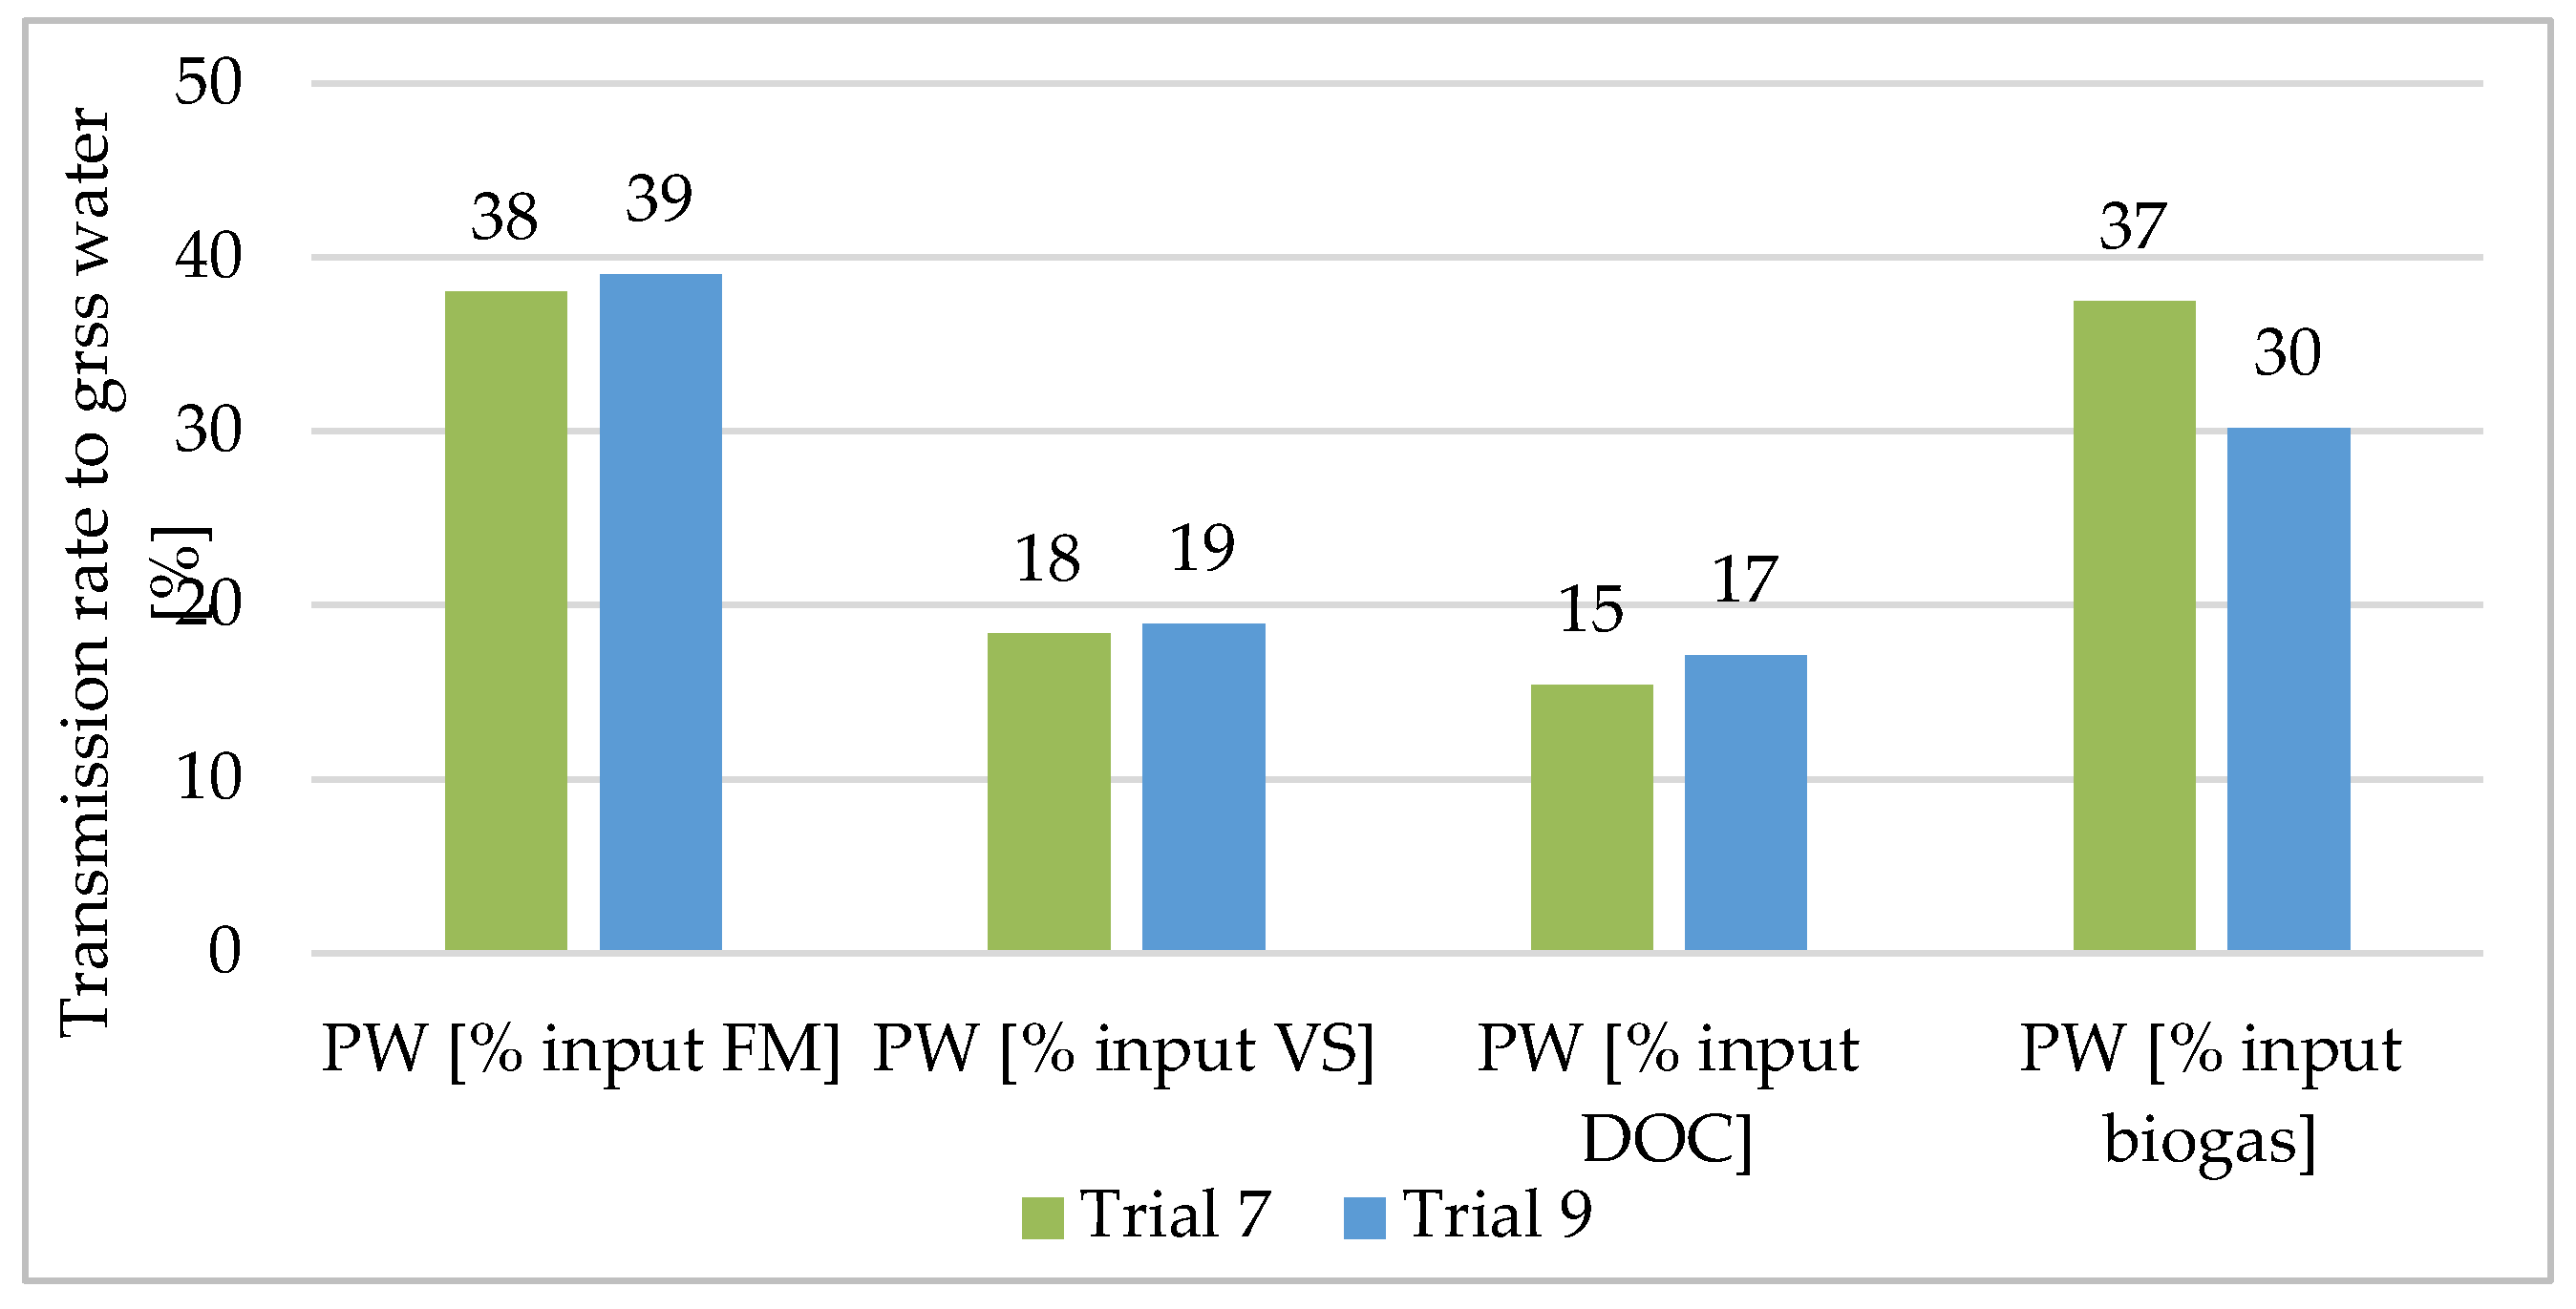
2.3. Impact of Feeding Rate of Input Mix on Press Water Properties and the Recovery Rate from MSFF

As described in Section 2.2 (Experimental Setup), the materials are fed separately into the hopper of the SP without prior hydrolysis mixing. Hydrolysis occurs both in the hopper and during the pressing stage in the SP. Increasing the feeding rate (ton/hour) requires more torque from the SP to process the input mix, which shortens the contact time of the materials in both the hopper and the SP. Therefore, the hydrolysis period is highly dependent on the feeding rate.
To quantify the impact of this parameter on the SP’s efficiency, three trials were conducted with varying discharge rates in PE3, while the pressure and GR+PZ-to-MSFF remained constant (Table 3 (PE3)).
As the discharge rate per hour increases, the TS of the PW also tends to increase, from 15% (at 8.8 tons/hour) to 20% (at 10.2 tons/hour). This suggests that more fine fractions are washed out into PW. When considering only the hydrolysis effect, one would expect that a higher feeding rate would result in a decrease in the VS load in the PW, since less organic matter would be dissolved. However, this reduction was not observed in Trials 7 (10.58% FM) and 9 (10.58% FM) (Table 3, PE3). This may be because higher discharge rates expose more VS to the liquid phase, which may then be pressed into the PW, offsetting the shortened hydrolysis time. Therefore, both of these factors - feeding rate and hydrolysis time - must be considered together. As in PE1 and PE2, the VS values in these trials were consistent with the range reported by [4].
Regarding biogas yield and DOC, there was some fluctuation, but a clear trend emerged: both DOC (from 10,240 to 7,970 mg/L) and biogas yield (from 729 to 389 L/kg VS) tended to decrease with increasing feeding rates in Trials 10 and 11 (Table 1, EP3). The dry screening process also indicated a lower biogas yield, ranging from 290 to 320 L/kg VS, for the prepared substrate [11].
Because a constant volume of GR and PZ was added for the same MSFF (which has a constant TS content), the water content of the input mix was 35%. With the same pressure applied, a similar distribution of the input mix between (PW and PC were observed for Trials 7 (8.8 tons/h) and 9 (10.2 tons/h), with 38–39% of the material going to PW and 61–62% to PC. The extraction rates of VS and DOC followed the concentration trends observed in the PW properties, as shown in Table 1. The same VS levels in Trials 7 and 9 resulted in similar VS recovery rates. However, an 8% improvement in DOC concentration in PW (from 7,320 to 7,970 mg/L) resulted in a corresponding increase in DOC recovery (from 15% to 17%).
Furthermore, 37% of the input biogas (calculated based on the biogas yield of the materials fed to the SP) was transferred to PW at a feeding rate of 8.8 tons/h, while a minimum recovery rate of 30% was observed at a feeding rate of 10.2 tons/h. However, results from separately collected biowaste showed no significant difference in biogas recovery with changing feeding rates [31]. This can be attributed to the high moisture content of pure biowaste, which is sufficient for the hydrolysis process. Regardless of feeding quantity, biogas transfer to PW could be further improved by increasing the pressing time through adjustments to the SP pressure and torque [31, 37].

2.4. Impact of Press Basket Size on Biogas Production

As mentioned in Section 2.3, changing the press basket on-site was practically unfeasible for conducting trials. To assess the impact of different press basket openings, operational data from the Erbenschwang MBT plant were evaluated. When the SP was initially commissioned, it operated with a 10 mm press basket, which was later reduced to 8 mm and ultimately replaced with a 5 mm mesh opening. During these periods, weekly samples of PW were collected and analyzed over the course of 30 months, while daily biogas volumes were also measured.
As expected, and in contrast to [11]’s findings, which did not consider the impact of the press basket size, the laboratory analysis of PW indicated that the TS and inert content have remained nearly constant for the tested press baskets. Given the press basket size used in this study, the PW produced did not require further preparation. However, for a larger press basket, an additional screening step was necessary, as reported by [11]. The Particle Size Distribution (PSD) of the inert content in PW generated with 5 mm mesh size has been discussed in a previous study [4]. However, while reducing the press basket size was typically associated with a lower feeding rate per hour for pure organic waste [31], no relationship was detected for MSFF.
Press Basket Size and Biogas Production
The biogas production data highlights a minor difference in the weekly and daily biogas volume. The daily biogas volume was lowest (840 m³/day, 5,513 m3/week) when the 10 mm press basket was used. This suggests that the increased TS content in the PW resulting from the use of a bigger basket is primarily composed of inert minerals, which do not contain high biogas potential. In contrast, the use of the 8 mm and 5 mm baskets increased from 50 - 60 m³/day in biogas production to 890 - 900 m3/day (Table 2). These results can be better understood by considering the PSD of the MSFF as explained by [4]. When the press basket size was changed from 10 mm to 8 mm, particles in the 8 - 10 mm range in MSFF were excluded. These particles contained a higher VS content, which likely contributed to the higher biogas yield observed with the smaller basket sizes. On the other hand, particles in the 8 - 6 mm range had extremely low VS concentrations, so excluding them by using the 5 mm press basket did not result in any further changes to biogas production.
Energy Consumption and Operational Considerations
Another important consideration is the relationship between press basket size and energy consumption for operating the SP. For organic waste, the SP used in this study consumed 0.6–0.8 kWh/ton of treated waste when operating with a 20 mm press basket. This energy consumption increased to around 1 kWh/ton when using the 5 mm press basket [31]. Additionally, fine mesh sizes are associated with higher torque and greater wear on the mechanical components of the equipment. This underscores the importance of considering the economic implications of press basket size, especially when processing MSFF, which has a more heterogeneous composition compared to homogeneous organic waste.

3. Materials and Methods

3.1. Characteristics of the Waste Used for Experiments

The yearly manual sorting analysis for the RMSW collected from households in the project area showed that it is comprised of 22% biodegradable fractions. Of this, 70% was kitchen & food waste and 30% was hardwood, which does not contribute significantly to biogas generation. The results of the laboratory analyses of the MSFF are presented in Figure 5. The TS and VS contents were found to be 58% and 26%, respectively, based on Fresh Mass (FM) [4, 39]. This corresponds to 67% of the MSFF used for the pressing experiments in the form of VS and water. These values represent the average properties of the waste delivered to the plant. The MSFF used for experiments in this study did not fluctuate significantly from these average properties. Detailed characteristics of the RMSW and MSFF can be found in the previous paper [4].

3.2. Experimental Setup

The experiments were carried out during regular treatment operations in the full-scale Erbenschwang MBT. Figure 5 illustrates the experimental setup used in this study. The MSFF, Digestate (GR), and Process Water (PZ), referred to as the “input mix”, are fed into the SP's hopper. The pressure applied separates the input mix into liquid PW and solid PC. The primary objective of the trials was to investigate the factors affecting the distribution of the organic content and biogas potential of the input mix across output streams, namely PW and PC. Since PW serves as the main feedstock for AD, this study investigated the optimal operating conditions to enhance its quality in terms of biogas yield.
Abbreviations: MSFF: Mechanically Separated Fine Fractions, MSCF: Mechanically Separated Coarse Fractions, RMSW: Residual Municipal Solid Waste

3.3. Investigated Operating Parameters

The most relevant parameters affecting the quality of the generated PW during the operation of the SP were identified. These include the quality of the Input mix, pressure, the added GR and PZ to MSFF, press basket openings, and the feeding rate to the SP. To determine the optimal operating conditions, each parameter was tested individually and in multiple replications, as summarized in Table 3.
For instance, to test the effect of press pressure, all other parameters were kept constant while the SP was operated at varying pressures between 2.5 and 4,0 bars in Experiment 1 (EP1). Additionally, various volumes of GR and PZ per ton of MSFF were also investigated in EP2. There is a relationship between the feeding rate per hour and the contact time between the solid MSFF and liquids (GR and PZ) tested in EP4. Running the SP at a constant pressure while increasing the feeding rate leads to prolonged contact time, resulting in more hydrolysis of organic matter.
Since it was not practically feasible to change the press basket during experiments, the impact on the biogas generation was assessed over a longer period using operational data. Furthermore, the influence of MSFF properties on PW quality was explored in a previous paper [4].
Table 3. Summary of the operating parameters tested in the pressing experiments of this work (investigated parameters are highlighted in grey in each PE).
Trial Quality of MSFF Pressure
(bar)
Added liquid (2)
to MSFF (l/ton)
Feeding rate
of MSFF (ton/h)
Press basket
(mm)
EP (1) Investigated (1)
Organic content
Particle size
4,5 Constant Constant 5
EP1 T1 Constant 2.5 790 - 5
T2 4.0 750 - 5
EP2 T3 Constant 4 690 - 5
T4 4 750 - 5
T5 4 1000 - 5
T6 4 1050 - 5
EP3 T7 Constant 4 750 8.8 5
T8 4 740 9.0 5
T9 4 750 10.20 5
EP4 T10 Constant - - - 10
T11 8
T12 5
(1)
EP: evaluated in a previous paper [4].
(2)
A mix of digestate (GR) recirculated from AD and process water (PZ), which is used water from cleaning purposes.

3.4. Sampling and Laboratory Analysis

Before the trial, a sampling plan was developed based on German standards [40] and VDI 4630 [41]. Sub-samples of solid (MSFF, PC) and liquid (GR, PZ, PW) materials were collected every 30 and 15 minutes, respectively, for each experiment. The materials included in the sampling program are indicated with a star “*” in Figure 5. For MSFF and PC, sub-samples were combined into a pile and, following the quartering method, an adequate quantity was packed for laboratory analysis at the University of Rostock. For PW, GR, and PZ, sub-samples were taken after mixing to ensure a representative sample for analysis, leading to accurate results. The materials were analyzed immediately after sampling in order to minimize storage time.
Each sample was dried at 105 °C to determine the Total Solid (TS) content and the dry samples were subsequently placed in an oven at 550 °C to measure the Volatile Solid (VS) content. These tests followed the guidelines outlined in EN 14346:2007 and DIN EN 15169:2007, respectively. A Biogas Potential (BGP) test was conducted to assess the biogas yield of each material. Additionally, the dissolved organic carbon (DOC) content, which reflects the organic content if the samples, was measured according to DIN EN 1484:1997. A comprehensive overview of the laboratory analysis is discussed in a previous paper [4] and illustrated in Figure 6.

4. Discussion

4.1. Maximum Biogas Recovery into Substrate for Anaerobic Digestion Based on Waste Mass

To determine the optimal operating setup of the SP for recovering the maximum biogas proportion from the input mix into PW, an overview of the trial results is presented in Table 4. The biogas recovery rate was calculated by dividing the total biogas volume by the amount of MSFF fed to the SP, yielding the biogas production per ton of MSFF. The results ranged from 29 to 55 m³/ton MSFF. Given that 62% of the RMSW consists of MSFF, the biogas volume per ton of RMSW could also be calculated, with values ranging from 18 m³/ton (minimum) to 34 m³/ton (maximum). Additionally, the biogas volume per ton VS was determined, considering the VS content of MSFF (26% FM) as shown in Figure 5. The biogas production per ton of VS ranged from 82 to 157 m3/ton.
Since RMSW is a heterogeneous waste stream with varying VS content, it is recommended to discuss biogas recovery rates based on VS content rather than raw RMSW. A comprehensive discussion on the properties of RMSW in the project area, compared with other studies from Germany, Europe, and globally, can be found in a previous paper [4].
Based on the results, the most significant parameter affecting the efficiency of the SP can be identified. The lowest biogas recovery rate (82 m³/ton) was observed in Trial 9, where the maximum feeding rate was applied. As discussed earlier, this is attributed to the shortened hydrolysis time in the SP. Reducing the feeding rate by 12% to 9 tons/h led to a 16% increase in the recovery rate, which rose to 95 m³/ton. Therefore, the feeding rate is considered a key influential factor in terms of SP efficiency, due to its correlation with hydrolysis time. This impact can be minimized to nearly negligible levels by adjusting the GR+PZ-to-MSFF to approximately 1000 l/ton when increasing the feeding of the SP from 8.8 (Trial 5) to 14 ton/h (Trial 6) ratio. Additional laboratory tests by mixing the liquid and MSFF for 5 min, 10 min, and 15 minutes before pressing showed the positive impact of increasing the mixing time.
The most important parameter is the volume of GR and PZ added per ton of MSFF. The minimum volume of 690 L/ton resulted in the second-lowest biogas extraction rate of 84 m³/ton, slightly lower than the previous setup of 90 m³/ton [4]. The least influential parameter was found to be the applied pressure. Increasing the pressure from 2.5 to 4.0 bars improved the recovery rate from 103 to 115 m³/ton, indicating that the effect of pressure increase is relatively minor. Further laboratory investigation revealed that the optimum pressure was 4.5 bars. Any increase in pressure beyond this point did not yield any additional benefits.
Regular operation with the setup used in Trials 2, 4, and 7 resulted in an average biogas recovery rate of 115 m³/ton. This setup included a pressure of 4.0 bars, a GR+PZ-to-MSFF of 750 L/ton, and a feeding rate to the SP of approximately 9 tons/h. This configuration can be further optimized to 157 m³/ton by increasing the volume of GR and PZ per ton of MSFF while keeping the other parameters constant. The increase in recovery rate was primarily due to improved hydrolysis, as the additional liquid volume helped dissolve more organic matter into the PW. In summary, although the highest efficiency was observed in Trial 5, increasing the GR and PZ volume per ton of MSFF to 1350 L/ton in the laboratory further enhanced the recovery rate by 25%. Therefore, this study recommends testing these laboratory results at large-scale MBT plants to determine the optimal relationship for full-scale operations.
In the European Union, approximately 77 million tons of biodegradable material are collected in RMSW bins each year [42, 43]. However, much of this material is not made use of resulting in a significant loss of potential energy resources. According to Trial 5 of this study, it would be possible to produce up to 12 billion cubic meters (m³) of biogas from this waste. This would correspond to 879 million m³ of biogas from the 5.6 million tons of organic waste that ends up in RMSW in Germany alone [44, 45].

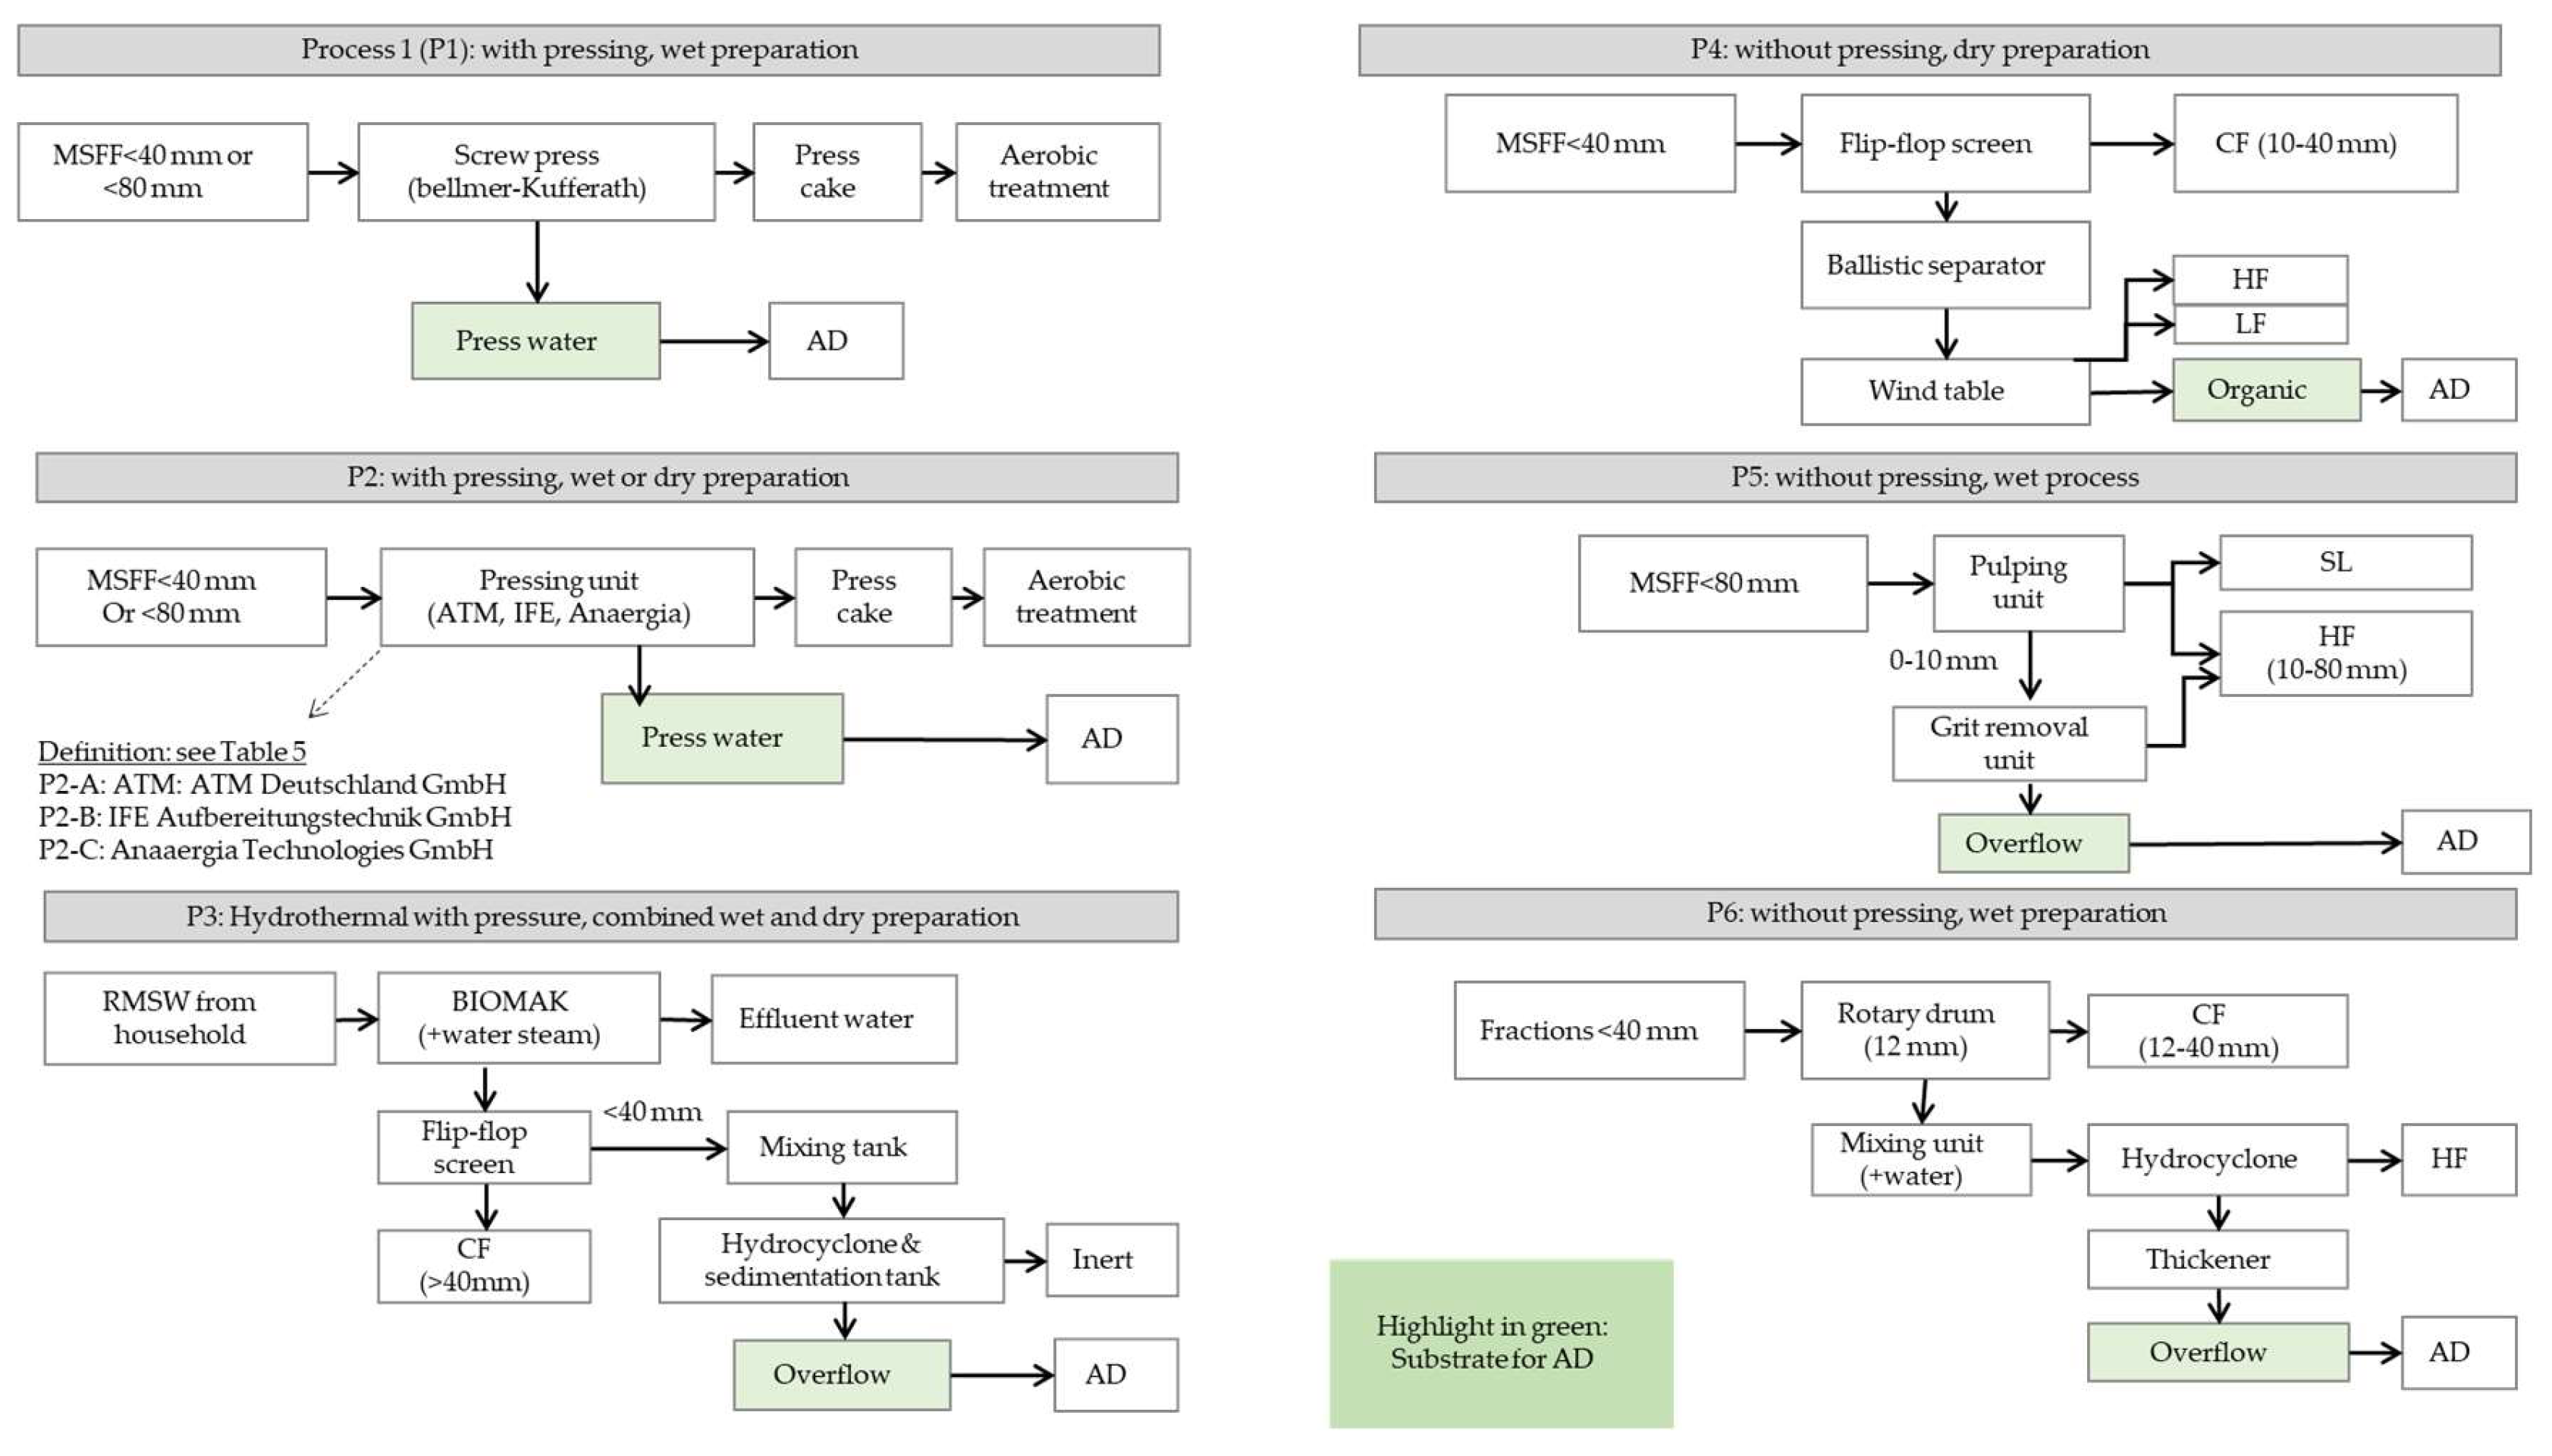
4.2. . Comparison of the Recovery Rate of Organic Matter and Biogas to Substrate for Anaerobic Digestion as reported in the Literature

To evaluate the results of this study, the biogas recovery is compared with values reported for other methods, including high-pressure piston press, thermal methods, and dry methods without pressure. These methods are explained in Section 1.1 and are represented as P2, P3, and P4 in Figure 1(A), respectively. For this comparison, the results from Trials 5 and 6 are selected, as they provide the optimal operating conditions for biogas recovery.
The comparison is summarized in Table 5. In terms of fresh mass (FM), the results of this study are comparable to those obtained with regards to other wet processes, such as the piston press. As expected, the addition of water in the wet processes led to higher recovery rates in P1 (47%), P2-A/B (49–67%), and P3 (80%) compared to the dry process in P4, where no water was added. However, it is important to note that the recovery rate depends on the volume of water added and the pressure used. These factors must be considered in terms of cost when evaluating the efficiency of these methods.
Similar to the findings of [10], this study also demonstrates the high selectivity of the SP system. This is evident from the low TS transfer rate to the PW, which is only 23%. This is the lowest value observed among all the methods compared, with TS transfer rates ranging from 25% (P2-B) to 53% (P3). The low TS transfer rate is crucial, as it helps minimize the deposition of minerals in the AD reactors, reducing the need for regular desludging.
Unlike the transfer rate for TS, the extraction of VS is relatively similar across all processes, ranging from 24% (for P4) to 38% (for P3). The results of this study, which fall within the range of 25–29%, are on the lower end of this spectrum. The exception is P2-C, which has a much higher extraction rate of 54% VS, due to the exceptionally high pressure of 250 bars applied [35]. Given that processes P2 to P4 involve multiple steps in the pretreatment phase, compared to the single-step SP method used at the EVA MBT plant in this study, the 25–29% extraction rate can be considered a very efficient approach.
The ultimate goal of all processes is to maximize biogas production. The last column of Table 5 presents the biogas recovery rate from the input mix to the substrate for AD. The lowest efficiency was observed for the dry method in P4, with biogas recovery ranging from 17% to 23%, as discussed by [11]. Given the relatively low biogas recovery for P4, this suggests that the substrate produced by this method contains a high proportion of impurities. In contrast, the substrate from the present work achieved a higher biogas extraction rate of 46–50%. This is evident from the increase in biogas yield, which rose from 364 L(N)/kg VS in the input mix to 613 L(N)/kg VS in the produced PW. This increase reflects the washing of organic matter into the PW. While a low recovery rate of biowaste was observed for P2-A, the highest recovery was attained for P2-C, which involved an exceptionally high pressing force.
In summary, the results demonstrate that the SP can produce PW with low TS and impurity content [4]. Furthermore, the high biogas yield of the PW in this study, compared to other substrates, supports the conclusion that the organic matter in the PW is readily available for degradation and conversion into biogas [10]. Two key factors are crucial in selecting the most suitable process for practical applications. First, pressing at low pressure produces PW with very low impurity levels. Consequently, it does not require any additional treatment and can be fed directly into AD reactors. Second, pressing at extraordinarily high-pressure results in PW with a high concentration of impurities, which necessitates advanced pretreatment before it can be used in AD.
Finally, a cost-benefit analysis is essential to evaluate the balance between production costs and biogas generation, as the latter can be considered a potential revenue or savings source.

5. Conclusions

From the discussions above, it can be concluded that the application of the screw press (SP) tested in this study optimizes the operation of mechanical biological treatment (MBT) plants by enhancing the recovery of volatile solids (VS) and biogas from residual municipal solid waste (RMSW) in the press waste (PW), which serves as the primary feedstock for anaerobic digestion (AD). The experiments demonstrated that the most influential factor affecting SP efficiency in terms of recovery rate was the volume of liquids (GR and PZ) relative to the mechanically separated fine fractions (MSFF). This parameter allows sufficient hydrolysis to dissolve organic matter. The maximum extraction rate of biogas - 50% of the input—was achieved at a GR+PZ-to-MSFF of approximately 1,000 L/ton. However, this can be increased to 77% by raising the volume to 1,350 L/ton, corresponding to a biogas production of 57 m³/ton of MSFF and 157 m³/ton of VS in the RMSW collected from households. Increasing the feeding rate to the SP showed minimal impact when adjusting the liquid-to-MSFF. Additionally, the SP pressure range of 2.5 to 4.0 bars did not lead to a clear conclusion due to its minor influence on efficiency. Despite these variables, the promising efficiency of the SP and its contribution to optimizing MBT plant operations suggest that it could be effectively implemented in existing MBT plants. Furthermore, the energy consumption of the SP under different operating setups, as discussed in this paper, warrants closer evaluation.

Author Contributions

Conceptualization, R.B.; methodology, R.B.; formal analysis, R.B.; investigation, R.B. and T.B.; data curation, R.B.; writing—original draft preparation, R.B..; writing—review and editing, R.B., J.S. and A.N.; supervision, A.N. and M.N. All authors have read and agreed to the published version of the manuscript.

Funding

This research received no external funding. This data collection was conducted based on the outcome of a Research and Development project funded by the Deutsche Bundesstiftung Umwelt (German Federal Environmental Foundation).

Data Availability Statement

Data are contained within the article.

Acknowledgments

The corresponding author, Rzgar Bewani, would like to express his sincere gratitude to all those who supported this research, including the operator of the Erbenschwang MBT plant, the technical laboratory at the University of Rostock, Germany (Ms. Kersten Eckermann) and the Leichtweiß Institute at the University of Braunschweig, Germany (Dr. Eng. Kai Münich, Ms. Jolanthe Bambynek, and Mrs. Anja Jenk).

Conflicts of Interest

The funding sponsor has no role in the design of the study; in the data evaluation; in the writing of the manuscript, and in the decision to publish the results. The role of the funding sponsor was in the data collection and analyses.

References

  1. Wirtschaftsbetriebe Duisburg,Abfallentsorgungsgebührensatzung Gültig ab 01.01.2025 (Lesefassung), 2025. Accessed: Jan. 24 2025. [Online]. Available: https://​www.wb-duisburg.de​/​Downloads/​index.php .
  2. L. de Baere and B. Mattheeuws, "Anaerobic digestion of msw in EUROPE," 2017.
  3. R. Campuzano and S. González-Martínez, "Characteristics of the organic fraction of municipal solid waste and methane production: A review," Waste management (New York, N.Y.), vol. 54, pp. 3–12, 2016. [CrossRef]
  4. R. Bewani, A. Nassour, T. Böning, and M. Nelles, "Expansion of mechanical biological residual treatment plant with fermentation stage for press water from organic fractions; involving a screw press to prepare the suitable press water for anaerobic digestion," 2025.
  5. M. Meirer, W. Müller, and A. Bockreis, "Pretreatment of MSW for co-digestion in waste water treatment plants," in Waste Management and The Environment VIII, Valencia, Spain, 2016, pp. 277–288.
  6. M. Meirer, W. Müller, and A. Bockreis, "Mechanische Abtrennung biogener Reststoffe aus Restabfall für die Co-Vergärung in Faultürmen kommunaler Kläranlagen," Österr Wasser- und Abfallw, vol. 69, 9-10, pp. 397–404, 2017. [CrossRef]
  7. D. Arina, "Comparison of municipal solid waste characteristics after separation by star and drum screen systems," 4th International Conference CIVIL ENGINEERING`13 Proceedings Part I ENVIRONMENT AND ENVIRONMENTAL EFFECTS, 2013.
  8. D. Arina, J. Kalnacs, R. Bendere, and A. Murasovs, "Mechanical pre-treatment for separation of bio-waste from municipal solid waste: case study of district in Latvia," in Engineering for Rural Development, 2019.
  9. R. Bayard, J. d. A. Morais, G. Ducom, F. Achour, M. Rouez, and R. Gourdon, "Assessment of the effectiveness of an industrial unit of mechanical-biological treatment of municipal solid waste," Journal of hazardous materials, vol. 175, 1-3, pp. 23–32, 2010. [CrossRef]
  10. T. L. Hansen, J. C. La Jansen, A. Davidsson, and T. H. Christensen, "Effects of pre-treatment technologies on quantity and quality of source-sorted municipal organic waste for biogas recovery," Waste management (New York, N.Y.), vol. 27, no. 3, pp. 398–405, 2007. [CrossRef]
  11. M. Meirer, Physikalische Aufbereitung von Restabfällen zur Co-Vergärung in Abwasserreinigungsanlagen. Leopold-Franzens-Universität Innsbruck, 2018. Accessed: Apr. 15 2024.
  12. A. Cesaro, V. Cieri, and V. Belgiorno, "Press-extrusion pretreatment of the organic fraction of municipal solid waste for enhanced methane production," J Mater Cycles Waste Manag, vol. 23, no. 1, pp. 130–138, 2020. [CrossRef]
  13. BTA International GmbH, BTA – biotechnical recycling. [Online]. Available: https://​bta-international.de​/​ (accessed: Nov. 11 2024).
  14. J. Effenberger, L. Jahn, and V. Kuehn, "Co-digestion of press liquids of source-sorted municipal organic waste in anaerobic sludge treatment of municipal wastewater treatment plants," Water science and technology : a journal of the International Association on Water Pollution Research, vol. 73, no. 12, pp. 3080–3086, 2016. [CrossRef]
  15. A. Blank and E. Hoffmann, "Upgrading of a co-digestion plant by implementation of a hydrolysis stage," WASTE MANAGEMENT & RESEARCH, vol. 29, no. 11, pp. 1145–1152, 2011. [CrossRef]
  16. M. S. Romero-Güiza, M. Peces, S. Astals, J. Benavent, J. Valls, and J. Mata-Alvarez, "Implementation of a prototypal optical sorter as core of the new pre-treatment configuration of a mechanical–biological treatment plant treating OFMSW through anaerobic digestion," Applied Energy, vol. 135, pp. 63–70, 2014. [CrossRef]
  17. A. Jank, W. Müller, S. Waldhuber, F. Gerke, C. Ebner, and A. Bockreis, "Hydrocyclones for the separation of impurities in pretreated biowaste," Waste management (New York, N.Y.), vol. 64, pp. 12–19, 2017. [CrossRef]
  18. K. Osei and R. Andoh, "Optimal Grit Removal and Control in Collection Systems and at Treatment Plants," in World Environmental and Water Resources Congress 2008, Honolulu, Hawaii, United States, 2008, pp. 1–7.
  19. Lopes, Alice do Carmo Precci, "Mechanical pretreatment of residual waste for codigestion in wastewater treatment plants," 2021.
  20. K. Schu, Ed., Sand im Getriebe der Vergärung? International congress, CH-Solothurn, Schweiz, 2008.
  21. H. GE, P. D. Jensen, and B. Damien J., "Pre-treatment mechanisms during thermophilic–mesophilic temperature phased anaerobic digestion of primary sludge," Water Research, vol. 44, no. 1, pp. 123–130, 2010. [CrossRef]
  22. H. Carrère et al., "Pretreatment methods to improve sludge anaerobic degradability: a review," Journal of hazardous materials, vol. 183, 1-3, pp. 1–15, 2010. [CrossRef]
  23. J. Ayala, B. MacKenzie, and J. McWilliams, "Thermal hydrolysis integration in anaerobic digestion process-biomethane (ECONWARD, BIOMAK)", Personal communication, Aug. 2024.
  24. J. Mata-Alvarez, J. Dosta, M. Romero-Güiza, X. Fonoll, M. Peces, and S. Astals, "A critical review on anaerobic co-digestion achievements between 2010 and 2013," Renewable and Sustainable Energy Reviews, vol. 36, pp. 412–427, 2014. [CrossRef]
  25. S. Luste, H. Heinonen-Tanski, and S. Luostarinen, "Co-digestion of dairy cattle slurry and industrial meat-processing by-products--effect of ultrasound and hygienization pre-treatments," Bioresource technology, vol. 104, pp. 195–201, 2012. [CrossRef]
  26. F. Fantozzi and C. Buratti, "Anaerobic digestion of mechanically treated OFMSW: experimental data on biogas/methane production and residues characterization," Bioresource technology, vol. 102, no. 19, pp. 8885–8892, 2011. [CrossRef]
  27. S. E. Nayono, Foodwaste as a co-substrate in a fed-batch anaerobic biowaste digester for constant biogas supply, 2009.
  28. Nowak and C. Ebner, "Verwertung organischer Reststoffe in Faulbehältern kommunaler Kläranlagen," Österr Wasser- und Abfallw, vol. 68, 3-4, pp. 108–117, 2016. [CrossRef]
  29. D. Novarino and M. C. Zanetti, "Anaerobic digestion of extruded OFMSW," Bioresource technology, vol. 104, pp. 44–50, 2012. [CrossRef]
  30. Abfallzweckverband Südniedersachsen, MBA - Verfahrensbeschreibung: Phase I: Mechanische Aufbereitung (MA) der Abfälle Phase II: Biologische Behandlung (BA) in der Trockenvergärung. [Online]. Available: https://​www.as-nds.de​/​mba/​verfahren/​index.html (accessed: Oct. 5 2024).
  31. Sutco Recyclingtechnik GmbH, "Forschungs- und Entwicklungs-Vorhaben Energieeffiziente Bioabfallverwertung = EnBV: Abschlussbericht Anschlussvorhaben," 2015. Accessed: Apr. 15 2024.
  32. EVA mbh and Universität Rostock, "FuE-Vorhaben „Presswasservergärung Restabfall = PV-R“: An die Deutsche Bundesstiftung Umwelt (DBU)," Deutsche Bundesstiftung Umwelt (DBU), 2017. Accessed: Apr. 25 2023.
  33. Lopes, Alice do Carmo Precci and A. Bockreis, "Mechanical pretreatment of municipal solid waste for co-digestion in wastewater treatment plants," 2021.
  34. D. Bolzonella, P. Pavan, S. Mace, and F. Cecchi, "Dry anaerobic digestion of differently sorted organic municipal solid waste: a full-scale experience," Water science and technology : a journal of the International Association on Water Pollution Research, vol. 53, no. 8, pp. 23–32, 2006b. [CrossRef]
  35. Anaergia Technologies GmbH, Separator FSP - Anaergia Technologies - Komponenten für eine nachhaltige Zukunft (EN). [Online]. Available: https://​www.anaergia-technologies.com​/​en/​products/​separation/​separator/​ (accessed: Oct. 19 2024).
  36. M. Meirer, W. Müller, and A. Bockreis, "Innovative Abfallaufbereitung: Erzeugung hochwertiger Substrate für Biogas- & Kläranlagen: Poster. Österreichische Abfallwirtschaftstagung 2017," 2017.
  37. M. Nelles, T. Böning, R. Bewani, and A. Nassour, FuE-Vorhaben „Presswasservergärung Restabfall“: Endbericht (Entwurf vom 15.2.2022), 2022. Accessed: Apr. 25 2023.
  38. A. Bernstad, L. Malmquist, C. Truedsson, and J. La Cour Jansen, "Need for improvements in physical pretreatment of source-separated household food waste," Waste management (New York, N.Y.), vol. 33, no. 3, pp. 746–754, 2013. [CrossRef]
  39. R. Bewani, T. Böning, A. Nassour, and M. Nelles, "Increasing the Efficiency of Mechanical-Biological Residual Waste Treatment through the Fermentation of the Liquid after Pressing the Organic Fractions," in 13. WISSENSCHAFTSKONGRESS Kreislauf- und Ressourcenwirtschaft: In Zusammenarbeit mit der Fakultät für Bau- und Umweltingenieurwesen der Technischen Universität Wien, Technischen Universität Wien, 2024, pp. 145–150. Accessed: Apr. 15 2024.
  40. J. Wagner, T. Kuegler, J. Baumann, M. Günther, and E. Finke, "Bericht zur Fortschreibung der Sortierrichtlinie 1998: Bericht zur Fortschreibung der Richtlinie zur einheitlichen Abfallanalytik in Sachsen," Freistaat Sachsen, 2014. Accessed: Apr. 15 2024. [Online]. Available: https://​publikationen.sachsen.de​/​bdb/​.
  41. Fermentation of organic materials Characterisation of the substrate, sampling, collection of material data, fermentation tests: VDI4630, 4630, VEREIN DEUTSCHER INGENIEURE, Nov. 2016.
  42. E. Favoino, M. Giavini, and S. A. Di Parco Monz, "Bio-waste generation in the EU - current capture and future potential," 2020. Accessed: 07.2023. [Online]. Available: https://​biconsortium.eu​/​downloads/​bio-​waste.
  43. European Compost Network, Bio-Waste Management plays a Keyrole in Bioeconomy - European Compost Network. [Online]. Available: https://​www.compostnetwork.info​/​policy/​circular-​economy/​bio-​waste-​management/​ (accessed: Feb. 25 2024).
  44. H.-J. Dr. Dornbusch et al., "Vergleichende Analyse von Siedlungsrestabfällen aus repräsentativen Regionen in Deutschland zur Bestimmung des Anteils an Problemstoffen und verwertbaren Materialien: Abschlussbericht," INFA GmbH, Ahlen; ARGUS GmbH, Berlin; Witzenhausen-Institut GmbH, Witzenhausen; Ingenieur-Büro Manfred Kanthak, Berlin, 2020. Accessed: Mar. 16 2021. [Online]. Available: http://​www.umweltbundesamt.de​/​publikationen.
  45. Umweltbundesamt, Residual waste in Germany has nearly halved in 35 years. [Online]. Available: https://​www.umweltbundesamt.de​/​en/​press/​pressinformation/​residual-​waste-​in-​germany-​has-​nearly-​halved-​in-​35 (accessed: Feb. 25 2024).
Figure 2. Impact of SP pressure on the recovery rate of Fresh Mass (FM), Total Solids (TS), Volatile Solids (VS), and Biogas from Input Mix to Press Water, tested during the PE1.
Preprints 149147 g002
Figure 3. Impact of added GR and PZ per ton MSFF on the recovery rate of (a) fresh mass (FM), (b) volatile solids (VS), and (c) biogas from input mix to press water, tested during the PE2.
Preprints 149147 g003
Figure 4. Impact of feeding quantity per hour to the screw press on the recovery rate of fresh mass (FM), total solids (TS), volatile solids (VS), and biogas from input mix to press water, tested during the PE3.
Preprints 149147 g004
Figure 5. Experimental program implemented in this work at the Erbenschwang MBT plant to evaluate the optimal performance of the screw press.
Preprints 149147 g005
Table 1. Characteristics of the generated PW from the pressing experiments with the Screw Press.
Trial TS [% FM] VS [% FM] DOC [mg/l] BY [l(N)/kg VS]
PE1 T1 14.87 8.43 8360 605
T2 15.38 10.58 7320 563
PE2 T3 18.02 10.50 4200 357
T4 15.38 10.58 7320 562
T5 18.73 10.31 10920 554
T6 14.75 7.18 9270 613
PE3 T7 15.38 10.58 7320 562
T8 18.12 5.83 10240 729
T9 20.87 10.58 7970 389
Literature review
RMSW (1) Pressing 9-24 6-16 - 450-760
Biowaste (2) Pressing 10-28 7-25 - 50-458
RMSW (3) Pressing 35 21 - 660
RMSW (4) Dry Screening 55-65 29-49 - 290-320
Biowaste (5) Wet Pulping 12-17 10-12 - 770-810
    (PE1, PE2, PE3) Results from this study.
(1)
Wet process with pressing: Pressing MSFF separated from RMSW [4].
(2)
Wet process with pressing: Pressing biowaste [4].
(3)
Wet process with pressing (250 bars): Pressing MSFF separated from RMSW [11, 35].
(4)
Dry process without pressing: Screening MSFF without pressure [11].
(5)
Wet process without pressing: Biowaste in pulping and hydrocyclone [11].
Table 2. Impact of different mesh sizes of the SP basket on the average daily biogas volume produced at the EVA MBT plant in this study.
Press basket size 10 [mm] 8 [mm] 5 [mm]
Biogas volume [m3/week] 5,513 6,213 5,987
Biogas volume [m3/day](1) 840 900 890
Project report published in German language [37].
Table 4. Biogas recovery per ton of RMSW, MSFF, and VS in MSFF for each trial (trials are listed from minimum to maximum recovery rate).
Recovery of Biogas Trial 9 Trial 3 Trial 8 Trial 1 Trial 2/4/7 Trial 6 Trial 5
[m3/ton RMSW] 18 18 21 22 25 33 34
[m3/ton MSFF] 29 29 33 36 40 53 55
[m3/ton VS in RMSW] 82 84 95 103 115 152 157
Table 5. Overview of the recovery rate of fresh mass, TS, VS, and biogas from the input mix to the substrate for AD (recovery rate to PW is highlighted green. P1 to P4 definition explained in section introduction and shown in Figure 1).
Materials Fresh Mass Total Solid (TS) Volatile Solid (VS) Biogas
Recovery rate [% input FM] Concentration [% FM] Recovery rate [% input TS] Concentration [% FM] Recovery rate [% input VS] Biogas potential [m3/Mg VS] Recovery rate [% input biogas]
 (1) P1: This study (Trial 5-6)P: 4.0 bars
GR+PZ/MSFF: 1,050 l/ton
Mixing time before pressing: No
Mesh size: 5 mm
MSFF<60mm 55 28 389
GR 12 4.8 192
PZ 1.0 0.4 778
Input Mix 100 32 100 16 100 364 100
PW for AD 47-58 15 23-29 7.2 25-29 613 46-50
PC 42 50 71 25 71 249 50
 (2) P2-A: Piston pressP: 50 bars
Water (10 °C)/MSFF: 330 l/ton
Mixing time before pressing: 2 h
Mesh size: 8 mm
MSFF<80mm 72 46,10 470
Tap water -
Input Mix 100 48 100 30,72 100 100
PW for AD 49 35 35 21,70 34 320 23
PC 51 61 65 39,65 66 -
 (3) P2-B: Piston pressP: 40 bars
Water (70 °C)/MSFF: 1,560 l/ton
Mixing time before pressing: 1,5 h
Mesh size: 12 mm
MSFF<40mm 74 47 360
Tap water -
Input Mix 100 29 100 18,27 100 100
PW1 for AD 67 9 22 69 24 450 30
PW2 for AD 5 19 3 64 3 - 4
PC 28 77 75 62 72 - 66
 (4) P2-C: Piston pressP: 250 bars
Water /MSFF: 160 l/ton
Mesh size: 8 mm
MSFF<80mm 50 25 570
Tap water
Input Mix 100 42 100 21 100 100
PW for AD 57 35 47 21 54 660 63
PC 43 53 53 23 46 470 37
 (5) P4: Dry ProcessScreening: 5 mm, 10 mm
No pressure
No water addition
MSFF<40mm 63-67 38-49 470
Substr. for AD 31-39 55-65 27-38 29-49 24-38 290-320 17-23
Rest 69-61 73-62 76-62 83-77
 (6) P3: Thermal ProcessP: 4.0 bars
Water steam (150 °C)/MSFF: 1,250 l/ton
Mesh size: 40 mm
MSFF<90 mm 46 59
Water steam
Input Mix 20 26
Substr. for AD 80 14 53 13 38
Rest 20 47 62
References: P2 and P4 [11], P2-C [11, 35], P3 [23].
Disclaimer/Publisher’s Note: The statements, opinions and data contained in all publications are solely those of the individual author(s) and contributor(s) and not of MDPI and/or the editor(s). MDPI and/or the editor(s) disclaim responsibility for any injury to people or property resulting from any ideas, methods, instructions or products referred to in the content.
Copyright: This open access article is published under a Creative Commons CC BY 4.0 license, which permit the free download, distribution, and reuse, provided that the author and preprint are cited in any reuse.
Prerpints.org logo

Preprints.org is a free preprint server supported by MDPI in Basel, Switzerland.

Subscribe

Disclaimer

Terms of Use

Privacy Policy

Privacy Settings

© 2025 MDPI (Basel, Switzerland) unless otherwise stated