1. Introduction
Bottom trawling is a method of fishing in which active fishing gear is towed behind a mobile vessel (Gabriel et al., 2005). This method is, however, not selective and many species apart from hake are caught as bycatch during the fishing process (Hall et al., 2000). Bycatch in a fishery is the incidental catch of non-target fish species and other marine organisms that are trapped by commercial fishing nets during fishing for target species (Pinedo & Polacheck, 2004). Some of the catch of non-target species is retained for marketing (often termed as a ‘byproduct’), but the extent of this varies among countries and with the relative values of the bycatch and target species. Alverson et al. (1994), estimated that 27 million tonnes of bycatch were discarded globally each year. Bottom trawls are also known to cause considerable damage to the marine habitats and species within them (Davies et al., 2007). Subsequently, this may result in an increase in the feeding opportunities for fish species, which may lead to their accumulation in areas that have been trawled recently (Kaiser and Spencer, 1994). The attraction to these recently trawled areas may increase the likelihood of being caught by subsequent fishing gear passes (Bradshaw et al., 2000), which may consequently lead to an increase in the number of bycatch incidents. Bycatch has emerged as a pressing global concern due to the growing volume of discards and the heightened awareness of its potential environmental consequences.
Various studies have demonstrated that bycatch species can vary significantly between different species, vessels, fleets, and over time and space (Catchpole & Gray, 2010; Rochet et al., 2002). Consequently, the location and extent of bycatch are critical factors in management decisions and strategies aimed at reducing bycatch (e.g., locations of mandatory mitigation gears/practices and temporary closures or effort redistribution). From a multispecies perspective, spatial analyses can help identify areas where fishing gear is likely to encounter multiple vulnerable species, which could be considered as bycatch "hotspots." Although concerns about bycatch in commercial and recreational fisheries have been expressed in the scientific literature since the mid-1970s, the issue gained prominence in the 1990s (Costa et al., 2008). Given the depleted state of many of the world's important fish stocks, there has been considerable interest in documenting and addressing the economic, political, and ecological implications of bycatch (Costa et al., 2008).
In Namibia, fisheries are regulated by the Marine Resources Act (MRA) of 2000 and corresponding regulations (Iitembu et al., 2021). These regulations cover the allocation of quotas, granting of rights, licensing of fishing activities, and conservation measures, such as controlling trawling activities and measuring mesh sizes (Iitembu et al., 2021). Despite these credible efforts, bycatch has always been a major problem for fisheries. The situation is worsened by grey areas in the literature amid the status of bycatch species. Apart from anecdotal observations, little is known about the spatial distribution and effects of Namibian hake-directed bottom trawl fisheries on bycatch species, and if these may have implications for the sustainable management of deep-water fisheries. The aim of this study was to examine the spatio-temporal distribution variations of bycatch species catch rates in the hake-directed bottom trawl fishery and to illustrate their usefulness in the management and reduction of bycatch for sensitive species, thereby fostering environmentally responsible fishing practices.
2. Materials and Methods
Study Area
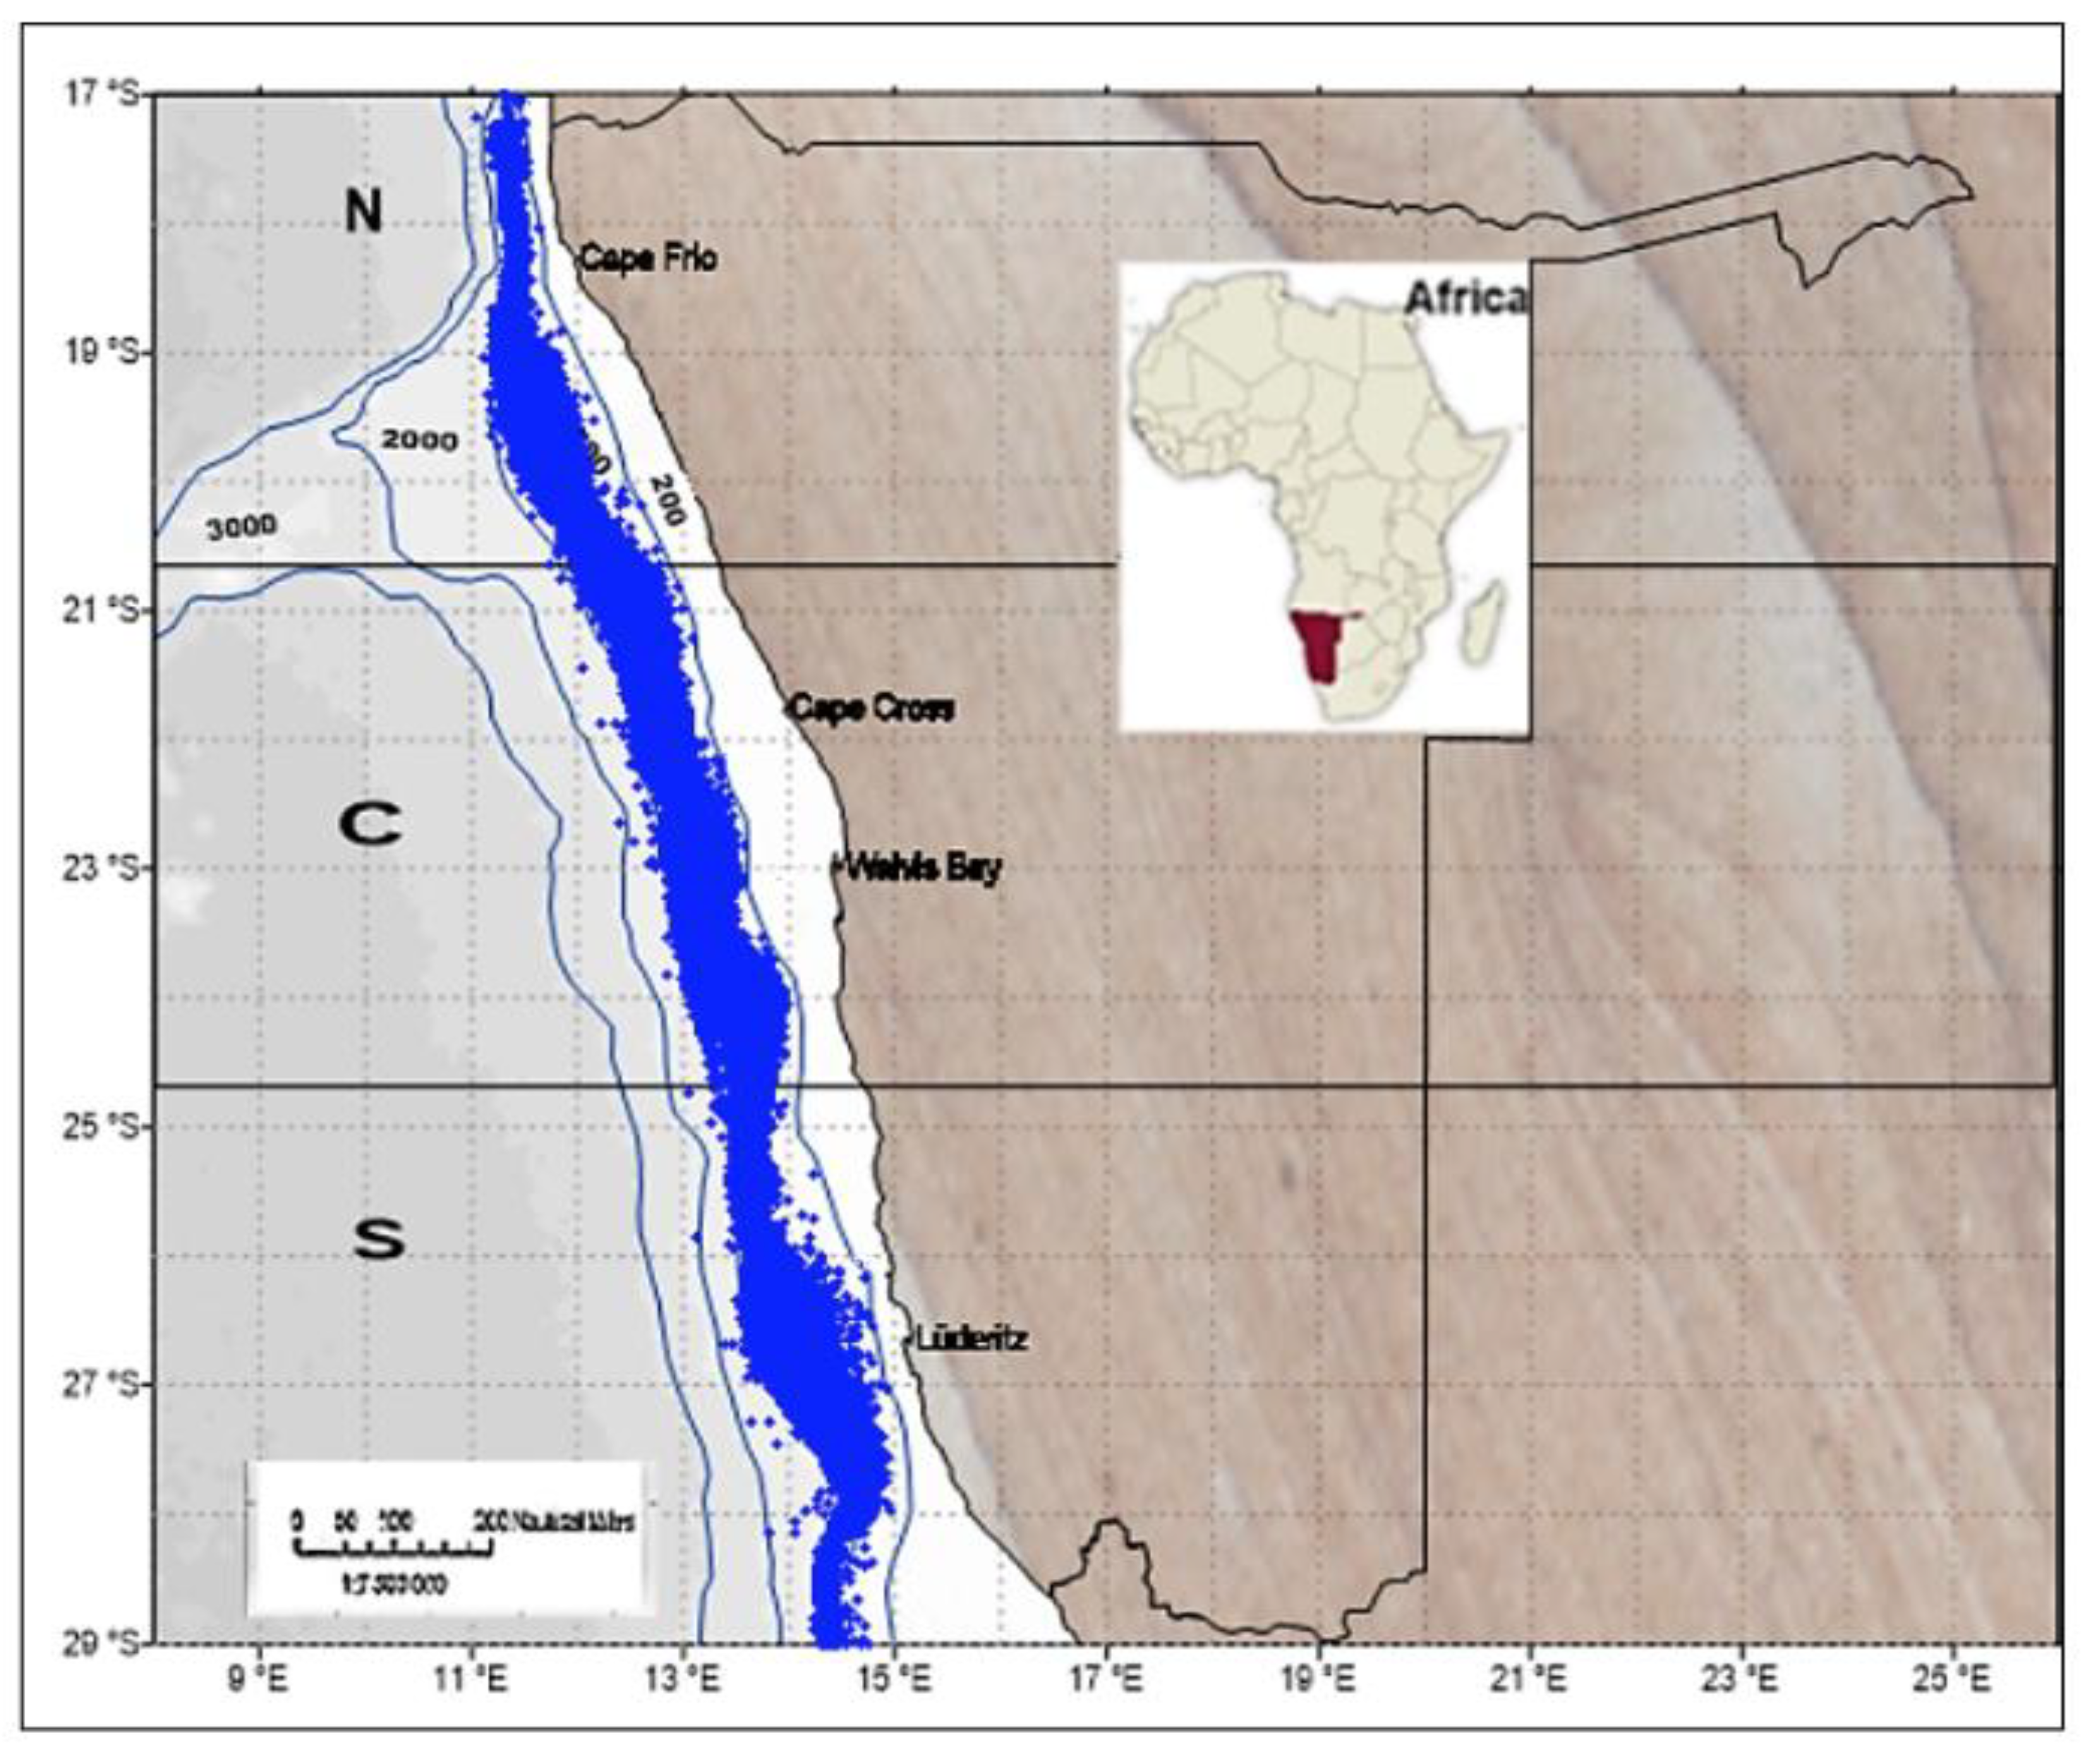
The present investigation was carried out within the Exclusive Economic Zone (EEZ) of Namibia, encompassing the area from the Kunene River mouth (17°S) in the northern sector to the Orange River mouth (29°S) in the southern sector. This region encompasses the Namibian hake-directed bottom trawling fishing grounds in waters deeper than 200 m within the EEZ of Namibia (200 nautical miles). For the purpose of this study, the coastline of Namibia was divided into three distinct marine sub-regions: northern (17°S–20°59’59”), central (21°S - 24°59’59”), and southern (25°S - 29°59’59”) regions, as previously established by Mafwila (2011) (
Figure 1).
Data Collection
The study employed observer data from a hake-directed bottom trawl fishery. Data on trawling location, catch, trawling time, number of trawls, and depth were collected and recorded by onboard observers from 1997 to 2014. Upon landing, all fish samples were sorted by species and recorded using the Ken Schultz Field Guide (2003). All data were captured using a formal database system managed by the Ministry of Fisheries and Marine Resources. Data on fish species abundance were subsequently extracted by accessing the database and creating queries, which linked different tables together and extracted different required variables for further analyses.
Data Analysis
Prior to data analyses, data were screened to eliminate errors, such as incorrectly recorded fishing positions and species names. Errors that could not be verified or corrected were excluded from analysis. Records for October were excluded because of the seasonal closure of the hake fishery.
Catch per Unit Effort (CPUE)
The abundance of fish was reported using catch per unit effort (CPUE) and weight per trawl. The CPUE was computed following the method outlined by Pollock et al. (1994) and was standardized as kilograms per trawl net per night. To calculate the mean CPUE, the following equation was utilized:
Ci represents the weight of the catch for species caught in gear i, and Ei is the effort expended to catch Ci (e.g., number of trawls). The spatial distribution of catch rates for commercial bottom trawl data (based on the CPUE) was plotted using Surfer® 9.0, a mapping software from Golden Software, LLC (
www.goldensoftware.com) (Surfer 9. 2010). Generalized Additive Models (GAMs) were applied to depict graphs of monthly variations in bycatch, indicating seasonality. The model used was:
In this model, k specifies the dimensions of the spline used for the basis, which was set to the 12th maximum possible month. "bs" indicates the basis type for the smooth term, and "cc" signifies a cyclic cubic spline, which is used for the monthly term as there should be no discontinuity between months. All GAM modelling was conducted using R software (R Development Core Team, 2010). Species with very low entries were excluded from the analysis in GAMs, as their entries were too low to run GAMs and/or to formulate graphs.
Multivariate Analysis
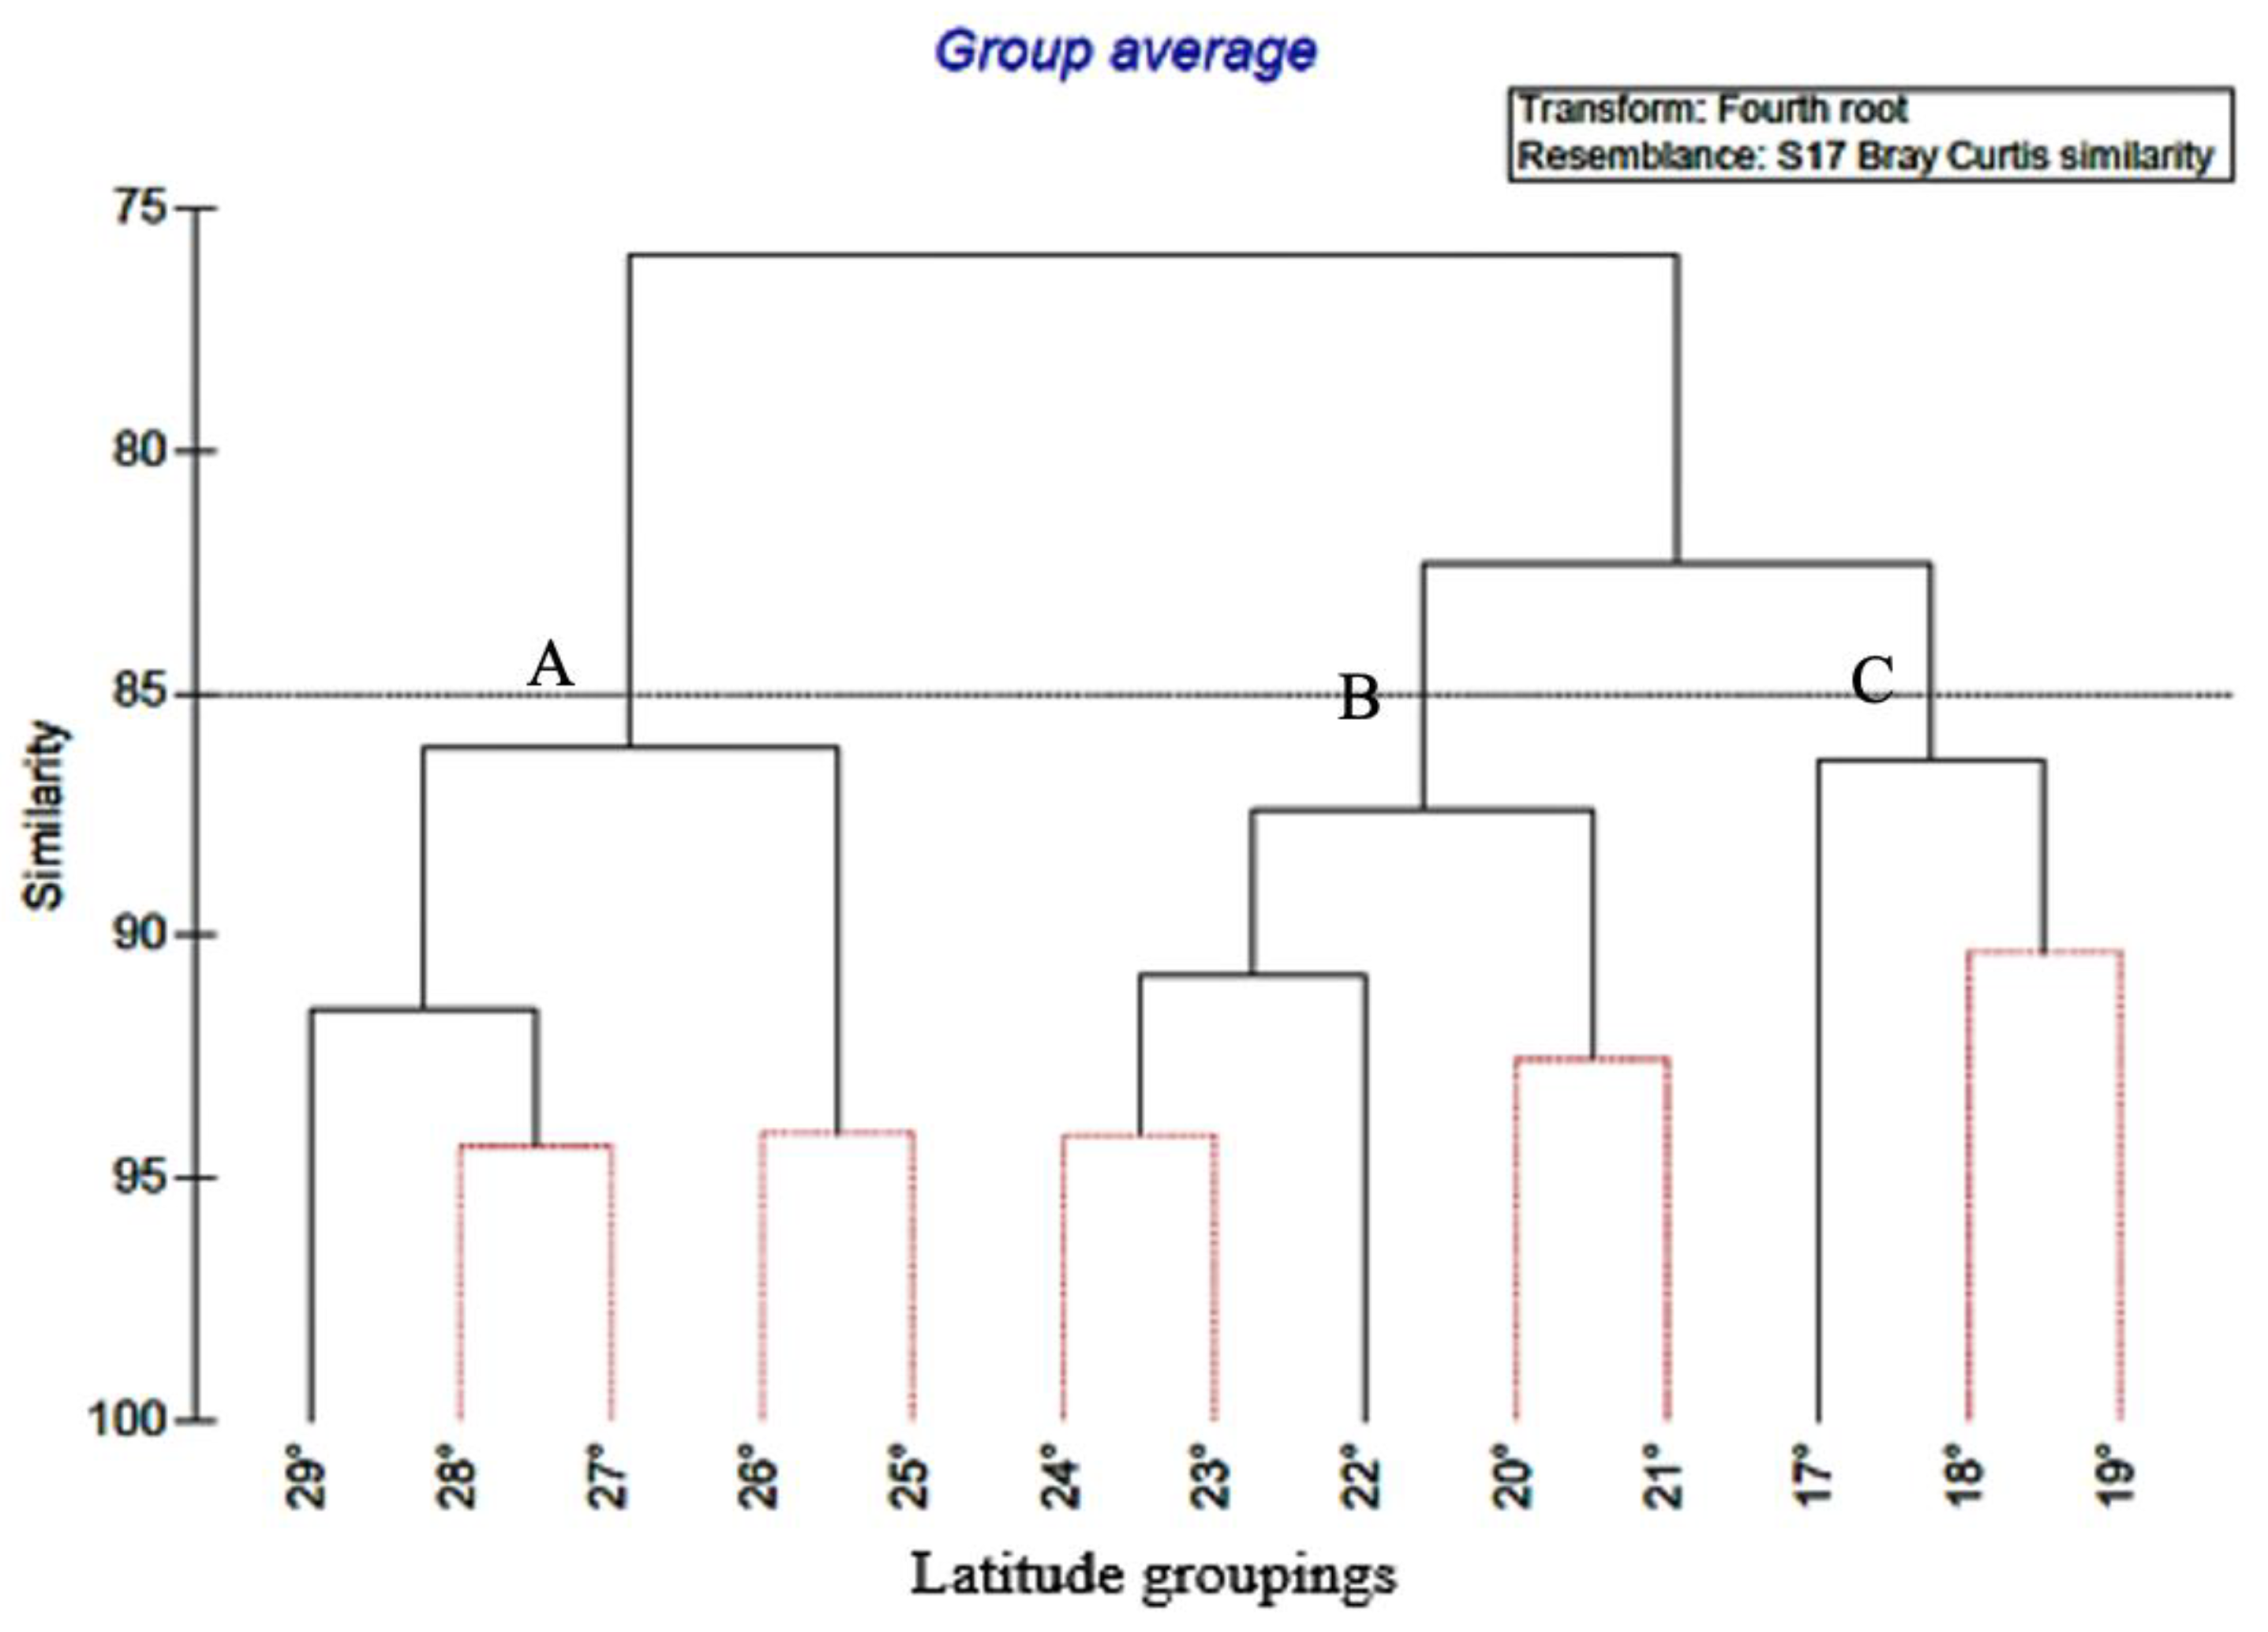
Hierarchical clustering was conducted using group-average sorting of Bray-Curtis similarity coefficients, which were calculated from species presence/absence data in PRIMER v7 (Plymouth Marine Laboratory, Plymouth, UK). Prior to the clustering analysis, the data were transformed by applying a fourth-root transformation to avoid overemphasis on the most abundant species (Clarke & Warwick, 2001). A dendrogram was generated to identify any grouping of the different study species by sampling station.
Significance testing between predefined groups of sampling stations was performed using the analysis of similarities (ANOSIM) method, which is a non-parametric permutation procedure applied to the similarity matrix (Clarke & Greene, 1993). The similarity percentage (SIMPER) was used to indicate the average contribution of each species density to similarity (typifying species) and dissimilarity (discriminating species) between groups of samples (Clarke & Warwick, 2001). The SIMPER analysis was performed on abundance data (CPUE) after a fourth root transformation.
3. Results
Bycatch Composition by Sampling Stations
A total of 23 bycatch species, weighing 9031480 tonnes were recorded in the study area from 1994 to 2014 (
Table 1).
Trachipterus trachypterus (14.97%),
Trachurus capensis (14.41%),
Helicolenus dactylopterus (13.06%),
Lophius vomerinus (11.32%), and
Genypterus capensis (9.33%) were the most dominant bycatch species, accounting for 63.09% of the total biomass
. Dentex macrophthalmus (32.85%),
T. capensis (14.86%) and
L. vomerinus (14.27%) were the most dominant species in the northern region while T. capensis (40.88%),
L. vomerinus (18.08%),
H. dactylopterus (13.00%) and dominated the central regions, and G. capensis (15.01%),
H. dactylopterus (12.77%) and
T. trachypterus (23.72%) were the most dominant species in the southern region. Species such as;
Macrouridae species,
Argyrosomus inodorus, and
Thunnus albacores were recorded in the North and central regions while
Thunus species was recorded in the Northern and Southern regions. However,
D. capensis was found exclusively in the northern region.
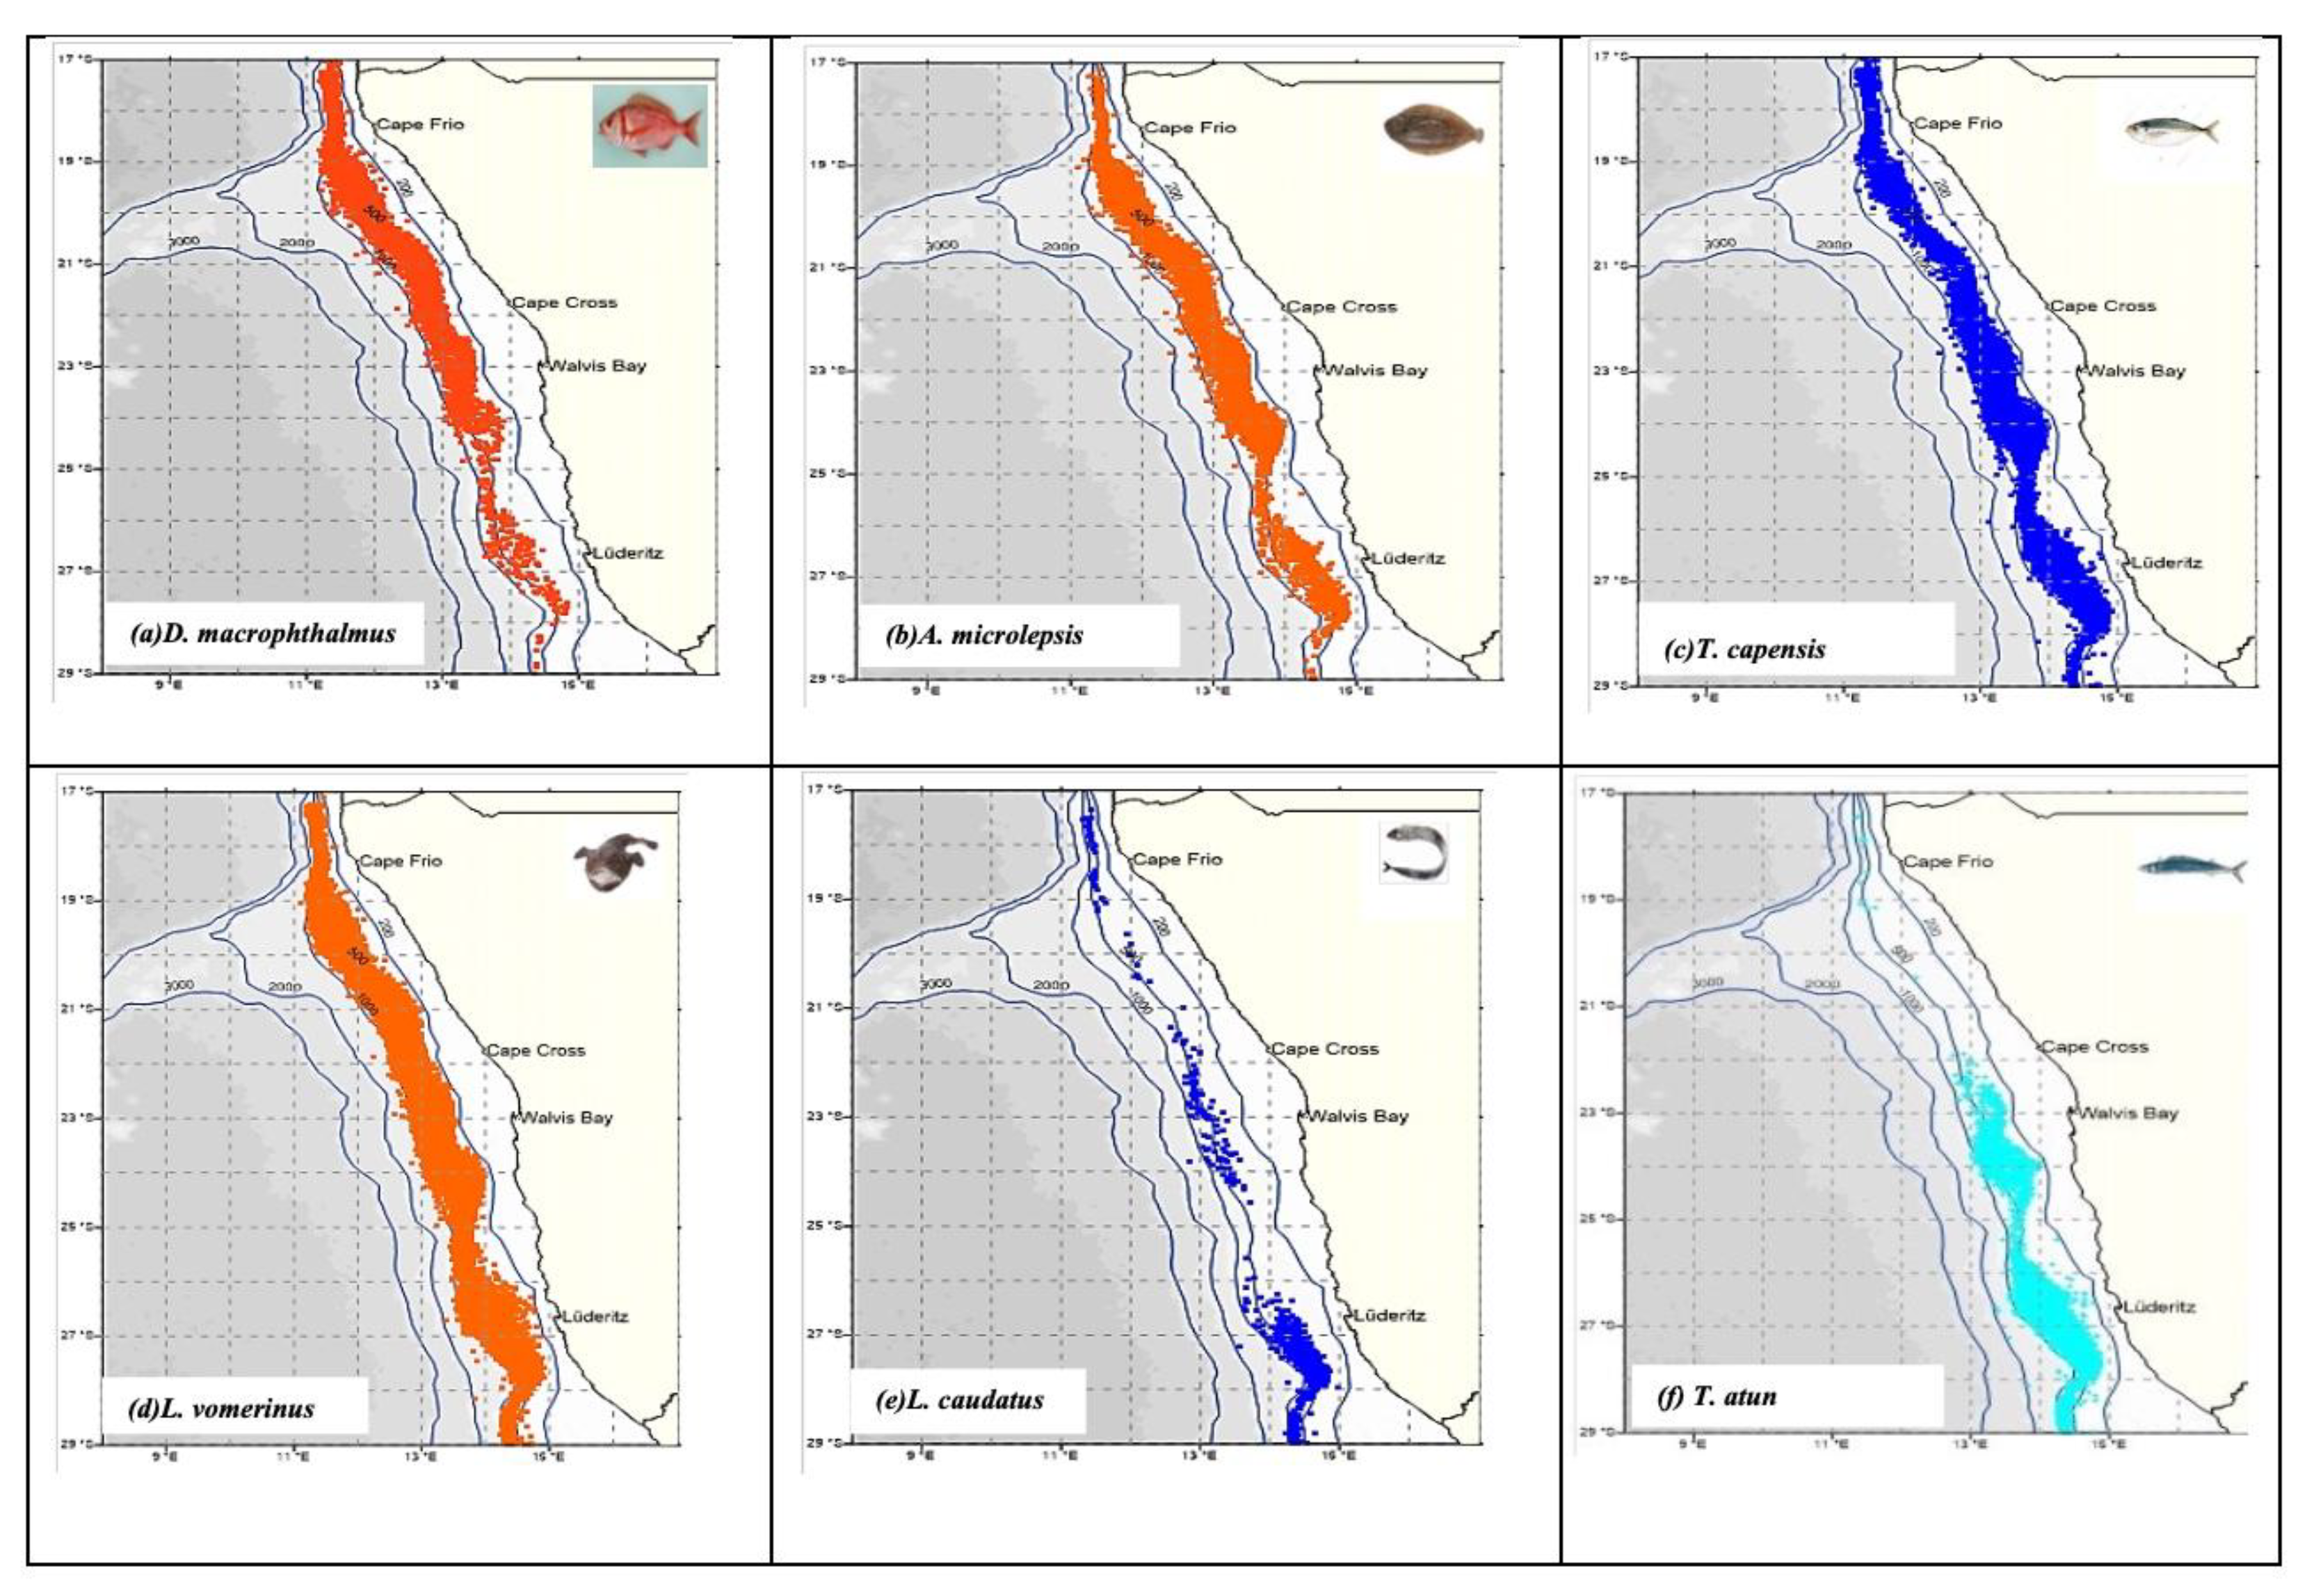
Spatial Distribution of Catch Rates (CPUE) of Selected Bycatch Species.
The spatial catch rates of the four (4) selected species (i.e., species that were sampled in sufficient sample sizes for detailed analysis) are depicted in
Figure 3 a-f. The results shows that,
D. macrophthalmus dominated the catch rates in the Northern region (
Figure 3 a) while
A. microlepis, T. capensis and
L. vomerinus were highly concentrated in the central region (
Figure 3b-d). Species such as
Lepidopus caudatus and
Thyrsites atun had the highest catch rates in the southern region (Figure 3 e - f). Generally, the highest catches of all bycatch species combined were recorded as follows: 5,553,164.3 tonnes in the southern region; 2,035,073.2 tonnes in the central and northern regions (
Table 1).
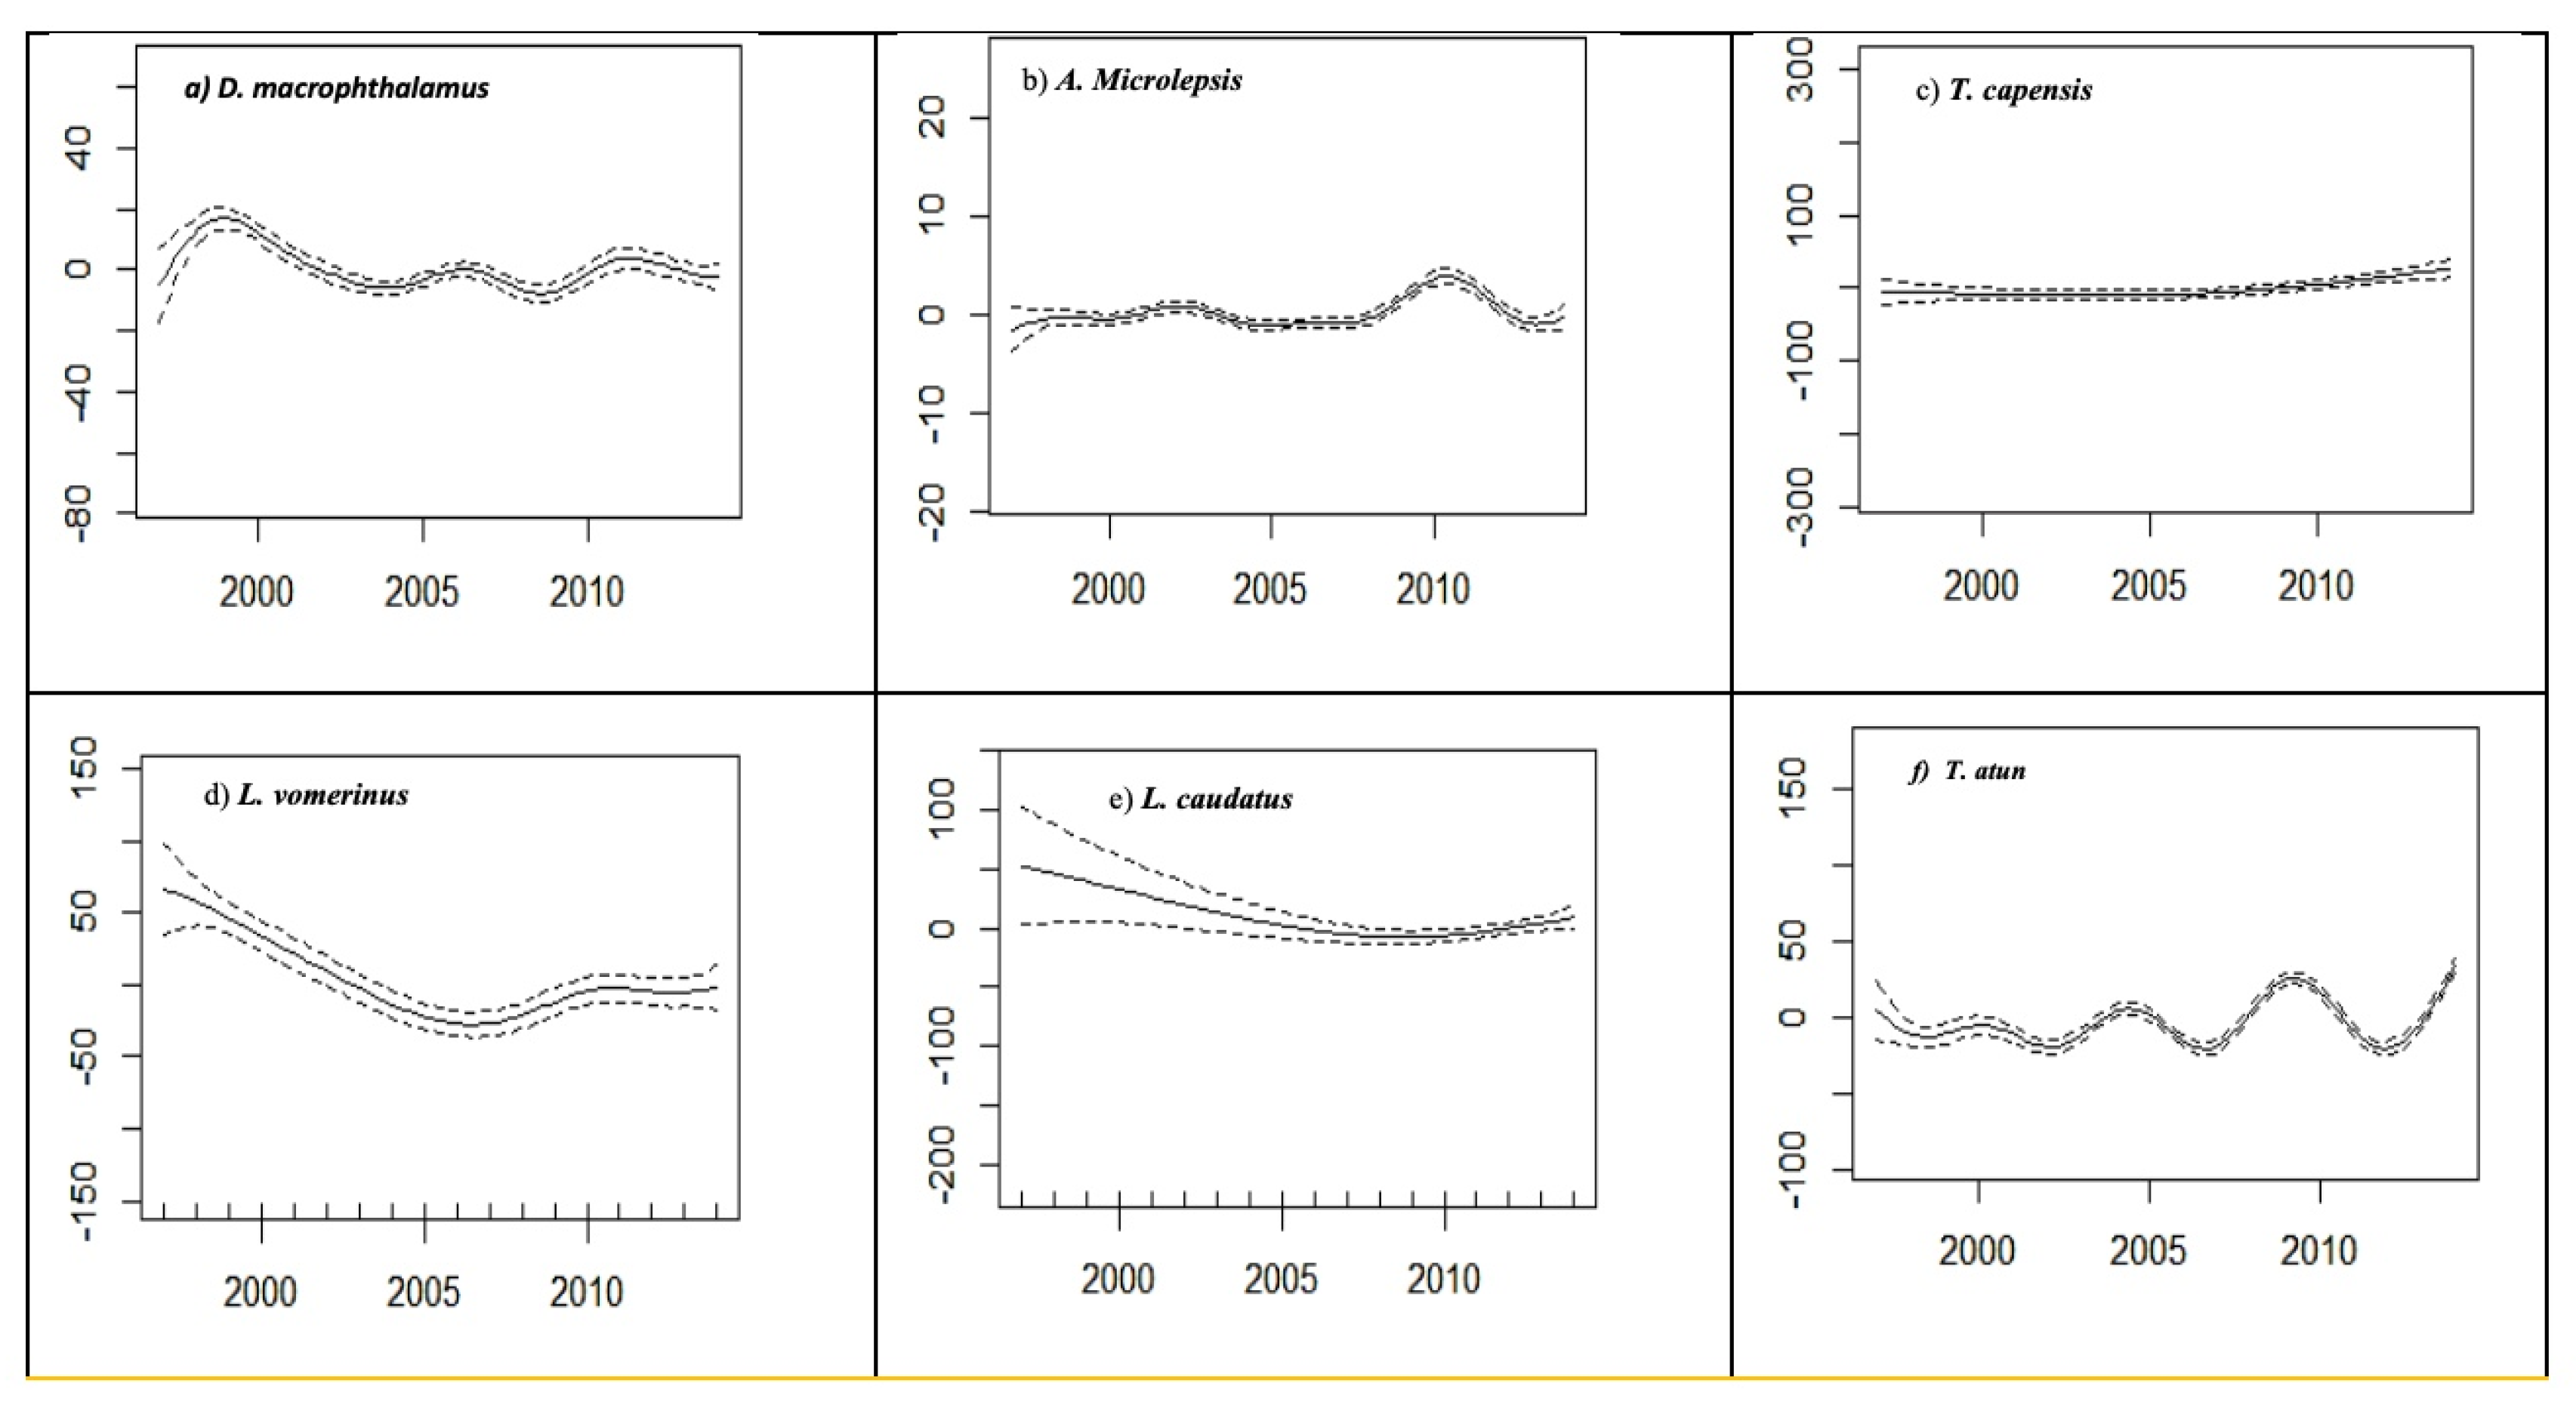
Annual Distribution of Catch Rate (CPUE) of the Selected Species
Annual trends in catch rates of the six key selected species are depicted in
Figure 4 (a – f). There was an annual variation in the annual CPUE of the key selected species. However, these variations are species specific. There was a general decline in the CPUE of
L. vomerinus and
L. caudatus from 1997 to 2005, but both remained stable from 2006 to the end of the study period. Similarly, the annual catch rates of
D. macrophthalmus and
A. microlepis varied over the study period. Minor peaks in the annual CPUE of
D. macrophthalmus were observed in 2009, whereas those of
A. microlepis were observed in 2011. The annual catch rates of
L. caudatus and
T. capensis remained stable throughout the study period, whereas those of
T. atun varied over the study period. Distinct peaks in CPUE of
T. atun were apparent in 2000, 2005, and 2010, while abrupt declines were observed in the subsequent years of 2003, 2007, and 2012, respectively.
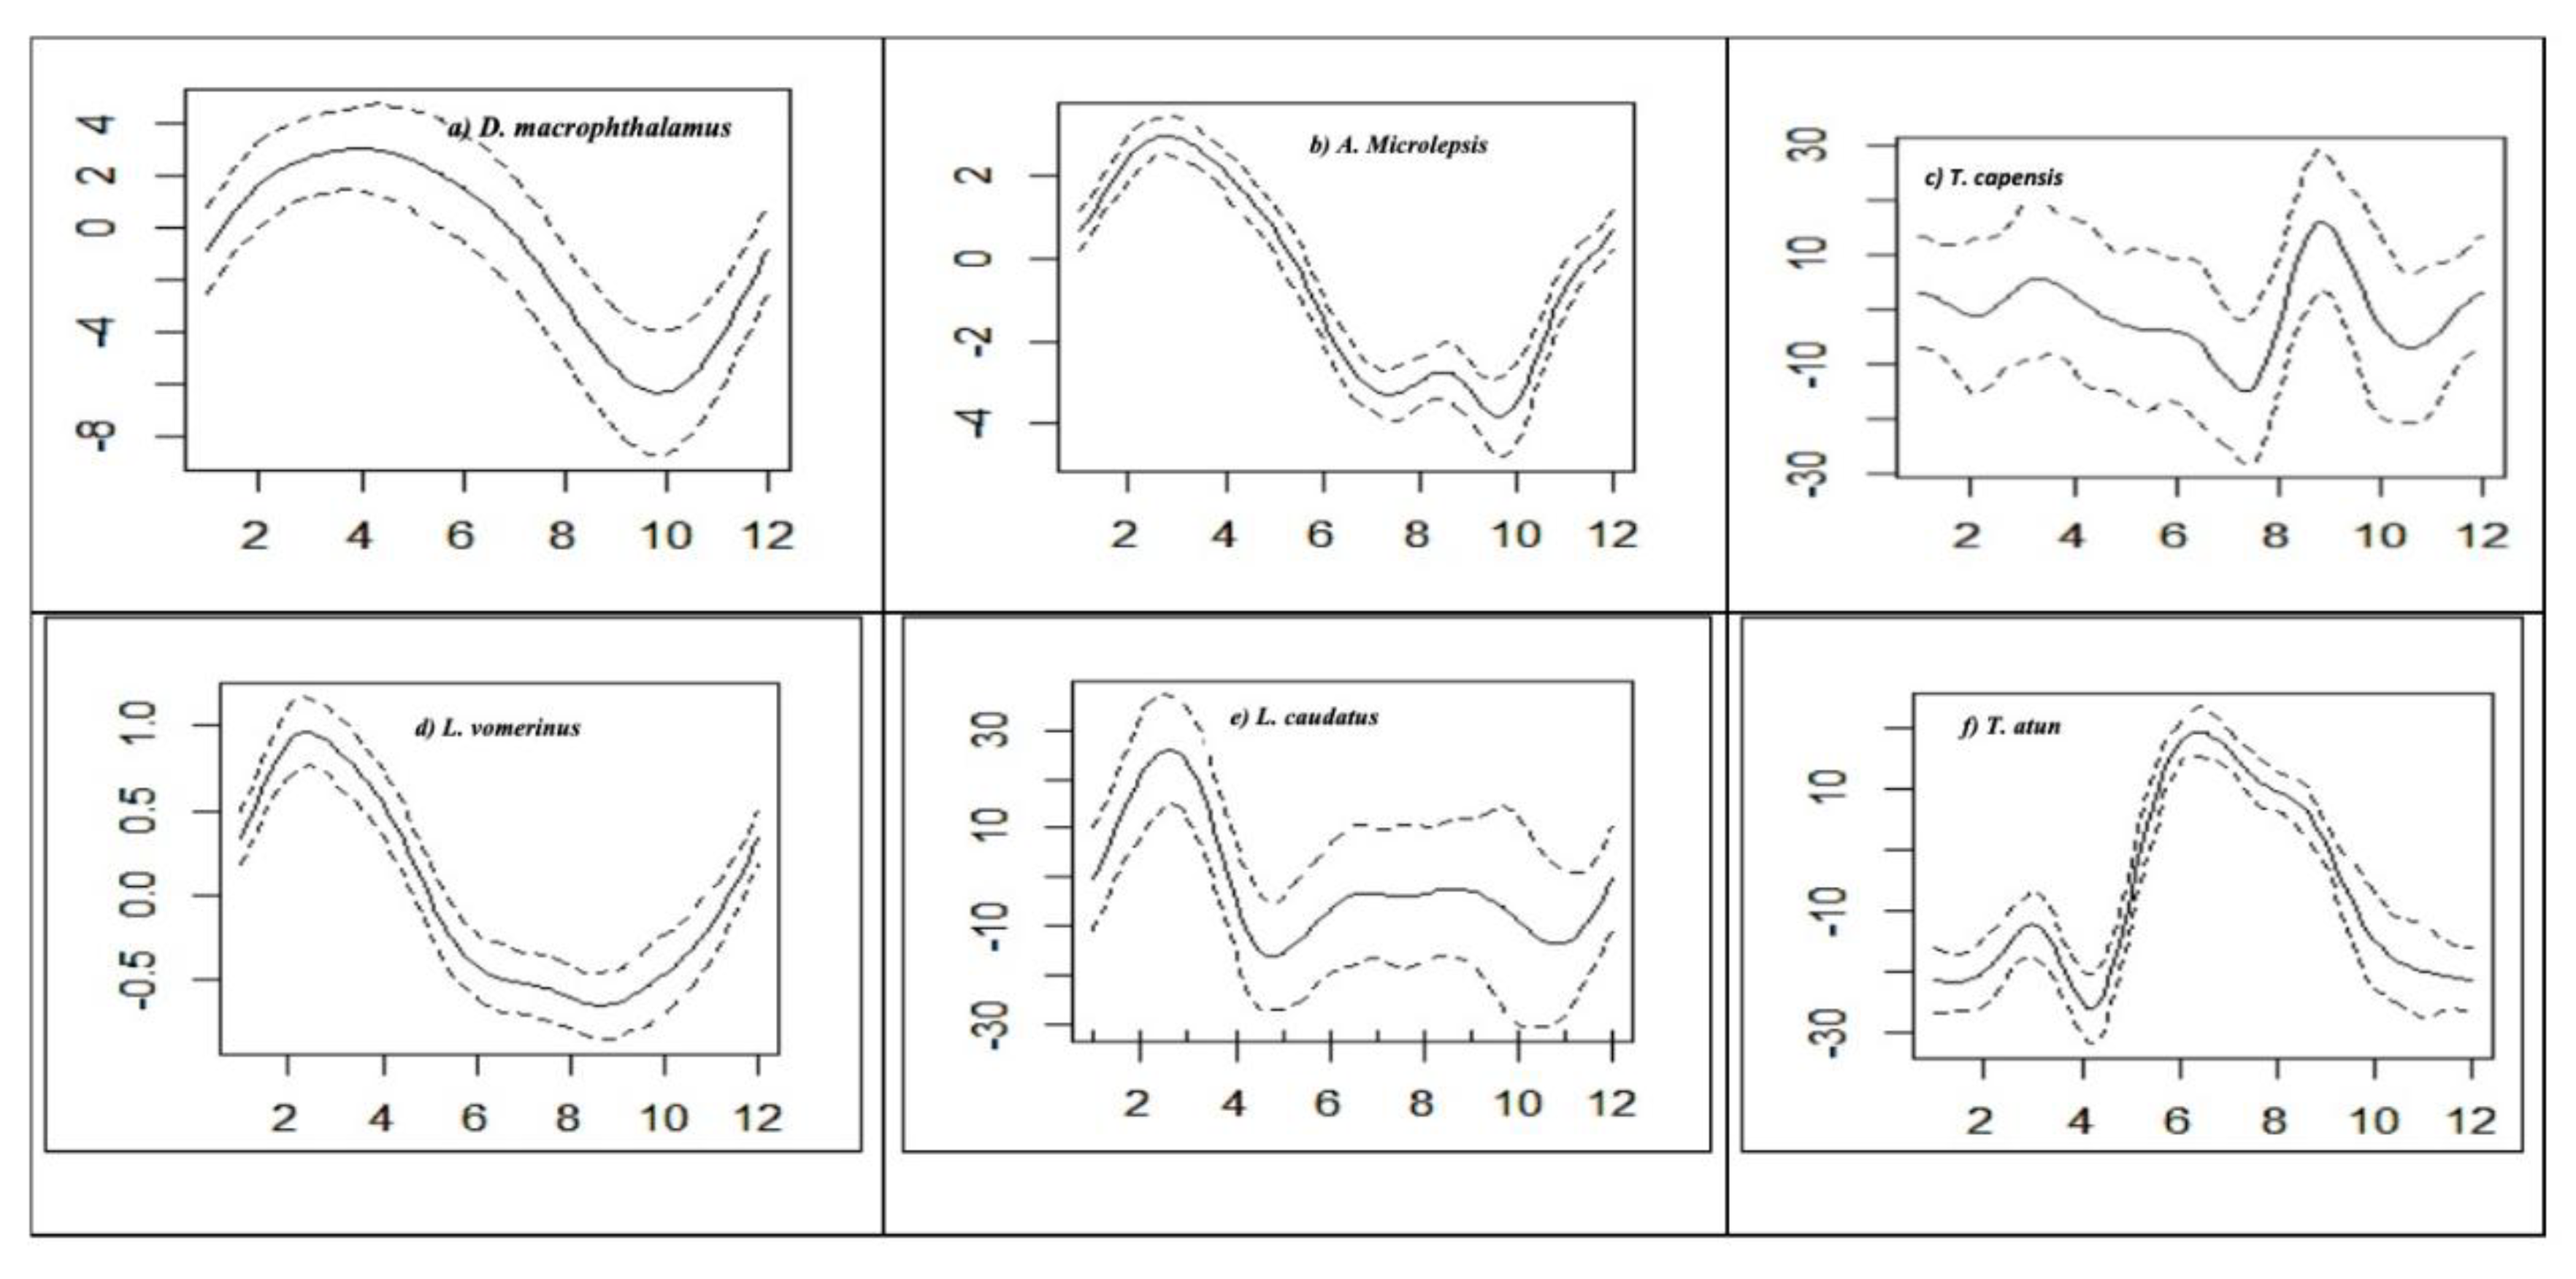
Seasonal Distribution of Catch Rate (CPUE) of Selected Species
The monthly catch rates of the six (6) selected species are shown in
Figure 5 a - f. The highest catch rates of
D. macrophthalamus and
A. Microlepsis were observed at the beginning of the year in March and April but were the lowest in October (
Figure 5 a & b). The monthly catch rates of
T. capensis decreased from January to August and peaked in September (
Figure 5 c).
Lophius vomerinus had its peaks in March but lowest in September (
Figure 5 d). The highest catch rate of
L. caudatus was recorded in March and decreased drastically in May (
Figure 5 a- e). However,
T. atun had high catch rates in July, which declined over the entire sampling period (
Figure 5 f).
4. Discussion
Bycatch Species Composition
The current study reports an array of 24 bycatch species that have never been reported before; thus, comparisons with previous studies are limited. Nonetheless, some indications may be provided by seemingly comparable studies conducted elsewhere in Africa and beyond. In this study, T. capensis (14.41%), H. dactylopterus (13.06%), and T. trachypterus (14.97%) were the main bycatch species of the hake trawl fishery. The current catch composition of the 24 species is comparable in magnitude to the 23 bycatch species documented for the trawl fishery in the Chubut coastal waters of Argentina. However, the current catch composition is relatively more complex than the six (6) bycatch shark species that were reported for the monk fishery (Lophius gastrophysus) in Southern Brazil (Perez et al., 2005). These variations may be attributed to sampling artifacts, fishing grounds, and target species. For instance, the findings of this study and those of Nunez et al. (2012), were based on bottom trawlers targeting hake in Namibia and incidentally caught a wide array of species, whereas Perez et al. (2004), employed gillnets that were more species-specific. Such selective studies have been criticized for yielding biased results that might contradict management protocols for different bycatch species, as they may positively increase the population for one specific species over the other species (Peres et al., 2004).
Spatial Distribution of the Key Selected Bycatch Species
The current study revealed evidence of spatial patterns, although the strength and nature of these patterns vary among species. Further analysis at the species level showed that the highest catch rates of D. macrophthalmus were observed in the northern region. These results are supported by annual surveys conducted by the Ministry of Fisheries and Marine Resources (MFMR, 2006), where D. macrophthalmus is reported to be common in the far north, ranging from the South of Mowè Bay and extending further north to the border with Angola (MFMR, 2018).
Austroglossus microlepis is another ecologically and commercially important species that contributes the most to the dissimilarity in bycatch community assemblages among sampling stations within regions. According to Bianchi et al. (1993), there are two distinct stocks of A. microlepis that are localized in the offshore zones of the Orange River mouth (between 28° S and 30° S in the southern regions) and another stock population in the central region of the Walvis Basin (between 20° S and 22° S). However, the present study found that the highest catch rates of A. microlepis were recorded in the central coastal regions between 20°S and 22°S. These results are in agreement with the data from Namibian annual hake surveys, where higher abundances of A. microlepis were cited in the central coastal regions of Namibia. Similarly, Bianchi et al. (1993), confirmed that A. microlepis is commonly found in the central coastal regions of Namibian, which further reaffirms the results of this study.
Monkfish (Lophius vomerinus) were among the key species caught along the entire coastal region of Namibia, with the highest catch rates recorded in the central region. Maartens et al. (1999) equally echoed that, the highest densities of L. vomerinus are commonly found in the central coastal regions of Namibian. According to BCLME (2011), this species breeds and recruits offshore in Walvis Bay, between 23°S and 25°S, or near the Orange River (28°S–35°S). Hence, the geographical positioning of their breeding and recruitment sites could account for their maximum landing within the central regions of Namibia.
Similarly, the highest catch rates of T. capensis (horse mackerel) have been recorded in the central coastal region of Namibia (Bianchi et al., 1993). Horse mackerel (T. capensis) is a serial spawner that breeds and recruits in the central coastal regions of the Cape Cross (22°S) (O’Toole, 1977). Consequently, it can be inferred that the catch rate dominance of T. capensis in the central region was related to its spawning grounds, where adult species assemble in massive numbers for courtship and spawning (O’Toole, 1977).
The scabbard fish (Lepidopus caudatus) is an important commercial fish species in the northeastern Atlantic and off Namibia and New Zealand (Nakamura, 1993). This species was caught along the entire coast of Namibia, with the highest catch rate in the southern region. According to Nakamura (1993), L. caudatus is commonly found in upwelled waters. In Namibian waters, upwelling is mostly intense in the southern parts of Namibia (26°S -28°S). Moreover, coastal upwelling and primary productivity influence fish distribution in the region, and this might have triggered the movement of L. caudatus towards the southern regions for feeding, resulting in larger scale capture by trawlers.
Snoek (Thyrsites atun) was also caught along the entire coast of Namibia, with the highest landings originating from the southern region. These results are consistent with the observations of Iitembu et al. (2012) and Boyer and Hampton (2001), who reported higher densities of T. atun in the southern region of Namibia. According to Crawford and de Villiers (1985), this species prefers cool upwelled waters, where it is an important predator of small pelagic species, which might explain their maximum landings in the southern regions.
Annual Catch Rates of the Key Selected Species
The annual catch rates of L. vomerinus and L. caudatus declined over the years, whereas those of D. macrophthalamus, A. Microlepsis and T. capensis remained stable over the study period. However, the observed decline in the annual CPUE trends of L. vomerinus and L. caudatus could be a sign of stock over-exploitation or environmental variability. During the 1960 Gulf of Alaska resource assessment surveys, several species of flatfish, including the king and Tanner crab, Pacific cod, Pacific Ocean perch, and sculpins, dominated the region. However, a decade later, walleye pollock emerged as the most abundant species, with Pacific Ocean perch experiencing a drastic decline in abundance from 36.8 kg to 3.9 kg per trawl hour. Additionally, crab abundance decreased during this period, while the weight per unit effort for flatfish remained relatively stable (Ronholt et al., 1978). The reported changes in fish populations are thought to have been caused by a substantial increase in fishing activities, especially by the Soviet and Japanese fishing fleets in the Gulf of Alaska (Alverson, 1992b). It is suggested that species with low reproductive output, high parental care, and low natural mortality rates are likely to experience greater impacts. Taking these factors into account, the observed decline in the CPUE of L. vomerinus and L. caudatus can be attributed to the rise in fishing efforts over the past 18 years. It is worth noting that there has been an increase in the number of fishing vessels along the Namibian coastline since the country gained independence (Mafwila, 2011). A study conducted on the effects of shrimp fishing in the Gulf of Mexico revealed a 40% reduction in the population levels of non-target Atlantic croaker species between 1972 and 1989 (NOAA/NMFS, 1992). Brander (1981) reported a decline and scarcity of common skate (Raja batis) in the Irish Sea, which was once abundant. The available evidence indicates that bycatch in major ground fish fisheries is the main reason for the disappearance of this species. Such fishing practices can alter the composition of species assemblages and disrupt trophic levels (Blaber & Wassenberg, 1989). These shifts have the potential to alter predator/prey relationships, increase food for scavengers, modify the structure and function of benthic communities, and increase competition among fishers, marine mammals, and other marine life for available resources.
Seasonal Catch Rates of the Key Selected Species
The present study illustrates a seasonal variation in catch rates (CPUE) of the key selected species along the coastal regions of Namibia. However, further analysis at the species level was restricted to four species (A. microlepis, L. vomerinus, T. capensis, and T. atun), which were retained in sufficient numbers for GAMS. As a result, the highest catch rates of the flatfish (A. microlepis) were recorded in February and March (Summer/Autumn month) and the lowest in August (winter). These results are supported by Diaz de Atarloa (2002), who reported maximum landings of A. microlepis during the summer. According to Macpherson and Gordoa (1992), seasonal peaks in flatfish landings may be triggered by their breeding season, from October to March, when brooders flock at high densities for spawning. This breeding strategy may help account for the observed peaks in the individual densities of A. microlepis during summer.
For L. vomerinus, the highest catch rates were recorded in January and February in the summer. These results confirmed similar observations made elsewhere for this species. For instance, Maartens and Booth (2005), reported that L. vomerinus are serial brooders and shoals in massive spawning schools during the summer. In this context, it can be deduced that their seasonal landings were synchronized with their breeding season.
The highest catch rates of T. capensis were recorded in September (spring) and the lowest from July to August (winter). Barange and Pillar (1998), also reported maximum landings of T. capensis from September to December. This is mainly because T. capensis migrates offshore in spring to feed and is entrapped in hake trawlers. According to Barange and Pillar (1998), there is always an abundant food supply induced by spring blooms, which may account for the observed spring peaks in catch rates of T. capensis.
The highest catch rates of T. atun were recorded in June and July (winter) and the lowest in December, January, and April (summer). According to Griffiths (2002), T. atun eggs and larvae are always abundantly distributed in winter. This implies that the observed maximum landings of this species in winter could be equally linked to their spawning periodicity as observed for L. vomerinus.
Vulnerable Taxa
The results of this study suggest that species that had a higher proportion of their population removed as bycatch (Trachurus capensis, Helicolenus dactylopterus, L. vomerinus, L. caudatus, and Trachipterus trachypterus) would have a lower capacity to recover. These species may be susceptible to hake bottom trawling off Namibia over a long period of time. They could be considered the most vulnerable and their populations could be severely pushed to near sustainable limits and may be unlikely to recover `within a foreseeable future. Other studies have also revealed that the removal of species from the ecosystem through bottom trawling as bycatch can have an impact on ecosystem stability and productivity by potentially altering species composition and diversity and altering the structure and function of food webs (trophic systems) (Mafwila, 2011). These species can be extirpated long before appropriate management policies can be implemented. Their vulnerability to fishing practices is likely to reduce their recovery capacity in the future. The removal of these species may have equally affected other communities across the trophic structure. Intensive trawling may, in the longer term, be expected to alter the population and community structure of demersal species in Namibian coastal waters. Regrettably, there appear to be no estimates of growth rate and longevity for these dominant bycatch species to elucidate the likely period required for such fish species or communities to recover from trawling disturbances.
Management Implications
The responsible management of non-target species is an essential aspect of fisheries. As stipulated in the FAO 'Code of Conduct for Responsible Fisheries' and the United Nations Agreement for the Conservation and Management of Straddling Fish Stocks and Highly Migratory Fish Stocks,' obligations regarding the impact of fishing on bycatch species are provided for. The United Nations Convention on the Law of the Sea obliges governments to manage responsibly the 'dependent and associated species' within their exclusive economic zones. spatial catch rate distribution maps and monthly plots elucidated the effects of seasons and areas of special concern, which are locations where high bycatch rates are likely to occur among neighboring bycatch locations. This information could be used to designate fish reserves aimed at safeguarding vulnerable by-catch species caught in high abundance and biomass. However, the uneven distribution of bycatch species in the Southern regions may pose a challenge if area bycatch management measures are considered. Interestingly, there was an overlap in assemblages whereby the central region bycatch species and the Northern region species indicated some element of high community assemblage similarity that may favor a spatially exclusive management protocol. Nevertheless, heavy fishing pressure directed towards the Southern regions should be accounted for through quota allocation and seasonal fishing closure in summer. The high bycatch rates may indicate a low presence of the target species or a good representation of a thriving community assemblage.
5. Conclusions
The present research examines the fluctuation in the rate of bycatch species in the hake bottom trawling fishery along the coastal regions of Namibia over time and space. The causes of this fluctuation were attributed to environmental variability, fishing pressure, season, and location. The study's findings indicate that hake bottom trawl fishing has the potential to negatively affect the variability of bycatch species off Namibia. Furthermore, the study revealed that these species could be grouped based on their occurrence and spatial variation, which is beneficial for ecosystem-based approaches to fisheries management. Therefore, the variation in catch rates suggests that bycatch management measures should be considered. Similarly, this factor can also be beneficial in implementing management strategies, such as the implementation of closed seasons and Marine Protected Areas.
Author Contributions
Samuel K. Mafwila: Conceptualization, Methodology, Software, Formal analysis, Writing - original draft, Writing - review & editing, Visualization, Supervision, Project administration, Funding acquisition. Evans Simasiku: Formal analysis, Writing–review and editing, Visualization, Supervision. Greg Mbaimbai: MSc Student, this work is part of Greg’s MSc thesis, Validation, Investigation, Resources, Data curation, Writing - review & editing. Johannes Iitembu: Conceptualization, Methodology, Writing–review and editing, supervision. Anna-Marie Namboga: Data curation, Methodology, Writing - Review and Editing. Kudakwashe Hove: Validation, visualization, and Review. All authors have read and agreed to the published version of the manuscript.”
Funding
This study was funded by the SANUMARC Trust, Sam Nujoma Campus, University of Namibia, Henties Bay, Namibia.
Institutional Review Board Statement
Not applicable
Informed Consent Statement
Not applicable
Data Availability Statement
We encourage all authors of articles published in MDPI journals to share their research data. In this section, please provide details regarding where data supporting reported results can be found, including links to publicly archived datasets analyzed or generated during the study. Where no new data were created, or where data is unavailable due to privacy or ethical restrictions, a statement is still required. Suggested Data Availability Statements are available in section “MDPI Research Data Policies” at
https://www.mdpi.com/ethics.
Acknowledgments
The authors would like to thank the Ministry of Fisheries and Marine Resources (MFMR), National Marine Information and Research Centre (NATMIRC) in Swakopmund, Erongo Region, Namibia, for availing the dataset for this study.
Conflicts of Interest
The authors declare no conflicts of interest.
References
- Alverson, D.L., Freeberg, M.H., Murawski , S.A., & Pope, J.G. (1994). A global assessment of fisheries bycatch and discards. FAO Fisheries and Aquaculture Technical Papers. 339: 233.
- Blaber, S. J. M., & Wassenberg, T. J. (1989). The feeding ecology of the piscivorous birds Phalacrocorax varius, P. melanoleucos and Sterna bergii in Moreton Bay, Australia: diets and dependence on trawler discards. Marine Biology, 101: 1–10.
- Bianchi, G., Carpenter, K. E., Roux, J. P., Molloy, F. J., Boyer, D., & Boyer, H. J. (1993). The living marine resources of Namibia. Curso de análisis sociocultural y demográfico:. FAO, Roma (Italia) Norwegian Agency for International Development, Rome (Italy).
- Bianchi, G., Hamukuaya, H., & Alvheim, O. (2001). On the dynamics of demersalfish assemblages off Namibia in the 1990s, South African Journal of Marine Science.23:419-428.
- Boyer, D. C., & Hampton, I. (2001). An overview of the living marine resources of Namibia. African Journal of Marine Science, 23, 5–35. [CrossRef]
- Bradshaw, C., Brand, A.R., Hill, A.S., Veale, L.O. (2000). The effects of scallop dredging on gravelly seabed communities. In: Kaiser MJ, De Groot SJ (eds), Effects of fishing on non-target species and habitats. Gray Publishing, Tunbridge Wells. pp 83-104.
- Brander, K. (1981). Disappearance of common skate Raia batis from Irish Sea. Nature 290, 48–49. [CrossRef]
- Pillar, S.C. & Barange, M. (1998). Feeding habits, daily ration and vertical migration of the cape horse mackerel off South Africa. In: Pillar, S. c., Moloney, C. L., Payne, A. I. L. and F. A. Shillington (Eds). South African Journal of Marine Science, 19:1, 263-274, . [CrossRef]
- Catchpole, T.L., & Gray, T.S,. (2010). Reducing discards of fish at sea: A review of European pilot projects. Journal of Environmental Management 91: 717-723. [CrossRef]
- Clarke, K.R., & Gorley, R.N. (2006). PRIMER v6: User Manual/Tutorial. Plymouth Marine Laboratory, Plymouth. pp 75.
- Clarke, K.R., & Warwick,R.M. (2001). Change in Marine Communities: An Approach to Statistical Analysis and Interpretation (2nd eds). Plymouth Marine Laboratory, Plymouth. pp 144.
- Crawford, R.M., & De-Villiers, G. (1985). Snoek and their prey: interrelationships in the Benguela upwelling system. South African Journal of Science 81: 91-97.
- Davies, A. J., Roberts, J. M., & Hall-Spencer, J. (2007). Preserving deep-sea natural heritage: emerging issues in offshore conservation and management. Biological Conservation, 138(3–4), 299–312. [CrossRef]
- Diaz de Astarloa, J.M .(2002). A review of the flatfish of the South Atlantic Ocean. Revista de Biologia Marina y Oceanografia 37: 113-125.
- Gabriel, O., Lange, K., Dahm ,E., & Wendt ,T .(2005). Fish catch methods of the world. Fourth edition. Blackwell Publishing , Oxford, United Kingdom.
- Griffiths, M.H,. (2002). Life History of South African snoek, Thyristes atun (Pisces: Gempylidae): a pelagic predator of the Benguela ecosystem. Fisheries Bulletin 100: 690-710.
- Hall, M. A., Alverson, D. L., & Metuzals, K. I. (2000). By-catch: problems and solutions. Marine Pollution Bulletin, 41(1–6), 204–219. [CrossRef]
- Iitembu, J. A., Erasmus, V. N., Uanivi, U., Nakwaya, D., Horaeb, R. R., Nangolo, E., Nashima, F. P., Iita, T. K., & Mwandemele, O. (2021). The hits and misses of Namibia’s attempt to implement the Ecosystem Approach to Fisheries (EAF) Management. Ecosystem Health and Sustainability, 7(1), 1920340. [CrossRef]
- Iitembu, J. A., Miller, T. W., Ohmori, K., Kanime, A., & Wells, S. (2012). Comparison of ontogenetic trophic shift in two hake species, Merluccius capensis and Merluccius paradoxus, from the Northern Benguela Current ecosystem (Namibia) using stable isotope analysis. Fisheries Oceanography, 21(2-3), 215–225.
- Maartens, L., Booth, A. J., & Hecht, T. (1999). The growth of monkfish Lophius vomerinus in Namibian waters, with a comparison of otolith and illicia methods of ageing. Fisheries Research, 44(2), 139–148. [CrossRef]
- Maartens, L., & Booth, A.J. (2005). Aspects of the reproductive biology of monkfish Lophius vomerinus off Namibia. South African Journal of Marine Science 27: 325–329.
- Mafwila, S. K. (2011). Ecosystem effects of bottom trawling in the Benguela current system: experimental and retrospective data analyses. PhD thesis, University of Cape Town.
- Macpherson, E., & Gordoa, A. (1992). Trends in the demersal fish community off Namibia from 1983 to 1990. Benguela Trophic Functioning. In: Payne AIL, Brink KH, Mann KH, Hilborn R (Eds), South African Journal of Marine Science 12: 635–649.
- Ministry of Fisheries and Marine Resources. (2006). Annual report 2006. Windhoek, Namibia. Unpublished.
- Ministry of Fisheries and Marine Resources. (2018). Cruise Report No 1/2018 RV Mirabilis. Windhoek, Namibia. Unpublished.
- Nakamura, I. (1993). Snake mackerels and cutlassfishes of the world (Families Gempylidae and Trichiuridae). FAO Fish. Syno., 125, 30–32.
- Nashima, F.P. (2009). Effects of environmental variability on fish diversity and composition along the southern Namibian coastline during summer. Master’s thesis, University of Namibia and the Humboldt-Universität zu Berlin.
- Nuñez, M. A., Kuebbing,S., Dimarco, R.,& Simberloff, D. (2012). Invasive species: to eat or not to eat, that is the question. Conservation Letters 5:334–341. [CrossRef]
- O’Toole, M. J. P. (1977). Investigations into some important fish larvae in the South East Atlantic in relation to the hydrological environment.
- Perez, J. A. A., & Wahrlich, R. (2005). A bycatch assessment of the gillnet monkfish Lophius gastrophysus fishery off southern Brazil. Fisheries Research 72: 81-95. [CrossRef]
- Pinedo, M. C., & Polacheck, T. (2004). Sea turtle by-catch in pelagic longline sets off southern Brazil. Biological Conservation, 119(3): 335–339. [CrossRef]
- Pollock, K. H., Jones, C. M. & Brown,T.L.(1994) .Angler survey methods and their applications in fisheries management. Special Publication. NO.25.Bethesda, Maryland: American Fisheries Society.
- Rochet, M.J., Péronnet ,I., & Trenkel, V.M .(2002). An analysis of discards from the French trawler fleet in the Celtic Sea. ICES Journal of Marine Science: Journal Du Conseil, 59:538-552. [CrossRef]
- Ronholt, L.L., Shippen,H.H., & Brown,E.S.( 1978). Demersal fish and shellfish resources of the Gulf of Alaska from Cape Spencer to Unimak Pass, 1948-1976 (a historical review), Volumes l-4. Processed Rep., various pagination. Northwest and Alaska Fish. Centeral., National. Marine. Fish. Servey., NOAA, 2725 Montlake Blvd. E., Seattle, WA 98112.
- Sakko, A.L. 1(998). Biodiversity of marine habitats. In: Barnard P, Biological diversity in Namibia – A country study. Windhoek. Namibian National Biodiversity Task Force.
Figure 1.
Map of Namibia depicting the spatial distribution of some individual trawls covered by the hake bottom trawl fishery off Namibia. (1997- 2014). The blue dots represent one trawl position, and the contour lines represent the water depth. The lines and letters indicate the areas according to sub-regions, where N = Northern, C = Central, S = Southern regions, respectively.
Figure 2.
Presents a dendrogram resulting from a hierarchical cluster analysis using the group-average linking method. The Bray-Curtis resemblance matrix was employed, and lines representing 85% similarity are depicted in dashed form. The figure displays the clustering based on latitude, and the groupings are labelled as A, B, and C.
Figure 3.
(a–f). Spatial catch rate (CPUE) distribution plots for the most frequently caught bycatch species sampled off the coast of Northern Namibia.
Figure 3.
(a–f). Spatial catch rate (CPUE) distribution plots for the most frequently caught bycatch species sampled off the coast of Northern Namibia.
Figure 4.
(a)– (f). Generalized Additive Model (GAM) outputs for pooled monthly CPUE variability (smoothers of the partial effect of months on the CPUE for selected bycatch species). Dashed lines indicate 95% confidence limits, and the y-axis shows the standardized value of the response.
Figure 4.
(a)– (f). Generalized Additive Model (GAM) outputs for pooled monthly CPUE variability (smoothers of the partial effect of months on the CPUE for selected bycatch species). Dashed lines indicate 95% confidence limits, and the y-axis shows the standardized value of the response.
Figure 5.
(a-f). Generalized Additive Model (GAM) outputs for pooled annual CPUE variability (smoothers of the partial effect of months on the CPUE for selected bycatch species). Dashed lines indicate 95% confidence limits, and the y-axis show the standardized value of the response.
Figure 5.
(a-f). Generalized Additive Model (GAM) outputs for pooled annual CPUE variability (smoothers of the partial effect of months on the CPUE for selected bycatch species). Dashed lines indicate 95% confidence limits, and the y-axis show the standardized value of the response.
Table 1.
Taxonomic list of bycatch species in the bottom trawl hake fishery by region (North, Central & South). W denotes the weight (int tons or kilograms), and %W denotes the percentage weight contribution of a species.
Table 1.
Taxonomic list of bycatch species in the bottom trawl hake fishery by region (North, Central & South). W denotes the weight (int tons or kilograms), and %W denotes the percentage weight contribution of a species.
| Species |
Station A (North) |
Station B (Central) |
Station C (South) |
Total |
| W |
%W |
W |
%W |
W |
%W |
W |
%W |
| Allocyttus verrucosus |
536.83 |
0.04 |
680.79 |
0.03 |
2018.36 |
0.04 |
3236.05 |
0.04 |
| Diplodus capensis |
227.08 |
0.02 |
- |
- |
- |
- |
227.10 |
0.00 |
| Epigonus spp |
300.01 |
0.02 |
1169.04 |
0.06 |
19132.32 |
0.34 |
20601.45 |
0.23 |
| Lepidotus caudatus |
500.91 |
0.03 |
1158.85 |
0.06 |
275536.06 |
4.96 |
277195.92 |
3.07 |
| Macrouridae spp) |
125.69 |
0.01 |
42.58 |
0.00 |
- |
- |
168.28 |
0.00 |
| Isurus oxyrinchus |
5254.94 |
0.36 |
31777.75 |
1.56 |
66132.95 |
1.19 |
103167.57 |
1.14 |
| Argyrosomus inodorus |
8820.81 |
0.61 |
1.44 |
0.00 |
- |
- |
8822.86 |
0.10 |
| Brama brama |
13774.57 |
0.95 |
132906.70 |
6.53 |
214866.74 |
3.87 |
361555.49 |
4.00 |
| Taractichthys logipinnis |
6392.39 |
0.44 |
52580.55 |
2.58 |
554515.56 |
9.99 |
613491.53 |
6.79 |
| Cheilidonicthys capensis |
60998.17 |
4.23 |
27783.48 |
1.37 |
2987.83 |
0.05 |
91775.07 |
1.02 |
| Dentex macrophthalmus |
474168.17 |
32.85 |
22312.40 |
1.10 |
7359.92 |
0.13 |
503874.44 |
5.58 |
| Trachurus capensis |
214469.55 |
14.86 |
832024.50 |
40.88 |
254748.45 |
4.59 |
1301298.24 |
14.41 |
| Helicolenus dactylopterus |
205521.73 |
14.24 |
264626.17 |
13.00 |
709196.45 |
12.77 |
1179371.60 |
13.06 |
| Zeus faber |
73660.21 |
5.10 |
15520.68 |
0.76 |
169334.35 |
3.05 |
258521.10 |
2.86 |
| Genypterus capensis |
273.26 |
0.02 |
9287.85 |
0.46 |
833358.76 |
15.01 |
842920.34 |
9.33 |
| Lophius vomerinus |
205926.64 |
14.27 |
367924.82 |
18.08 |
448784.37 |
8.08 |
1022668.17 |
11.32 |
| Thyrsites atun |
132.26 |
0.01 |
12564.01 |
0.62 |
448548.18 |
8.08 |
461245.08 |
5.11 |
| Austroglosus microlepsis |
98069.53 |
6.80 |
87933.89 |
4.32 |
16424.09 |
0.30 |
202438.63 |
2.24 |
| Thunus spp |
294.97 |
0.02 |
- |
- |
375.23 |
0.01 |
670.22 |
0.01 |
| Trachipterus trachypterus |
678.10 |
0.05 |
34440.76 |
1.69 |
1317225.68 |
23.72 |
1352346.28 |
14.97 |
| Thunnus albacores |
620.14 |
0.04 |
3.35 |
0.00 |
- |
- |
623.54 |
0.01 |
| Todarodes sagittatus |
72136.56 |
5.00 |
139988.22 |
6.88 |
198271.80 |
3.57 |
410408.46 |
4.54 |
| Raja species |
360.00 |
0.02 |
345.32 |
0.02 |
14347.19 |
0.26 |
15052.55 |
0.17 |
| Total |
1443242.5 |
|
2035073.2 |
|
5553164.3 |
|
9031480.0 |
|
Table 2.
provides the average abundance of the top five bycatch species in terms of their latitudinal distribution in groups A and C. The species are listed in the order of their contribution to the average dissimilarity between the two groups, with Southern regions represented by group A and central regions represented by group C.
| Average Dissimilarity = 21.25 |
|---|
| Species |
Cluster: A |
Cluster: C |
Av.Diss |
Diss/SD |
Contrib% |
Cum.% |
| R. species |
7.81 |
3.47 |
2.12 |
3.81 |
9.97 |
9.97 |
| A. microlepsis |
3.32 |
7.09 |
1.85 |
3.25 |
8.71 |
18.68 |
| G. capensis |
9.15 |
5.45 |
1.82 |
2.06 |
8.58 |
27.27 |
| T. atun |
6.71 |
3.19 |
1.72 |
2.31 |
8.11 |
35.38 |
| T. trachypterus |
5.61 |
3.03 |
1.32 |
1.63 |
6.21 |
41.59 |
Table 3.
Average abundance of the top five bycatch species in terms of latitudinal distribution in groups A (southern regions) and B (central regions). Species are listed in order of their contribution to the average dissimilarity between the two groups.
Table 3.
Average abundance of the top five bycatch species in terms of latitudinal distribution in groups A (southern regions) and B (central regions). Species are listed in order of their contribution to the average dissimilarity between the two groups.
| Average Dissimilarity = 28.88 |
|
|
|
|
|
| Species |
Cluster: A |
Cluster: B |
Av.Diss |
Diss/SD |
Contrib% |
Cum.% |
| D. macrophthalmus |
2.7 |
10.44 |
3.52 |
14.21 |
12.19 |
12.19 |
| G. capensis |
9.15 |
2.73 |
2.93 |
5.54 |
10.15 |
22.34 |
| C. capensis |
1.98 |
7.7 |
2.6 |
6.76 |
9 |
31.34 |
| T. atun |
6.71 |
1.83 |
2.22 |
5.55 |
7.69 |
39.02 |
| R. species |
7.81 |
3.43 |
1.99 |
4.89 |
6.89 |
45.91 |
Table 4.
The average abundances of the top five bycatch species in terms of latitudinal distribution in groups C (northern regions) and B. species are listed in order of their contribution to the average dissimilarity between the two groups. .
Table 4.
The average abundances of the top five bycatch species in terms of latitudinal distribution in groups C (northern regions) and B. species are listed in order of their contribution to the average dissimilarity between the two groups. .
| Average Dissimilarity = 17.70 |
|
|
|
|
|
| Species |
Cluster C |
Cluster B |
Av.Diss |
Diss/SD |
Contrib% |
Cum.% |
| D. macrophthalmus |
5.26 |
10.44 |
2.49 |
2.56 |
14.06 |
14.06 |
| C. capensis |
4.51 |
7.7 |
1.55 |
2.8 |
8.73 |
22.79 |
| Z. faber |
4.34 |
7.23 |
1.39 |
3.24 |
7.86 |
30.65 |
| A. inodorus |
0.33 |
3.03 |
1.32 |
1.39 |
7.44 |
38.09 |
| G. capensis |
5.45 |
2.73 |
1.3 |
2 |
7.37 |
45.46 |
Table 5.
Analysis of similarity (ANOSIM) of the three groups from HCA and MDS in terms of latitudinal distribution. p ˂0.05 in all cases, for the pairwise comparisons.
Table 5.
Analysis of similarity (ANOSIM) of the three groups from HCA and MDS in terms of latitudinal distribution. p ˂0.05 in all cases, for the pairwise comparisons.
| Clusters |
R Statistic |
Significance Level % |
Possible Permutations |
Actual Permutations |
Number >=Observed |
| a, b |
0.908 |
0.8 |
126 |
126 |
1 |
| a, c |
1 |
1.8 |
56 |
56 |
1 |
| b, c |
0.754 |
1.8 |
56 |
56 |
1 |
|
Disclaimer/Publisher’s Note: The statements, opinions and data contained in all publications are solely those of the individual author(s) and contributor(s) and not of MDPI and/or the editor(s). MDPI and/or the editor(s) disclaim responsibility for any injury to people or property resulting from any ideas, methods, instructions or products referred to in the content. |
© 2025 by the authors. Licensee MDPI, Basel, Switzerland. This article is an open access article distributed under the terms and conditions of the Creative Commons Attribution (CC BY) license (http://creativecommons.org/licenses/by/4.0/).