
Submitted:
12 February 2025
Posted:
12 February 2025
You are already at the latest version
Abstract
The study focuses on the returns to factors of electricity production by different technologies, which can be beneficial to the promotion of electricity production in the future. Six (6) technologies employed for electricity production in Thailand, which are coal-fired, natural gas-fired, biomass, hydropower wind turbines, and solar photovoltaic power plants, are included in the study. Cash flow analysis is used as the tool to identify the distribution of the plants’ revenues to different factors of productions. Revenues received from electricity sales are paid to the required expenses, and shared among the factors of production, namely fuel costs, operation and maintenance expenses, utilities, personnel wages, taxes, interests, loans, and dividends. Power plants of different technologies require different amounts of investments and proportions factors of production. It is interesting to learn how the payments are returned to the owners of the factors of the production, which include fuel and utility suppliers, workers, owners, financial institutes (through interests and loans), government and society (through taxes), for a unit price of electricity paid by customers.
Keywords:
Electricity generation
; Returns to Factors
; Cash flow analysis
1. Background and Literature Review
It is customary to justify a power generation project based on its economics and environmental impacts. Financial parameters, such as payback period, internal rate of return, and net present value, are evaluated on economic aspect. Environmental impact assessment (EIA), and environmental health impact assessment (EHIA), as well as strategic environmental assessment (SEA) are normally used to ensure the stability and sustainability of the electrical system development. Further consideration can be extended to the benefits to all production factors and stakeholders will additionally clarify and promote the most appropriate power plants in the future. In economics, there are four main factors of production: land, labor, capital, and entrepreneurs. When the products are sold, income from the sale of the products will be allocated as returns to the four factors of production (Returns to factors) as rent (Rent), wages (Wage), interest (Interest) and profits (Profit) respectively. The returns to the traditional production factors do not differentiate other factors of various technologies, such as the imported fuels and domestic fuels, foreign direct investment (FDI), and tax exemption. In addition, electricity energy from the same grid system is generally offered to its customers at the same price, regardless of the sources where it and how it is produced. End users are paying for electricity energy at the same rate. It can be beneficial to the end users to learn that how their payments are allocated to the factors of production. Two approaches to cost estimation can be considered for power plants, which are the top-down method based on scaling and detailed information from similar reactor systems, and the bottom-up estimating technique, that is adequately detailed to account for all construction commodities, plant equipment, and labor hours (EMWG_Guidelines, 2007).
Productivity is a significant indicator of competitiveness. An improvement in labor productivity and an advance in technology for the increase in capital productivity are the primary objectives for gaining advantages over industrial competition. Total factor productivity (TFP), which can be derived from assumed production functions, relating inputs and outputs, such as Cobb-Douglas production (Cobb & Douglas, December 1928) (Cottrell, 2019), Leontiff production function (Dietzenbacher & Lahr, 2004), and others, in the power-generating industry is considered a comparative measure of the industry. The approximate production function, like Cobb-Douglas production function, can be derived by using the data on output and inputs at the aggregate level (Felipe & Adams, 2005). As a result, the derived productivity represents of a industry, rather than productivity of each factor input in the production process. Thus, the average productivities can be useful for the comparison among various industries.
There were studies proposing fair and transparent revenue allocation among various participants, particularly when there were more than one participant involved in the sharing process. A general Nash bargaining model was proposed for multi-VPPs (Virtual Power Plants), which are aggregations of small-scale renewable energy resources, with respect to energy sharing and cost allocation of peer-to-peer energy transactions by Yan, et.al. (Yan, Gao, Ming, Abbes, & FRancois, 2023). They were able to show that the proposed model of the general Nash bargaining theory yielded a fairer benefit distribution and aligned with the promotion of the development of the distributed renewable energy resources. An optimal revenue sharing model of a wind-solar-storage hybrid energy plant was proposed (Zeng, Gao, Fang, Zhang, & Zhu, 2024) under medium and long-term green power trading market to facilitate the coordinated operation and equitable revenue allocation. It was found that the proposed coordinated scheduling strategy for the hybrid renewable energy plant could significantly reduce the deviation penalty of green power and increase the completion rate of transactions and net income in the green power and spot trading market, and the revenue sharing model effectively enhanced the operating revenue of energy storage power stations by considering the contribution of the energy storage power station and renewable energy in the green power market. A short-run production function was constructed (Forsund, Hjalmarsson, & Zheng, 2011). Data of 82 coal-fired power plants in the Chinese regions, such as generation of electricity in MWh for 1991, installed capacity in MW, labor input in numbers of employees, and coal in volume of standard coal was used for the production function derivation. The study of the structure of Chinese electricity-generating plants was limited by the available data set at the time. In order to promote wind energy resources in China, a comparison study of three (3) revenue allocation strategies was conducted; namely the nucleolar method, Shapley value method, and the equal modified disruption propensity (MDP) (Fan, et al., October 22-25, 2021). The order preference by similarity to ideal solution (TOPSIS) comprehensive evaluation method is used to determine the relative satisfaction of the three allocation strategies. Result showed that each power generation enterprise was more willing to accept the distribution of revenues by the equal MDP method allocation strategy. An economic model, which incorporates technical factors, was proposed to supersede the existing financial models used for the design basis and based on the maximum thermal efficiency excluding the operation expenses (OPEX) and the capital expenses (CAPEX). The model was simulated by using the information of the steam cycle of a 600 MW coal-fired power plant in the Philippines, and discussed for the benefit of future investment on power plant projects (Hong & Lee, 27 August 2018). A method for minimizing the imbalance of cost and revenue allocation at the level of Balancing Responsible Party (BRP), who were the license holders (producers, large consumers, suppliers, and grid operators) was proposed to increase the competitiveness among them (Oprea, Bara, & Ciurea, 2022). The proposed method was proved to ensure the benefits of the BRP members and to decrease their costs considerably.
It can be of benefit of the policy planners to be acknowledged of the revenue allocations among all factors of production and stakeholders of different technologies for electricity generation; i.e. coal-fired power plants, natural gas-fired power plants, biomass power plants, hydro power plants, wind power plants, and solar photovoltaic power plants. Different revenue allocation proportions to production factors can lead to different objectives of promotions.
2. Methodology
2.1. Cash Flow Analysis
Cash flow analysis is used to study the allocation of revenues from electricity sale to the factors of production and stakeholders through the companies’ financial statements (Carlson, 2020). The analysis has been conducted as follows:
Financial data (Cash flows) for power plants of various types technologies, such as coal-fired, natural gas-fired, hydropower, wind turbine, and solar photovoltaic, are collected. Such data includes installed production capacity, production volume, electricity selling price, number of employees, income, expenses and assets according to financial data from the company's annual financial statements from various sources such as the Securities and Exchange Commission, the company's website, the Stock Exchange of Thailand, and FERC Form-1 of the Federal Energy Regulatory Commission, United States, etc.
2) The accuracy of the accuracy of collected financial data is reviewed and verified.
3) Returns on production factors of the power plants with different technologies are analyzed.
4) Returns on the same production factor of the power plants of different technologies are compared.
2.2. Power Plant Information
According to the national plan, Thailand targets to commission new power plant capacity at 56,431 MW by 2037, of which 18,696 MW would be electricity from renewable energy. For solar energy, the target of new solar PV power plant capacity target in 2037 has been set at 8,740 MW, plus additional 550 MW capacity target of solar PV hybrid with other renewable energy source, and 2,725 MW floating solar PV as hybrid systems with large hydropower dams. As of 2020, cumulative PV installed capacity in the country was at 3,939.8 MWp, consisting of 3,933.7 MW of grid-connected PV systems and 6.1 MWp of off-grid PV systems. Most of the total installed capacity was ground-mounted PV systems. In 2020, the annual grid-connected systems installation in Thailand was 143.64 MWp, which included rooftop PV systems for the commercial sector of 127.25 MW, 12.69 MW of floating PV systems, and 3.7 MW of ground mounted systems (IEA, 2021).
There are six (6) technologies, of which the plant information was collected from various sources, included in the analysis. Those are a natural gas- fired power plant (SPP, 1997), a coal-fired power plant (Rokhmawati, 2023), a biomass power plant (CleanPowerAsia, Biomass Financial Model, 2020), a hydropower plant (ADB, 2002), a wind turbine plant (CleanPowerAsia, Wind Financial Model , 2020), and a solar photovoltaic power plant (CleanPowerAsia, Solar Financial Model, 2020). The assumptions and basic data of electricity generation at plant level to calculate the cash flow is presented in Table 1.
3. Results and Analysis
This study evaluates the cost of electricity generation using various technologies. Cash flow statements are financial documents that provide insight into a project's present cash inflow and outflow values of a project, which are the parameters to be analyzed. The cash outflows for operating, investing, and financing activities are considered as returns to factors of electricity generation and compared among those for different technologies. The cash outflows (COF) can be written as: (Rosemary Carlson, 2020).
COF = CFO + CFI + CFF
Where CFO is cash flows from operating activities
CFI is cash flows from investing activities,
CFF is cash flows from financing activities
Figure 1 provides an overview of the cash flow categories that can be differentiated when determining the returns on production factors of the power plants. Thailand’s power generation industry is structured in line with the enhanced single-buyer model, with state bodies being the sole buyers and distributors of power through the national grid. The revenues of power plants are divided into three flows, which are from electricity and steam sales and other income. The expenses are divided by activities: investments, electricity generation, and financial activities. The investment cost that is in forms of loan and investment capital. The operating expenses are fuel costs, O&M costs, insurance costs, income tax, which are associated with generation activities. The financial activities include debt interest, debt repayment, and dividend payment. The returns are directed to stakeholders, such as generators/distributors, investors.
In the calculation of cash flow analysis for the lifetime of the power plants, it was found that the share of expenses in electricity generation by technology is shown in Table 2. It can be summarized that fuel costs are the major cost for power plants using natural gas, coal, and biomass, ranging from 27.3% to 54.4% of their revenues. In contrast, hydropower, wind turbines, and solar photovoltaic power plants do not share their revenues for fuel costs.
The total expenses for operation activities for a natural gas-fired power plant, a coal-fired power plant, and a biomass power plant, ranging between 51.4% to 73.1% of their revenues, are much more than those for hydropower plant, wind turbine power plant, and a solar photovoltaic power plant, which are in the range of 17.8% to 40.6% of their revenues. On the opposite, the expenses on financial activities for a hydropower plant, wind turbine power plant, and a solar photovoltaic power plant, which range from 29.9% to 42.3% of their revenues, are higher than those for a natural gas-fired power plant, a coal-fired power plant, and a biomass power plant, which are in the range of 15.1% and 28.3%. It is worth mentioning that the larger shares of the revenue of the hydropower plant, wind turbine power plant, and solar photovoltaic power plant return to the owners, 29.4% to 43.3% of their revenues, compared with 11.8% to 16.1% for the natural gas-fired, coal-fired, and biomass power plants, as shown in Table 2 and Figure 2. In addition, income taxes (business taxes), which can be viewed as returns to the government and society, range from 3.5% to 11.5% of their income. Taxes are subject to governmental requirements and promotional programs. The findings can be useful for future power plans and promotion program establishments.
4. Conclusions and Discussion
Investment induces employment, procurement, and other indirect effects and welfare. An establishment of a power plant in the country requires a large amount of investment, which can be foreign direct investment (FDI) or domestic investment. The initial investments are used for the construction of the power plant, such as civil works, building and construction materials supplies, engineering, procurement and construction (EPC) services, machinery and mechanical equipment manufacturing and fabrication, electrical and electronic equipment suppliers, as well as general equipment supplies. In addition to initial investment, the power plant also requires operation factors and costs including fuel cost, operation and maintenance cost, tax, interest, and etc. Power plants of different technologies require different mounts of investments and operation costs. The revenues received from the sale of electricity are distributed among the owners of the various factors. It was found that fuel costs are the major cost for power plants using natural gas, coal, and biomass, ranging from 27.3% to 54.4% of their revenues, while a hydropower plant, a wind turbine power plant, and a solar photovoltaic power plant do not share their revenues for fuel costs.
The largest shares of the revenue of the renewable energy power plants return to the owner, 29.4% to 43.3% of their revenues. The total expenses for operation activities for a natural gas-fired power plant, a coal-fired power plant, and a biomass power plant, ranging between 51.4% to 73.1% of their revenues, are much more than those for hydropower plant, wind turbine power plant, and a solar photovoltaic power plant, which are in the range of 17.8% to 40.6% of their revenues. On the opposite, the expenses on financial activities and investment activities for a hydropower plant, wind turbine power plant, and a solar photovoltaic power plant are higher than those for a natural gas-fired power plant, a coal-fired power plant, and a biomass power plant. The costs of operation activities for a natural gas-fired power plant, a coal-fired power plant, and a biomass power plant are also major portions, the returns of which range between 51.4% to 73.1% of their revenues, and are much more than those for hydropower plant, wind turbine power plant, and a solar photovoltaic power plant, ranging from 17.8% to 40.6% of their revenues. On the contrary, most of the renewable energy power plants require larger amounts of investment per unit capacity than the traditional fossil and biomass power plants. The expenses on financial activities, for the returns as interests and repayments, for a hydropower plant, wind turbine power plant, and a solar photovoltaic power plant, which range from 29.9% to 42.3% of their revenues, are higher than those for a natural gas-fired power plant, a coal-fired power plant, and a biomass power plant, which are in the range of 15.1% and 28.3%. The remains of the revenue are turned to the owners. The larger shares of the revenue of the hydropower plant, wind turbine power plant, and solar photovoltaic power plant return to the owners, 29.4% to 43.3% of their revenues, compared with 11.8% to 16.1% for the natural gas-fired, coal-fired, and biomass power plants. It is also of interest to mention the income taxes (business taxes), which can be viewed as returns to the government and society, range from 3.5% to 11.5% of their income. Nevertheless, taxes are subject to governmental requirements and promotional programs.
Reports on Total Factor Productivity (TFP) and contributions of labor and capital among the eight major European electricity-producing companies from 2009 to 2012 were reviewed and compared with the total factor productivity of the Thai power-generating industry. During 2009-2012, TFP increased slightly for RWE, Enel, and EDF but declined sharply for GEN, E.ON, Fortum, and CEZ. In 2012, TFP for RWE was the largest at 0.196, while that for CEZ was the lowest at 0.129. The average TFPG Index of the power generation industry in Thailand, which was reported as a part of TSIC 32 (Other industries), increased from 12.62% in 2020 to 12.83% in 2021, or equivalent to TFP of 0.1262 in 2020 and 0.1283 in 2021 (Krizanic, Oplotnik, Kolsek, & Kavkler, 2015). The total factor productivity for 72 U.S. electricity and combination electricity and gas companies for the period 1972-2009 was measured using publicly-available data from the U.S. Federal Energy Commission and other sources, and found that during the period 1972 to 2009 the weighted average TFP growth of 72 U.S. electricity and combination electricity/gas companies was 0.85 percent (Makholm, Ros, & Case).
The returns to fuel costs of natural gas-fired, coal-fired, and biomass-fired are directed to resources’ owners. The return to the cost of biomass, which is originated as the local resource in the country, goes to the farmers in the agriculture sector. In contrast, the returns to the costs of fossil fuels, which are mainly imported, are remitted out of the country. Referred to PTT’s website (PTT, 2022), 51% of the natural gas consumed in Thailand has been imported, 35% in the form of LNG and 16% through the pipelines from Myanmar. The remaining 49% of the natural gas consumption has been obtained from the gulf of Thailand. 61.6% of the natural gas has been consumed in energy sector. According to the analysis, the returns to natural gas cost account for 54.4% the revenue. 97% of the fuel supplied to coal-fired power plants in the country has been produced in the country (EPPO, 2024), while the payments to the cost of biomass, such as bagasse and rice husk, are returned local farmers.
Author Contributions
Conceptualization, A.B.; methodology, A.B., and O.C; validation, A.B., O.C. and A.P.; formal analysis, O.C.; writing—original draft preparation, O.C., and A.P.; writing—review and editing, A.B.; project administration, A.P. All authors have read and agreed to the published version of the manuscript.
Funding
This research project is supported by King Mongkut’s University of Technology Thonburi (KMUTT), Thailand Science Research and Innovation (TSRI), and National Science, Research and Innovation Fund (NSRF) Fiscal year 2024 Grant number FRB 670016/0164.
Data Availability Statement
The original contributions presented in the study are included in the article, further inquiries can be directed to the author.
Conflicts of Interest
The authors declare no conflicts of interest.
References
- (ADB, 2002) ADB. (2002). The Theun-Hinboun Hydropower Project. Asian Development Bank.
- (Carlson, 2020) Carlson, R. (2020, January 4). Net Cash Flow and How It's Used. Retrieved from The Balance: https://www.thebalancesmb.com/what-is-net-cash-flow-and-how-is-it-used-393112.
- (CleanPowerAsia, 2020) CleanPowerAsia. (2020). Biomass Financial Model. USAID Clean Power Asia.
- (CleanPowerAsia, 2020) CleanPowerAsia. (2020). Solar Financial Model. USAID Clean Power Asia.
- (CleanPowerAsia, 2020) CleanPowerAsia. (2020). Wind Financial Model . USAID Clean Power Asia.
- (Cobb and Douglas 1928) Cobb, C., & Douglas, P. (December 1928). A Theory of Production. American Economic Review, 139-165.
- (Cottrell, 2019) Cottrell, A. (2019). The Cobb-Douglas Production Function. Economics.
- (Dietzenbacher and Lahr 2004) Dietzenbacher, E., & Lahr, M. L. (2004). Wassily Leontief and Input-Output Economics. Cambridge, U.K.: Cambridge University Press.
- (EMWG_Guidelines, 2007) EMWG_Guidelines. (2007). Cost Estimating Guidelines for Generation IV Nuclear Energy Systems. The OECD Nuclear Energy Agency for the Generation IV International Forum.
- (EPPO, 2024) EPPO. (2024). Energy Statistic Dash Board. Retrieved from Energy Policy and Planning Office: https://www.eppo.go.th/index.php/en/en-energystatistics/coal-and-lignite.
- (Fan et al., 2021) Fan, J., Zhu, J., Wu, W., Dong, H., Zhu, H., & Luo, T. (October 22-25, 2021). Revenues Allocation Model and Evaluation Method for Joint Transaction of Wind-Thermal Power Generation Right Based on Cooperative Game. The 5th IEEE Conference on Energy Internet and Energy System Integration. Taiyuan, China.
- (Felipe and Adams, 2005) Felipe, J., & Adams, F. (2005). "A Theory of Production", The Estimation Of The Cobb-Douglas Function: A Retrospective View. Eastern Economic Journal, Vol.31, Issue 3, 427-445.
- (Forsund et al., 2011) Forsund, F., Hjalmarsson, L., & Zheng, J. (2011). A short-run production function for electricity generation in China. Journal of Chinese Economic and Business Studies.
- (Hong and Lee, 2018) Hong, C.-S., & Lee, E.-B. (27 August 2018). Power Plant Economic Analysis: Maximizing Lifecycle Profitability by Simulating Preliminary Design Solutions of Steam-Cycle Conditions. Energies 2018.
- (IEA, 2021) IEA. (2021). National Survey Report of PV Power Applications in THAILAND: A Technology Collaboration Programme. IEA/Ministry of Energy, Thailand.
- (Krizanic et al., 2015) Krizanic, F., Oplotnik, Z. J., Kolsek, V., & Kavkler, A. (2015). Production Factors Use in the European Electricity Producing. International Journal of Energy Economics and Policy, 725-730.
- (Makholm et al., n.d.) Makholm, J. D., Ros, A. J., & Case, M. A. (n.d.). Total Factor Productivity and Performance-based Ratemaking for Electricity and Gas Distribution. NERA.
- (Oprea et al., 2022) Oprea, S.-V., Bara, A., & Ciurea, C.-E. (2022). A novel cost-revenue allocation computation for the competitiveness of balancing responsible parties, including RES. Insights from the electricity market. Renewable Energy 199 , 881-894. [CrossRef]
- (PTT, 2022) PTT. (2022). Energy Situation. Retrieved from PTT : https://pttwebtest8.pttplc.com/PTT-GSM-CSC_2021/content.aspx?id=Wa8FWO27Pecs0As94Dw5gQ%3D%3D.
- (Rokhmawati, 2023) Rokhmawati, A. (2023). Quantifying social costs of coal-fired power plant generation. Geography and Sustainability, 39-48.
- (SPP, 1997) SPP. (1997). Feasibility study of a cogeneration gas-fired power plant. Bangkok, Thailand.
- (Yan et al., 2023) Yan, X., Gao, C., Ming, H., Abbes, D., & FRancois, B. (2023). Optimal Scheduling Strategy and Benefit Allocation of Multiple Vertual Power Plants based on General Nash Bargaining Theory. International Journal of Electrical Power & Energy Systems, 152.
- (Zeng et al., 2024) Zeng, Z., Gao, X., Fang, B., Zhang, T., & Zhu, Y. (2024). Optimal revenue sharing model of a wind-solar-storage hybrid energy plant under the green power trading market. Frontiers in Energy Research. [CrossRef]
Figure 1.
Overview of the financial categories of electricity generation.
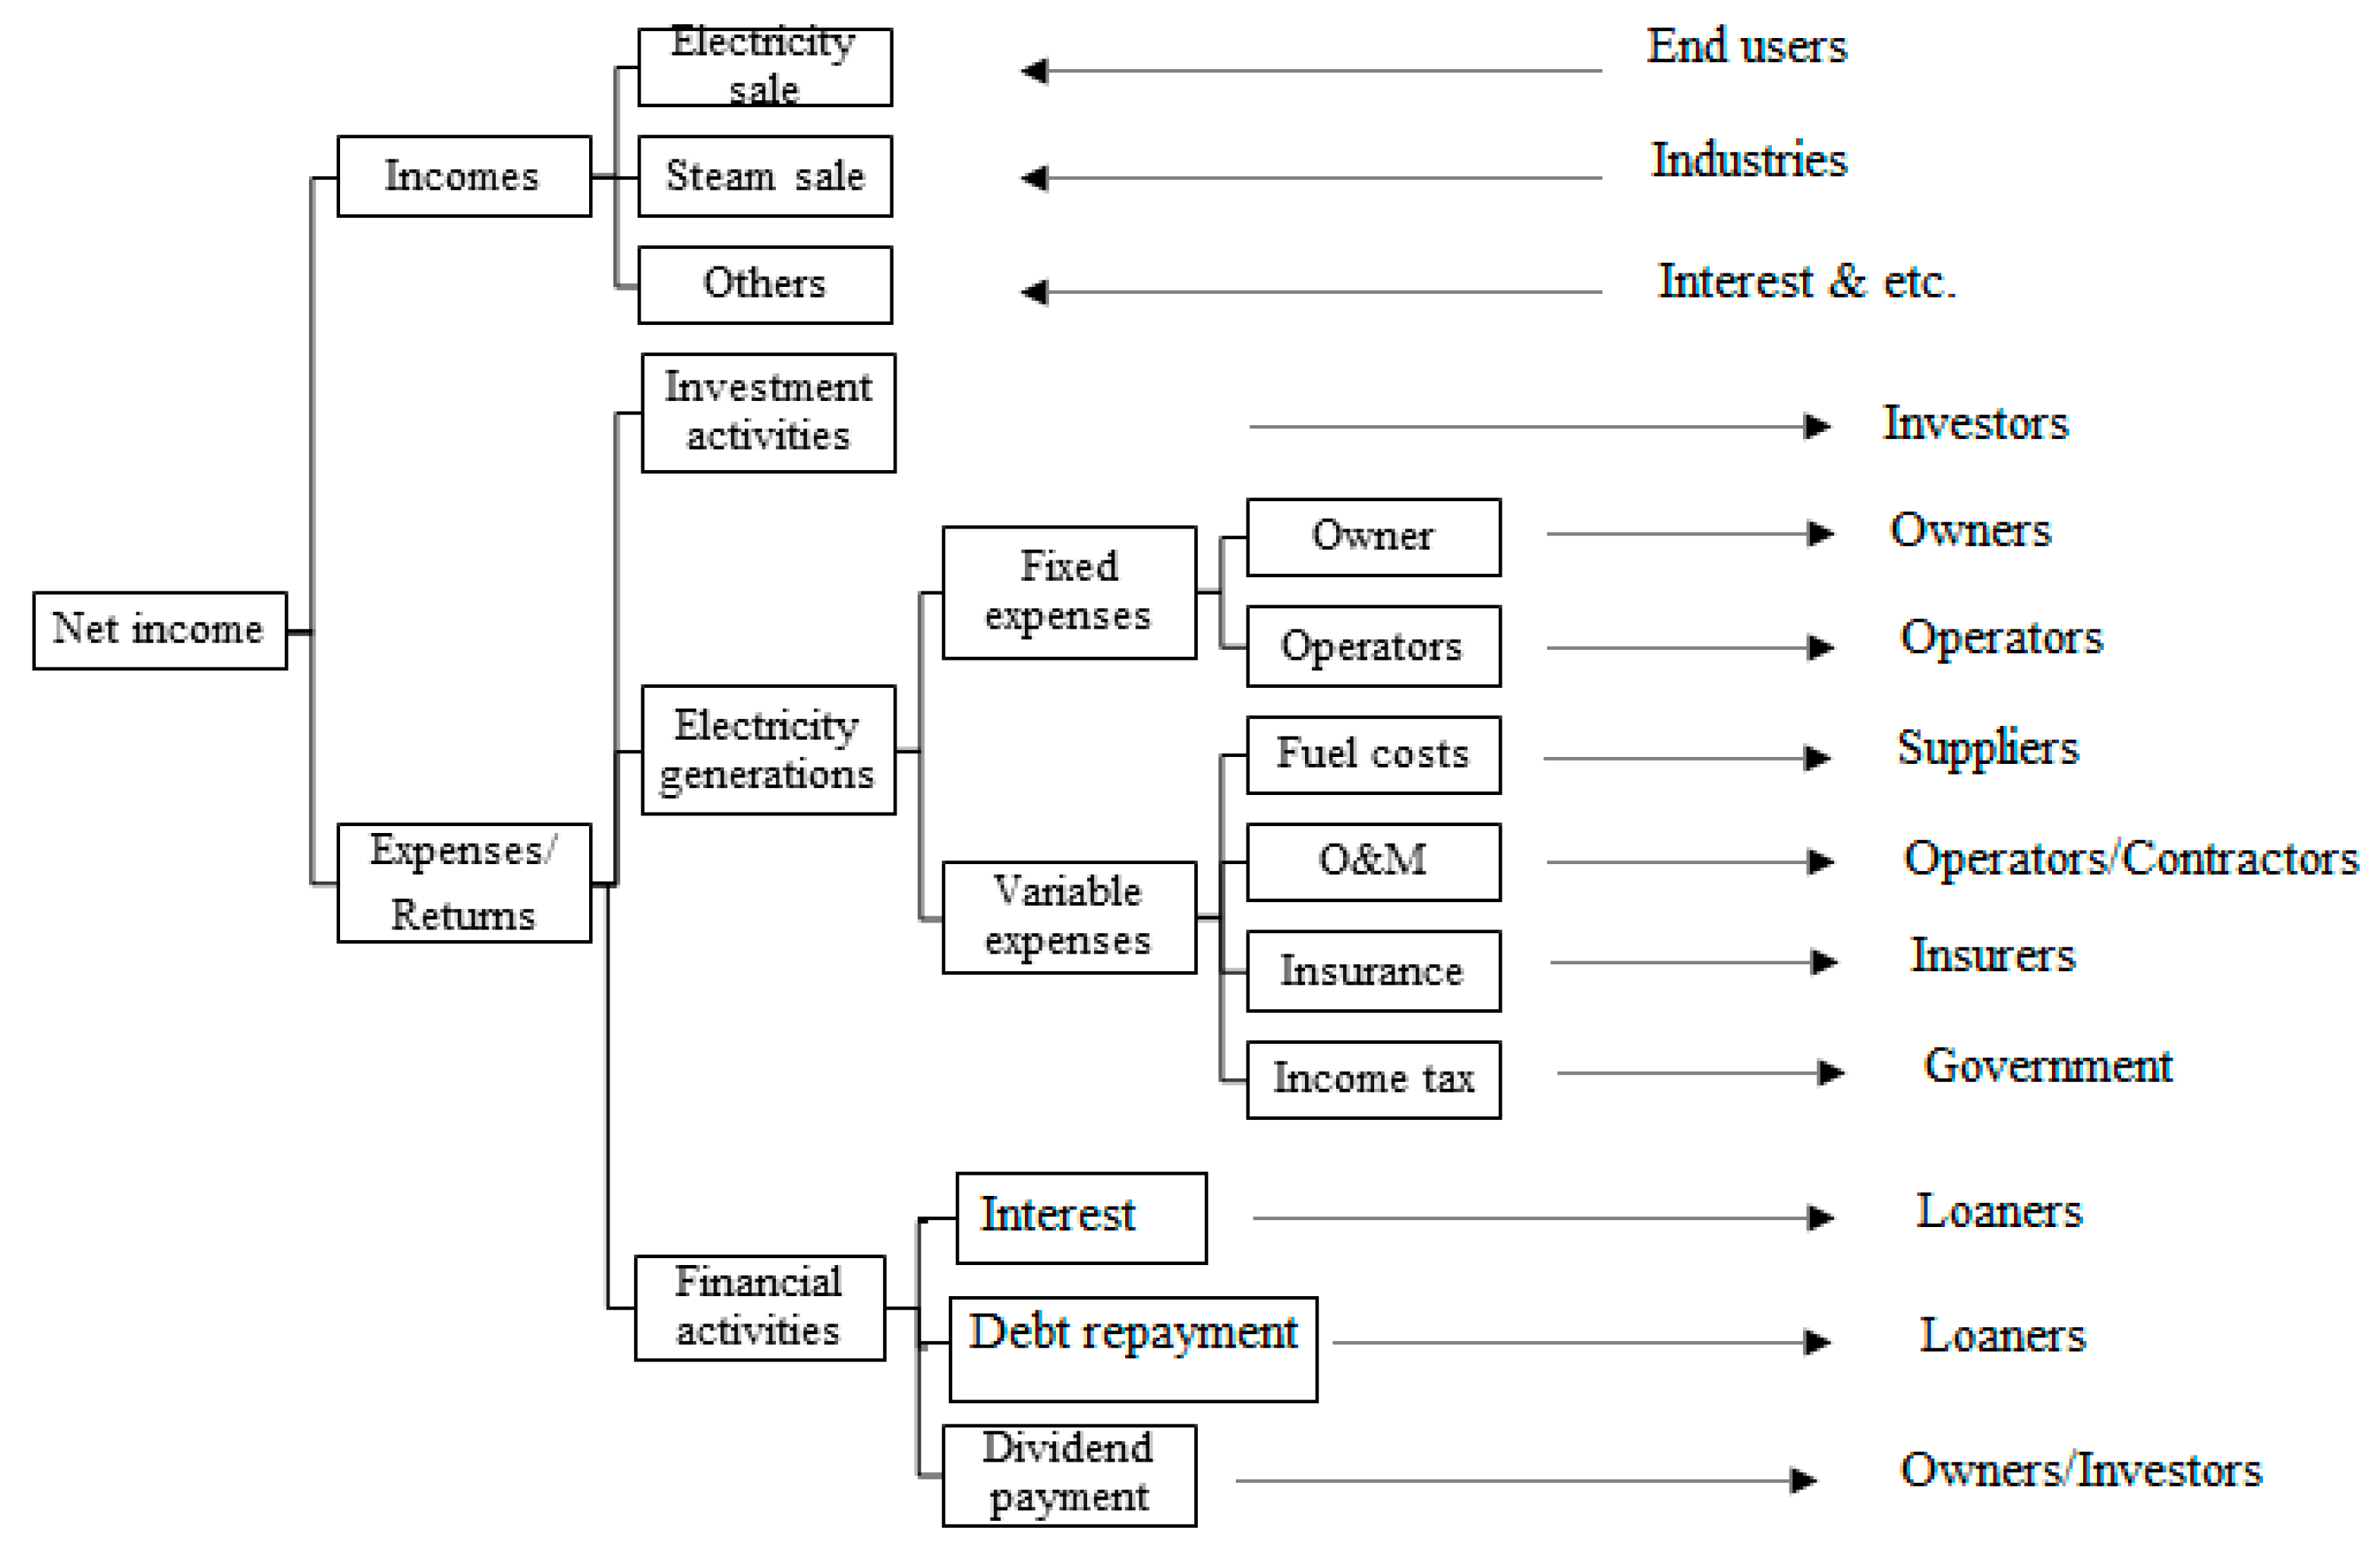
Figure 2.
Percentage Returns to Factors of Electricity Generation by technology.
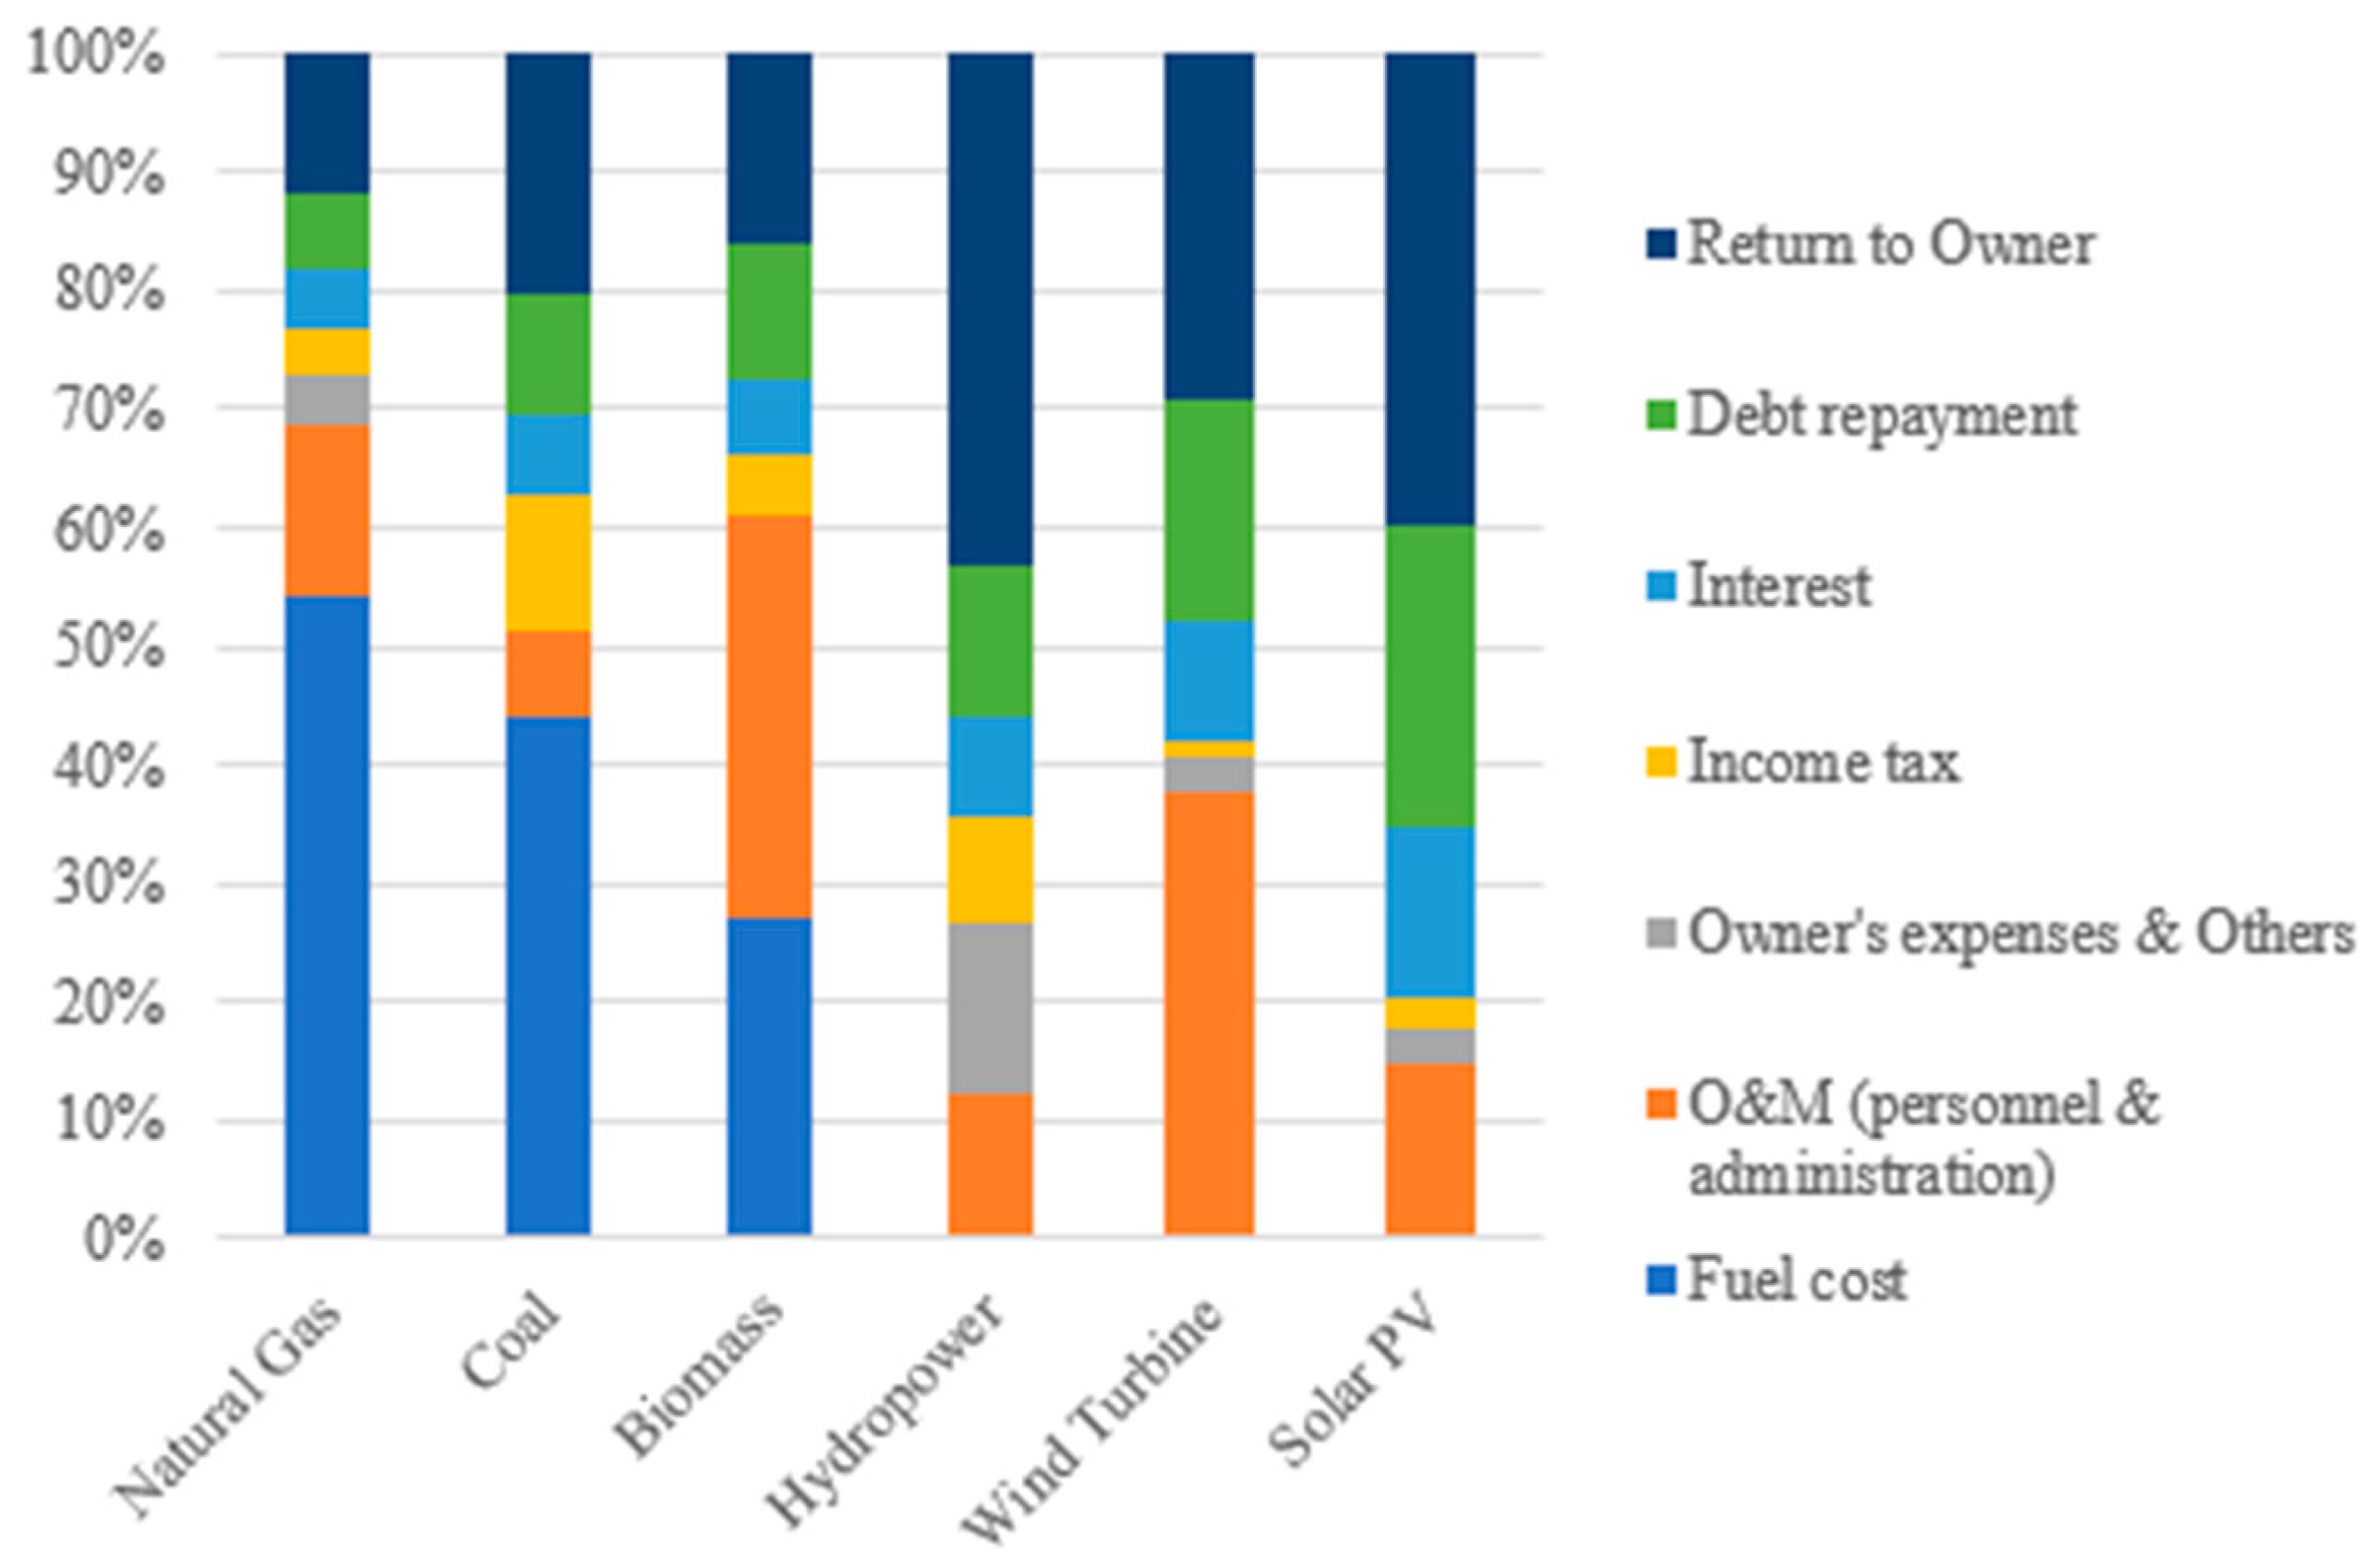

Table 1.
Power plants’ assumptions and basic data.
| Natural gas-fired | Coal-fired | Biomass-fired | Wind turbine | Hydropower | Solar photovoltaic | |
| Capacity (MW) | 118 | 220 | 20 | 210 | 200 | 50 |
| Electricity generated (GWh/year) | 769 | 1,380 | 126 | 1,645 | 617 | 66 |
| Life time (Year) | 20 | 25 | 20 | 25 | 25 | 25 |
| Investment (MB) | 3,239 | 2,345 | 1,915 | 617 | 9,507 | 1,420 |
| Construction started | 1996 | 2002 | 2020 | 1998 | 2020 | 2020 |
| Inflation rate (%) | 1.4 | 4.9 | 1.4 | 1.0 | 1.4 | 1.4 |
| Interest (%) | 7 | 7 | 7 | 8.3 | 8 | 8 |
| Income tax (%) | 0-20 | 0-20 | 0-20 | 0-15 | 0-20 | 0-25 |
Table 2.
Share of expenses in electricity generation by technology.
| Expenses | Natural Gas | Coal | Biomass | Hydropower | Wind Turbine | Solar PV |
| Operation Activities | ||||||
| Fuel cost | 54.4% | 44.2% | 27.3% | 0.0% | 0.0% | 0.0% |
| O&M (personnel & administration) | 14.3% | 7.2% | 33.9% | 12.4% | 37.6% | 14.7% |
| Owner's expenses & Others | 4.4% | 0.0% | 0.0% | 14.4% | 3.0% | 3.1% |
| Total Operation Activities | 73.1% | 51.4% | 61.2% | 26.8% | 40.6% | 17.8% |
| Financial Activities | ||||||
| Income tax | 3.5% | 11.5% | 4.8% | 8.7% | 1.5% | 2.5% |
| Interest | 5.4% | 6.7% | 6.3% | 8.6% | 10.0% | 14.5% |
| Debt repayment | 6.2% | 10.1% | 11.6% | 12.6% | 18.5% | 25.3% |
| Total Financial Activities | 15.1% | 28.3% | 22.7% | 29.9% | 30.0% | 42.3% |
| Investment Activities | ||||||
| Return to Owner | 11.8% | 20.3% | 16.1% | 43.3% | 29.4% | 39.9% |
| Total Investment Activities | 11.8% | 20.3% | 16.1% | 43.3% | 29.4% | 39.9% |
| Total cash cost | 100.0% | 100.0% | 100.0% | 100.0% | 100.0% | 100.0% |
Disclaimer/Publisher’s Note: The statements, opinions and data contained in all publications are solely those of the individual author(s) and contributor(s) and not of MDPI and/or the editor(s). MDPI and/or the editor(s) disclaim responsibility for any injury to people or property resulting from any ideas, methods, instructions or products referred to in the content. |
© 2025 by the authors. Licensee MDPI, Basel, Switzerland. This article is an open access article distributed under the terms and conditions of the Creative Commons Attribution (CC BY) license (http://creativecommons.org/licenses/by/4.0/).
Copyright: This open access article is published under a Creative Commons CC BY 4.0 license, which permit the free download, distribution, and reuse, provided that the author and preprint are cited in any reuse.


