
Submitted:
24 October 2024
Posted:
25 October 2024
You are already at the latest version
Abstract
This paper presents shortening the payback period of greenhouse gas reduction benefits from photovoltaic rooftop system. The objective was to evaluate the amount and returns of carbon credits. Economic analysis, and comparison of economic analysis with and without consideration of carbon credits from a 149.80 kWp, and 25.68 kWp photovoltaic rooftop system. This study evaluated the amount of electrical energy produced by a photovoltaic rooftop system estimated from the PVsyst program of the factory in Pathum Thani Province, Thailand. The economic indices that the researcher analyzed include the payback period, net present value (NPV), benefit cost ratio (B/C ratio), internal rate of return (IRR). It is divided into four cases studies: Case 1 is the base case, and Cases 2, 3, and 4 are considered carbon credits for 7, 14, and 25 years, respectively. The economic indices analyzed in Case 1 include financial internal rate of return (FIRR), payback period, financial net present value (FNPV), and B/C ratio. The economic indices analyzed in Cases 2, 3, and 4 are the economic internal rate of return (EIRR), economic net present value (ENPV), B/C ratio, payback periods, respectively. This paper outlines a new economic calculation approach that considers carbon credits produced by photovoltaic rooftop system to reach break-even points more quickly, and the application of carbon credits in conjunction with renewable energy.
Keywords:
payback period
; greenhouse gas
; benefit
; carbon credit
; photovoltaic rooftop system
1. Introduction
Greenhouse Gas (GHG) is mainly composed of carbon dioxide (CO2), which is produced by industrial processes and fuels combustion [1]. In atmosphere GHG are water, ozone, methane, carbon dioxide, and nitrous oxide, but nitrous oxide, carbon dioxide, and methane have a significant effect on global warming [2]. Climate change and global warming result from the emission of GHG. The greenhouse effect occurs when the atmosphere traps heat from certain gases [3]. The Third Session of the Conference of the Parties or Kyoto Protocol was established in 1997. This protocol set targets for reducing greenhouse gas emissions, involving approximately 40 developed countries. Under the Kyoto Protocol, the greenhouse gases include six types: nitrous oxide, methane, carbon dioxide, perfluorocarbons (PFCs), sulfur hexafluoride (SF₆), and hydrofluorocarbons (HFCs) [4]-[5]. Developing countries are not obligated to directly reduce greenhouse gas emissions but can voluntarily set their own appropriate emission reduction targets. Additionally, flexible mechanisms have been established that allow developed countries to purchase carbon credits.
The way to reduce greenhouse gas emissions and find replacements for greenhouse gas emissions is called “Carbon Credit”. The certificates showing the reduction of GHG in the atmosphere from projects that reduce or prevent GHG emissions is Carbon credits. Countries that can reduce greenhouse gas emissions are entitled to sell carbon credits to countries with greenhouse gas emissions that exceed standards [6]. Carbon dioxide emissions intensity is a measure of the quantity of carbon dioxide equivalent (CO2eq) emitted per unit of energy generated. This refers to GHG other than CO2, specifically methane and nitrous oxide. The fossil fuel technology used to produce electricity has a high emissions of carbon intensity due to burning of high carbon fuels [7]-[8].
Photovoltaic systems are used to generate electricity using green technology. The electrical energy produced was derived from natural energy sources. Solar panels convert sunlight into electrical energy according to the intensity of the energy from the sun [9]-[10]. Solar power can help reduce emissions of carbon dioxide by in place of intensive of carbon heat and source of energy. The quantity reduced greenhouse gas emissions depends on the quantity of general or heat energy replaced, and the intensity of carbon from source of energy. The energy type, and quantity used to manufacture, install, and operate solar energy systems [7]. Solar energy technology has great potential to reduce reliance on electricity generation from fossil fuels. Solar systems can be expanded with energy storage systems, which can release stored energy at night, thereby enhancing the reliability of the system [11]. The electricity distribution of distribution system; (a) in case of no solar power system; (b) in case of install solar power system at bus 3 are presented in Fig. 1.
Figure 1(a) shows that, when there are no photovoltaic in the system, the total energy produced by the generator is 500 kW. The energy received from the grid is generated from fossil fuels. Figure 1(b) shows when a 100 kW photovoltaic is installed at bus 3, the total power produced by the generator is 400 kW because the distribution system compensates for the energy from the photovoltaic. Therefore, the reduction in fuel usage for electricity production from generators due to the installation of photovoltaic in the distribution system helps reduce carbon dioxide and greenhouse gas emissions.
Previously, the assessment carbon credits and economic analysis many were studied. Naskar, et al. (2017) estimated and analysis 5 kWp photovoltaic system at the JIS College of Engineering, Kalyani. The purpose was assess cost analysis of photovoltaic system with a capacity of 5 kWp. Assessment of carbon credits over 25 years. Comparison of payback with and without carbon credits. The payback period is reduced to nearly 4 years, when carbon credits are traded [12]. Kale (2019) analyzed economic of photovoltaic off grid capacity of 6 kW from February 2017 to January 2018. Nine years is the payback period result and reduce approximately 5.6 tons of carbon dioxide per year and 112 tones over its lifetime. Considering carbon credit as payback, the period drops to four to five years [13]. Bhadke, et al. (2022) designed and evaluated solar PV power plants and carbon credits from Government College of Engineering, Amravati. PV panel uses 1,477 modules. The module capacity is 440 Wp. Each array contains 17 modules. 8.24 years as the payback period. Carbon credits received from the facility were 20,574.07 tCO2eq [14]. Natchapol Ruangsap, et al. (2023) estimated quantity and return of carbon credit from hybrid solar rooftop system. The capacity of system is 25.68 kW. Duration of carbon credit estimation is 25 years. The result quantity and return of carbon credit in 25 years is 368.29 tCO2eq and 11,162.74 baht [15]. Natchapol Ruangsap, et al. (2023) analyzed economic of hybrid solar rooftop systems. The capacity of system is 149.80 kW. Duration of carbon credit estimation is 25 years. The result quantity and return of carbon credit in 25 years is 2,059.1515 tCO2eq and 62,412.8806 baht. The payback period consider carbon credit is 8 years and 6 months, which can pay back 11 days faster than not considering a carbon credits [16].
Therefore, this paper analysis of economic from photovoltaic system on the rooftop combined with carbon credits. This study discusses how to calculate the amount, and price of carbon credits in Thailand. The major contributions of this study are as follows:
- Calculate the amount and price of carbon credits from photovoltaic systems in Thailand. Carbon credits were assessed based on the quantity of energy of electrical was produced by photovoltaic rooftop system using PVsyst program.
- Economic analysis index include payback period, NPV, B/C ratio and IRR. The financial economic analysis variables include project costs, O&M costs, and project returns, whereas the economic analysis variables include project costs, O&M costs, returns from the project, and income from selling carbon credits from the projects.
2. Background
The factory used electricity from the Provincial Electricity Authority (PEA) through transformers of 100 kVA, and 800 kVA. A diagram of the power supply to the factory is shown in Figure 2.
The roof of the factory at 100 kVA installs divides two orientations. The first orientation: tilts is 5° and azimuth is -70°. The second orientation: tilts is 5° and azimuth is 110°. The schematic diagram of photovoltaic rooftop system capacity 25.68 kW is shown in Figure 3.
Figure 3 shows that the factory roof has 48 modules. The capacity of the module was 535 W, and the system used two inverters. Each inverter had a capacity of 10 kW. The roof of the factory at 800 kVA the plant load measured by the Provincial Electricity Authority of Thailand before installing the photovoltaic rooftop system. The results show that the average plant load was 145.54 kW, and the RMS currents A, B, and C were 90.67, 82.16, and 84.85 A, respectively. A diagram of photovoltaic rooftop system capacity 149.80 kW is presented in Fig. 4.
Figure 4 shows that the system consists of 20 strings. Each string has 14 modules. A total of 280 modules were used. The capacity of the module was 535 W, and the system uses one inverter capacity of 100 kW.
3. Evaluation of Greenhouse Gas Reduction
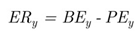
The amount of greenhouse gases that can be reduced in terms of carbon dioxide equivalent (CO2eq) can be calculated using Equation 1.
 |
(1) |
From equation 1
| ERy | is amount of greenhouse gas emission reduction from project implementation in year y (tCO2eq per year). |
| BEy | is emission of baseline in year y (tCO2eq per year). |
| PEy | is emission of project in year y (tCO2eq per year). |
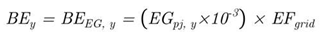
Electricity production from solar energy in this study falls within the scope of calculation according to the methodology for producing electricity of renewable energy to replace using electricity from transmission system or distribution system [17]–[18], which can be calculated using Equation 2.
 |
(2) |
From equation 2
| BEEG,y | is amount of greenhouse gas emissions from electricity generation of grid in year y (tCO2eq per year). |
| EGPJ,y | is amount of electricity produced from the photovoltaic system in year y (kWh per year). |
| EFgrid | is greenhouse gas emissions from electricity generation of grid (tCO2eq per MWh). |
The EFgrid in Equation 2 for solar power projects is 0.4857 tCO2 per MWh [19]. It was assumed that was constant throughout the study period. PE is equal to zero because no fossil fuels or electricity is used in the greenhouse gas reduction project.
4. Thailand Policy
4.1. Thailand National Economic and Social Development Plan
In milestone 10 of National Economic and Social Development Plan (2023-2027), “Thailand was a circular economy and a low-carbon society” [20]. Target 3 is establishing a sustainable low-carbon society. In 2027 a proportion of renewable energy will increase by no less than 24 percent in the final energy consumption.
4.2. Thailand Integrated Energy Blueprint
Thailand integrated energy blueprint viz
- Alternative Energy Development Plan (AEDP).
- Energy Efficiency Development Plan (EEDP).
- Power Development Plan (PDP).
- Gas Plan.
- Oil Plan.
4.3. Net Zero Emission, and Carbon Neutrality
5. Economic Analysis Index
Economic analysis encompasses two distinct types. Financial analysis pertains to evaluating the financial viability of individual projects, assessing their private benefits. On the other hand, economic analysis delves into the broader implications of projects on society as a whole. While financial analysis concentrates on personal financial ramifications, economic analysis is concerned with forecasting macroeconomic trends and their societal repercussions.
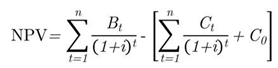
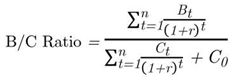
5.1. Net Present Value
NPV represents variance between cash inflows of present value, and that outflow of cash. This analysis yields a project’s return at discount rate. NPV can be calculate using equation (3).
 |
(3) |
Where:
| Bt | is return/year. |
| Ct | is cost/year. |
| C0 | is first year cost. |
| i | is rate of discount. |
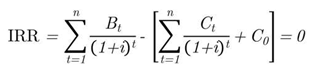
5.2. Internal Rate of Return
Discount rate that reduces NPV of projects to zero is IRR. IRR is a tool used to assess the feasibility of a project.
 |
(4) |
Where:
| r | is IRR. |
5.3. Benefit Cost Ratio
A comparative ratio between costs of present value and returns over the life of project.
 |
(5) |
From equation (5) the project is accepted, if B/C ratio > 1. The project is rejected, if B/C ratio < 1.
5.4. Payback Period
 |
(6) |
6. Case Study
The results and discussions are presented in this section. The first step was to evaluate the quantity and value of the carbon credits. The results of the economic analysis of the 149.80 kWp and 25.68 kWp hybrid solar power generation systems are presented. The results of the benefit analysis of the hybrid solar power generation systems in the same area are presented.
6.1. Evaluation of Quantity and Value of Carbon Credits
In this section, two positions viz 149.80, kWp and 25.68 kWp photovoltaic rooftop systems are considered. Evaluation of quantity and value of carbon credit from photovoltaic rooftop systems capacity 149.80 kWp is shown in Table 2.
Figure 5.
Comparison of quantity and value of carbon credit from photovoltaic system 149.80 kWp.
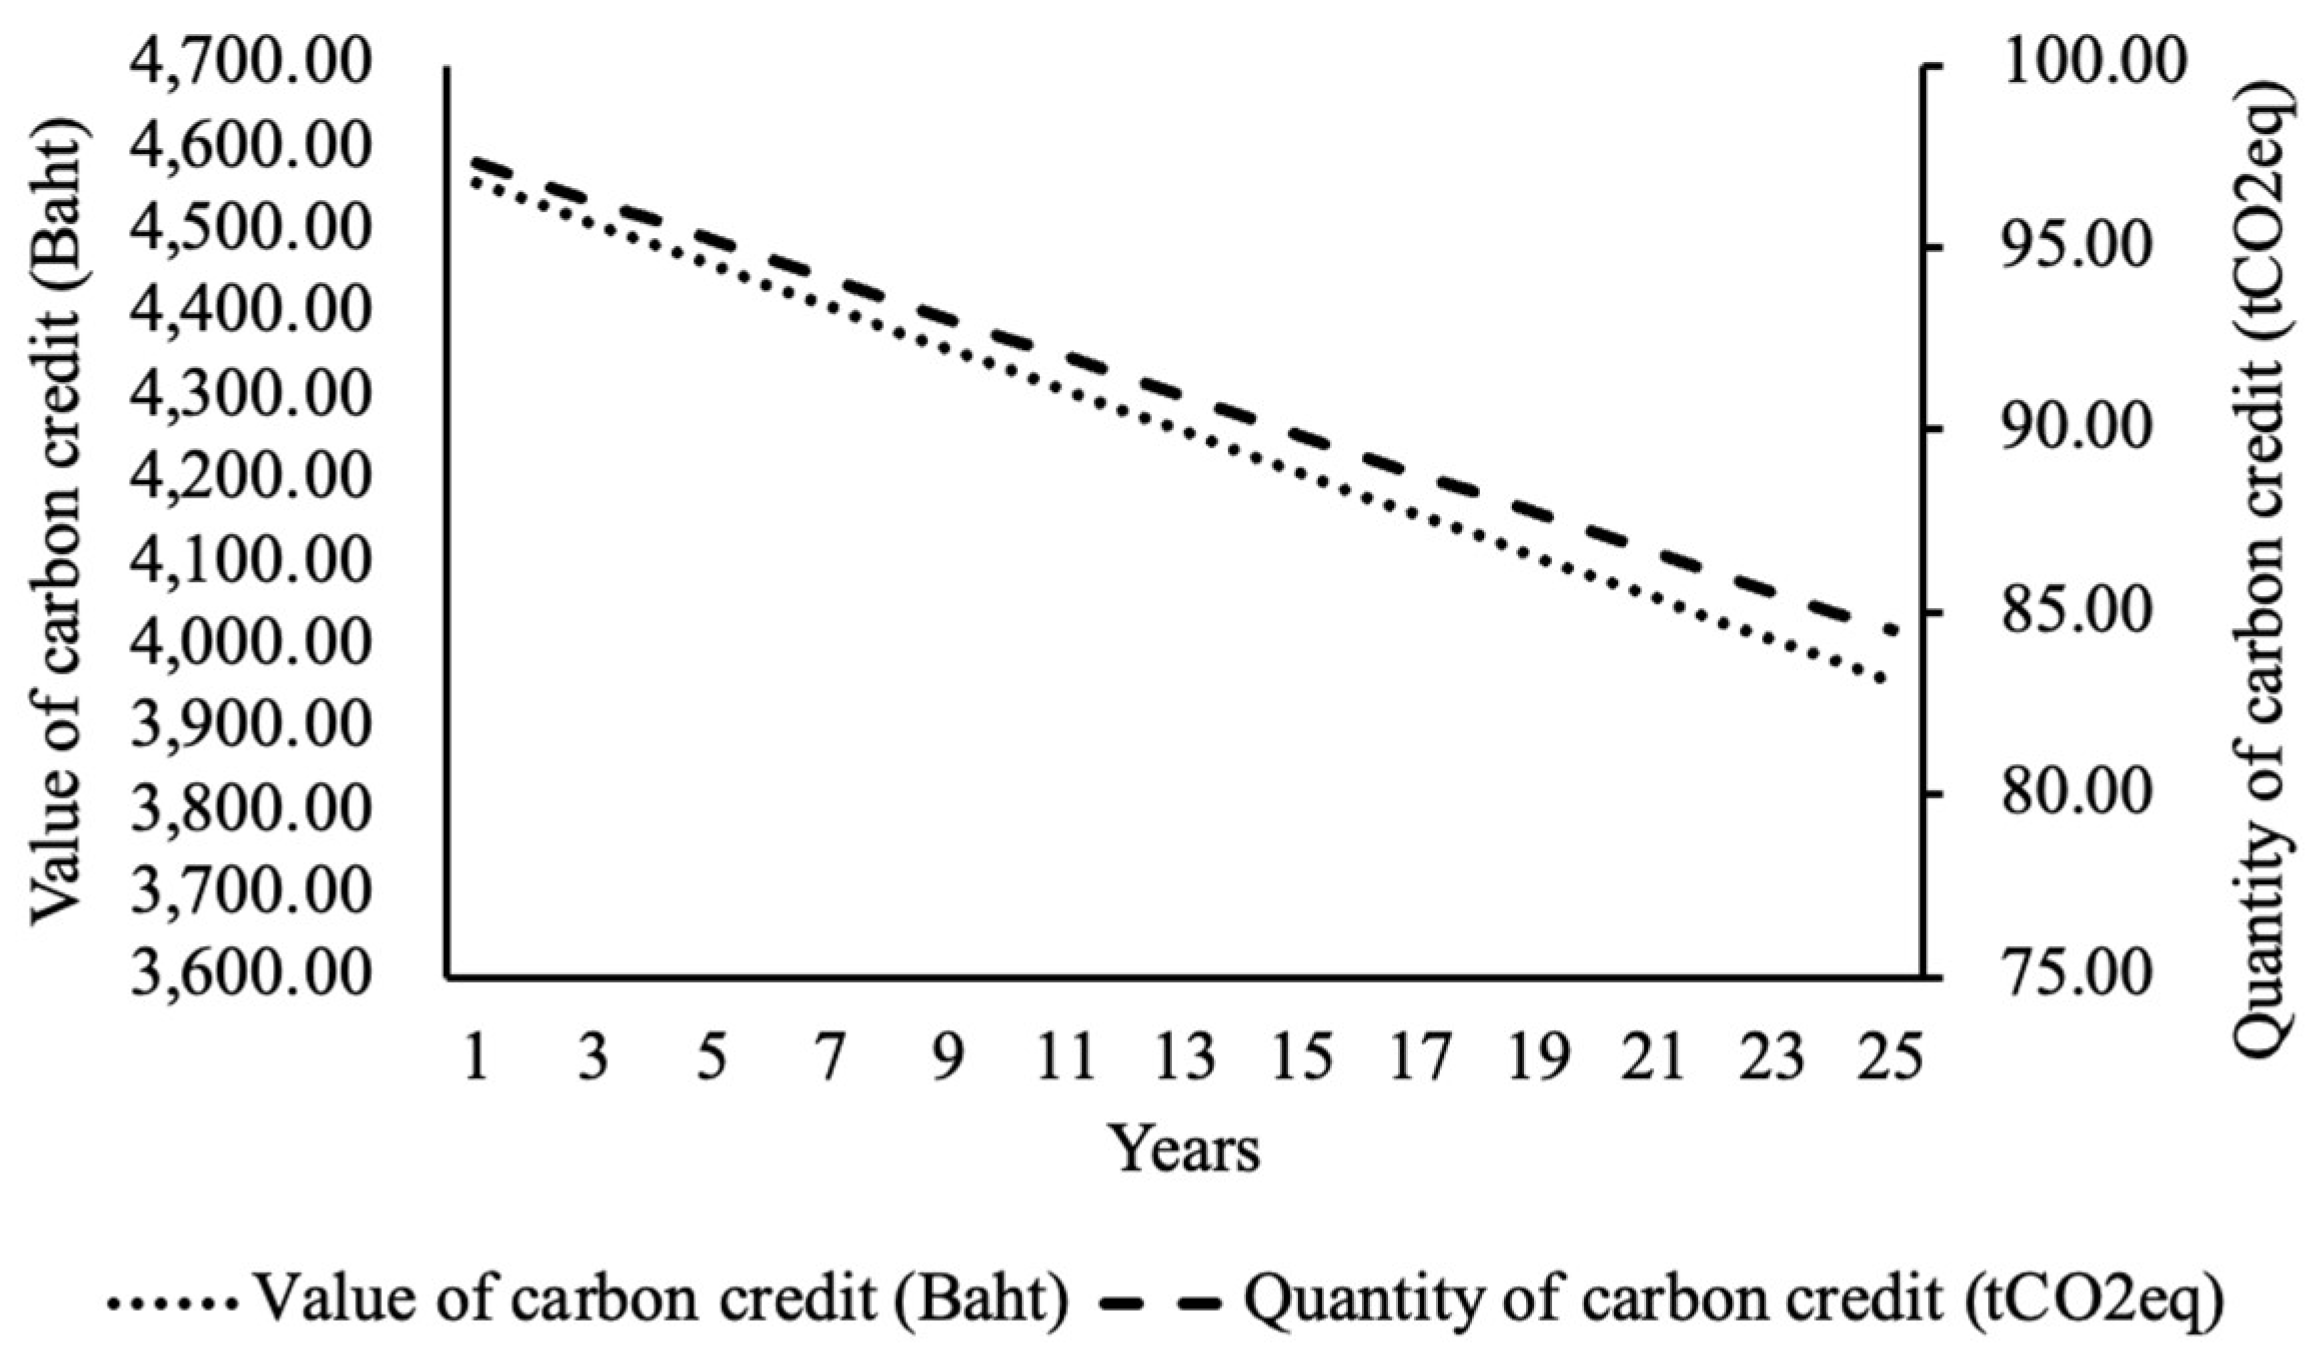
It can be calculated as carbon credits of 97.32 tCO2eq, 94.11 tCO2eq, 90.36 tCO2eq, and 84.48 tCO2eq, equivalent to 4,557.66 baht, 4,407.26 baht, 4,231.79 baht, and 3,956.05 baht, respectively. Evaluation of quantity and value of carbon credit from photovoltaic rooftop systems capacity 25.68 kWp is shown in Table 3.
From Table III. shows electricity production results estimated from the PVsyst program in years 1, 7, 14, and 25 were 35,047.00 kW, 33,890.45 kW, 32,541.14 kW, and 30,420.80 kW, respectively. It can be calculated as carbon credits of 17.02 tCO2eq, 16.46 tCO2eq, 15.81 tCO2eq, and 14.78 tCO2eq, equivalent to 797.16, 770.85, 740.16, and 691.93 baht, respectively.
Figure 6.
Comparison of quantity and value of carbon credit from photovoltaic system 25.68 kWp.

6.2. The Economic Analysis

Table 4.
Cost of project and benefit from photovoltaic rooftop systems capacity 149.80 kWp.
| Year | Cost | Benefit | ||
|---|---|---|---|---|
| Investment (Baht) |
O&M (Baht) |
Benefit (Baht) |
Cost of Carbon Credit (Baht) | |
| 0 | 5,827,220 | 0.00 | 0.00 | 0.00 |
| 1 | 0.00 | 0.00 | 735,693.31 | 4,557.66 |
| 2 | 0.00 | 0.00 | 731,646.99 | 4,532.60 |
| 3 | 0.00 | 44,940.00 | 727,600.68 | 4,507.53 |
| 4 | 0.00 | 44,940.00 | 723,554.37 | 4,482.46 |
| 5 | 0.00 | 44,940.00 | 719,508.05 | 4,457.40 |
| 6 | 0.00 | 44,940.00 | 715,461.74 | 4,432.33 |
| 7 | 0.00 | 44,940.00 | 711,415.43 | 4,407.26 |
| 8 | 0.00 | 44,940.00 | 707,369.11 | 4,382.19 |
| 9 | 0.00 | 44,940.00 | 703,322.80 | 4,357.13 |
| 10 | 0.00 | 44,940.00 | 699,276.49 | 4,332.06 |
| 11 | 0.00 | 44,940.00 | 695,230.17 | 4,306.99 |
| 12 | 0.00 | 44,940.00 | 691,183.86 | 4,281.93 |
| 13 | 0.00 | 44,940.00 | 687,137.55 | 4,256.86 |
| 14 | 0.00 | 44,940.00 | 683,091.24 | 4,231.79 |
| 15 | 0.00 | 44,940.00 | 679,044.92 | 4,206.72 |
| 16 | 0.00 | 44,940.00 | 674,998.61 | 4,181.66 |
| 17 | 0.00 | 44,940.00 | 670,952.30 | 4,156.59 |
| 18 | 0.00 | 44,940.00 | 666,905.98 | 4,131.52 |
| 19 | 0.00 | 44,940.00 | 662,859.67 | 4,106.46 |
| 20 | 0.00 | 44,940.00 | 658,813.36 | 4,081.39 |
| 21 | 0.00 | 44,940.00 | 654,767.04 | 4,056.32 |
| 22 | 0.00 | 44,940.00 | 650,720.73 | 4,031.25 |
| 23 | 0.00 | 44,940.00 | 646,674.42 | 4,006.19 |
| 24 | 0.00 | 44,940.00 | 642,628.10 | 3,981.12 |
| 25 | 0.00 | 44,940.00 | 638,581.79 | 3,956.05 |
| Total | 5,827,220 | 1,033,620 | 17,178,438.71 | 106,421.45 |
From Table 5, the NPV is calculated at a discount rate of 10%. Case 1 is the base case, without calculating carbon credits as part of the economic benefit. Therefore, it is the FNPV, and FIRR. Cases 2, 3, and 4 considered carbon credits. Therefore, these are the ENPV, and EIRR variables.
As shown in Table 6, the total investment is 1,766,336 baht. The total O&M cost was 259,440.00 baht. The total benefit is 3,004,585.04 baht. The total cost of the carbon credit was 18,613.58 baht. The economic index results of the 25.68 kWp photovoltaic rooftop system is presented in Table 7.
From Table 7, the NPV is calculated at a discount rate of 10%. Case 1 is the base case, without calculating carbon credits as part of the economic benefit. Therefore, it is the FNPV, and FIRR. Cases 2, 3, and 4 considered carbon credits. Therefore, these are the ENPV, and EIRR variables. The NPV results were negative. The factory was located at the end of the transmission line. Power outage problems frequently occur. Therefore, it is necessary to install a solar-cell system.
6.3. The Analysis Benefit Same Area
Photovoltaic rooftop system capacity 25.68 kWp, discount rate 10%, FNPV has a value of -729,060.75 baht, FIRR is 3.88%, and payback period is 15.535 years. The above numbers indicate that it is not suitable for investment, but because the factory needs to solve the problem of temporary voltage drops and power outages during the rainy season. Backup loads include server and office lighting systems. This is because the installation area of the 149.80 kWp, and 25.68 kWp photovoltaic rooftop systems is in the same area. And 149.80 kWp photovoltaic rooftop systems had a payback period of 8.493 years.
Therefore, the profit of the 149.80 kWp photovoltaic rooftop systems after payback was combined with that of the 25.68 kWp photovoltaic rooftop systems for a faster payback. Benefit analysis of photovoltaic rooftop systems capacity 25.68 kWp combined profit of photovoltaic rooftop systems capacity 149.80 kWp after payback is shown in Table 8.
From Table 8 payback period of photovoltaic rooftop systems capacity 25.68 kWp, when combined profit photovoltaic rooftop system capacity 149.80 kWp. In cases 1, 2, 3, and 4, the mean age was 10.495 years, 10.447 years, 10.431 years, and 10.431 years, respectively.
7. Conclusion
This paper evaluated an amount of electric power produced by a hybrid solar power generation system estimated using the PVsyst program. This study presents a method for calculating the quantity and value of carbon credits from hybrid solar power generation systems within the scope of calculations based on Voluntary Greenhouse Gas Reduction Methodology for renewable electricity generation. (T-VER-S-METH-01-01), and the value of carbon credits is determined from the purchase price of TVERs separated by project type (solar energy) on August 8, 2024. It is divided into four cases studies: case 1, the base case; case 2, consideration of carbon credits for 7 years; case 3, consideration of carbon credits for 14 years; and case 4, consideration of carbon credits for 25 years. The economic indices analyzed in Case 1 include FNPV, FIRR, B/C ratio, and payback period. The economic indices analyzed in Cases 2, 3, and 4 are the ENPV, EIRR, B/C ratio, and payback periods, respectively.
The study found that the method for calculating the payback of a hybrid solar power generation system combined with carbon credits could achieve payback faster than the calculation without considering carbon credits. This could be another option for installers to consider. This is because it is an additional channel for reducing greenhouse gases and is another way to earn income. When applied to a large system, it produces meaningful results.
This paper outlines a new economic calculation approach that considers the carbon credits produced by rooftop solar hybrid systems to reach break-even points more quickly and is the application of carbon credits in conjunction with renewable energy.
Author Contributions
Conceptualization, N.R., S.N. and N.R.; Methodology, N.R., S.N. and N.R.; Validation, N.R.; Investigation, N.R., S.N. and N.R.; Writing—original draft, N.R.; Writing—review & editing, N.R. and S.N. All authors have read and agreed to the published version of the manuscript.
Funding
This research received no external funding.
Data Availability Statement
The study's original contributions are included within the article, and any further inquiries can be directed to the corresponding authors.
Acknowledgments
The authors would like to express his sincere thanks to the Rajamangala University of Technology Phra Nakhon (RMUTP), Thailand and Thai Carton (Rangsit) Service Co., Ltd. for their support.
Conflicts of Interest
The authors declare no conflicts of interest.
References
- Chilukuri, Y.; Usman, A.; Rajpurohit, B.S. Assessing the Impact of Renewable Energy Sources to Achieve Net Zero Emissions. In Proceedings of 2023 IEEE Conference on Technologies for Sustainability (SusTech), Portland, OR, USA, 19-22 April 2023.
- Tavassoli, M.; Pirzaman, A.K. Comparison of effective greenhouse gases and global warming. In Proceedings of 2023 8th International Conference on Technology and Energy Management (ICTEM), Mazandaran, Babol, Iran, Islamic Republic of, 08-09 February 2023.
- Albuquerque, F.D.B.; Maraqa, M.A.; Chowdhury, R.; Mauga, T.; Alzard, M. Greenhouse gas emissions associated with road transport projects: current status, benchmarking, and assessment tools. Transportation Research Procedia 2020, 48, 2018–2030.
- Iwata, H.; Okada, K. Greenhouse gas emissions and the role of the Kyoto Protocol. Environmental Economics and Policy Studies 2012, 16, 325–342.
- Moiceanu, G.; Dinca, M.N. Climate Change-Greenhouse Gas Emissions Analysis and Forecast in Romania. Sustainability 2021, 13, 12186.
- Sanglimsuwan, K. Carbon Markets: the Simple Fact. Panyapiwat Journal 2011, 3, 123–133.
- Nelson, J.; Gambhir, A.; Daukes, N.E. Solar power for CO2 mitigation. Grantham Institute for Climate Change Imperial College London 2014, Briefing Paper No 11, 1 – 15.
- Naskar, R.; Ghosh, S.; Mandal, R. Analysis on Carbon Credit of a 5KWP Solar Photovoltaic Power Plant at JIS College of Engineering, Kalyani. Imperial Journal of Interdisciplinary Research (IJIR) 2016, 2, 1,506–1,511.
- Ruangsap, N.; Nedphokaew, S.; Rugthaicharoencheep, N. Planning and Operation Enhanced Voltage Profile by Using Distributed Generators Installation in Distribution System with Feeder Reconfiguration. In Proceedings of 2022 International Conference on Power, Energy and Innovations (ICPEI), Pattaya Chonburi, Thailand, 19-21 October 2022.
- Ngamprasert, P.; Wannakarn, P.; Rugthaicharoencheep, N. Enhance Power Loss in Distribution System Synergy Photovoltaic Power Plant. In Proceedings of 2020 International Conference on Power, Energy and Innovations (ICPEI), Chiangmai, Thailand, 14-16 October 2020.
- Drennen, T.E.; Erickson, J.D.; Chapman, D. Solar power and climate change policy in developing countries. Energy Policy 1996, 24, 9–16.
- Naskar, R.; Ghosh, S.; Mandal, R. Estimation & Analysis of a 5KWP Solar Photovoltaic Power Plant at JIS College of Engineering, Kalyani. International Research Journal of Engineering and Technology (IRJET) 2017, 223–230.
- Kale, D.; Kokil, P. A Study of the Performance and Carbon Credit Analysis of a 6 KWP Rooftop Solar Photovoltaic Power Plant at Sanjay Group Aurangabad, India, Innovative Energy & Research 2019, 8, 1–4.
- Bhadke, H.M.; Prajapati, A.B.; Gulhane, M.L. A case study of Government College of Engineering Amravati for its design and assessment of solar PV plant and Carbon credit earned. Journal of Emerging Technologies and Innovative Research 2022, 9, 1–9.
- Charlangsut, N.; Ruangsap, N.; Rugthaicharoencheep, N. An Assessment of a Return from Carbon Credit of a Hybrid Solar Rooftop System. In Proceedings of 2023 International Conference on Power, Energy and Innovations (ICPEI), Phrachuap Khirikhan, Thailand, 18-20 October 2023.
- Boonthienthong, M.; Ruangsap, N.; Charlangsut, N.; Rugthaicharoencheep, N. The Economic Analysis Consider Carbon Credit from Hybrid Solar Rooftop System. In Proceedings of 2023 IEEE PES 15th Asia-Pacific Power and Energy Engineering Conference (APPEEC), Chiang Mai, Thailand, 06-09 December 2023.
- Tantisattayakul, T.; Rassameethammachote, P.; Auisakul, M. Energy, Environmental and Economic Assessment of Solar Rooftop Systems on Buildings of Thammasat University, Rangsit Centre. Thai Science and Technology Journal 2017, 25, 1,083–1,099.
- United Nations Framework Convention on Climate Change, ACM0002: Grid-connected electricity generation from renewable sources --- Version 22.0. Available online: https://cdm.unfccc.int/methodologies/DB/XB1TX7TAZ6SLWM9B7BC67THHVD16JV (accessed on 20 October 2024).
- Carbon Credit Certification Office Thailand Greenhouse Gas Management Organization (Public Organization), Emission Factor from Electricity Generation/Consumption for Greenhouse Gas Mitigation Projects and Activities. Available online: https://ghgreduction.tgo.or.th/en/download/120-tver-gwp-emission-factor/3377-emission-factor-30-2565.html (accessed on 20 October 2024).
- Office of the National Economic and Social Development Council Office of the Prime Minister Bangkok, Thailand, The Thirteenth National Economic and Social Development Plan (2023-2027). Available online: https://www.nesdc.go.th/nesdb_en/main.php?filename=develop_issue (accessed on 20 October 2024).
- Traivivatana, S.; Wangjiraniran, W.; Junlakarn, S.; Wansophark, N. Thailand Energy Outlook for the Thailand Integrated Energy Blueprint (TIEB). Energy Procedia 2017, 138, 399–404.
- Office of Natural Resources and Environmental Policy and Planning Ministry of Natural Resources and Environment, Thailand Long-Term Low Greenhouse Gas Emission Development Strategy (Revised Version). Available online: https://unfccc.int/documents/622276?gad_source=1&gclid=CjwKCAjw1NK4BhAwEiwAVUHPUHS-FvBRfsFg2tq6c-V_OMdi6-FW3l0OHTlLEd7hom-OEKXeAY9b4xoC-TYQAvD_BwE (accessed on 20 October 2024).
- Rajbhandari, S.; Winyuchakrit, P.; Pradhan, B.B.; Chaichaloempreecha, A.; Pita, P.; Limmeechokchai, B. Thailand’s net-zero emissions by 2050: analysis of economy-wide impacts. Sustainability Science 2023, 19, 189–202.
- Prechaveerakul, J.; Inwai, C.C. Engineering economic analysis between high power LED and hydrargyrum medium-arc iodide luminaries in studio lighting application. In Proceedings of 2015 18th International Conference on Electrical Machines and Systems (ICEMS), Pattaya, Thailand, 25-28 October 2016.
- Acharya, P.; Regmi, P.P.; Gauchan, D.; Dilli, KC.B.; Gopa, KC. B. Benefit Cost Analysis of Adoption of Small Farm Machineries for Rice Cultivation in Nepal. International Journal of Applied Sciences and Biotechnology (IJASBT) 2020, 8, 448–453.
- Santoso, N.B.; Bahaweres, R.B.; Alaydrus, M. Cost-benefits, NPV, IRR and QoS analysis of the dynamic telecytology system in Indonesia, In Proceedings of 2016 1st International Conference on Biomedical Engineering (IBIOMED), Yogyakarta, Indonesia, 05-06 October 2016.
Figure 1.
The electricity distribution of distribution system; (a) in case of no solar power system; (b) in case of install solar power system at bus 3.
Figure 1.
The electricity distribution of distribution system; (a) in case of no solar power system; (b) in case of install solar power system at bus 3.
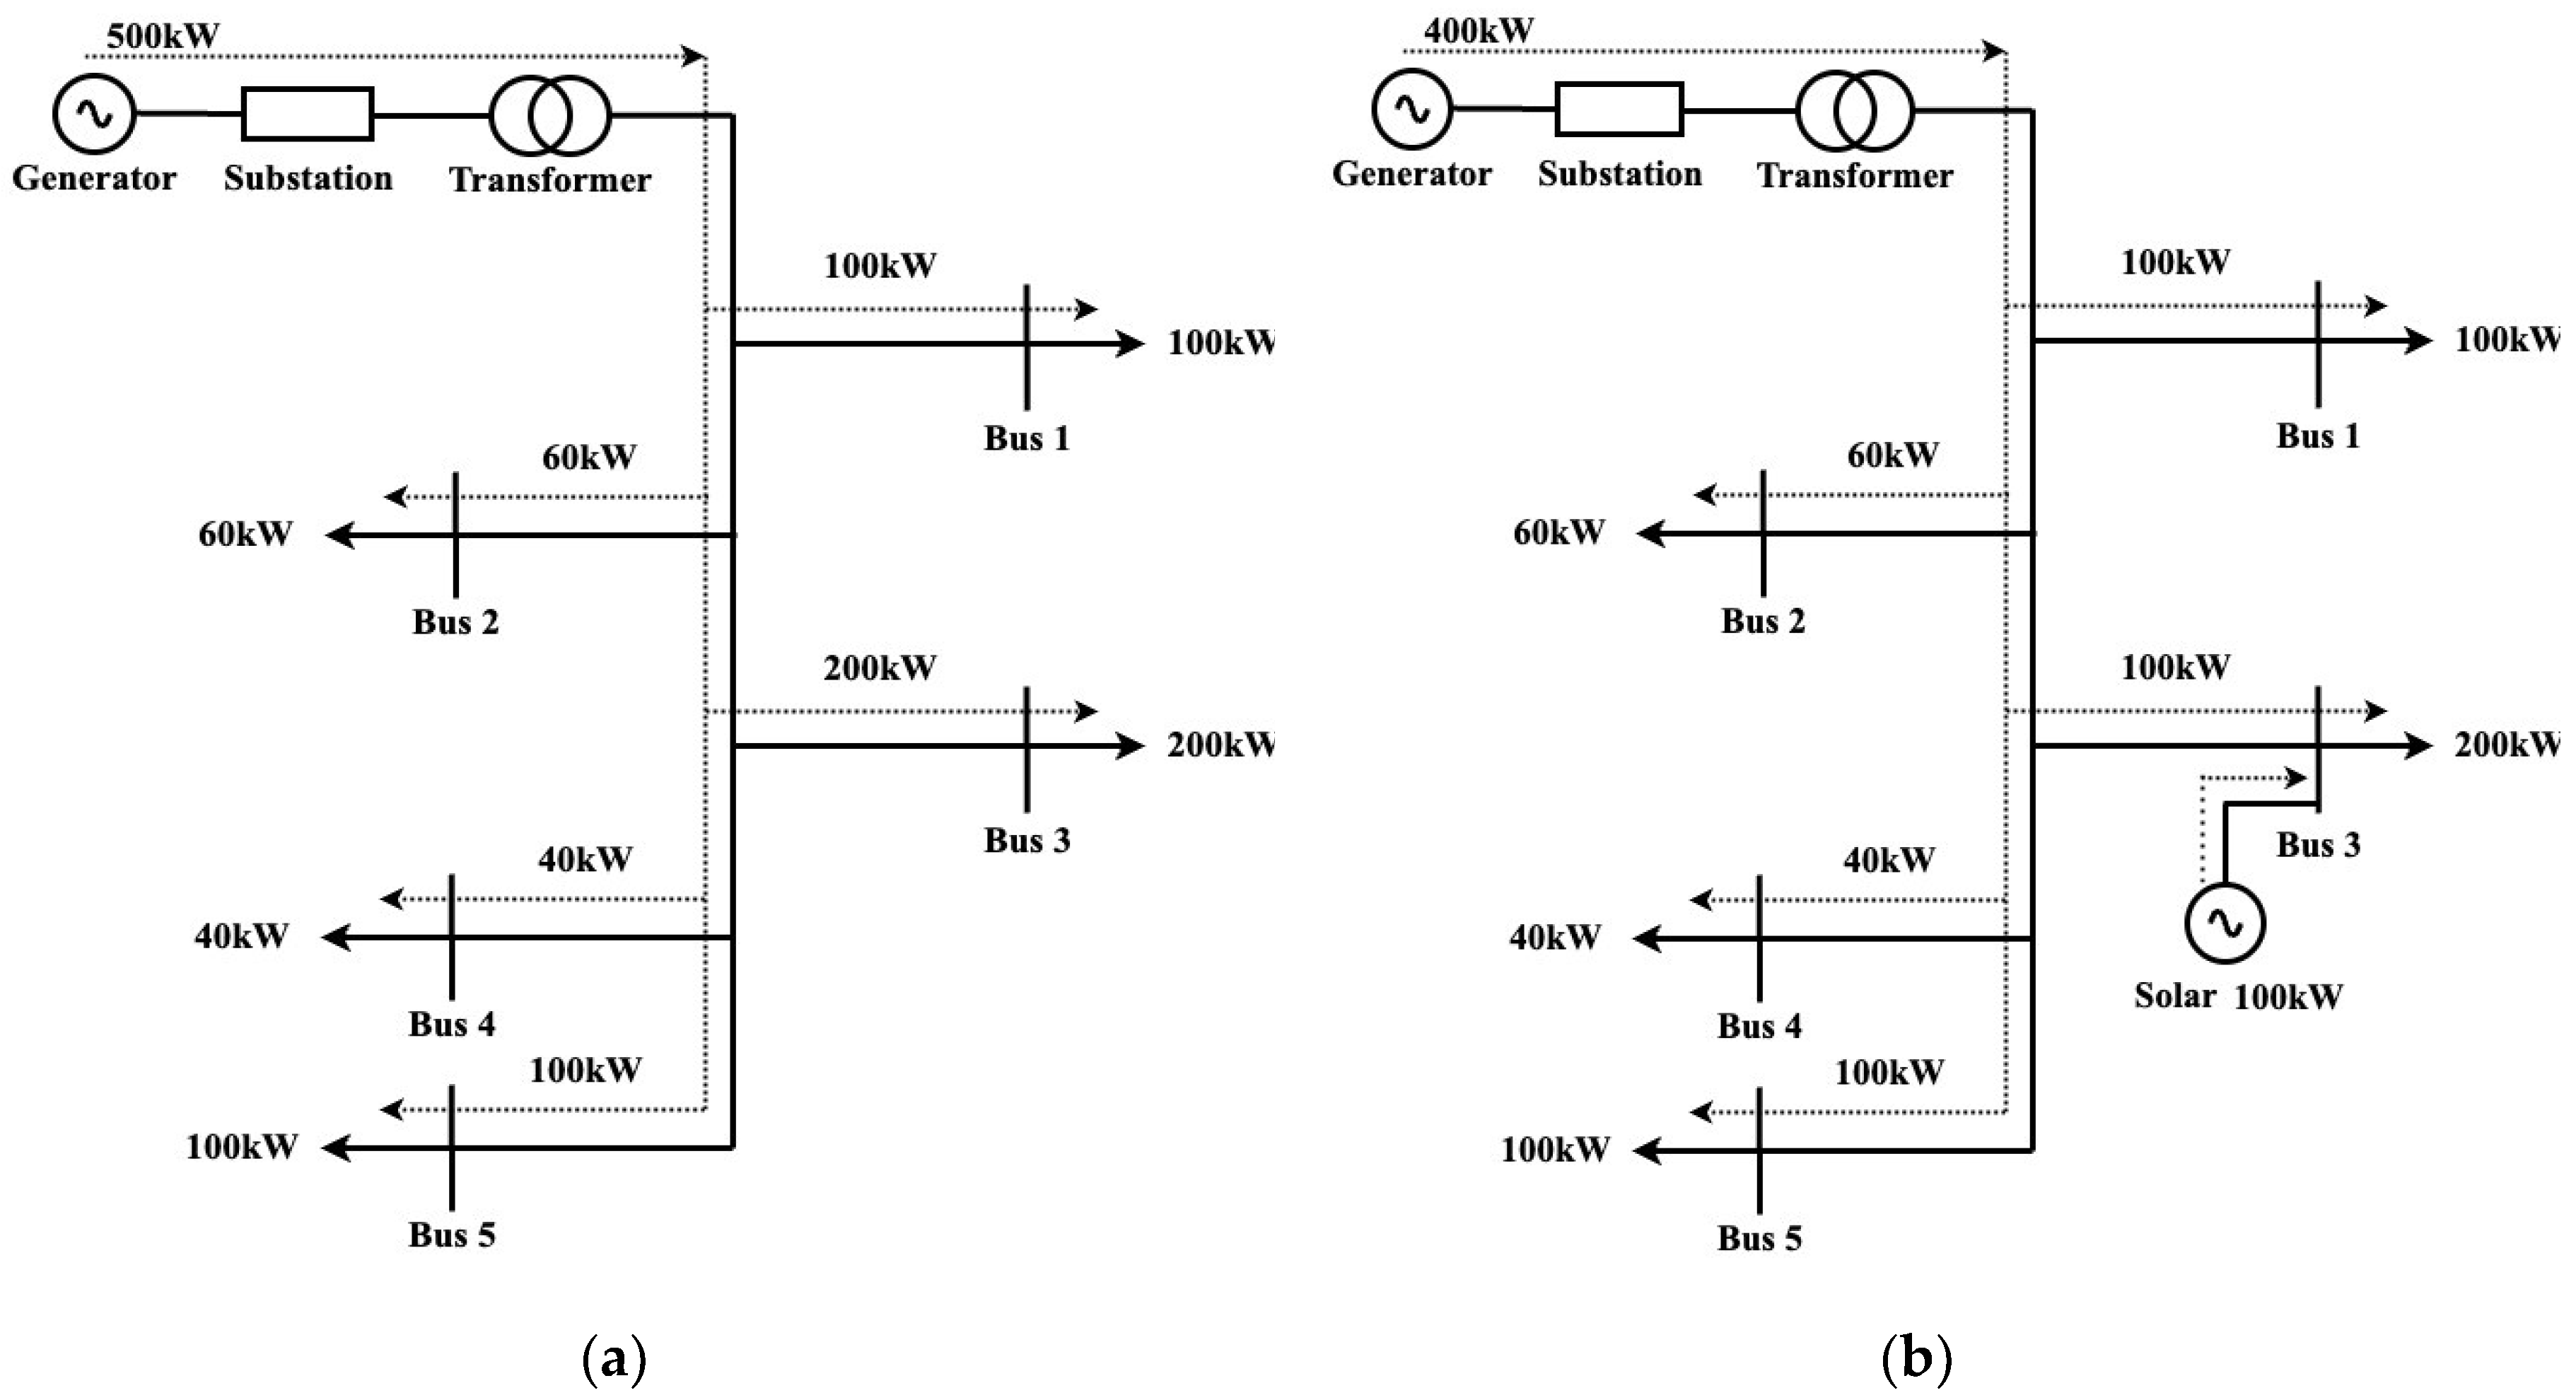
Figure 2.
A diagram of the power supply to the factory.
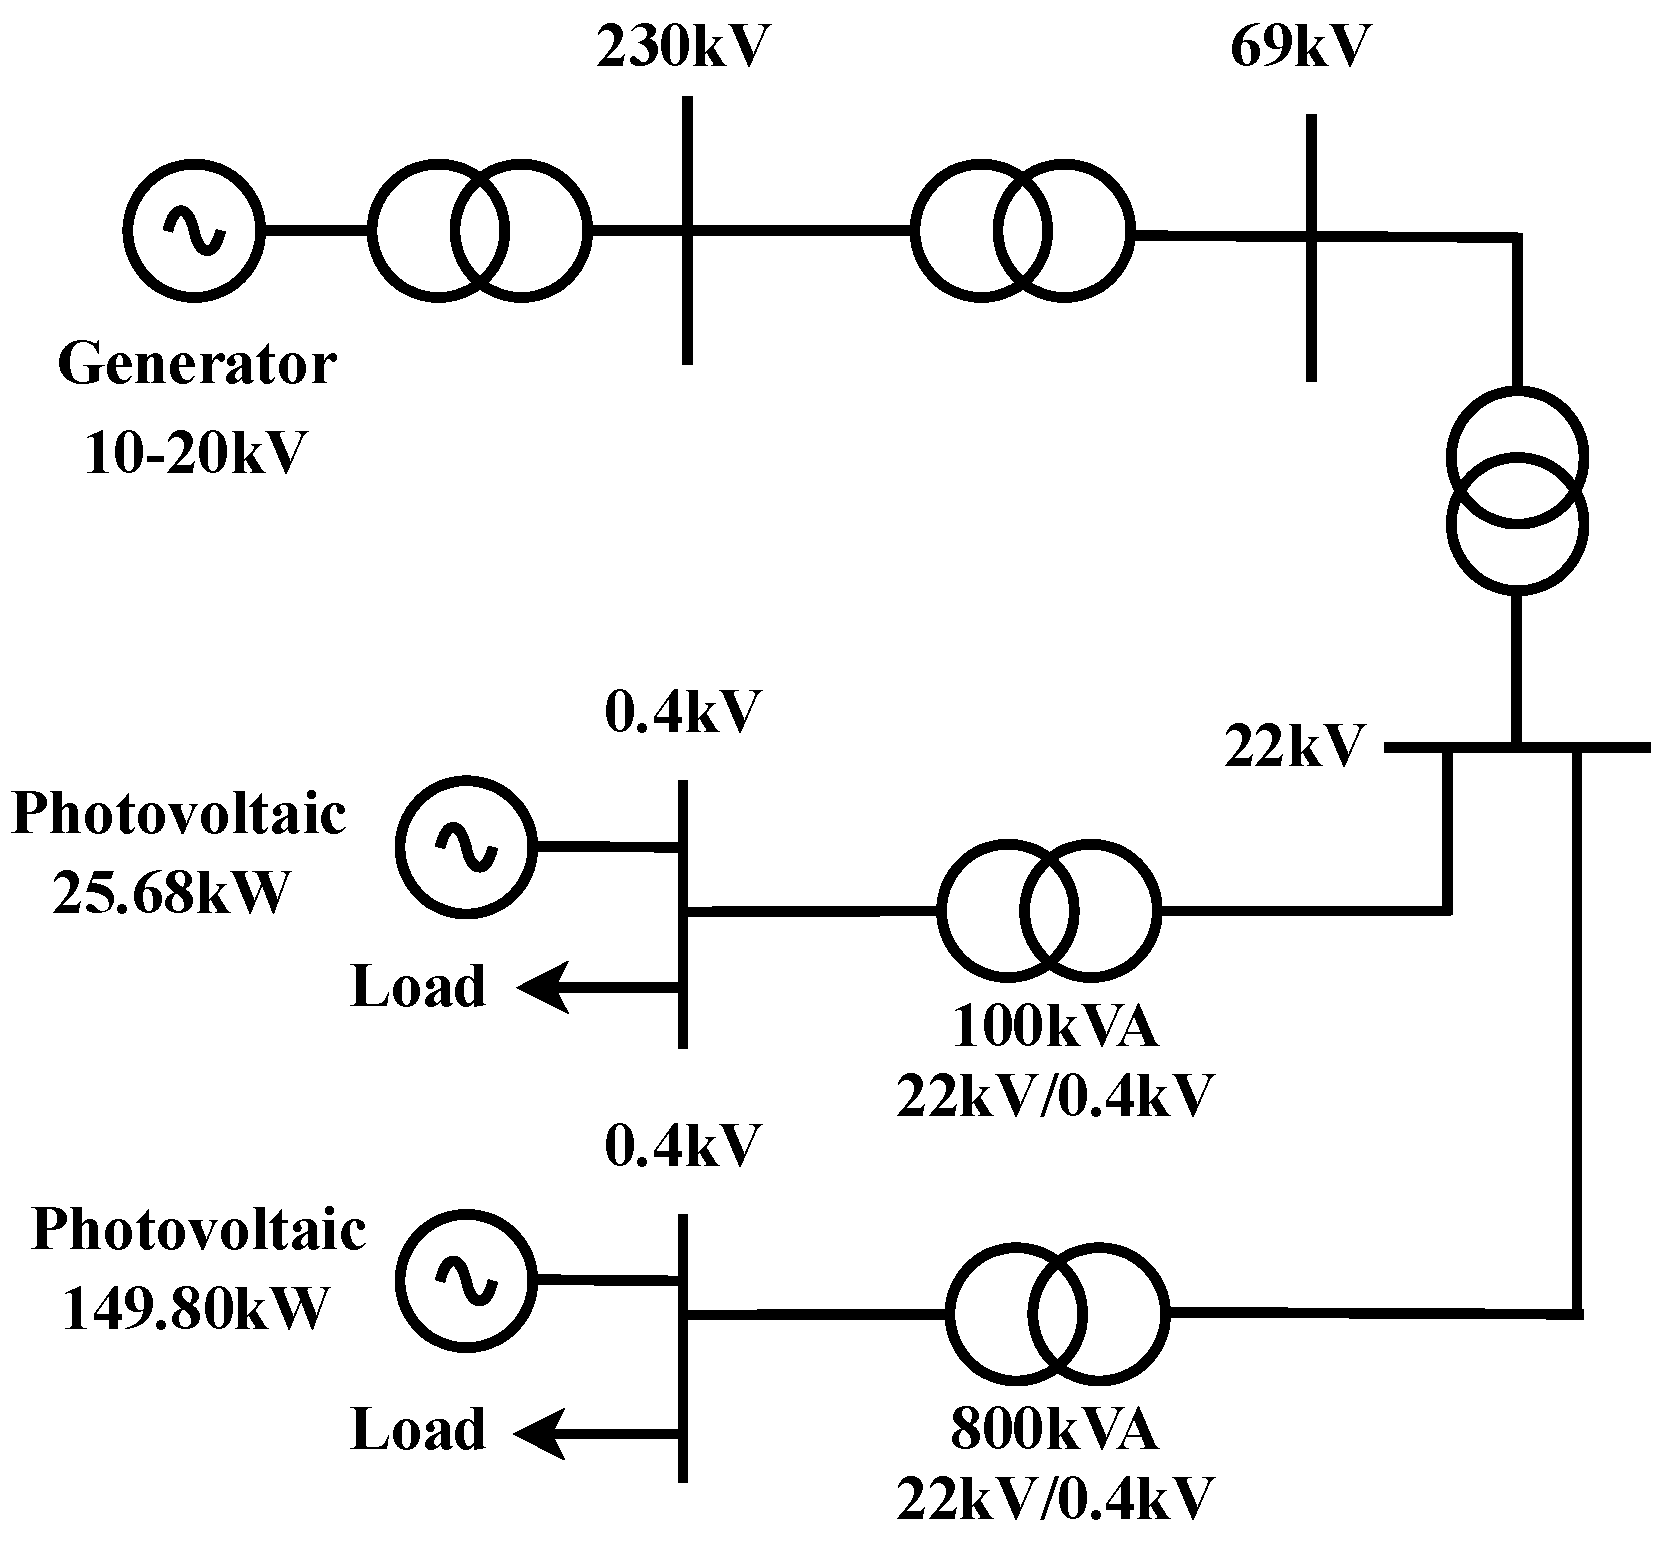
Figure 3.
The schematic diagram of photovoltaic rooftop system capacity 25.68 kW.
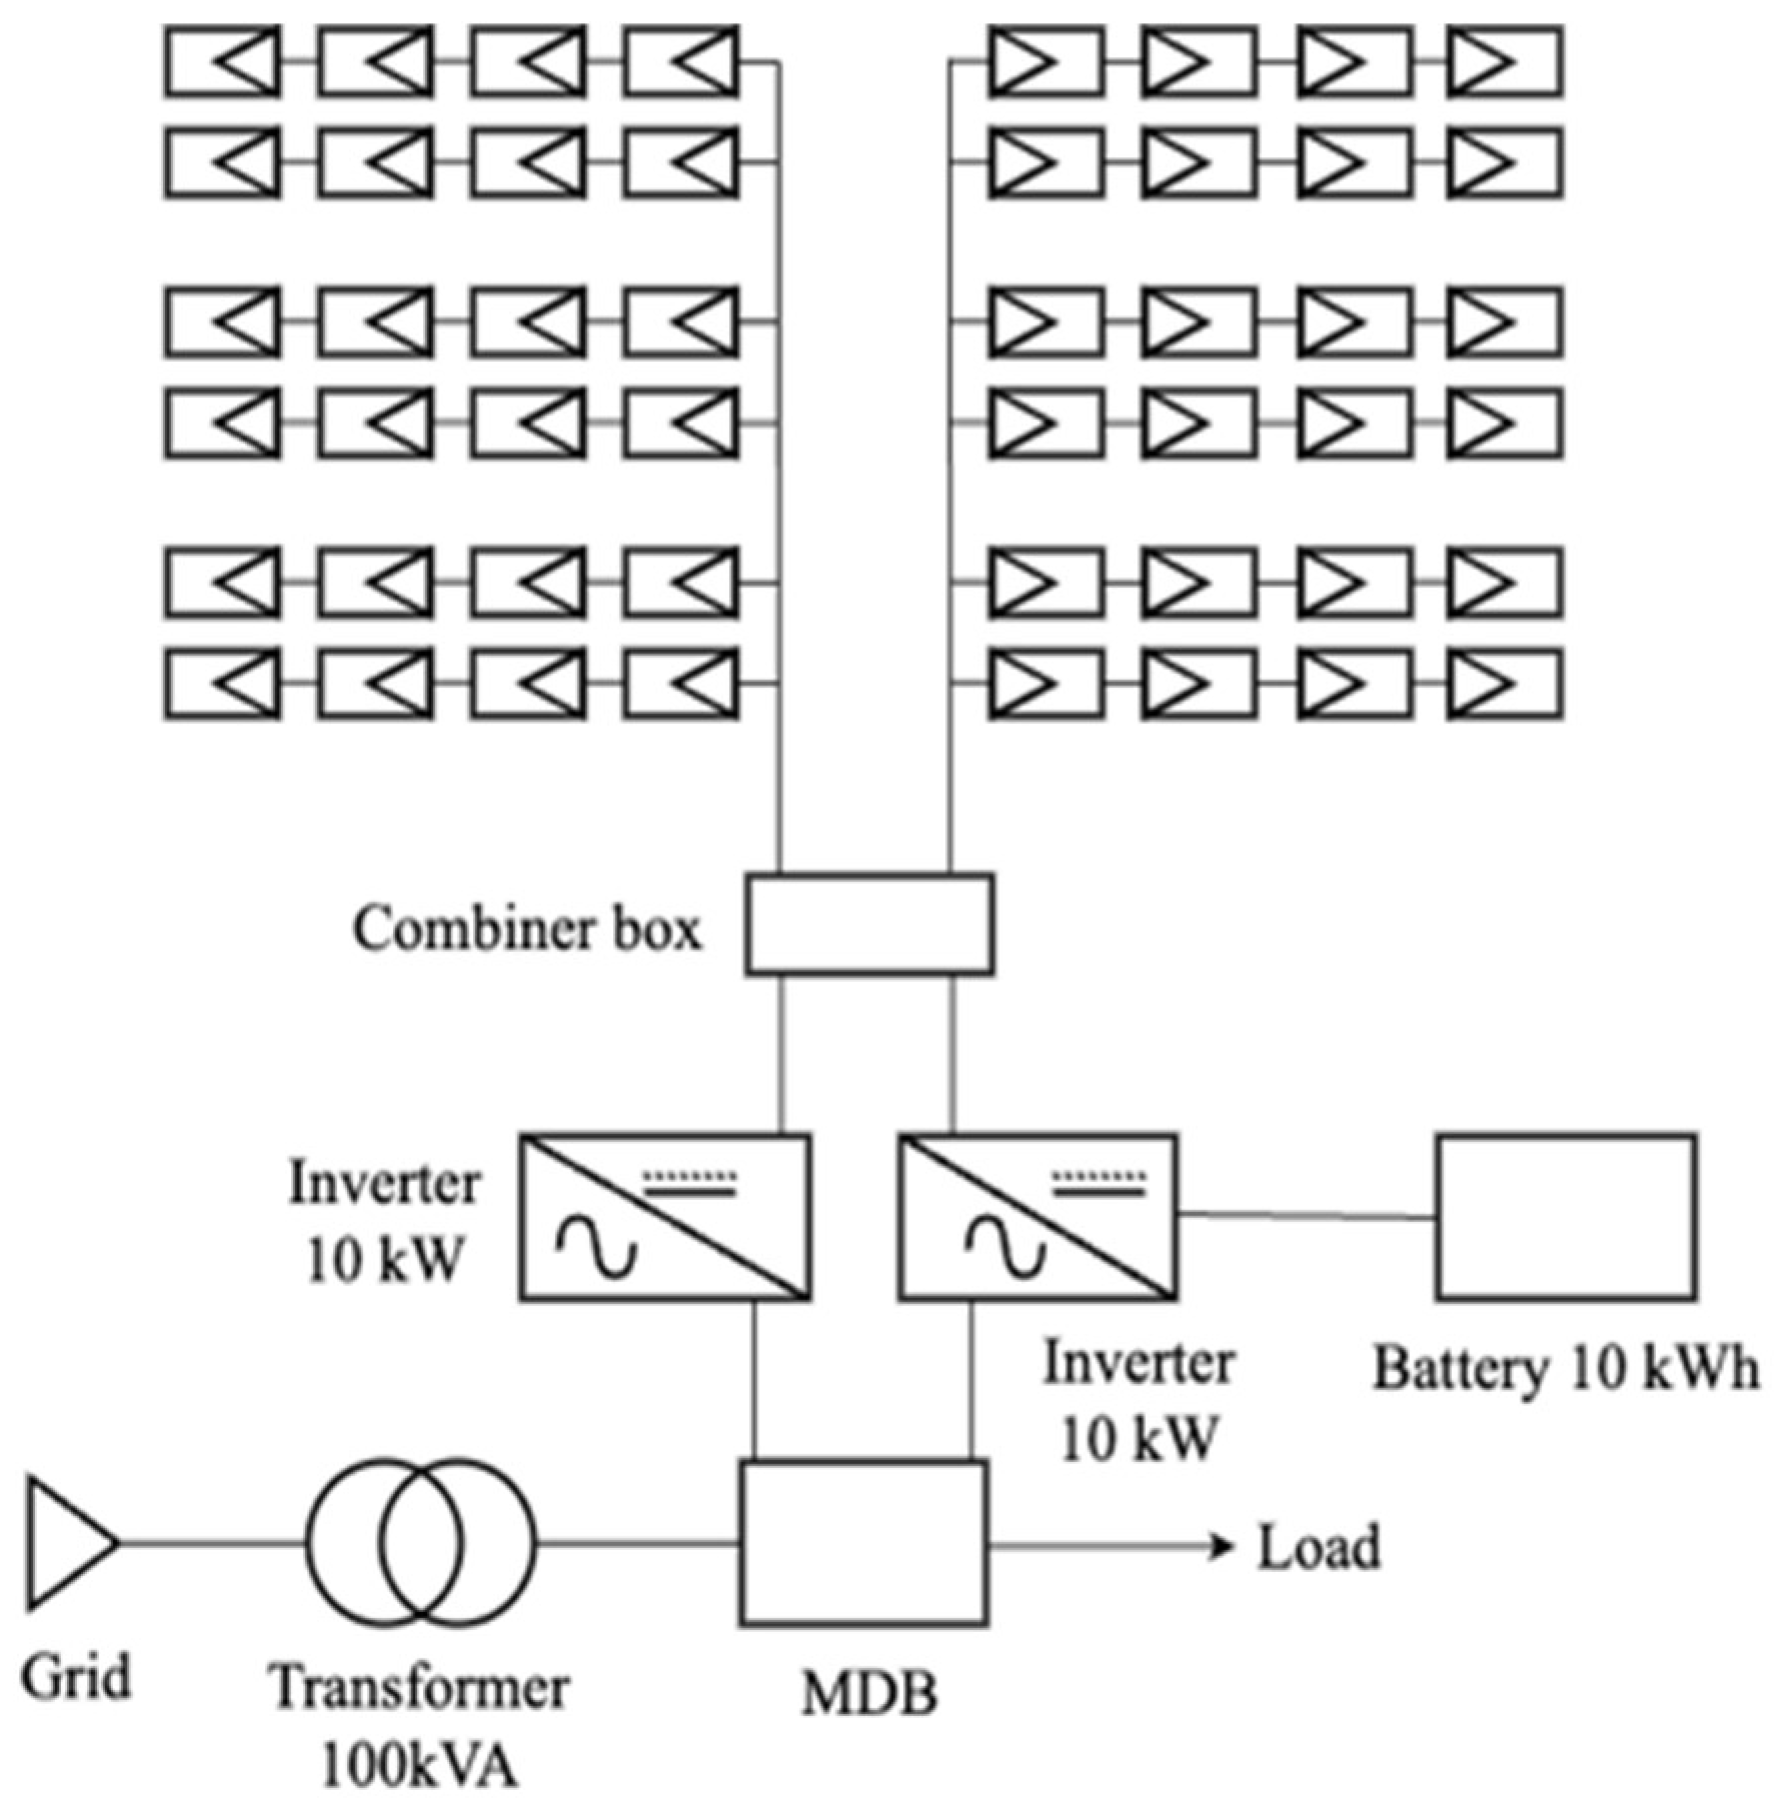
Figure 4.
A diagram of photovoltaic rooftop system capacity 149.80 kW.
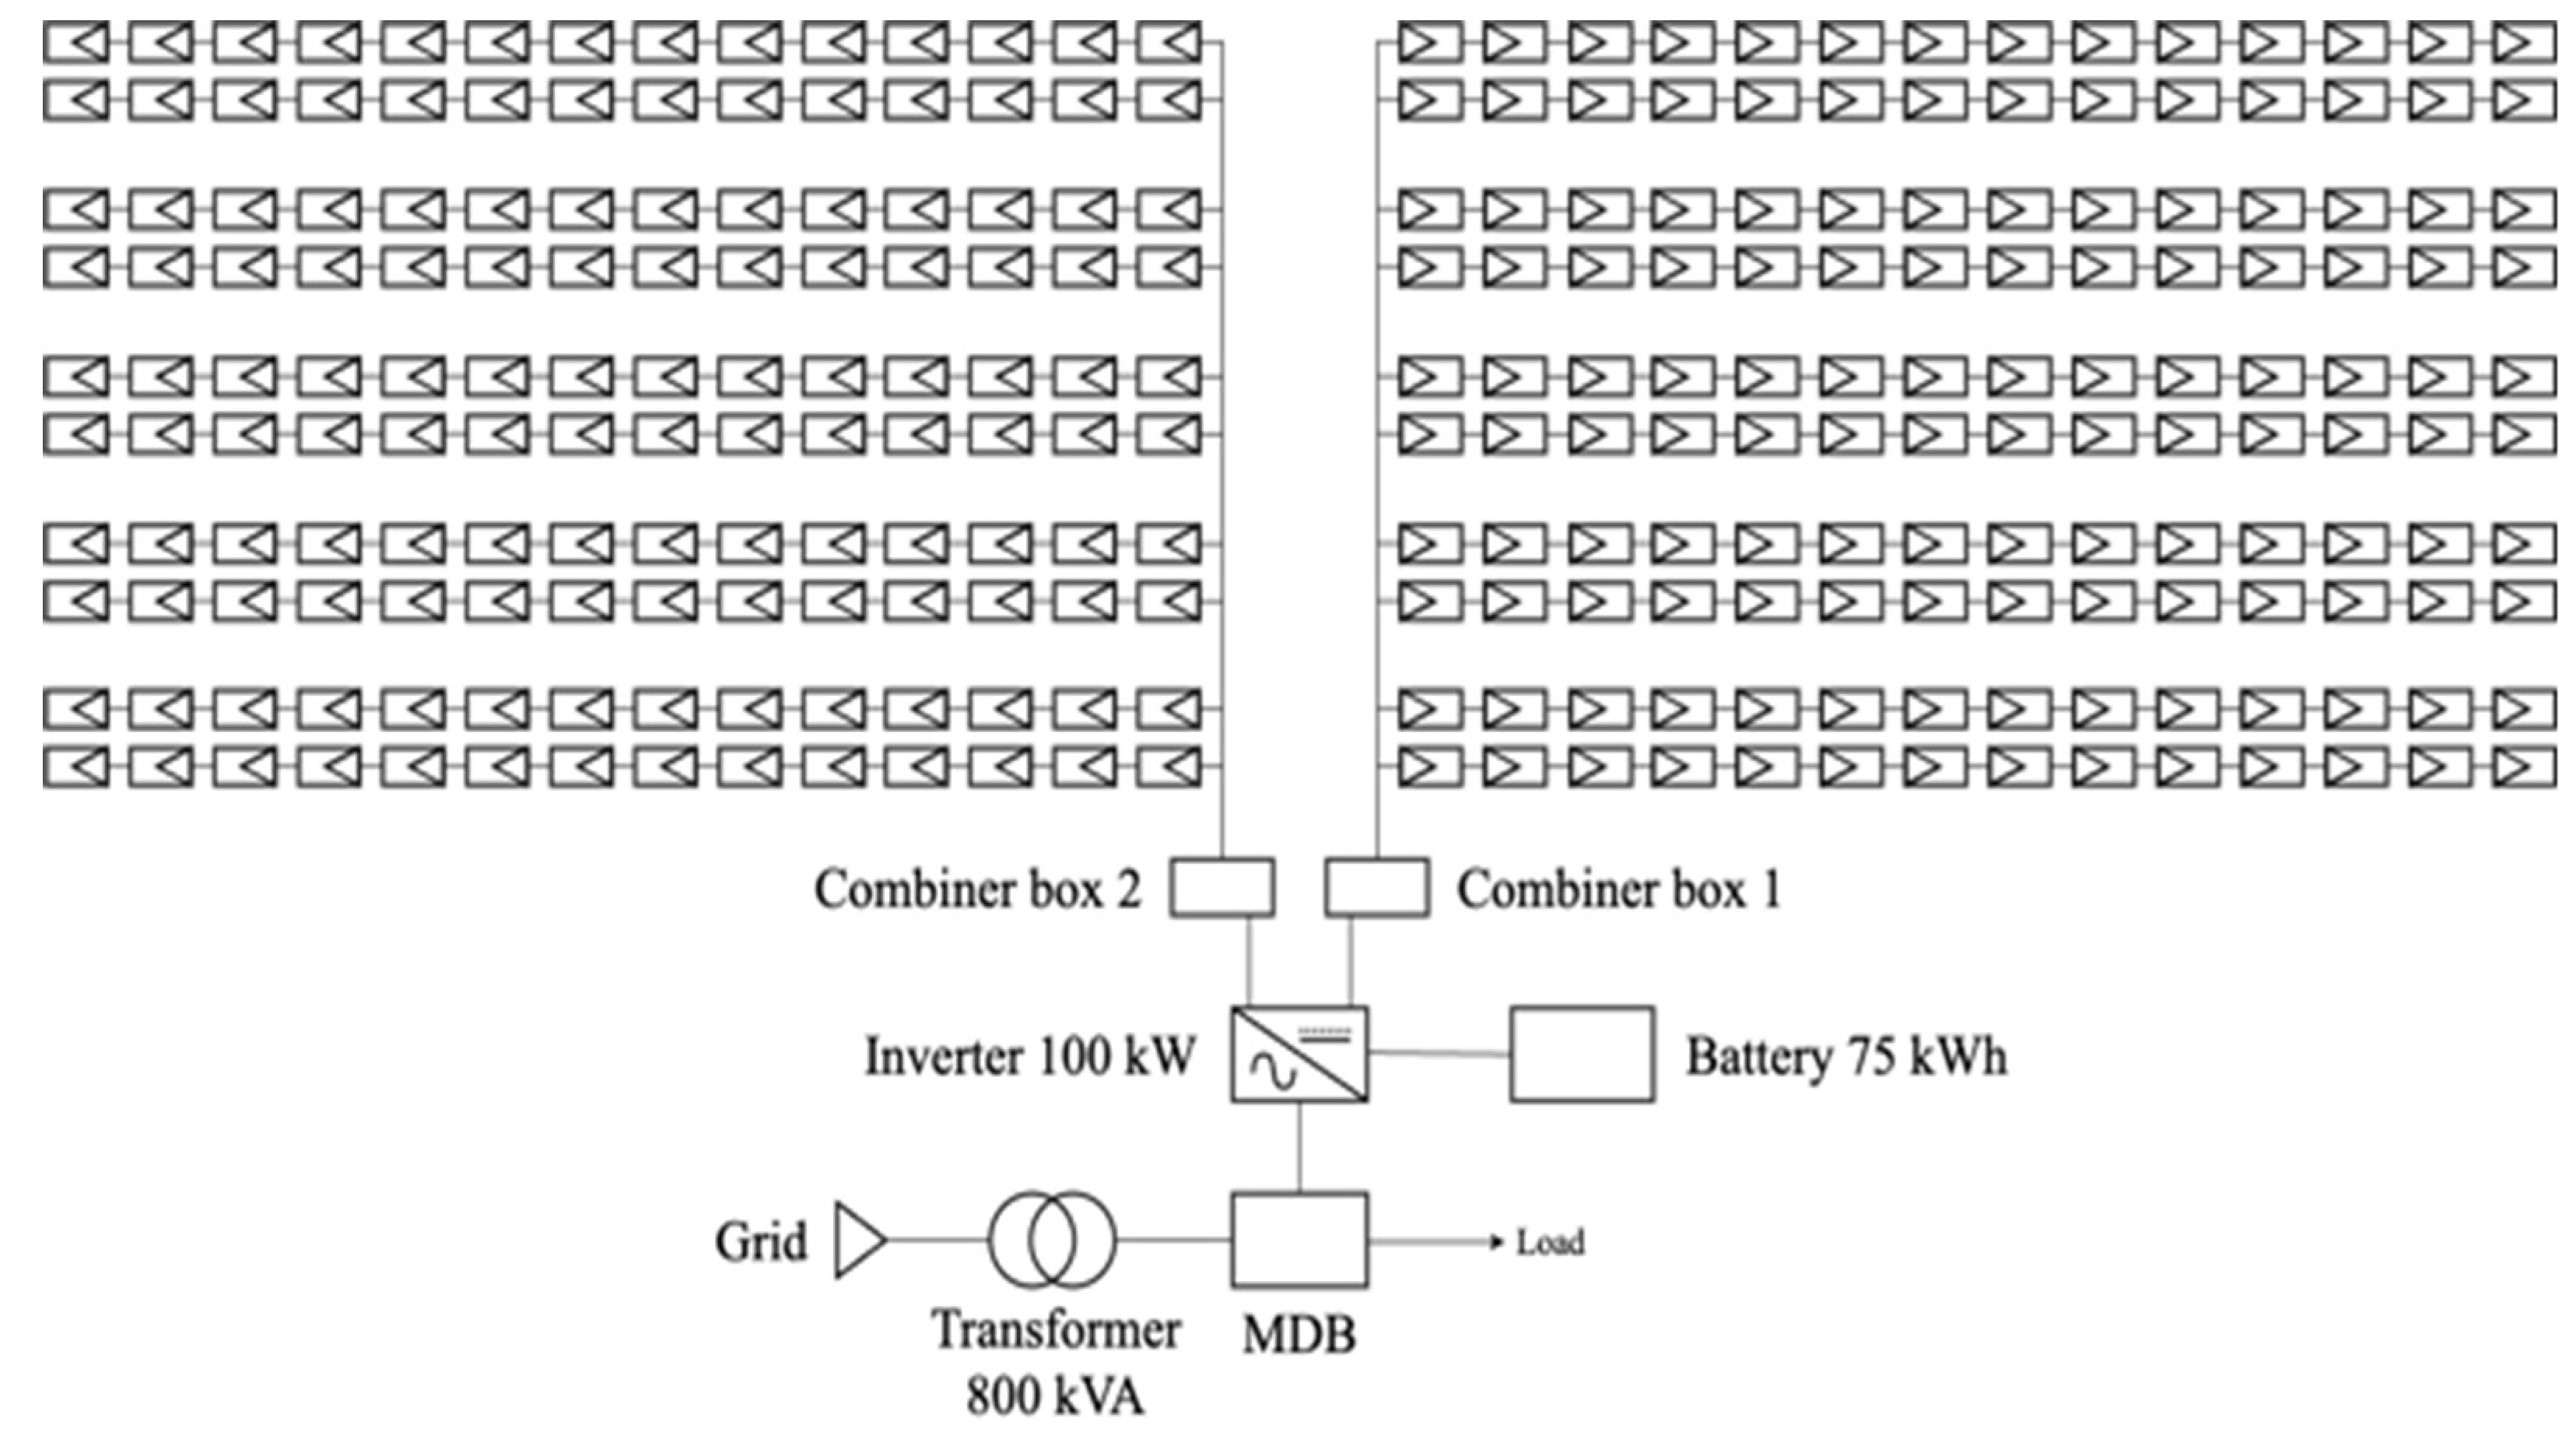
Table 1.
Objective of Thailand integrated energy blueprint.
| Energy plan | Objective |
|---|---|
| AEDP | In 2036 increase renewable energy usage to 20%. |
| EEDP | In 2036 decrease 30% of energy intensity compared to 2010. |
| PDP | To enhance capacity of electricity generation to be sufficient with consumption in future. |
| Gas Plan | Management and provision of natural gas usage to adequately meet future demand. |
| Oil Plan | Management of the optimal level of petroleum consumption and reserves. |
Table 2.
Evaluation of quantity and value of carbon credit from photovoltaic rooftop systems capacity 149.80 kWp.
Table 2.
Evaluation of quantity and value of carbon credit from photovoltaic rooftop systems capacity 149.80 kWp.
| Year | Electrical energy produced (kW) |
Quantity of Carbon Credits (tCO2eq) |
Value of Carbon Credits (Baht) |
|---|---|---|---|
| 1 | 200,378.00 | 97.32 | 4,557.66 |
| 2 | 199,275.92 | 96.79 | 4,532.60 |
| 3 | 198,173.84 | 96.25 | 4,507.53 |
| 4 | 197,071.76 | 95.72 | 4,482.46 |
| 5 | 195,969.68 | 95.18 | 4,457.40 |
| 6 | 194,867.61 | 94.65 | 4,432.33 |
| 7 | 193,765.53 | 94.11 | 4,407.26 |
| 8 | 192,663.45 | 93.58 | 4,382.19 |
| 9 | 191,561.37 | 93.04 | 4,357.13 |
| 10 | 190,459.29 | 92.51 | 4,332.06 |
| 11 | 189,357.21 | 91.97 | 4,306.99 |
| 12 | 188,255.13 | 91.44 | 4,281.93 |
| 13 | 187,153.05 | 90.90 | 4,256.86 |
| 14 | 186,050.97 | 90.36 | 4,231.79 |
| 15 | 184,948.89 | 89.83 | 4,206.72 |
| 16 | 183,846.82 | 89.29 | 4,181.66 |
| 17 | 182,744.74 | 88.76 | 4,156.59 |
| 18 | 181,642.66 | 88.22 | 4,131.52 |
| 19 | 180,540.58 | 87.69 | 4,106.46 |
| 20 | 179,438.50 | 87.15 | 4,081.39 |
| 21 | 178,336.42 | 86.62 | 4,056.32 |
| 22 | 177,234.34 | 86.08 | 4,031.25 |
| 23 | 176,132.26 | 85.55 | 4,006.19 |
| 24 | 175,030.18 | 85.01 | 3,981.12 |
| 25 | 173,928.10 | 84.48 | 3,956.05 |
| Total | 4,678,826.30 | 2,175.18 | 106,421.45 |
Table 3.
Evaluation of quantity and value of carbon credit from photovoltaic rooftop systems capacity 25.68 kWp.
Table 3.
Evaluation of quantity and value of carbon credit from photovoltaic rooftop systems capacity 25.68 kWp.
| Year | Electrical energy produced (kW) |
Quantity of Carbon Credits (tCO2eq) |
Value of Carbon Credits (Baht) |
|---|---|---|---|
| 1 | 35,047.00 | 17.02 | 797.16 |
| 2 | 34,854.24 | 16.93 | 792.77 |
| 3 | 34,661.48 | 16.84 | 788.39 |
| 4 | 34,468.72 | 16.74 | 784.00 |
| 5 | 34,275.97 | 16.65 | 779.62 |
| 6 | 34,083.21 | 16.55 | 775.23 |
| 7 | 33,890.45 | 16.46 | 770.85 |
| 8 | 33,697.69 | 16.37 | 766.47 |
| 9 | 33,504.93 | 16.27 | 762.08 |
| 10 | 33,312.17 | 16.18 | 757.70 |
| 11 | 33,119.42 | 16.09 | 753.31 |
| 12 | 32,926.66 | 15.99 | 748.93 |
| 13 | 32,733.90 | 15.90 | 744.54 |
| 14 | 32,541.14 | 15.81 | 740.16 |
| 15 | 32,348.38 | 15.71 | 735.77 |
| 16 | 32,155.62 | 15.62 | 731.39 |
| 17 | 31,962.86 | 15.52 | 727.01 |
| 18 | 31,770.11 | 15.43 | 722.62 |
| 19 | 31,577.35 | 15.34 | 718.24 |
| 20 | 31,384.59 | 15.24 | 713.85 |
| 21 | 31,191.83 | 15.15 | 709.47 |
| 22 | 30,999.07 | 15.06 | 705.08 |
| 23 | 30,806.31 | 14.96 | 700.70 |
| 24 | 30,613.55 | 14.87 | 696.32 |
| 25 | 30,420.80 | 14.78 | 691.93 |
| Total | 818,347.45 | 397.47 | 18,613.58 |
Table 5.
The results of the economic index of the 149.80 kWp photovoltaic rooftop systems.
| Case | NPV (Baht) | IRR (%) | B/C Ratio | Payback Period (Year) |
|---|---|---|---|---|
| 1 | 246,849.61 (FNPV) | 10.57 (FIRR) | 2.771 | 8.493 |
| 2 | 268,718.29 (ENPV) | 10.62 (EIRR) | 2.776 | 8.445 |
| 3 | 279,502.01 (ENPV) | 10.65 (EIRR) | 2.781 | 8.436 |
| 4 | 286,522.75 (ENPV) | 10.66 (EIRR) | 2.789 | 8.436 |
Table 6.
The project costs and benefits of photovoltaic rooftop system capacity 25.68 kWp.
| Year | Cost | Benefit | ||
|---|---|---|---|---|
| Investment (Baht) |
O&M (Baht) |
Benefit (Baht) |
Cost of Carbon Credit (Baht) | |
| 0 | 1,766,336 | 0.00 | 0.00 | 0.00 |
| 1 | 0.00 | 0.00 | 128,676.02 | 797.16 |
| 2 | 0.00 | 0.00 | 127,968.30 | 792.77 |
| 3 | 0.00 | 11,280.00 | 127,260.58 | 788.39 |
| 4 | 0.00 | 11,280.00 | 126,552.86 | 784.00 |
| 5 | 0.00 | 11,280.00 | 125,845.15 | 779.62 |
| 6 | 0.00 | 11,280.00 | 125,137.43 | 775.23 |
| 7 | 0.00 | 11,280.00 | 124,429.71 | 770.85 |
| 8 | 0.00 | 11,280.00 | 123,721.99 | 766.47 |
| 9 | 0.00 | 11,280.00 | 123,014.27 | 762.08 |
| 10 | 0.00 | 11,280.00 | 122,306.56 | 757.70 |
| 11 | 0.00 | 11,280.00 | 121,598.84 | 753.31 |
| 12 | 0.00 | 11,280.00 | 120,891.12 | 748.93 |
| 13 | 0.00 | 11,280.00 | 120,183.40 | 744.54 |
| 14 | 0.00 | 11,280.00 | 119,475.68 | 740.16 |
| 15 | 0.00 | 11,280.00 | 118,767.97 | 735.77 |
| 16 | 0.00 | 11,280.00 | 118,060.25 | 731.39 |
| 17 | 0.00 | 11,280.00 | 117,352.53 | 727.01 |
| 18 | 0.00 | 11,280.00 | 116,644.81 | 722.62 |
| 19 | 0.00 | 11,280.00 | 115,937.09 | 718.24 |
| 20 | 0.00 | 11,280.00 | 115,229.37 | 713.85 |
| 21 | 0.00 | 11,280.00 | 114,521.66 | 709.47 |
| 22 | 0.00 | 11,280.00 | 113,813.94 | 705.08 |
| 23 | 0.00 | 11,280.00 | 113,106.22 | 700.70 |
| 24 | 0.00 | 11,280.00 | 112,398.50 | 696.32 |
| 25 | 0.00 | 11,280.00 | 111,690.78 | 691.93 |
| Total | 1,766,336 | 259,440.00 | 3,004,585.04 | 18,613.58 |
Table 7.
The economic index results of the 25.68 kWp photovoltaic rooftop system.
| Case | NPV (Baht) | IRR (%) | B/C Ratio | Payback Period (Year) |
|---|---|---|---|---|
| 1 | -729,060.75 (FNPV) | 3.88 (FIRR) | 1.554 | 15.535 |
| 2 | -725,235.82 (ENPV) | 3.91 (EIRR) | 1.557 | 15.484 |
| 3 | -723,349.70 (ENPV) | 3.92 (EIRR) | 1.560 | 15.434 |
| 4 | -722,121.74 (ENPV) | 3.95 (EIRR) | 1.565 | 15.425 |
Table 8.
Benefit analysis of photovoltaic rooftop systems capacity 25.68 kWp combined profit of photovoltaic rooftop systems capacity 149.80 kWp after payback.
Table 8.
Benefit analysis of photovoltaic rooftop systems capacity 25.68 kWp combined profit of photovoltaic rooftop systems capacity 149.80 kWp after payback.
| Case | Payback Period of 25.68 kWp System (Year) |
Payback period of 25.68 kWp system, when combined profit of 149.80 kWp System (Year) |
Comparison payback period of 25.68 kWp system, when combined profit of 149.80 kWp System (Year) |
|---|---|---|---|
| 1 | 15.535 | 10.495 | 5.040 |
| 2 | 15.484 | 10.447 | 5.037 |
| 3 | 15.434 | 10.431 | 5.003 |
| 4 | 15.425 | 10.431 | 4.994 |
Disclaimer/Publisher’s Note: The statements, opinions and data contained in all publications are solely those of the individual author(s) and contributor(s) and not of MDPI and/or the editor(s). MDPI and/or the editor(s) disclaim responsibility for any injury to people or property resulting from any ideas, methods, instructions or products referred to in the content. |
© 2024 by the authors. Licensee MDPI, Basel, Switzerland. This article is an open access article distributed under the terms and conditions of the Creative Commons Attribution (CC BY) license (http://creativecommons.org/licenses/by/4.0/).
Copyright: This open access article is published under a Creative Commons CC BY 4.0 license, which permit the free download, distribution, and reuse, provided that the author and preprint are cited in any reuse.


