
Submitted:
11 February 2025
Posted:
12 February 2025
You are already at the latest version
Abstract
The STEM fields (Science, Technology, Engineering, Mathematics) have attracted the interest of the scientific community and organisations such as the Organisation for Economic Co-operation and Development (OECD), mainly because of the demand for professionals in these fields, which is expected to increase. The cultivation of scientific skills and interest in these specific fields is cultivated from the early school years, so the role of the school is important. Students' performance in the Panhellenic examinations was chosen for analysis for two reasons. Firstly, because students take these exams at the end of secondary education, which reflects the knowledge they have acquired throughout their schooling. Secondly, because their participation in the Physics and Mathematics exams is based on their own choice, we can assume that they have a special interest in these subjects. The research, through its method of analysis, contributes to understanding the level of students' knowledge and provides guidelines for its improvement.
Keywords:
Greece National Exams
; STEM Education in Greece
; student performance
; science
; physics
; mathematics
1. Introduction
The Panhellenic Examinations are the procedure by which students are admitted to the country's public higher education institutions. When students enter high school, they are divided into pre-selection groups. The selection is made by the students, according to their choice of direction, different subjects are examined and then they have the possibility to choose between specific departments of the universities. The choice of subjects, such as mathematics, physics, chemistry, biology, programming, leads to a number of departments that are part of the STEM fields. It is appropriate to examine the performance of students in these subjects because their choice is voluntary and indicates their willingness to work in these disciplines. In addition, the students tested in these subjects are the next generation of STEM professionals. Fields that are expected to be in high demand in the labour market. In Australia, it has been predicted that by 2014, 75% of e-jobs will require some STEM skills. At the same time, the increase in the number of people working in STEM disciplines is expected to make a significant contribution to gross national product growth [1]. Today's students are the ones who will be called upon to solve the problems of everyday life in the years to come, using the 21st century skills that their education will provide. Their performance in national examinations is the first step in a STEM career and it is therefore appropriate to study it. Through this analysis, the students' interest in pursuing their respective disciplines can be determined. In conclusion, among all students, a small percentage of students choose to take the exam in subjects such as physics, chemistry, mathematics, while a larger percentage choose to take the exam in programming arts and mathematics. This shows that scientific disciplines seem to be inaccessible to students. The choice of subjects is made in upper secondary school, which means that students have already acquired a negative attitude towards science in the first year. Therefore, in order to increase the number of students enrolled in these courses, they need to acquire positive attitudes from previous years.
The following research questions are addressed in this article:
- At what level do Greek students' performances in Mathematics and Physics fluctuate in the Panhellenic examinations from 2007 to 2024?
- At what levels should corrective actions be taken in order to improve their performances?
- How can students' motivation and interest in their engagement with these subjects be strengthened?
2. Materials and Methods
In the present article, data on the performance of Greek students by subject were collected from the website https://www.minedu.gov.gr/ , the official website of Ministry of Education, Religious Affairs and Sport. The data on the number of students who answered correctly per subject in each subject were provided following a request to the Ministry of Education, Religious Affairs and Sport under number 105978/2023, which was approved. The limitation is that there is no data on the number of hours studied and the marks obtained by each student. It should also be noted that the subjects of the examinations are always in the same format and are divided into four subjects, since the level of difficulty of the subjects varies from one academic year to another.
3. Results
3.1. Data from the National Exams in Greece
We will now proceed to a comparative presentation of statistical data on the students’ performances in subjects from STEM fields on which they are tested at a national level. The analysis focuses on students from day General High Schools, which the bulk of Greek students attend. The data collected concerns the school years from 2007 to 2023. During that period the educational system and the national exam underwent some changes, which will be briefly presented below.
From 2007 to 2014, General High School candidates at the panhellenic exam had to choose one of three academic tracks, two of which relate to STEM fields. In detail :
-
Academic track : Science
- Mathematics
- Physics
- Chemistry
- Biology
-
Academic track : Technology
- Mathematics
- Physics
- Computer Science Applications
- Principles of Business and Services Organization and Administration
From 2015 to 2019 these tracks were re-baptized as “orientation groups”.
-
Orientation group : Science
- Physics
- Chemistry
-
One of the following elective subjects, depending on the scientific field chosen, which gives access to different University schools :
- Mathematics
- Biology
- History
-
Orientation group: Economic and Computer Studies
- Mathematics
- Computer Science Applications
- One of the following elective subjects:
- Common curriculum Biology (Γενικής Παιδείας)
- Common curriculum History (Γενικής Παιδείας)
- Principles of Economic Theory
From 2020 till today, the system is organized as follows:
-
Orientation group: Science
- Physics
- Chemistry
- Mathematics
-
Orientation group: Health studies
- Physics
- Chemistry
- Biology
-
Orientation group : Economic and Computer Studies
- Mathematics
- Informatics/Computer science
- Economics
It is worth mentioning that every year, students are tested in the subject of Modern Greek irrespective of the academic track they have chosen. Through the multiple reforms of the system, there have been years where students were tested on an obligatory or elective basis in subjects of the general, common curriculum. However, there is no reason to analyze their performances in those subjects given the topic of the present study which is their performances in STEM fields. A few further clarifications regarding the specificities of the Greek educational system are also in order. The term «orientation» is used as a shorthand for “academic track” and “orientation group” - the different terms that have been used throughout the years. Also, the grade 20 is the highest one (corresponding to “Excellent”) and the grade 10 is the passing grade
Figure 1.
This figure shows the percentage of students who were below the base, i.e. 10, and the percentage of students who were above the base in Maths- Science orientation. [2,3,4,5,6,7,8,9,10,11,12,13].
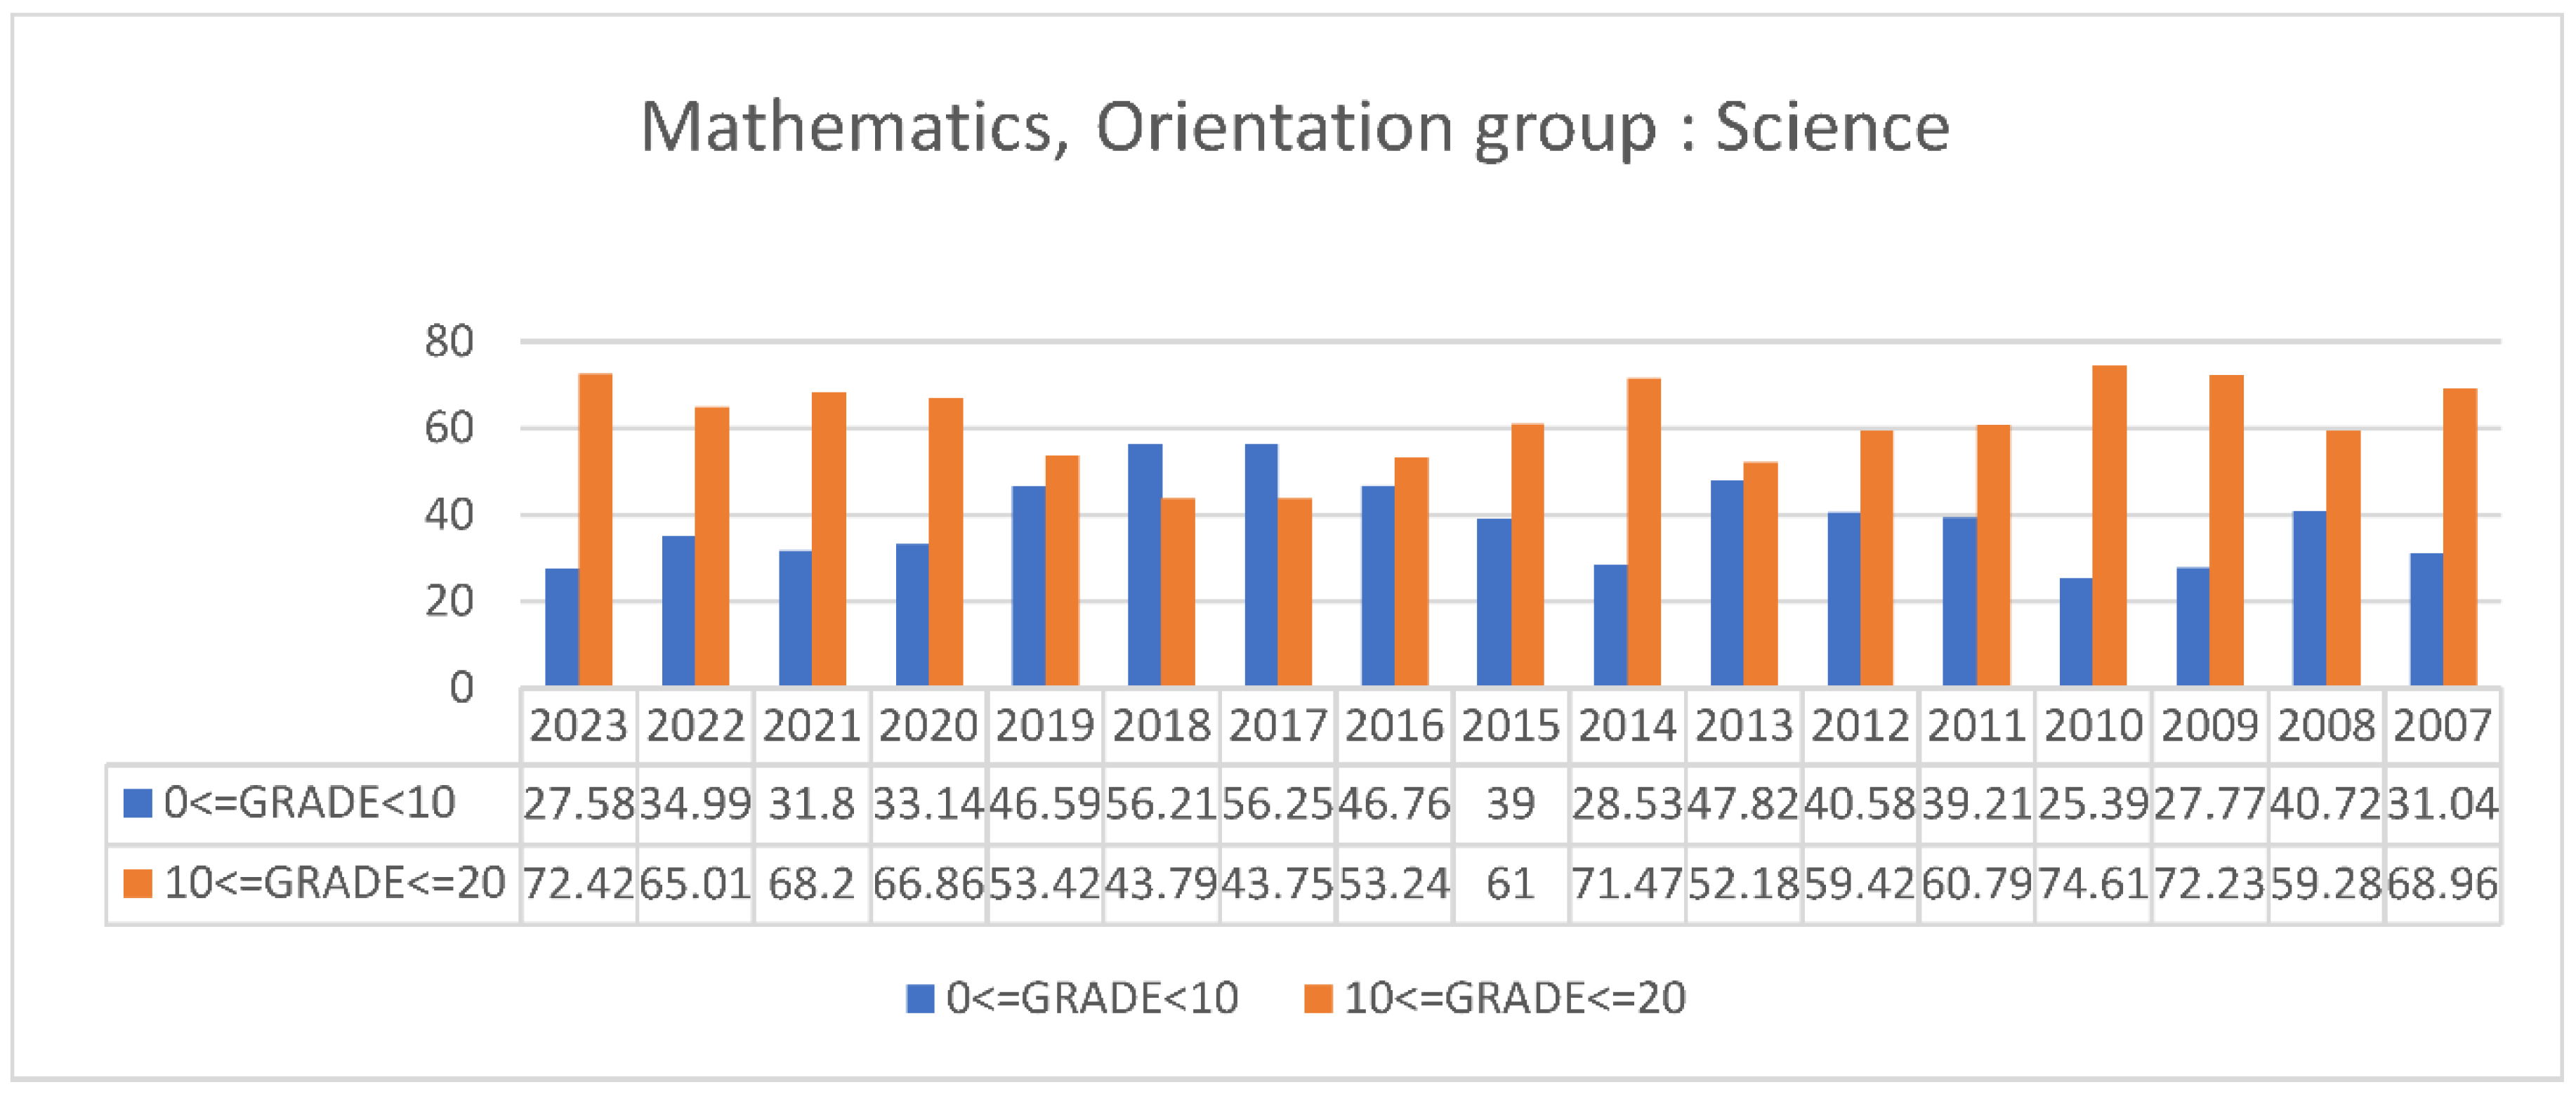
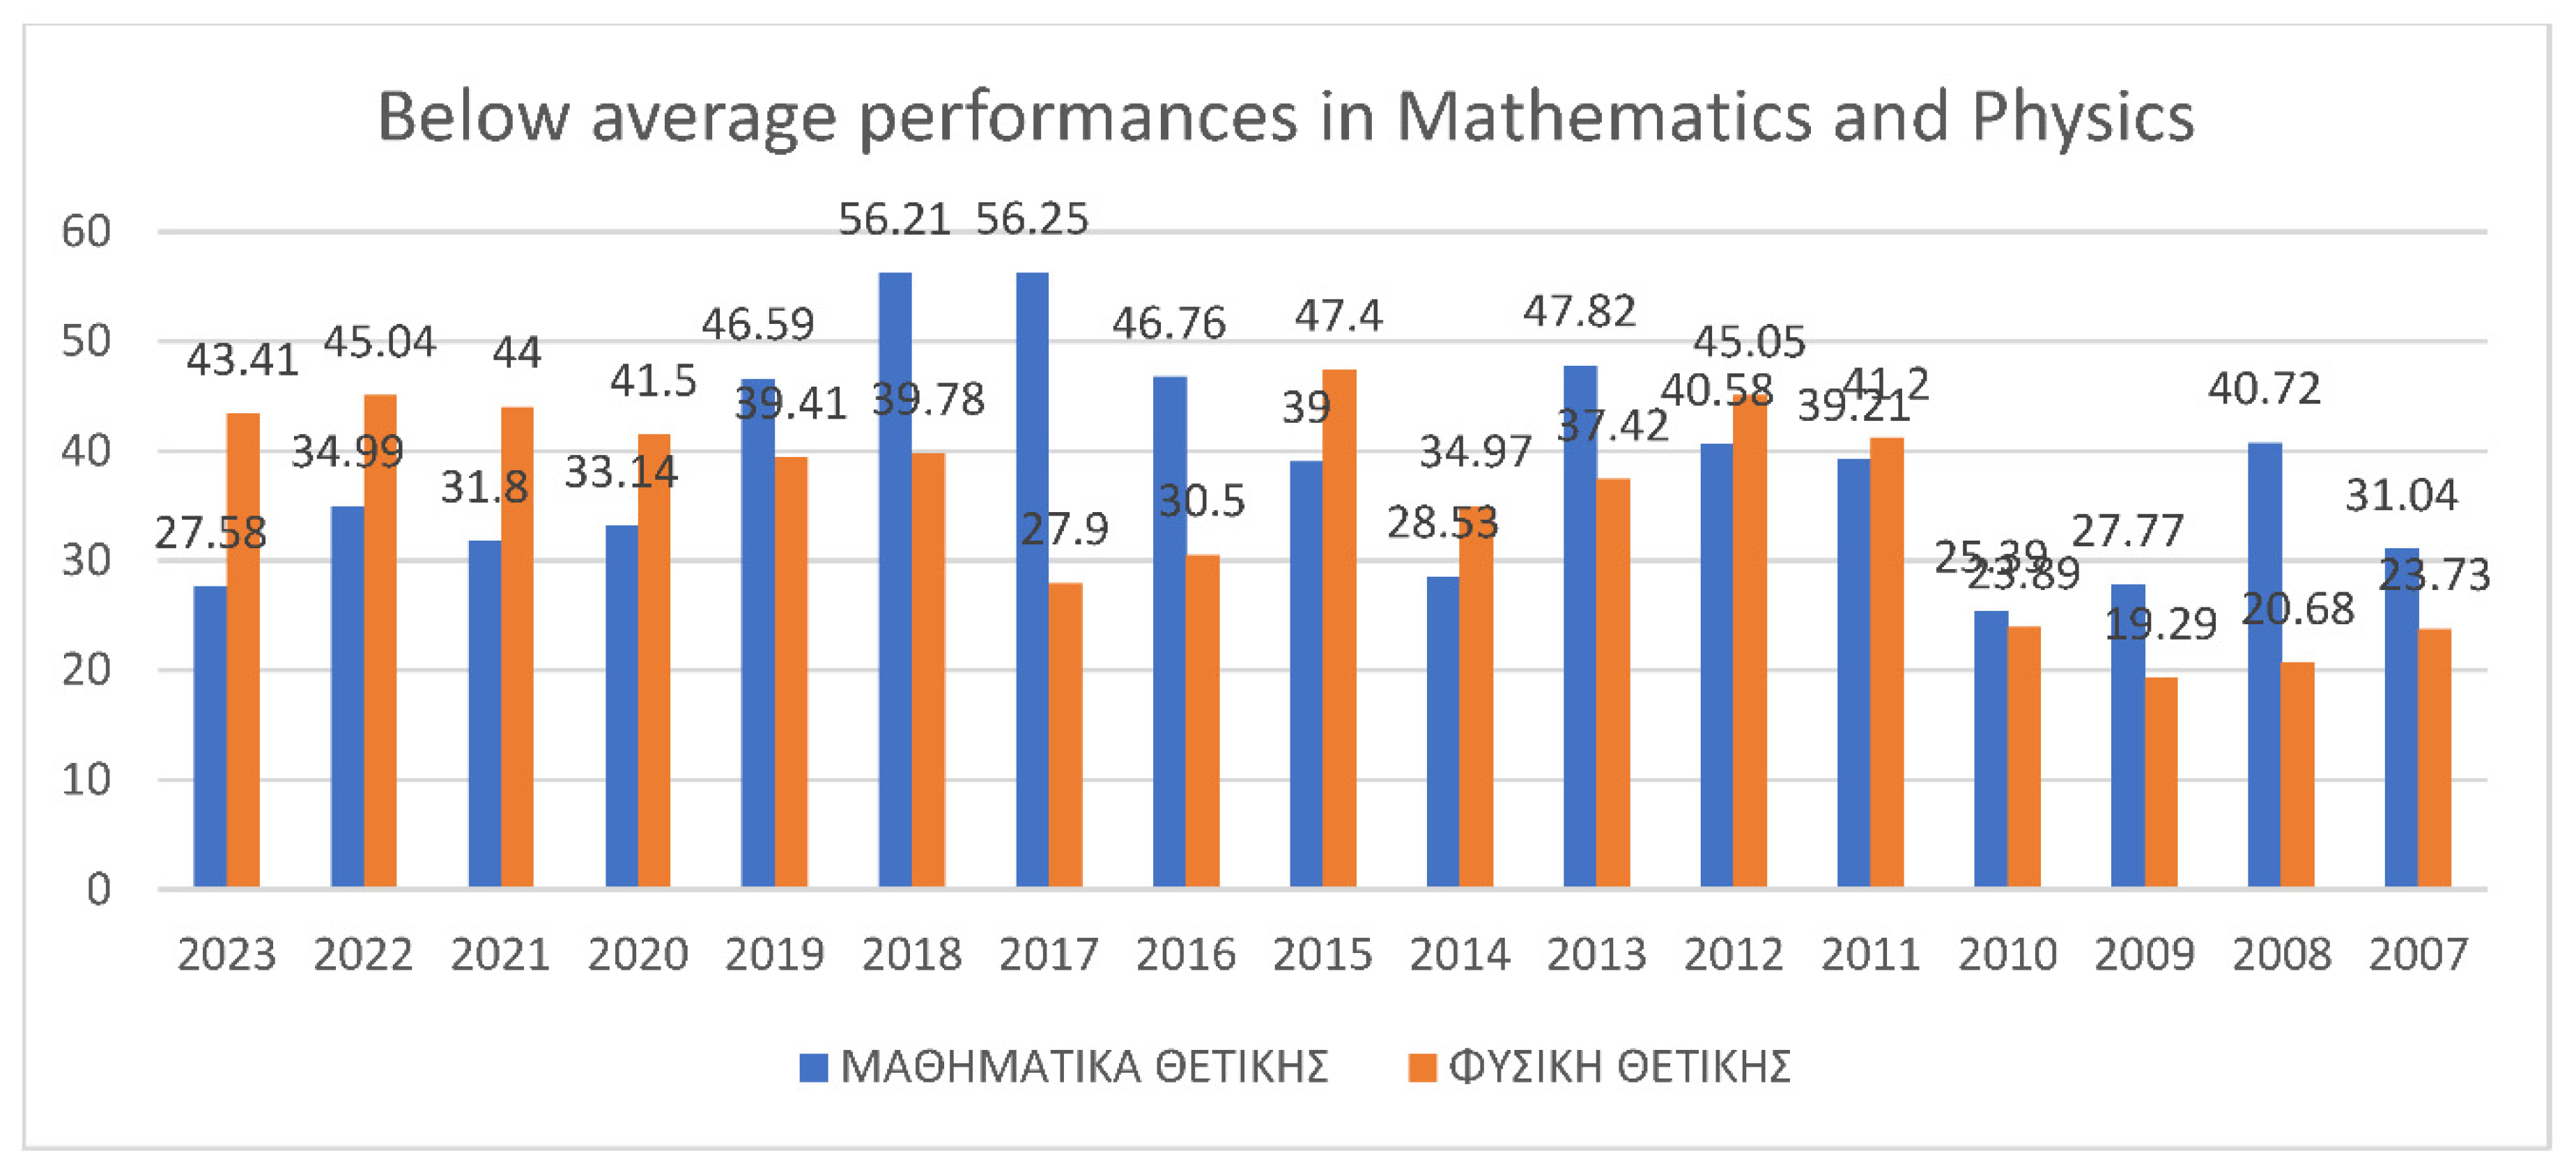
As far as performances in Mathematics – Orientation : Science are concerned, a significant percentage of students consistently scores below average, varying from 25,39% in 2010 to 56,25% in 2017. In 2023, 2022, 2021, 2020, 2015, 2014, 2011, 2007 the below average percentage varied from 25,39% to 40% ; in 2019, 2016, 2013, 2012, 2008 from 40,72% to 47,82%. Over 50% of the students did not attain a passing grade in the years 2017 and 2018.
Figure 2.
This table shows the percentage of students who were below the base, i.e. 10, and the percentage of students who were above the base in Maths-Informatics/Computer science orientation. [2,3,4,5,6,7,8,9,10,11,12,13].
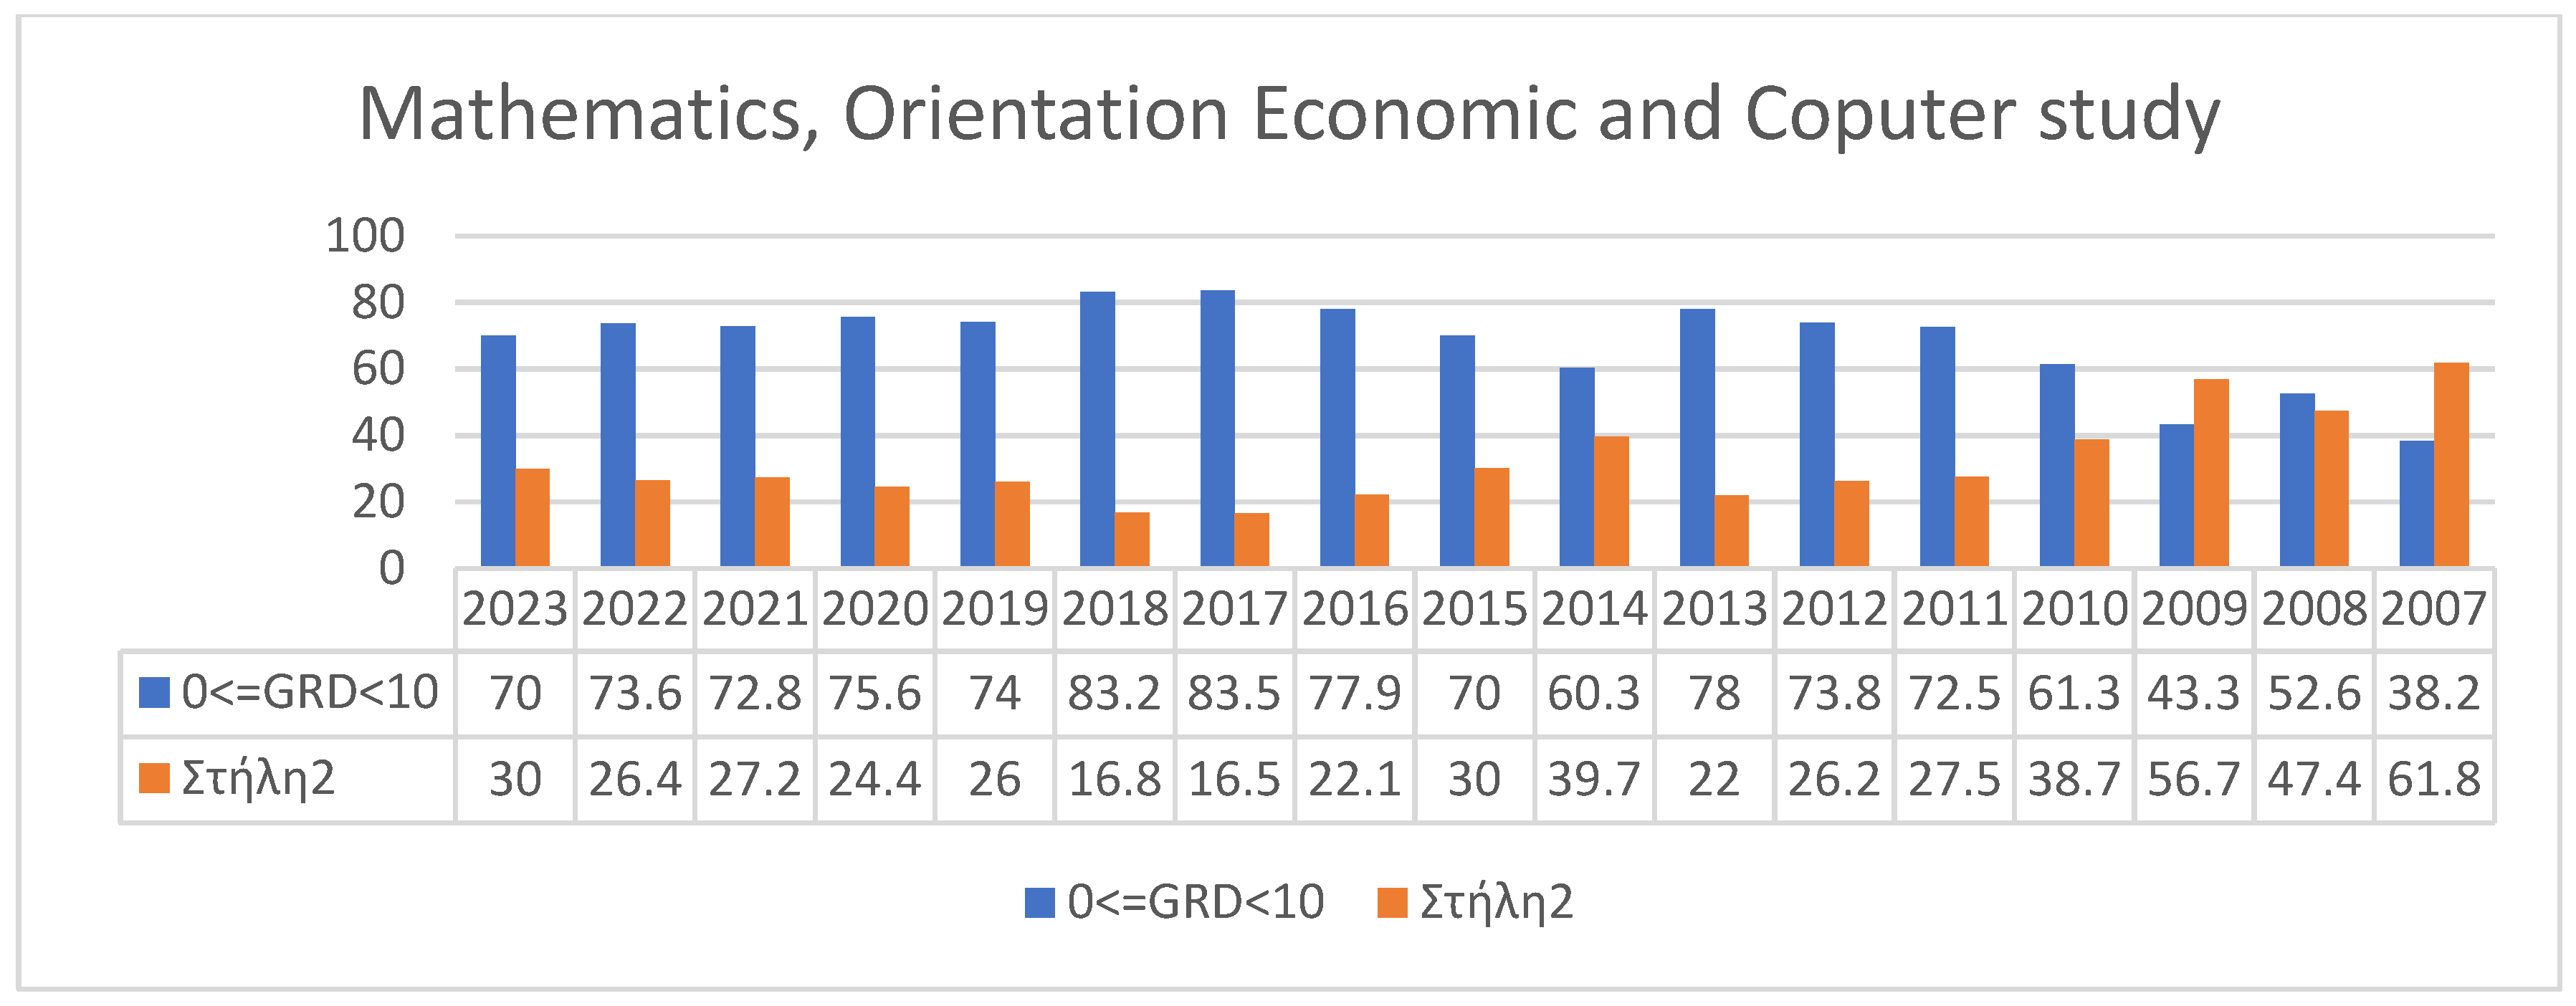
As far as Mathematics – Orientation : “Technology”, subsequently Orientation group “Informatics/Computer science and Economics”, is concerned, the percentage of students having scored below average is consistently over 52,61% since 2008, except for the years 2009 and 2007. The rest of the time, the percentage of below average performances varied from 52,61% to 83,46%. Out of the 17 years that were studied : in 3 years, 6 out of 10 students scored below average ; in 9 years, more than 7 out of 10 students scored below average, whereas there were two years where more than 8 out of 10 students scored below average.
It is clear that there is a huge discrepancy between the two groups of students so far examined, that is students from the Orientation group “Informatics/Computer science and Economics” and from the Orientation group “Science”.
Figure 3.
This table shows the percentage of students who were below the base, i.e. 10, and the percentage of students who were above the base in Maths-All orientation. [2,3,4,5,6,7,8,9,10,11,12,13].
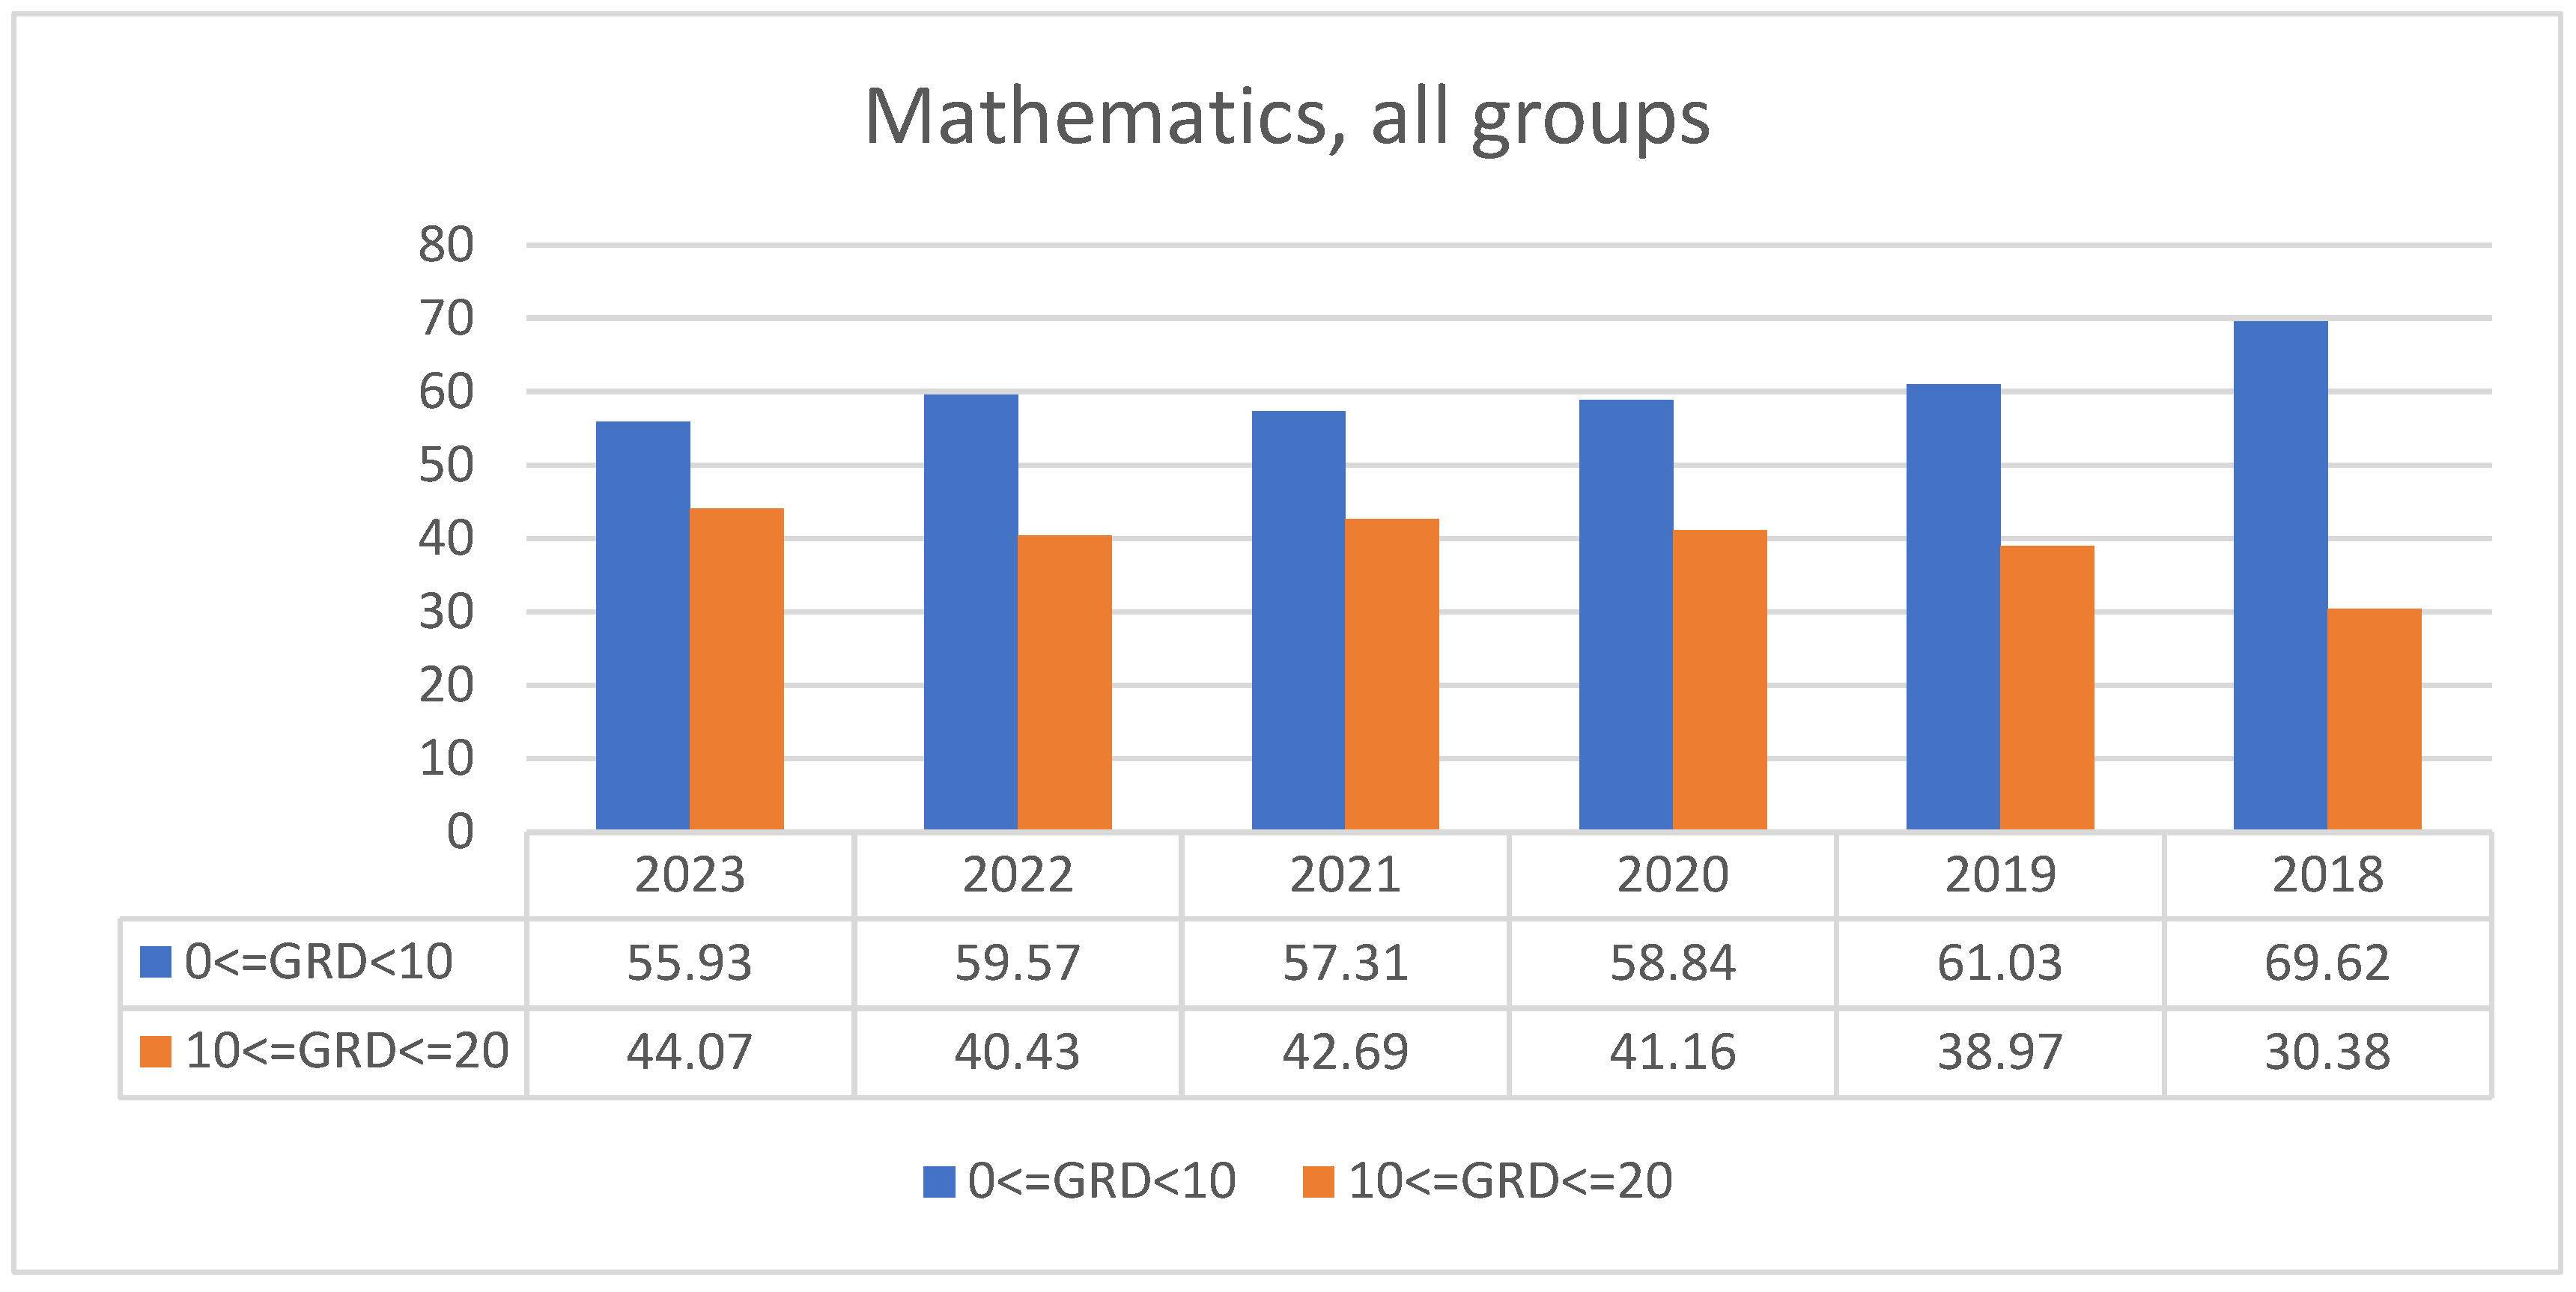
The following table presents the distribution of the students in the grading scale (0-5, 5-10, 10-11, 11-12, 12-13, 13-14, 15-16, 16-17, 17-18, 18-19, 19-20). The percentage of students who scored between 0 and 5 is quite remarkable. It is also noteworthy that during the years from 2021 to 2023, the percentages of students who achieved higher grades (over 18) were higher than the previous years. It seems that the reduction of the number of subjects at the panhellenic exams has had an impact on the number of students who were able to attain very good or excellent grades. Overall, the largest percentage of students is situated between the grades 14 and 17.
Figure 4.
This figure make a compariso of below average persentage accoring to Orientation group in Mathematics. [2,3,4,5,6,7,8,9,10,11,12,13].
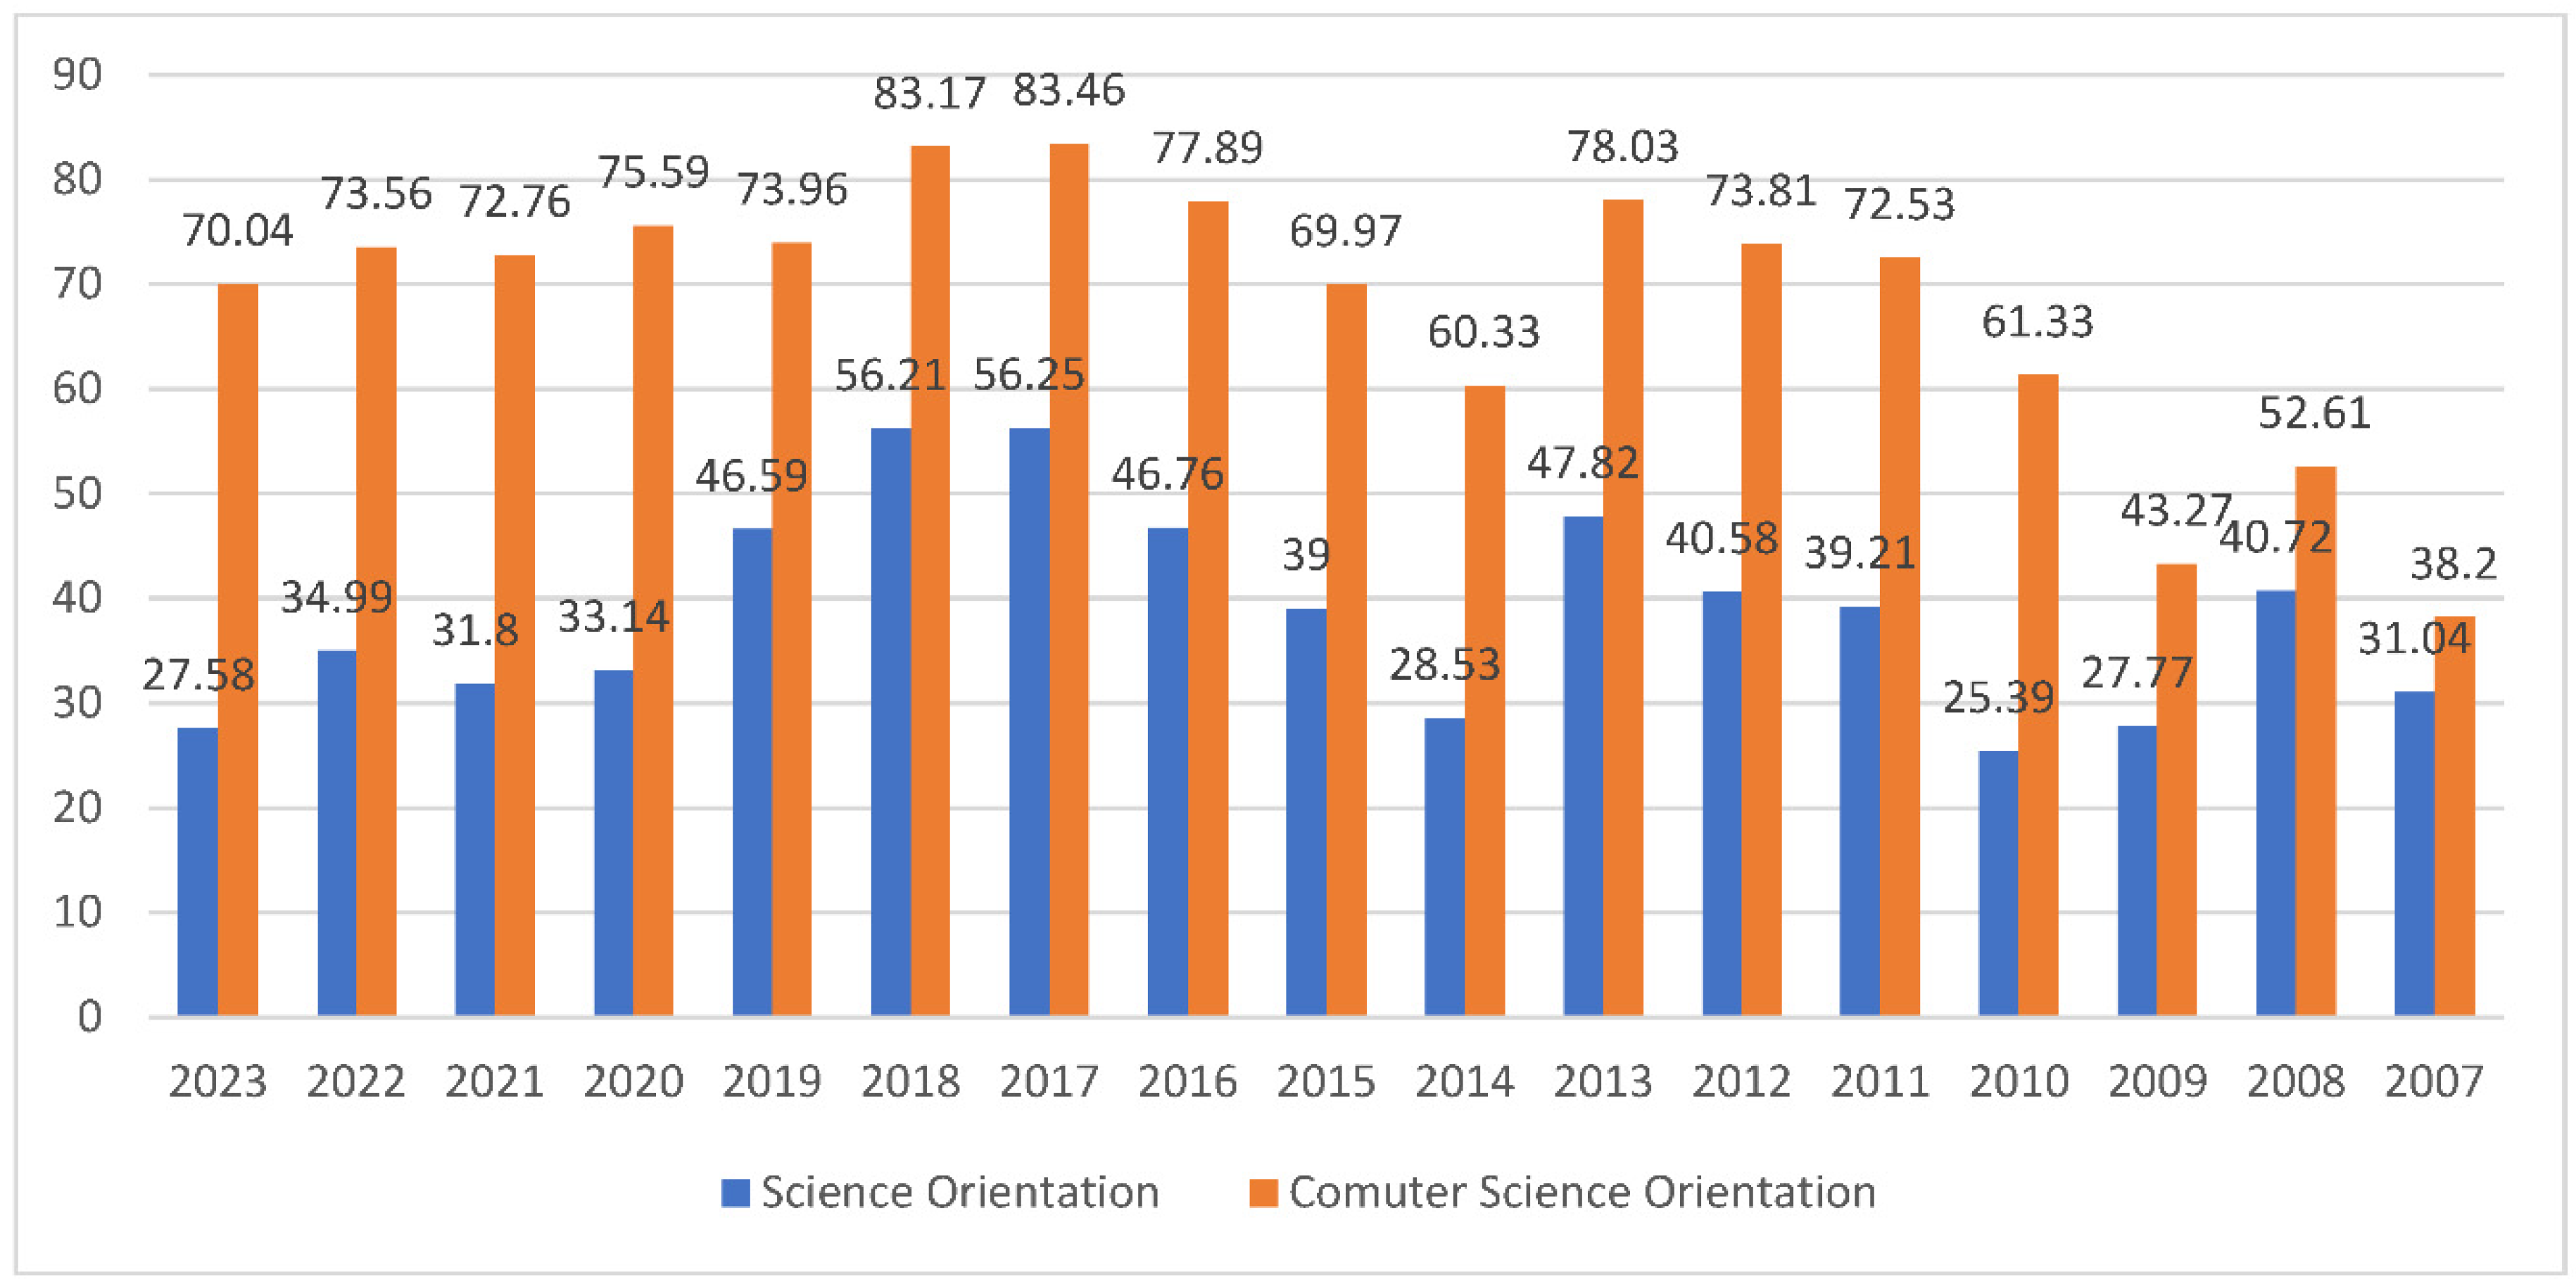
Figure 5.
This table has points from zero to twenty divided into the following ranges 0-5, 5-10 and then by one unit. In each margin is written the percentage of students who achieved the corresponding score. For MATHEMATICS – Orientation : Science. [2,3,4,5,6,7,8,9,10,11,12,13].
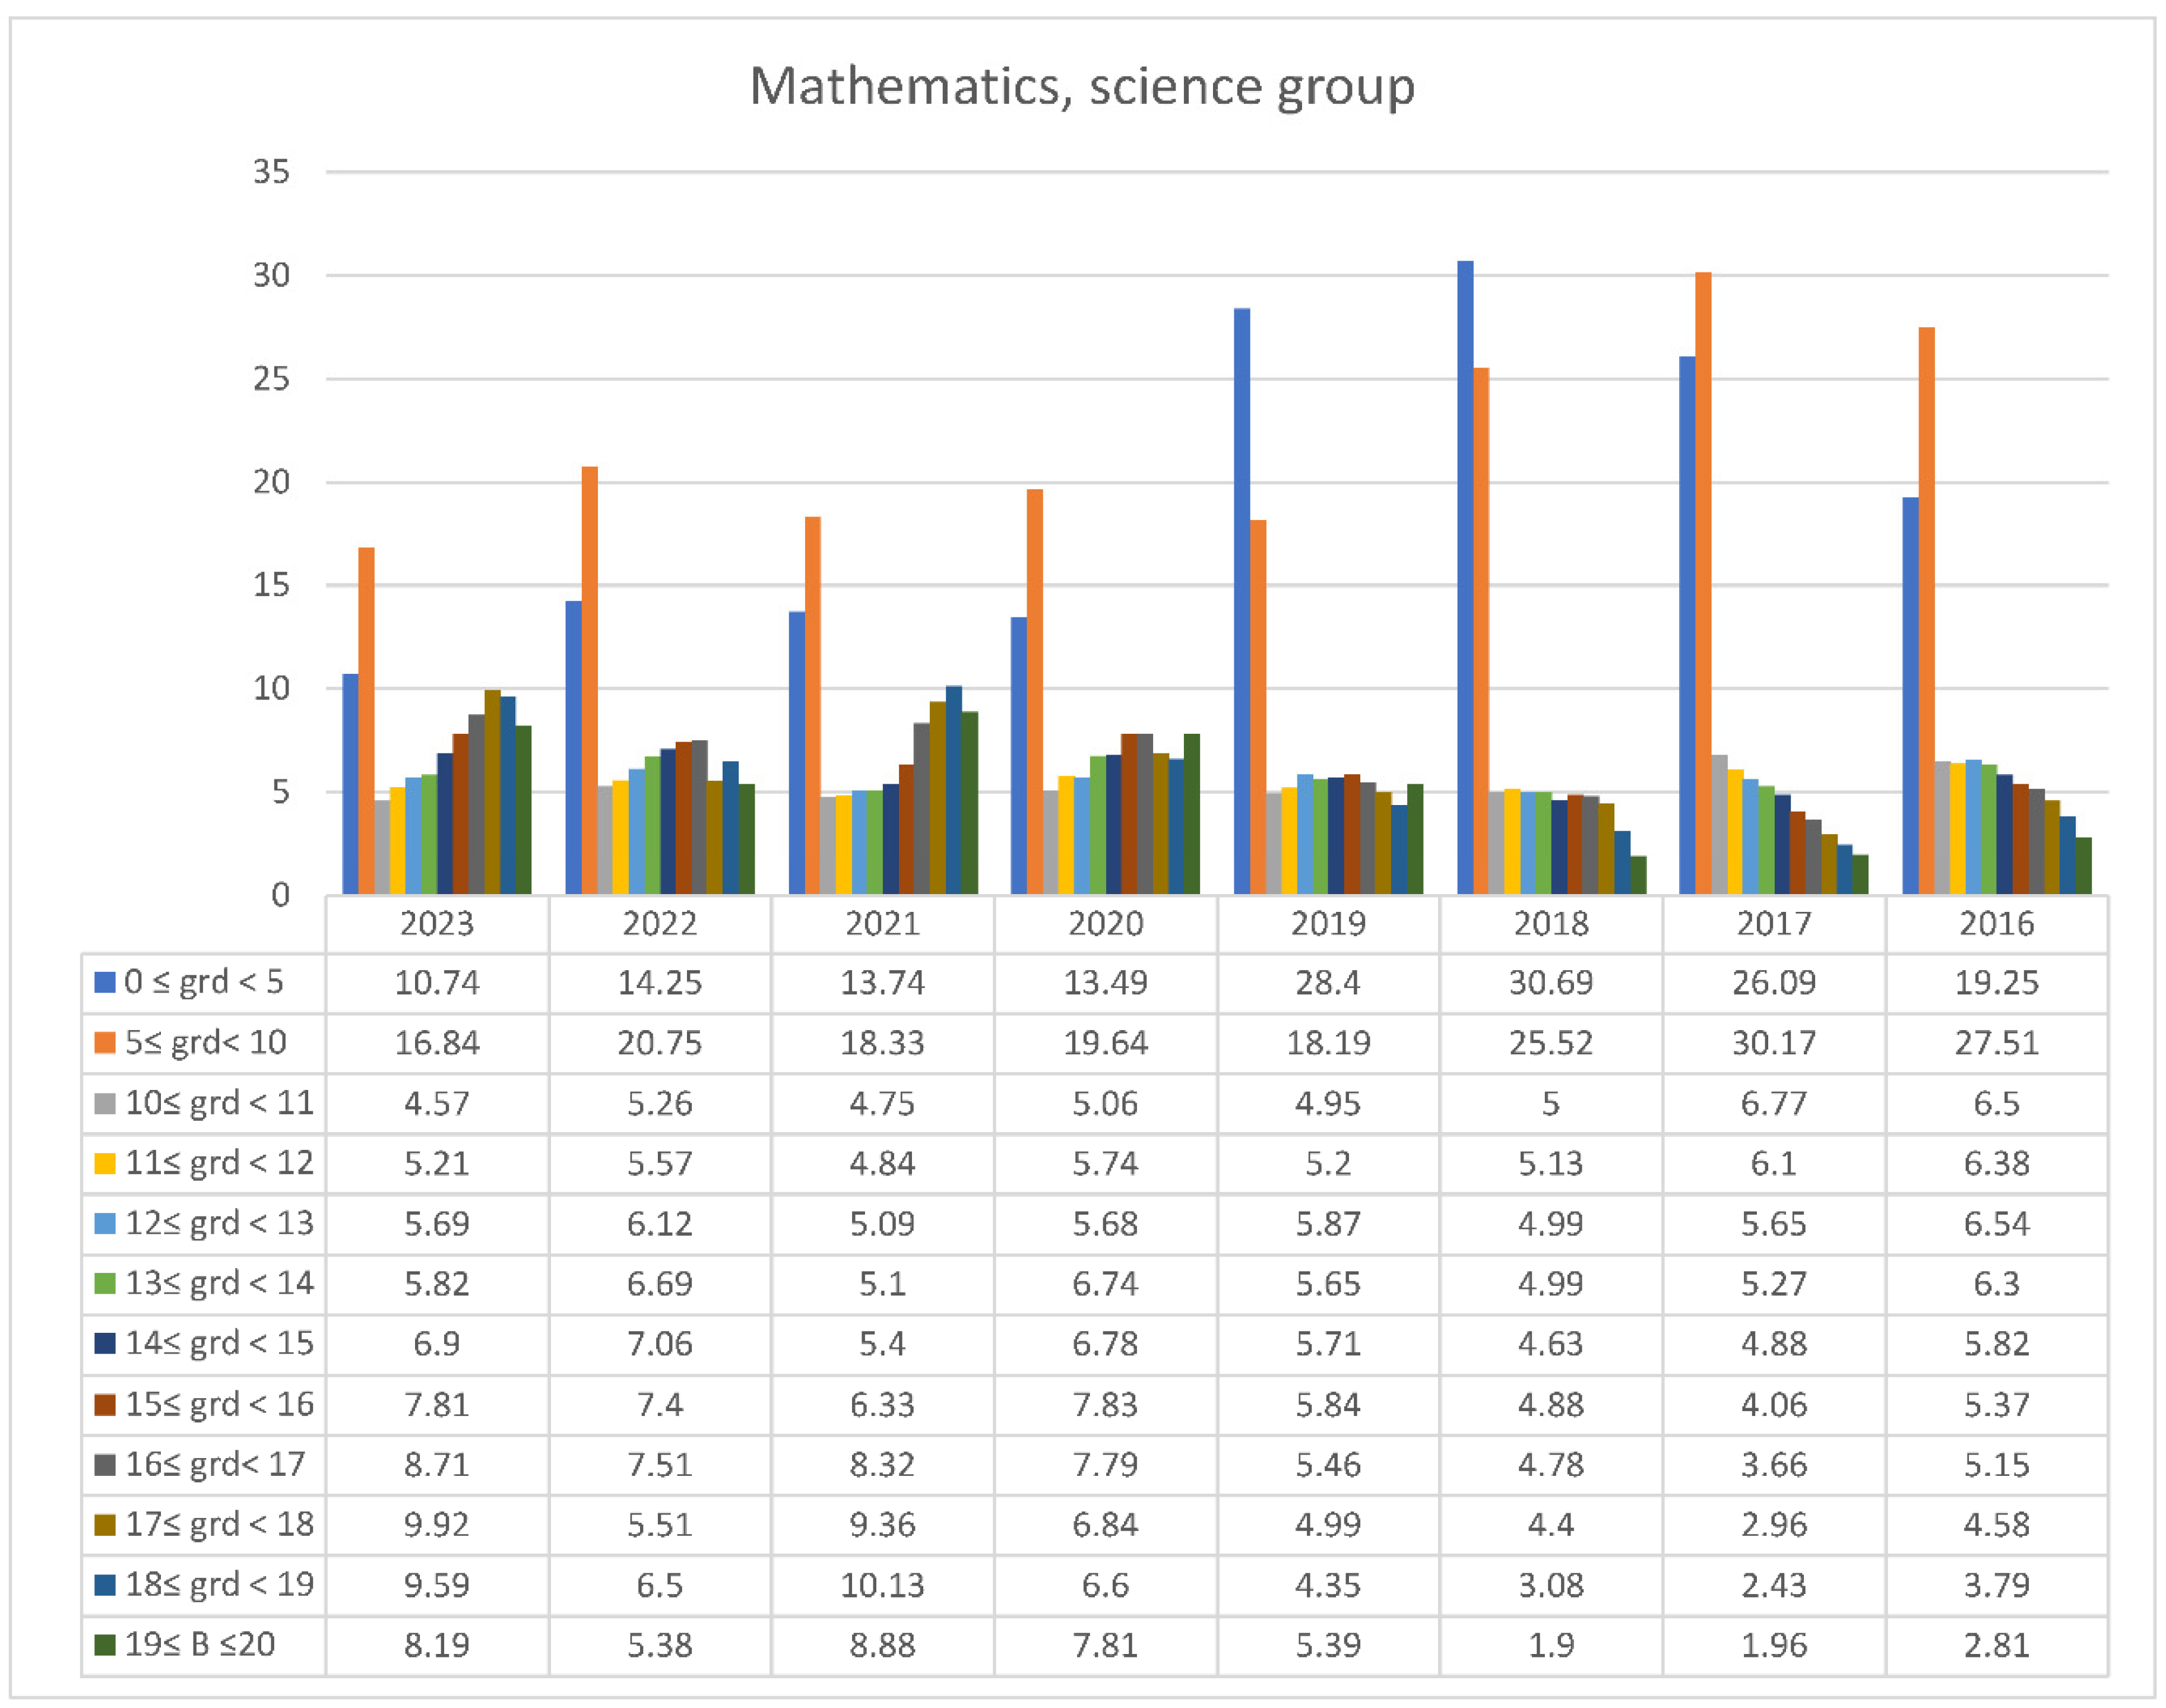
As far as the Orientation group “Informatics/Computer science” is concerned, we observe a lower percentage of students who were able to attain grades above average, which in turn, affects the percentage of students who attained excellent grades. The latter is significantly lower than the corresponding percentage of students from the Orientation group “Science”. Less than 1% of students scored between 19 and 20 and between 18 and 19 in almost every exam. On the other hand, the largest percentage of students who scored above average is situated between the grades 11 and 15.
Figure 6.
This figure has points from zero to twenty divided into the following ranges 0-5, 5-10 and then by one unit. In each margin is written the percentage of students who achieved the corresponding score. For MATHEMATICS – Orientation : Informatics/Computer science from 2016 to 2023 [2,3,4,5,6,7,8,9,10,11,12,13].
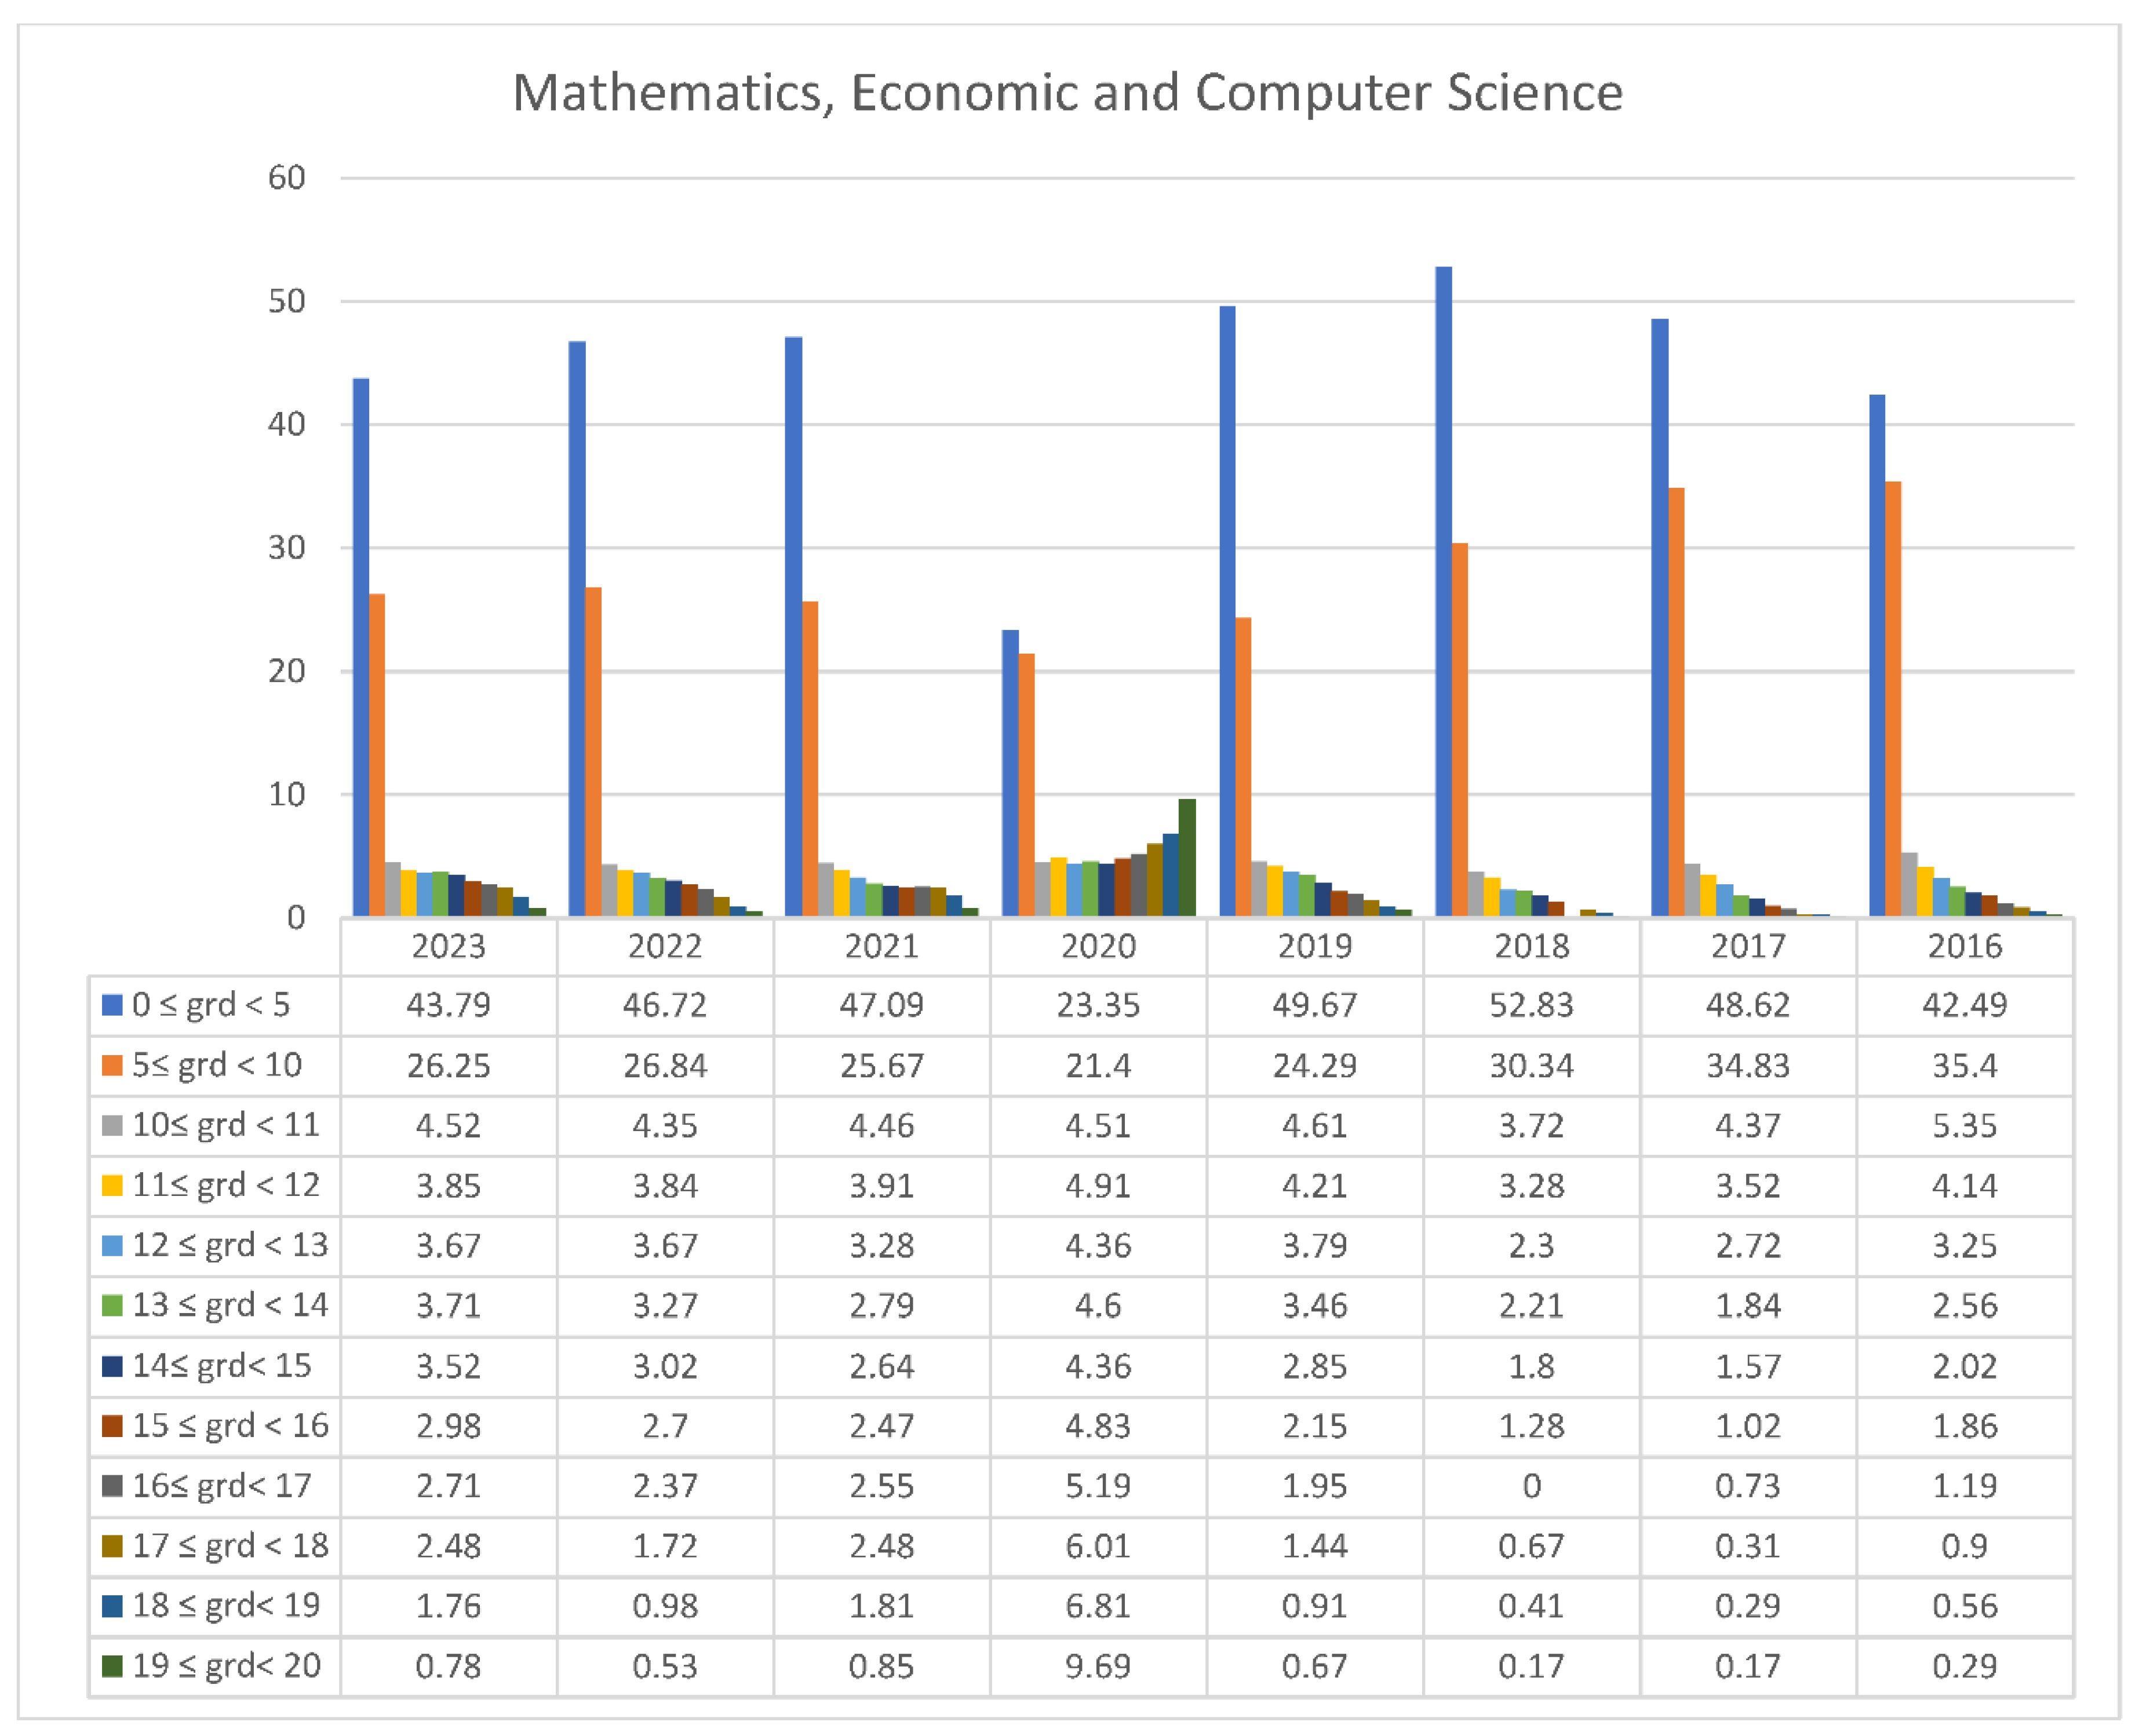
Figure 7.
This figure has points from zero to twenty divided into the following ranges 0-5, 5-10 and then by one unit. In each margin is written the percentage of students who achieved the corresponding score. For MATHEMATICS – Orientation : technology up to 2014. [2,3,4,5,6,7,8,9,10,11,12,13].
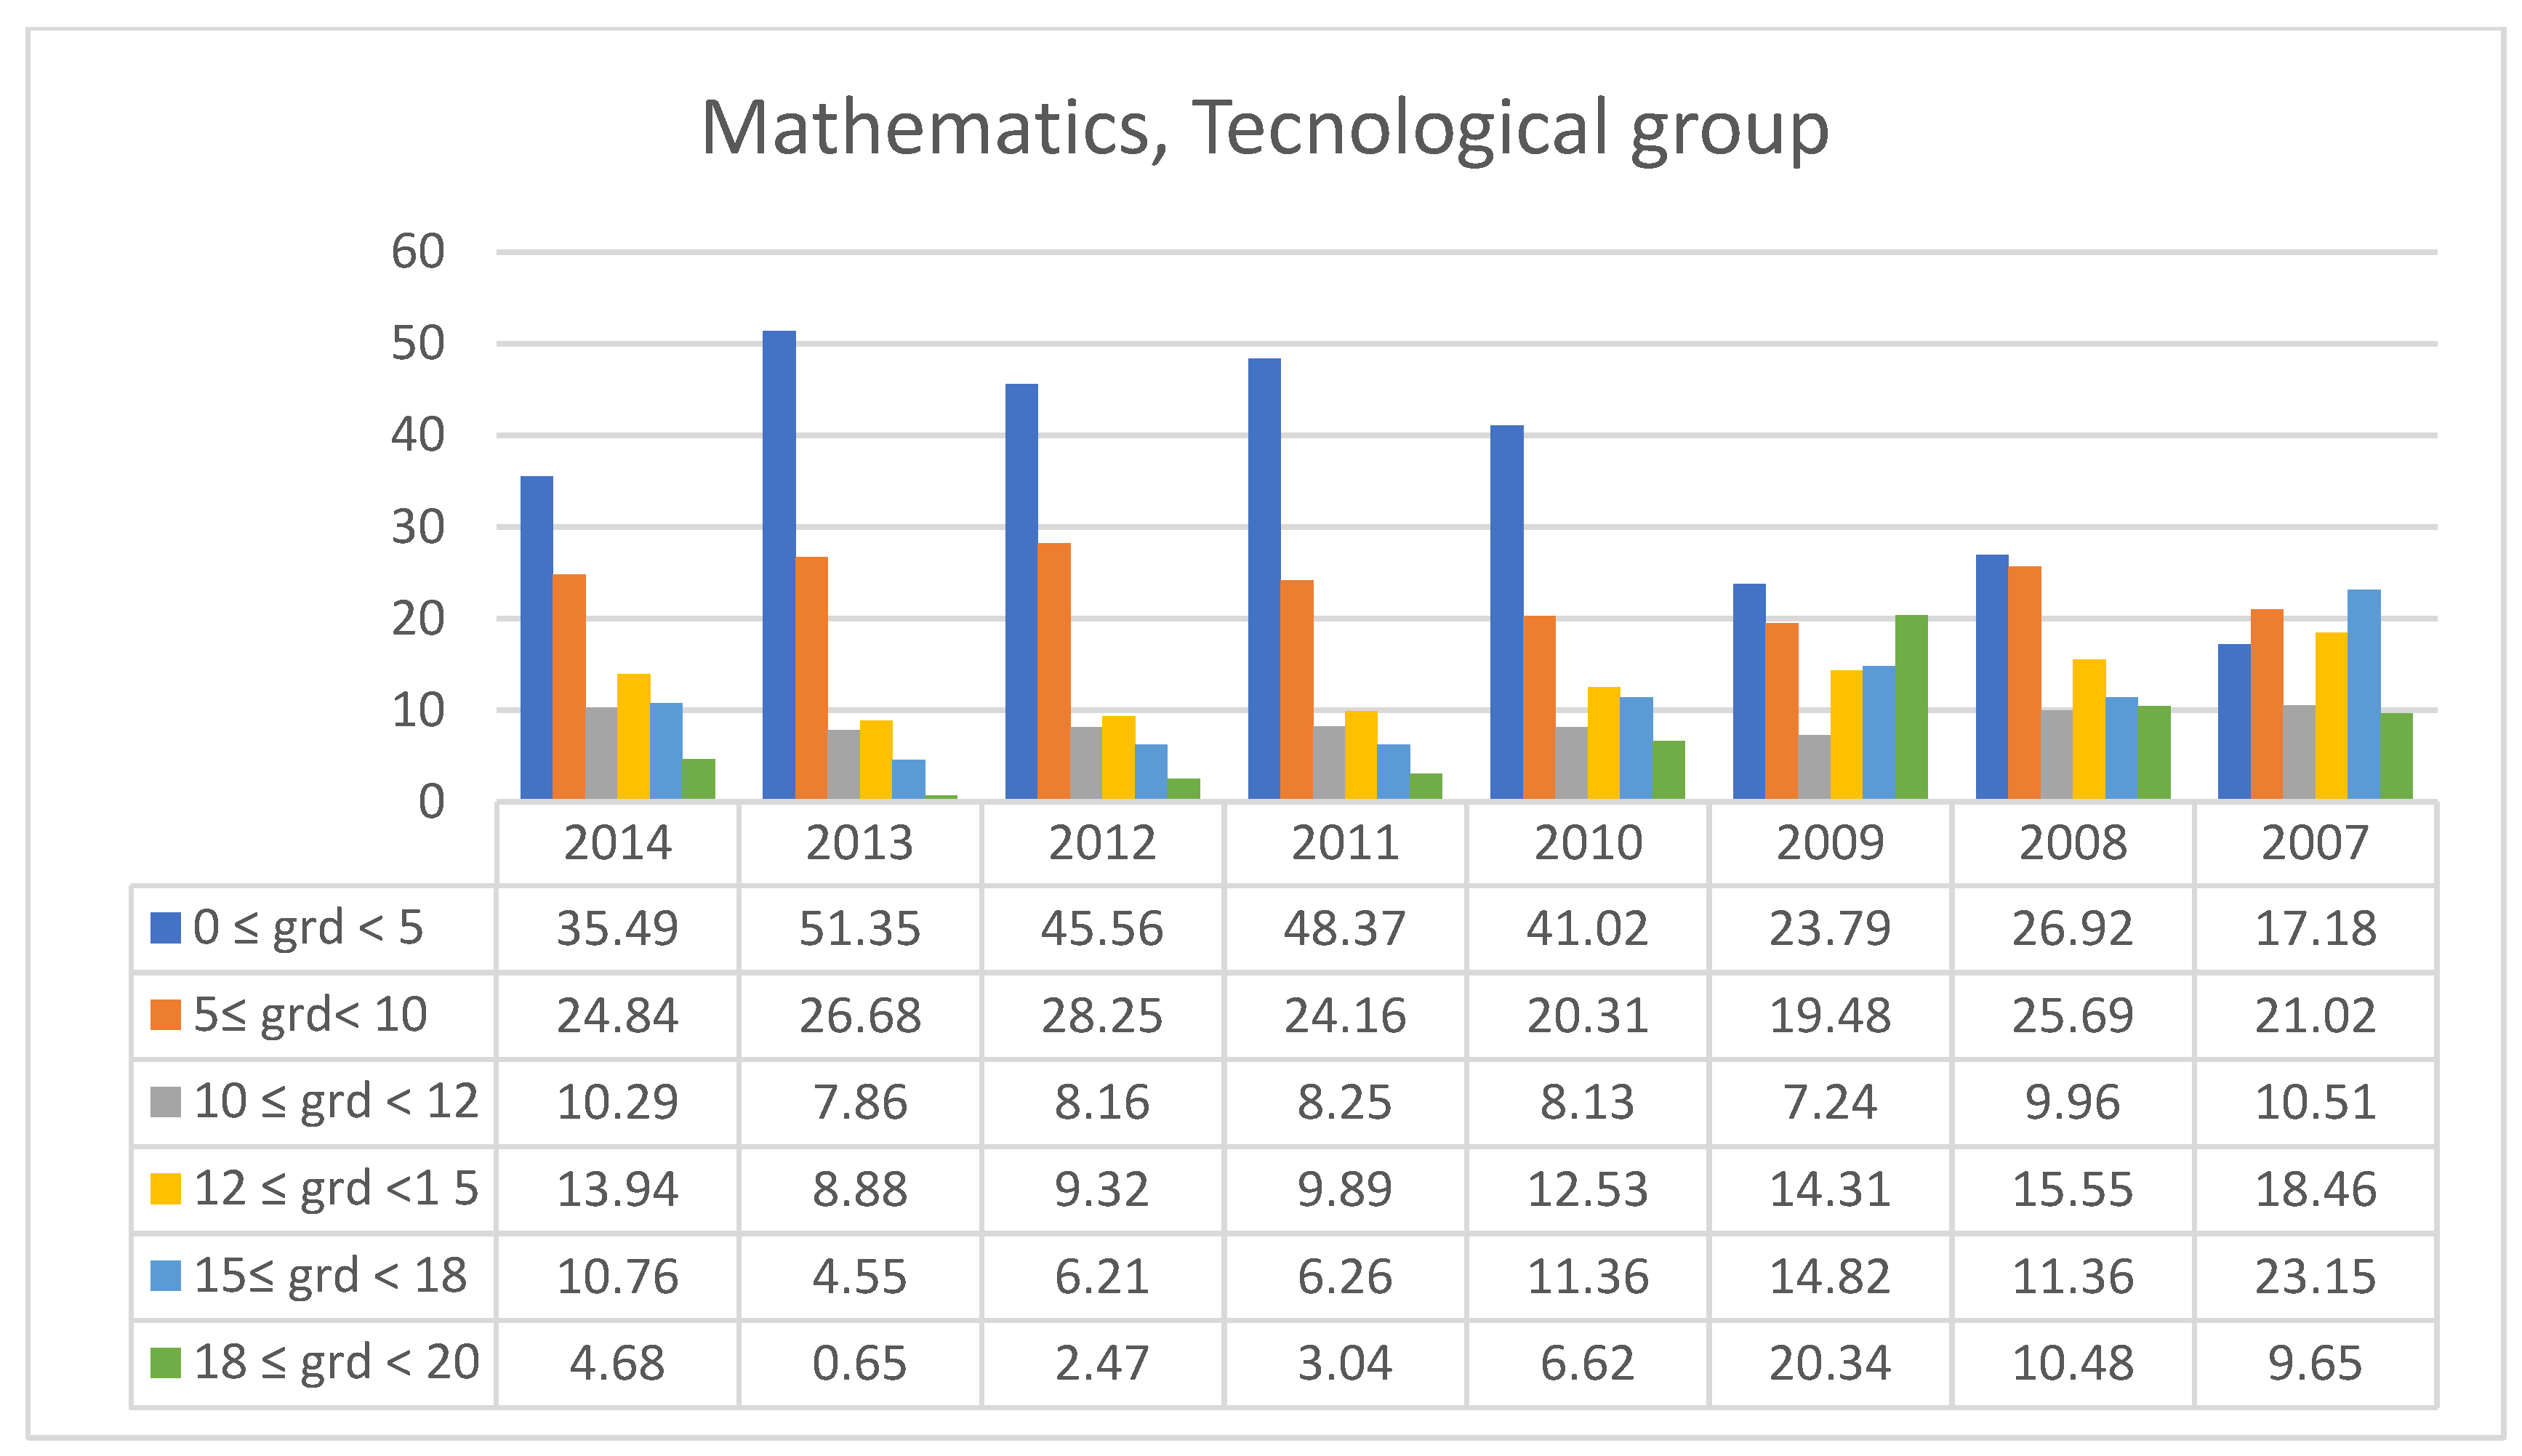
Figure 8.
This table has points from zero to twenty divided into the following ranges 0-5, 5-10 and then by one unit. In each margin is written the percentage of students who achieved the corresponding score. For MATHEMATICS – All Orientations [2,3,4,5,6,7,8,9,10,11,12,13].
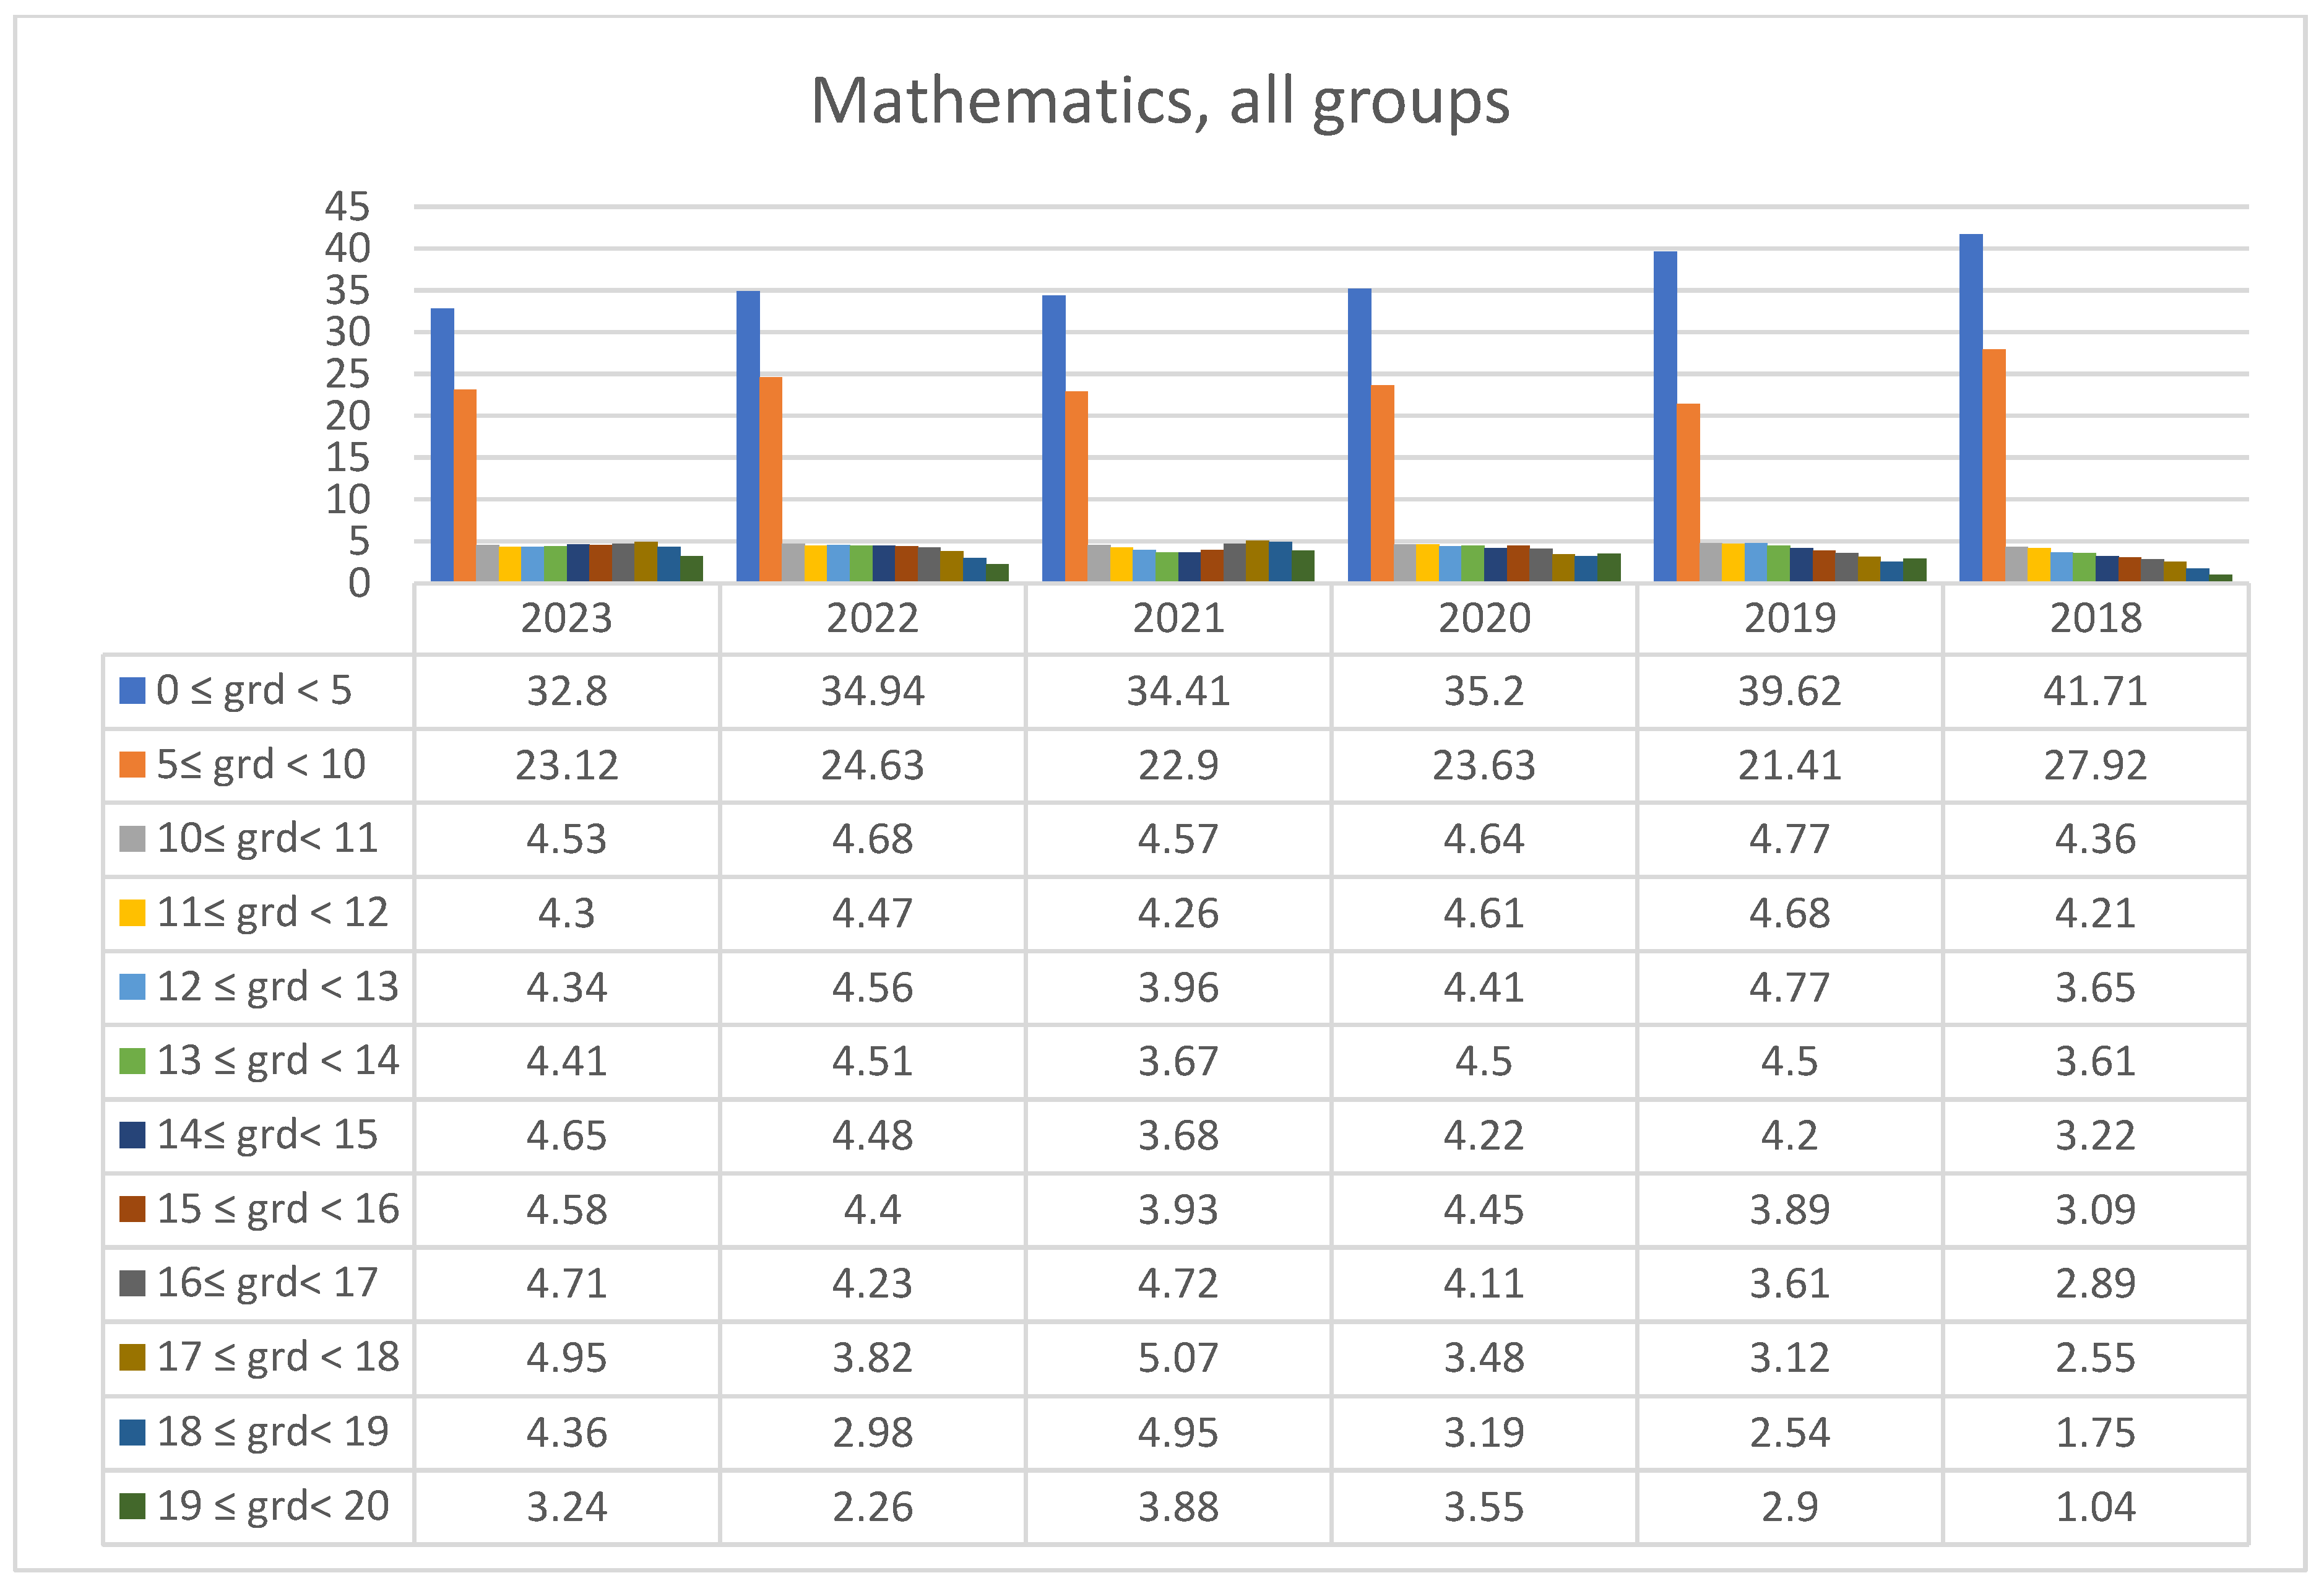
Figure 9.
This figure shows the percentage of students who were below the base, i.e. 10, and the percentage of students who were above the base in Physics- Operation Science [2,3,4,5,6,7,8,9,10,11,12,13].
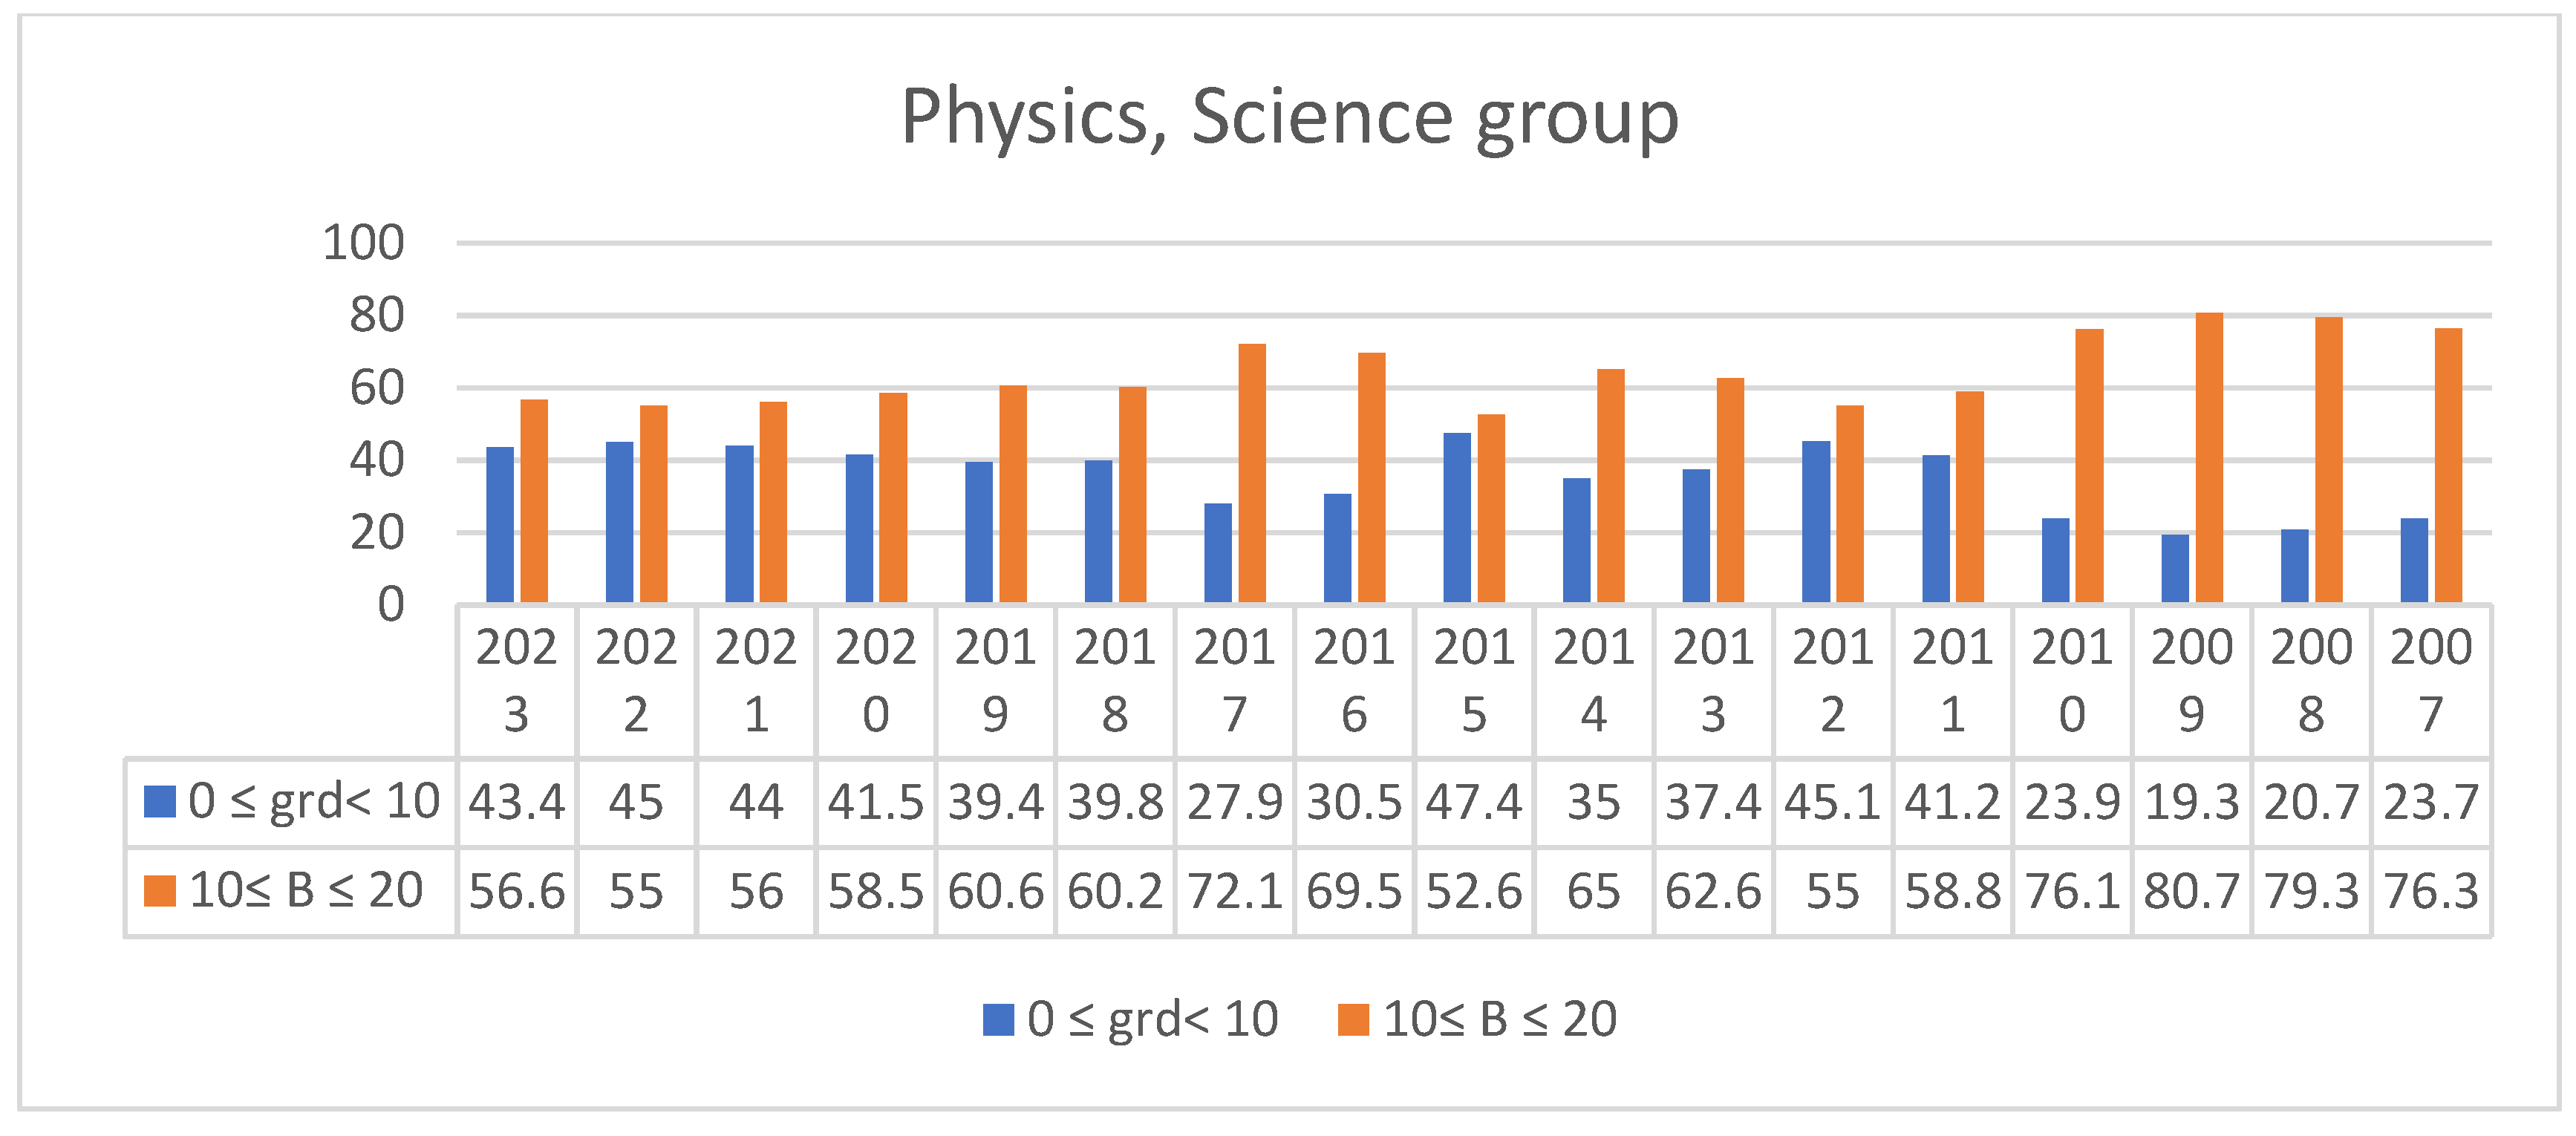
In Physics, Orientation group “Science”, the lowest percentage of students scoring below average – 20,68% – was recorded in 2008 and the highest – 47,4% – in 2015. In the years between 2007 and 2010, the same percentage ranged from 19,29% to 23,89%. In the years 2013, 2014, 2016, 2018 and 2019, it ranged from 30,5% to 39,78%. In the rest of the years, it varied from 41,2% to 45,05%.
Figure 10.
This table shows the percentage of students who were below the base, i.e. 10, and the percentage of students who were above the base in Physics- Health Science orientation [2,3,4,5,6,7,8,9,10,11,12,13].
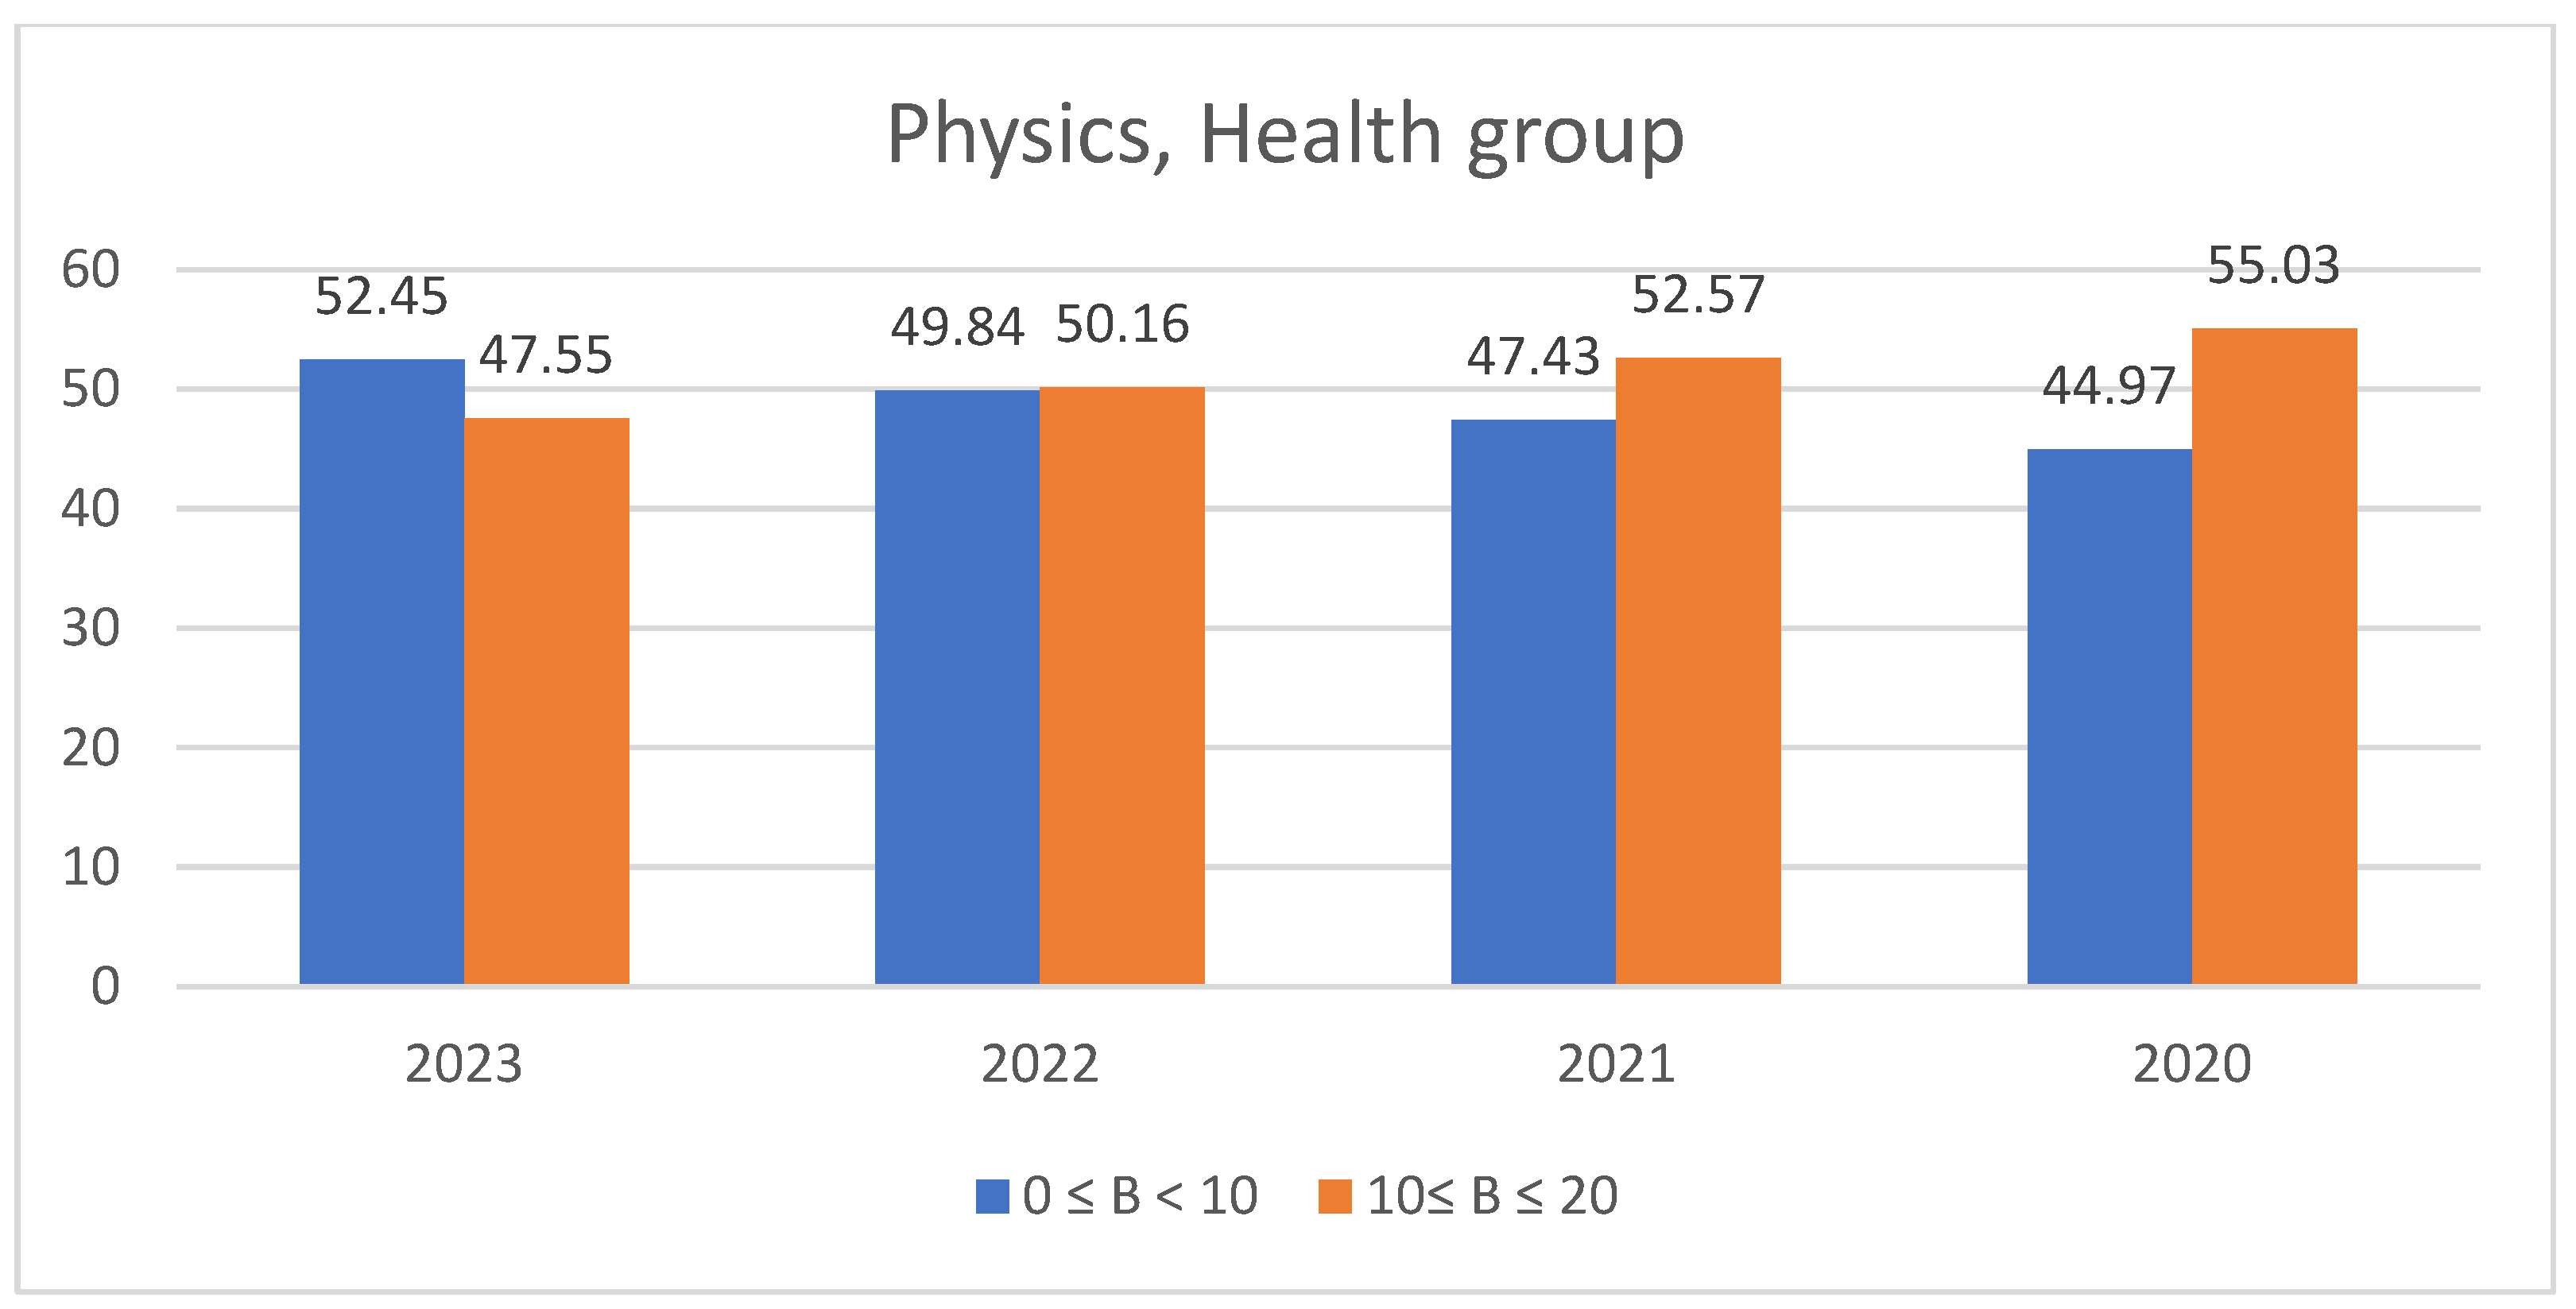
Since the year 2020, which sees the introduction of the Orientation group “Health sciences”, the percentage of students scoring below average ranges from 44,97% to 52,45%. During the four years of its existence, almost half of the student population have not achieved a passing grade.
Figure 11.
This figure shows the percentage of students who were below the base, i.e. 10, and the percentage of students who were above the base in Physics- Technology orientation [2,3,4,5,6,7,8,9,10,11,12,13].
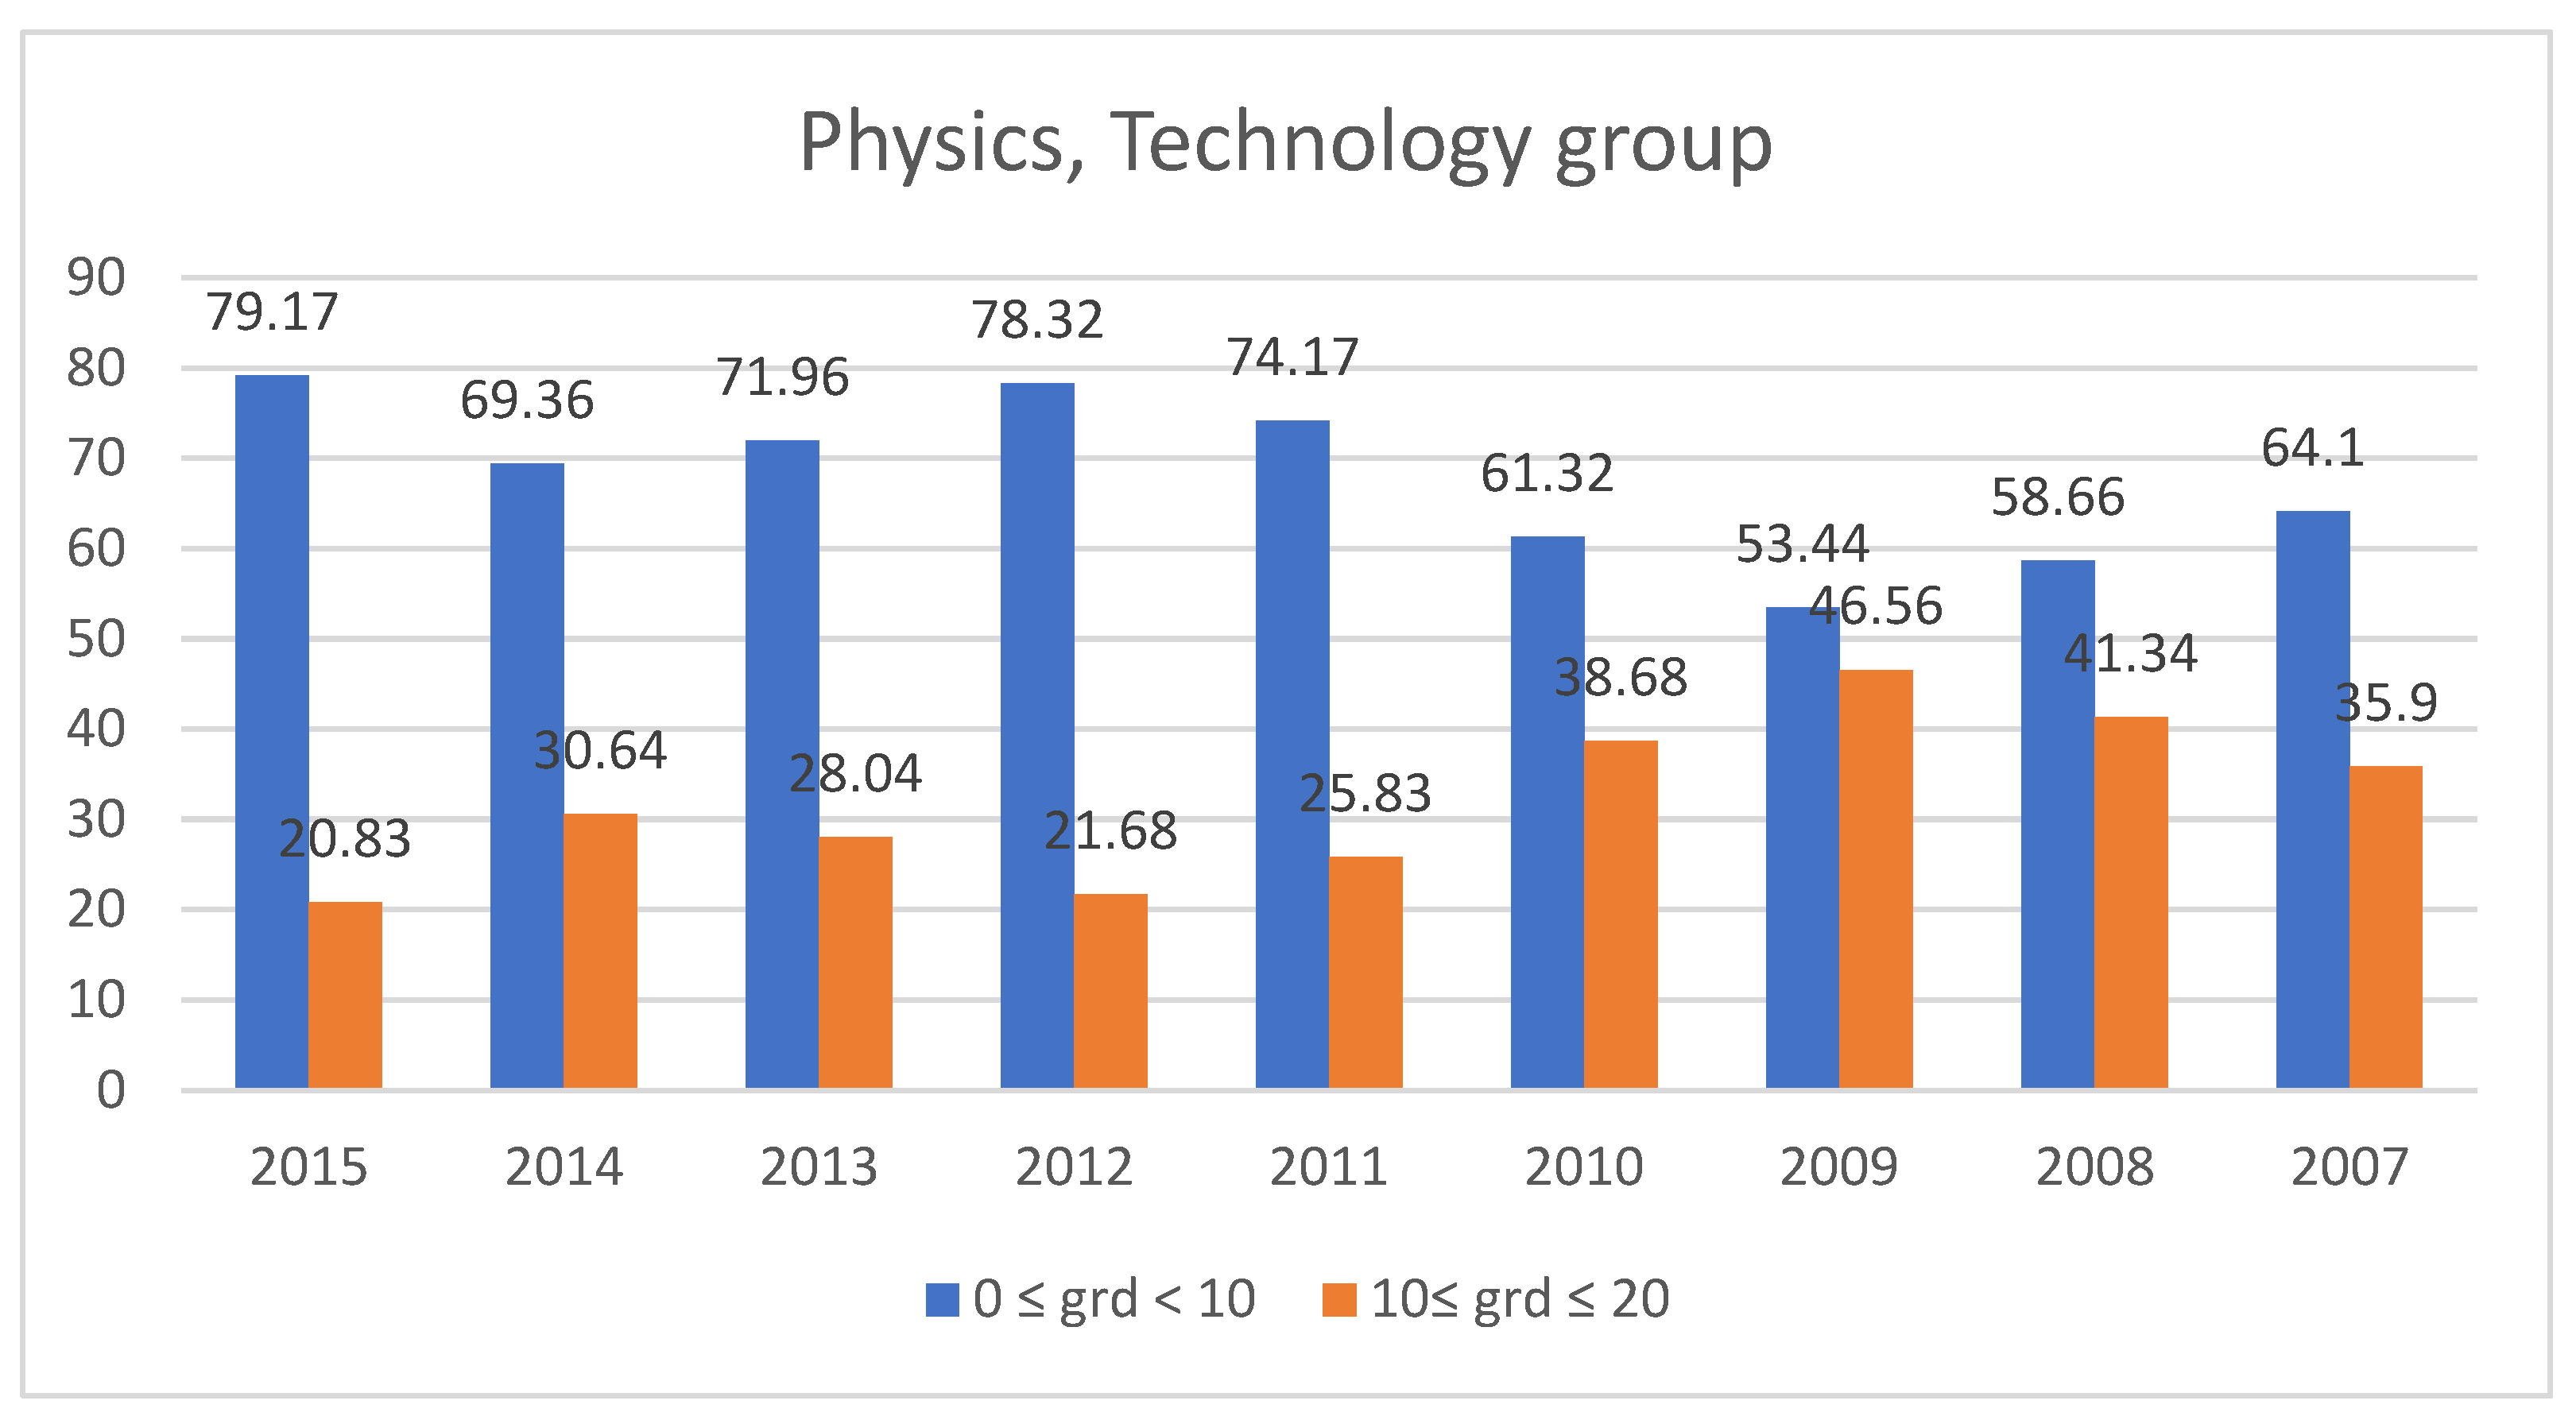
From 2007 to 2015, there was also the separate orientation “Technology”, where students were tested in Physics. The percentage of students scoring below average was higher than that of the students from the orientation “Science”. More specifically, the percentage ranges from 53,44% in 2009 to 79,17% in 2015. Every year, at least half of the student population scored below average. In 2011, almost three out of four students scored below average (74,17%).
Figure 12.
This table shows the percentage of students who were below the base, i.e. 10, and the percentage of students who were above the base in Physics-All orientation [2,3,4,5,6,7,8,9,10,11,12,13].
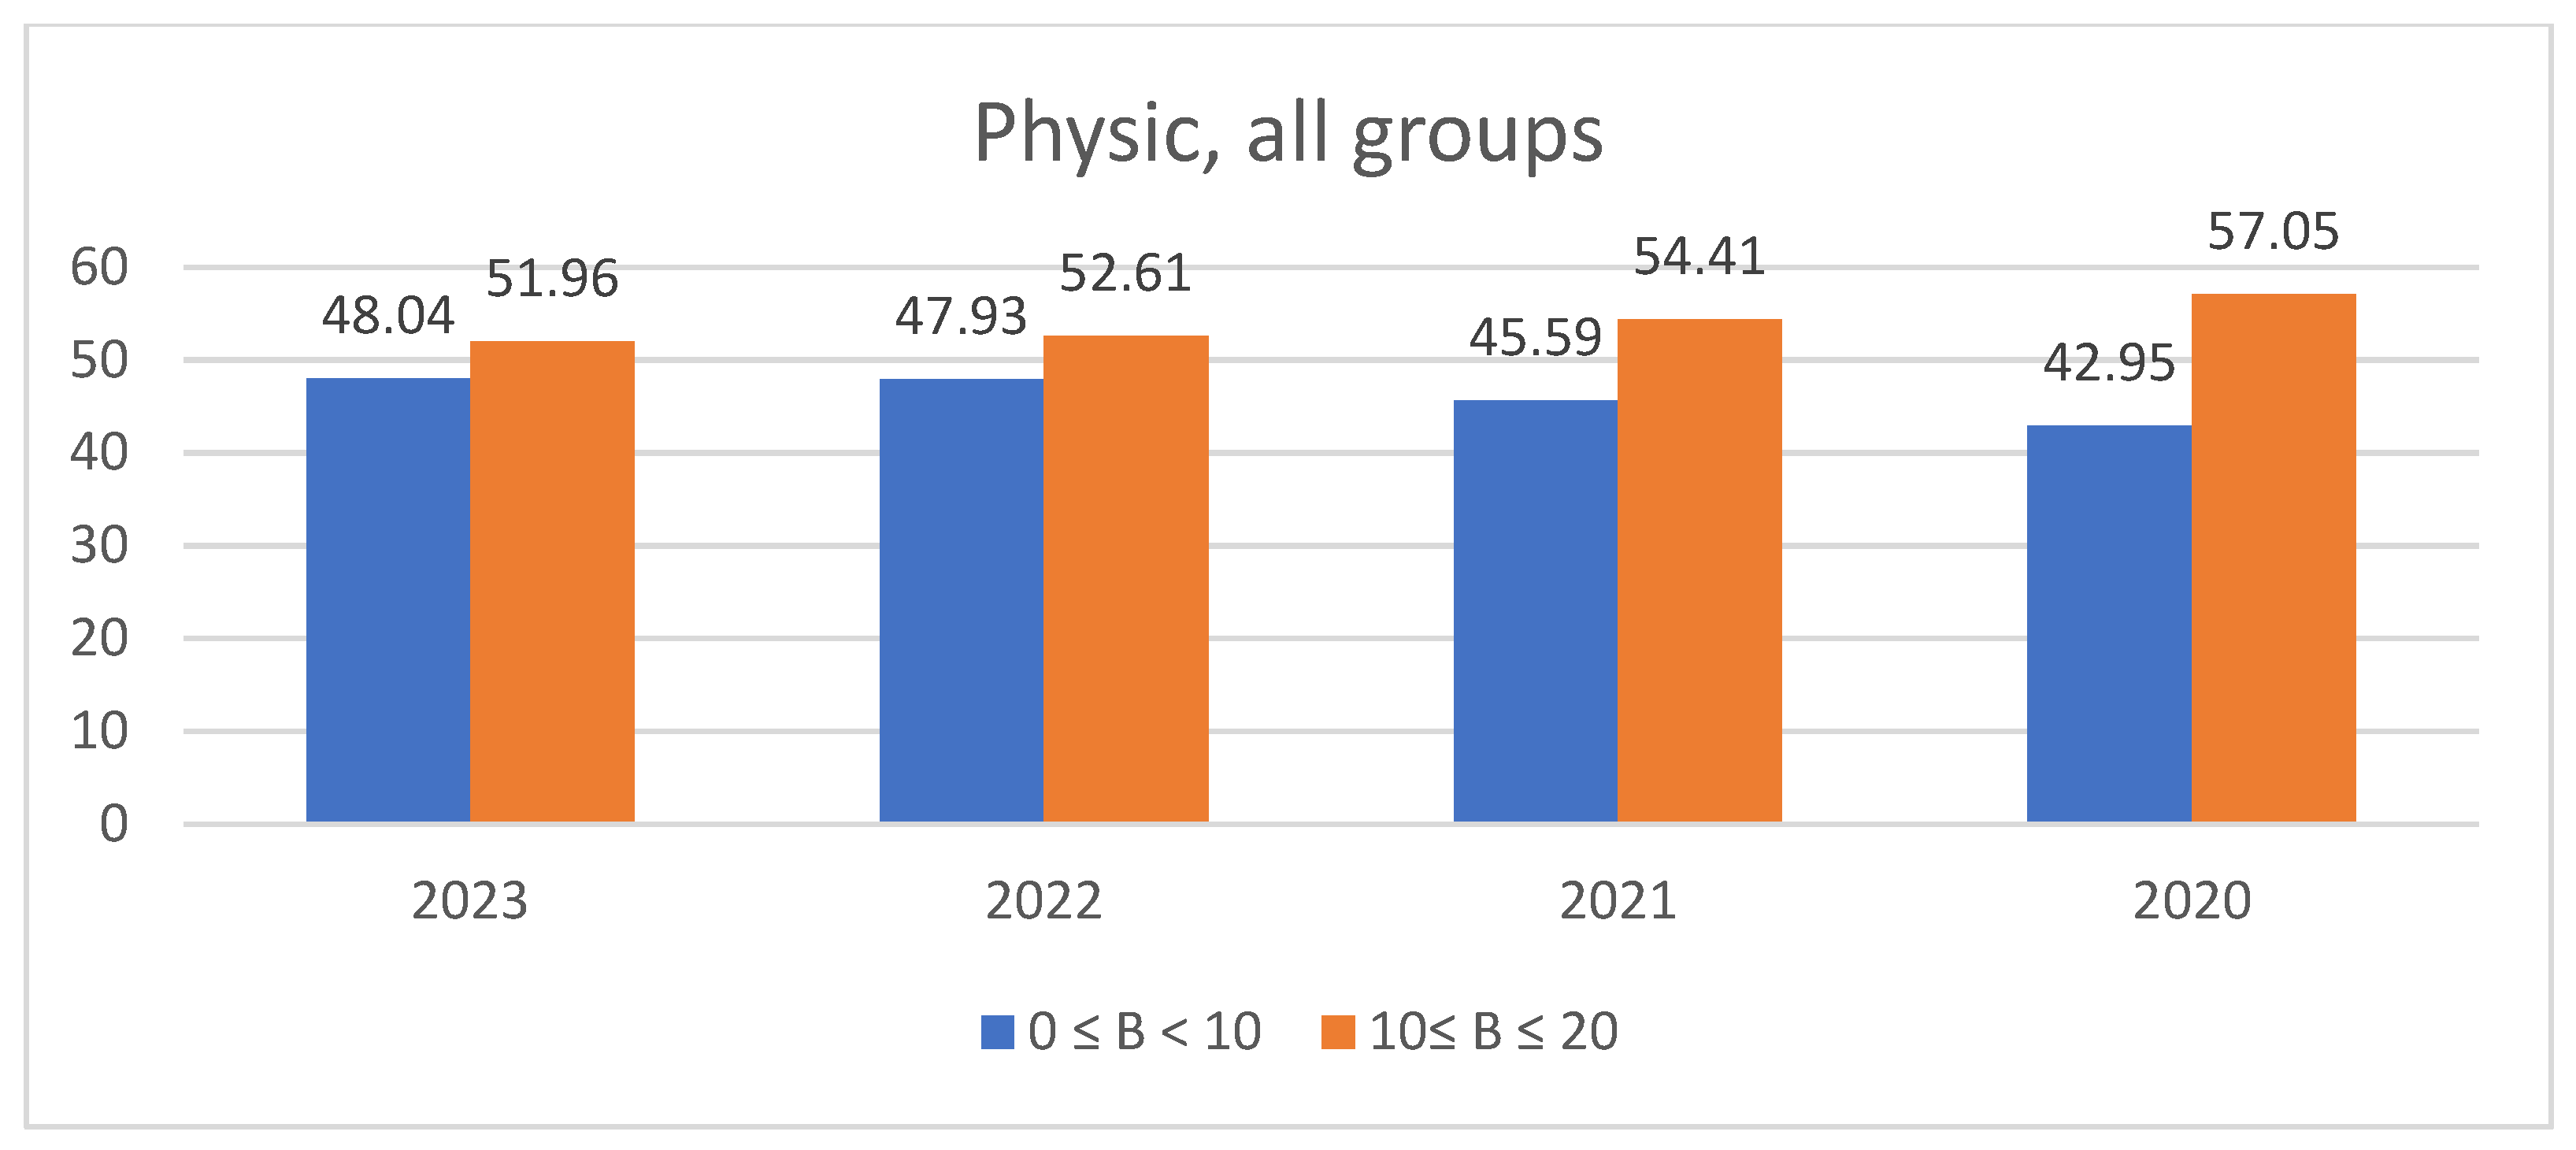
Figure 13.
This table has points from zero to twenty divided into the following ranges 0-5, 5-10 and then by one unit. In each margin is written the percentage of students who achieved the corresponding score. For Physics – Science Orientation [2,3,4,5,6,7,8,9,10,11,12,13].
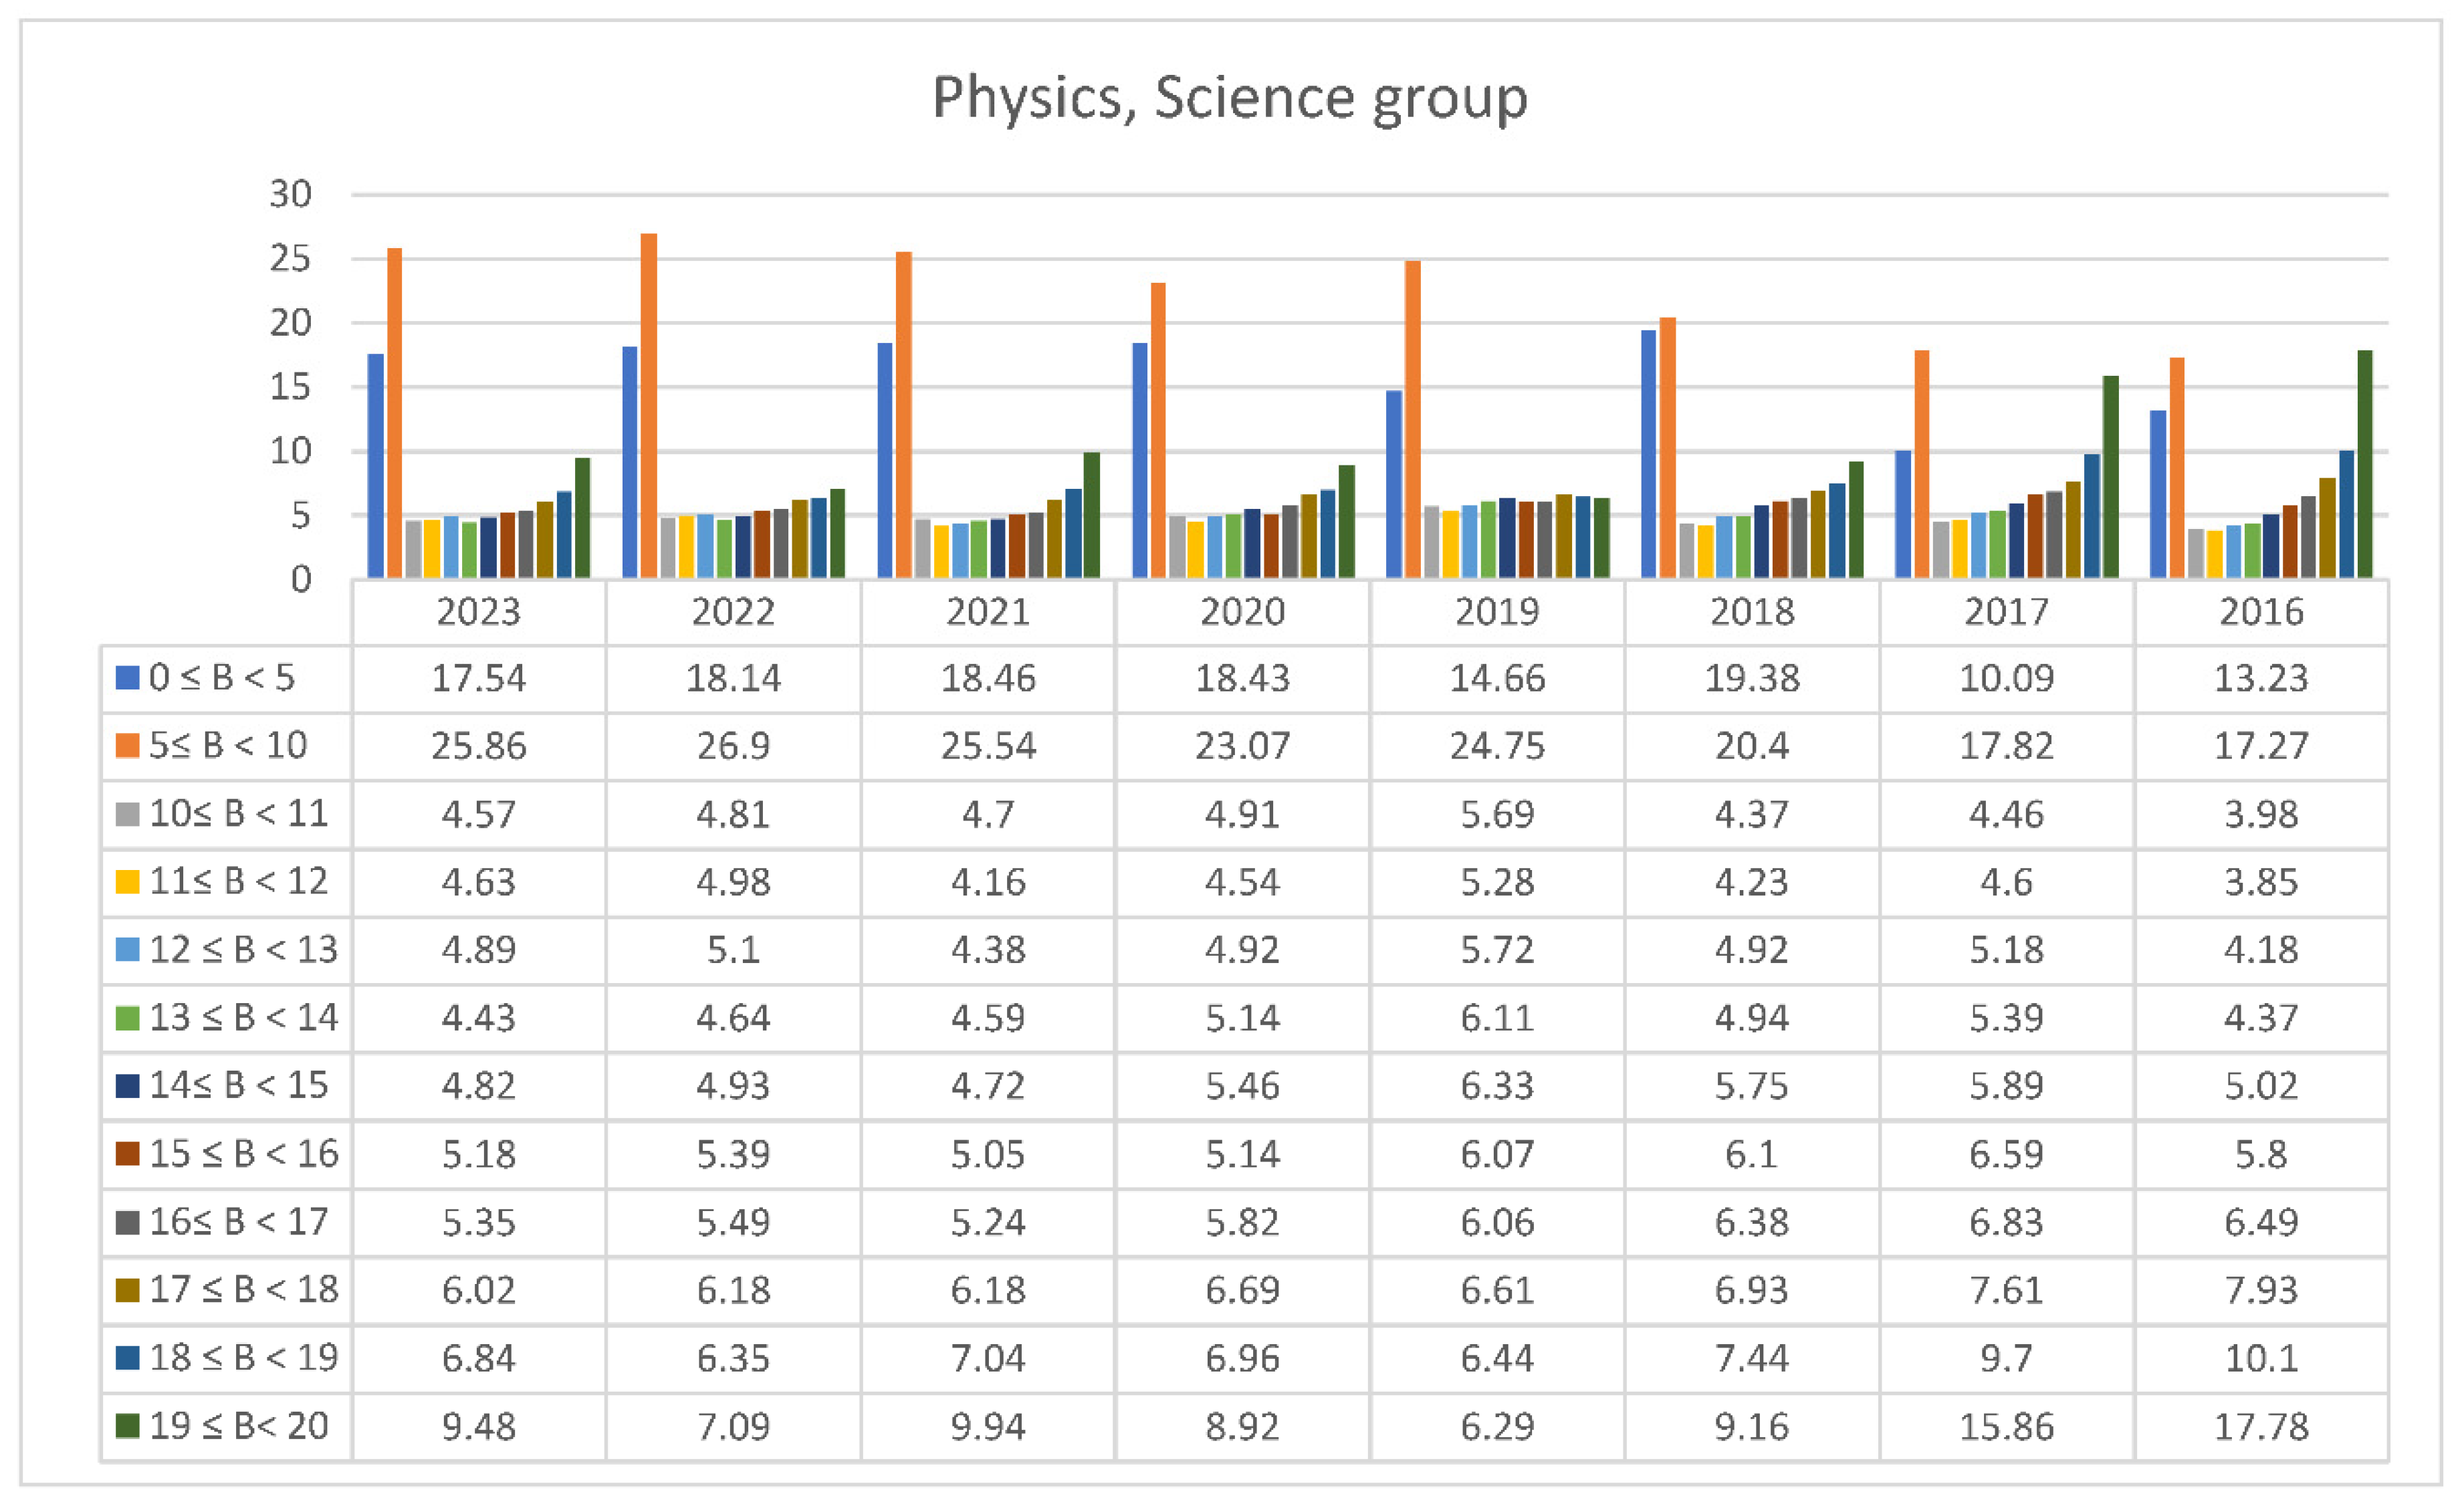
Figure 14.
This table has points from zero to twenty divided into the following ranges 0-5, 5-10 and then by one unit. In each margin is written the percentage of students who achieved the corresponding score. For Physics – Science Orientation [2,3,4,5,6,7,8,9,10,11,12,13].
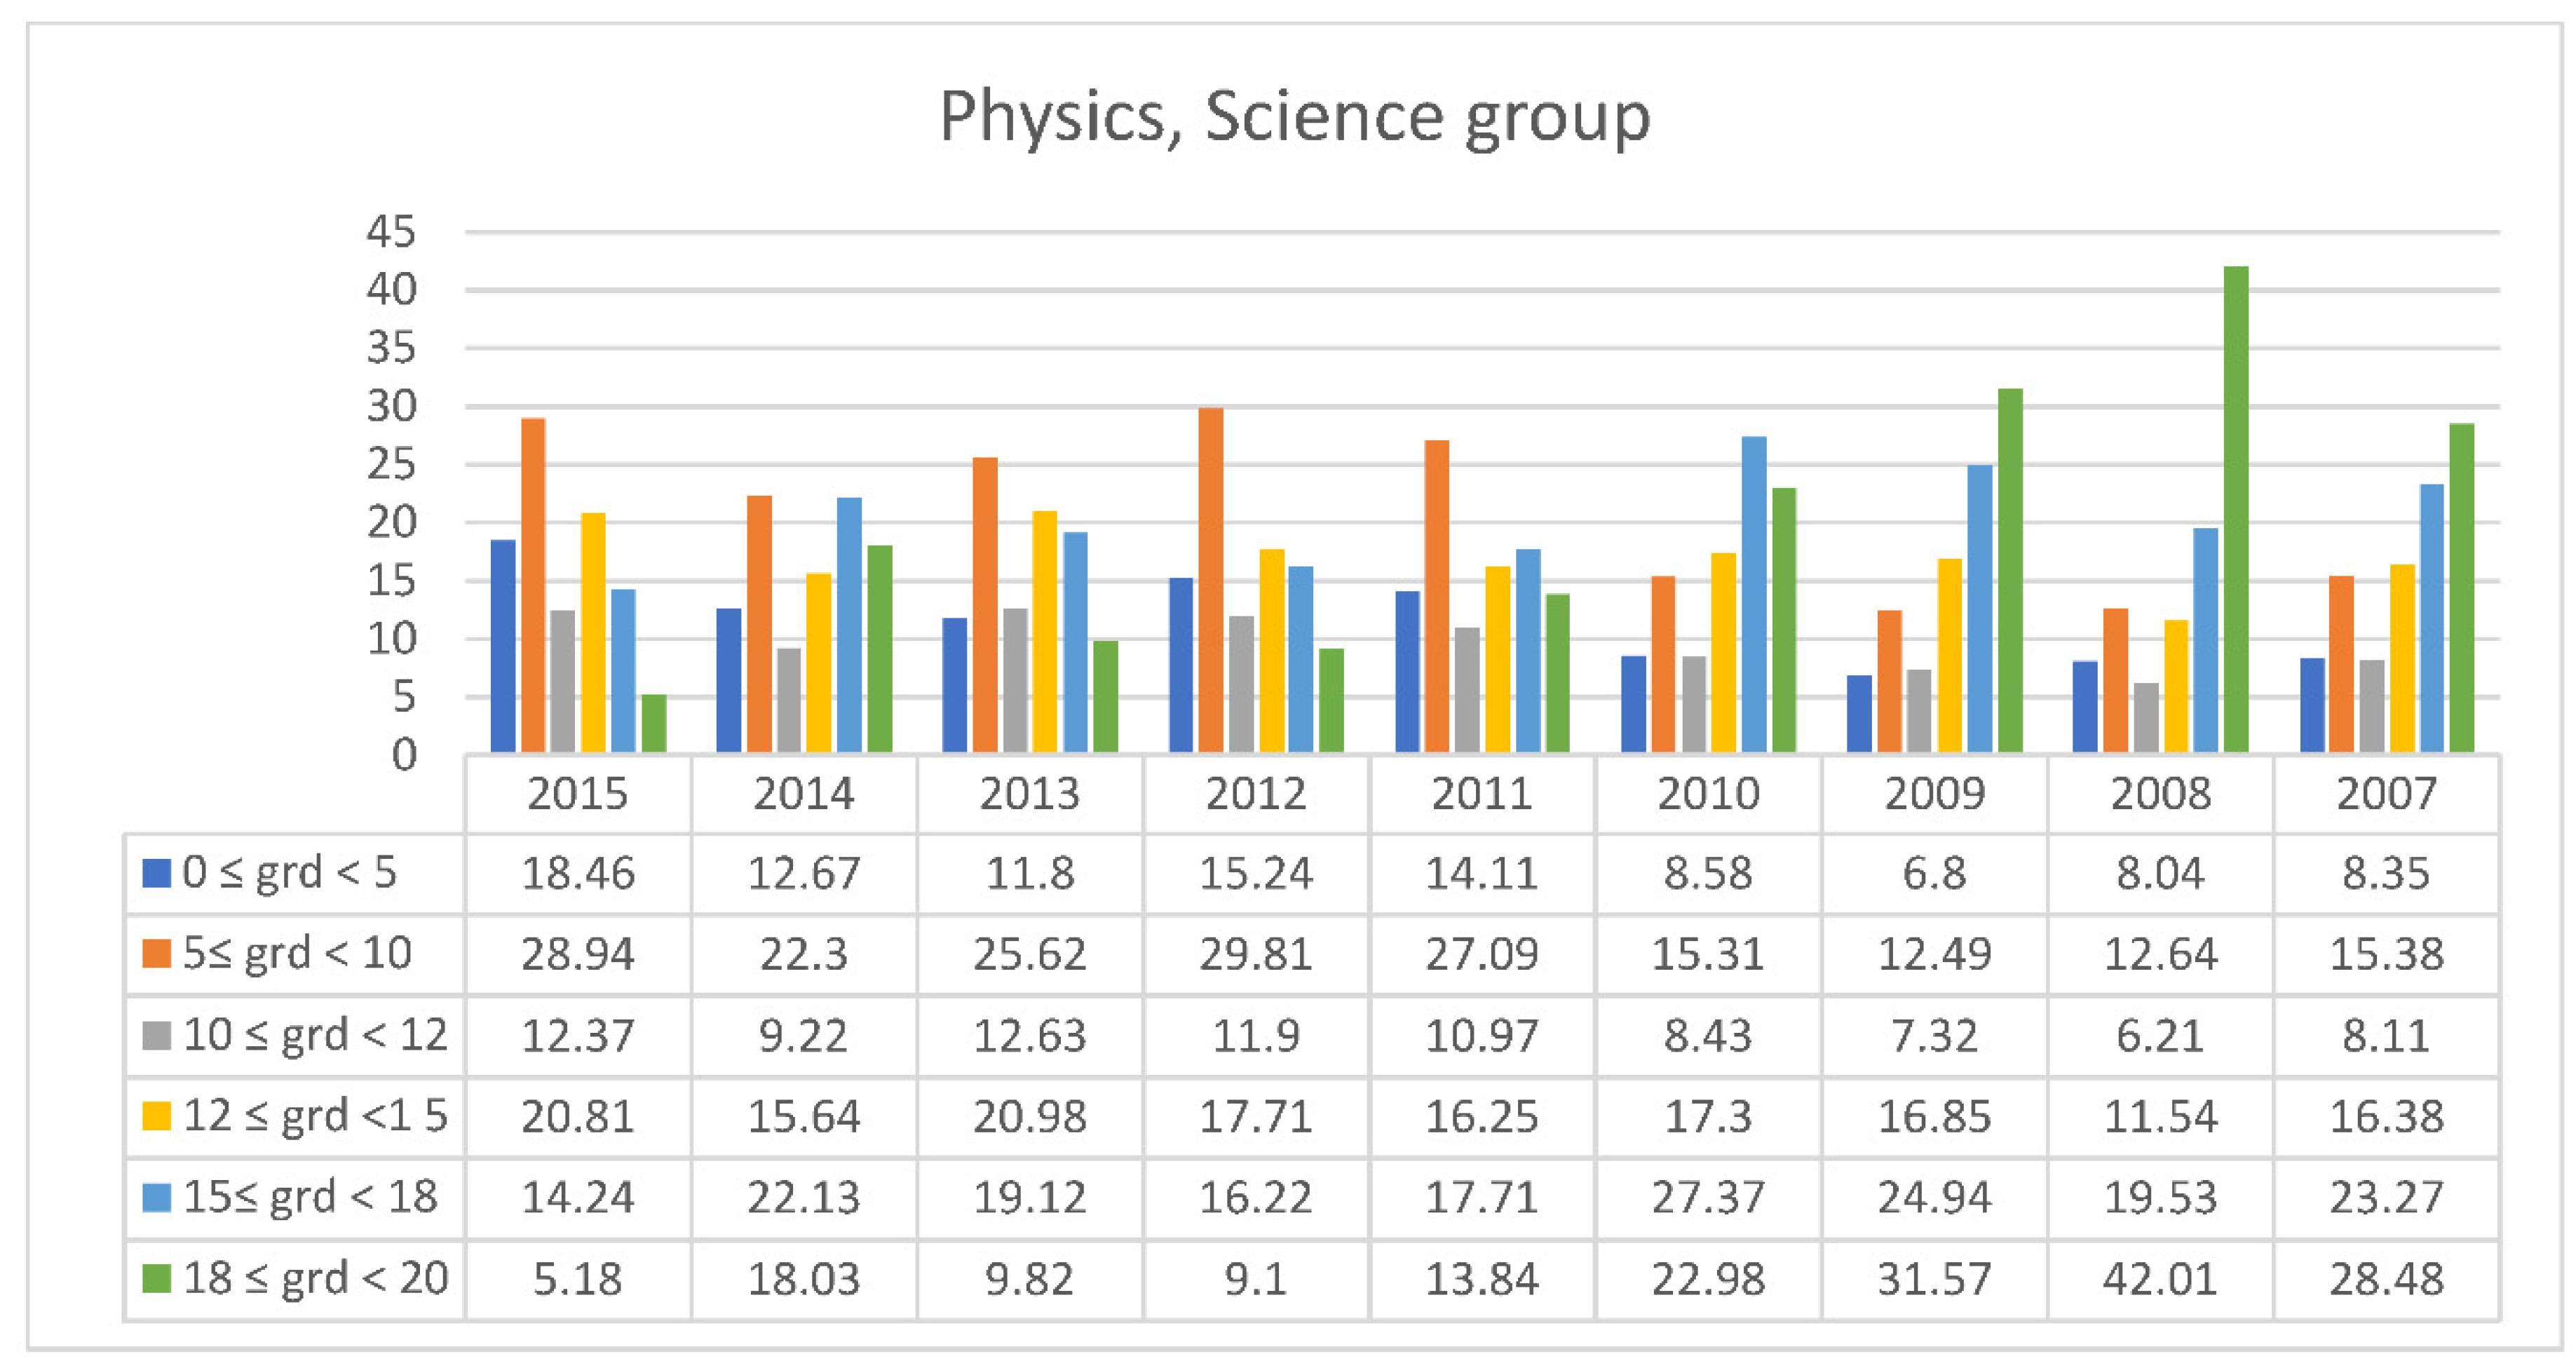
In the orientation group “Science”, amongst the students with above average grades, the highest percentage achieved grades above 15, as with Mathematics. The percentage of students who achieved the grade “Excellent”, that is above 18, is consistently above 13%. The year 2008 saw the highest percentage of “Excellent” grades - 42,01%. In the more recent years, the highest percentage has been 16,98% and was achieved in 2021.
The same goes for Physics in the Orientation group “Health Sciences”. The year 2021 saw the highest percentage of students scoring above 18, namely 18,39%. According to the table above, in 2023, the percentage of students attaining the grade “Excellent” surpassed 13,01%.
Figure 15.
This table has points from zero to twenty divided into the following ranges 0-5, 5-10 and then by one unit. In each margin is written the percentage of students who achieved the corresponding score. For Physics – Health Orientation [2,3,4,5,6,7,8,9,10,11,12,13].
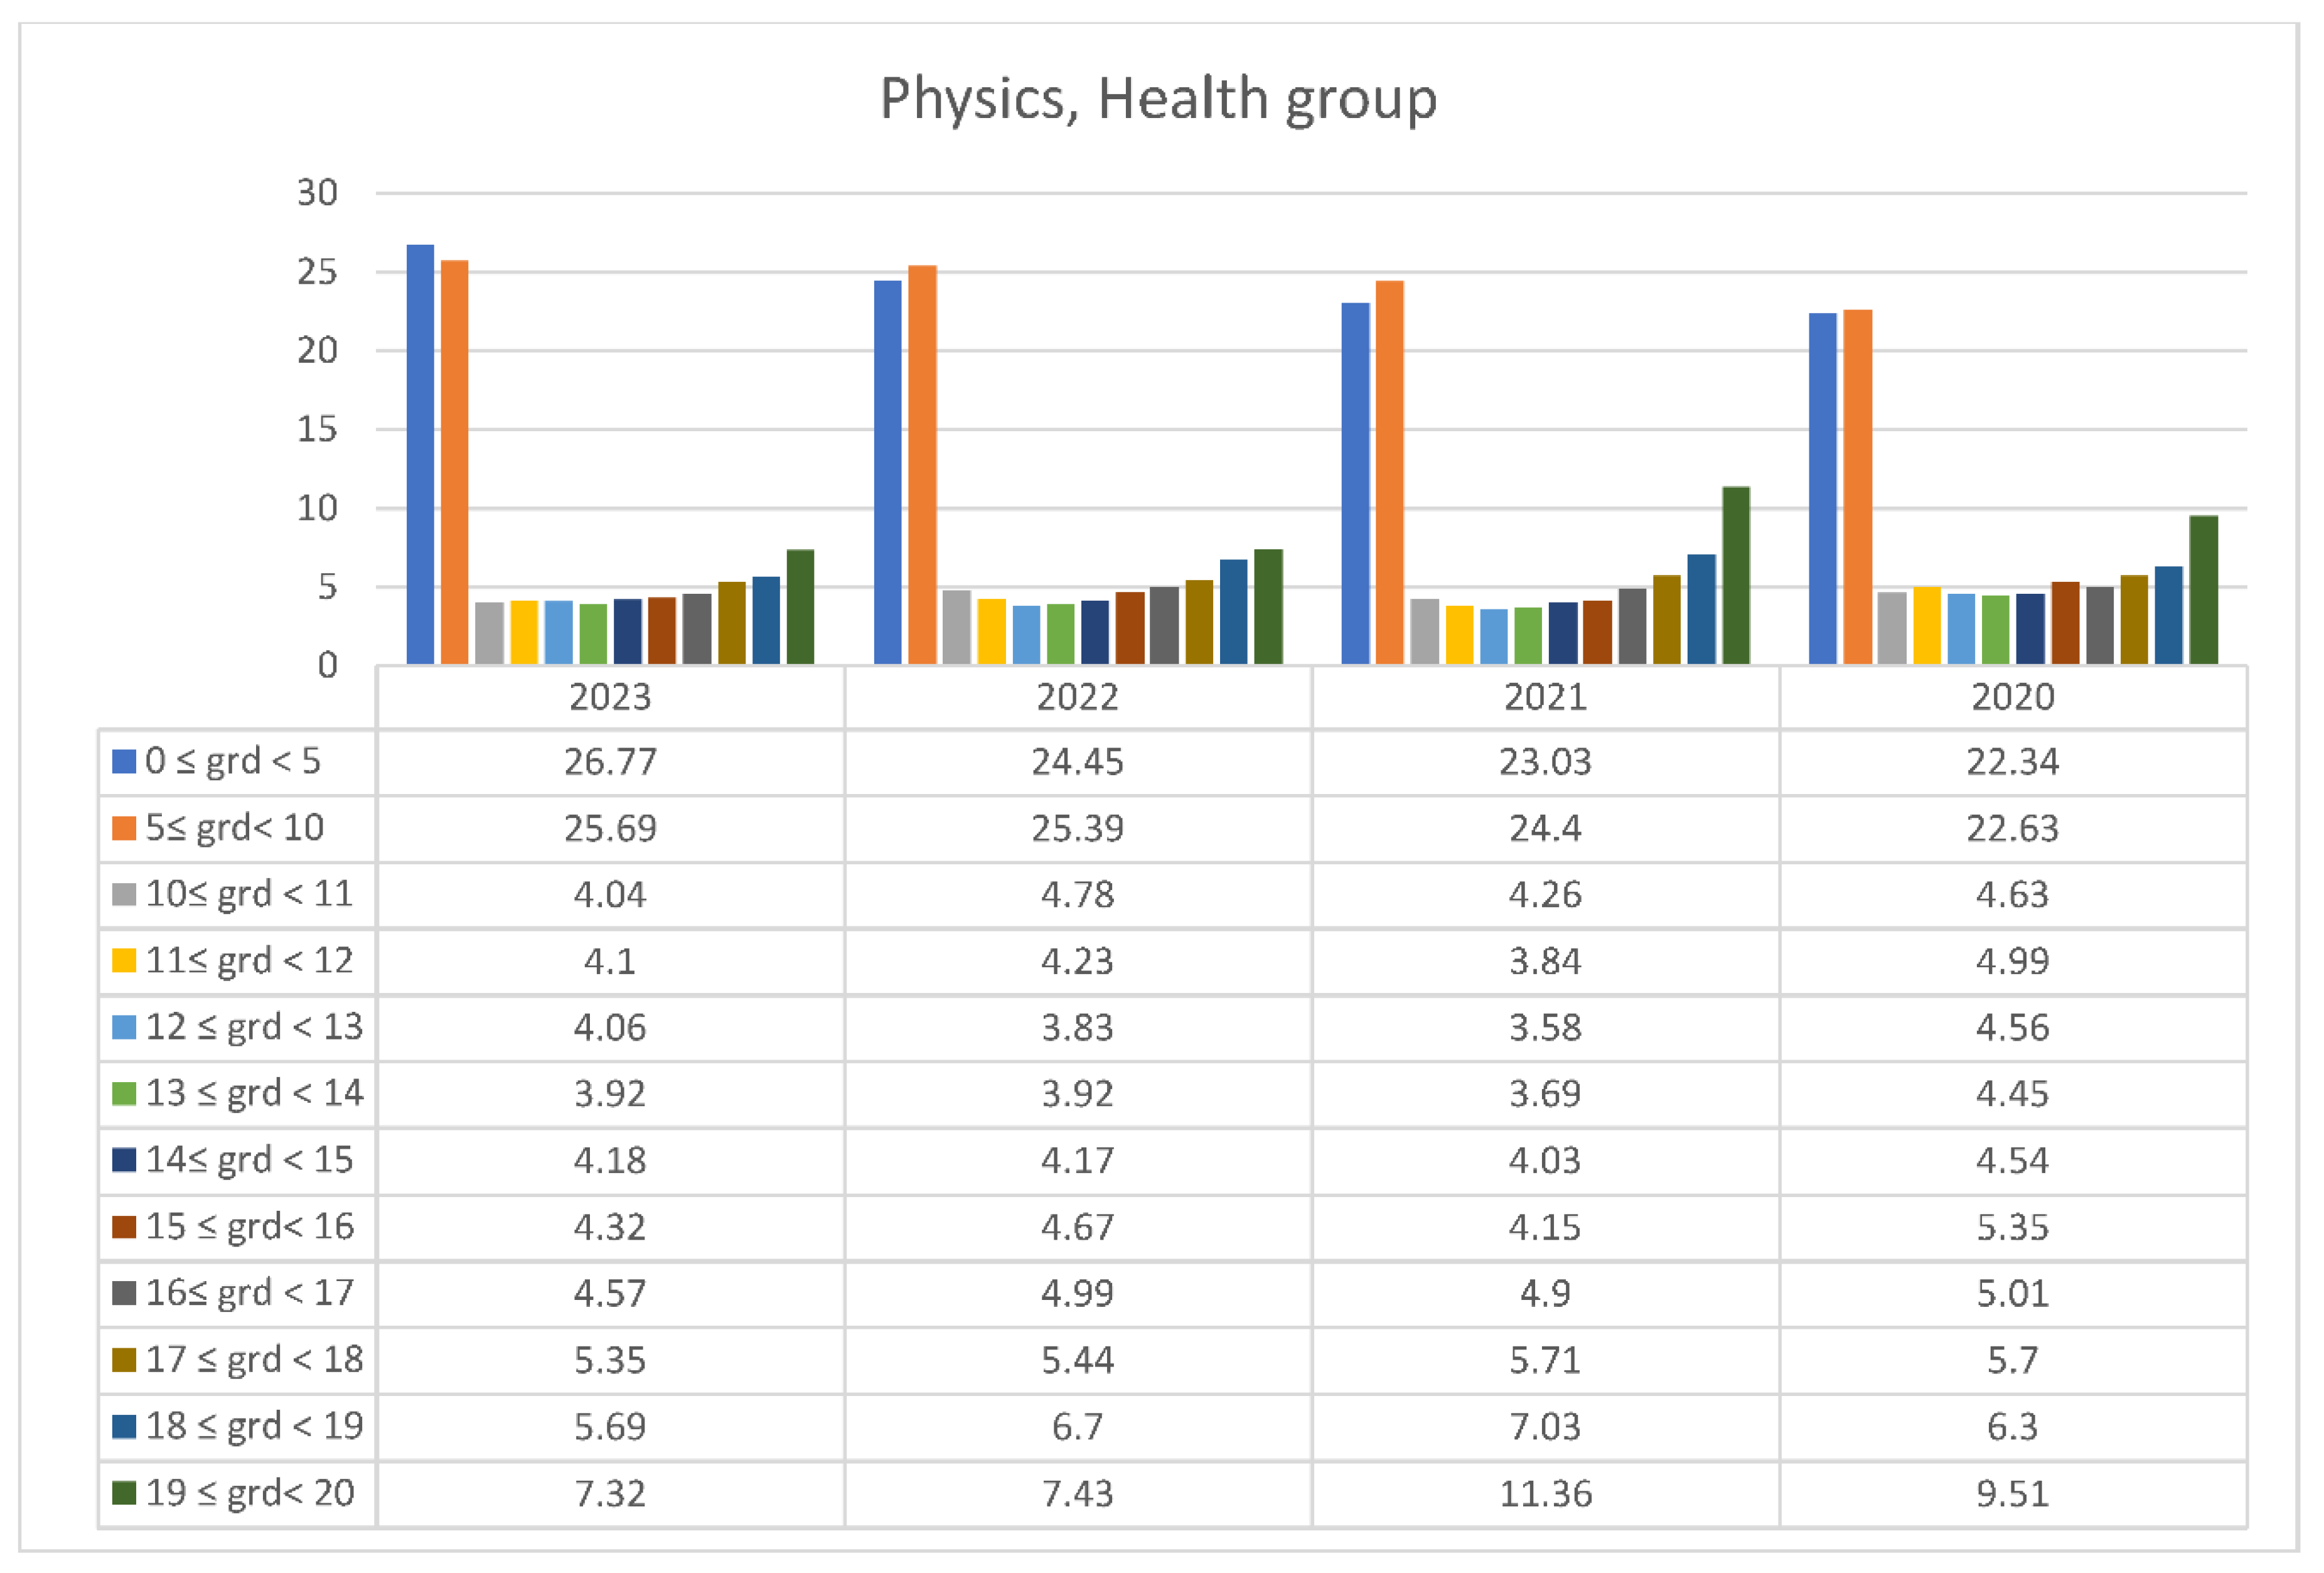
The same goes for Physics in the Orientation group “Health Sciences”. The year 2021 saw the highest percentage of students scoring above 18, namely 18,39%. According to the table above, in 2023, the percentage of students attaining the grade “Excellent” surpassed 13,01%.
Figure 16.
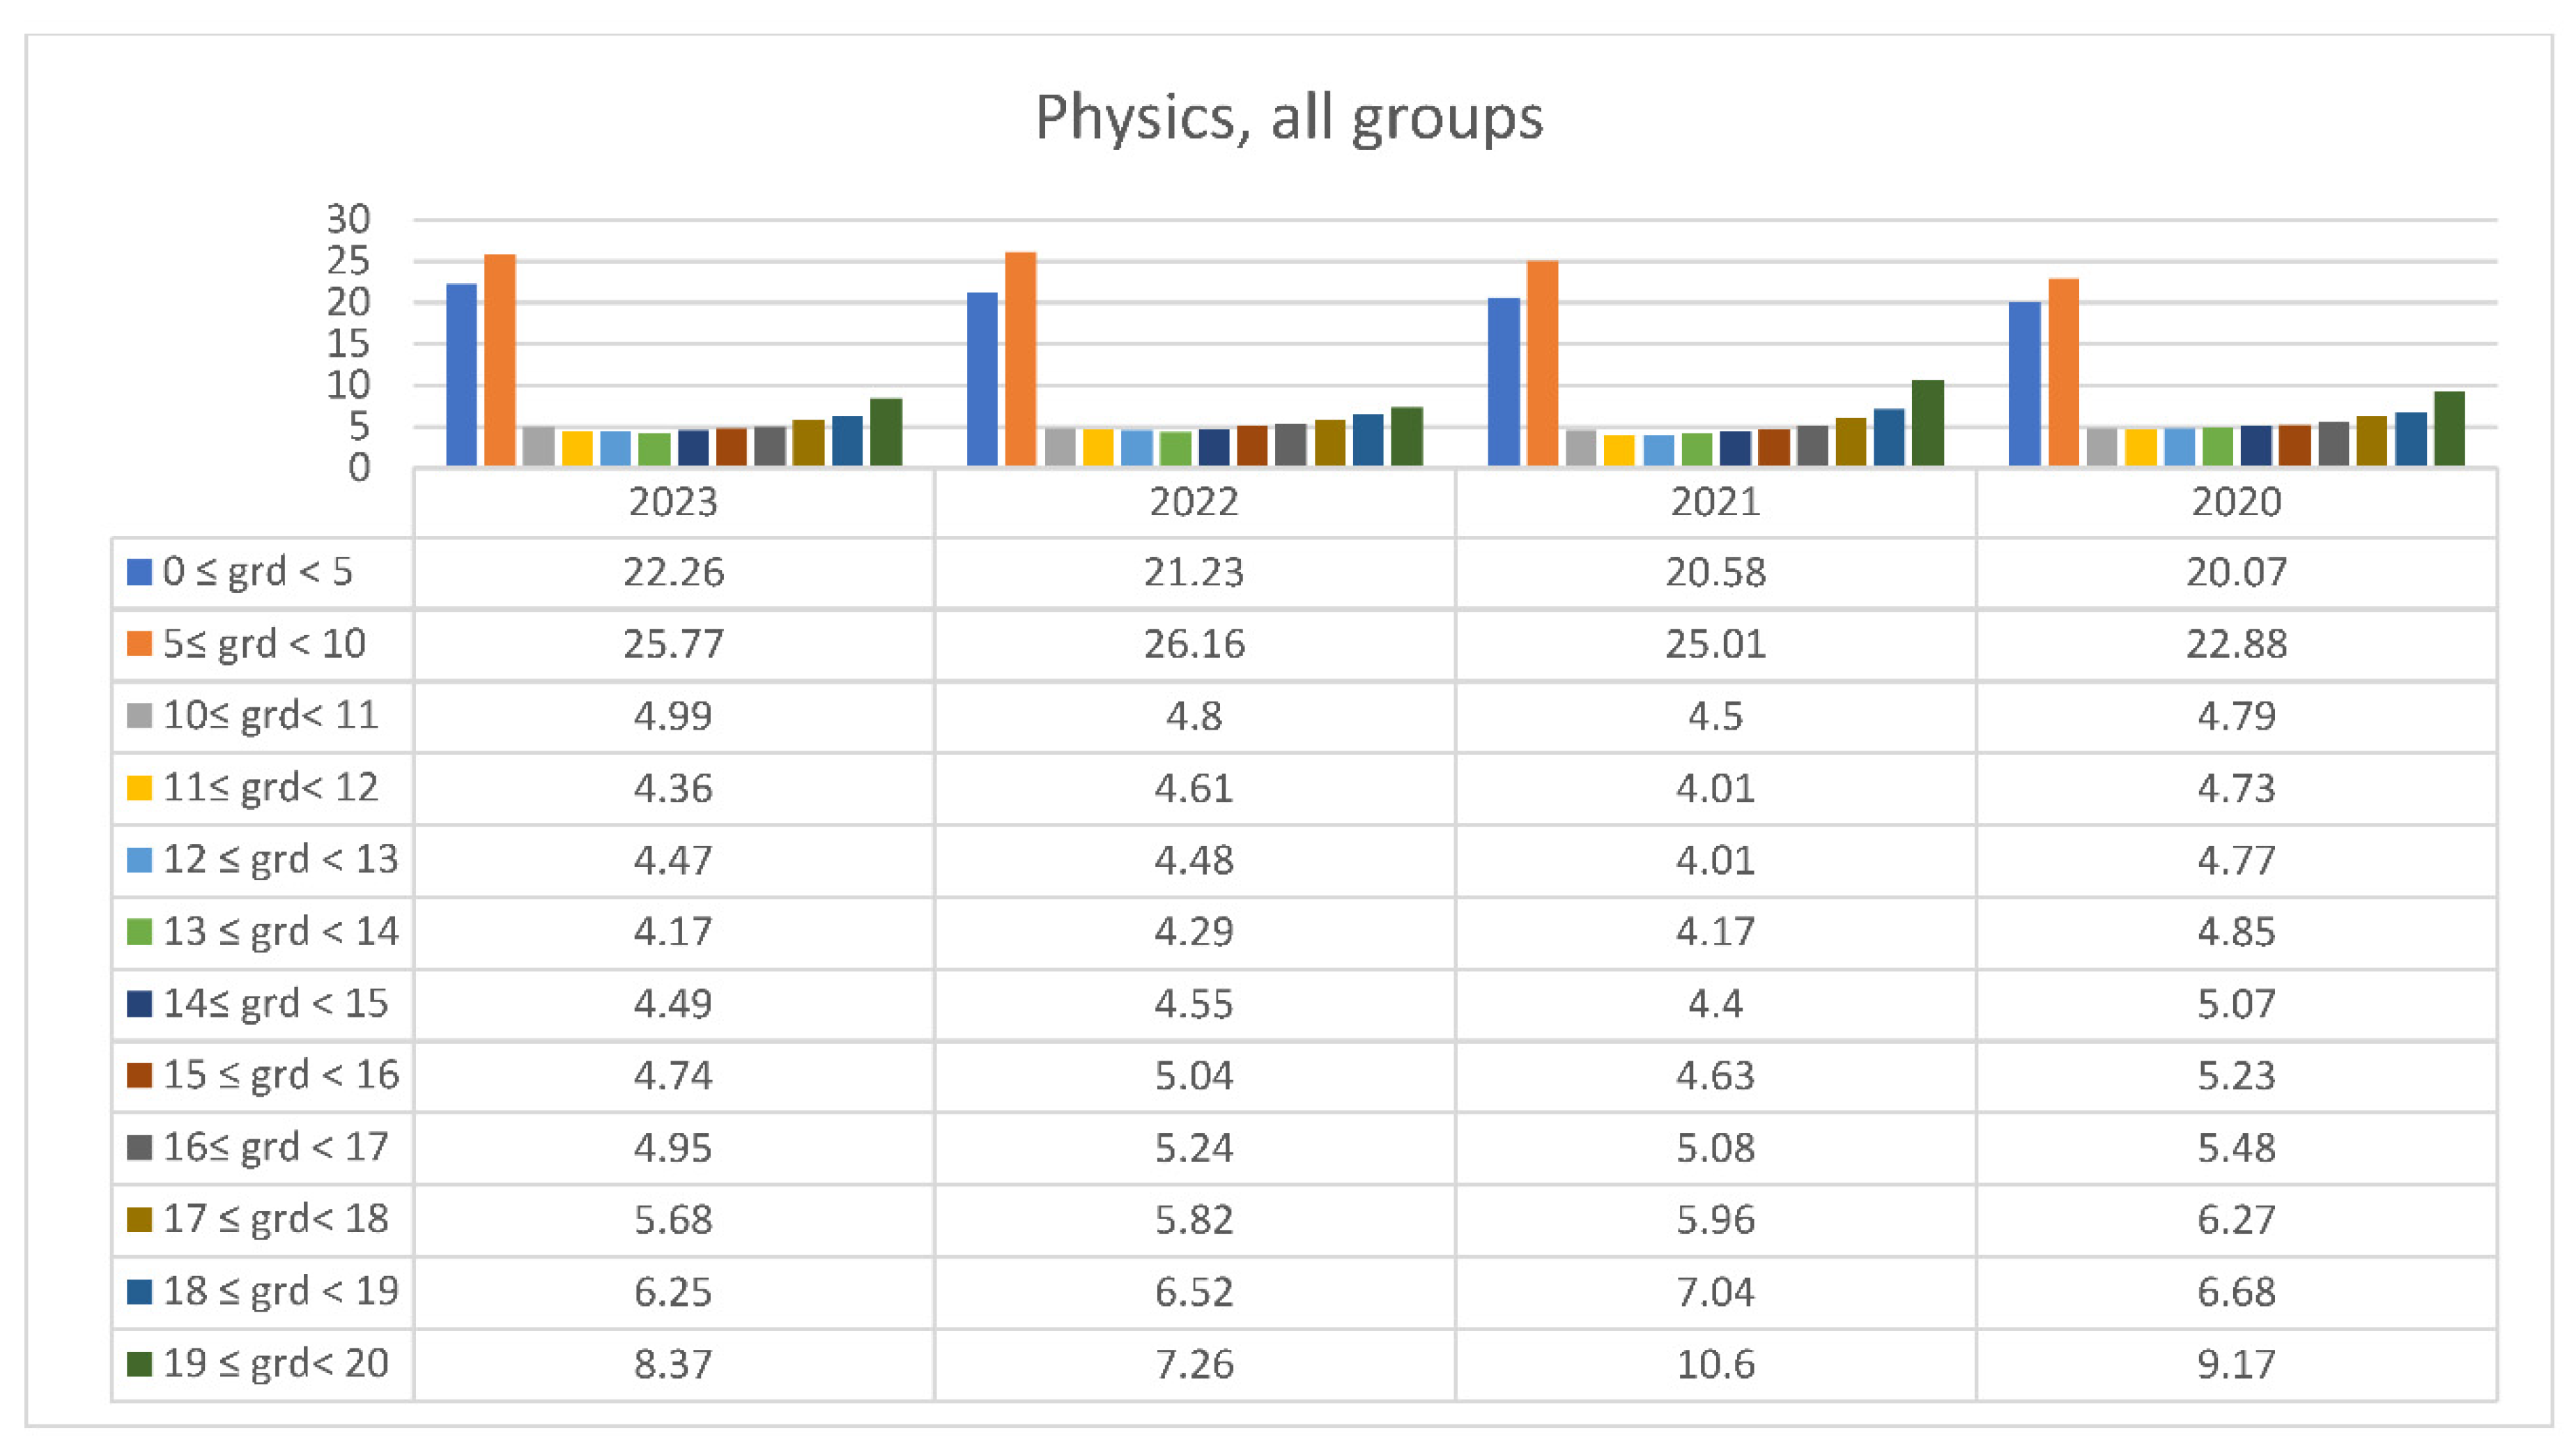
This table has points from zero to twenty divided into the following ranges 0-5, 5-10 and then by two unit. In each margin is written the percentage of students who achieved the corresponding score. For Physics – Technology Orientation [2,3,4,5,6,7,8,9,10,11,12,13].
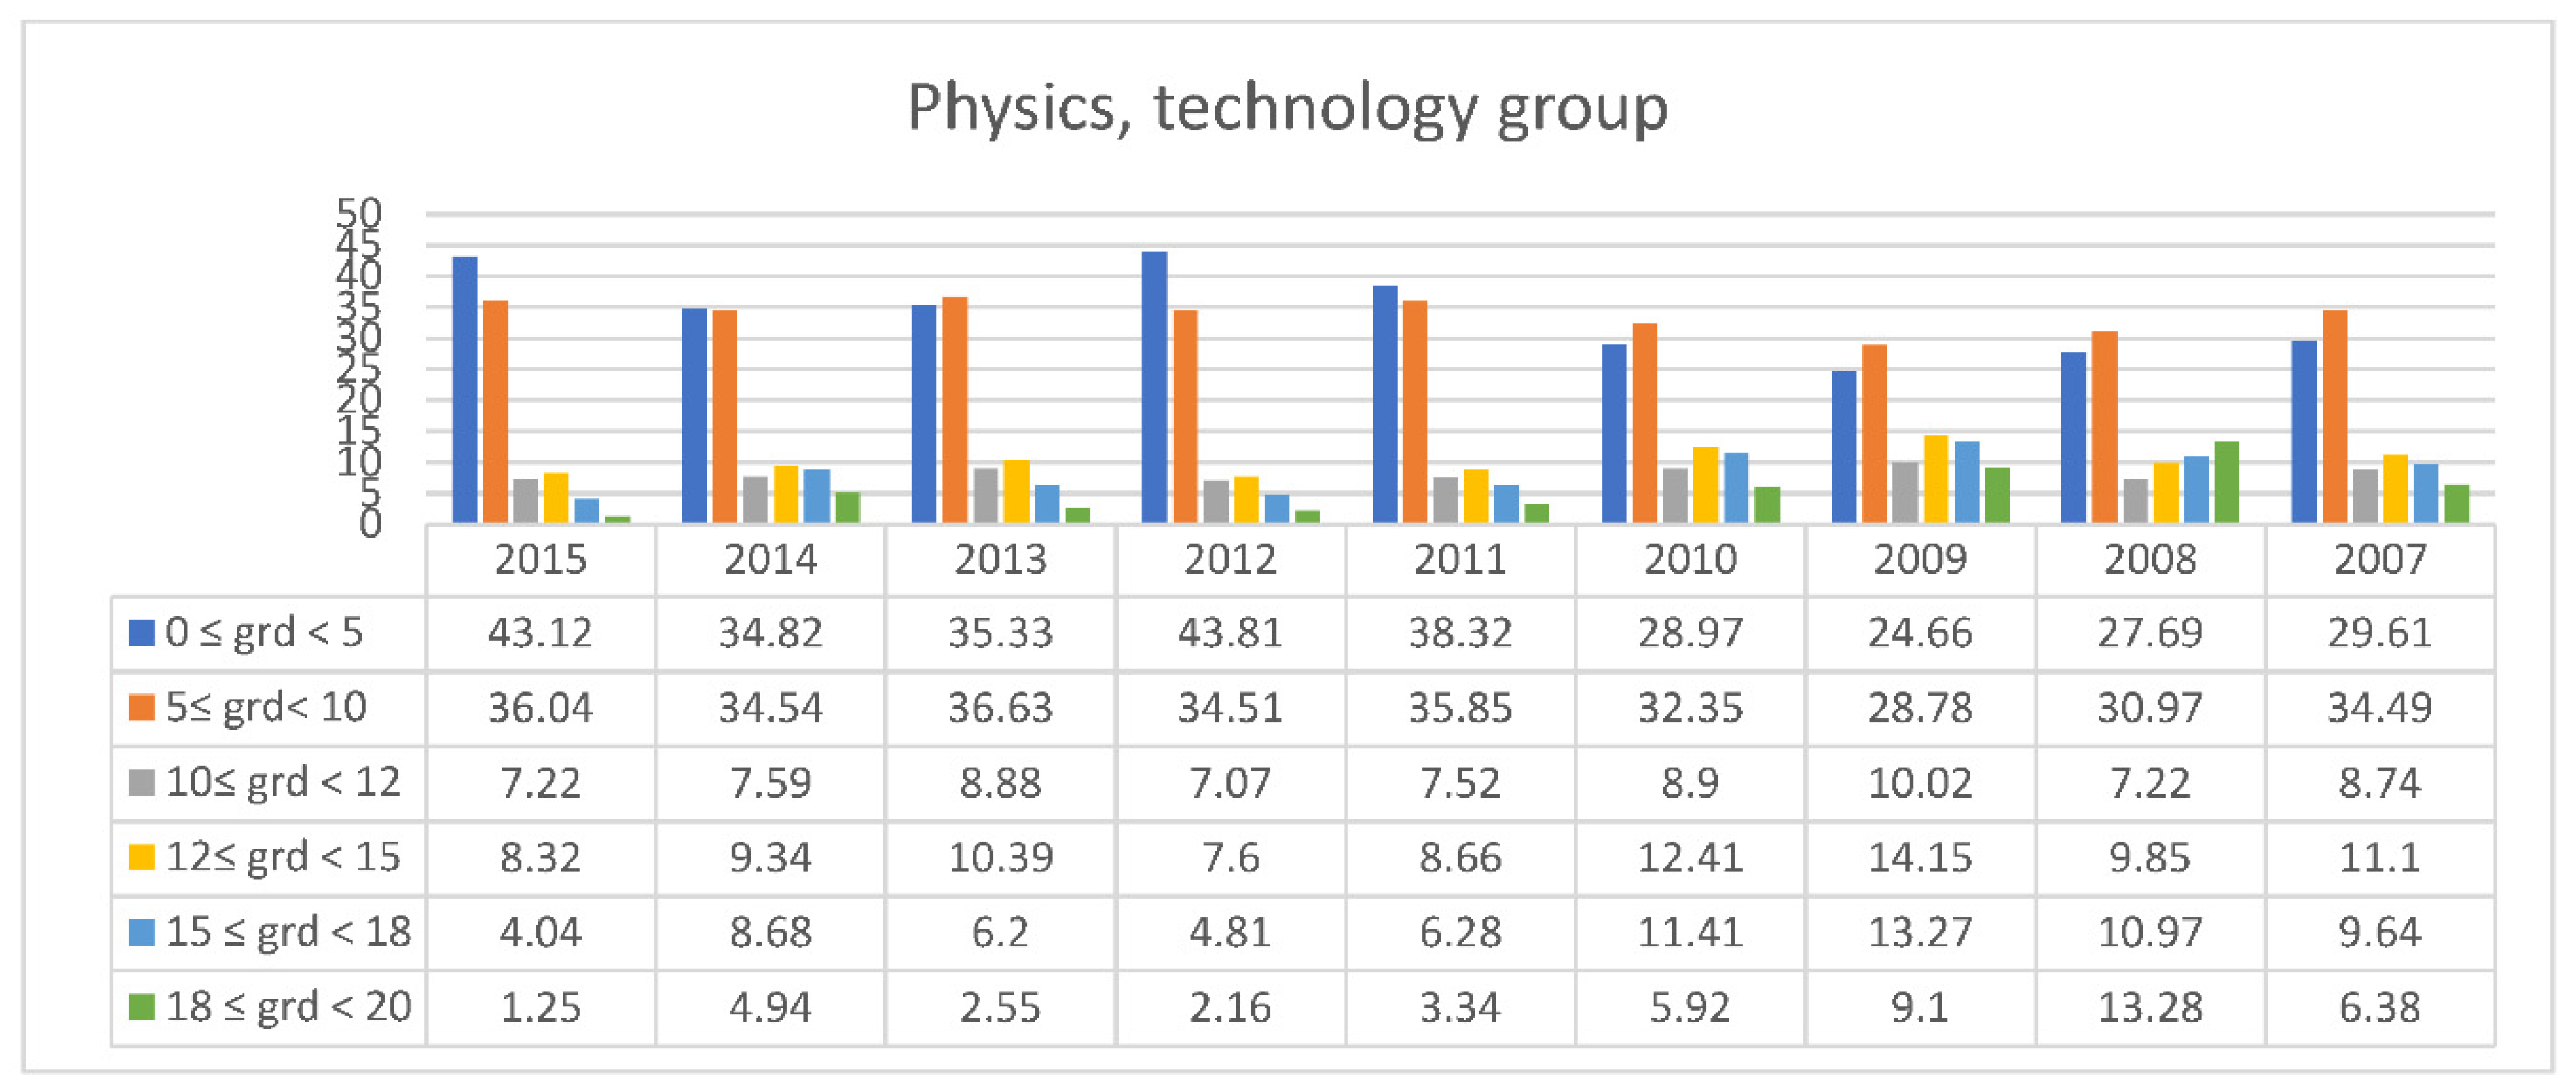
As with Mathematics, the performances of students from the orientation “Technology” in Physics are inferior. Not only are the percentages of students scoring below average grades higher, but also the percentages of students scoring above 18 are lower. The highest percentage is recorded in 2008 and goes up to 24,25%, whereas the lowest is recorded in 2015 and is only 5,29%.
Figure 17.
his table has points from zero to twenty divided into the following ranges 0-5, 5-10 and then by one unit. In each margin is written the percentage of students who achieved the corresponding score. For Physics – All Orientations [2,3,4,5,6,7,8,9,10,11,12,13].
Comparing students’ performances from all orientations in these subjects, we are not able to observe consistently better or worse performances in one or the other. However, were we to focus on the current exam system, in force since 2020, students perform worse in Physics than in Mathematics.
3.2. Students’ Performances at the National Exams in Greece per Discipline and per Question
In order to be able to evaluate the skills of the candidates at the panhellenic exams, we submitted a request to the Ministry of Education, Religious Affairs and Sports (file number 53149/Δ2/12-05-2023) for data regarding the number of students who obtained the grade “Excellent” in each of the exam questions at the disciplines relating to STEM education. Useful conclusions as to students’ STEM skills can be reached, taking into account the degree of difficulty of each question. According to the relevant legislation, the exam questions are conceived in such a way as to cover the largest possible part of the exam curriculum and to have increasing difficulty.
In Mathematics, the first question is theoretical; it concerns concepts, definitions, lemmata, statements, theorems, corollaries. The goal is to test the understanding of basic knowledge. The second question asks students to solve a problem by using algorithms, theorems, properties, and corollaries. For the third question, students need to apply combinatorial thinking and to synthesize. The fourth question requires the skills needed to solve the problem of the third question and additionally initiative and developing resolution strategies [14].
In Physics also there are four questions of increasing difficulty. The first one contains questions concerning theory. The second question tests again theoretical knowledge but mostly the students’ critical thinking skills and the skills acquired through experiments. As for the third question, it requires students to use combinatorial thinking and synthesize concepts, laws, formulas, and principles. For the fourth question, students need to apply combinatorial thinking and also to develop resolution strategies [14].

Table 1.
Orientation group Mathematics -statistics on students who achieved the grade “Exallent” per question.
Table 1.
Orientation group Mathematics -statistics on students who achieved the grade “Exallent” per question.
| Year | Total number of students | Question A (number of students) |
Question A (percentage) |
Question Β (number of students) |
Question Β (percentage) |
Question C (number of students) |
Question C (percentage) |
Question D (number of students) |
Question D (percentage) |
| 2023 | 39.859 | 5.213 | 13,08% | 2.945 | 7,39% | 1.567 | 3,93% | 588 | 1,47% |
| 2022 | 39.133 | 4.354 | 11,12% | 2.933 | 7,49% | 1.032 | 2,64% | 485 | 1,24% |
| 2021 | 38.850 | 5.014 | 12,91% | 1.719 | 4,42% | 2.701 | 6,95% | 349 | 0,9% |
| 2020 | 38.440 | 4.857 | 12,63% | 3.953 | 10,28% | 1.276 | 3,32% | 814 | 2,18% |
| 2019 | 45.552 | 2.294 | 5,03% | 4.128 | 9,06% | 1.820 | 3,4% | 720 | 1,58% |
Table 2.
Orientation group Physics -statistics on students who achieved the grade “Exallent” per question.
Table 2.
Orientation group Physics -statistics on students who achieved the grade “Exallent” per question.
| Year | Total number of students | Question A (number of students) |
Question A (percentage) |
Question Β (number of students) |
Question Β (percentage) |
Question C (number of students) |
Question C (percentage) |
Question D (number of students) |
Question D (percentage) |
| 2023 | 27.071 | 7.104 | 26,24% | 4.759 | 17,58% | 1.443 | 5,33% | 1.945 | 7,18% |
| 2022 | 27.774 | 5.551 | 19,98% | 4.037 | 14,54% | 3.340 | 12,02% | 767 | 2,76% |
| 2021 | 27.313 | 8.806 | 32,24% | 4.592 | 16,81% | 1.690 | 6,19% | 1.832 | 6,71% |
| 2020 | 26.103 | 4.634 | 17,75% | 3.867 | 14,81% | 1.712 | 36,94% | 1.763 | 6,75% |
| 2019 | 30.410 | 6.963 | 22,9% | 2.819 | 9,27% | 3.910 | 12,86% | 855 | 2,81% |
The above analysis shows that the panhellenic exam allowing access to higher education assesses some of the 21st century skills, such as critical and combinatory thinking – two of the most fundamental skills required to conquer higher level skills. The results of this exam are, unfortunately, not encouraging. In all the exam subjects, more than half of the students were unable to successfully tackle all the questions.
4. Discussion
It is clear that the small number of students who achieve high performance in STEM subjects and the correspondingly high percentage of students who do not exceed the baseline are remarkable. The students themselves choose the orientation group in which they will study and therefore the subjects in which they will be tested. This demonstrates their own desire and therefore their belief that they can achieve better results in these subjects. On the other hand, the ever-increasing demand for STEM professionals worldwide underlines the need to support these disciplines so that there will be a greater number of professionals in the future [15], which will cover the shortage of workers recorded in these disciplines [16,17].
Better performance is linked to the acquisition of interest in the subjects concerned [18,19], social and emotional skills [20], but also to the pedagogical methods used. Motivation [15,21,22], cognitive factors [15] and interest in science [19,21] play a leading role in strengthening students' desire to engage with STEM subjects and their subsequent careers [15]. In particular, interest in acquiring knowledge is what can activate students, as they learn for their own enjoyment rather than because they are forced to [23].
An analysis of the results of the PISA 2015 survey shows the link between interest in science and medium and high performance in the survey [18]. Meanwhile, the acquisition of scientific skills and interest in science led to students in the last year of secondary education in Indonesia being able to solve problems of high difficulty [19]. At this point, there is an alignment with the objectives of the national examinations.
School is the environment that can provide the appropriate emotional and social conditions for students to achieve higher performance [24]. With regard to the acquisition of interest by students, carrying out experiments in science laboratories has positive results [25,26]. Access to laboratory resources is associated with students' active participation, but also with their positive attitudes towards science [25]. Effective science education from primary school can have positive results in effective science education throughout students' school careers [27,28]. In addition, implementing STEM education from the primary school stage can have a positive effect [28,29], both in terms of increasing students' interest and better understanding of science and engineering in both fields [29]. It is clear that if we are to find ways of improving students' performance at the end of their school careers, interventions need to start in the early years of schooling [27].
Students' interest in STEM subjects is also influenced by informal learning, i.e. activities in which students engage in their free time outside school. Students' engagement with mathematics and science outside the formal curriculum appears to have a positive impact on their attitudes towards these subjects and on their performance [30]. This engagement is also associated with higher science scores in PISA 2015 [18].
Teachers, for their part, can contribute to increasing students' interest [15,27] by creating an accessible climate for students during mathematics and science lessons, by encouraging all kinds of learning activities [15], and by increasing students' involvement in the whole process [25]. As each student has a different learning preference (visual, auditory, kinaesthetic), which plays an important role in achieving educational goals, secondary school teachers should use different methods when teaching science so that all learning preferences are covered [21]. The teacher, in the role of a guide, allows the students to explore and thus gain a deeper understanding of the subject under study [31].
Improving student performance can also be achieved by developing 21st century skills such as collaboration [32] and leadership [33].
Artificial intelligence and data analytics have been applied to STEAM courses and have been shown to increase interest and change students' initial attitudes towards science and mathematics for the better [34].
New technologies, including TikTok videos, can contribute to a deeper understanding of even abstract concepts in science, starting with primary school students [28]. In particular, the TikTok platform allows for interaction during the transfer of knowledge from teacher to student, but also contributes to the development of critical thinking, creativity and problem-solving skills, while increasing the level of understanding of the presented topic and stimulating students' interest [28]. In general, the use of technological resources that use images [27], resources such as PPT, You Tube videos, quizzes [23] and laboratory resources, increase students' interest, active participation [23,25,27], their level of attention to what their teacher is saying and positive feelings towards the lesson [23].
Learner-centred models of learning, such as constructivists, which explain the way in which a person learns [35,36] or understands [36], seem to contribute to the development of the skills required for the 21st century [37]. On the other hand, pedagogical methods such as problem-based learning (PBL) show positive results in science teaching, as knowledge is developed through the analysis and solution of a problem, which requires the direct involvement of the students and thus stimulates their interest [31]. Another method that can help improve student performance is cooperative learning [38,39]. Other constructivist methods include inquiry-based learning [40], project-based learning [37] and design thinking [41].
The education system is at the centre of supporting student performance as it supports the development of learners' knowledge, skills and attitudes [19]. Good science performance in PISA 2015 is also associated with schools that have adequate equipment, high levels of educational leadership, lower pupil-teacher ratios and higher numbers of science teachers [18].
5. Conclusions
It is clear that the performance of Greek students in Panhellenic examinations is consistently low. Given the need for professionals in STEM fields, which is expected to increase globally, improving student performance in these subjects is a challenge.
Improving academic performance is a multifaceted issue that requires a combination of measures to achieve. At the center is the curriculum, which needs to focus on the issue so that teachers, in turn, use the appropriate pedagogical methods and contribute in this direction.
Specifically for science courses, contact with the laboratory, teaching from an early age, the use of new technologies, the choice of student-centred teaching methods, the creation of an appropriate classroom environment, the involvement of students in science in extracurricular activities, the reduction of the student-teacher ratio and more hours of science teaching can contribute in this direction.
Future research could link students' performance in national examinations with their study time during the year, with their attitudes towards the subjects examined and with their views on their studies in higher education.
References
- Tytler, R.; Aderson, J.; Li, Y. STEM Education for the Twenty-First Century. Integr. Approaches STEM Educ. 2020, 21–43. [Google Scholar]
- minedu.gov.gr. 2012. [Online]. Available: https://www.minedu.gov.gr/themata-eksetaseon/82-anakoinwseis-eksetasewn/5146-25-06-12-statistika-grapton-bathmologion-panelladikon-eksetaseon-genikoy-lykeioy-kai-genikoy-bathmoy-prosbasis-2012.
- minedu.gov.gr. 2013. [Online]. Available: https://www.minedu.gov.gr/themata-eksetaseon/82-anakoinwseis-eksetasewn/9837-25-06-13-2013.
- minedu.gov.gr. 2014. [Online]. Available: https://www.minedu.gov.gr/anazitisi-archive/statistika-stoixeia-panelladikwn.
- minedu.gov.gr. 2015. [Online]. Available: https://www.minedu.gov.gr/epal-m/anakoinwseis-epala/17766-23-06-15-2016.
- minedu.gov.gr. 2016. [Online]. Available: https://www.minedu.gov.gr/epal-m/anakoinwseis-epala/21650-16-06-16-statistika-stoixeia-panelladikon-2018.
- "Ministry of Education and Religious Affairs. 03 07 2017. [Online]. Available: https://www.minedu.gov.gr/epal-m/anakoinwseis-epala/29112-03-07-17-statistika-stoixeia-ton-vathmologion-ton-panelladikon-eksetaseon-2017-minyma-tou-ypourgoy-paideias-erevnas-kai-thriskevmaton-3.
- Ministry of Education and Religious Affairs. 29 06 2018. [Online]. Available: https://www.minedu.gov.gr/ypapegan/anakoinoseis/35675-29-06-18-anakoinosi-statistikon-stoixeion-gia-tis-vathmologikes-epidoseis-gel-kai-epal-2020.
- Ministry of Education and Religious Affairs. 28 06 2019. [Online]. Available: https://www.minedu.gov.gr/news/42071-28-06-19-anakoinosi-statistikon-stoixeion-gia-tis-vathmologikes-epidoseis-gel-kai-epal-2020.
- www.minedu.gov.gr. Jun 2020. [Online]. Available: https://www.minedu.gov.gr/news/45726-10-07-20-anakoinosi-vathmologion-panelladikon-eksetaseon-gel-kai-epal-2020. [Accessed Jul 2024].
- www.minedu.gov.gr. Jun 2021. [Online]. Available: https://www.minedu.gov.gr/news/49404-09-07-21-anakoinosi-vathmologion-panelladikon-eksetaseon-gel-kai-epal-2021. [Accessed Jul 2024].
- www.monedu.gov.gr. Jun 2022. [Online]. Available: https://www.minedu.gov.gr/news/52639-28-06-22-anakoinosi-vathmologion-panelladikon-eksetaseon-gel-kai-epal-2022. [Accessed Jul 2024].
- www.minedu.gov.gr. Jun 2023. [Online]. Available: https://www.minedu.gov.gr/news/55832-29-06-23-anakoinosi-vathmologion-panelladikon-eksetaseon-gel-kai-epal-2023. [Accessed Jul 2024].
- Φ.Ε.Κ., ʺΤεύχος Β'5136/03.10.2022".
- Amalina, I.; VidÃ, T.; Karimova, K. Factors influencing student interest in STEM careers: motivational, cognitive, and socioeconomic status. Humanities and Social Sciences Communications 2025, 12. [Google Scholar] [CrossRef]
- J. Calabrese, D. Jr, H. Cordner and N. Songer. Do students recognize design features that promote interest in science and engineering? Interdisciplinary Journal of Environmental and Science Education 2025, 1, 21.
- McDonald, C.V. STEM Education: A Review of the Contribution of the Disciplines of Science, Technology, Engineering and Mathematics. Science Education International 2016, 27, 530–569. [Google Scholar]
- Kim, J.; Yoon, S.; Hong, S. Exploring Influencing Factors at Student and Teacher/School levels on Science Self-efficacy Using Machine Learning and Multilevel Latent Profile Analysis. SAGE Open 2024, 14. [Google Scholar] [CrossRef]
- Yusnidar, Y.; Fuldiaratman, F.; Chaw, E.P. A STUDY OF MIXED-METHOD: SCIENCE PROCESS SKILLS, INTERESTS AND LEARNING OUTCOMES OF NATURAL SCIENCE IN JUNIOR HIGH SCHOOL. J. Ilm. Ilmu Ter. Univ. Jambi|JIITUJ| 2024, 8, 76–89. [Google Scholar] [CrossRef]
- OECD, ʺSKILLS FOR 2030,ʺ in OECD Future of Education and Skills 2030 Conceprtual learning framework, 2019.
- Dela Torre and J. Paglinawan, "STUDENTS LEARNING PREFERENCE AND STUDENT'S ENGAGEMENT IN SCIENCE OF SECONDARY HIGH SCHOOL STUDENTS. International Journal Of All Research Writings 2023, 7.
- Wu, T.-T.; Wu, Y.-T. Applying project-based learning and SCAMPER teaching strategies in engineering education to explore the influence of creativity on cognition, personal motivation, and personality traits. Thinking Skills and Creativity, 2020. [Google Scholar]
- Febrina, V.; Setiawan, D. Analysis of the Use of Learning Media on the Learning Interest of Learning Science Students and Environmental Themes. J. Penelit. Pendidik. IPA 2024, 10, 5702–5709. [Google Scholar] [CrossRef]
- Levin, H. The Importance of Adaptability for the 21st Century. Symposium: 21st Century Excellence in Education, Part I. 2015, 52, 136–141. [Google Scholar] [CrossRef]
- Lazaro, J.M.; Paglinawan, J. Laboratory Resource Availability and Students’ Engagement in Science. International Journal of Research and Innovation in Applied Science 2025, IX, 146–153. [Google Scholar] [CrossRef]
- Efendi, N.; Jayanti, A.S.L. Optimizing Science Laboratory Management for Enhanced Student Learning Outcomes. Indones. J. Law Econ. Rev. 2024, 19. [Google Scholar] [CrossRef]
- Pasrellia, R. ; Disniarti Teacher Strategies in Increasing Student Learning Interest with the Use of Science Lesson Image Media. Int. J. Educ. Comput. Stud. (IJECS) 2024, 4, 57–63. [Google Scholar] [CrossRef]
- Han, L.I. Increasing Interest in Science Concepts among Primary School Students through Tiktok. Int. J. Acad. Res. Progress. Educ. Dev. 2024, 13. [Google Scholar] [CrossRef]
- Hewitt, T.; Forcino, F. he influence of a STEM unit on the interest in and understanding of science and engineering between elementary school girls and boys. Discov Educ 2025, 4. [Google Scholar] [CrossRef]
- Xia, X.; Bentley, L.; Fan, X.; Tai, R. TEM Outside of School: a Meta-Analysis of the Effects of Informal Science Education on Students' Interests and Attitudes for STEM. Int J of Sci and Math Educ 2024. [Google Scholar]
- Qu, L. Problem-Based Learning: An Effective Teaching Method for Science Competence Development. Science Insights Education Frontiers 2024, 2, 3919–3921. [Google Scholar] [CrossRef]
- Afzal, A. Collaboration in Secondary School Classroom. Pakistan Review of Social Sciences 2020, 1, 79–92. [Google Scholar]
- Warren, L.L. The Importance of Teacher Leadership Skills in the Classroom. Education Journal 2021, 10, 8–15. [Google Scholar] [CrossRef]
- Shin, S.-H.; Sim, J.; Moon, C.; Kim, N.; Hwang, J. Effects of STEAM Programs Emphasizing Data Science and AI on Students' Attitudes toward Mathematics and Science. KEDI journal of educational policy 2024, 2, 89–110. [Google Scholar]
- Shah, R.K. Effective Constructivist Teaching Learning in the Classroom. Shanlax Int. J. Educ. 2019, 7, 1–13. [Google Scholar] [CrossRef]
- Heystek, S. The implementation of problem-based learning to foster pre-service teachers' critical thinking in education for sustainable development, North-West University, 2021.
- Keiler, L.S. Teachers’ roles and identities in student-centered classrooms. Int. J. STEM Educ. 2018, 5, 1–20. [Google Scholar] [CrossRef] [PubMed]
- Ghavifekr, S. COLLABORATIVE LEARNING: A KEY TO ENHANCE STUDENTS’ SOCIAL INTERACTION SKILLS. Malays. Online J. Educ. Sci. 2020, 8, 9–21. [Google Scholar]
- Liebech-Lie, B.; Sjølie, E. Teachers’ conceptions and uses of student collaboration in the classroom. Educational Research 2020. [Google Scholar]
- Dekker, H.; Wolff, S.W. Re-inventing Research-Based Teaching and Learning. In European Forum for Enhanced Collaboration in Teaching; Brussels, 2016. [Google Scholar]
- Seevaratnam, V.; Gannaway, D.; Lodge, J. Design thinking-learning and lifelong learning for employability in the 21st century. J. Teach. Learn. Grad. Employab. 2023, 14, 167–186. [Google Scholar] [CrossRef]
- www.minedu.gov.gr. Jun 2024. [Online]. Available: https://www.minedu.gov.gr/epal-m/anakoinwseis-epala/58752-28-06-24-anakoinosi-vathmologion-panelladikon-eksetaseon-gel-kai-epal-2024-statistika-4. [Accessed Jul 2024].
Disclaimer/Publisher’s Note: The statements, opinions and data contained in all publications are solely those of the individual author(s) and contributor(s) and not of MDPI and/or the editor(s). MDPI and/or the editor(s) disclaim responsibility for any injury to people or property resulting from any ideas, methods, instructions or products referred to in the content. |
© 2025 by the authors. Licensee MDPI, Basel, Switzerland. This article is an open access article distributed under the terms and conditions of the Creative Commons Attribution (CC BY) license (http://creativecommons.org/licenses/by/4.0/).
Copyright: This open access article is published under a Creative Commons CC BY 4.0 license, which permit the free download, distribution, and reuse, provided that the author and preprint are cited in any reuse.


