
Submitted:
22 December 2025
Posted:
23 December 2025
You are already at the latest version
Abstract
[18F]FDG positron emission tomography (PET) is extensively utilized to assess brain glucose metabolism, typically through static images reflecting radiotracer accumulation of up to one hour. In comparison, functional PET (fPET) enables investigation of [18F]FDG dynamics occurring within seconds. However, the physiological mechanisms supporting these rapid changes in metabolism necessitate further attention to allow accurate interpretation of brain function and their clinical implications. This work highlights candidate mechanisms driving [18F]FDG signal changes at high temporal resolution, offering complementary insights to existing interpretations.At rest, metabolic demands are closely matched by glucose supply across the blood-brain barrier (BBB), regulated by glucose transporter 1 (GLUT1). During neuronal activation, both glucose transport and phosphorylation by hexokinase are elevated to meet increased energy requirements. Simulations indicate that rapid [18F]FDG signal increases are primarily driven by BBB transport (K1 and k2 in a two-tissue compartment model), with subsequent increases in hexokinase activity (k3). Mechanisms supporting increased BBB transport include elevated glucose concentration gradient towards the brain and changes in GLUT1 intrinsic properties, but only minor effects of blood flow. Conversely, moment-to-moment fluctuations in [18F]FDG, as examined using molecular connectivity, reflect temporally synchronized supply in response to metabolic demand, mediated jointly by blood flow and BBB transport.We emphasize that, particularly during neuronal activation, the strong coupling between BBB transport and metabolism underpin the [18F]FDG fPET signal. Considering alterations of GLUT1 and subsequent metabolism in numerous brain disorders, stimulation-induced changes of energy demands and moment-to-moment fluctuations of molecular connectivity represent a promising opportunity to investigate the underlying pathophysiological processes.
Keywords:
brain metabolism
; functional PET
; blood-brain barrier
; blood flow
; kinetic modeling
Introduction
[18F]FDG is the most commonly used radiotracer world-wide for positron emission tomography (PET) [1]. This is due to its high clinical relevance in numerous medical fields [2] and the widespread availability given by the simple synthesis with an isotope half-life that allows transportation and commercial production.
Routine clinical use in brain imaging employs a bolus application, followed by a resting period of about 30-60 min and subsequent scanning for 10-15 min [3]. Although this yields a static image, it is widely used as a surrogate for overall brain glucose metabolism, typically reported as the standard uptake value (SUV) or SUV ratio (SUVR). This interpretation is predicated on phosphorylation of the radiotracer and subsequent irreversible trapping in the cell (i.e., k4 = 0 in a 2-tissue compartment model (2TCM), Figure 1). We acknowledge however that this assumption may not completely hold for certain applications such as for long scan times.
While a dynamic PET scan with a bolus application allows for identification of individual rate constants through compartment modeling of the radiotracer kinetics, it will in most cases still yield a static outcome image of the cerebral metabolic rate of glucose (CMRGlu). This can be derived from the influx constant Ki, which in turn is a macroparameter obtained from the individual rate constants:
Ki = K1*k3 / (k2 + k3)
These rate constants describe the transport across the blood-brain barrier (BBB, K1 and k2), and the phosphorylation in the cell through the conversion of [18F]FDG to [18F]FDG-6-phosphate by the enzyme hexokinase (k3), i.e., the first step of glucose metabolism [1] (Figure 1). In most practical applications, SUV, SUVR and CMRGlu images reflect brain metabolism at resting state, with k3 showing the strongest correlation with these metrics at the above mentioned time scale [4]. This offers the possibility to identify (non-acute) pathological alterations e.g., caused by epilepsy, tumors, injuries as well as neurodegenerative and psychiatric disorders.
Further advancement of dynamic PET enables the quantification of different cognitive or emotional states within a single PET scan [5,6,7]. Similar to functional magnetic resonance imaging (fMRI) this is achieved through presentation of e.g., visual paradigms in a block design, thus yielding the term functional PET (fPET). The approach requires administration of radiotracers like [18F]FDG as a (bolus +) constant infusion to provide free radiotracer throughout the experiment, which is then able to be metabolized according to the current metabolic demands [6,8].
As the temporal resolution for this approach has substantially improved from PET image frames of 1 min [5,6] down to 3 s [9], acute adaptations in glucose metabolism become increasingly relevant. It is therefore essential to determine the assumptions and interpretations that apply to [18F]FDG PET imaging at such a short time scale and to identify the possible neurophysiological mechanisms that underpin rapid changes in metabolic demands. This work aims to highlight major driving factors responsible for fast-acting changes in glucose metabolism and their links to the corresponding [18F]FDG signals measured with fPET in vivo. Although conceptual parallels are drawn to rate constants of the 2TCM, fPET is not assumed to unambiguously resolve their individual contribution to such rapid effects. Instead, this work aims to relate these parameters in a general sense to the underlying neurophysiological mechanisms, rather than to estimate their precise values. We will specifically focus on aspects applicable to short-term changes, which should be seen in addition to (not instead of) previous knowledge that explained glucose metabolism derived from steady-state kinetics obtained with conventional PET imaging. This work comprises a literature review, supported by simulations of the irreversible 2TCM. We start by briefly re-capitulating the main concepts of brain metabolism from the literature. This knowledge will then be transferred to scenarios of acute stimulation-induced changes in [18F]FDG glucose metabolism. Finally, we propose that also moment-to-moment fluctuations in the PET signal at resting state represent meaningful information. These enable computation of molecular connectivity [10,11,12], but are subject to an even more refined interpretation. In sum, this work provides a neurophysiological account of the rapid dynamics in glucose metabolism elicited through cognitive or emotional processing and at resting-state, which can be imaged with [18F]FDG fPET.
Simulations
To characterize [18F]FDG uptake and metabolism induced by stimulation and moment-to-moment fluctuations, simulations were carried out using the irreversible 2TCM. The arterial input function and rate constants at resting-state were adopted from our previous work, using a typical bolus + infusion radiotracer administration protocol at a ratio of 20:80% [9], with K1 = 0.11 mL/cm3/min, k2 = 0.167 min−1, k3 = 0.074 min−1, k4 = 0 min−1. These values are also in close agreement with previously published data [13].
Stimulation-specific changes in rate constants were introduced after 8 min to allow equilibration and lasted 36 s. Proceeding from our previous simplified simulation where changes in rate constants were stationary [9], the changes here were modeled as time-dependent variables. The model was implemented analytically in Matlab by solving the corresponding differential equations, while also considering the rate constants’ newly introduced time variance. Since that the true changes in rate constants during neuronal activation are unknown, we explored which different sets of rate constants are able to characterize a ramp function during activation, similar to the one commonly used in fPET general linear model analyses [6,8]. For combined changes of rate constants (case 5 and 6 below) a minimization procedure was employed with the constraints that i) the resulting stimulation-induced changes in Ki may approximate ~27%, as observed experimentally (see below) and ii) that stimulation-specific effects approximate the shape of a ramp function. We would like to emphasize, that many possible combinations of changes in rate constants, including decreases in some cases, might be able to satisfy these constraints. However, if possible, we assumed an increase in the individual constants’ values as this was deemed most likely from a physiological point of view. The following cases were explored:
- ∆K1 = 5%
- ∆k2 = 5%
- ∆k3 = 5%
- ∆K1 : ∆k2 : ∆k3 = x : -5x : 0, with x = 5%
- ∆K1 : ∆k2 : ∆k3 = x : 0 : 4.38x, with x = 6.81%
- ∆K1 : ∆k2 : ∆k3 = x : 1.18x : 1.72x, with x = 19.89%
Cases 1-3 characterize changes in the [18F]FDG signal due to variation of individual rate constants alone. In case 4 only BBB-related transport rates are increased (i.e., ∆k3 = 0). Note that even if k3 does not change, an increase in K1 alone is mathematically sufficient to cause an increase in overall metabolism Ki (see Eq. 1). Case 5 assumes that neuronal activation leads only to increases in supply and metabolism of glucose and [18F]FDG with a constant reverse transport (i.e., ∆k2 = 0). The rationale of case 6 is that BBB transport is generally increased maintaining a constant ratio between K1 and k2 (i.e., ∆K1 = ∆k2).
Oscillating moment-to-moment fluctuations were simulated on top of basis radiotracer uptake (i.e., with K1 = 0.11 mL/cm3/min, k2 = 0.167 min−1, k3 = 0.074 min−1, k4 = 0 min−1). That is, changes in rate constants as in case 6 above (i.e., with ∆K1 : ∆k2 : ∆k3 = x : 1.18x : 1.72x) were repeatedly introduced for 30 s periods, with the respective variations alternating between positive and negative algebraic signs. Furthermore, the contribution of k3 was investigated by varying K1 and k2 only, with ∆k3 = 0.
Finally, we indirectly assess the influence of blood flow, assuming that changes in CBF would lead to changes in the fractional volume of blood vB in the common operational equation used in PET imaging:
vB was changed according to the relationship established by Grubb et al. [14], yielding 8.85% change in CBV following increases in CBF by 25% [15,16,17,18]. This was implemented for both, stimulation-induced changes (single stimulation block of 36s) as well as resting-state fluctuations (repeatedly alternating changes of 30s). These changes were modeled in analogy to BOLD signal changes, with a boxcar function for stimulation-induced changes and a sine-like change for resting-state fluctuations, respectively. In the simulations, only the vB part scaling CWB was changed, as we assume that rapid CBF changes do not translate into corresponding changes in CT on such a short time scale.
CPET = (1-vB)*CT + vB*CWB
Basal Glucose Metabolism in the Human Brain
The human brain accounts for about 20% of the body’s energy demands under resting conditions, with glucose being the primary fuel. Since glucose is only scarcely stored in the brain (except for e.g., glycogen storage in astrocytes, see below), a constant supply from blood is mandatory to maintain brain function [19,20]. Glucose as well as [18F]FDG pass the BBB through facilitated transport via the glucose transporter 1 (GLUT1) carrier protein (although at different Michaelis-Menten constants KM) [21,22,23]. The transport mechanism is required because of the hydrophilic nature of both compounds, which makes [18F]FDG different to most other radiotracers which cross the BBB via passive diffusion. Throughout the manuscript, GLUT1 refers to the form with a molecular mass of 55 kDa with highest expression at the BBB (Figure 1), while the 45 kDa form is expressed at astrocytes [21,23].
Glucose transport rate or velocity across the BBB (TGluc) can be described with the Michaelis-Menten equation, taking into account the difference in glucose concentration between blood plasma ([GlucPlasma]) and brain ([GlucBrain], Eq. 2) [24]. At rest, TGluc has been estimated to be about 37 µmol/100g/min (i.e., 37% of its maximum value Tmax = 1 µmol/g/min, see [19,24,25,26,27] for assumptions).
This confirms the well-known fact that under normal resting conditions TGluc is not the limiting factor (rather, conversion by hexokinase is [28,29]), but TGluc can become so during stimulation (see [24,26,30] and below).
As highlighted previously [24], the interesting point is that the transport velocity of glucose across the BBB TGluc closely matches its metabolic rate CMRGlu at about 30 µmol/100g/min [6,19,24,31]. In other words, at resting-state the delivery of glucose just satisfies the actual demands [19,24,26], which is plausible given the limited storage in the form of glycogen [26,32] and the neurotoxicity of excessive glucose concentrations [33]. These facts in turn imply that acute increases in metabolic demands also require an increase in supply across the BBB as discussed in the next sections.
Stimulation-Specific Changes in [18F]FDG
We and others have repeatedly shown that stimulation-induced regional increases in CMRGlu as obtained with [18F]FDG in awake humans are stable at about 20-25% from baseline metabolism across various experimental settings [6,24,30,34,35,36]. It is acknowledged that this is lower than the often referenced 50% [37], but such a large change might be even beyond the maximum calculated transport rate of glucose [30]. Furthermore, recent work has reported increases in regional cerebral blood flow (CBF) of about 25% [15,16,17,18], i.e., a similar range as compared to CMRGlu. Thus, the initially described coupling mechanisms between CMRGlu and CBF [37] still apply.
In line with studies that used other techniques than PET imaging [35,38,39,40], our recent work has demonstrated that such increases in [18F]FDG may occur almost instantly upon neuronal stimulation [9]. To assess the contribution of individual rate constants and CBF, we carried out simulations of the 2TCM (Figure 2). Simulated changes in vB as presumably induced by CBF yielded instant step-wise changes in the [18F]FDG signal upon start and end of the stimulation, which did not resemble experimentally observed effects (Supplementary Figure S1 and Figure 2c). Rather, initial increases in the [18F]FDG signal required changes in K1 (and potentially k2), i.e., parameters that characterize BBB transport (Figure 2a). Furthermore, a combination of changes in rate constants that also included changes in k3 were required to match experimental data (Figure 2b-c). Thus, changes in k3 were necessary for the [18F]FDG signal to return to baseline metabolism after the stimulus has ceased (i.e., slope = 0 in the task-specific time activity curve (TAC), Figure 2b), indicating that [18F]FDG is truly phosphorylated by hexokinase after transport into the brain. In line, previous work has elegantly shown that only an increase in both glucose transport across the BBB and its phosphorylation by hexokinase yields an increase in overall energy increase [26,27].
This coupling of events may seem trivial, but it is particularly relevant for interpreting the rapid changes observed with fPET. To summarize the essential aspects underpinning the tight coupling of BBB transport and hexokinase activity upon neuronal activation, i) at rest glucose supply matches the actual demands (TGluc ~ CMRGlu), ii) there is almost no storage capacity for glucose in the brain, and iii) independent simulations have shown that increases in BBB transport and hexokinase activity are both required to increase the actual metabolism. Again, these results imply that an acute surge in metabolic demands during neuronal activation must consequently also be matched by an increased supply. Previous work has already emphasized that glucose transport across the BBB represents an essential factor at rest [41] and during stimulation [24,30,42]. Of note, even earliest studies assessing task-specific glucose metabolism imaged BBB transport at least to some extent [43,44]. That is, task performance was carried out during the bolus injection of [18F]FDG, with the initial part of the TAC being mainly determined by K1 and k2.
Although glucose metabolism itself has been studied extensively, the corresponding supply has received relatively little attention. There are several candidate mechanisms available that may (or may not) explain such an increase in supply (Figure 3). Importantly, with respect to the [18F]FDG signal, all of these mechanisms will to some extent affect its transport via the BBB (K1 and k2) and subsequently its metabolism by hexokinase (k3).
Cerebral Blood Flow (CBF)
The increase in CBF upon neuronal activation is well established and represents the basis of blood-oxygen level dependent (BOLD) fMRI. Among others [45], such changes occur at the level of the capillary bed by decreasing its resistance to and heterogeneity of flow, indicating a functional recruitment by increasing the fraction of high-flow capillaries [46,47,48,49]. For PET imaging, K1 is often associated with changes in blood flow. This assumption is valid for radiotracers that cross the BBB via passive diffusion and have a high extraction fraction. However, as mentioned above glucose and [18F]FDG are subject to a facilitated transport mechanism via GLUT1. More importantly, their extraction fraction from blood is only 10% [19,24,27,50,51]. This implies that an increase in regional CBF of about 25% by neuronal activation [15,16,17,18] would result only in a 2.5% change in BBB transport of glucose, which in turn is only a fraction of the observed CMRGlu change. Experimental work using a hypercapnia challenge also showed that [18F]FDG uptake is not influenced by supraphysiological changes in CBF even if higher than 100% [5]. This does not invalidate previous observations showing associations between CBF and CMRGlu. Rather, it suggests that these may be correlated, but only due to their common causal dependency on neuronal activation. Altogether, this indicates that changes in CBF only represent a minor contribution to changes in the [18F]FDG signal.
Glucose Concentration Gradient
The BBB is not freely permeable for glucose, maintaining a concentration gradient of about [GlucPlasma] = 5 mmol/L in blood plasma vs. [GlucBrain] = 1 mmol/L in brain extracellular space at rest [19,22,24]. During neuronal activation, glucose phosphorylation is accelerated [23], which decreases brain glucose concentration [GlucBrain] by about 20% [24,35,36,52,53]. Leaving everything else constant in Eq. 2, such an increase in the concentration gradient between blood and brain alone would increase glucose transport across the BBB (TGluc) by 14% [24]. As noted previously, this effect derived from the law of mass action is still insufficient to explain CMRGlu changes in full [25]. Interestingly, the mentioned decrease in [GlucBrain] is very much within the range of regional changes observed with [18F]FDG fPET [6,30,34], thereby providing the possible interpretation of fPET signal changes representing just the amount of glucose that is needed to satisfy the increased demands.
Intrinsic Properties of GLUT1
Another aspect to modify BBB transport of glucose is given by changes in its permeability, which has also been described as neurobarrier coupling [24]. This is realized by adaptations of the intrinsic properties of GLUT1 upon activation, resulting in an increased Tmax of Eq. 2 [54,55]. Although rather little is known about the exact changes, potential mechanisms may include conformational changes between occluded and open states [56,57] as well as “unmasking” of already available binding sites [54,58,59]. Interestingly, the increases in Tmax occurred without relevant changes in Km [54,60]. Furthermore, GLUT1 appears in clusters, which are dissolved during activation resulting in increased glucose transport [61]. Regarding the temporal scale, one study reported rapid changes in GLUT1 Tmax within 10 s [62]. However, this concerned the astrocytic GLUT1 transporter (45 kDa), which differs from that of the BBB (55 kDa), so it remains to be investigated whether these effects translate to BBB transport. In any case, slightly delayed increase in the transport is also in line with the above mentioned decrease in brain glucose concentration [35]. Unfortunately, quantitative estimations at short time scales are hardly available so far. One study demonstrated an increase in Tmax by 30-40%. However, this was obtained after the induction of seizures [63], thus being a supraphysiological stimulus. Considering that the other mechanisms may already account for 16.5% of changes (2.5% CBF + 14% concentration gradient), the remaining amount to reach the commonly observed regional CMRGlu increase of 20-25% would then leave 3.5-8.5% that are potentially attributed to intrinsic changes in GLUT1 (Figure 3).
Number of GLUT1
Finally, a possibility to increase the transport rate of glucose is to increase the number of GLUT1 carrier proteins at the BBB surface. This likely occurs through redistribution of GLUT1 from the intracellular pool (which accounts for up to 40% of total GLUT1) to the membrane surface [21,24]. However, the time-scale at which this occurs has been described to be mostly within the range of minutes to hours [24]. Thus, increased expression of GLUT1 at the BBB may be relevant for subsequent adaptations to sustained neuronal activation, but probably represents a minor factor in the adaptations to meet acute metabolic demands. Also, the above changes in Tmax may even occur without variations in the number of glucose transporters [54] and mRNA [64].
In sum, these findings suggest that the majority of increases in glucose supply upon neuronal activation are related to an increased concentration gradient towards the brain, followed by changes of the intrinsic properties of GLUT1, whereas increases in blood flow only play a minor role (Figure 3). Thus, the increased supply reflects the fast increase of the [18F]FDG signal, which is then followed by its metabolism via hexokinase.
Resting-State Dynamics of [18F]FDG
The assessment of resting-state functional connectivity as derived from BOLD fMRI and EEG [65,66] has made a convincing case that spontaneous fluctuations of brain signals represent biologically meaningful information even in the absence of specific stimulation. This has substantially changed our understanding about the interaction between brain regions, organized in hierarchical networks each underpinning different physiological functions [67,68,69].
Although the concept to compute connectivity with PET data was introduced decades ago [70,71], the computation of molecular connectivity has received particular attention in recent years [10,12,72], due to the ability to obtain reliable high temporal resolution PET data. In analogy to BOLD fMRI functional connectivity, molecular connectivity refers to the correlation of fluctuations of signal time courses between brain regions [10]. It has been shown that the computation of molecular connectivity with [18F]FDG data also features structured network organization [11,12]. However, the interpretation and the underlying neurophysiological mechanisms of such rapid signal fluctuations in the fPET signal without external stimulation have not been established.
Moment-to-Moment Fluctuations in [18F]FDG
There are various approaches available to compute moment-to-moment fluctuations from [18F]FDG fPET data [10,11,12,73,74], but all with the common aim to remove the cumulative part of the TAC reflecting the irreversible uptake of the radiotracer. The most illustrative approach is a bandpass filter, due to the straightforward interpretation in terms of the signals’ frequencies. Simulations were carried out to assess potential contributions to the observed signal changes. Simulated changes in individual rate constants were first Fourier transformed, with focus on the frequency range of 0.01 < f < 0.1 Hz [11], commonly used for BOLD fMRI functional connectivity. The corresponding frequency spectra indicate that the [18F]FDG signal underlying these fluctuations is primarily determined by K1 and k2 reflecting transport across the BBB, rather than k3 (Figure 4a), as the effect of changes in k3 were simply too slow (Figure 2a and Figure 4a). Next, combined changes in rate constants were simulated and subsequently band-pass filtered in the 0.01-0.1 Hz frequency range. This procedure effectively removed the irreversible radioligand uptake, leaving only oscillating changes in the signal, both in experimental and simulated data (Figure 4b and c). Notably, the resulting oscillations were almost identical, regardless of whether k3 changes were included in the simulation. However and in contrast to task-induced changes, simulated variations in vB (reflecting presumed CBF changes) lead to similar oscillations in the [18F]FDG signal (Figure 4b).
Several aspects however warrant further investigation and experimental validation. For instance, it remains to be clarified to what extent CBF variations translate into vB changes at the capillary level. Furthermore, the employed 2TCM has been developed for modeling tracer kinetics in steady-state, whereas rapid fluctuations may require additional refinements. Consequently, the precise contributions of individual rate constants and CBF remains uncertain and the amplitudes of the effects shown in Figure 4b may change under different modeling assumptions. Nevertheless, it seems unlikely that molecular connectivity obtained with [18F]FDG exclusively reflects CBF-related effects, since independent studies have reported substantial differences between BOLD-derived functional connectivity and [18F]FDG-based molecular connectivity in terms of overall network structure [11,12] and alterations in aging [75].
From a more general view, it seems plausible that the observed fluctuations reflect adaptations through a regulatory circuit, aiming to maintain a constant supply of glucose which matches the current consumption, i.e., slight increases and decreases from a steady baseline according to the actual changes in demand. In the hypothetical case that every brain region has equal metabolic demands, this oscillation would be uniform across the entire brain. However, since the brain is never truly at rest [76] and different brain regions are involved in processing distinct stimuli, its metabolic demands also vary across space and time, resulting in a regional variability in this regulatory signal. If two brain regions have equal metabolic demands simultaneously, then also their time courses would be similar and thus correlated, irrespective of their baseline metabolism. These regions can be considered to be metabolically coupled through their common acute changes in metabolic demands [70,71], which are in turn matched by corresponding changes in CBF and BBB transport. Although it might be surprising that k3 does not seem to play a direct role in molecular connectivity, it is of course still relevant. As emphasized throughout this manuscript and within the concept of neurobarrier coupling [24], changes in BBB transport are initially triggered by neuronal activation, subsequently leading to increased glucose consumption and thus increases in k3 (see above).
Limitations, Outlook and Conclusions
Numerous studies with simulations and experimental data demonstrate that stimulation-induced increases in glucose metabolism require BBB transport for subsequent phosphorylation by hexokinase. We emphasize that changes in BBB transport may not be seen independently from hexokinase activity, as neuronal activation triggers both in order to match energy supply and demand, i.e., these mechanisms are strongly coupled. In terms of [18F]FDG PET imaging this implies that several rate constants (especially K1 and k3) are involved in this process. The adaptations supporting neuronal activation are mainly provided by an increased glucose BBB gradient towards the brain and functional changes in the intrinsic properties of GLUT1 molecules, while blood flow plays only a minor role for stimulation-specific effects. Conversely, moment-to-moment fluctuations in the [18F]FDG signal used for molecular connectivity seem to reflect the regulation of metabolic supply through CBF and across the BBB to match the underlying demands.
As a limitation, current models may not yet be sufficient to characterize such rapid changes in glucose metabolism and the corresponding [18F]FDG signal. That is, the Michaelis-Menten equation is valid for the steady-state, an assumption that does not hold for acute changes in neuronal activation. Thus, several variables (e.g., Tmax, [GlucBrain]) become time-variant, which requires a different mathematical solution. For the simulations of the 2TCM, time-dependent rate constants were used, but the changes were only assumed to occur during the task effect at a fixed rate, while temporally varying changes and those beyond the stimulation period are possible. Another limitation of our simulations is that numerous combinations of changes in rate constants may yield similar changes in the actual [18F]FDG TAC. Although our examples do not cover the full simulation space, we provided results within a physiologically plausible and thus representative range of changes. Finally, we acknowledge that other sources apart from glucose may also be used for energy production. For instance, glycogen is stored in astrocytes, but its turnover is slower than that of glucose [27]. Furthermore, recent modelling suggested that glycogenolysis takes place in astrocytes to spare glucose for neuronal energy metabolism upon activation [30,32]. This model also seemed to explain fluctuations in lactate [77], which may however not represent a major energy source under normal conditions [78]. Nevertheless, the current work outlines potential neurophysiological underpinnings of rapid changes in the [18F]FDG signal, It is important to note that the described mechanisms do not replace previous assumptions and interpretations of [18F]FDG imaging, rather they should be seen as additional considerations specifically relevant for short-term changes.
Future work may build upon this information to investigate if known pathological alterations of brain glucose metabolism can be characterized in more detail. For instance, decreases in GLUT1 transporters at the BBB explain hypometabolism, which occurs before the onset of cognitive dysfunction and amplifies neurodegenerative processes [79,80,81], alterations that are also found in Parkinson’s disease [50,82]. Further, increased GLUT1 phosphorylation in major depressive disorder was alleviated in patients who remitted after treatment [83]. Thus, BBB transfer by GLUT1 may represent a promising therapeutic target for various disorders to rescue brain glucose metabolism [22,84].
Finally, the herein proposed concepts may at least partly translate to other targets such as dopamine and serotonin synthesis, imaged with 6-[18F]FDOPA [85] and [11C]AMT [86], respectively, as numerous of the presented aspects apply in a similar manner. These include facilitated transport across the BBB (via the L-type amino acid transporter 1 [87,88]), a low extraction fraction from blood [89] as well as tight coupling of BBB transport [90] and neurotransmitter synthesis enzymes [91,92,93,94] with neuronal activation. Future application of this approach may therefore provide novel insights into neurotransmitter dysfunction in psychiatric disorders.
Supplementary Materials
The following supporting information can be downloaded at the website of this paper posted on Preprints.org.
Author Contributions
Conceptualization: A.H., R.L. Methodology: P.F., A.H., M.B.R., M.M. Writing – original draft: A.H., M.M., P.F. Writing – review and editing: all authors. Funding acquisition: A.H., R.L., C.M. All authors discussed the implications, revised the manuscript and approved the final version.
Funding
This research was funded in whole or in part by the Austrian Science Fund (FWF) [Grant DOI 10.55776/KLI610, 10.55776/KLI1151 and 10.55776/PAT5436523, PI: A. Hahn, Grant DOI 10.55776/KLI1006, PI: R. Lanzenberger]. For open access purposes, the author has applied a CC BY public copyright license to any author-accepted manuscript version arising from this submission. C. Milz is a recipient of a DOC Fellowship (27221) from the Austrian Academy of Sciences at the Department of Psychiatry and Psychotherapy, Medical University of Vienna.
Data and Code Availability
Custom code for simulations can be obtained from the corresponding author with a transfer agreement.
Acknowledgments
We thank the graduated team members and the diploma students of the Neuroimaging Lab (NIL, head: R. Lanzenberger) as well as the clinical colleagues from the Department of Psychiatry and Psychotherapy for clinical and/or administrative support. In detail, we would like to thank L. Silberbauer, and G. Gryglewski for medical support, L. Rischka for acquisition and analysis support. The scientific project was performed with the support of the Medical Imaging Cluster of the Medical University of Vienna.
Conflicts of Interest
RL received investigator-initiated research funding from Siemens Healthcare regarding clinical research using PET/MR. He is a shareholder of the start-up company BM Health GmbH since 2019. D. Rujescu served as consultant for Janssen, received honoraria from Gerot Lannacher, Janssen and Pharmagenetix, received travel support from Angelini and Janssen, and served on advisory boards of AC Immune, Roche and Rovi. M. Hacker received consulting fees and/or honoraria from Bayer Healthcare BMS, Eli Lilly, EZAG, GE Healthcare, Ipsen, ITM, Janssen, Roche, and Siemens Healthineers. All other authors report no conflict of interest in relation to this study.
References
- Wadsak W, Mitterhauser M. Basics and principles of radiopharmaceuticals for PET/CT. Eur J Radiol. 2010;73:461-9.
- Buerkle A, Weber WA. Imaging of tumor glucose utilization with positron emission tomography. Cancer and Metastasis Reviews. 2008;27:545-54. [CrossRef]
- Guedj E, Varrone A, Boellaard R, Albert NL, Barthel H, van Berckel B, et al. EANM procedure guidelines for brain PET imaging using [(18)F]FDG, version 3. Eur J Nucl Med Mol Imaging. 2022;49:632-51. [CrossRef]
- Volpi T, Lee JJ, Vlassenko AG, Goyal MS, Corbetta M, Bertoldo A. The brain’s “dark energy” puzzle upgraded: [(18)F]FDG uptake, delivery and phosphorylation, and their coupling with resting-state brain activity. J Cereb Blood Flow Metab. 2025;45:1799-815. [CrossRef]
- Villien M, Wey HY, Mandeville JB, Catana C, Polimeni JR, Sander CY, et al. Dynamic functional imaging of brain glucose utilization using fPET-FDG. Neuroimage. 2014;100:192-9.
- Hahn A, Gryglewski G, Nics L, Hienert M, Rischka L, Vraka C, et al. Quantification of Task-Specific Glucose Metabolism with Constant Infusion of 18F-FDG. J Nucl Med. 2016;57:1933-40. doi:jnumed.116.176156.
- Jamadar SD, Ward PG, Li S, Sforazzini F, Baran J, Chen Z, et al. Simultaneous task-based BOLD-fMRI and [18-F] FDG functional PET for measurement of neuronal metabolism in the human visual cortex. Neuroimage. 2019;189:258-66. [CrossRef]
- Rischka L, Gryglewski G, Pfaff S, Vanicek T, Hienert M, Klobl M, et al. Reduced task durations in functional PET imaging with [(18)F]FDG approaching that of functional MRI. Neuroimage. 2018;181:323-30. [CrossRef]
- Hahn A, Reed MB, Vraka C, Godbersen GM, Klug S, Komorowski A, et al. High-temporal resolution functional PET/MRI reveals coupling between human metabolic and hemodynamic brain response. Eur J Nucl Med Mol Imaging. 2023. [CrossRef]
- Reed MB, Cocchi L, Sander CY, Chen J, Matheson GJ, Fisher P, et al. Connecting the dots: approaching a standardized nomenclature for molecular connectivity in positron emission tomography. Eur J Nucl Med Mol Imaging. 2025;53:48-58. [CrossRef]
- Reed MB, Graf S, Murgaš M, Eggerstorfer B, Milz C, Silberbauer LR, et al. High-temporal resolution metabolic connectivity resolved by component-based noise correction. bioRxiv. 2025:2025.08.18.670788. [CrossRef]
- Jamadar SD, Ward PGD, Liang EX, Orchard ER, Chen Z, Egan GF. Metabolic and Hemodynamic Resting-State Connectivity of the Human Brain: A High-Temporal Resolution Simultaneous BOLD-fMRI and FDG-fPET Multimodality Study. Cereb Cortex. 2021;31:2855-67. [CrossRef]
- Reivich M, Alavi A, Wolf A, Fowler J, Russell J, Arnett C, et al. Glucose metabolic rate kinetic model parameter determination in humans: the lumped constants and rate constants for [18F]fluorodeoxyglucose and [11C]deoxyglucose. J Cereb Blood Flow Metab. 1985;5:179-92. [CrossRef]
- Grubb RL, Jr., Raichle ME, Eichling JO, Ter-Pogossian MM. The effects of changes in PaCO2 on cerebral blood volume, blood flow, and vascular mean transit time. Stroke. 1974;5:630-9. [CrossRef]
- Fang J, Ohba H, Hashimoto F, Tsukada H, Chen F, Liu H. Imaging mitochondrial complex I activation during a vibrotactile stimulation: A PET study using [(18)F]BCPP-EF in the conscious monkey brain. J Cereb Blood Flow Metab. 2020;40:2521-32. [CrossRef]
- Kessler RM. Imaging methods for evaluating brain function in man. Neurobiol Aging. 2003;24 Suppl 1:S21-35; discussion S7-9. doi:S0197458003000472 [pii].
- Mintun MA, Lundstrom BN, Snyder AZ, Vlassenko AG, Shulman GL, Raichle ME. Blood flow and oxygen delivery to human brain during functional activity: theoretical modeling and experimental data. Proc Natl Acad Sci U S A. 2001;98:6859-64. [CrossRef]
- Fox PT, Raichle ME. Focal physiological uncoupling of cerebral blood flow and oxidative metabolism during somatosensory stimulation in human subjects. Proc Natl Acad Sci U S A. 1986;83:1140-4. [CrossRef]
- Dienel GA. Brain Glucose Metabolism: Integration of Energetics with Function. Physiol Rev. 2019;99:949-1045. [CrossRef]
- Jamadar S, Behler A, Deery H, Breakspear PM. The metabolic costs of cognition. 2024. [CrossRef]
- Simpson IA, Carruthers A, Vannucci SJ. Supply and Demand in Cerebral Energy Metabolism: The Role of Nutrient Transporters. Journal of Cerebral Blood Flow & Metabolism. 2007;27:1766-91. [CrossRef]
- Patching SG. Glucose Transporters at the Blood-Brain Barrier: Function, Regulation and Gateways for Drug Delivery. Molecular Neurobiology. 2017;54:1046-77. [CrossRef]
- Koepsell H. Glucose transporters in brain in health and disease. Pflügers Archiv - European Journal of Physiology. 2020;472:1299-343. [CrossRef]
- Leybaert L. Neurobarrier coupling in the brain: a partner of neurovascular and neurometabolic coupling? J Cereb Blood Flow Metab. 2005;25:2-16. [CrossRef]
- Leybaert L, De Bock M, Van Moorhem M, Decrock E, De Vuyst E. Neurobarrier coupling in the brain: Adjusting glucose entry with demand. Journal of Neuroscience Research. 2007;85:3213-20. [CrossRef]
- Barros LF, Porras OH, Bittner CX. Why glucose transport in the brain matters for PET. Trends in Neurosciences. 2005;28:117-9. [CrossRef]
- Barros LF, Bittner CX, Loaiza A, Porras OH. A quantitative overview of glucose dynamics in the gliovascular unit. Glia. 2007;55:1222-37. [CrossRef]
- Furler SM, Jenkins AB, Storlien LH, Kraegen EW. In vivo location of the rate-limiting step of hexose uptake in muscle and brain tissue of rats. Am J Physiol. 1991;261:E337-47. [CrossRef]
- Robinson PJ, Rapoport SI. Glucose transport and metabolism in the brain. Am J Physiol. 1986;250:R127-36. [CrossRef]
- Rothman DL, Dienel GA, Behar KL, Hyder F, DiNuzzo M, Giove F, et al. Glucose sparing by glycogenolysis (GSG) determines the relationship between brain metabolism and neurotransmission. J Cereb Blood Flow Metab. 2022;42:844-60. [CrossRef]
- Gruetter R, Novotny EJ, Boulware SD, Rothman DL, Shulman RG. 1H NMR studies of glucose transport in the human brain. J Cereb Blood Flow Metab. 1996;16:427-38. [CrossRef]
- Dienel GA, Cruz NF. Contributions of glycogen to astrocytic energetics during brain activation. Metabolic Brain Disease. 2015;30:281-98. [CrossRef]
- Tomlinson DR, Gardiner NJ. Glucose neurotoxicity. Nature Reviews Neuroscience. 2008;9:36-45. [CrossRef]
- Godbersen GM, Falb P, Klug S, Silberbauer LR, Reed MB, Nics L, et al. Non-invasive assessment of stimulation-specific changes in cerebral glucose metabolism with functional PET. Eur J Nucl Med Mol Imaging. 2024;51:2283-92. [CrossRef]
- Hu Y, Wilson GS. Rapid Changes in Local Extracellular Rat Brain Glucose Observed with an In Vivo Glucose Sensor. Journal of Neurochemistry. 1997;68:1745-52. [CrossRef]
- Chen W, Novotny EJ, Zhu XH, Rothman DL, Shulman RG. Localized 1H NMR measurement of glucose consumption in the human brain during visual stimulation. Proc Natl Acad Sci U S A. 1993;90:9896-900. [CrossRef]
- Fox PT, Raichle ME, Mintun MA, Dence C. Nonoxidative glucose consumption during focal physiologic neural activity. Science. 1988;241:462-4.
- Li B, Freeman RD. Neurometabolic coupling between neural activity, glucose, and lactate in activated visual cortex. J Neurochem. 2015;135:742-54. [CrossRef]
- Roche R, Salazar P, Martin M, Marcano F, Gonzalez-Mora JL. Simultaneous measurements of glucose, oxyhemoglobin and deoxyhemoglobin in exposed rat cortex. J Neurosci Methods. 2011;202:192-8. [CrossRef]
- Mann K, Deny S, Ganguli S, Clandinin TR. Coupling of activity, metabolism and behaviour across the Drosophila brain. Nature. 2021;593:244-8. [CrossRef]
- Hawkins RA, Mans AM, Davis DW, Hibbard LS, Lu DM. Glucose availability to individual cerebral structures is correlated to glucose metabolism. J Neurochem. 1983;40:1013-8. [CrossRef]
- Hargreaves RJ, Planas AM, Cremer JE, Cunningham VJ. Studies on the relationship between cerebral glucose transport and phosphorylation using 2-deoxyglucose. J Cereb Blood Flow Metab. 1986;6:708-16. [CrossRef]
- Phelps ME, Kuhl DE, Mazziota JC. Metabolic mapping of the brain’s response to visual stimulation: studies in humans. Science. 1981;211:1445-8.
- Vlassenko AG, Rundle MM, Mintun MA. Human brain glucose metabolism may evolve during activation: findings from a modified FDG PET paradigm. Neuroimage. 2006;33:1036-41.
- Mishra A, Reynolds JP, Chen Y, Gourine AV, Rusakov DA, Attwell D. Astrocytes mediate neurovascular signaling to capillary pericytes but not to arterioles. Nat Neurosci. 2016;19:1619-27. [CrossRef]
- Kleinfeld D, Mitra PP, Helmchen F, Denk W. Fluctuations and stimulus-induced changes in blood flow observed in individual capillaries in layers 2 through 4 of rat neocortex. Proceedings of the National Academy of Sciences. 1998;95:15741-6. [CrossRef]
- Vogel J, Kuschinsky W. Decreased Heterogeneity of Capillary Plasma Flow in the Rat Whisker-Barrel Cortex during Functional Hyperemia. Journal of Cerebral Blood Flow & Metabolism. 1996;16:1300-6. [CrossRef]
- Akgören N, Lauritzen M. Functional recruitment of red blood cells to rat brain microcirculation accompanying increased neuronal activity in cerebellar cortex. NeuroReport. 1999;10:3257.
- Barfod C, Akgoren N, Fabricius M, Dirnagl U, Lauritzen M. Laser-Doppler measurements of concentration and velocity of moving blood cells in rat cerebral circulation. Acta physiologica Scandinavica. 1997;160:123-32. [CrossRef]
- Barros LF, San Martín A, Ruminot I, Sandoval PY, Fernández-Moncada I, Baeza-Lehnert F, et al. Near-critical GLUT1 and Neurodegeneration. Journal of Neuroscience Research. 2017;95:2267-74. [CrossRef]
- Hasselbalch SG, Holm S, Pedersen HS, Svarer C, Knudsen GM, Madsen PL, et al. The (18)F-fluorodeoxyglucose lumped constant determined in human brain from extraction fractions of (18)F-fluorodeoxyglucose and glucose. J Cereb Blood Flow Metab. 2001;21:995-1002. [CrossRef]
- Fellows LK, Boutelle MG, Fillenz M. Extracellular brain glucose levels reflect local neuronal activity: a microdialysis study in awake, freely moving rats. J Neurochem. 1992;59:2141-7. [CrossRef]
- McNay EC, Fries TM, Gold PE. Decreases in rat extracellular hippocampal glucose concentration associated with cognitive demand during a spatial task. Proc Natl Acad Sci U S A. 2000;97:2881-5. [CrossRef]
- Barnes K, Ingram JC, Bennett MDM, Stewart GW, Baldwin SA. Methyl-beta-cyclodextrin stimulates glucose uptake in Clone 9 cells: a possible role for lipid rafts. Biochem J. 2004;378:343-51. [CrossRef]
- Caliceti C, Zambonin L, Prata C, Vieceli Dalla Sega F, Hakim G, Hrelia S, et al. Effect of plasma membrane cholesterol depletion on glucose transport regulation in leukemia cells. PLoS One. 2012;7:e41246. [CrossRef]
- Park M-S. Molecular Dynamics Simulations of the Human Glucose Transporter GLUT1. PLOS ONE. 2015;10:e0125361. [CrossRef]
- Mitrovic D, McComas SE, Alleva C, Bonaccorsi M, Drew D, Delemotte L. Reconstructing the transport cycle in the sugar porter superfamily using coevolution-powered machine learning. eLife. 2023;12:e84805. [CrossRef]
- Hamrahian AH, Zhang J-Z, Elkhairi FS, Prasad R, Ismail-Beigi F. Activation of Glut1 Glucose Transporter in Response to Inhibition of Oxidative Phosphorylation: Role of Sites of Mitochondrial Inhibition and Mechanism of Glut1 Activation. Archives of Biochemistry and Biophysics. 1999;368:375-9. [CrossRef]
- Barnes K, Ingram JC, Porras OH, Barros LF, Hudson ER, Fryer LGD, et al. Activation of GLUT1 by metabolic and osmotic stress: potential involvement of AMP-activated protein kinase (AMPK). Journal of Cell Science. 2002;115:2433-42. [CrossRef]
- Mercado CL, Loeb JN, Ismail-Beigi F. Enhanced glucose transport in response to inhibition of respiration in Clone 9 cells. American Journal of Physiology-Cell Physiology. 1989;257:C19-C28. [CrossRef]
- Yan Q, Lu Y, Zhou L, Chen J, Xu H, Cai M, et al. Mechanistic insights into GLUT1 activation and clustering revealed by super-resolution imaging. Proceedings of the National Academy of Sciences. 2018;115:7033-8. [CrossRef]
- Loaiza A, Porras OH, Barros LF. Glutamate Triggers Rapid Glucose Transport Stimulation in Astrocytes as Evidenced by Real-Time Confocal Microscopy. Journal of Neuroscience. 2003;23:7337-42. [CrossRef]
- Cornford EM, Nguyen EV, Landaw EM. Acute upregulation of blood-brain barrier glucose transporter activity in seizures. American Journal of Physiology-Heart and Circulatory Physiology. 2000;279:H1346-H54. [CrossRef]
- Shetty M, Loeb JN, Vikstrom K, Ismail-Beigi F. Rapid activation of GLUT-1 glucose transporter following inhibition of oxidative phosphorylation in clone 9 cells. Journal of Biological Chemistry. 1993;268:17225-32. [CrossRef]
- Biswal B, Yetkin FZ, Haughton VM, Hyde JS. Functional connectivity in the motor cortex of resting human brain using echo-planar MRI. Magn Reson Med. 1995;34:537-41.
- Fox MD, Snyder AZ, Vincent JL, Corbetta M, Van Essen DC, Raichle ME. The human brain is intrinsically organized into dynamic, anticorrelated functional networks. Proc Natl Acad Sci U S A. 2005;102:9673-8.
- Fox MD, Raichle ME. Spontaneous fluctuations in brain activity observed with functional magnetic resonance imaging. Nature Reviews Neuroscience. 2007;8:700-11.
- Margulies DS, Ghosh SS, Goulas A, Falkiewicz M, Huntenburg JM, Langs G, et al. Situating the default-mode network along a principal gradient of macroscale cortical organization. Proc Natl Acad Sci U S A. 2016;113:12574-9. [CrossRef]
- Smith SM, Fox PT, Miller KL, Glahn DC, Fox PM, Mackay CE, et al. Correspondence of the brain’s functional architecture during activation and rest. Proc Natl Acad Sci U S A. 2009;106:13040-5. [CrossRef]
- Horwitz B, Duara R, Rapoport SI. Intercorrelations of glucose metabolic rates between brain regions: application to healthy males in a state of reduced sensory input. J Cereb Blood Flow Metab. 1984;4:484-99. [CrossRef]
- McIntosh AR, Grady CL, Ungerleider LG, Haxby JV, Rapoport SI, Horwitz B. Network analysis of cortical visual pathways mapped with PET. J Neurosci. 1994;14:655-66.
- Sala A, Lizarraga A, Caminiti SP, Calhoun VD, Eickhoff SB, Habeck C, et al. Brain connectomics: time for a molecular imaging perspective? Trends Cogn Sci. 2023;27:353-66. [CrossRef]
- Hahn A, Reed MB, Milz C, Falb P, Murgas M, Lanzenberger R. A unified approach for identifying PET-based neuronal activation and molecular connectivity with the functional PET toolbox. J Cereb Blood Flow Metab. 2025:271678X251370831. [CrossRef]
- Reed MB, Ponce de Leon M, Vraka C, Rausch I, Godbersen GM, Popper V, et al. Whole-body metabolic connectivity framework with functional PET. Neuroimage. 2023;271:120030. [CrossRef]
- Deery HA, Liang E, Moran C, Egan GF, Jamadar SD. Metabolic connectivity has greater predictive utility for age and cognition than functional connectivity. bioRxiv. 2024:2024.08.15.608184. [CrossRef]
- Raichle ME. The restless brain. Brain Connect. 2011;1:3-12. [CrossRef]
- Hu Y, Wilson GS. A Temporary Local Energy Pool Coupled to Neuronal Activity: Fluctuations of Extracellular Lactate Levels in Rat Brain Monitored with Rapid-Response Enzyme-Based Sensor. Journal of Neurochemistry. 1997;69:1484-90. [CrossRef]
- Dienel GA. Lack of appropriate stoichiometry: Strong evidence against an energetically important astrocyte–neuron lactate shuttle in brain. Journal of Neuroscience Research. 2017;95:2103-25. [CrossRef]
- Winkler EA, Nishida Y, Sagare AP, Rege SV, Bell RD, Perlmutter D, et al. GLUT1 reductions exacerbate Alzheimer’s disease vasculo-neuronal dysfunction and degeneration. Nature Neuroscience. 2015;18:521-30. [CrossRef]
- Erickson MA, Banks WA. Blood–Brain Barrier Dysfunction as a Cause and Consequence of Alzheimer’s Disease. Journal of Cerebral Blood Flow & Metabolism. 2013;33:1500-13. [CrossRef]
- Szablewski L. Glucose Transporters in Brain: In Health and in Alzheimer’s Disease. Journal of Alzheimer’s Disease. 2017;55:1307-20. [CrossRef]
- Zhang S, Lachance BB, Mattson MP, Jia X. Glucose metabolic crosstalk and regulation in brain function and diseases. Progress in Neurobiology. 2021;204:102089. [CrossRef]
- Kahl KG, Georgi K, Bleich S, Muschler M, Hillemacher T, Hilfiker-Kleinert D, et al. Altered DNA methylation of glucose transporter 1 and glucose transporter 4 in patients with major depressive disorder. Journal of Psychiatric Research. 2016;76:66-73. [CrossRef]
- Cunnane SC, Trushina E, Morland C, Prigione A, Casadesus G, Andrews ZB, et al. Brain energy rescue: an emerging therapeutic concept for neurodegenerative disorders of ageing. Nature Reviews Drug Discovery. 2020;19:609-33. [CrossRef]
- Hahn A, Reed MB, Pichler V, Michenthaler P, Rischka L, Godbersen MG, et al. Functional dynamics of dopamine synthesis during monetary reward and punishment processing. J Cereb Blood Flow Metab. 2021;41:2973-85.
- Hahn A, Reed MB, Murgas M, Vraka C, Klug S, Schmidt C, et al. Dynamics of human serotonin synthesis differentially link to reward anticipation and feedback. Mol Psychiatry. 2024. [CrossRef]
- del Amo EM, Urtti A, Yliperttula M. Pharmacokinetic role of L-type amino acid transporters LAT1 and LAT2. Eur J Pharm Sci. 2008;35:161-74. [CrossRef]
- Zaragoza R. Transport of Amino Acids Across the Blood-Brain Barrier. Frontiers in physiology. 2020;11:973. [CrossRef]
- Muzik O, Chugani DC, Chakraborty P, Mangner T, Chugani HT. Analysis of [C-11]alpha-methyl-tryptophan kinetics for the estimation of serotonin synthesis rate in vivo. J Cereb Blood Flow Metab. 1997;17:659-69. [CrossRef]
- Delescluse J, Simonnet MM, Ziegler AB, Piffaretti K, Alves G, Grosjean Y, et al. A LAT1-Like Amino Acid Transporter Regulates Neuronal Activity in the Drosophila Mushroom Bodies. Cells. 2024;13. [CrossRef]
- Hery F, Simonnet G, Bourgoin S, Soubrie P, Artaud F, Hamon M, et al. Effect of nerve activity on the in vivo release of [3H]serotonin continuously formed from L-[3H]tryptophan in the caudate nucleus of the cat. Brain Res. 1979;169:317-34.
- Hamon M, Bourgoin S, Artaud F, Glowinski J. The role of intraneuronal 5-HT and of tryptophan hydroxylase activation in the control of 5-HT synthesis in rat brain slices incubated in K+-enriched medium. J Neurochem. 1979;33:1031-42.
- Morgenroth VH, 3rd, Boadle-Biber M, Roth RH. Tyrosine hydroxylase: activation by nerve stimulation. Proc Natl Acad Sci U S A. 1974;71:4283-7.
- Neff NH, Hadjiconstantinou M. Aromatic L-amino acid decarboxylase modulation and Parkinson’s disease. Prog Brain Res. 1995;106:91-7.
- Silberbauer LR, Reed MB, Gryglewski G, Murgaš M, Nics L, Godbersen MG, et al. Acute effects of selective serotonin reuptake inhibitors on cerebral glucose metabolism and blood flow. Translational Psychiatry. 2025;Epub ahead of print.
Figure 1.
Schematic description of the irreversible two-tissue compartment model, i.e., k4 = 0. Similar to glucose, the radiotracer [18F]FDG crosses the blood-brain barrier (BBB) via facilitated transport by the glucose transporter 1 (GLUT1, 55 kDa), described by rate constants K1 and k2. The uptake mechanism is in contrast to most other radiotracers, which cross the BBB via passive diffusion. Within the brain interstitium (unmetabolized compartment), glucose and [18F]FDG are taken up by neurons (GLUT3) and astrocytes (GLUT1, 45 kDA). Within the cells they are subsequently metabolized by hexokinase (k3). The italic variables at the bottom refer to those of Eq. 2, being the concentration of glucose in plasma ([GlucPlasma]) and brain ([GlucBrain]), as well as the maximum (Tmax) and actual transport rate of glucose (TGluc) across the BBB.
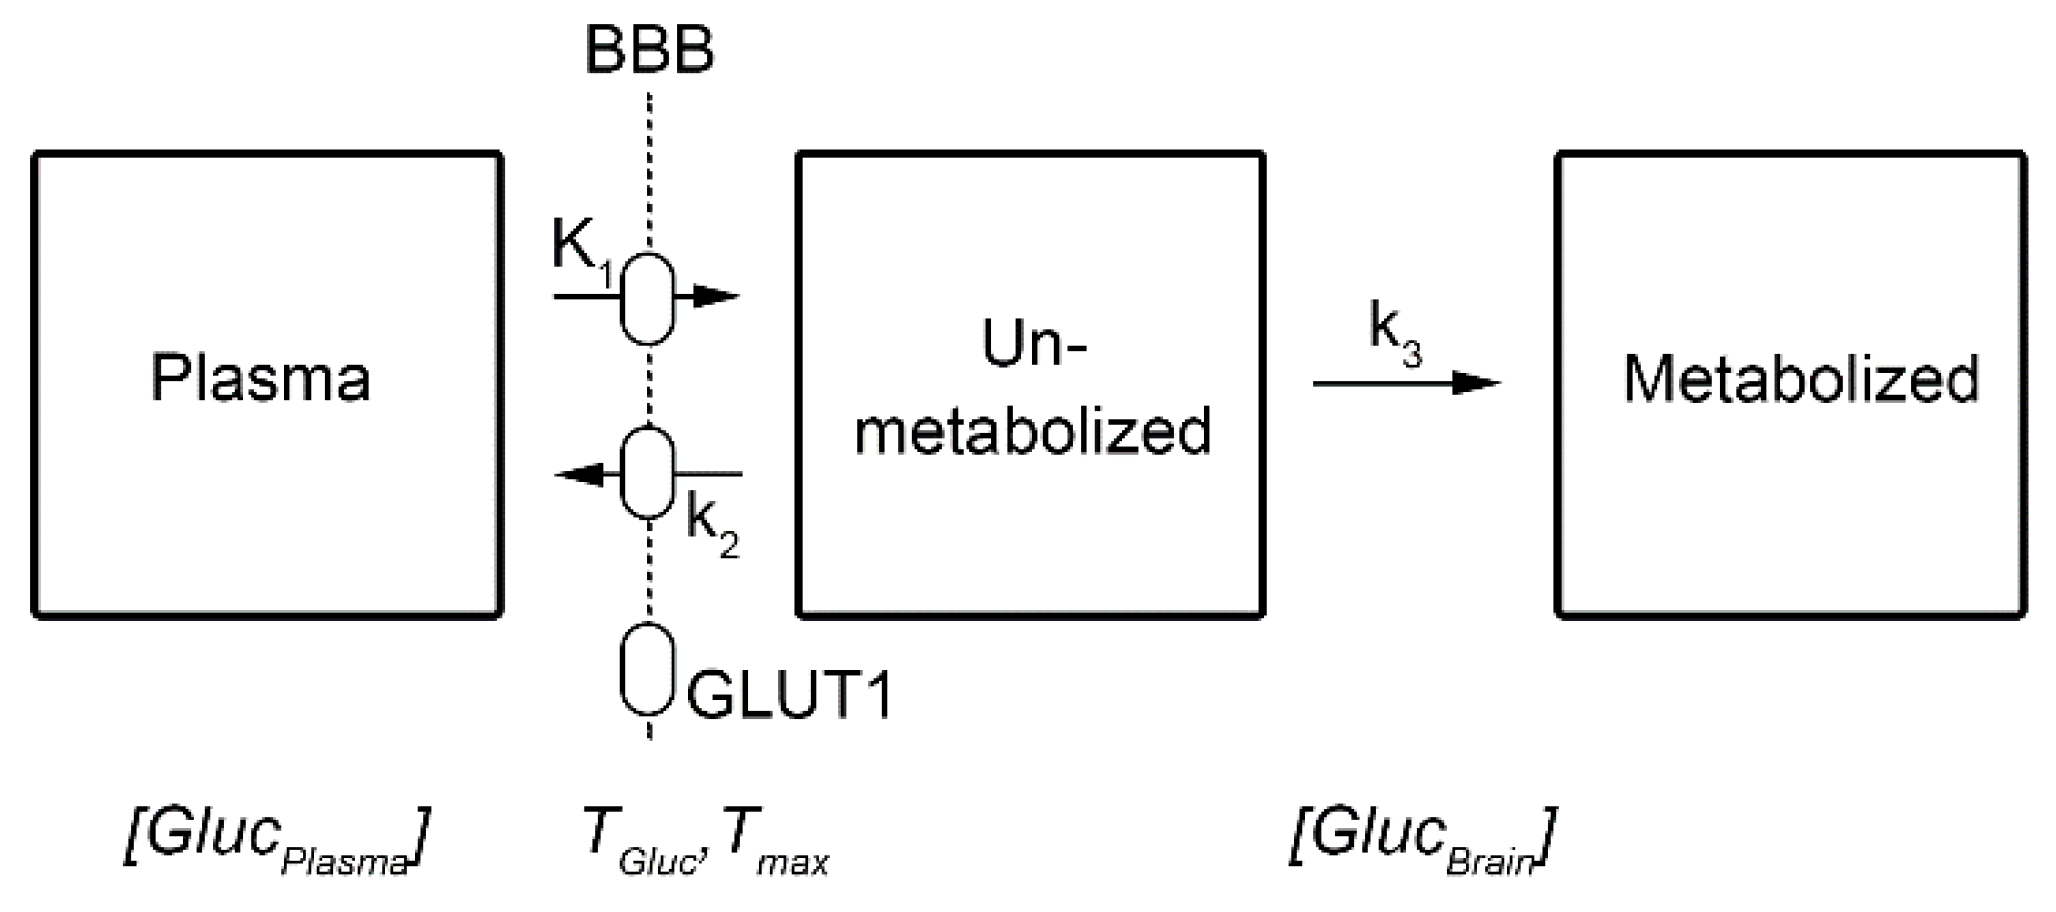
Figure 2.
Simulated and experimentally observed changes in the [18F]FDG signal upon neuronal activation. Simulations comprised changes in individual rate constants alone (dark blue, red, orange) as well as combinations thereof (green, purple, light blue). All time courses represent stimulation-specific effects, i.e., after removing baseline radiotracer uptake, and were normalized by baseline radiotracer uptake. a) Simulated increases in individual rate constants indicate that changes in K1 (dark blue) and k2 (red) lead to instant, near-linear changes in the fPET signal with subsequent return to baseline, whereas changes elicited by k3 (orange) require more time to take effect. b) Combinations of changes in K1 and k3 (purple) or K1, k2 and k3 (light blue) were simulated to obtain a ramp function, that is typically used to model task-specific changes in glucose metabolism (dashed green line in (c)) [6]. Interestingly, changes in K1 and k2 alone (i.e., without changing k3, green) resulted in a considerably different shape which is not compatible with experimental data, although such changes would mathematically be sufficient to yield changes in overall Ki. c) Experimentally observed changes in the [18F]FDG fPET signal (black) show a rapid increase during the task, which returned to baseline when stimulation ceases [9]. None of the individual rate constants (a) were able to explain the experimentally observed signal changes, but only their combination which included changes in k3 (b) yielded a comparable effect. Task duration for simulations and experimental data was from 0 to 36 s (grey box). See section simulation for corresponding parameter settings.
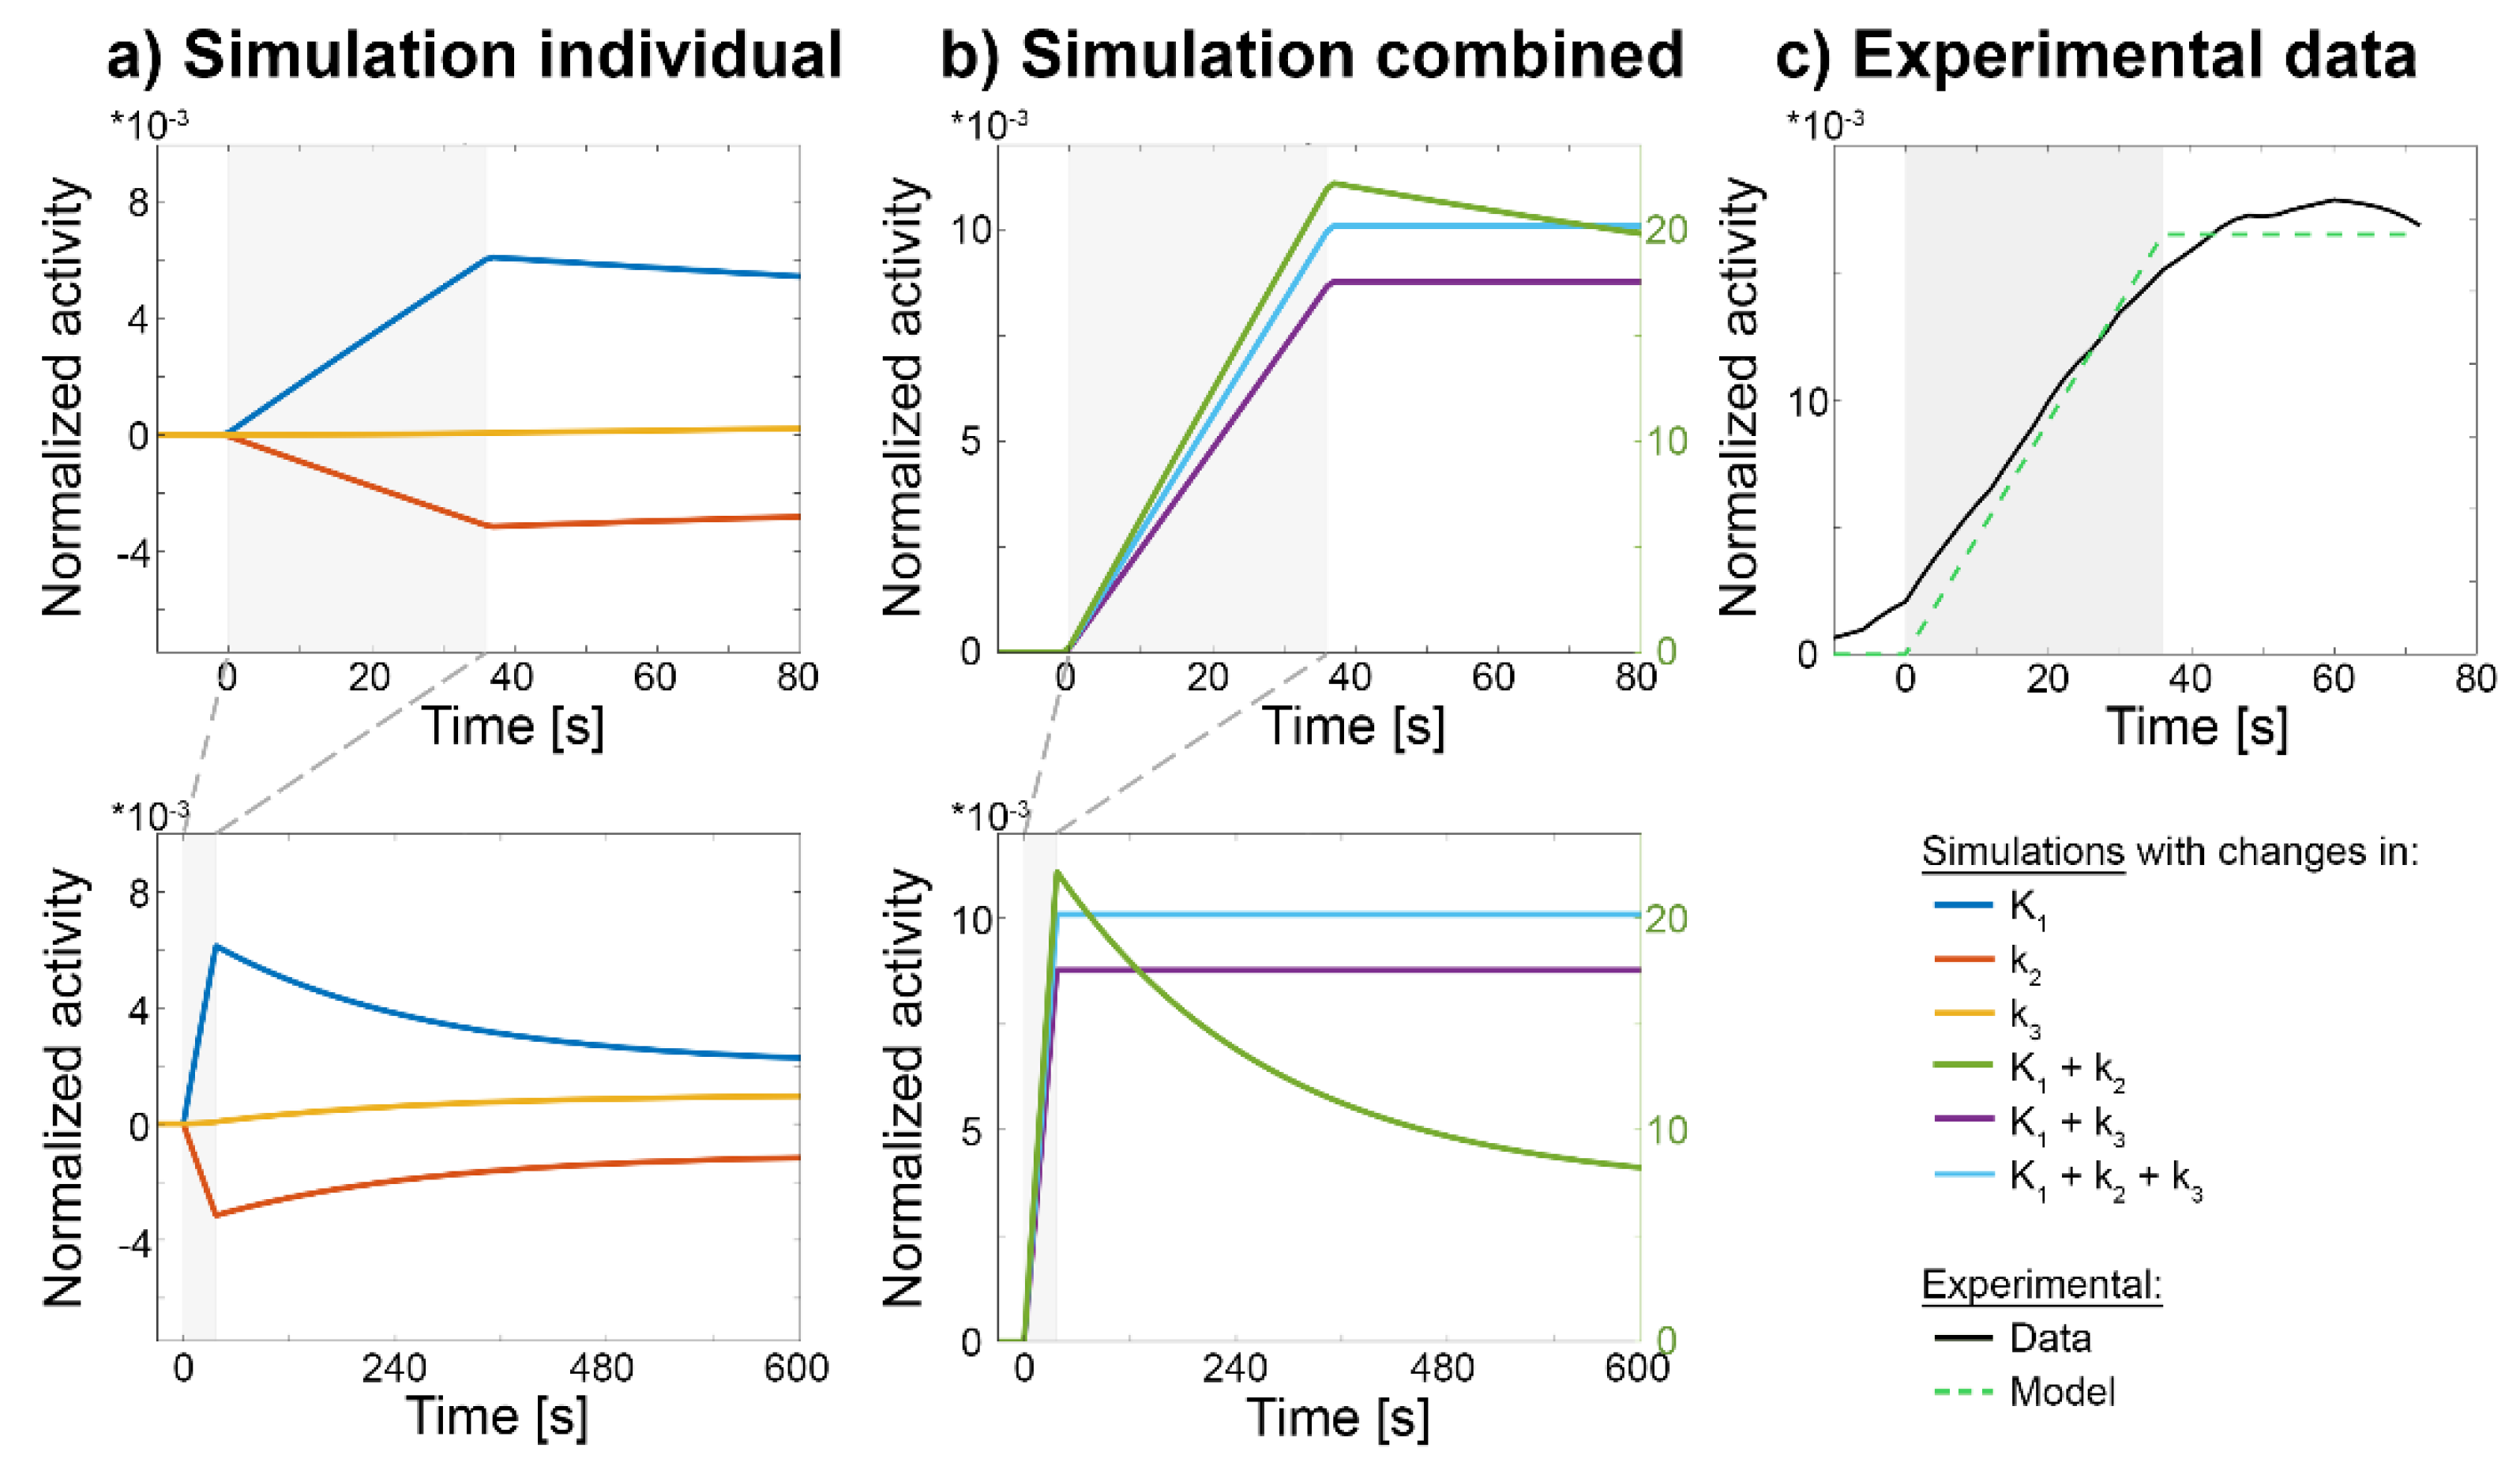
Figure 3.
Candidate mechanisms contributing to increased glucose metabolism upon neuronal activation via increased glucose supply across the BBB. Based on experimental data [6,24,30,34,35,36,52,53], a 20-25% increase in regional glucose metabolism from baseline was assumed to be representative, which is distributed as follows. Cerebral blood flow plays only a minor role (2.5%, red) for stimulation induced effects, due to the low extraction fraction of glucose from blood. The largest part (14%, green) can be explained by an increased glucose concentration gradient from blood to brain. The remaining 3.5-8.5% can be ascribed to alterations of the intrinsic properties in GLUT1, such as conformational changes, unmasking of available molecules and decomposition of GLUT1 clusters into singular molecules. Since an increase in the number of GLUT1 molecules at the BBB occurs only after minutes or hours, this mechanism is not considered to be relevant for rapid changes in glucose metabolism. Notably, BBB changes are here assumed to equally translate into CMRGlu changes, as suggested previously [27]. Even if the assumption may not hold, the ratio between the different mechanisms may remain at a similar scale.
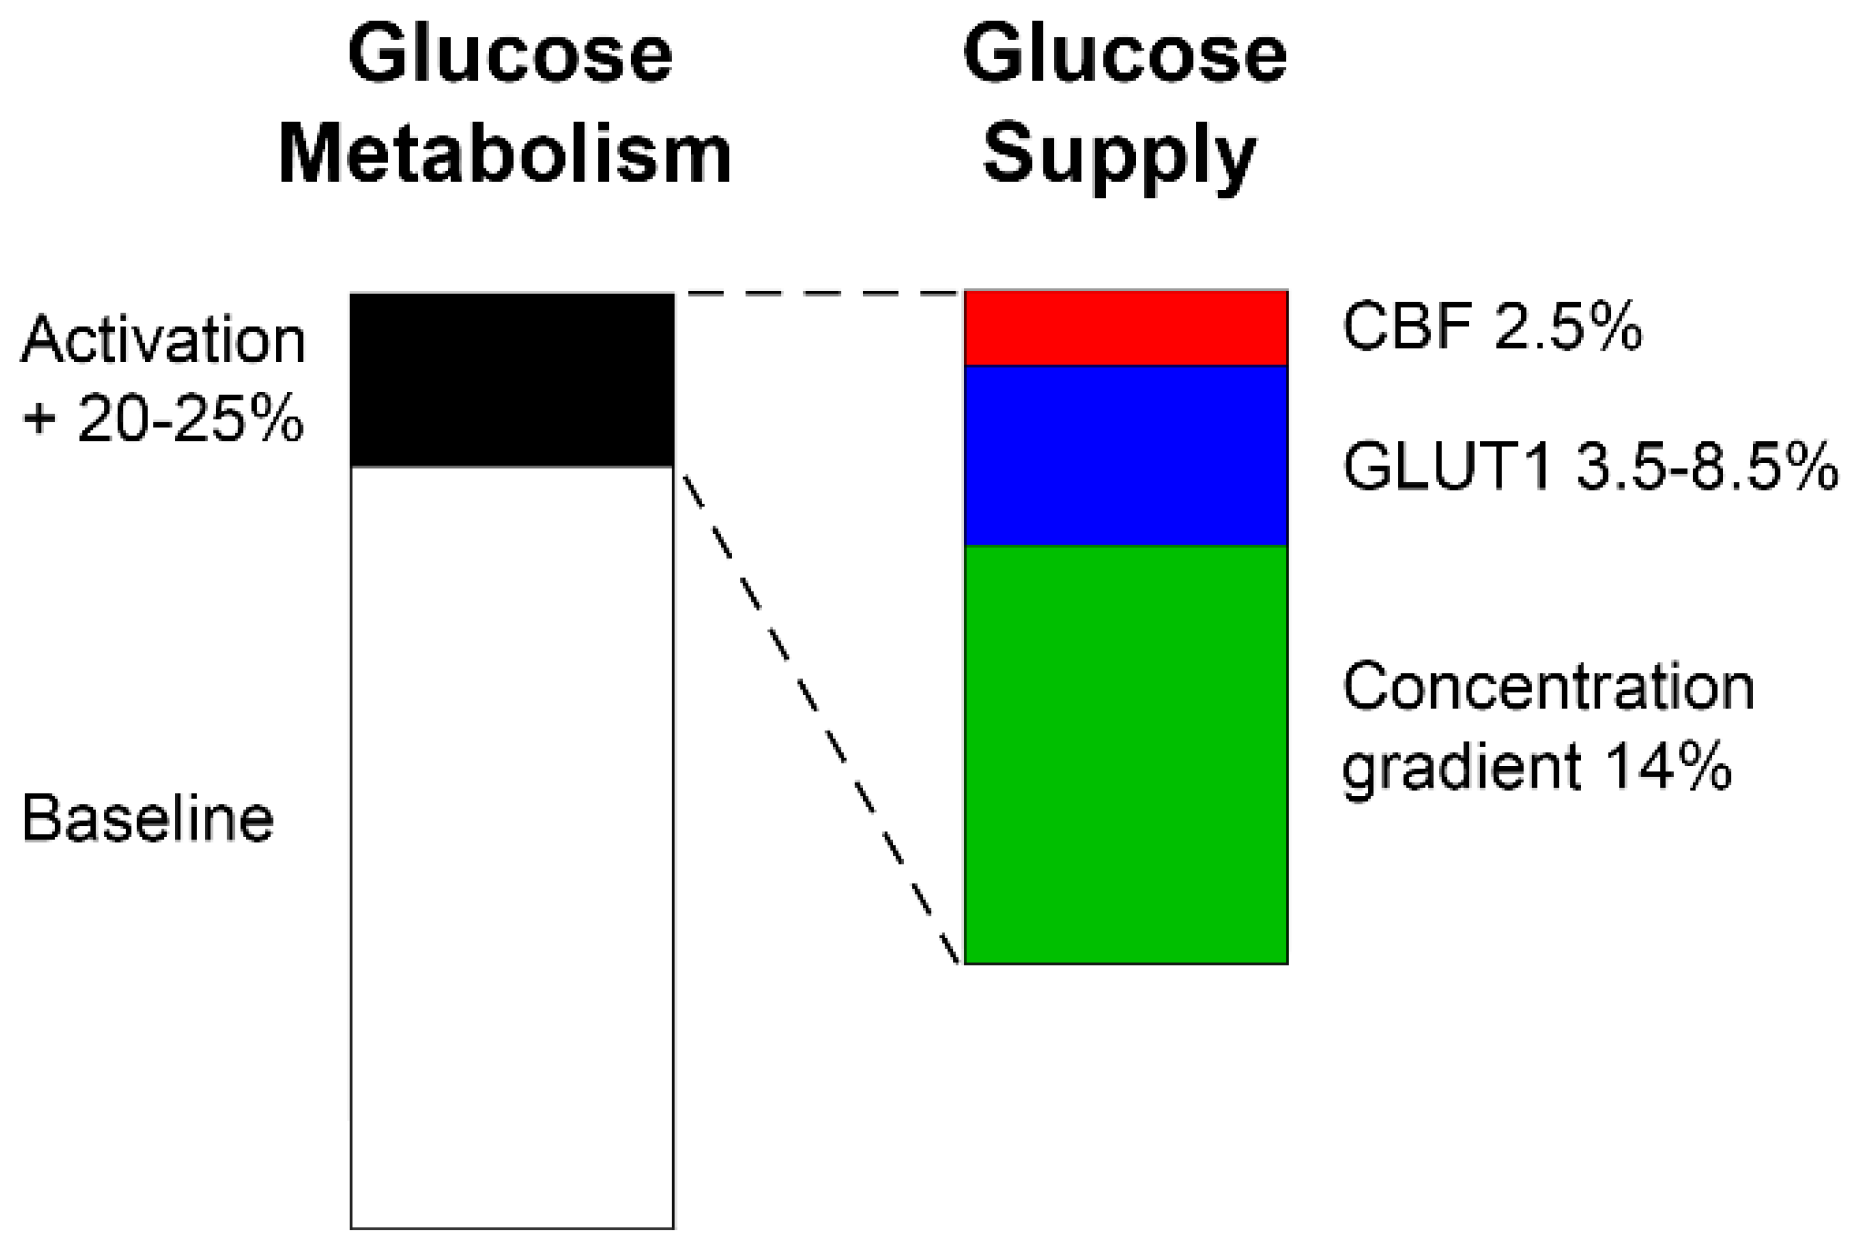
Figure 4.
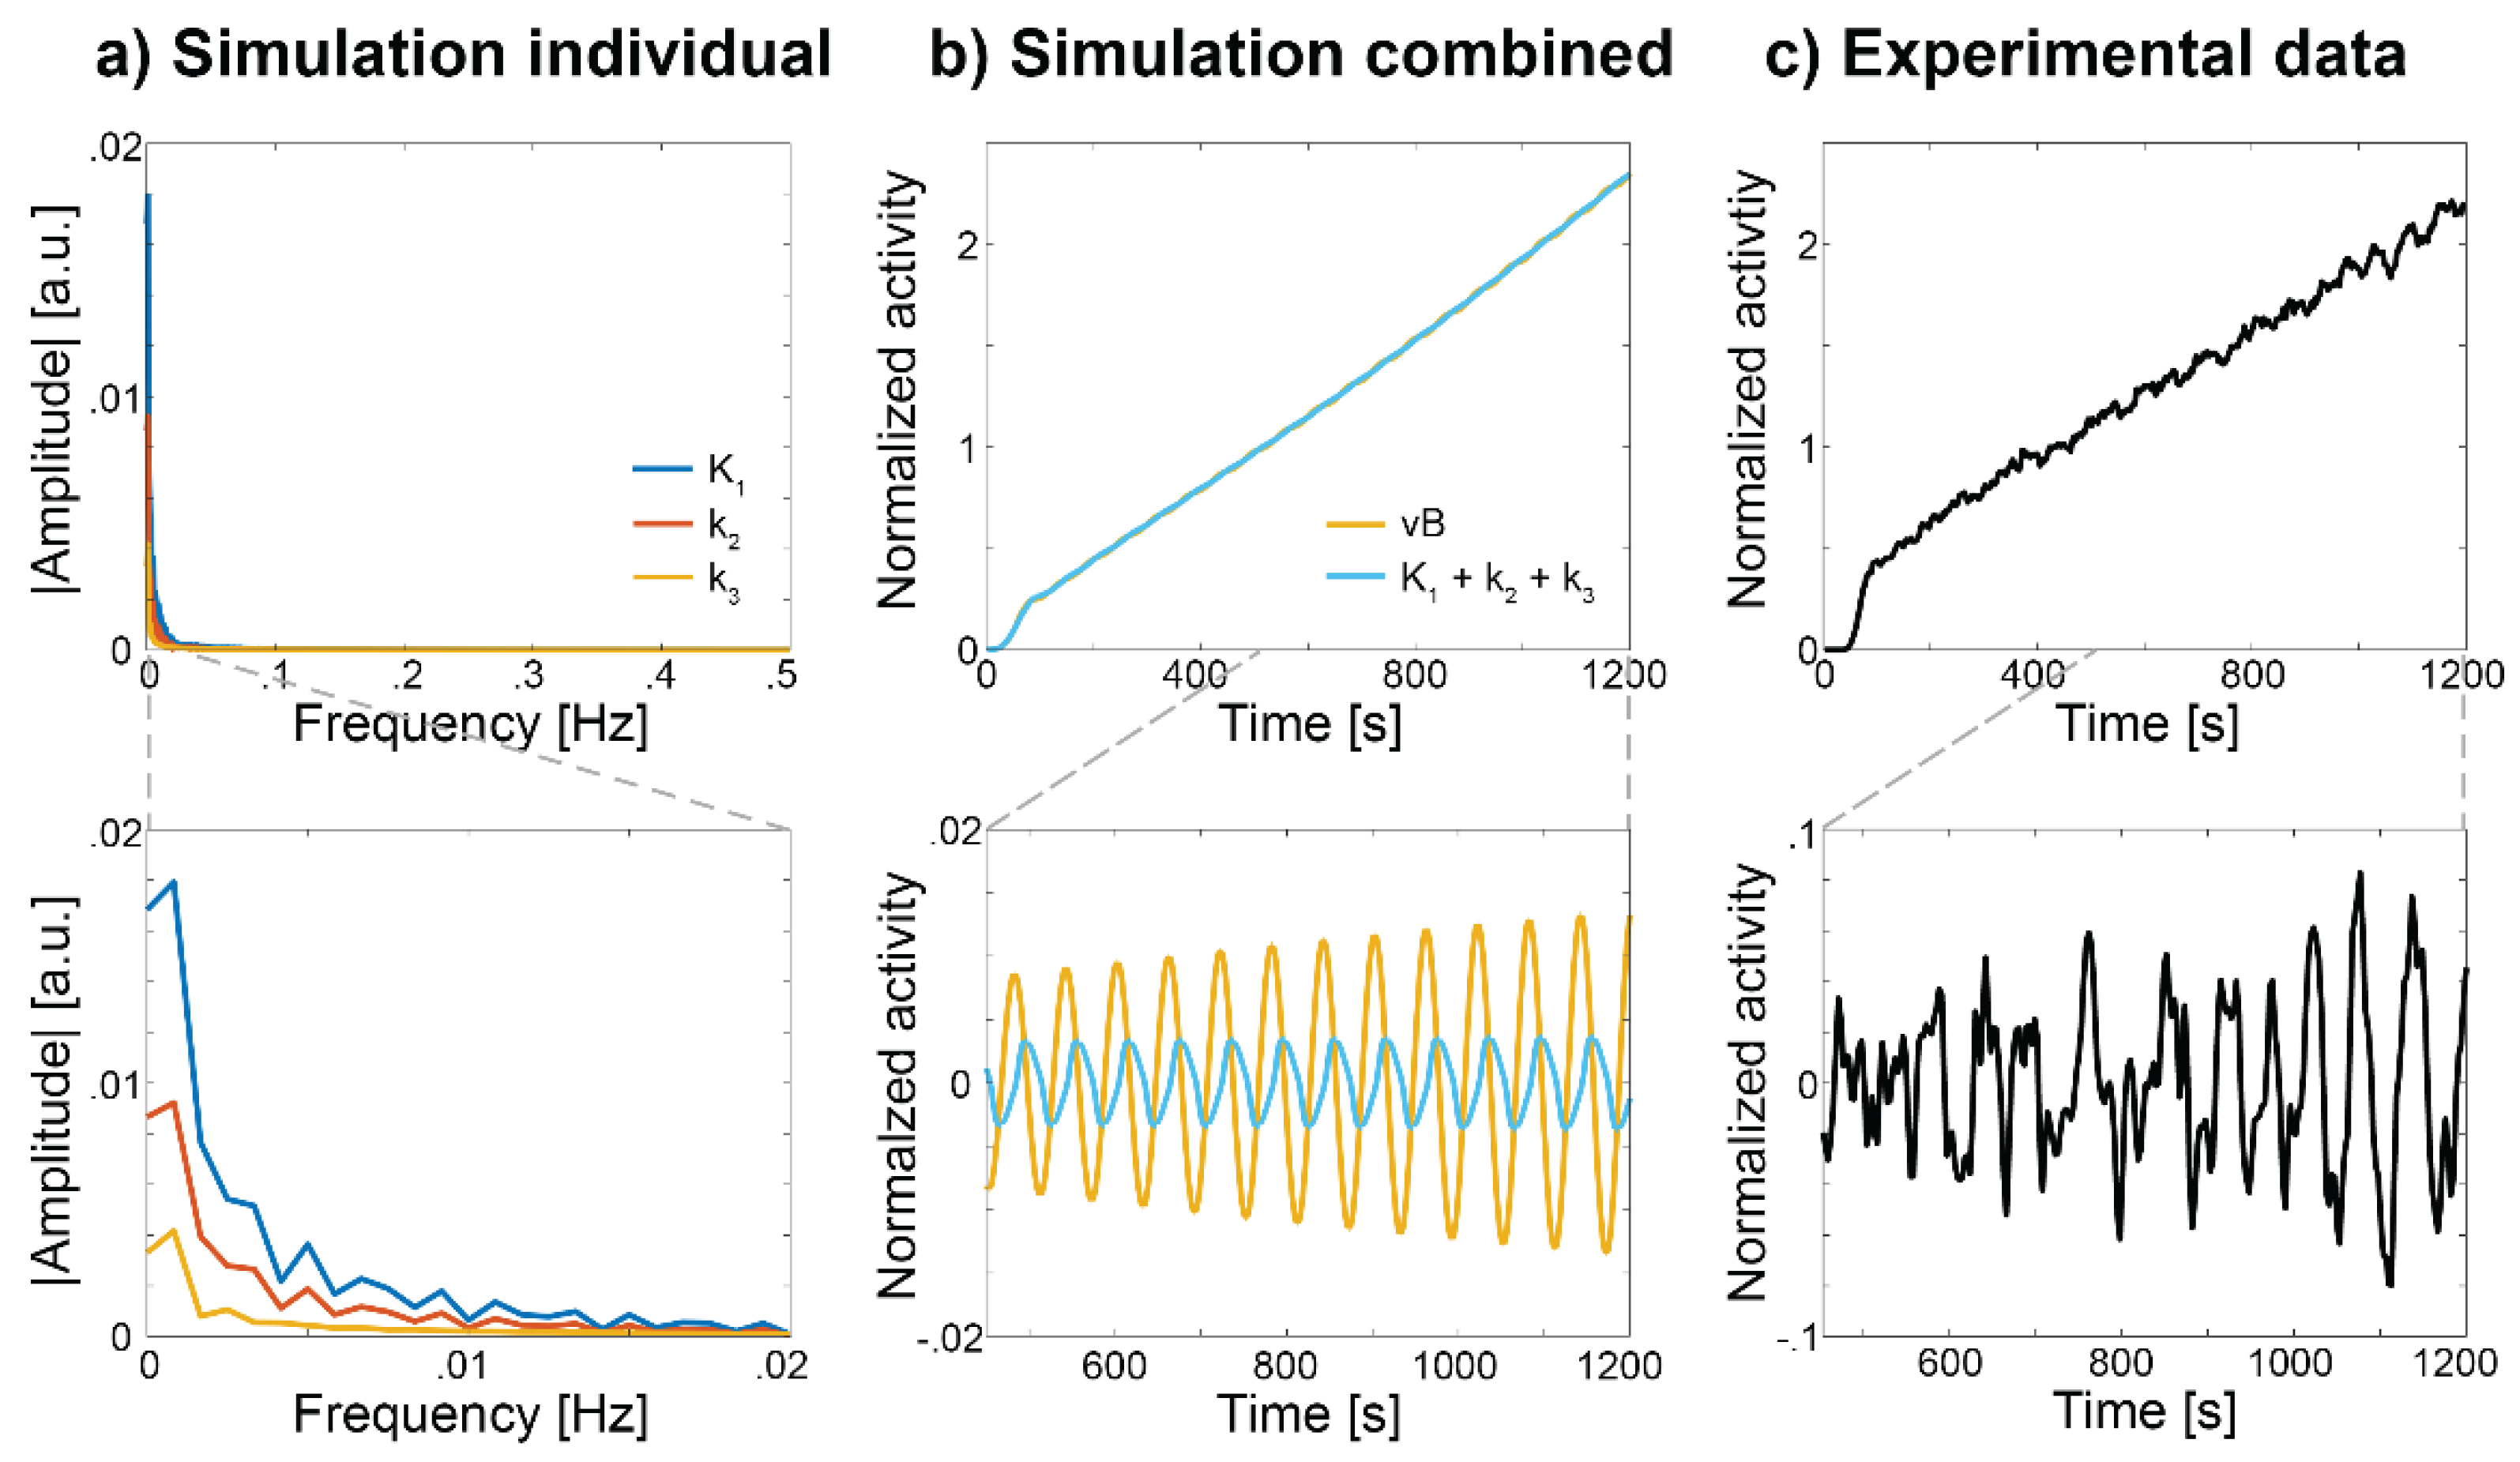
Simulated and experimentally observed changes in the [18F]FDG signal at resting state. a) Frequency spectra of stimulation-specific changes in the TACs after simulated increases in individual rate constants as shown in Figure 2a (i.e., after removing baseline radiotracer uptake). The excerpt (lower panel) indicates that changes in K1 (dark blue) and to some extent k2 (red) comprise frequency components beyond 0.01 Hz, but not k3 (orange). b) Combined changes in K1, k2 and k3 (light blue) exhibit oscillating changes on top of a steady baseline uptake. Rate constants were changed at the same ratio as in Figure 2b (light blue). After applying a bandpass filter these oscillating changes remain (lower panel). Of note, omitting changes in k3 in this simulation showed virtually identical results, indicating that k3 does not contribute to these changes. Such oscillatory fluctuations were also obtained when varying the blood volume component vB in the 2TCM (orange), indicating that CBF indeed plays a relevant role for resting-state metabolic fluctuations. However, the exact ratio of contributions between changes in rate constants and CBF still remains unknown and as such the amplitudes may change. c) Experimentally observed changes in the [18F]FDG fPET signal of a representative subject [95]. Application of a bandpass filter leaves oscillating changes also for experimental data (lower panel), which represent the basis for molecular connectivity.
Figure 4.
Simulated and experimentally observed changes in the [18F]FDG signal at resting state. a) Frequency spectra of stimulation-specific changes in the TACs after simulated increases in individual rate constants as shown in Figure 2a (i.e., after removing baseline radiotracer uptake). The excerpt (lower panel) indicates that changes in K1 (dark blue) and to some extent k2 (red) comprise frequency components beyond 0.01 Hz, but not k3 (orange). b) Combined changes in K1, k2 and k3 (light blue) exhibit oscillating changes on top of a steady baseline uptake. Rate constants were changed at the same ratio as in Figure 2b (light blue). After applying a bandpass filter these oscillating changes remain (lower panel). Of note, omitting changes in k3 in this simulation showed virtually identical results, indicating that k3 does not contribute to these changes. Such oscillatory fluctuations were also obtained when varying the blood volume component vB in the 2TCM (orange), indicating that CBF indeed plays a relevant role for resting-state metabolic fluctuations. However, the exact ratio of contributions between changes in rate constants and CBF still remains unknown and as such the amplitudes may change. c) Experimentally observed changes in the [18F]FDG fPET signal of a representative subject [95]. Application of a bandpass filter leaves oscillating changes also for experimental data (lower panel), which represent the basis for molecular connectivity.
Disclaimer/Publisher’s Note: The statements, opinions and data contained in all publications are solely those of the individual author(s) and contributor(s) and not of MDPI and/or the editor(s). MDPI and/or the editor(s) disclaim responsibility for any injury to people or property resulting from any ideas, methods, instructions or products referred to in the content. |
© 2025 by the authors. Licensee MDPI, Basel, Switzerland. This article is an open access article distributed under the terms and conditions of the Creative Commons Attribution (CC BY) license (http://creativecommons.org/licenses/by/4.0/).
Copyright: This open access article is published under a Creative Commons CC BY 4.0 license, which permit the free download, distribution, and reuse, provided that the author and preprint are cited in any reuse.


