1. Introduction
The gastrointestinal microbiome in cystic fibrosis (CF) demonstrates marked differences compared to healthy subjects from an early age [
1]. A significantly altered composition of the gut microbiome [
2,
3] influences functionality [
1,
3], delays maturation [
4,
5] and contributes to a persistent, inflammatory state [
4]. Improved life expectancy in CF patients, resulting from therapeutic advancements, has contributed to rising diagnoses of concomitant disorders, including gastrointestinal malignancy [
6]. Individuals with CF harbour around 10 times the risk of developing colon cancer, and earlier onset of cancer, when compared to the general population [
6,
7]. Crucially, gut dysbiosis and increased inflammation is both present in CF and implicated in the development of colorectal cancer (CRC), suggesting these factors may play a role in CF-related CRC.
The gut microbiome itself becomes established and is stable from age four into adulthood [
8]. However, an altered intestinal milieu is present in CF from early childhood. Therefore, there is reason to consider that the physiological steps which prime CF patients to develop CRC may be identifiable in childhood. Children with CF (cwCF) demonstrate significantly increased abundance of
Escherichia coli (
E. coli) in the gut [
1,
9]. While
E. coli is commensal, some strains may cause pathology, particularly in vulnerable gastrointestinal environments like that of people with CF [
10].
E.
coli derived from the B2 phylogenetic group can produce colibactin, a genotoxic chemical compound, through expression of a polyketide synthesis (
pks) locus [
11]. By inducing deoxy-ribonucleic acid (DNA) damage and cell cycle arrest, colibactin promotes colon tumour growth, and modifies the tumour microenvironment [
12].
Colibactin is strongly implicated in CRC in non-CF populations and has demonstrated causative links to microbial dysbiosis and intestinal inflammation [
12,
13]. Together, this suggests
pks+ E. coli may be overrepresented in CF. However, no studies have investigated a potential role of colibactin in CF-related gut changes. Isolation of colibactin for research purposes is difficult due to chemical instability and the fact it is produced in incredibly small quantities [
14]. To counter this, previous research methods have focused on the
pks island and its regulation of colibactin production, to characterise potential genotoxic ability and therapeutic potential [
15].
In this study, we aimed to investigate differences in pks island expression, as a proxy for colibactin, between cwCF and HC, and within cwCF over time. We also investigated inflammation and microbial diversity within the CF gut, and potential associations between pks expression, gut inflammation and dysbiosis.
2. Materials and Methods
Study Design
CwCF were recruited from the CF clinic at Sydney Children’s Hospital (SCH) Randwick, an Australian tertiary paediatric hospital, as part of the ‘Evaluating the Alimentary and Respiratory Tracts in Health and Disease’ (EARTH) research programme [
16]. HC children were recruited from advertisement, word-of-mouth, and outpatient clinics (e.g., healthy children from the fracture clinic). Inclusion criteria into the EARTH programme has been previously outlined in the EARTH protocol [
16]. Three consecutive stool samples, collected at separate timepoints spaced approximately six months apart were required for inclusion in longitudinal analysis. The EARTH research programme was approved by the South-Eastern Sydney Area Health Service, Human Research Ethics Committee, Sydney, Australia. Ethics number: HREC/18/SCHN/26 and 2019/ETH05421.
DNA Extraction and Sequencing
The DNA was extracted following manufacturer instructions from homogenised stool samples using the QIAamp DNA Mini Kit (Qiagen, Germantown, Maryland, USA), as utilised by Nielsen et al. [
17]. The 16s rRNA gene amplicon sequencing was performed at the Ramaciotti Centre for Genomics, University of New South Wales on the Illumina MiSeq platform (v3, 2 × 300 bp). Sequences were quality filtered, clustered into unique zero-distance operation taxonomic units (zOTUs), and classified as described by Coffey et al. [
1].
Faecal Calprotectin
Faecal calprotectin was measured to assess presence of intestinal inflammation, using the BÜHLMANN fCAL ELISA kit (BÜHLMANN Laboratories AG, Schönenbuch, Switzerland), as validated by Garnett et al. [
18].
Identification of E. coli and pks-Producing E. coli
Polymerase chain reaction (PCR) was performed to screen faecal DNA samples for pks+ E. coli. Detection of pks+ bacterial DNA involved the amplification of a 283 bp sequence in the gene clbB, part of the pks island, with the following primer set: forward primer
5’-GCGCATCCTCAAGAGTAAATA- 3’, reverse primer
5’ -GCGCTCTATGCTCATCAACC-3’ [
19]. To confirm the presence of
E. coli specific
pks+, samples were also screened for
E. coli, via amplification of a primer set universal for the
E. coli specific gene
UidA: forward primer 5’-AAAACGGCAAGAAAAAGCAG-3’, reverse primer 5’–ACGCGTGGTTACAGTCTTGCG-3’ [
20]. Samples were considered as
pks+ E. coli positive if they were positive for the
clbB and
UidA gene cluster on PCR.
Invitrogen® Super Mix (Invitrogen/Thermo Fisher Scientific, 10572014) and Invitrogen® Platinum™ II Hot-Start Green PCR Master Mix (2X) (Invitrogen/Thermo Fisher Scientific, 14001014) were used for the PCR reactions. DNA from pks+ E. coli, isolated from Mutaflor® Escherichia coli strain Nissle 1917 (Mutaflor, 123456), was used as a positive control, while a negative control was prepared by substituting the DNA with nuclease free water. The final volume of the PCR reactions was 25 μl, consisting of 22.5 μl of Invitrogen® Super Mix or Invitrogen® Platinum™ II Hot-Start Green PCR Master Mix (2X), 0.5 μl of each primer (forward and reverse) and 1.5 μl of the isolated stool sample DNA. Amplification was performed using a SimpliAmp™ Thermal Cycler (Applied Biosystems/Thermo Fisher Scientific, Waltham, Massachusetts, USA) (94°C for 2 minutes, followed by 35 cycles of 94°C for 15 seconds, 58.5°C for 15 seconds, 72°C for 60 seconds, then a final holding step at 4°C). The products were visualized and evaluated on a prepared 1% agarose gel containing SYBR® Safe DNA gel stain (Invitrogen/Thermo Fisher Scientific, S33102).
Statistical Analysis
Statistical analysis was performed with the use of RStudio v2023.03.0+386. Diagnostic differences in
pks+ E.
coli prevalence between cohorts were compared with Fisher’s Exact test and described as percentages. Continuous variables were described by mean and standard deviation (SD) and compared through paired Student’s t-tests. Statistical significance was reported at the 5% significance level. Alpha diversity was reported using two metrics: Richness - a measure of unique zOTUs - and Shannon diversity index - a measure of species abundance and evenness. Linear mixed models were constructed to control for age and gender when comparing continuous variables in longitudinal data. Permutational multivariate analysis of variance (PERMANOVA) tests (permutations = 1000) were utilised to test if beta diversity was significantly different between groups (‘CF versus HC’ and “Timepoint 1‘ versus ‘Timepoint 2’ versus ‘Timepoint 3’) and for age and gender using the vegan function adonis2 [
21]. Graphs were generated using ggplot2 in R [
22]. Differences in the proportion of
pks prevalence between groups were determined using Pearson’s chi-squared test for independence. Microbial alpha diversity and phylogeny-based beta diversity were calculated with a dataset subsampled to 33839 and 13497 sequences per sample for baseline and longitudinal analysis respectively.
3. Results
Demographics
The study involved 55 children with CF and 55 HC [
16]. Both the CF and HC group were comprised of 26 males (47%). The mean (SD) age of CF patients and HC was 7.7 years (5.1), and 7.8 years (5.0) respectively, p = 0.17. Among the CF patients, 48 patients (87%) were pancreatic insufficient. Anthropometric z scores for our CF cohort were also calculated based on WHO regression data for the general paediatric population and are presented in
Table 1A. The CF subgroup (n = 23) included for longitudinal analysis was comprised of 10 males and 13 females. The mean (SD) age at each timepoint was 7.0 years (4.2), 7.8 years (4.2) and 8.8 years (3.9) for timepoints 1, 2 and 3 respectively. Of this subset, 19 patients (83%) were pancreatic insufficient (
Table 1B).
Table 1.
Demographics for cross-sectional comparison (1A) and longitudinal analysis (1B).
Table 1.
Demographics for cross-sectional comparison (1A) and longitudinal analysis (1B).
| 1A: Baseline |
Cystic fibrosis patients |
Healthy controls |
P-value |
95% CI |
| Number of participants |
55 |
55 |
|
|
| Male sex, n (%) |
26 (47%) |
26 (47%) |
1 |
|
| Mean age in years (SD) |
7.66 (5.1) |
7.78 (5.0) |
0.17 |
(-0.29,0.05) |
| Exocrine pancreatic status |
|
| |
Pancreatic sufficient (%) |
7 (13%) |
| |
Pancreatic insufficient (%) |
48 (87%) |
| Anthropometrics |
|
|
| |
Mean weight z-scores (SD) |
-0.24 (1.23) |
|
| |
Mean height z-scores (SD) |
0.00 (1.01) |
|
| |
Mean BMI z-scores (SD) |
0.39 (0.71) |
|
| 1B: Longitudinal |
Cystic fibrosis patients |
| Number of participants |
23 |
| Male sex, n (%) |
10 (38%) |
| Mean age in years (SD) |
T1 |
T2 |
T3 |
| |
7.0 (4.2) |
7.8 (4.2) |
8.8 (3.9) |
|
| Exocrine pancreatic status |
|
|
| |
Pancreatic sufficient (%) |
4 (17%) |
| |
Pancreatic insufficient (%) |
19 (83%) |
Microbiome Diversity and Inflammation
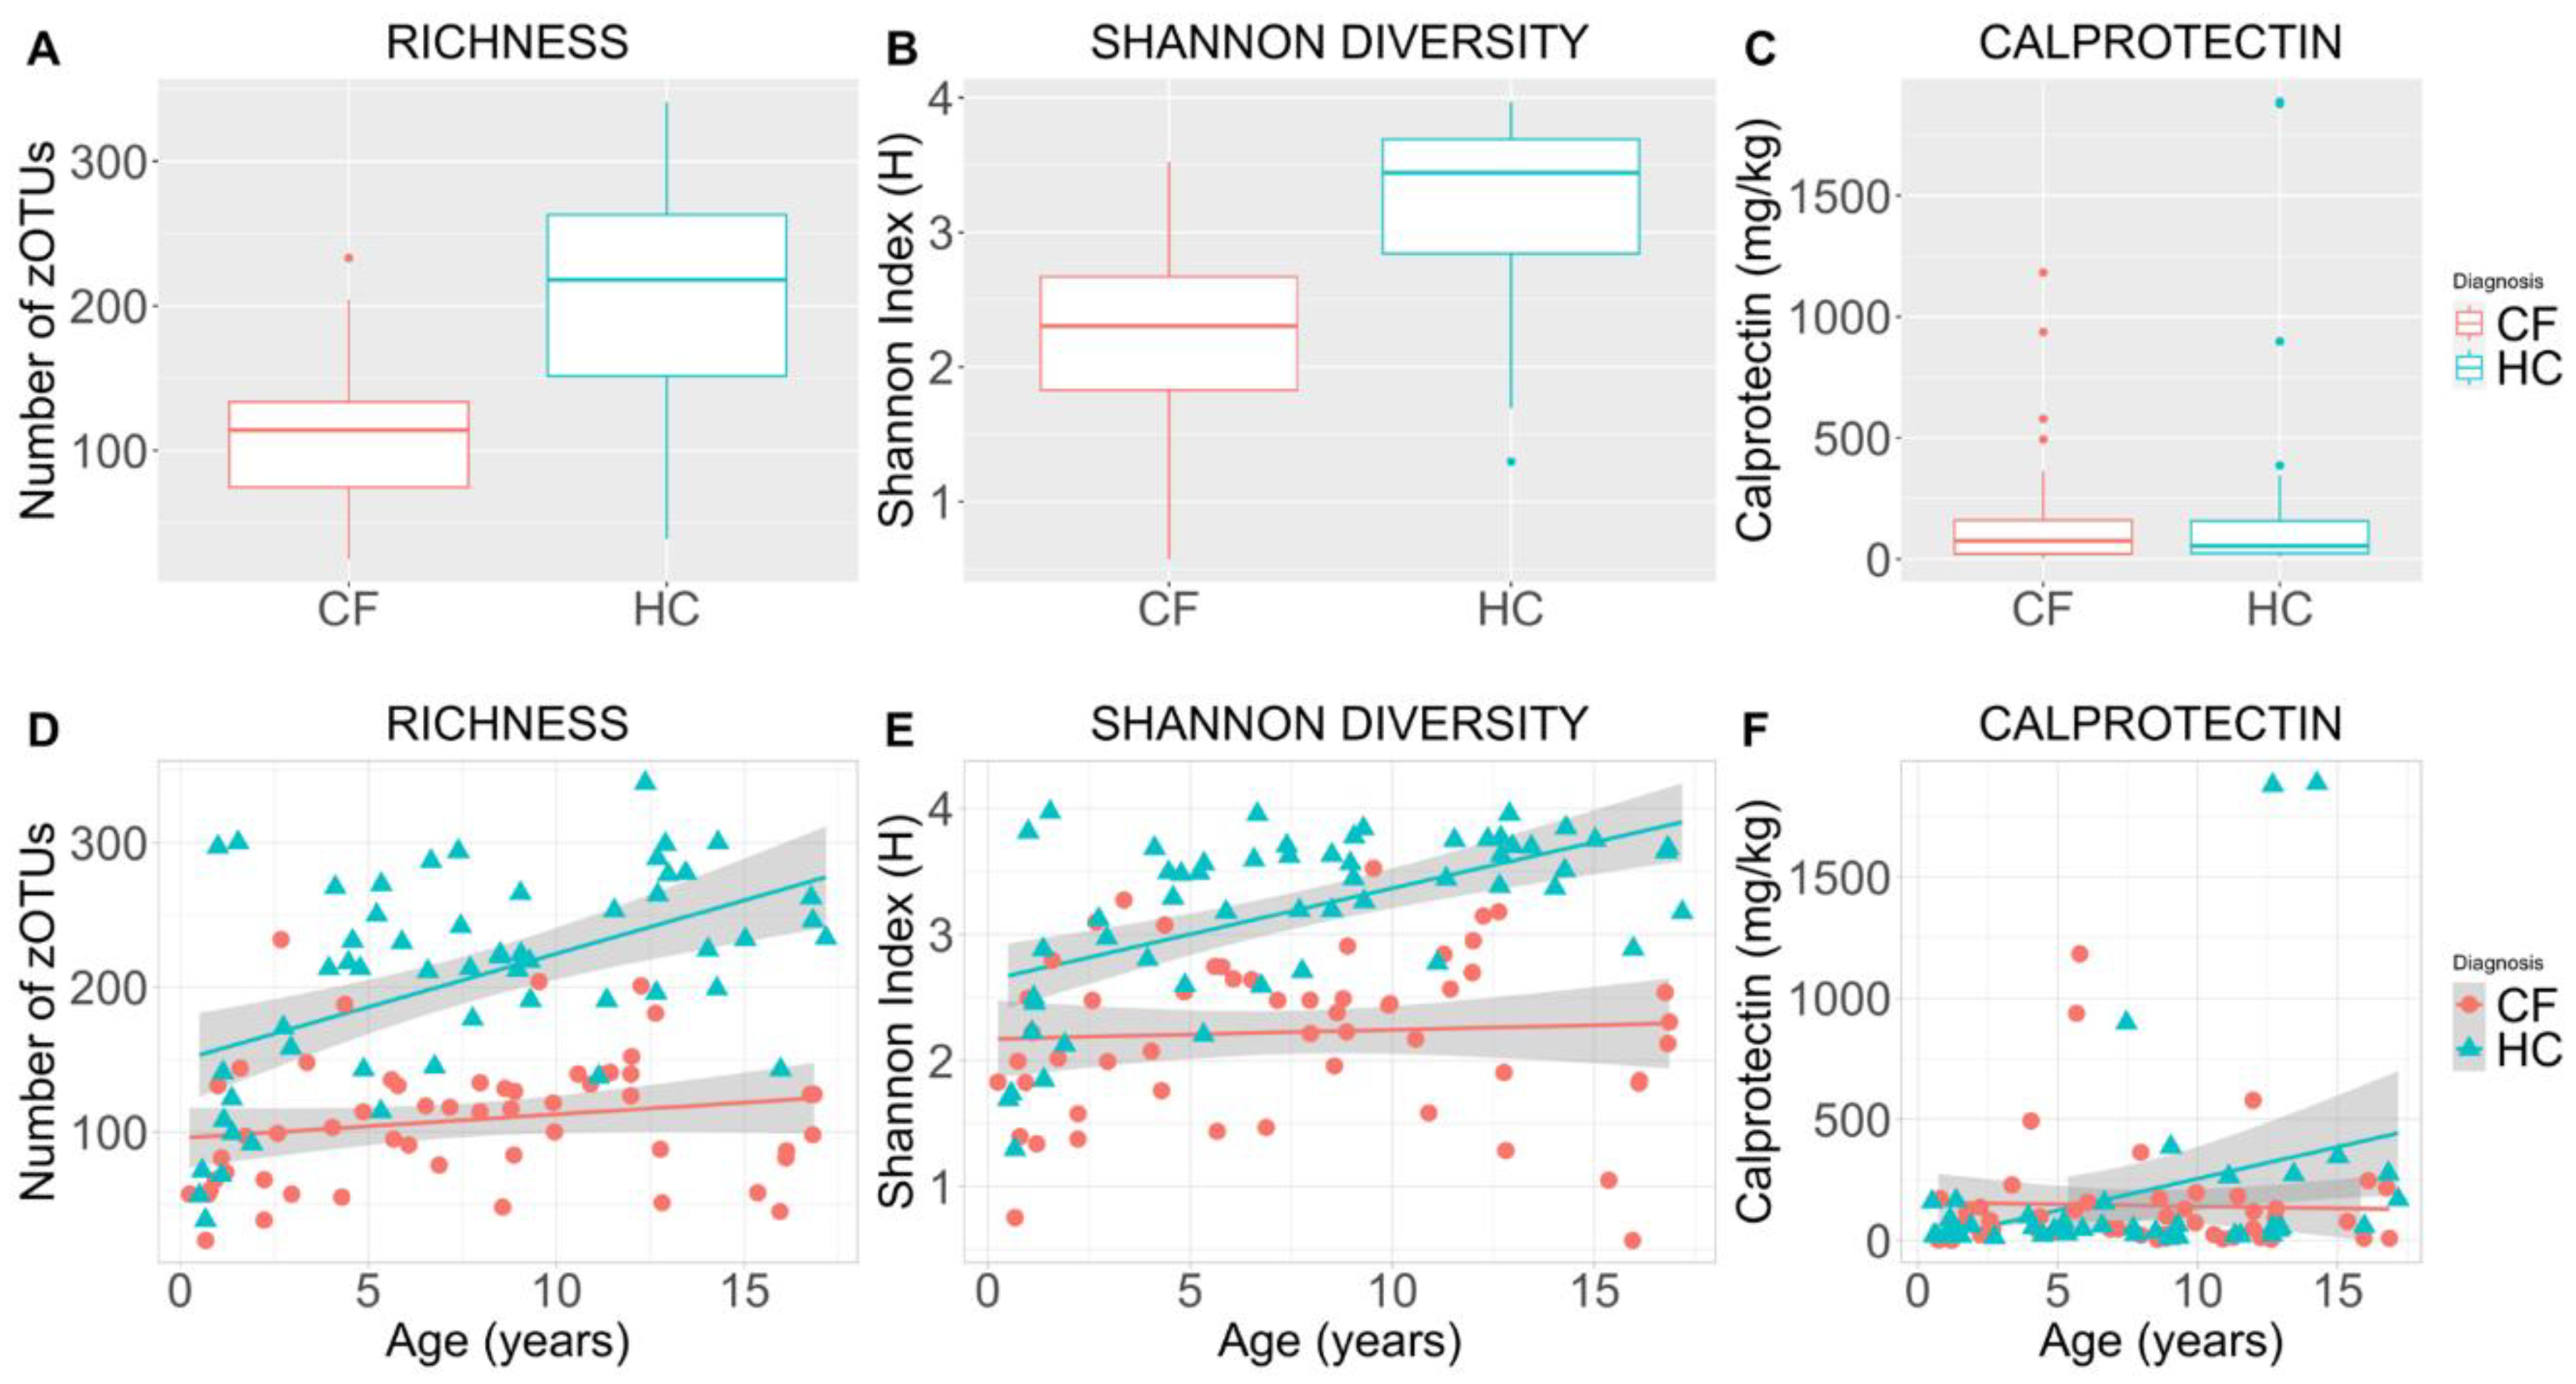
Mean (SD) microbial richness was significantly decreased in CF patients compared to HC (108 (45) versus 207 (71); p < 0.001) (Figure 1A, 1D). Mean (SD) Shannon diversity (H) was also significantly decreased among CF patients compared to HC (2.2 (0.65) versus 3.2 (0.65); p < 0.001) (Figure 1B, 1E). When accounting for age, Shannon diversity remained significantly lower relative to HC (p = 0.001). No difference in either alpha diversity indices were observed between males and females. CF participants had significantly elevated mean (SD) calprotectin levels, indicative of increased intestinal inflammation relative to HC (232 (402) mg/kg vs 64 (73) mg/kg; p < 0.003). This disparity remained unchanged when controlling for age (Figure 1C, 1F).
Figure 1.
Alpha diversity indices and faecal calprotectin for cross-sectional comparison of children with cystic fibrosis versus healthy controls. Boxplots depict microbial richness (number of zOTUs)) (1A), Shannon diversity (Shannon Index (H)) (1B), and the concentration of faecal calprotectin (mg/kg) (1C) in faecal samples of the cystic fibrosis and healthy control cohorts. Scatterplots illustrate sample microbial richness (1D), Shannon diversity (1E), and faecal calprotectin (1F) in the cystic fibrosis and healthy control cohorts with respect to age (years). Coloured lines indicate the cohort means, while shaded regions indicate 95% confidence intervals constructed from generalised linear models (1D, 1E, 1F). CF = cystic fibrosis, HC = healthy controls, zOTU =zero-distance operation taxonomic unit, calprotectin = a measure of intestinal inflammation.
Prevalence of pks+ E. coli at Baseline
The presence of clbB was identified in 21 CF patients and 26 HC (Table 2A). Of the 47 individuals positive for the clbB gene, four patients (three CF, one HC) were negative for the UidA gene cluster. There was no significant difference in proportions of clbB positive subjects between CF and HC using Pearson’s chi-squared test for independence (p = 0.32, df = 1). In our CF cohort, the presence of clbB was also not associated with any significant differences in mean calprotectin concentration, microbial richness, or Shannon diversity (Table 2B).
Table 2A depicts a two-way frequency table of
clbB gene status (positive versus negative) against diagnosis (cystic fibrosis versus healthy controls) from cross-sectional baseline analysis of faecal DNA samples. The
clbB gene was screened for using PCR to determine the prevalence of the
pks island. Student’s t-test was utilised in
Table 2B to determine if correlations between
clbB prevalence and microbial diversity indices (Shannon diversity and microbial richness) or calprotectin exist.
Pks = polyketide-synthase, Microbial richness = a measure of unique zOTUs, Shannon diversity = a measure of species abundance and evenness, Calprotectin = a measure of intestinal inflammation, SD = standard deviation.
Prevalence of pks+ E. coli in Longitudinal Analysis of the CF Cohort
Chi-squared test for independence revealed no significant difference in
clbB prevalence across timepoints (p = 0.4, df = 2), even when accounting for age (p = 0.6) and antibiotics usage (p = 0.18). However, only 7/23 (30%) subjects were consistent in their
pks+ E. coli status across all three timepoints (positive or negative). The fluctuation in
pks+ E. coli prevalence across each timepoint is presented in full in
Table 3. Furthermore, 12/69 (17%) of the total samples were negative for
UidA. A linear mixed model was used to investigate the effects of age, gender, and sample timepoint on alpha diversity indices, with Patient ID included as a random effect to account for repeated measures. There was no significant difference in alpha diversity parameters (richness, Shannon diversity or chao1) between sample timepoints (variance = 412.9, 0.15, 344.9; p = 0.9, 0.2, 0.9 respectively) and no effect of gender. Alpha diversity parameters increased with age, but this was only a significant predictor for chao1 (β = 4.07, SE = 1.75, t = 2.32, p = 0.03 (
Table 4).
The prevalence of pks+ E. coli was determined by being positive for both the clbB and UidA gene cluster on PCR. Here, ‘+’ indicates that pks+ E. coli is present in the sample, ‘-‘ indicates that pks+ E. coli is absent in the sample, and a grey space indicates that E. coli was undetectable in this sample following UidA gene PCR. Each row corresponds to one, de-identified cystic fibrosis patient involved in the longitudinal analysis. Samples were collected across three timepoints, spaced roughly six months apart. pks+ E. coli = polyketide synthase-positive Escherichia coli.
4. Discussion
This study is the first of its kind to investigate the colibactin-producing
pks+ E. coli in the CF gut, and we identified no evidence suggestive of increased
pks+ E. coli prevalence in cwCF. Furthermore,
pks+ E. coli prevalence was not linked to differences in calprotectin concentration, gut microbial richness, or Shannon diversity index within cwCF. While many CF patients demonstrated fluctuations in
pks+ E. coli status across timepoints, there was no significant difference overall. We also identified significant reductions in microbial diversity of the CF gut, and significant differences in bacterial composition when compared to HC. CF patients exhibited alterations in over 70 genera, including that of
Fusobacterium, which has demonstrated previous links to CRC development [
1]. Faecal calprotectin was significantly higher in CF compared to HC but within CF, there was no difference in calprotectin concentrations over time.
Our results suggest that increased abundance of pks+ E. coli is not a major contributor to alterations in gut richness or diversity for cwCF. Furthermore, we did not identify any significant relationship between inflammation or gut microbial diversity and the status of pks+ E. coli. While alpha and beta diversity provide an important characterisation of the gut microbiota, they do not characterise DNA changes which occur following exposure to genotoxic bacteria, such as pks+ E. coli. Future research should target a more definitive understanding of these DNA changes, and their implications, on CRC development.
The significantly lower gut microbial richness and diversity in cwCF and increased faecal calprotectin mirrors previous studies in patients with CF [
3,
23]. Within CF, we observed no significant temporal changes in microbial alpha diversity or gut inflammation.
While the implications of
pks+ E. coli on CRC development have been previously reported in non-CF poopulations [
19,
25], when comparing the presence of
pks+ E. coli between the HC cohorts of these studies, they are markedly different. Determinants of
pks+ E. coli prevalence are evidently multifactorial, and while
pks+ E. coli may be a viable pathogenic pathway towards CRC in CF, it could be one of many distinct pathways of carcinogenesis. Further, we identified
pks in 4 samples (3 CF, 1 HC) which did not have
E. coli, suggesting other, non-
E. coli species may have the capacity to express
pks, with or without pathogenic effect [
26]. The consequences of increased levels of these non
-E. coli pks+ positive species in colorectal carcinogenesis is not yet understood.
Lastly, our analysis identified no significant difference in the proportion of CF individuals who were
pks+ E. coli gene positive over time. However, 16 individuals experienced fluctuations in
pks+ E. coli status across successive timepoints, indicating a high degree of temporal instability. One previous study of an IBD cohort identified greater temporal microbiota instability between timepoints when compared to HC, particularly with changes in disease stability [
27]. Disease instability could be applicable to our longitudinal observations in
pks+ E. coli and explain the lack of diagnostic differences in our cross-sectional analysis. Furthermore, only three patients maintained positive
pks+ E. coli status across all three timepoints. It remains unclear whether the persistence of
pks+ E. coli is required for genotoxic effect, or if the cumulative influence of transient, repeat exposures is satisfactory to produce carcinogenesis. Given the high variability we identified in
pks+ E. coli status, the concept of repeat, transient exposures could be relevant in CF-related CRC.
Limitations
Some limitations of our current study should be considered. While use of the clbB gene in PCR, as a proxy for the pks island, has been validated in previous studies, this gene represents only one of multiple within the pks gene cluster. Metagenomic analysis could also enable quantification of gene expression in future studies and avoid the primer specificity inherent to PCR-based methods.
Further, our study accounted for demographic co-variates such as age, gender, and clinical variables such as use of antibiotics, but other factors remain, such is the therapeutic complexity involved in management of CF. Furthermore, the high-energy, high-fat diet utilised in CF nutrition management influences GI microbial composition [
29] and previous literature indicates some diets, such as the Western-style diet, are conductive to higher rates of CRC containing
pks+ E. coli [
30]. Evaluation of the role these variables play on the CF gut has already begun [
29], but should further their analysis to analyse a potential role in CRC development.
5. Conclusions
Taken together, our findings suggest that pks+ E. coli is unlikely to directly contribute to the increased inflammatory environment and dysbiotic state that develops early in cwCF. While our findings do not support the utility of colibactin as a prognostic indicator for CRC risk in cwCF, future studies are needed within the adult CF population to understand the role pks may play in inflammation and CRC tumorigenesis later in life. Characterisation of pks in older CF patients with polyp formation or diagnosis of CRC would further this understanding. Based on the higher load of bacteria with carcinogenic links within the CF gut, along with the temporal variability we identified in pks+ E. coli, future research should also consider both the cumulative impact of multiple genotoxic species as well as effect of recurrent colonisation of these genotoxic species over time.
Supplementary Materials
The following supporting information can be downloaded at the website of this paper posted on Preprints.org.
Author Contributions
CC – Conceptualisation, Data Curation, Formal Analysis, Investigation, Methodology, Visualisation, Writing – original draft preparation, Writing – review and editing. JvD - Conceptualisation, Data Curation, Formal Analysis, Investigation, Methodology, Supervision, Writing – review and editing, Validation. MC - Conceptualisation, Data Curation, Formal Analysis, Methodology, Software, Writing – review and editing. CM – Data Curation, Formal Analysis, Investigation, Resources, Software IM – Data Curation, Resources JA – Data Curation KP – Data Curation RT – Data Curation HWC – Data Curation BP – Resources, Writing – review and editing LO – Resources, Writing – review and editing YB – Resources, Writing – review and editing SC – Resources, Writing – review and editing AJ – Resources, Writing – review and editing CYO - Conceptualisation, Funding Acquisition, Project administration, Resources, Methodology, Supervision, Writing – review and editing, Validation.
Funding
CYO and this study were funded by the National Health and Medical Research Council (NHMRC, Australia) Investigator Grant (2020/GNT1194358).
Institutional Review Board Statement
Patient data utilized in this manuscript was collected as part of the ‘Evaluating the Alimentary and Respiratory Tracts in Health and Disease’ (EARTH) research programme [
16]. The EARTH research programme was conducted in accordance with the Declaration of Helsinki, and approved by the South-Eastern Sydney Area Health Service, Human Research Ethics Committee, Sydney, Australia. Ethics number: HREC/18/SCHN/26 and 2019/ETH05421.
Informed Consent Statement
Informed consent was obtained from all subjects involved in this study.
Data Availability Statement
The datasets used and/or analysed during the current study are available from the corresponding author on reasonable request.
Acknowledgments
The authors would like to thank the CF multidisciplinary team, and patients and families at Sydney Children’s Hospital Randwick. We would also like to acknowledge past UNSW ILP/Honours students Isabelle McKay, Jumaana Abdu, Keerti Paida, Rachel Tam, and Hannah Wrigley-Carr who contributed to patient recruitment and follow-up.
Conflicts of Interest
CYO has received honorarium from Vertex Pharmaceuticals as a consultant and advisory board member (unrelated to this study). BP has received honorarium from Vertex pharmaceuticals as an invited speaker and received the TSANZ/Vertex Cystic Fibrosis Clinical fellowship (unrelated to this study). There are no other conflicts of interest.
References
- Coffey, M.J., et al. Gut Microbiota in Children With Cystic Fibrosis: A Taxonomic and Functional Dysbiosis. Sci. Rep. 9, 18593 (2019). [CrossRef]
- Manor, O., et al. Metagenomic evidence for taxonomic dysbiosis and functional imbalance in the gastrointestinal tracts of children with cystic fibrosis. Sci. Rep. 6, 22493 (2016). [CrossRef]
- Burke, D.G., et al. The altered gut microbiota in adults with cystic fibrosis. BMC Microbiol. 17, 58 (2017). [CrossRef]
- Tam, R.Y., van Dorst, J.M., McKay, I., Coffey, M. & Ooi, C.Y. Intestinal Inflammation and Alterations in the Gut Microbiota in Cystic Fibrosis: A Review of the Current Evidence, Pathophysiology and Future Directions. J. Clin. Med. 11, 649 (2022). [CrossRef]
- Kristensen, M., et al. Development of the gut microbiota in early life: The impact of cystic fibrosis and antibiotic treatment. J. Cyst. Fibros. 19, 553-561 (2020). [CrossRef]
- Yamada, A., et al. Risk of gastrointestinal cancers in patients with cystic fibrosis: a systematic review and meta-analysis. Lancet Oncol. 19, 758-767 (2018). [CrossRef]
- Maisonneuve, P., Marshall, B.C., Knapp, E.A. & Lowenfels, A.B. Cancer risk in cystic fibrosis: a 20-year nationwide study from the United States. J. Natl. Cancer Inst. 105, 122-129 (2013). [CrossRef]
- Yatsunenko, T., et al. Human gut microbiome viewed across age and geography. Nature 486, 222-227 (2012). [CrossRef]
- Matamouros, S., et al. Adaptation of commensal proliferating Escherichia coli to the intestinal tract of young children with cystic fibrosis. Proc. Natl. Acad. Sci. U.S.A. 115, 1605-1610 (2018). [CrossRef]
- Pakbin, B., Brück, W.M. & Rossen, J.W.A. Virulence Factors of Enteric Pathogenic Escherichia coli: A Review. Int. J. Mol. Sci. 22, 9922 (2021). [CrossRef]
- Faïs, T., Delmas, J., Barnich, N., Bonnet, R. & Dalmasso, G. Colibactin: More Than a New Bacterial Toxin. Toxins (Basel) 10, 151 (2018). [CrossRef]
- Dalmasso, G., Cougnoux, A., Delmas, J., Darfeuille-Michaud, A. & Bonnet, R. The bacterial genotoxin colibactin promotes colon tumor growth by modifying the tumor microenvironment. Gut Microbes 5, 675-680 (2014). [CrossRef]
- Arthur, J.C., et al. Microbial genomic analysis reveals the essential role of inflammation in bacteria-induced colorectal cancer. Nat. Commun. 5, 4724 (2014). [CrossRef]
- Dougherty, M.W. & Jobin, C. Shining a Light on Colibactin Biology. Toxins (Basel) 13, 346 (2021). [CrossRef]
- Eklöf, V., et al. Cancer-associated fecal microbial markers in colorectal cancer detection. Int. J. Cancer 141, 2528-2536 (2017). [CrossRef]
- Coffey, M.J., et al. Evaluating the Alimentary and Respiratory Tracts in Health and disease (EARTH) research programme: a protocol for prospective, longitudinal, controlled, observational studies in children with chronic disease at an Australian tertiary paediatric hospital. BMJ Open 10, e033916 (2020). [CrossRef]
- Nielsen, S., et al. Disrupted progression of the intestinal microbiota with age in children with cystic fibrosis. Sci. Rep. 6, 24857 (2016). [CrossRef]
- Garnett, E., et al. Validation of the newly FDA-approved Buhlmann fCal Turbo assay for measurement of fecal calprotectin in a pediatric population. Pract. Lab. Med. 22, e00178 (2020). [CrossRef]
- Arthur, J.C., et al. Intestinal inflammation targets cancer-inducing activity of the microbiota. Science 338, 120-123 (2012). [CrossRef]
- Tantawiwat, S., Tansuphasiri, U., Wongwit, W., Wongchotigul, V. & Kitayaporn, D. Development of multiplex PCR for the detection of total coliform bacteria for Escherichia coli and Clostridium perfringens in drinking water. Southeast Asian J. Trop. Med. Public Health. 36, 162-169 (2005).
- Anderson, M.J. A new method for non-parametric multivariate analysis of variance. Austral Ecol. 26, 32-46 (2001).
- Hadley, W. ggplot2: Elegant Graphics for Data Analysis, (Springer-Verlag New York, 2016).
- Bruzzese, E., et al. Intestinal inflammation is a frequent feature of cystic fibrosis and is reduced by probiotic administration. Aliment. Pharmacol. Ther. 20, 813-819 (2004). [CrossRef]
- Ai, D., et al. Identifying Gut Microbiota Associated With Colorectal Cancer Using a Zero-Inflated Lognormal Model. Front. Microbiol. 10, 826 (2019). [CrossRef]
- Oliero, M., et al. Prevalence of pks + bacteria and enterotoxigenic Bacteroides fragilis in patients with colorectal cancer. Gut Pathog. 14, 51 (2022). [CrossRef]
- Luo, C., et al. Genetic and Functional Analysis of the pks Gene in Clinical Klebsiella pneumoniae Isolates. Microbiol. Spectr. 11, e00174-00123 (2023). [CrossRef]
- Clooney, A.G., et al. Ranking microbiome variance in inflammatory bowel disease: a large longitudinal intercontinental study. Gut 70, 499-510 (2021). [CrossRef]
- Ooi, C.Y., et al. Impact of CFTR modulation with Ivacaftor on Gut Microbiota and Intestinal Inflammation. Sci. Rep. 8, 17834 (2018). [CrossRef]
- McKay, I., et al. Diet and the gut-lung axis in cystic fibrosis – direct & indirect links. Gut Microbes 15, 2156254 (2023). [CrossRef]
- Arima, K., et al. Western-Style Diet, pks Island-Carrying Escherichia coli, and Colorectal Cancer: Analyses From Two Large Prospective Cohort Studies. Gastroenterology 163, 862-874 (2022). [CrossRef]
|
Disclaimer/Publisher’s Note: The statements, opinions and data contained in all publications are solely those of the individual author(s) and contributor(s) and not of MDPI and/or the editor(s). MDPI and/or the editor(s) disclaim responsibility for any injury to people or property resulting from any ideas, methods, instructions or products referred to in the content. |
© 2025 by the authors. Licensee MDPI, Basel, Switzerland. This article is an open access article distributed under the terms and conditions of the Creative Commons Attribution (CC BY) license (http://creativecommons.org/licenses/by/4.0/).