
Submitted:
24 May 2023
Posted:
25 May 2023
You are already at the latest version
Abstract
Microbiota and the metabolites they produce within the large intestine interact with the host epithelia under the influence of a range of host-derived metabolic, immune, and homeostatic factors. This complex host-microbe interaction affects intestinal tumorigenesis but established microbial or metabolite profiles predicting colorectal cancer (CRC) risk are missing. Here we describe alterations in fecal bacteria and volatile organic compounds (VOC) in healthy (Non-Adenoma, NA) versus CRC prone (High-Risk Adenoma, HRA) individuals. Analyzing samples from 117 participants undergoing routine colonoscopy we highlight the higher abundance of Proteobacteria and Parabacteroides distasonis, and the lower abundance of Lachnospiraceae species, Roseburia faecis, Blautia luti, Fusicatenibacter saccharovorans, Eubacterium rectale and Phascolarctobacterium faecium, in the fecal samples of HRA individuals. Volatolomic analysis reveals higher concentration in the feces of HRA individuals of 5 compounds, isobutyric acid, methyl butyrate, methyl propionate, 2-hexanone and 2-pentanone. Interestingly, there is a level of complexity revealed by assessing fecal bacteria-VOC associations and another one by assessing differences in these associations between NA and HRA individuals. For example, isobutyric acid corelates positively with the Lachnospiraceae incertae sedis and Bacteroides genera in NA individuals, and negatively in HRA individuals. In contrast, Coprococcus and Colinsella genera correlate negatively with isobutyric acid in NA individuals, and positively in HRA individuals. The described differences in the fecal microbiota and VOC profiles and their associations in NA versus HRA individuals indicate the significance of multiple levels of combinatorial analysis towards the identification of testable CRC risk biomarkers.
Keywords:
Dysbacteriosis
; pathobionts
; nutrients
; metabolites
1. Introduction
Colorectal cancer (CRC) is the third most common and the second deadliest cancer worldwide with 1.9 million new cases and 0.9 million recorded deaths in 2020 [1]. The multifactorial nature of CRC involves many risk factors, some of which have a clear environmental component and are thus modifiable, such as, lifestyle, obesity, diet, alcohol intake, tobacco use and biological aging, while others have a clear genetic component and are relatively fixed, such as, sex, ancestry, identifiable inherited mutations, and family history of proneness to cancer [2]. Two biomedically quantifiable and modifiable factors are the billions of microbes residing in the intestine and the thousands of metabolites they generate. These affect epithelial homeostasis and the host immune system and in turn tissue regeneration and predisposition to cancer [3,4]. Some of the gut microbes can ferment plant derived dietary fibers and animal protein-derived amino acids facilitating host metabolism and a balanced intestinal biochemistry [5]. An emerging risk factor for CRC development is intestinal dysbacteriosis which results from the presence of certain bacteria, diets, lifestyles and clinical pathologies. [2]. Accordingly, the intestinal bacteriome and metabolome provide the potential to identify novel non-invasive biomarkers for colonic inflammatory disorders and CRC. Fusobacterium nucleatum, colibactin positive (pks+) Escherichia coli and enterotoxigenic Bacteroides fragilis (ETBF) have been causally linked to CRC, while the link to CRC of Clostridium symbiosum, Enterococcus fecalis, Streptococcus bovis, Peptostreptococcus anaerobius, Parvimonas micra and Porphyromonas species remains to be established [6,7,8,9,10,11]. Higher levels of some of these species and strains may distinguish High-Risk Adenoma (HRA) and early-stage CRC patients from healthy No Adenoma (NA) individuals. Moreover, microbial biomarker discovery may be improved, when combined with the characterization of the intestinal metabolome. For example, combining Ultra High Performance Liquid Chromatography Mass Spectrometry (UHPLC-MS) with metagenomics data allowed the link of cholesteryl esters and sphingolipids as well as of Fusobacterium, Parvimonas and Staphylococcus with CRC and provided combinatorial microbiome-metabolome analysis towards early disease diagnosis [7]. Intriguingly, breath, urine, and fecal volatile organic compounds (VOCs) provide an alternative and promising clinical approach to intestinal inflammation and early CRC diagnosis, despite the inadequate strength of evidence and differing analytical platforms [12,13].
Here, we link fecal bacteria at different taxonomic levels and fecal volatile compounds to HRA status by sampling and analyzing a Cypriot population. We use 16S rRNA sequencing (16S-Seq) and HeadSpace Solid Phase Micro-Extraction Gas Chromatography Mass Spectrometry (HS-SPME-GC-MS) to identify differences in fecal bacteria abundance and VOC concentrations between NA and HRA individuals. Moreover, we performed Spearman’s rank order correlations between the fecal bacteriome and VOCs indicating intestinal health versus pre-cancerous dysbiosis, followed by binomial logistic regression modelling.
2. Materials & Methods
2.1. Sample collection
Fecal samples in this study were collected under the Cyprus Intestinal Health Study (MoCo Project EXCELLENCE/1216/0523) funded by the Research and Innovation Foundation of Cyprus. Bioethical approval was obtained from the Cyprus National Bioethics Committee (Protocol numbers: EEBK/ΕΠ/2015/38 and EEBK/ΕΠ/2019/23). 117 participants provided fecal samples ≥15 days after conventional colonoscopy per established assessments [14] which were stored at −80 °C until analysis. 100 of these were assigned an NA status due to the absence of tumor detection during colonoscopy. The remaining 17 individuals were assigned an HRA status according to colonoscopy and histopathological reports recording ≥3 adenomas/serrated polyps, or ≥1 adenoma/serrated polyp ≥1 cm, or ≥1 villus or tubulovillus adenoma, or high-grade dysplasia per established criteria [15,16]. 55 and 62 individuals were males and females, respectively, 50–70 years old, undergoing routine colonoscopy (Table 1). No individual had a history of CRC or inflammatory bowel disease (IBD) or received antibiotics treatment or suffered from gastroenteritis during the month before colonoscopy or sample collection.
2.2. Fecal bacteria DNA isolation and 16S gene amplicon sequencing
Fecal bacteria DNA isolation and purification was performed using the PureLink™ Microbiome DNA Purification Kit (Invitrogen™) using 0.18–0.2 g from the initial fecal sample, and 90 μl of eluted DNA was stored at −80 °C. The 16S rRNA gene hypervariable regions V3 and V4 were sequenced using the Nextera XT Library Preparation kit (Illumina™, Inc., San Diego, CA, United States) [17] and the following primers containing overhang adapter sequences:
Forward: TCGTCGGCAGCGTCAGATGTGTATAAGAGACAGCCTACGGGNGGCWGCAG
Reverse: GTCTCGTGGGCTCGGAGATGTGTATAAGAGACAGGACTACHVGGGTATCTAATCC
16S Gene Amplicon Sequencing for the taxonomic classification was performed using a 300 bp paired-end run on an Illumina MiSeq™ platform, following the standard Illumina protocols.
2.3. Bioinformatics and statistical analyses for metagenomics
Metagenomics Operational Taxonomic Units (OTU) analysis was performed, determining the relative abundance of each bacterial taxon from phylum to species. Bioinformatic OTU analysis was performed from FASTQ files with paired-end reads utilizing Ribosomal Database Project Classifier against the RefSeq RDP 16S ver4.3 database [18]. Quality control was applied by requiring the detection of each OTU in at least 30% of samples and a minimum average relative abundance of 1% in at least one of the two groups (NA and HRA). Average bacterial abundance at the phylum, family, genus, and species taxonomic level was compared between the NA and HRA groups using a Mann-Whitney U test.
To display bacterial taxa percentiles (raw relative abundance) and hierarchy based on identified reads for the NA and the HRA groups we used Krona visualization with classification imported in an Excel template detailing lineage and magnitude [19]. Inverse Simpson index was used to calculate alpha diversity and UniFrac index to compute beta diversity, both by using the VEGAN package [20].
2.4. HS-SPME-GC-MS headspace analysis of fecal VOCs
18 NA and 10 HRA individuals were randomly selected for fecal volatolomics. Approximately 0.6 g of each frozen sample added in a 20 ml headspace glass vial (Agilent; Part#: 8010-0413) was thawed for 24 hrs at room temperature. Then, 5μL of internal standard solution of chlorobenzene-d5 (Sigma-Aldrich; Product#: 48086, CAS#: 3114-55-4) with a final concentration of 25 ppb, was injected in the headspace vial the sample left to equilibrate in the closed crimp seal vial for 24 h at room temperature and it was then incubated in a water bath at 60 °C for 1 hr. Consecutively, the 75μm CAR/PDMS SPME fiber was exposed to the headspace phase of the vial for 30 min, so as to achieve the extraction of the small volatiles contained in the headspace phase. VOCs were thermally desorbed from the SPME fiber in an Agilent Single-Quadrupole GC-MS Instrument (GC-7890B, MSD-5977B, Agilent Technologies, USA) (Supplementary Information in SI1).
2.5. Volatolomic and combinatorial omic statistical analyses
For normalization, raw VOCs values were divided by the value of the internal standard (chlorobenzene-d5, 25 ppb). Quality control was applied by minimal detection of at least 3 values of VOCs in both groups. To VOCs levels between NA and HRA groups the Shapiro Wilk normality test was performed prior to the Mann-Whitney U test (non-parametric, if normality fails), or independent sample t-test (parametric, for normally distributed variables). Principal Component Analysis (PCA) was done with the FACTOEXTRA package in R and the production of a heatmap to show the values of VOCs across each sample was completed with the GPLOTS package in R [21,22]. Bacterial families and genera correlations with VOCs, shown in Figures 5 and 6 and Tables 3 and 4, were measured in terms of strength and direction via Spearman’s rank order correlation. The probability of certain interactions among an individual status (NA or HRA), VOCs and relative abundance of bacteria taxa, shown in Figures 6 and 8, was tested via binomial logistic regression analysis, as a tool for predictive modeling of CRC proneness. The a-priori set threshold for statistical significance in all tests was p-value ≤ 0.05.
3. Results
3.1. Fecal bacteria prevalence and diversity in NA and HRA individuals
Fecal samples from 117 female and male adults between the age of 50 and 70 (Table 1), divided into 100 NA and 17 HRA in accordance with established criteria [15] were analyzed via 16S-Seq generating 38,6 million quality-filtered reads, 87% of which were identified. Krona plots revealed raw relative abundances as percentiles of total identified bacteria sequence reads per taxonomic level for the NA and the HRA group (Figure 1 and Figure 2). Firmicutes was the most prevalent phylum in both groups, covering 68% in NA and 41% in HRA individuals. Lachnospiraceae and Ruminococcaceae, the most prominent Firmicutes families in the NA group were tentatively less prevalent in the HRA group. The Blautia, Roseburia and Fusicatenibacter genera collectively covered 48% of the Lachnospiraceae family sequence reads in ΝA, and 19% in HRA individuals. Bacteroidetes and Actinobacteria phyla were comparable in the two groups: Bacteroidetes covered 20% of the sequence reads in NA, and 14% in HRA individuals, while Actinobacteria covered 9% in NA and 10% in HRA. Interestingly, Proteobacteria covered 23% and 1% of the sequence reads in HRA and NA individuals, respectively. Accordingly, Enterobacteriaceae, a prominent Proteobacteria family, was prominently abundant in HRA individuals.
Inverse Simpson index was applied to assess alpha-diversity within the groups of 100 NA and 17 HRA individuals at the phylum, family, genus and species level. The higher the value of this index the greater the diversity within the group. As expected, the alpha-diversity increased for each group from family to species level, but the index of the NA and HRA groups at a given taxonomic level was in all cases comparable (Supplementary Figure S1). To determine potential dissimilarities in the microbial communities between the NA and the HRA group, the phylogenetic distance between sets of phyla, families, genera, and species unique to either the NA or the HRA group we used the UniFrac phylogenetic method. The Multidimensional Scaling (MDS) representation of beta-diversity measurement showed no significant differences at any taxonomic level between the NA and HRA groups (Supplementary Figure S2).
3.2. Significant fecal bacteria differences between NA and HRA individuals
We used a Mann-Whitney non-parametric test to pinpoint statistically significant differences between NA and HRA individuals in the relative abundance of bacteria at the phylum, family, genus, and species level (Table 2, Figure 3). Differences were accepted at p-value ≤ 0.05 and normalized mean relative abundance ≥ 1% in at least one of the two groups. Accordingly, the phylum of Proteobacteria was ≈2 times more abundant in HRA versus NA individuals. Members of the Lachnospiraceae family, namely, the Roseburia and Fusicatenibacter genera, were ≈2 times more abundant in NA individuals. At the species level, Roseburia faecis, Blautia luti, Fusicatenibacter saccharovorans and Eubacterium rectale belonging to the Lachnospiraceae family, as well as Phascolarctobacterium faecium belonging to the Acidaminococcaceae family were more abundant in NA individuals. To the contrary, Parabacteroides distasonis a bacterial species with a potential pathogenic role belonging to the Tannerellaceae family was ≈3 times more abundant in HRA individuals.
3.3. VOCs abundance in NA and HRA individuals
HS-SPME-GC-MS analysis was used to evaluate the profile of volatile organic compounds in the feces of a subset of the initial individuals: 18 NA and 10 HRA individuals. Out of over 250 detected volatiles 71 were present in the samples of at least 3 individuals in each group. Principal Component Analysis (PCA) for the 71 essential volatiles emitted (Supplementary Figure S3) indicated dispersed distributions of samples, that is, significant sample to sample variations in VOCs. Moreover, there was a lack of distinct sample clustering indicating similarity between the VOCs of the NA and the HRA group. This may be partially due to differences in the dietary habits of the sampled individuals. However, branched chain fatty acids (BCFAs), methyl propionate, methyl butyrate and isobutyric acid, and the ketones, methyl butyl ketone (2-Hexanone) and ethyl acetone (2-Pentanone) were significantly more abundant in HRA versus NA individuals (Figure 4, Supplementary Table S1).
3.4. Associations between bacterial families and VOCs in NA and HRA individuals
We examined correlations between fecal bacterial families (FBFs) and fecal VOCs using 28 fecal samples from 18 NA and 10 HRA individuals. We identified 68 pairwise associations between 16 FBFs and 30 VOCs, as shown in the Chord diagram of Figure 5 and the Supplementary Table S2. Of all FBFs, Bacteroidaceae and Eubacteriaceae exhibited the most associations with VOCs, 10 and 9, respectively. Of all VOCs, acetaldehyde and propanal exhibited the most associations with FBFs, 7 of them each.
To gain insight regarding distinctions between the NA and HRA groups, we explored all combinations and managed to associate 4 of the VOCs found significantly more abundant in HRA individuals, butyl methyl ketone, isobutyric acid, methyl butyrate and ethyl acetone (Figure 4), via Spearman’s correlation analysis with 6 FBFs, Eubacteriaceae, Lactobacillaceae, Bacteroidaceae, Erysipelotrichaceae, Acidaminococcaceae, and Peptostreptococcaceae (Table 3 and Figure 5). Moreover, we associated Lachnospiraceae a FBF significantly less abundant in HRA individuals (Figure 3), with 4 VOCs, propanal, methacrolein, methyl 4-methylvalerate, dimethyl trisulfide (Table 3 and Figure 5). Strikingly, the direction of each FBF-VOC interaction was opposite in most cases between the NA and the HRA group (Table 3). Similarly, binomial logistic regression analysis of the 18 NA and the 10 HRA samples regarding the key FBF-VOC associations described in Table 3, revealed five FBF-VOC co-abundance correlations and distinct trends for the NA and the HRA groups, as potential predictive models of CRC proneness (Figure 6).
3.5. Associations between bacterial genera and VOCs in NA and HRA individuals
We also examined correlations between fecal bacterial genera (FBGs) with fecal VOCs using the 28 fecal samples from 18 NA and 10 HRA individuals. We identified 96 different associations between 27 fecal bacterial genera and 41 VOCs, as shown in the Chord diagram of Figure 7 and Supplementary Table S3. Of all FBGs, Bacteroides and Eubacterium exhibited the most associations with VOCs, 10 and 9, respectively. Of all VOCs propanal exhibited the most (13) associations with FBGs, while acetaldehyde, isobutyraldehyde, isovaleraldehyde and methyl cyclohexanecarboxylate with 5 FBGs each.
To gain distinct insight regarding the NA and HRA groups, we explored all combinations and managed to associate four VOCs found significantly enriched in HRA individuals, butyl methyl ketone, isobutyric acid, methyl butyrate, ethyl acetone (Figure 4), via Spearman’s correlation analysis with 8 FBGs, Ruminococcus, Lachnospiraceae incertae sedis, Collinsella, Bacteroides, Coprococcus, Bacteroides, Holdemanella and Eubacterium. Moreover, we associated FBGs significantly less abundant in HRA individuals, Roseburia and Fusicatenibacter (Figure 3), with 3 VOCs, propanal, p-Cresol and indole (Table 4, Figure 7). Strikingly, the direction of each FBG-VOC interaction was opposite in most cases between the NA and the HRA group (Table 4). Similarly, binomial logistic regression analysis of the 18 NA and the 10 HRA samples regarding the key FBG-VOC associations described in Table 4, revealed 10 FBF-VOC co-abundance correlations and distinct trends for the NA and the HRA groups, as potential predictive models of CRC proneness (Figure 8).
4. Disscusion
Countless interactions take place within the large intestine between volatile compounds and the intestinal microbiota influenced by host diet, age, metabolism, inflammation-related processes, medications and other environmental factors. VOCs are generated, modified or degraded by bacteria residing the intestine and the host itself. Some VOCs may benefit, while others may destroy the health promoting microbial composition balance [31]. During the last decade, microbiome changes and specific bacterial species have been linked to cancer development and progression [32,33]. Nevertheless, it is still early to name microbial and biochemical signatures of predictive value for CRC risk. Through our ongoing clinical study, we find significant changes in the microbial composition and fecal VOCs between NA and HRA individuals residing in the island of Cyprus. Beyond our independent microbiome and volatilome analysis, we indicate a level of complexity revealed by assessing fecal bacteria-VOC associations and another one by assessing differences in these associations between NA and HRA individuals.
4.1. Fecal bacteriome analysis
To determine differential microbial abundances between the NA and HRA individuals, we compared microbial composition at the phylum, family, genus and species level utilizing Mann-Whitney non-parametric statistical analysis. Proteobacteria and Parabacteroides distasonis, a member of the Tannerellaceae family, were more abundant in HRA individuals, while members of the Lachnospiraceae family, Roseburia faecis, Blautia luti, Fusicatenibacter saccharovorans and Eubacterium rectale, as well as Phascolarctobacterium faecium, member of the Acidaminococcaceae family, were more abundant in NA individuals.
Based on previous studies depletion of members of the Clostridia class, such as Lachnospiraceae, Ruminococcaceae and Eubacteriaceae, indicate colonic subclinical inflammation within which high-risk adenomas may form [2,34]. Clostridia can ferment dietary plant fibers producing butyrate and other SCFAs, such as propionate, acetate and valerate. Moreover, the anaerobic Lachnospiraceae and Ruminococcaceae families may play a preventive role in CRC development, since the relative abundances of Lachnospiraceae and its metabolites have been inversely correlated with CRC progression [24].
R. faecis, B. luti, E. rectale and F. saccharovorans species are members of the Lachnospiraceae family and SCFA-producers that preserve gut-homeostasis and protect the intestinal mucosal cells from becoming hyperplastic, dysplastic or malignant by regulating colonic inflammation [35]. Moreover, members of the Fusicatenibacter and Roseburia genera, such as F. saccharivorans, and R. faecis, are significantly reduced in CRC patients compared to healthy individuals [23,30]. Similarly, B. luti is depleted in CRC patients vs. healthy-controls [25,36], consistent with its probiotic properties [27]. P. faecium, another SCFA producer, utilizes succinate, generated in the large intestine by bacteria of the Bacteroides and Parabacteroides genera, sustaining its abundance during aging [37]. The abundance of the five aforementioned commensal bacterial species may thus indicate healthy versus cancer-prone status and may serve as bacterial biomarkers of health, although prospective and experimental studies are required to provide deeper insight into their role.
On the other hand, P. distasonis appears to be a pathobiont in some cases, present in a healthy gut, while enriched in human abscesses, extra-intestinal abdominal infections and in Lynch syndrome patients [38,39,40,41]. While potentially anti-inflammatory and protective against CRC in other cases, it is associated with pre-existing inflammatory bowel disease in both humans and animal models [38]. Therefore, P. distasonis along with Proteobacteria species enriched in HRA individuals, may be indicative of intestinal inflammation and CRC risk.
Raw relative abundance of Gammaproteobacteria class and the Enterobacteriaceae family derived from Krona plots was many-fold higher in HRA individuals in agreement with their clear association with conventional and serrated adenomas [34,42]. Similarly, the low but detectable presence of the opportunistic pathogen and oncobacterium Fusobacterium nucleatum was only recorded in HRA individuals, indicating potential similarities between the microbial ecosystem composition within the gut of HRA individuals and CRC patients [43,44,45,46,47].
4.2. Fecal volatilome analysis
Methyl propionate, a carboxylic ester, and methyl butyrate, a fatty acid ester, were found elevated in the feces of HRA individuals, suggesting that these BCFAs may contribute to pathogenesis [48]. Both of them are low molecular weight volatiles, highly abundant in the human feces, and products of the exogenously esterification of propionate and butyrate derived from dietary fibers and microbial metabolism within the large intestine [5,49].
Isobutyric acid is a branched-chain saturated fatty acid primarily derived from the branched chain amino acid valine via intestinal fermentation mediated by Clostridium and Bacteroides species. Its concentration increases progressively along the proximodistal colon axis and in feces. BCFAs are proposed to affect human health but they are relatively unexplored compared to SCFAs [5]. Interestingly, we found isobutyric acid and Bacteroides and Clostridium genera in higher levels in the feces of HRA individuals. Similarly, we found methyl propionate, methyl butyrate and isobutyric acid in higher levels in HRA individuals, in agreement with previous findings about the greater abundance of isobutyric acid in CRC relative to HRA and healthy control individuals [50]. These BCFAs may thus serve as candidate biomarkers of CRC risk.
4.3. Fecal bacteriome to volatilome analysis
Spearman’s rank order correlation analysis of fecal bacteria families and genera with fecal VOCs revealed 11 FBG-VOC associations (Table 3), and 12 FBF-VOC associations (Table 4). Isobutyric acid correlates with the Lacnospiraceae incerta sedis, Bacteroides, Colinsella and Coprococcus genera in different ways between the NA and HRA groups (Table 4). This BCFA was positively correlated via predictive modeling using binomial logistic regression with Lacnospiraceae incerta sedis and Bacteroides in NA individuals, and negatively in HRA individuals (Figure 8). While isobutyric acid predictive modeling correlations with Coprococcus and Colinsella were found in reverse: negative in NA and positive in HRA individuals (Figure 8). BCFAs, such as isobutyric and isovaleric acids, are less abundant than SCFAs in the human large intestine and feces. They are markers of amino acid fermentation, and their intestinal and fecal abundance is related to diet and aging [5]. Previous studies indicate members of the Proteobacteria and Actinobacteria phyla, the Lachnospiraceae family, and Fusobacteria and Bacteroides genera as main producers of BCFAs and markers of colonic protein fermentation, a process that also generates p-cresol, phenol and ammonia [5,51,52]. Moreover, we associated Lachnospiraceae with 4 VOCs, propanal, methacrolein, methyl 4-methylvalerate, dimethyl trisulfide (Table 3). Propanal was also associated with Roseburia (Table 4), but the biological significance of the association of this and other potentially pathogenic VOCs with potentially beneficial bacteria is unclear due to the positive correlation of this volatile in breath (not fecal) samples of CRC patients [53]. Notably, breath sample VOCs are expected to defer from fecal VOCs, despite their potential predictive power [54,55].
Methyl butyrate, a volatile compound involved in SCFA butyrate production, corelates with Bacteroides and Coprococcus genera (Table 4). Moreover, it was positively correlated via predictive modeling with Bacteroides in NA individuals and negatively corelated in HRA individuals (Figure 8). On the other hand, methyl butyrate was negatively correlated with Coprococcus in NA individuals and positively corelated in HRA individuals (Figure 8). These observations need to be further investigated, since Bacteroides and Coprococcus genera are abundant SCFA producers and regulators of protein fermentation and complex oligosaccharides digestion within the gut [51,56].
We also highlighted ethyl acetone (2-hexanone) as highly abundant in the human feces [57], which was positively correlated with Eubacterium in NA individuals, while negatively in HRA individuals (Table 4 and Figure 8). Depletion of Eubacterium is noted in IBD individuals and those adopting a western diet of high intake of animal protein and fat and less intake of plant fiber [58]. Furthermore, ethyl acetone was positively correlated with Holdemanella, an Erysipelotrichaceae family member, in NA individuals, while negatively correlated with HRAs. Both associations need to be further investigated, since Holdemanella biformis has been suggested as an antitumorigenic SCFA-generator able to control CRC cell proliferation and intestinal metabolism [59,60,61].
P-cresol and indole were detected in all fecal samples tested, since they are the main fermentation products of the essential amino acids, phenylalanine and tyrosine (p-cresol) and tryptophan (indole). Both volatiles are also products of bacterial metabolism within the large intestine, and precursors of toxic metabolite compounds, referred to as uremic toxins, with p-cresol having a potential to contribute to genotoxicity and colorectal oncogenesis. Their concentration among fecal samples varies widely, as a result of dietary differences and protein intake from animal versus plant sources [62]. Both p-cresol and indole were positively correlated with Fusicatenibacter abundance in both subgroups of NA and HRA subjects, although p-cresol was overall more abundant than indole. This agrees with previous studies showing members of the Lachnospiraceae, Clostridiaceae, Eubacteriaceae, Peptostreptococcaceae, Enterobacteriaceae, Oscillospiraceae and Sutterellaceae families produce p-cresol and indole in culture [63,64], and associate with p-cresol and indole in human feces [62].
Despite the wealth of bacteriome and volatile correlations, no combinatorial biomarkers of CRC risk have been established [65,66]. Thus, microbial-metabolite signatures need to be further investigated to address the potentially toxic volatiles differentially produced by the dysbiotic microbiome of HRA individuals. One limitation of this and previous studies is that metagenomics and volatolomics analyses used fecal samples, reflecting the relative abundances of bacterial communities and VOCs at the lumen of the distal GI tract, without taking into consideration the other parts of the colon or the mucosa. Different levels of microbial abundances and volatiles emission derived in fecal matter cannot directly reflect the complex host-microbiota interactions taking place within the colonic mucosa of proximal and distal colon. Hence, studies sampling different sites along the colonic mucosa may provide a broader picture of the metagenomic and metabolomic milieu.
Supplementary Materials
The following supporting information can be downloaded at the website of this paper posted on Preprints.org.
Funding
This work was funded by the Republic of Cyprus “Restart 2016–2020 Programmes” through the Research and Innovation Foundation (MoCo Project: EXCELLENCE/1216/0523).
References
- Xi, Y.; Xu, P. Global colorectal cancer burden in 2020 and projections to 2040. Transl Oncol 2021, 14, 101174. [Google Scholar] [CrossRef]
- Katsaounou, K.; Nicolaou, E.; Vogazianos, P.; Brown, C.; Stavrou, M.; Teloni, S.; Hatzis, P.; Agapiou, A.; Fragkou, E.; Tsiaoussis, G.; et al. Colon Cancer: From Epidemiology to Prevention. Metabolites 2022, 12. [Google Scholar] [CrossRef]
- Panayidou, S.; Apidianakis, Y. Regenerative inflammation: lessons from Drosophila intestinal epithelium in health and disease. Pathogens 2013, 2, 209–231. [Google Scholar] [CrossRef]
- de Vos, W.M.; Tilg, H.; Van Hul, M.; Cani, P.D. Gut microbiome and health: mechanistic insights. Gut 2022, 71, 1020–1032. [Google Scholar] [CrossRef]
- Rios-Covian, D.; Gonzalez, S.; Nogacka, A.M.; Arboleya, S.; Salazar, N.; Gueimonde, M.; de Los Reyes-Gavilan, C.G. An Overview on Fecal Branched Short-Chain Fatty Acids Along Human Life and as Related With Body Mass Index: Associated Dietary and Anthropometric Factors. Front Microbiol 2020, 11, 973. [Google Scholar] [CrossRef]
- Kostic, A.D.; Chun, E.; Robertson, L.; Glickman, J.N.; Gallini, C.A.; Michaud, M.; Clancy, T.E.; Chung, D.C.; Lochhead, P.; Hold, G.L.; et al. Fusobacterium nucleatum potentiates intestinal tumorigenesis and modulates the tumor-immune microenvironment. Cell Host Microbe 2013, 14, 207–215. [Google Scholar] [CrossRef] [PubMed]
- Clos-Garcia, M.; Garcia, K.; Alonso, C.; Iruarrizaga-Lejarreta, M.; D’Amato, M.; Crespo, A.; Iglesias, A.; Cubiella, J.; Bujanda, L.; Falcon-Perez, J.M. Integrative Analysis of Fecal Metagenomics and Metabolomics in Colorectal Cancer. Cancers (Basel) 2020, 12. [Google Scholar] [CrossRef] [PubMed]
- Xie, Y.H.; Gao, Q.Y.; Cai, G.X.; Sun, X.M.; Sun, X.M.; Zou, T.H.; Chen, H.M.; Yu, S.Y.; Qiu, Y.W.; Gu, W.Q.; et al. Fecal Clostridium symbiosum for Noninvasive Detection of Early and Advanced Colorectal Cancer: Test and Validation Studies. EBioMedicine 2017, 25, 32–40. [Google Scholar] [CrossRef] [PubMed]
- Rezasoltani, S.; Sharafkhah, M.; Asadzadeh Aghdaei, H.; Nazemalhosseini Mojarad, E.; Dabiri, H.; Akhavan Sepahi, A.; Modarressi, M.H.; Feizabadi, M.M.; Zali, M.R. Applying simple linear combination, multiple logistic and factor analysis methods for candidate fecal bacteria as novel biomarkers for early detection of adenomatous polyps and colon cancer. J Microbiol Methods 2018, 155, 82–88. [Google Scholar] [CrossRef] [PubMed]
- Long, X.; Wong, C.C.; Tong, L.; Chu, E.S.H.; Ho Szeto, C.; Go, M.Y.Y.; Coker, O.O.; Chan, A.W.H.; Chan, F.K.L.; Sung, J.J.Y.; et al. Peptostreptococcus anaerobius promotes colorectal carcinogenesis and modulates tumour immunity. Nat Microbiol 2019, 4, 2319–2330. [Google Scholar] [CrossRef] [PubMed]
- Iyadorai, T.; Mariappan, V.; Vellasamy, K.M.; Wanyiri, J.W.; Roslani, A.C.; Lee, G.K.; Sears, C.; Vadivelu, J. Prevalence and association of pks+ Escherichia coli with colorectal cancer in patients at the University Malaya Medical Centre, Malaysia. PLoS One 2020, 15, e0228217. [Google Scholar] [CrossRef] [PubMed]
- Vernia, F.; Valvano, M.; Fabiani, S.; Stefanelli, G.; Longo, S.; Viscido, A.; Latella, G. Are Volatile Organic Compounds Accurate Markers in the Assessment of Colorectal Cancer and Inflammatory Bowel Diseases? A Review. Cancers (Basel) 2021, 13. [Google Scholar] [CrossRef] [PubMed]
- Monedeiro, F.; Monedeiro-Milanowski, M.; Ligor, T.; Buszewski, B. A Review of GC-Based Analysis of Non-Invasive Biomarkers of Colorectal Cancer and Related Pathways. J Clin Med 2020, 9. [Google Scholar] [CrossRef] [PubMed]
- Nagata, N.; Tohya, M.; Fukuda, S.; Suda, W.; Nishijima, S.; Takeuchi, F.; Ohsugi, M.; Tsujimoto, T.; Nakamura, T.; Shimomura, A.; et al. Effects of bowel preparation on the human gut microbiome and metabolome. Sci Rep 2019, 9, 4042. [Google Scholar] [CrossRef]
- Lieberman, D.A.; Rex, D.K.; Winawer, S.J.; Giardiello, F.M.; Johnson, D.A.; Levin, T.R. Guidelines for colonoscopy surveillance after screening and polypectomy: a consensus update by the US Multi-Society Task Force on Colorectal Cancer. Gastroenterology 2012, 143, 844–857. [Google Scholar] [CrossRef]
- Lee, J.K.; Jensen, C.D.; Levin, T.R.; Doubeni, C.A.; Zauber, A.G.; Chubak, J.; Kamineni, A.S.; Schottinger, J.E.; Ghai, N.R.; Udaltsova, N.; et al. Long-term Risk of Colorectal Cancer and Related Death After Adenoma Removal in a Large, Community-based Population. Gastroenterology 2020, 158, 884–894. [Google Scholar] [CrossRef]
- Fadeev, E.; Cardozo-Mino, M.G.; Rapp, J.Z.; Bienhold, C.; Salter, I.; Salman-Carvalho, V.; Molari, M.; Tegetmeyer, H.E.; Buttigieg, P.L.; Boetius, A. Comparison of Two 16S rRNA Primers (V3-V4 and V4-V5) for Studies of Arctic Microbial Communities. Front Microbiol 2021, 12, 637526. [Google Scholar] [CrossRef]
- Alishum, A. DADA2 formatted 16S rRNA gene sequences for both bacteria & archaea. 2022. [CrossRef]
- Ondov, B.D.; Bergman, N.H.; Phillippy, A.M. Interactive metagenomic visualization in a Web browser. BMC Bioinformatics 2011, 12, 385. [Google Scholar] [CrossRef]
- vegan: Community Ecology Package. Available online: https://cran.r-project.org/web/packages/vegan/index.html.
- factoextra: Extract and Visualize the Results of Multivariate Data Analyses. Available online: https://cran.r-project.org/web/packages/factoextra/index.html.
- gplots: Various R Programming Tools for Plotting Data. Available online: https://cran.r-project.org/web/packages/gplots/index.html.
- He, T.; Cheng, X.; Xing, C. The gut microbial diversity of colon cancer patients and the clinical significance. Bioengineered 2021, 12, 7046–7060. [Google Scholar] [CrossRef] [PubMed]
- Hexun, Z.; Miyake, T.; Maekawa, T.; Mori, H.; Yasukawa, D.; Ohno, M.; Nishida, A.; Andoh, A.; Tani, M. High abundance of Lachnospiraceae in the human gut microbiome is related to high immunoscores in advanced colorectal cancer. Cancer Immunol Immunother 2023, 72, 315–326. [Google Scholar] [CrossRef] [PubMed]
- Zhao, L.; Cho, W.C.; Nicolls, M.R. Colorectal Cancer-Associated Microbiome Patterns and Signatures. Front Genet 2021, 12, 787176. [Google Scholar] [CrossRef]
- Nie, K.; Ma, K.; Luo, W.; Shen, Z.; Yang, Z.; Xiao, M.; Tong, T.; Yang, Y.; Wang, X. Roseburia intestinalis: A Beneficial Gut Organism From the Discoveries in Genus and Species. Front Cell Infect Microbiol 2021, 11, 757718. [Google Scholar] [CrossRef] [PubMed]
- Liu, X.; Mao, B.; Gu, J.; Wu, J.; Cui, S.; Wang, G.; Zhao, J.; Zhang, H.; Chen, W. Blautia-a new functional genus with potential probiotic properties? Gut Microbes 2021, 13, 1–21. [Google Scholar] [CrossRef]
- Nilsen, M.; Madelen Saunders, C.; Leena Angell, I.; Arntzen, M.O.; Lodrup Carlsen, K.C.; Carlsen, K.H.; Haugen, G.; Hagen, L.H.; Carlsen, M.H.; Hedlin, G.; et al. Butyrate Levels in the Transition from an Infant- to an Adult-Like Gut Microbiota Correlate with Bacterial Networks Associated with Eubacterium Rectale and Ruminococcus Gnavus. Genes (Basel) 2020, 11. [Google Scholar] [CrossRef] [PubMed]
- Ikeyama, N.; Murakami, T.; Toyoda, A.; Mori, H.; Iino, T.; Ohkuma, M.; Sakamoto, M. Microbial interaction between the succinate-utilizing bacterium Phascolarctobacterium faecium and the gut commensal Bacteroides thetaiotaomicron. Microbiologyopen 2020, 9, e1111. [Google Scholar] [CrossRef] [PubMed]
- Liu, C.; Li, Z.; Ding, J.; Zhen, H.; Fang, M.; Nie, C. Species-Level Analysis of the Human Gut Microbiome Shows Antibiotic Resistance Genes Associated With Colorectal Cancer. Front Microbiol 2021, 12, 765291. [Google Scholar] [CrossRef] [PubMed]
- Adlung, L.; Elinav, E.; Greten, T.F.; Korangy, F. Microbiome genomics for cancer prediction. Nat Cancer 2020, 1, 379–381. [Google Scholar] [CrossRef] [PubMed]
- Sivan, A.; Corrales, L.; Hubert, N.; Williams, J.B.; Aquino-Michaels, K.; Earley, Z.M.; Benyamin, F.W.; Lei, Y.M.; Jabri, B.; Alegre, M.L.; et al. Commensal Bifidobacterium promotes antitumor immunity and facilitates anti-PD-L1 efficacy. Science 2015, 350, 1084–1089. [Google Scholar] [CrossRef]
- Gopalakrishnan, V.; Spencer, C.N.; Nezi, L.; Reuben, A.; Andrews, M.C.; Karpinets, T.V.; Prieto, P.A.; Vicente, D.; Hoffman, K.; Wei, S.C.; et al. Gut microbiome modulates response to anti-PD-1 immunotherapy in melanoma patients. Science 2018, 359, 97–103. [Google Scholar] [CrossRef]
- Peters, B.A.; Dominianni, C.; Shapiro, J.A.; Church, T.R.; Wu, J.; Miller, G.; Yuen, E.; Freiman, H.; Lustbader, I.; Salik, J.; et al. The gut microbiota in conventional and serrated precursors of colorectal cancer. Microbiome 2016, 4, 69. [Google Scholar] [CrossRef]
- Coker, O.O.; Liu, C.; Wu, W.K.K.; Wong, S.H.; Jia, W.; Sung, J.J.Y.; Yu, J. Altered gut metabolites and microbiota interactions are implicated in colorectal carcinogenesis and can be non-invasive diagnostic biomarkers. Microbiome 2022, 10, 35. [Google Scholar] [CrossRef] [PubMed]
- Wei, P.L.; Hung, C.S.; Kao, Y.W.; Lin, Y.C.; Lee, C.Y.; Chang, T.H.; Shia, B.C.; Lin, J.C. Classification of Changes in the Fecal Microbiota Associated with Colonic Adenomatous Polyps Using a Long-Read Sequencing Platform. Genes (Basel) 2020, 11. [Google Scholar] [CrossRef] [PubMed]
- Wu, F.; Guo, X.; Zhang, J.; Zhang, M.; Ou, Z.; Peng, Y. Phascolarctobacterium faecium abundant colonization in human gastrointestinal tract. Exp Ther Med 2017, 14, 3122–3126. [Google Scholar] [CrossRef] [PubMed]
- Ezeji, J.C.; Sarikonda, D.K.; Hopperton, A.; Erkkila, H.L.; Cohen, D.E.; Martinez, S.P.; Cominelli, F.; Kuwahara, T.; Dichosa, A.E.K.; Good, C.E.; et al. Parabacteroides distasonis: intriguing aerotolerant gut anaerobe with emerging antimicrobial resistance and pathogenic and probiotic roles in human health. Gut Microbes 2021, 13, 1922241. [Google Scholar] [CrossRef] [PubMed]
- Lu. X.-j.; Kang, Q.J., P.; Sheng, J.-q. The Interactions Between Gut Microbiota and Lynch Syndrome. Clinical Gastroenterology and Hepatology 2017, 15. [Google Scholar]
- Mori, G.; Orena, B.S.; Cultrera, I.; Barbieri, G.; Albertini, A.M.; Ranzani, G.N.; Carnevali, I.; Tibiletti, M.G.; Pasca, M.R. Gut Microbiota Analysis in Postoperative Lynch Syndrome Patients. Front Microbiol 2019, 10, 1746. [Google Scholar] [CrossRef] [PubMed]
- Mori, G.; Pasca, M.R. Gut Microbial Signatures in Sporadic and Hereditary Colorectal Cancer. Int J Mol Sci 2021, 22. [Google Scholar] [CrossRef] [PubMed]
- Dejea, C.M.; Wick, E.C.; Hechenbleikner, E.M.; White, J.R.; Mark Welch, J.L.; Rossetti, B.J.; Peterson, S.N.; Snesrud, E.C.; Borisy, G.G.; Lazarev, M.; et al. Microbiota organization is a distinct feature of proximal colorectal cancers. Proc Natl Acad Sci U S A 2014, 111, 18321–18326. [Google Scholar] [CrossRef]
- Brennan, C.A.; Garrett, W.S. Fusobacterium nucleatum—symbiont, opportunist and oncobacterium. Nature Reviews Microbiology 2019, 17, 156–166. [Google Scholar] [CrossRef]
- Yang, J.; McDowell, A.; Kim, E.K.; Seo, H.; Lee, W.H.; Moon, C.M.; Kym, S.M.; Lee, D.H.; Park, Y.S.; Jee, Y.K.; et al. Development of a colorectal cancer diagnostic model and dietary risk assessment through gut microbiome analysis. Exp Mol Med 2019, 51, 1–15. [Google Scholar] [CrossRef]
- Olovo, C.V.; Huang, X.; Zheng, X.; Xu, M. Faecal microbial biomarkers in early diagnosis of colorectal cancer. J Cell Mol Med 2021, 25, 10783–10797. [Google Scholar] [CrossRef]
- Kostic, A.D.; Gevers, D.; Pedamallu, C.S.; Michaud, M.; Duke, F.; Earl, A.M.; Ojesina, A.I.; Jung, J.; Bass, A.J.; Tabernero, J.; et al. Genomic analysis identifies association of Fusobacterium with colorectal carcinoma. Genome Res 2012, 22, 292–298. [Google Scholar] [CrossRef]
- Cheng, W.T.; Kantilal, H.K.; Davamani, F. The Mechanism of Bacteroides fragilis Toxin Contributes to Colon Cancer Formation. Malays J Med Sci 2020, 27, 9–21. [Google Scholar] [CrossRef]
- Sanna, S.; van Zuydam, N.R.; Mahajan, A.; Kurilshikov, A.; Vich Vila, A.; Võsa, U.; Mujagic, Z.; Masclee, A.A.M.; Jonkers, D.M.A.E.; Oosting, M.; et al. Causal relationships among the gut microbiome, short-chain fatty acids and metabolic diseases. Nature Genetics 2019, 51, 600–605. [Google Scholar] [CrossRef] [PubMed]
- de Lacy Costello, B.; Amann, A.; Al-Kateb, H.; Flynn, C.; Filipiak, W.; Khalid, T.; Osborne, D.; Ratcliffe, N.M. A review of the volatiles from the healthy human body. J Breath Res 2014, 8, 014001. [Google Scholar] [CrossRef]
- Niccolai, E.; Baldi, S.; Ricci, F.; Russo, E.; Nannini, G.; Menicatti, M.; Poli, G.; Taddei, A.; Bartolucci, G.; Calabro, A.S.; et al. Evaluation and comparison of short chain fatty acids composition in gut diseases. World J Gastroenterol 2019, 25, 5543–5558. [Google Scholar] [CrossRef] [PubMed]
- Horvath, T.D.; Ihekweazu, F.D.; Haidacher, S.J.; Ruan, W.; Engevik, K.A.; Fultz, R.; Hoch, K.M.; Luna, R.A.; Oezguen, N.; Spinler, J.K.; et al. Bacteroides ovatus colonization influences the abundance of intestinal short chain fatty acids and neurotransmitters. iScience 2022, 25, 104158. [Google Scholar] [CrossRef]
- Abdugheni, R.W. , W-Z.; Wang, Y.J.; Du, M-X.; Liu, F-L.; Zhou N.; Jiang, C-Y.; Wang, C-Y.; Wu, L.; Ma, J.; Liu, C.; Liu, S-J.;. Metabolite profiling of human-originated Lachnospiraceae at the strain level. iMeta 2022, 1. [Google Scholar]
- Markar, S.R.; Chin, S.T.; Romano, A.; Wiggins, T.; Antonowicz, S.; Paraskeva, P.; Ziprin, P.; Darzi, A.; Hanna, G.B. Breath Volatile Organic Compound Profiling of Colorectal Cancer Using Selected Ion Flow-tube Mass Spectrometry. Ann Surg 2019, 269, 903–910. [Google Scholar] [CrossRef]
- Woodfield, G.; Belluomo, I.; Laponogov, I.; Veselkov, K.; Cobra1 Working, G.; Cross, A.J.; Hanna, G.B. Diagnostic Performance of a Noninvasive Breath Test for Colorectal Cancer: COBRA1 Study. Gastroenterology 2022, 163, 1447–1449. [Google Scholar] [CrossRef] [PubMed]
- Amal, H.; Leja, M.; Funka, K.; Lasina, I.; Skapars, R.; Sivins, A.; Ancans, G.; Kikuste, I.; Vanags, A.; Tolmanis, I.; et al. Breath testing as potential colorectal cancer screening tool. International Journal of Cancer 2016, 138, 229–236. [Google Scholar] [CrossRef]
- Li, Y.; Faden, H.S.; Zhu, L. The Response of the Gut Microbiota to Dietary Changes in the First Two Years of Life. Front Pharmacol 2020, 11, 334. [Google Scholar] [CrossRef]
- Garner, C.E.; Smith, S.; de Lacy Costello, B.; White, P.; Spencer, R.; Probert, C.S.; Ratcliffe, N.M. Volatile organic compounds from feces and their potential for diagnosis of gastrointestinal disease. FASEB J 2007, 21, 1675–1688. [Google Scholar] [CrossRef]
- Enzo, S.; Silvia, T.; Sheri, S.; Renato, S.; Dario, A.; Maria Chiara, V. Natural Compounds in the Modulation of the Intestinal Microbiota: Implications in Human Physiology and Pathology. In Alternative Medicine, Muhammad, A., Ed.; IntechOpen: Rijeka, 2020. [Google Scholar]
- Zagato, E.; Pozzi, C.; Bertocchi, A.; Schioppa, T.; Saccheri, F.; Guglietta, S.; Fosso, B.; Melocchi, L.; Nizzoli, G.; Troisi, J.; et al. Endogenous murine microbiota member Faecalibaculum rodentium and its human homologue protect from intestinal tumour growth. Nat Microbiol 2020, 5, 511–524. [Google Scholar] [CrossRef] [PubMed]
- Romani-Perez, M.; Lopez-Almela, I.; Bullich-Vilarrubias, C.; Rueda-Ruzafa, L.; Gomez Del Pulgar, E.M.; Benitez-Paez, A.; Liebisch, G.; Lamas, J.A.; Sanz, Y. Holdemanella biformis improves glucose tolerance and regulates GLP-1 signaling in obese mice. FASEB J 2021, 35, e21734. [Google Scholar] [CrossRef]
- Hindson, J. Anti-tumorigenic endogenous gut bacteria in mice and humans. Nat Rev Gastroenterol Hepatol 2020, 17, 132. [Google Scholar] [CrossRef] [PubMed]
- Candeliere, F.; Simone, M.; Leonardi, A.; Rossi, M.; Amaretti, A.; Raimondi, S. Indole and p-cresol in feces of healthy subjects: Concentration, kinetics, and correlation with microbiome. Frontiers in Molecular Medicine 2022, 2. [Google Scholar] [CrossRef]
- Amaretti, A.; Gozzoli, C.; Simone, M.; Raimondi, S.; Righini, L.; Perez-Brocal, V.; Garcia-Lopez, R.; Moya, A.; Rossi, M. Profiling of Protein Degraders in Cultures of Human Gut Microbiota. Front Microbiol 2019, 10, 2614. [Google Scholar] [CrossRef]
- Raimondi, S.; Calvini, R.; Candeliere, F.; Leonardi, A.; Ulrici, A.; Rossi, M.; Amaretti, A. Multivariate Analysis in Microbiome Description: Correlation of Human Gut Protein Degraders, Metabolites, and Predicted Metabolic Functions. Front Microbiol 2021, 12, 723479. [Google Scholar] [CrossRef]
- Louis, P.; Hold, G.L.; Flint, H.J. The gut microbiota, bacterial metabolites and colorectal cancer. Nat Rev Microbiol 2014, 12, 661–672. [Google Scholar] [CrossRef]
- Zackular, J.P.; Rogers, M.A.M.; Ruffin, M.T., IV; Schloss, P.D. The Human Gut Microbiome as a Screening Tool for Colorectal Cancer. Cancer Prevention Research 2014, 7, 1112–1121. [Google Scholar] [CrossRef] [PubMed]
Figure 1.
Krona plots of NA (https://www.stremble.com/papersuplements/KronaGroupHealthy.html) individuals showing the percentile of identified sequence reads and their phylum to genus hierarchy.
Figure 1.
Krona plots of NA (https://www.stremble.com/papersuplements/KronaGroupHealthy.html) individuals showing the percentile of identified sequence reads and their phylum to genus hierarchy.
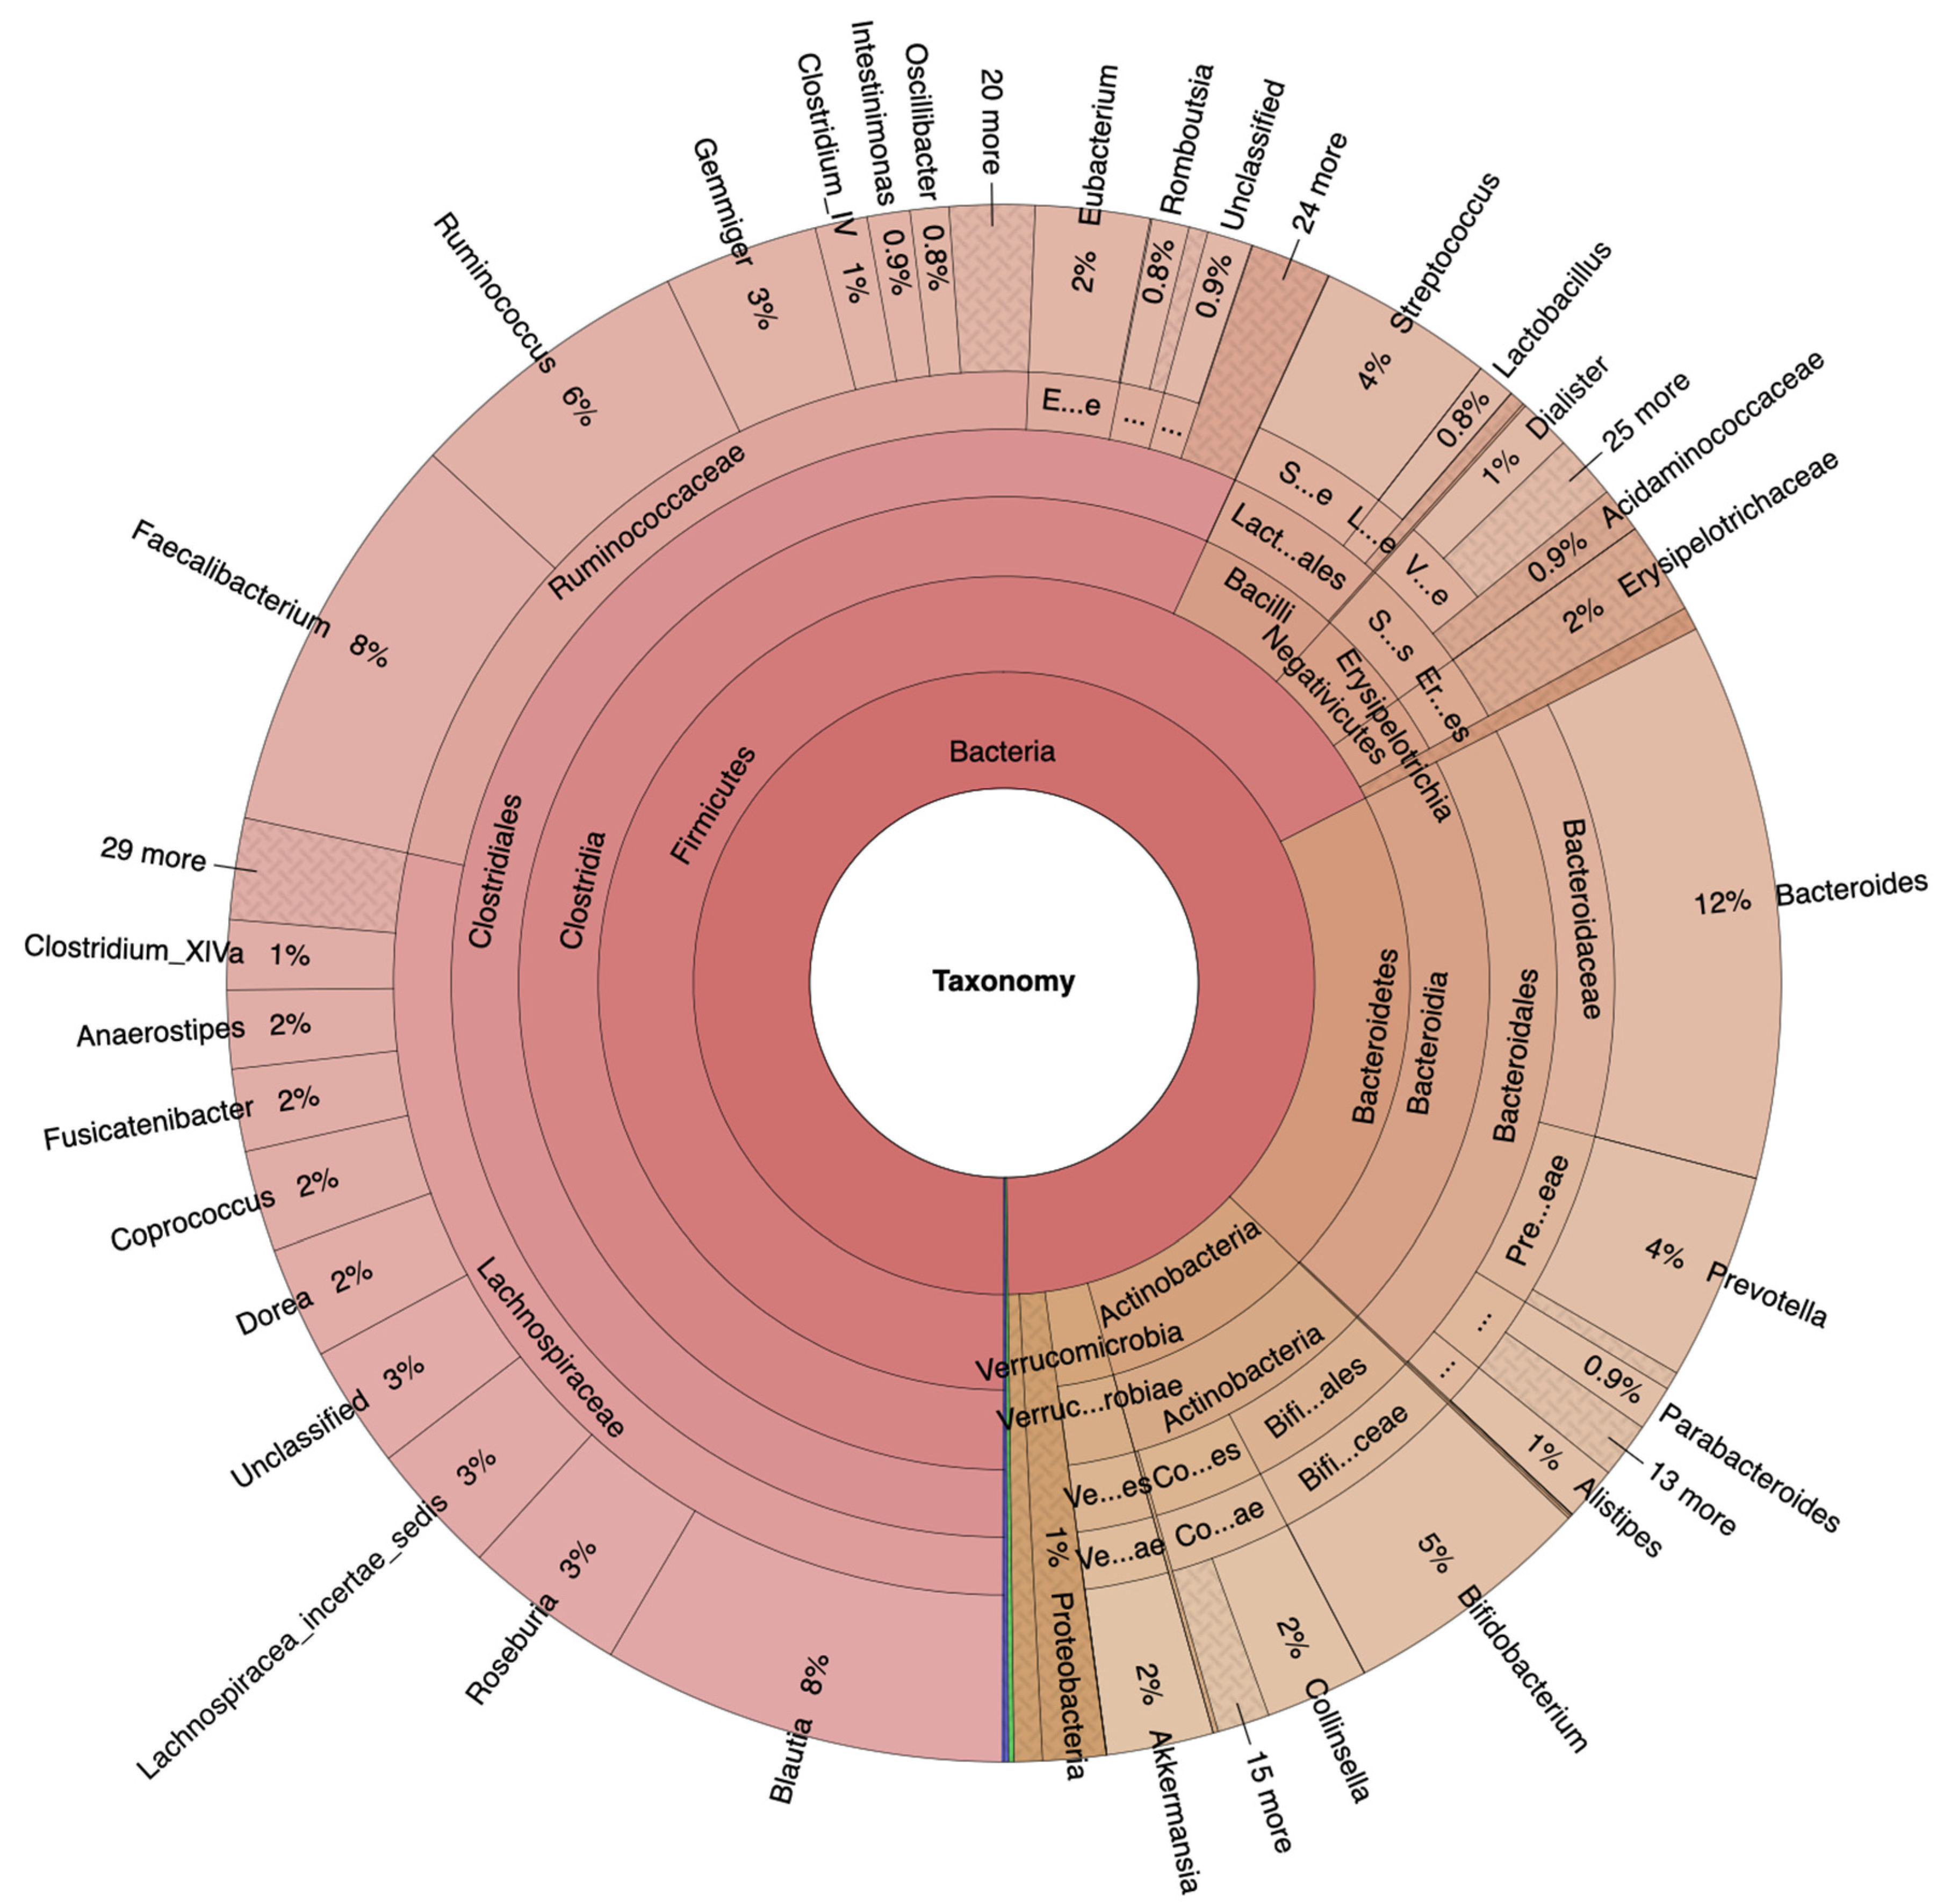
Figure 2.
Krona plots of HRA (https://www.stremble.com/papersuplements/KronaGroupCancerProne.html) individuals showing the percentile of identified sequence reads and their phylum to genus hierarchy.
Figure 2.
Krona plots of HRA (https://www.stremble.com/papersuplements/KronaGroupCancerProne.html) individuals showing the percentile of identified sequence reads and their phylum to genus hierarchy.
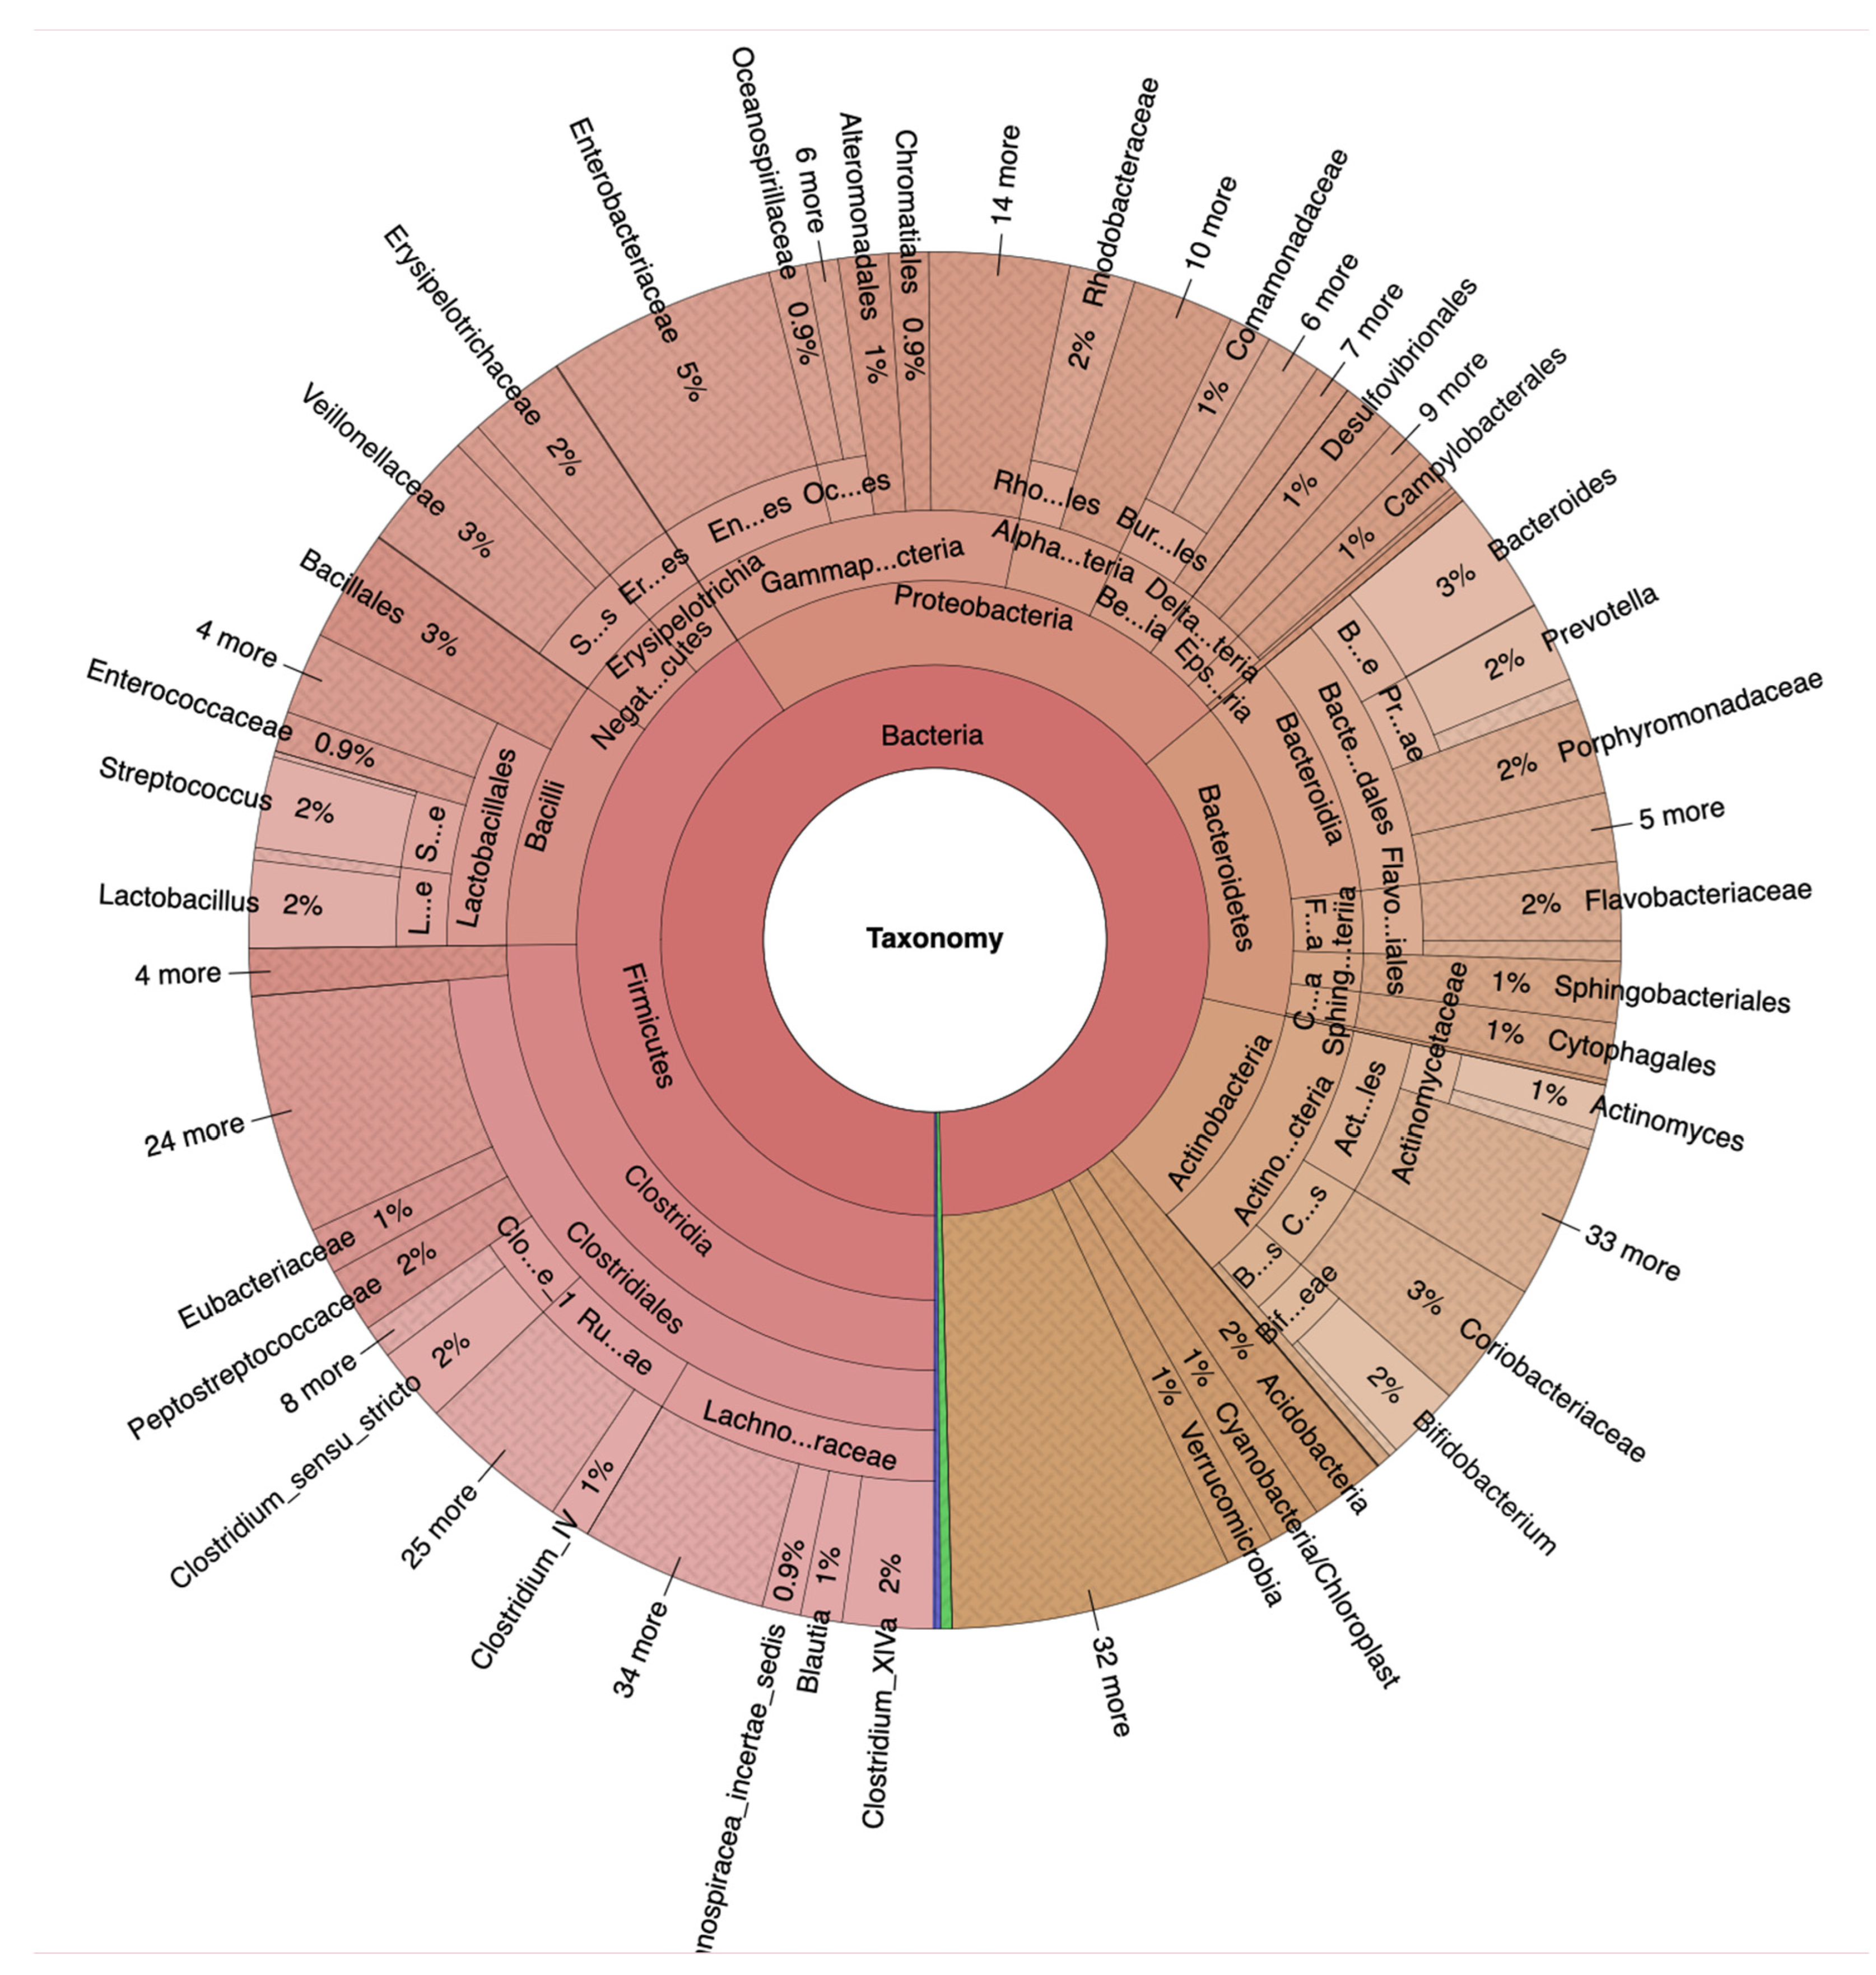
Figure 3.
Average relative abundance of specific bacterial taxa displaying significant differences between the NA (green) and the HRA (brown) individuals. The mean is indicated by the horizontal line dividing each box in two. The top and the bottom of each box indicate the mean plus/minus the standard error. Dots display data points and p-value indicates the significance of the difference between NA and HRA.
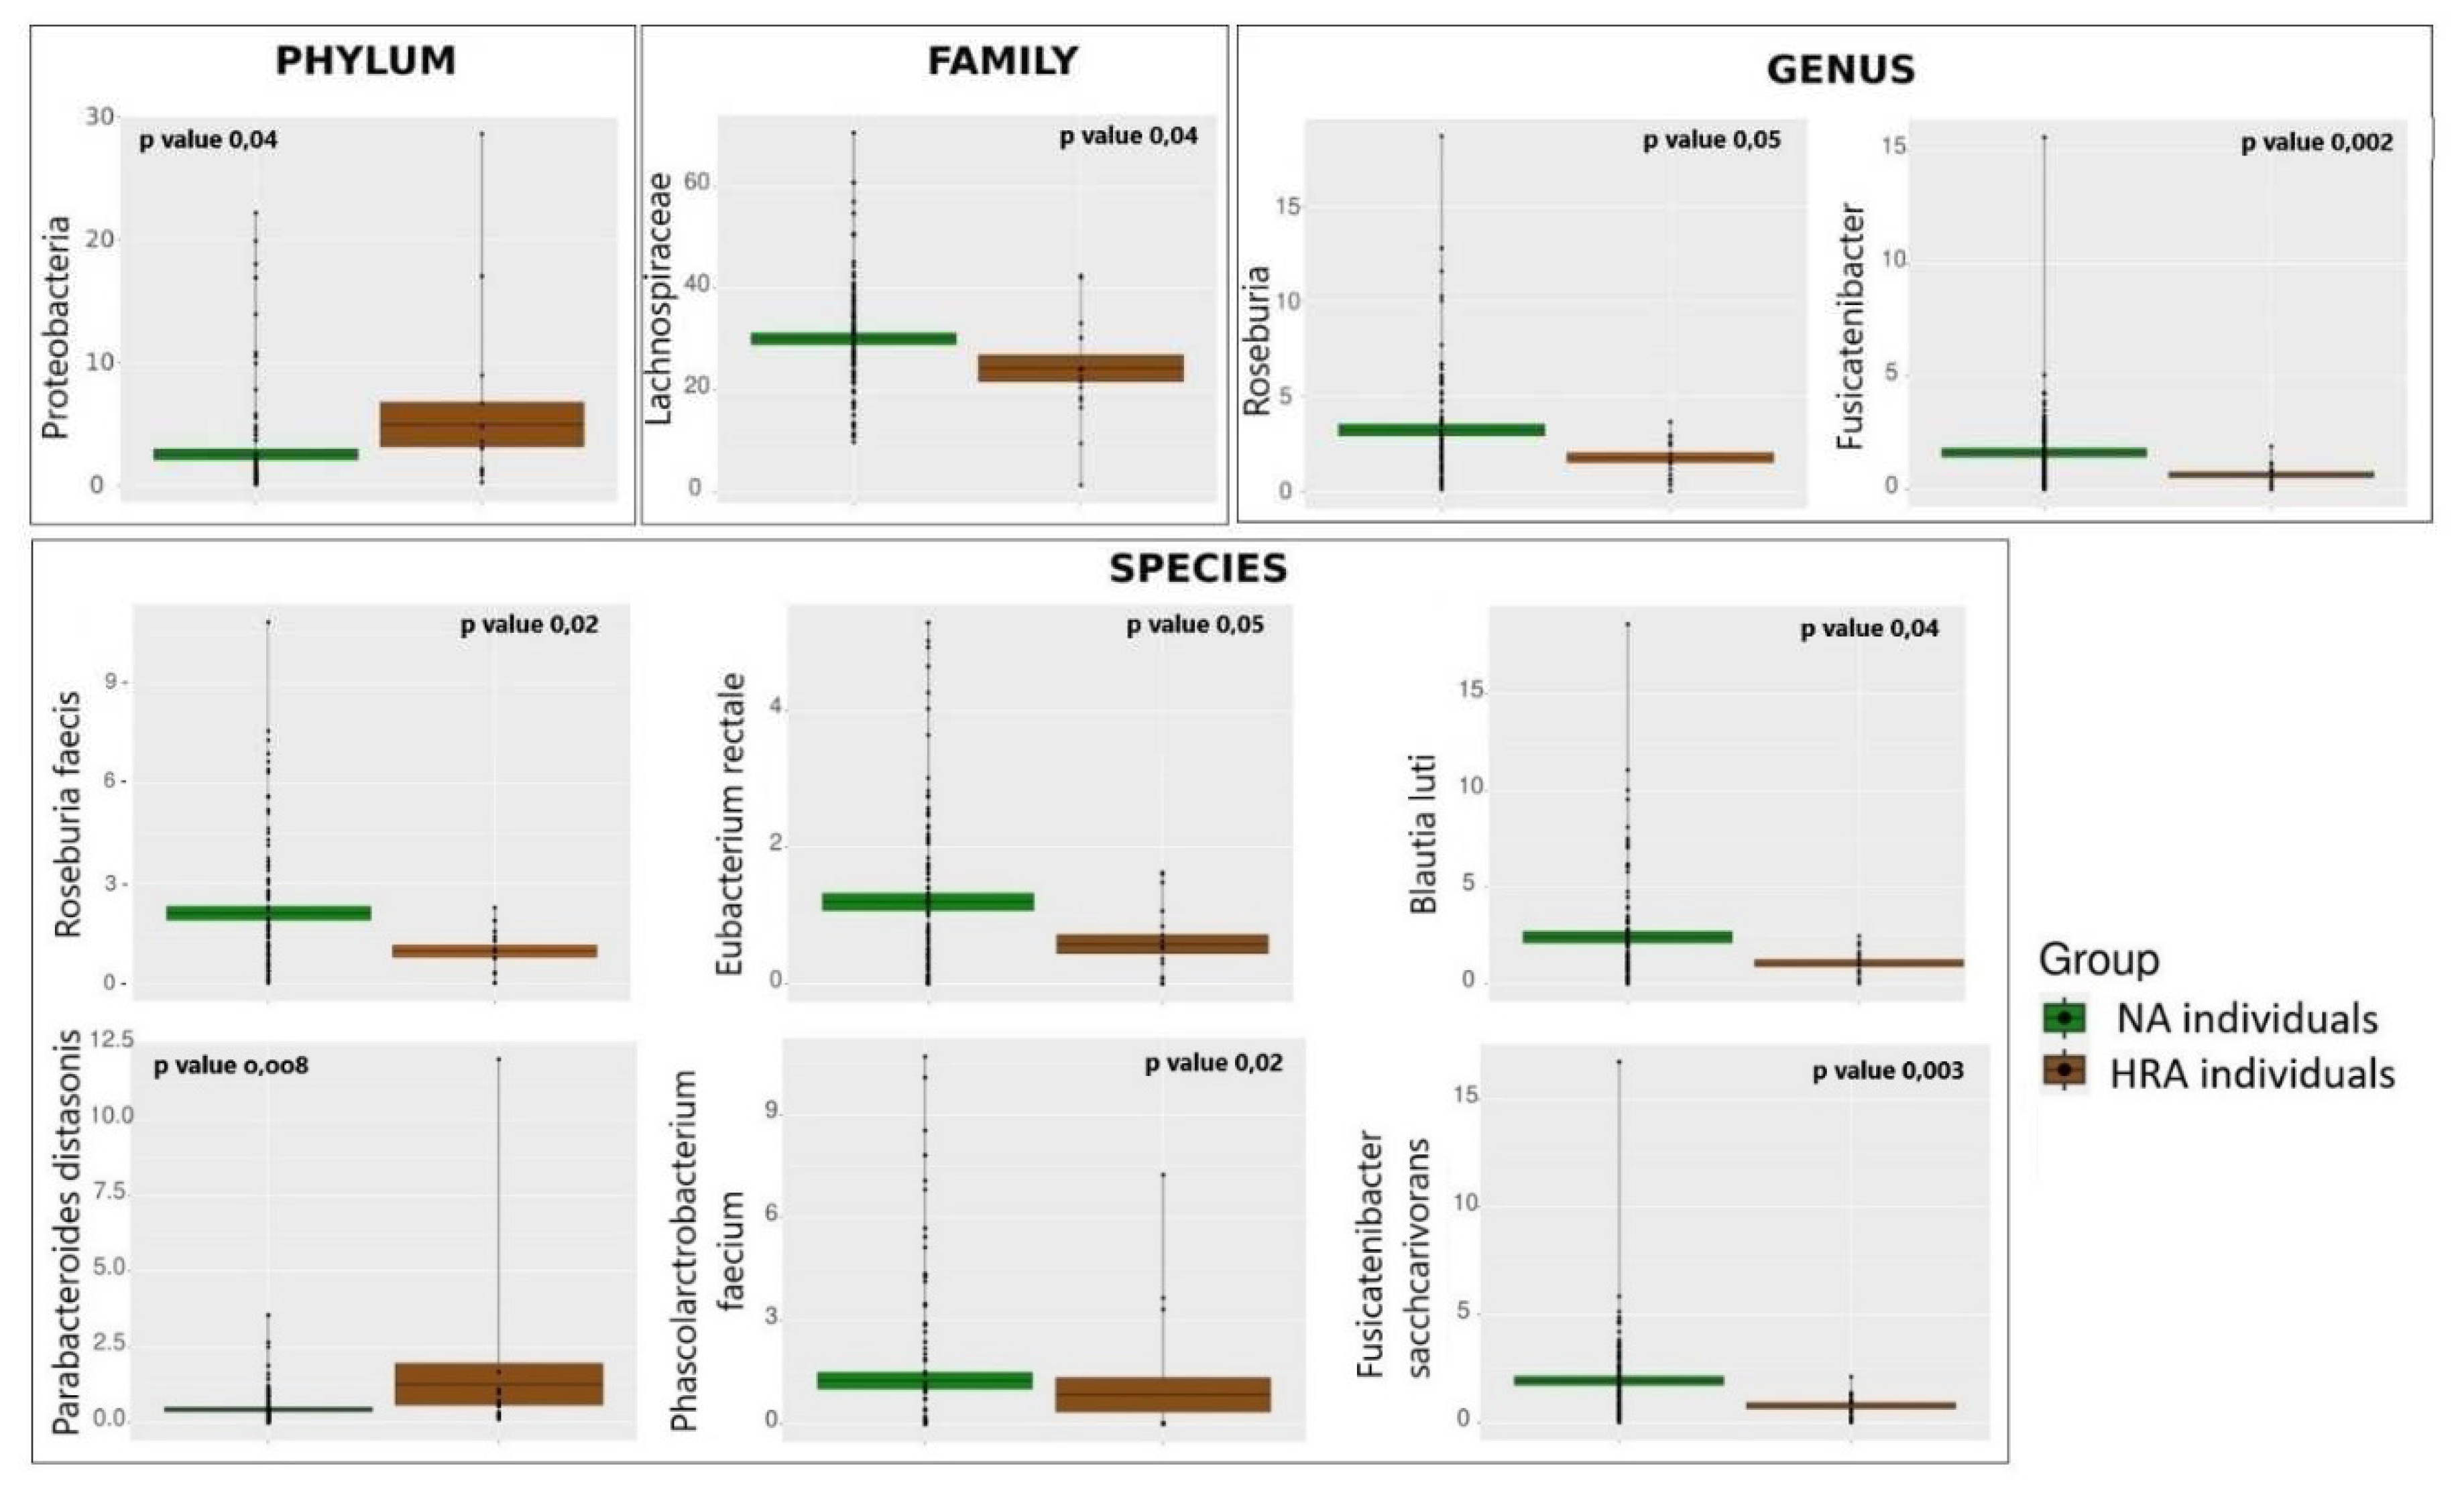
Figure 4.
Relative abundance of VOCs displaying significant differences between the NA (green) and the HRA (brown) group. The mean is indicated by the horizontal line dividing each box in two. The top and the bottom of the box indicate the mean plus/minus the standard error. Dots display data points.
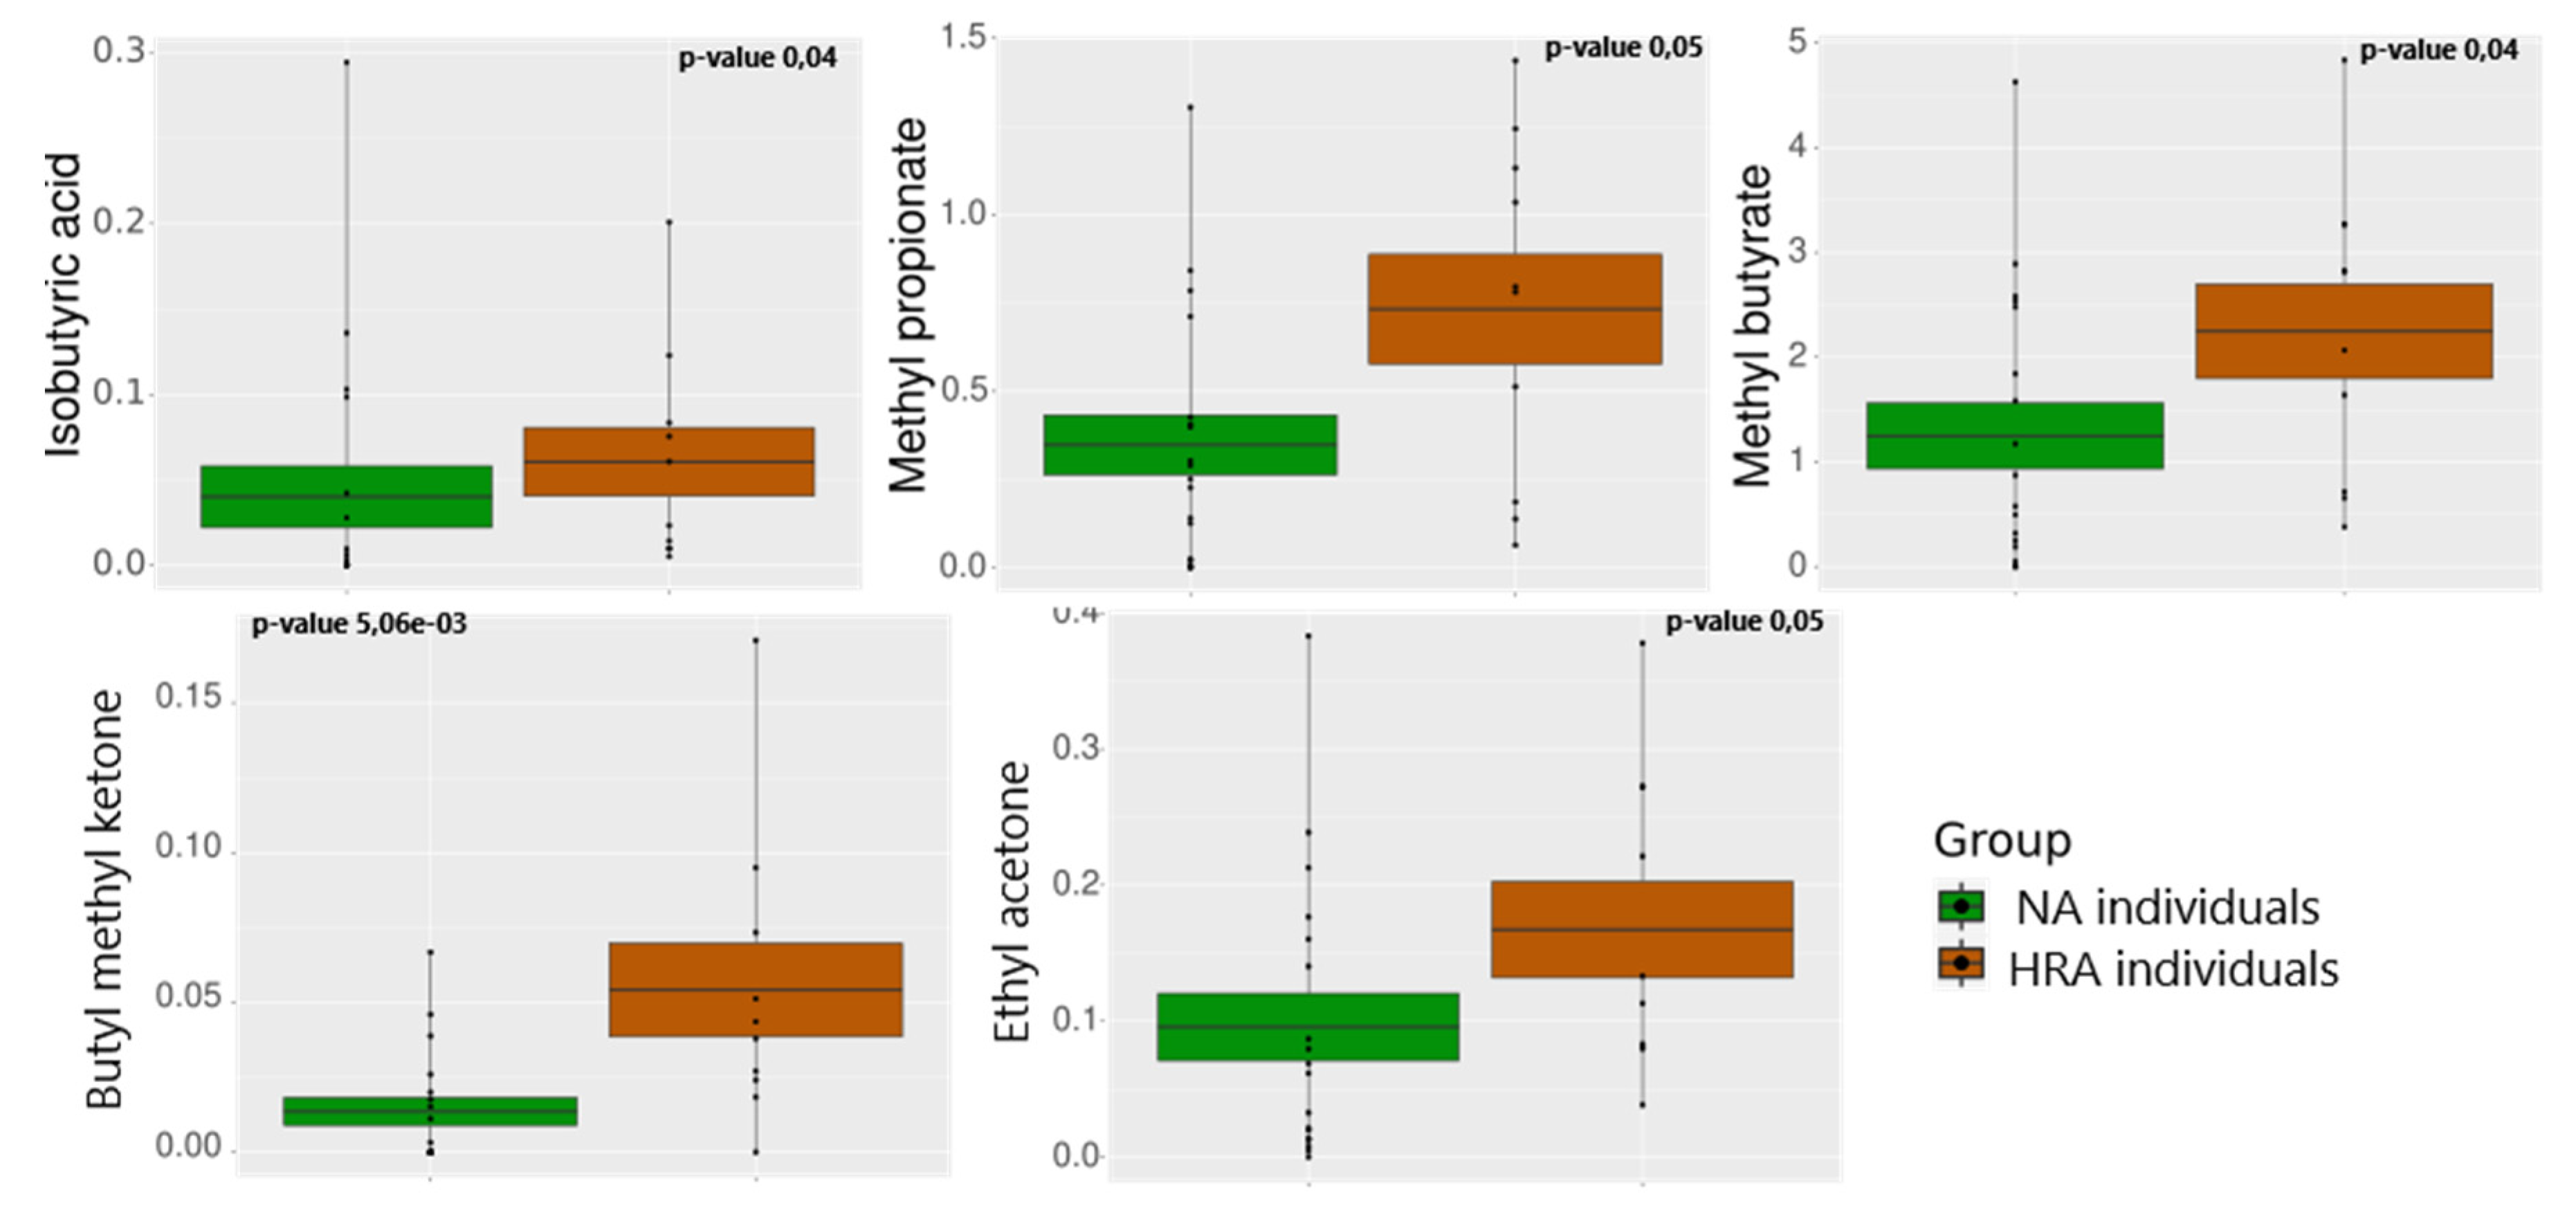
Figure 5.
Chord diagram showing associations between FBFs and VOCs. The outer ring shows FBFs on the left and VOCs on the right. The inner half ring on the left side and the ribbons spanning the circle side to side show specific FBFs interacting with specific VOCs.
Figure 5.
Chord diagram showing associations between FBFs and VOCs. The outer ring shows FBFs on the left and VOCs on the right. The inner half ring on the left side and the ribbons spanning the circle side to side show specific FBFs interacting with specific VOCs.
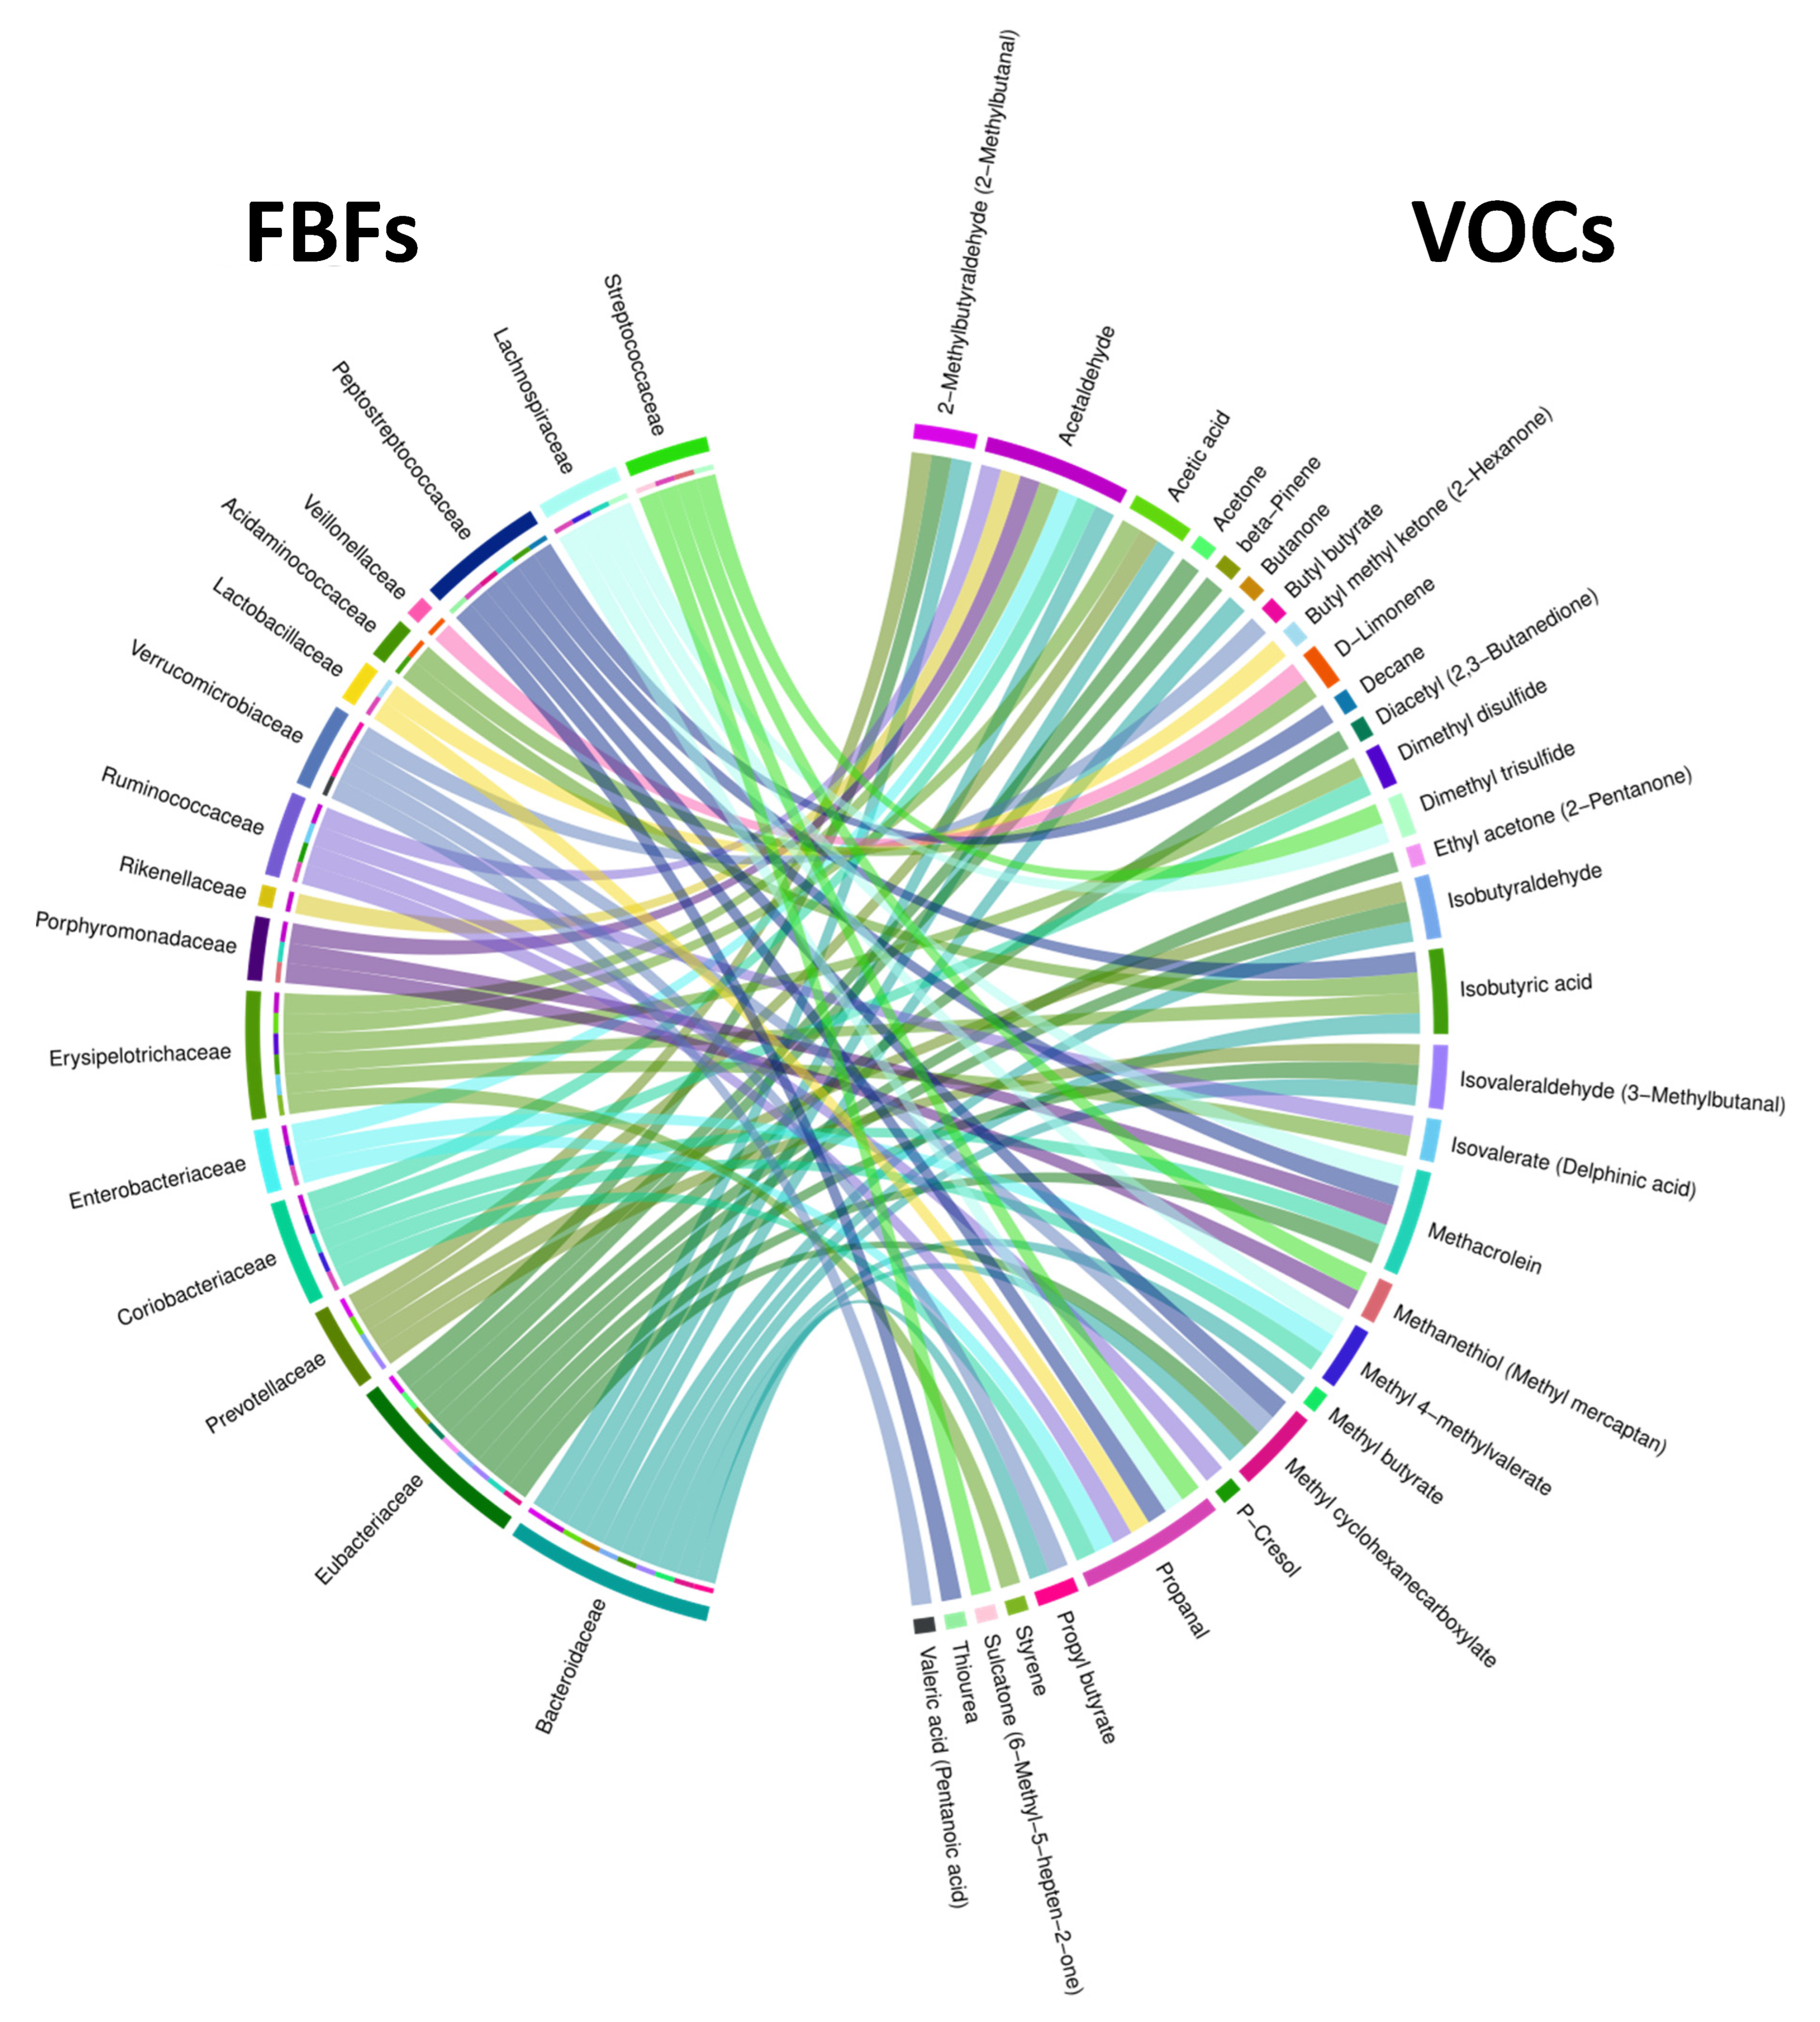
Figure 6.
Predictive modeling via binomial logistic regression of FBF-VOC correlations of NA and HRA sample datapoints. Relative abundance of FBFs (on the y-axis) against the concentration of the VOCs associated with them (on the x-axis) using 18 NA and 10 HRA datapoints, to forecast the probability of the individual’s outcome (NA/healthy or HRA/CRC prone). Regression lines and confidence intervals are displayed in green and red for NA and HRA data sets, respectively. Only HRA enriched FBFs and NA enriched VOCs are displayed.
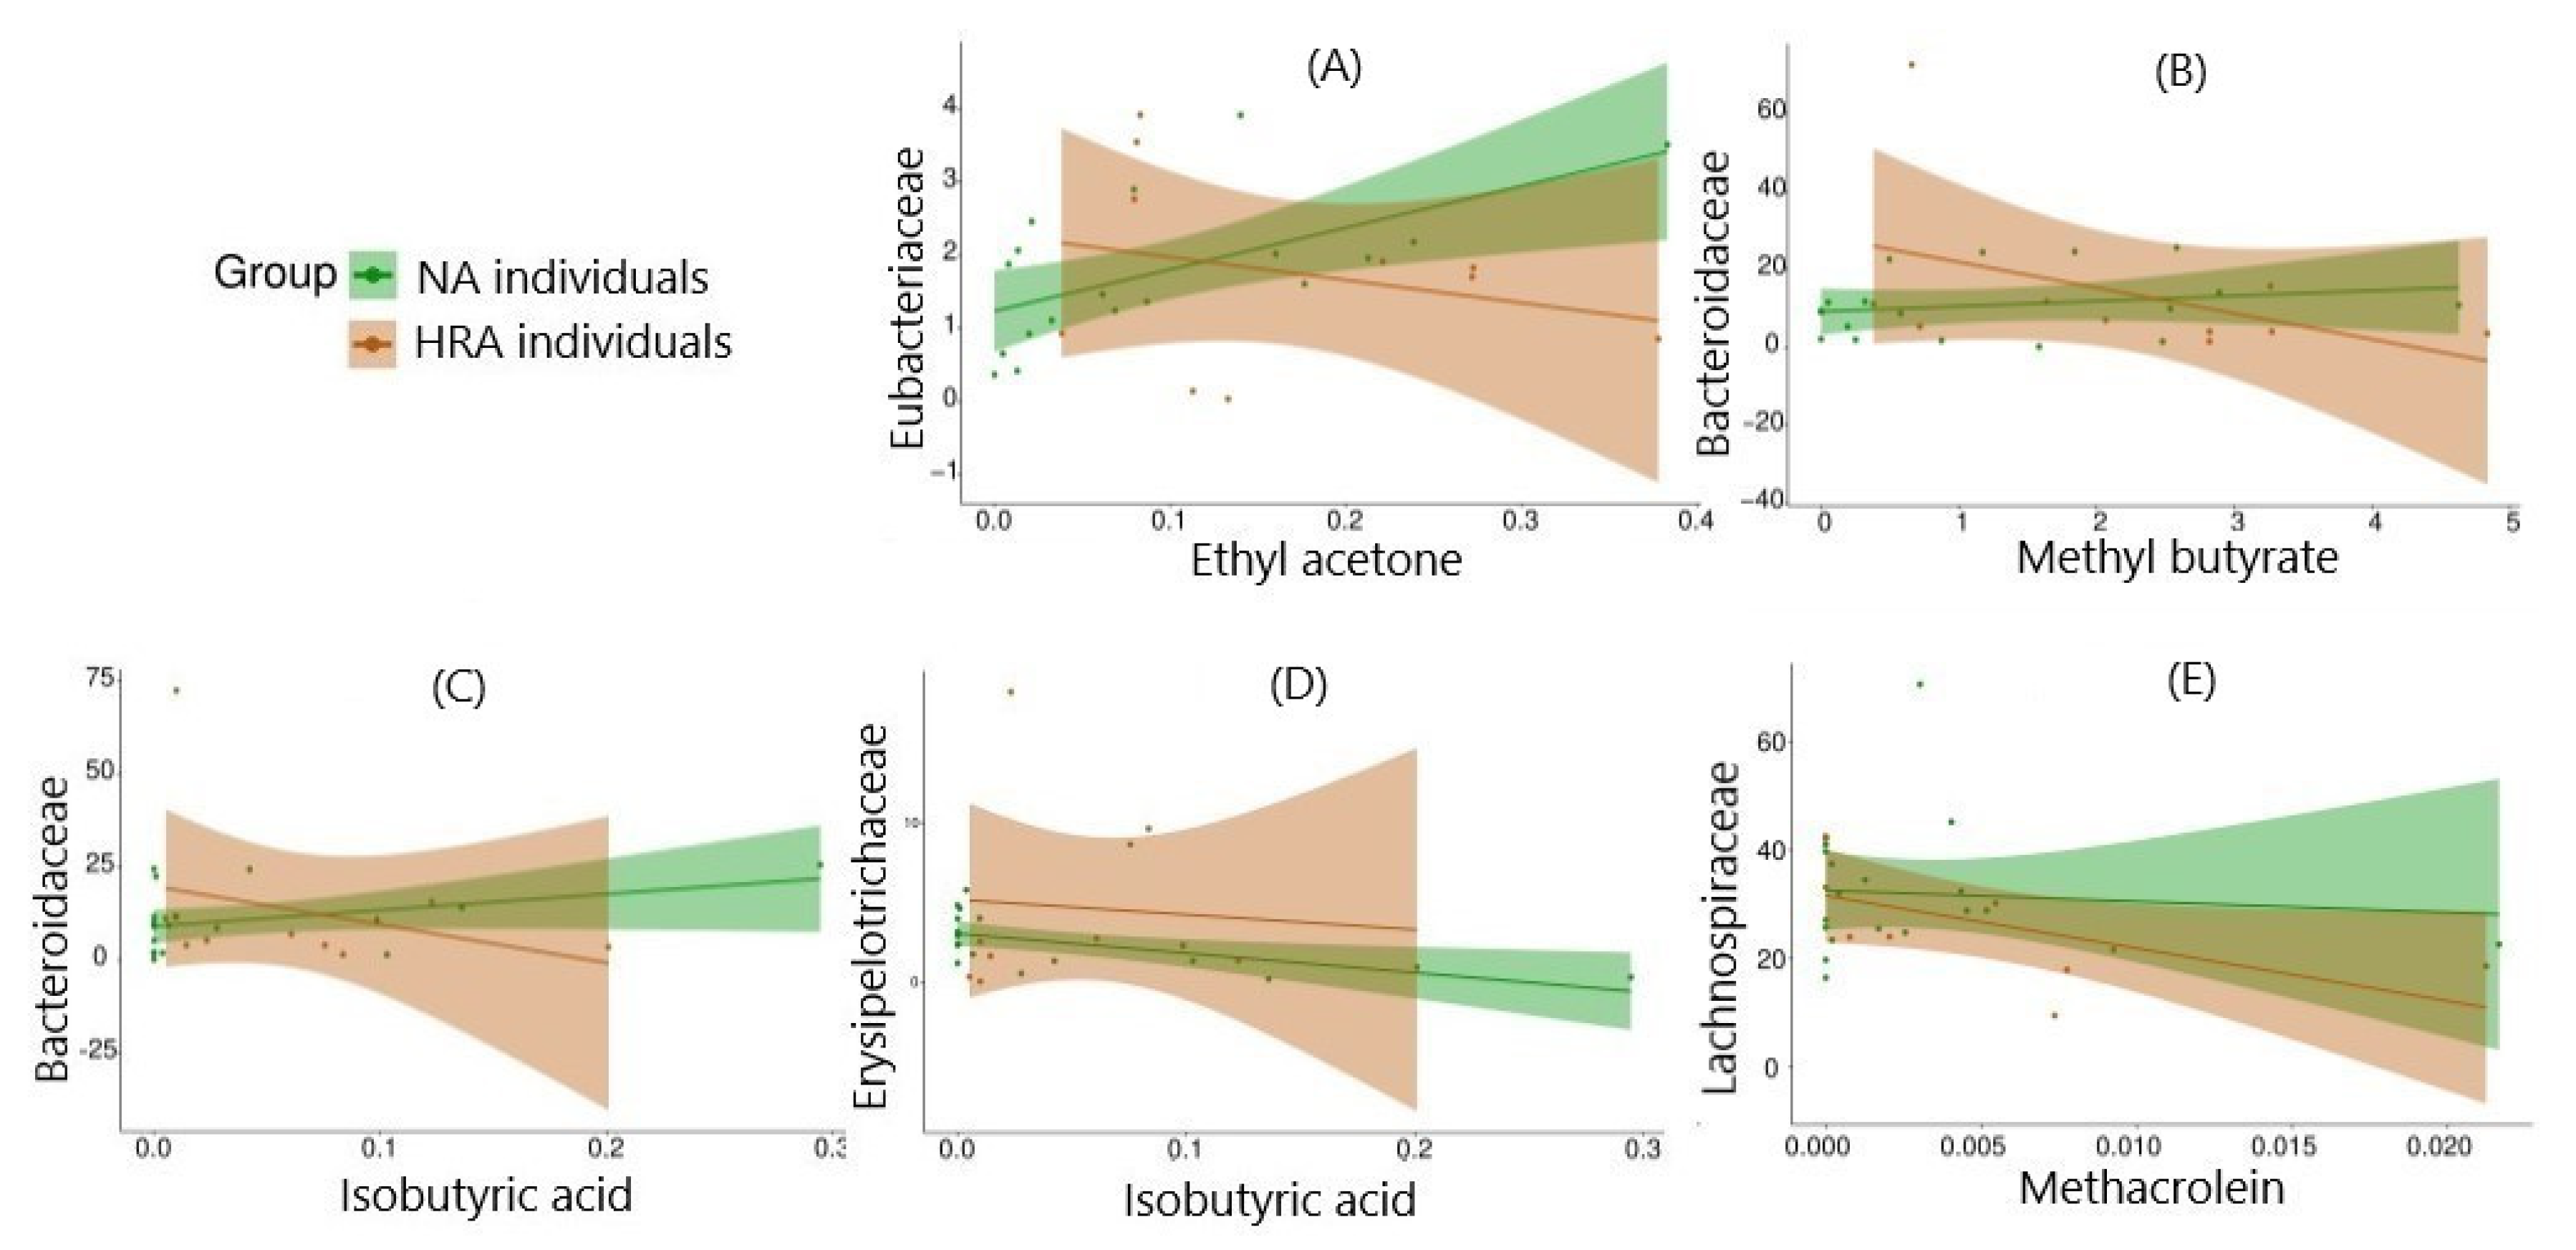
Figure 7.
Chord diagram showing associations between FBGs and VOCs. The outer ring shows FBGs on the left and VOCs on the right. The inner half ring on the left side and the ribbons spanning the circle side to side show specific FBGs interacting with specific VOCs.
Figure 7.
Chord diagram showing associations between FBGs and VOCs. The outer ring shows FBGs on the left and VOCs on the right. The inner half ring on the left side and the ribbons spanning the circle side to side show specific FBGs interacting with specific VOCs.
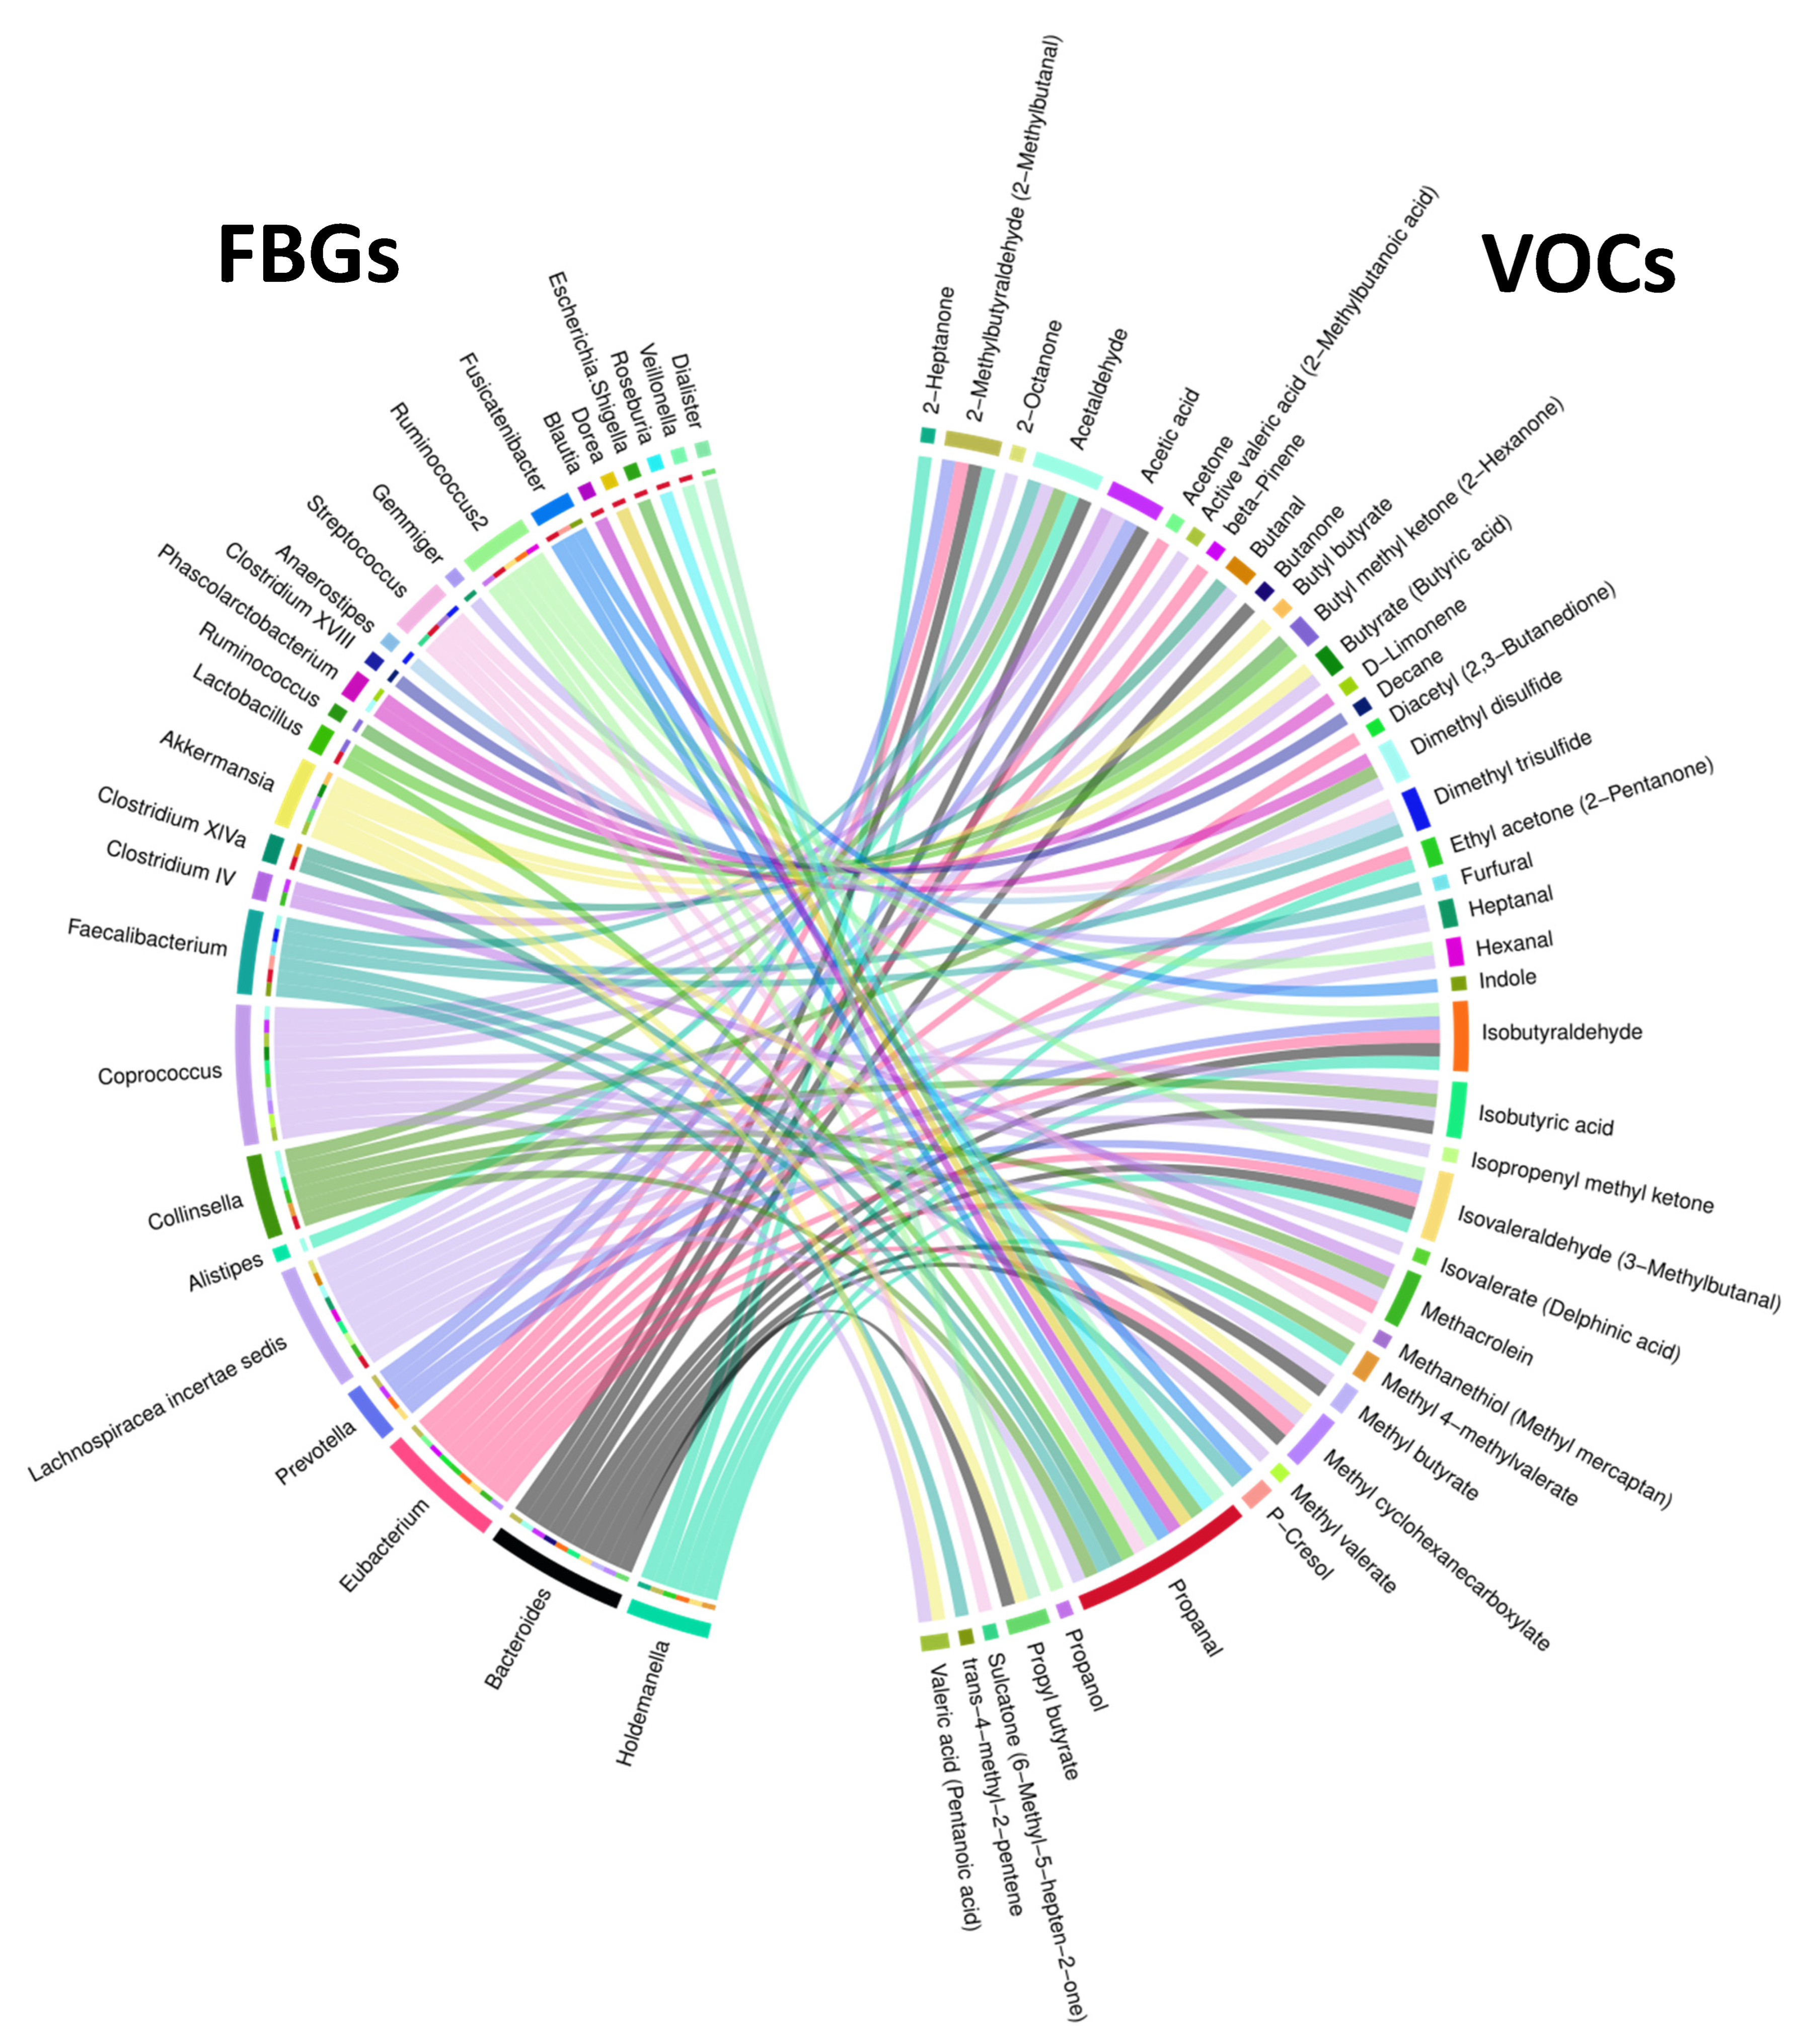
Figure 8.
Predictive modeling via binomial logistic regression of FBF-VOC correlations of NA and HRA sample datapoints. Relative abundance of FBGs (on the y-axis) against the concentration the VOCs associated with them (on the x-axis) using 18 NA and 10 HRA datapoints, to forecast the probability of the individual’s outcome (NA/healthy or HRA/CRC prone). Regression lines and confidence intervals are displayed in green and red for NA and HRA data sets, respectively. Only HRA enriched FBGs and NA enriched VOCs are displayed.
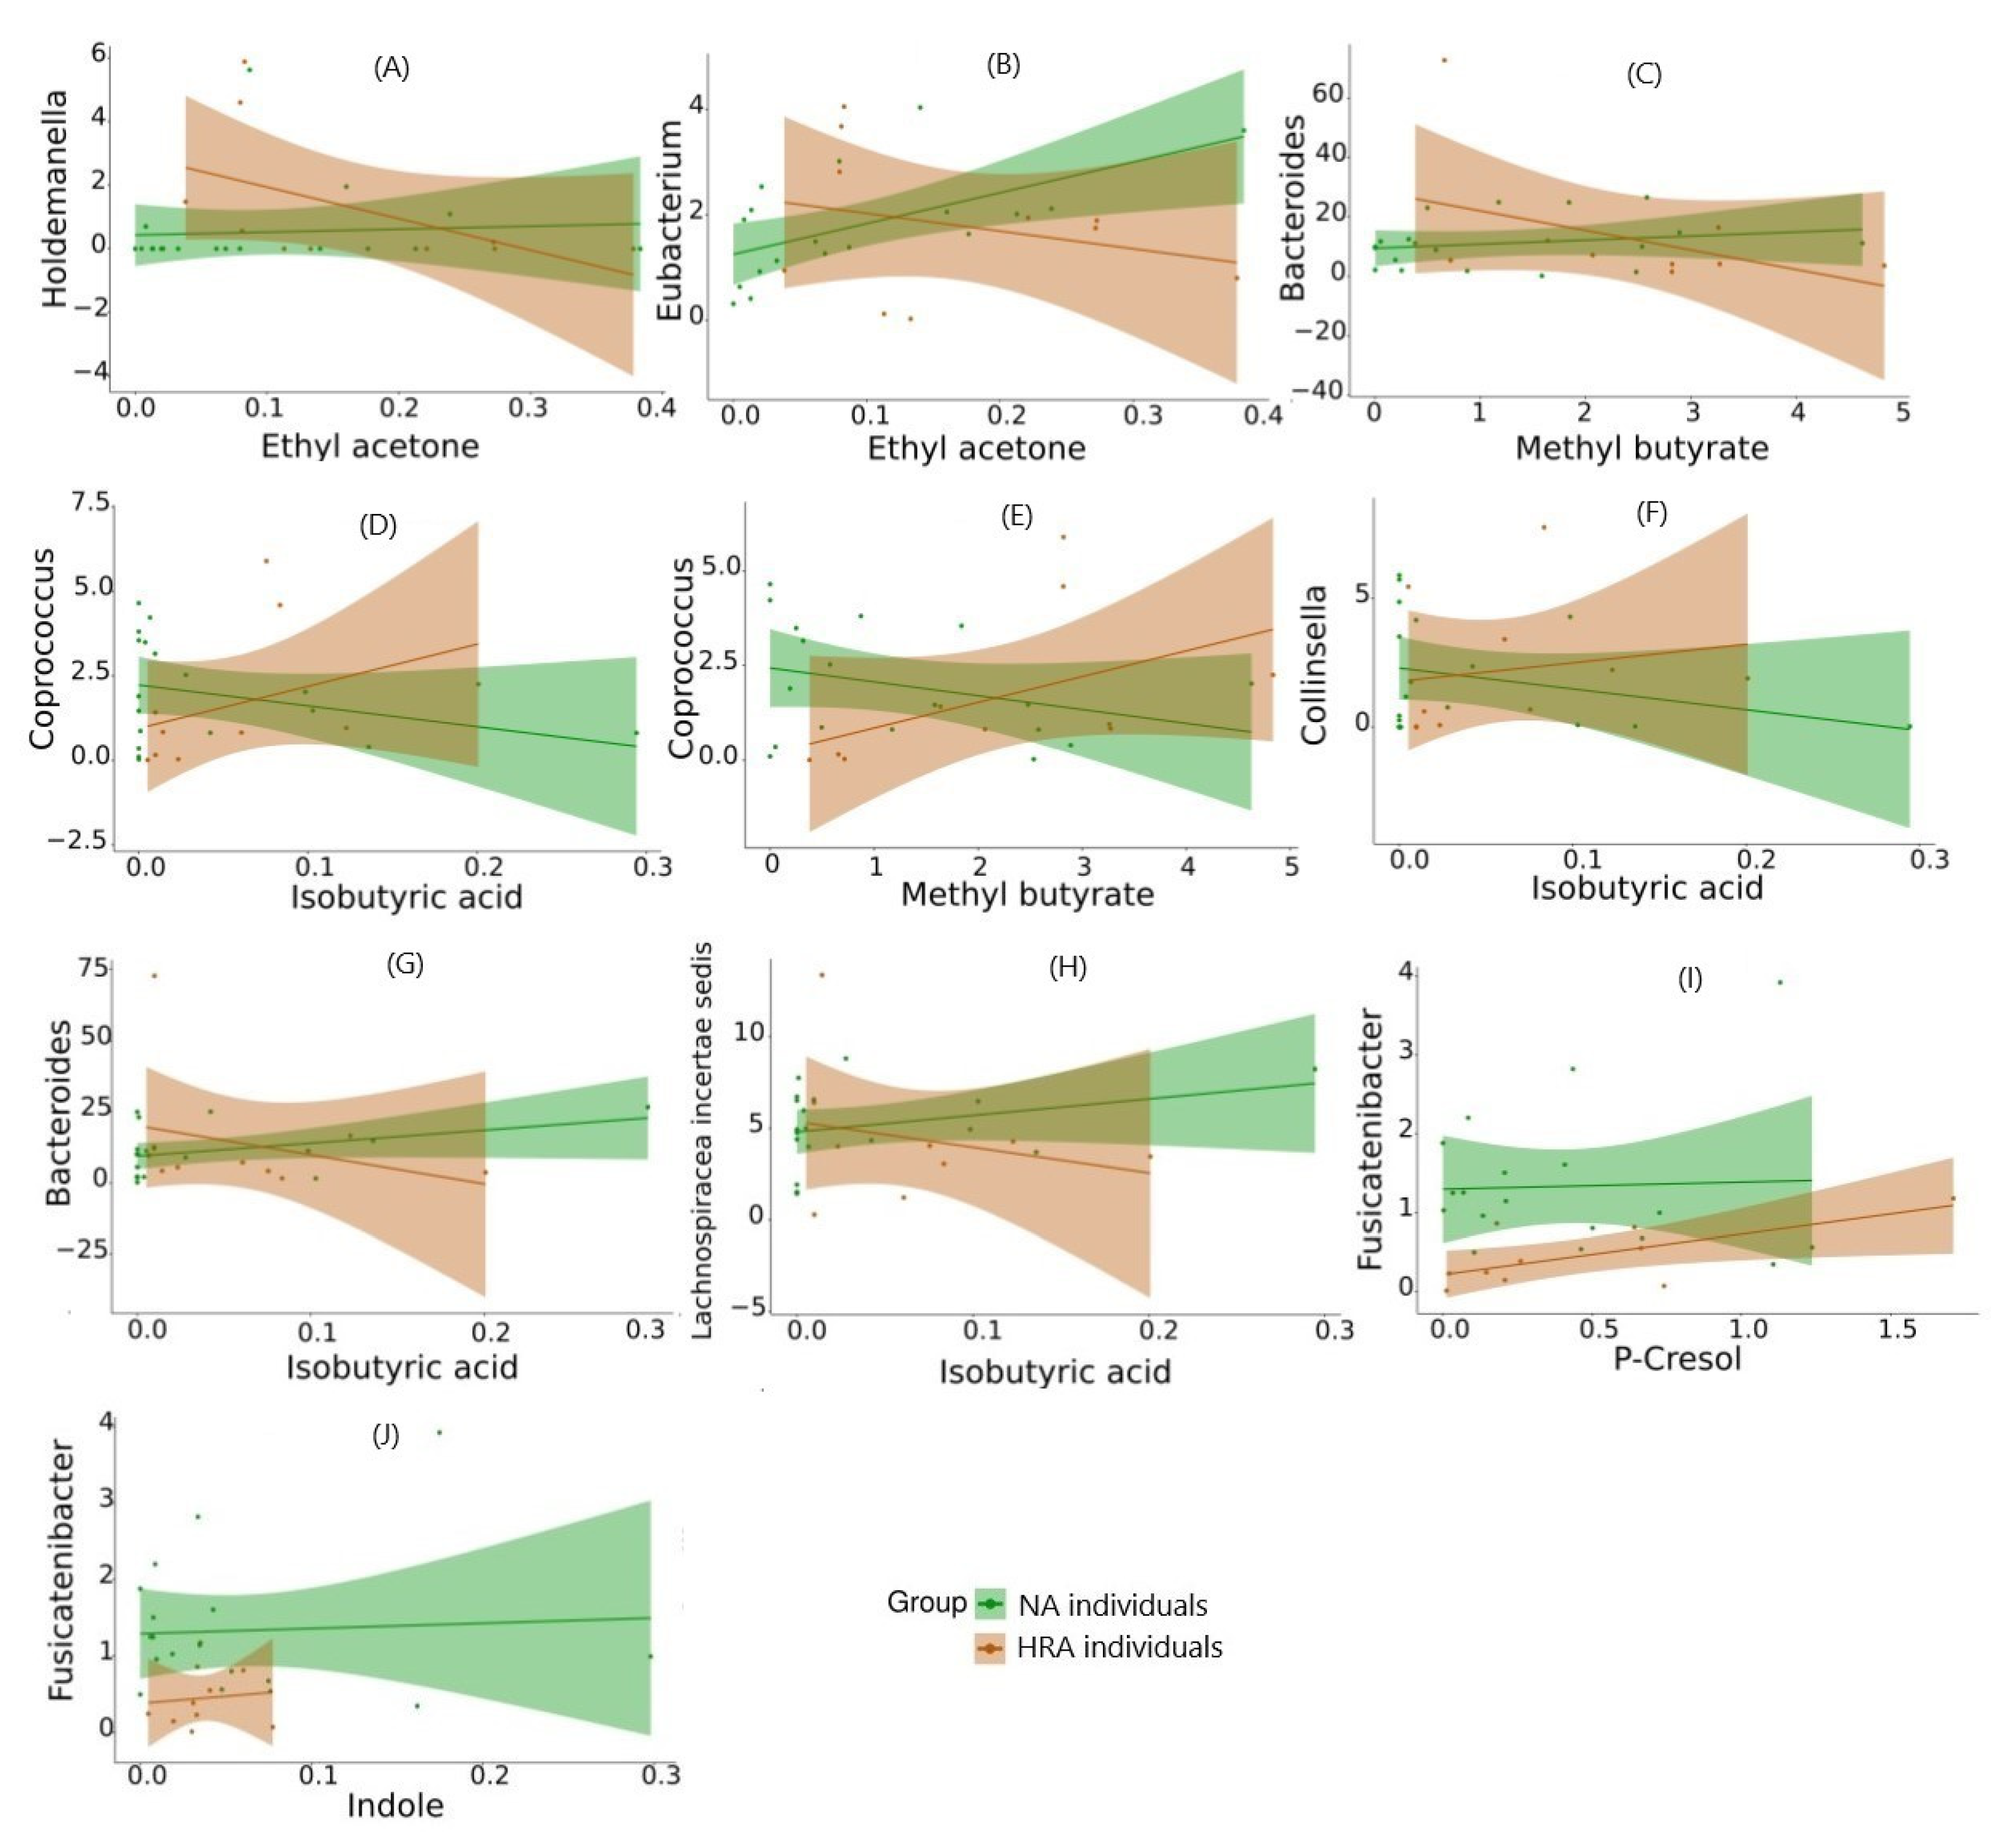

Table 1.
Participant breakdown per sex, age bracket (in years), assay (16S-Seq vs. GC-MS) and macroscopic classification (NA vs. HRA).
Table 1.
Participant breakdown per sex, age bracket (in years), assay (16S-Seq vs. GC-MS) and macroscopic classification (NA vs. HRA).
| Participants per assay & NA/HRA status | Sex | Age bracket | |||
|---|---|---|---|---|---|
| Females | Males | 50–60 | 61–65 | 66–70 | |
| All 117 individuals | 62 (53%) | 55 (47%) | 32 (27%) | 43 (37%) | 42 (36%) |
| 16S-Seq: 100 NA individuals (85.5%) | 52 | 48 | 27 | 36 | 37 |
| 16S-Seq: 17 HRA individuals (14.5%) | 10 | 7 | 5 | 7 | 5 |
| GC-MS: 18 NA individuals (15.4%) | 10 | 8 | 5 | 7 | 6 |
| GC-MS: 10 HRA individuals (8.5%) | 4 | 6 | 3 | 4 | 3 |
Table 2.
Significant differences in the average relative abundance between 100 NA and 17 HRA individuals at the phylum, family, genus, and species level. Higher abundance is indicated with number in bold and the corresponding p-value. SCFAs, short chain fatty acids.
Table 2.
Significant differences in the average relative abundance between 100 NA and 17 HRA individuals at the phylum, family, genus, and species level. Higher abundance is indicated with number in bold and the corresponding p-value. SCFAs, short chain fatty acids.
| Organism | p-value | Average Relative Abundance in HRA | Average Relative Abundance in NA | Potential Impact on the Host | |
|---|---|---|---|---|---|
| PHYLUM | Proteobacteria | 0.0440 | 4.96 | 2.53 | Potential pathogens, such as E. coli, Salmonella, Vibrio cholerae, and Helicobacter pylori. Infectious, inhibit immune function, cause dysbacteriosis, and exacerbate growth of colon cancer cells [23] |
| FAMILY | Lachnospiraceae | 0.0393 | 24.26 | 30.09 | Beneficial. Protect against colon cancer by producing butyrate via the butyrate kinase pathway [24] |
| GENUS | Roseburia | 0.0481 | 1.76 | 3.23 | Beneficial. SCFAs producers protecting against gut inflammation, maintaining energy homeostasis, inhibiting NF-κB activation |
| Fusicatenibacter | 0.0025 | 0.67 | 1.65 | Beneficial. Butyrate producers maintaining intestinal regeneration, homeostasis, low inflammation [25] | |
| SPECIES | Roseburia faecis | 0.0189 | 0.96 | 2.10 | Beneficial. SCFAs producer [26] |
| Blautia luti | 0.0423 | 1.06 | 2.41 | Beneficial. Potential anti-inflammatory action and inhibition of pathogen colonization via production of bacteriocins [27] | |
| Fusicatenibacter saccharivorans | 0.0030 | 0.79 | 1.94 | Beneficial. Butyrate producer decreased in the gut of CRC patients [23] | |
| Eubacterium rectale | 0.0456 | 0.58 | 1.12 | Beneficial. Butyrate producer [28] | |
| Phascolarctobacterium faecium | 0.0164 | 0.84 | 1.25 | Beneficial. Propionate producer via the succinate metabolic pathway [29] | |
| Parabacteroides distasonis | 0.0084 | 1.26 | 0.43 | Potentially pathogenic and carcinogenic, associated with CRC [30] |
Table 3.
Spearman rank order correlation analysis. Four VOCs enriched in HRA fecal samples (butyl methyl ketone, isobutyric acid, methyl butyrate and ethyl acetone) correlate with 6 fecal bacterial families; and one fecal bacterial family enriched in NA fecal samples (Lachnospiraceae) correlate with 4 VOCs. A-E indicate 5 Spearman’s correlations also passing binomial logistic regression analysis (see Figure 6).
| FBFs | Associated VOC | Direction of association (+/-) in NA and HRA, and significance of NA-HRA difference in association | |
|---|---|---|---|
|
FBFs associated with HRA-enriched-VOCs |
Eubacteriaceae | Ethyl acetone (2-Pentanone) | NA (+) HRA (-) p-value: 0.02 |
| Lactobacillaceae | Butyl methyl ketone (2-Hexanone) | NA (+) HRA (+) p-value: 0.04 |
|
| Bacteroidaceae | Methyl butyrate | NA (+) HRA (-) p-value: 0.03 |
|
| Isobutyric acid | NA (+) HRA (-) p-value: 0.04 |
||
| Erysipelotrichaceae | NA (+) HRA (-) p-value: 0.03 |
||
| Acidaminococcaceae | NA (+) HRA (-) p-value: 0.03 |
||
| Peptostreptococcaceae | NA (-) HRA (+) p-value: 0.04 |
||
|
VOCs associated with NA-enriched-FBFs |
Lachnospiraceae | Propanal | NA (+) HRA (-) p-value: 0.007 |
| Methacrolein | NA (-) HRA (-) p-value: 0.04 |
||
| Methyl 4-methylvalerate | NA (+) HRA (-) p-value: 0.03 |
||
| Dimethyl trisulfide | NA (-) HRA (+) p-value: 0.04 |
Table 4.
Spearman rank order correlation analysis. Four VOCs enriched in HRA fecal samples (butyl methyl ketone, isobutyric acid, methyl butyrate and ethyl acetone) correlate with 7 fecal bacterial genera; and two FBGs enriched in NA fecal samples (Roseburia and Fusicanibacter) correlate with 3 VOCs. A-J indicate 10 Spearman’s correlations also passing binomial logistic regression analysis (see Figure 8).
| FBGs | Associated VOC | Direction of association (+/-) in NA and HRA, and significance of NA-HRA difference in association | |
|---|---|---|---|
|
FBGs associated with HRA-enriched-VOCs |
Ruminococcus | Butyl methyl ketone (2-Hexanone) | NA (+) HRA (+) p-value: 0.04 |
| Lachnospiraceae incertae sedis | Isobutyric acid | NA (+) HRA (-) (H) p-value: 0.04 |
|
| Collinsella | NA (-) HRA (+) p-value: 0.05 |
||
| Bacteroides | NA (+) HRA (-) p-value: 0.04 |
||
| Coprococcus | NA (-) HRA (+) (D) p-value: 0.004 |
||
| Bacteroides | Methyl butyrate | NA (+) HRA (-) p-value: 0.03 |
|
| Coprococcus | NA (-) HRA (+) p-value: 0.05 |
||
| Holdemanella | Ethyl acetone (2-Pentanone) | NA (+) HRA (-) p-value: 0.04 |
|
| Eubacterium | NA (+) HRA (-) p-value: 0.03 |
||
|
VOCs associated with NA-enriched-FBGs |
Roseburia | Propanal | NA (+) HRA (-) p-value: 0.02 |
| Fusicatenibacter | p-Cresol | NA (+) HRA (+) p-value: 0.03 |
|
| Indole | NA (+) HRA (+) (J) p-value: 0.02 |
Disclaimer/Publisher’s Note: The statements, opinions and data contained in all publications are solely those of the individual author(s) and contributor(s) and not of MDPI and/or the editor(s). MDPI and/or the editor(s) disclaim responsibility for any injury to people or property resulting from any ideas, methods, instructions or products referred to in the content. |
© 2023 by the authors. Licensee MDPI, Basel, Switzerland. This article is an open access article distributed under the terms and conditions of the Creative Commons Attribution (CC BY) license (http://creativecommons.org/licenses/by/4.0/).
Copyright: This open access article is published under a Creative Commons CC BY 4.0 license, which permit the free download, distribution, and reuse, provided that the author and preprint are cited in any reuse.


