Submitted:
10 February 2025
Posted:
13 February 2025
You are already at the latest version
Abstract
Due to limited exploration drilling and analogue mapping, bench-scale geotechnical characterization often suffers from high uncertainty, reducing confidence in geotechnical analysis. The Measure-While-Drilling (MWD) system uses sensors to collect drilling data from mining blast hole drill rigs. Historically, MWD studies have focused on penetration rates to identify rock formations during drilling. This study explores the effectiveness of Artificial Intelligence (AI) classification models using MWD data to predict geotechnical categories, including Stratigraphic Unit, Rock/Soil Strength, Rock Type, Geological Strength Index, and Weathering properties. Feature selection algorithms, Minimum Redundancy Maximum Relevance and ReliefF, identified all MWD responses as influential, leading to their inclusion in Machine Learning (ML) models. ML algorithms tested included Decision Trees, Support Vector Machines (SVMs), K-Nearest Neighbors (KNNs), Random Forests (RFs), Linear Discriminant Analysis, and Naive Bayes. KNN, SVMs, and RFs achieved up to 97% accuracy, outperforming other models. Prediction performance varied with class distribution, with balanced datasets showing wider accuracy ranges and skewed datasets achieving higher accuracies. The findings demonstrate a robust framework for applying AI in real-time orebody characterization, offering valuable insights for geotechnical engineers and geologists in improving orebody prediction and analysis.
Keywords:
Measure-While-Drilling (MWD)
; Artificial Intelligence (AI)
; Machine Learning (ML)
; geotechnical
; rock mass
; real-time orebody analysis
; feature importance
1. Introduction
Profiling a geological deposit is a critical task for mining production, requiring accuracy and precision to meet grade and tonnage requirements. However, traditional methods relying on resource-definition drill holes are often expensive and inefficient [1,2]. For example, the high costs of resource definition drilling result in large gaps between drill holes, leading to inaccurate subsurface depictions [3,4]. Moreover, the use of radioactive wireline instruments (sondes) in Reverse Circulation (RC) drill holes introduces physical limitations and potential risks to field personnel [5].
To address these challenges, engineers and geologists have turned to Measurement While Drilling (MWD) technology as a cost-effective and data-rich solution [6]. Originally developed for the petroleum sector, MWD sensors integrated into blast hole drill rigs in the 1970’s to provide continuous data collection during operations, such as open-pit mining, construction, and tunnelling [7]. This technology generates a wealth of MWD data points, allowing for detailed insights into subsurface geological conditions [8,9,10,11,12].
Historically, manual methods were employed to interpret the abundant MWD data and its complex correlations with subsurface composition [9,10,13,14,15,16,17]. However, these methods were limited to rock-type detection, neglecting other essential geological attributes like stratigraphic unit, weathering intensity, and rock or soil strength [9,10,14,16,17,18]. In recent times, advancements in computing power and availability have enabled the application of Artificial Intelligence (AI) and Machine Learning (ML) approaches to MWD data interpretation predominantly for rock type identification using univariate methods [19,20,21,22,23,24]. Despite this progress, few studies have focused on applying ML methods to MWD data for geological boundary identification [25,26]. While some have taken a multivariate approach to predictive regression-based algorithms for geochemical or geophysical values [22,24,27], none have effectively evaluated the importance of individual MWD features for predicting categorical geotechnical features, such as rock type, weathering intensity, rock strength, stratigraphic unit and rock mass classification [6].
This study proposes an approach to evaluate feature importance of MWD variables for the classification and predictive modelling of geotechnical properties. Unlike previous studies [18,28] that applied Principal Component Analysis (PCA) for this purpose, which can yield misleading results, the current research utilizes appropriate feature selection algorithms, Minimum Redundancy Maximum Relevance (MRMR), and ReliefF, in combination with ML techniques. The study examines geological traits of an orebody using MWD data from an open cut iron ore mine in the Pilbara region of Western Australia. It presents a method to assess the feature importance of input drilling variables for predictive geotechnical modelling using MWD data and includes a comparative analysis of various classification-based ML algorithms' predictive performance.
The findings of this study offer a more accurate representation of orebodies based on MWD data, resulting in an order of magnitude increase in spatial resolution compared to RC and diamond drill hole-based geological models. This advancement has been achieved without the need for additional exploration drilling. The proposed approach holds promise for mine technical services personnel seeking cost-effective and high-resolution delineation of subsurface rock conditions, thereby improving the efficiency and productivity of mining production.
2. Methods
The data used in this paper are the same as in Goldstein et al. which aimed to predict wireline geophysical measurements and geochemical assay values from the same MWD dataset [24,27]. For the sake of self-completeness, the site and data are briefed as below:
2.1. Mine Site
The Western Australian Pilbara area is a high-volume iron ore exporter. In the year 2021, the area was responsible for exporting 874 million tons of iron ore [29]. The focus of this study lies in the iron-ore deposits found in Marra Mamba and Brockman (BR) Formations of the Hammersley Group, recognized for their substantial contribution to the economically exploitable iron ore in Pilbara [30]. An interesting feature of these formations is their interlayering with Banded Iron Formation (BIF), a mineral-rich sequence from about 2.5 billion years ago, and shale layers [31]. The Brockman Iron Formation itself is composed of the Dales Gorge Member, overlaid by Whaleback Shale, which in turn is topped by the Joffre Member. The Hamersley Detrital units, which appear higher in the stratigraphic sequence, originate from weathered bedded ores [4].
The current work investigates a single pit within the geological characteristics of the Brockman Formation (BR). A combination of 12 diamond core drill holes and 211 RC drill holes were used to characterize the pit’s subsurface geological conditions. The diamond and RC holes totaling 1089 and 16,880 drill meters, respectively, with an average depth of 90 meters and 80 meters per hole, respectively. Field observations were employed to log information concerning rock type, weathering profile, rock strength, stratigraphic unit, and Geological Strength Index (GSI). There was no need for further data engineering on the resource-definition data due to prior scrutiny of these datasets through the mining company's Quality Assurance and Quality Control (QA/QC) procedures.
2.2. Geotechnical Field Observation Categories
This research explores various field observations logged, encompassing aspects such as stratigraphic unit, rock type, weathering, rock strength and GSI. The general categories for rock types include BIF, shale (SHL), detrital (DET), and the hydrated zone of alteration (HYD). Table 1 depicts the classification of weathering using a method adapted from the International Society for Rock Mechanics (ISRM) conventions [32]. In addition, Table 2 describes the ISRM strength categories for both soil and rock [33]. GSI is a rock mass classification system to evaluate a combination of the estimated rock strength and persistence of structures into several classes [34].
2.3. MWD Drilling Systems
MWD data collection was conducted using a fleet of 22 rotary blast hole rigs fitted with Tungsten Carbide Insert bits. This fleet included ten Pit Viper 271 rigs by Atlas Copco (Epiroc), two Terex SKS 12 rigs, one Bucyrus SKS 13 rig, and two Sandvik 460 rigs, which were used for drilling production blast holes of 0.229m in diameter (Figure 1a). Furthermore, a Cubex QXR 920 rig, a Sandvik 560 rig, and five Atlas Copco (Epiroc) D65 drill rigs were employed for creating 0.165m wall control blast holes (Figure 1b). The height of the benches in the iron-ore pits under study varied between 8 and 12 meters, with sub-drilling reaching approximately 2 meters beneath the bench floor. On average, the spacing and burden between production blast holes were 8 meters and 7 meters, respectively.
The MWD system on the drill rigs collected various measurements, such as rate of penetration (rop; m/s), rotary pressure or torque (tor; Nm), force on bit (fob; kgf) – typically known as weight on bit, thrust or pulldown pressure, bit air pressure or flushing air medium (bap; kgf/cm), and rotary speed (rpm). However, since inconsistencies in the onboard sensor resulted in rpm data being available for only around a quarter of the sample points, these data were omitted from the drilling measurements. The process of collecting MWD values involved both manually operated rigs and semi-autonomous machines, with the latter being remotely monitored from a distant Operations Centre. The drilling system logged MWD time-series data at approximately 0.1-meter intervals throughout the depth of the blast hole.
This study focused on the MWD dataset from BR pit, including 75,470 blast holes totaling 844,855 meters. MWD data was analyzed from 2 meters beneath the hole collars to the bottom of the blast holes, as the first two meters of the borehole may not accurately reflect the in situ rock conditions due to potential toe charge effects from the blasting of the previous bench. In addition, the BR MWD dataset was observed to have a relatively high noise-to-signal ratio with no QA/QC performed on the data.
2.3.1. MWD Data Pre-Processing
The reliability of MWD data can be influenced by various factors such as the fabric and composition of the subsurface rock, the management system of the drill rig, and external circumstances, which may cause abnormal response values [35]. This could potentially lead to incorrect MWD response values and misinterpretations of the data [36]. Therefore, the noise-to-signal ratio in the examined mining MWD dataset is high, given that the data had not undergone a comprehensive QA/QC process.
Hence, the MWD data in this investigation necessitated feature engineering. To minimize potential effect on the representation of in situ rock due to collaring effects at the beginning of the shaft and potential blast damage from previous holes, the initial MWD dataset excluded the first 2 meters of each drilling hole. Further, data points showing negative rop, tor, fob, or bap values were eliminated. Any gaps in the MWD data were filled using linear interpolation, quartile detection methods, and a 1.5-factor threshold. A Gaussian filter with a smoothing factor of 0.3 was applied to the data from the blast holes to mitigate the local impacts of noise.
The drilling datasets for blast-hole MWD and exploration hole were converted from drill hole interval formats to point data, which encompassed geospatial coordinates and corresponding dataset values for each data point. The point data for exploration geotechnical holes were generated using downhole wireline logged desurvey data, which registered the azimuth and dip of each hole every 10 meters until the final depth. In contrast, the blast hole MWD data were not desurveyed due to the production nature of the holes, and each point's location was determined by presuming a straight line from the hole's collar to its end. A K-Nearest Neighbor distance-based search technique was utilized to calculate the distance between each point in the MWD and exploration data for merging these two datasets. Each exploration drilling data point was linked with the nearest MWD data point to execute supervised machine learning. Horizontal and vertical distance thresholds were employed to further refine the results.
2.4. Feature Selection Methods
PCA has often been employed to determine the most important features in MWD data. However, this research opts for feature selection algorithms to ascertain the relative importance of each MWD variable identified for geotechnical categories such as rock type, weathering intensity, stratigraphic unit, and rock strength. For this purpose, non-parametric approaches, specifically MRMR and ReliefF, were utilized on the pre-processed BR dataset. These techniques refrain from making assumptions about the relationships between input and output variables and instead assess feature selection in different ways.
MRMR, a non-parametric approach to feature selection, decouples complex variable interactions via mutual information maximization [37]. It identifies crucial features by fitting the model iteratively with each feature both included and excluded, subsequently measuring the variation in performance. The MRMR algorithm evaluates and chooses the MWD input that brings the most substantial improvement in the model as the most important, formulated as follows for categorical variables:
where the mutual information, I, quantifies the relationship between two variables, x and y. This relationship is defined in the context of their joint probabilistic distribution, p(xi,yj), and the corresponding marginal probabilities, p(xi) and p(yj). The mutual information essentially provides a measure to determine a comparative level of similarity among geotechnical classifications. In addition, the principle of minimum redundancy, aims to select outputs that are maximally dissimilar from each other. Minimal redundancy enhances the representational efficacy of the feature set with respect to the entire dataset. This not only makes the selected features a better representative of the full dataset, but it also determines the relative importance among MWD variables.
On the other hand, ReliefF is a filter-based feature selection algorithm that determines the weights of predictors for categorical variables. The algorithm penalizes predictors that yield dissimilar values for neighbors belonging to the same class, and contrastingly, rewards predictors that produce different values for neighbors from distinct classes [38]. The ReliefF methodology randomly samples a datapoint and then examines the impact of the neighbors of the datapoint. The technique then adjusts the weights of the drilling variables for that datapoint, with the adjustments being governed by the extent to which these features can effectively differentiate between neighboring datapoints. The algorithm follows this logic:
Assuming xr and xq belong to the same class, the following equation applies:
If xr and xq are part of different classes, this equation applies:
where Wji represents the weight of predictor Fj at the i iteration step, pyr and pyq are the prior probabilities of the classes to which xr and xq belong, respectively, m is the number of iterations, Δj(xr,xq) is the difference in the value of predictor Fj between observations xr and xq, xrj is the value of j for observation xr, and xqj is the value of xq at j.
2.5. Classification-Based ML Methods
Different classification-based ML models were tested for their ability to classify rock types in various contexts. For example, Neural Networks (NNs), a type of machine learning model, proved effective in classifying rock types in a coal deposit in Canada [23]. However, a more specific type of NNs, known as Back Propagation NNs, failed in classifying rock types in an iron-ore mine in the United States [21]. Furthermore, two other ML techniques, Logistic Regression and Random Forests (RFs), were successful in predicting marble quality classes in Norwegian quarry [19].
In contrast to these previous studies, this research explored the use of a variety of newer machine learning methods. These include Decision Trees (DTs), Support Vector Machines (SVMs), K-Nearest Neighbors (KNNs), Linear Discriminant Analysis (LDA), and Naïve Bayes (NB). This research also employed RFs, as previous research had shown this method to be effective. The advantages and disadvantages of each classification-based ML method are summarized in Table 3.
The predictive capacity of various classification-based ML algorithms, with computations executed on a high-performance computing system known as Pawsey Supercomputer Nimbus cloud, operating on an Ubuntu system, outfitted with 8 virtual CPUs and 32GB of memory. The Classification Learner Toolbox in MATLAB was used with default hyperparameters and no optimization for each respective classification-based ML method to generate models and assess prediction performance [45]. The available data was portioned into two sets, with 80% dedicated to training the models, and the remaining 20% used for evaluating their predictions. 10-fold cross-validation was used to evaluate the strength of the models' predictions on the training data.
The effectiveness of the various models was compared using three specific measures: Accuracy, Overall Misclassification Cost (OMC), and Training Duration (TD).
- Accuracy - this measure indicates the proportion of successful predictions made by the classification model. It is determined by dividing the number of correct predictions by the total number of predictions made.
- OMC - this is the total cost accumulated from incorrect predictions made by the model, computed by combining the cost matrix of misclassification with the corresponding confusion matrix.
- TD - this denotes the length of time it takes for the model to complete training phase.
The criteria for these metrics are defined as follows:
where TN and TP represent True Negatives (instances that are accurately predicted as not belonging to the class) and True Positives (instances that are correctly predicted as belonging to the positive class), respectively. In contrast, False Positives (FP) and False Negatives (FN) refer to the accurate and inaccurate negative predictions, respectively.
The OMC is determined, as follows:
where CostMi is the misclassification cost matrix and ConfMi is the confusion matrix for the respective model.
3. Results
3.1. Exploratory Data Analysis
A preliminary analysis was conducted on the gathered measurements of MWD measurements (rate of penetration, torque, flow outback pressure, and bit axial pressure) acquired from drill sensors to establish an understanding of the data's distribution and frequency of occurrence. Various factors, including irregularities in mining machinery, operator proficiency, drill bit wear, and the rock characteristics, among others, have been identified as potential contributors to observable differences in rop and the fob [46]. Hence, it is possible that a univariate study alone may not adequately capture the nonlinear relationships that exist between MWD responses and geotechnical classification characteristics. Consequently, multivariate analysis using all MWD response variables was employed to maximize the prediction performance of the ML models.
Figure 2a–d depicts a variety of skewed and bimodal distributions of the MWD data points. The rop (Figure 2a) and tor (Figure 2b) have right skewed and left skewed distributions, respectively. This inverse relationship is sensible, as when tor increases to drill through a zone of strong zone, the rop should correspondingly decrease. The distributions for fob (Figure 2c) and bap (Figure 2d) are both bimodal with two prevalent value ranges in each MWD variable. The mean, median, standard deviation, minimum and maximum values for rop, tor, fob and bap are presented in Table 4.
The observations of MWD data distributions suggest diverse data behaviors, underscoring the need for careful and nuanced analysis of the relationships between variables. As a result, a Pearson Correlation Coefficient plot for the MWD data is displayed in Figure 3. For instance, the correlation between fob and tor is approximately 0.57, indicating a very weak positive linear relationship. However, only linear relationships are displayed, which may not capture more intricate, non-linear relationships between variables.
Contrasting with the input MWD responses, the distributions of geotechnical class outputs reveal two distinct patterns (Figure 4). The Stratigraphic Unit and Rock Type exhibit a more even distribution across their respective categories. In contrast, Weathering Intensity, GSI, and Rock or Soil Strength predominantly feature a single category. This even distribution in the Stratigraphic Unit (Figure 4a) aligns with the stratified BR geological deposition observed in the pit: the DET unit overlays the DG3, DG2, and D1 units, which in turn rest atop the MCS [4].
Furthermore, the distribution within the Rock Type aligns with observed pit geology, where HYD alteration zones and SHL are less frequent compared to BIF and DET categories (Figure 4b). Conversely, the skewed distributions in Weathering, Rock or Soil Strength and GSI are consistent with the predominant features of the pit’s BR geology, specifically favoring the MW, R3, and Poor categories (Figure 4c–e, respectively). Such a pronounced skewness towards a single category might influence the efficacy of predictive models, especially when these models rely on a limited set of infrequent categories for training and validation.
3.2. Feature Selection Results
The feature selection algorithms MRMR and ReliefF were applied to the four MWD response features to evaluate their significance in predicting five geotechnical categories: Rock Type, Strat. Unit, Strength, Weathering, and GSI. The percentages presented in were calculated by dividing the score of each MWD response in an experiment by the total of the four MWD responses in that respective experiment (Figure 5).
MRMR consistently highlighted bap as the most influential feature in three out of five experiments, including Rock Type, Stratigraphic Unit and GSI underscoring its potential significance in these classification tasks. Conversely, ReliefF designated rop as the marginally leading feature for three experiments: Rock Type, Strat. Unit, and GSI. The prominence of rop in the ReliefF results underscores a divergent perspective on feature selection compared to MRMR. Notably, a stark difference was observed for the Strength classification. MRMR identified tor as the key feature, while ReliefF pinpointed fob. In the Weathering classification, MRMR and ReliefF again diverged, with fob and tor identified as the most influential features, respectively.
These discrepancies reflect the inherent differences in the methodologies of the two feature selection techniques. While MRMR focuses on maximizing relevance and minimizing redundancy, ReliefF emphasizes distinguishing capabilities between nearest neighbors of different classes. Such disparities emphasize the necessity of a comprehensive approach when selecting features, considering the inherent biases and strengths of each method. Importantly, since no features were identified as having zero or minimal influence, all four MWD responses will be included in predictive analysis.
3.3. Classification-Based ML Results
Various classification-based ML algorithms were applied to the geotechnical category datasets, including Stratigraphic Unit, Rock or Soil Strength, Rock Type, and Weathering, to compare model prediction performance using MWD data. For each model, five primary metrics were evaluated: 10 cross-fold Validation Accuracy, Testing Accuracy, Training Duration, Validation OMC, and Testing OMC. The results are listed in Table 5. While the KNN and RF had the consistently strongest Validation and Testing Accuracies of around 98%, the KNN model recurrently emerged as the strongest performing method due to lower Training Durations and Validation and Testing OMCs. Specifically, for GSI, Stratigraphic Unit, Rock or Soil Strength, and Rock Type classifications, the Fine KNN model consistently exhibited the highest Validation and Testing accuracies. In addition, in the Weathering classification, this model demonstrated the highest validation accuracy.
On the other hand, the other models had stronger performance in one aspect with weaker performance than KNN. For example, LDA consistently demonstrated the shortest training time across the Rock or Soil Strength and Weathering categories. However, the reduced training time came at the expense of Validation Accuracy, which was 10% lower than KNN’s. In a similar example, the Gaussian NB model displayed the shortest training time for the GSI and Rock Type classifications.
However, the reduced training time for LDA did not translate to higher accuracy or lower costs than those of KNNs (Figure 6). In terms of OMC, the Fine KNNs model displayed the strongest performance versus training duration. For all five geotechnical classifications, KNN consistently showcased the lowest validation and testing costs. On the other hand, NB and LDA models had higher Validation costs despite shorter training times.
Testing accuracies were further examined using confusion matrices to understand the pattern of correct and incorrect class predictions within a geotechnical dataset. For example, confusion matrices showing testing accuracies for Rock Type using the six ML algorithms are shown in Figure 7a. Across most models, the primary diagonal, which represents correct classifications, displays high values of more than 74.9% for the SVMs, KNNs and RFs (Figure 7b–d). This is indicative of the models' capability to correctly classify a vast majority of the samples. The strength and distinctiveness of the features associated with BIF and HYD likely contribute to this trend. On the other hand, DET, due to its more weathered nature and soil-like consistency, stands out as occasionally challenging for the models. Its weaker material strength, compared to BIF, HYD, and SH might be leading to these misclassifications. This underscores the importance of considering DET's unique geological history and characteristics when interpreting model results.
On the other hand, as BIF and HYD have a stronger material strength compared to SHL and DET, the models seem to have a relatively easier time distinguishing them. Their inherent robustness and resistance to geological processes impart them with features that machines can recognize with high accuracy. SHL, being stronger than DET but weaker than BIF and HYD, shows occasional overlaps with both groups in the DTs, LDA and NB (Figure 7a,e,f). This intermediate strength, combined with its rock-like nature, might cause it to share properties with both the stronger (BIF and HYD) and weaker (DET) materials, resulting in occasional misclassifications. Similar misclassifications were observed in the GSI, Stratigraphic Unit, Rock or Soil Strength and Weathering categories.
4. Discussion
This study demonstrates the effectiveness of classification-based ML techniques in estimating classes of geotechnical properties from MWD data, thereby increasing rock mechanics characterization beyond an order of magnitude with resource development drilling methods. Though the scope of this study was confined to five geotechnical data categories, including Stratigraphic Unit, Rock or Soil Strength, Rock Type, GSI and Weathering properties, it has the potential to be extended to other categorical orebody knowledge datasets. For example, higher resolution understandings of grade, trace contaminants, alteration intensity and mineralogy as well as other rock mass classifications systems, including Rock Mass Rating, Rock Quality Designation or Q, will greatly reduce uncertainty resulting in increased mining confidence.
This study departs from prior research by demonstrating the balanced influence of the four MWD variables. Earlier research emphasized rop and tor, utilizing PCA to determine the most important MWD measurements for rock type identification [13,16,18,21,23,47]. In contrast, both MRMR and ReliefF feature selection methods offer invaluable insights, yet their results can diverge based on their underlying methodologies. While MRMR highlighted the significance of the bap feature, ReliefF favored towards the rop feature. Such disparities emphasize the necessity of a comprehensive approach when selecting features, considering the inherent biases and strengths of each method. Future research might explore consensus-based approaches or further investigate the specific contexts where one method may be more appropriate than the other. However, both methods revealed a relatively balanced relationships between MWD measurements in which no features were identified as having zero or minimal influence.
This study also examined model prediction performance for approximating geotechnical categorical properties. The choice of the ML analytical model had a large effect on the ML prediction outcomes, demonstrated by higher Validation and Testing Accuracies, lower Training duration, Validation and Testing OMCs. DTs, LDA and NB performed the weakest across the five geotechnical datasets while KNN and RFs displayed the strongest results, consistently above 90% for Validation and Testing Accuracies for correct class identifications. Furthermore, KNN was quicker to train than RFs. For example, KNN, at 3s, was over 20 times faster than RFs, at 64s, for Rock Type. These results indicate that KNN is both the strongest and most computationally efficient model to predict geotechnical classification properties.
However, a great deal of the variance of accuracies and training durations can be traced to differences in class distributions between the five categories (Figure 5). Rock Type and Stratigraphic Unit had balanced distributions while the remaining categories were skewed to one class. The impact of this is observable in the consistently above 80% Accuracies for GSI, Rock or Soil Strength and Weathering prediction performance results. On the other hand, the Rock Type and Stratigraphic Unit, which had a wider spread of Accuracies, from 32% to 97%, depending on the ML algorithm. Moreover, similar physical properties may cause misclassification. For example, regarding Rock Type, SHL was observed to be misclassified as BIF and DET, because of its material strength lying between the relatively stronger BIF and weaker DET. This study demonstrated the success of classification-based ML technique for geotechnical classification problems but also supports the valuable role of subject matter expert oversight in complementing ML studies regarding instances of misclassification, especially concerning materials with close or overlapping properties.
5. Conclusions
The application of classification-based ML techniques in conjunction with innovative datasets, such as MWD data, has introduced fresh opportunities in the field of rock mechanics Characterisation. This work provides evidence for the efficacy of ML techniques in estimating geotechnical conditions. Additionally, it highlights the improvements in the characterization of rock mechanics properties beyond the scale achieved by traditional resource development methods. The MRMR and ReliefF feature selection methods support a balanced integration of the MWD features rop, tor, fob, and bap in multivariate analysis instead of depending solely on a single feature.
Moreover, a comprehensive assessment of diverse machine learning models yielded intricate observations regarding their predictive capabilities. The KNN and RFs algorithms demonstrated superior performance, routinely obtaining validation, and testing accuracies exceeding 90%. The short training duration for KNN compared with that of RFs highlights its remarkable computational efficiency. Nevertheless, it is important to acknowledge that these results are closely linked to the underlying data distributions within the geotechnical classifications.
The balanced distributions of classes in Rock Type and Stratigraphic Unit were in stark contrast to the other categories that exhibited a predominant skew towards a single class. This contrast was evident in the wide range of accuracies depending on the ML algorithm chosen in Rock Type and Stratigraphic Unit. Furthermore, the need for further examination arises from the misidentification of related materials, such as SHL with both BIF and DET. Future work should also include other Feature Importance algorithms, such as Shapley Values, that reveal the “black box” characteristics of ML techniques to improve explainability [48,49]. While the scope of this study was limited to five geotechnical data categories, the findings provide a solid basis for extrapolating these methods to other categorical datasets relevant to orebody knowledge.
Acknowledgments
One of the authors (DG) received support through the MRIWA Postgraduate Research Scholarship and the AusIMM Education Endowment Fund Postgraduate Scholarship during his doctoral studies at Curtin University. Furthermore, the research was enabled by the advanced computing resources provided by the Pawsey Supercomputing Research Centre in Perth, Australia.
Conflicts of Interest
The authors declare no conflict of interest.
References
- Said, K.O.; Onifade, M.; Akinseye, P.; Kolapo, P.; Abdulsalam, J. A Review of Geospatial Technology-Based Applications in Mineral Exploration. GeoJournal 2023, 88, 2889–2911. [Google Scholar] [CrossRef]
- Stebbins, S.A. Cost Estimation Handbook for Small Placer Mines; US Department of the Interior, Bureau of Mines, 1987; Vol. 9170.
- Silversides, K.; Melkumyan, A.; Wyman, D.; Hatherly, P. Automated Recognition of Stratigraphic Marker Shales from Geophysical Logs in Iron Ore Deposits. Computers and Geosciences 2015, 77, 118–125. [Google Scholar] [CrossRef]
- Wedge, D.; Hartley, O.; McMickan, A.; Green, T.; Holden, E.J. Machine Learning Assisted Geological Interpretation of Drillhole Data: Examples from the Pilbara Region, Western Australia. Ore Geology Reviews 2019, 114, 103118–103118. [Google Scholar] [CrossRef]
- Potter, C.; Moussa, J.; Wilcox, A.; Gilbert, L.; Vargas, V. General Overview of Mobile Sources Used for Well Logging and Industrial Radiography Applications. 2022.
- Goldstein, D.M.; Aldrich, C.; O’Connor, L. A Review of Orebody Knowledge Enhancement Using Machine Learning on Open-Pit Mine Measure-While-Drilling Data. Machine Learning and Knowledge Extraction 2024, 6, 1343–1360. [Google Scholar] [CrossRef]
- Barr, M.V. Instrumented Horizontal Drilling for Tunnelling Site Investigation. PhD, University of London: Imperial College of Science and Technology, 1984. [Google Scholar]
- Hatherly, P.; Leung, R.; Scheding, S.; Robinson, D. Drill Monitoring Results Reveal Geological Conditions in Blasthole Drilling. International Journal of Rock Mechanics and Mining Sciences 2015, 78, 144–154. [Google Scholar] [CrossRef]
- Kadkhodaie-Ilkhchi, A.; Monteiro, S.T.; Ramos, F.; Hatherly, P. Rock Recognition from MWD Data: A Comparative Study of Boosting, Neural Networks, and Fuzzy Logic. IEEE Geoscience and Remote Sensing Letters 2010, 7, 680–684. [Google Scholar] [CrossRef]
- Khorzoughi, M.B. Use of Measurement While Drilling Techniques for Improved Rock Mass Characterization in Open-Pit Mines. MSc, University of British Columbia, Vancouver, 2011. [Google Scholar]
- Navarro, J.; Segarra, P.; Sanchidrián, J.A.; Castedo, R.; Fortes, A.P.P.; Natale, M.; López, L.M. Application of an In-House MWD System for Quarry Blasting.; Lulea, Sweden, 2018; pp. 203–210.
- van Eldert, J.; Schunnesson, H.; Saiang, D.; Funehag, J. Improved Filtering and Normalizing of Measurement-While-Drilling (MWD) Data in Tunnel Excavation. Tunnelling and Underground Space Technology 2020, 103, 103467–103467. [Google Scholar] [CrossRef]
- Galende-Hernández, M.; Menéndez, M.; Fuente, M.J.; Sainz-Palmero, G.I. Monitor-While-Drilling-Based Estimation of Rock Mass Rating with Computational Intelligence: The Case of Tunnel Excavation Front. Automation in Construction 2018, 93, 325–338. [Google Scholar] [CrossRef]
- Klyuchnikov, N.; Zaytsev, A.; Gruzdev, A.; Ovchinnikov, G.; Antipova, K.; Ismailova, L.; Muravleva, E.; Burnaev, E.; Semenikhin, A.; Cherepanov, A.; et al. Data-Driven Model for the Identification of the Rock Type at a Drilling Bit. Journal of Petroleum Science and Engineering 2019, 178, 506–516. [Google Scholar] [CrossRef]
- Peck, J.P. Performance Monitoring of Rotary Blasthole Drills. 1989, 395.
- Scoble, M.J.; Peck, J.; Hendricks, C. Correlation between Rotary Drill Performance Parameters and Borehole Geophysical Logging. 1989, 8, 301–312. [Google Scholar]
- Segui, J.B.; Higgins, M. Blast Design Using Measurement While Drilling Parameters.; Hunter Valley, NSW, 2001; pp. 28–31.
- Navarro, J.; Seidl, T.; Hartlieb, P.; Sanchidrián, J.A.; Segarra, P.; Couceiro, P.; Schimek, P.; Godoy, C. Blastability and Ore Grade Assessment from Drill Monitoring for Open Pit Applications. Rock Mech Rock Eng 2021, 54, 3209–3228. [Google Scholar] [CrossRef]
- Akyildiz, O.; Basarir, H.; Vezhapparambu, V.S.; Ellefmo, S. MWD Data-Based Marble Quality Class Prediction Models Using ML Algorithms. Math Geosci 2023. [Google Scholar] [CrossRef]
- Basarir, H.; Wesseloo, J.; Karrech, A.; Pasternak, E.; Dyskin, A. The Use of Soft Computing Methods for the Prediction of Rock Properties Based on Measurement While Drilling Data. Proceedings of the Eighth International Conference on Deep and High Stress Mining 2017, 537–551. [Google Scholar] [CrossRef]
- Beattie, N. Monitoring-While-Drilling for Open-Pit Mining in a Hard Rock Environment. Master of Science, Queen’s University, Kingston, Ontario, Canada, 2009. [Google Scholar]
- Khushaba, R.N.; Melkumyan, A.; Hill, A.J. A Machine Learning Approach for Material Type Logging and Chemical Assaying from Autonomous Measure-While-Drilling (MWD) Data. Math Geosci 2021. [Google Scholar] [CrossRef]
- Martin, J. Application of Pattern Recognition Techniques to Monitoring-While- Drilling on a Rotary Electric Blasthole Drill at an Open-Pit Coal Mine. MSc, Queen’s University, Kingston, Ontario, Canada, 2007. [Google Scholar]
- Goldstein, D.; Aldrich, C.; O’Connor, L. Enhancing Orebody Knowledge Using Measure-While-Drilling Data: A Machine Learning Approach. IFAC PapersOnLine 2024, 58, 72–76. [Google Scholar] [CrossRef]
- Silversides, K.L.; Melkumyan, A. Multivariate Gaussian Process for Distinguishing Geological Units Using Measure While Drilling Data. In Proceedings of the Minig Goes Digitial; Taylor & Francis Group: London, 2019; pp. 94–100. [Google Scholar]
- Silversides, K.L.; Melkumyan, A. Boundary Identification and Surface Updates Using MWD. Mathematical Geosciences 2020. [Google Scholar] [CrossRef]
- Goldstein, D.; Aldrich, C.; Shao, Q.; O’Connor, L. Unlocking Subsurface Geology: A Case Study with Measure-While-Drilling Data and Machine Learning. Preprints 2025. [Google Scholar] [CrossRef]
- Schunnesson, H. Drill Process Monitoring in Percussive Drilling: A Multivariate Approach for Data Analysis. Licentiate, Lulea University of Technology: Lulea, Sweden, 1990.
- Ker, P. Iron Ore Supply Slump as Rio Runs Late on New Mines. Australian Financial Review 2021.
- De-Vitry, C.; Vann, J.; Arvidson, H. Multivariate Iron Ore Deposit Resource Estimation – a Practitioner’s Guide to Selecting Methods. Trans Inst Mining Metallurgy Sect B. 2010, 119, 154–165. [Google Scholar] [CrossRef]
- Jones, H.; Walraven, F.; Knott, G. Natural Gamma Logging as an Aid to Iron Ore Exploration in the Pilbara Region of Western Australia.; Perth, Australia, 1973.
- Brown, E. Rock Characterization, Testing and Monitoring: ISRM Suggested Methods; Pergamon Press, 1981. [Google Scholar]
- International Society for Rock Mechanics (ISRM) Simple Field Identification Compressive Strength of Rock and Clay. International Journal of Rock Mechanics and Mining Sciences 1978, 15, 319–368.
- Hoek, E. Strength of Jointed Rock Masses. Géotechnique 1983, 33, 187–223. [Google Scholar] [CrossRef]
- Khorzoughi, B.M.; Hall, R. Processing of Measurement While Drilling Data for Rock Mass Characterization. International Journal of Mining Science and Technology 2016, 26, 989–994. [Google Scholar] [CrossRef]
- van Eldert, J.; Schunnesson, H.; Johansson, D.; Saiang, D. Application of Measurement While Drilling Technology to Predict Rock Mass Quality and Rock Support for Tunnelling. Rock Mechanics and Rock Engineering 2020, 53, 1349–1358. [Google Scholar] [CrossRef]
- Ding, C.; Peng, H. Minimum Redundancy Feature Selection from Microarray Gene Expression Data. Journal of bioinformatics and computational biology 2005, 3, 185–205. [Google Scholar] [CrossRef]
- Kira, K.; Rendell, L.A. A Practical Approach to Feature Selection. In Machine learning proceedings 1992; Elsevier, 1992; pp. 249–256. [Google Scholar]
- Breiman, L.; Friedman, J.; Olshen, R.; Stone, C. Classification and Regression Trees; Wadsworth and Brooks: Cole Monterey, CA, USA, 1984. [Google Scholar]
- Cortes, C.; Vapnik, V. Support-Vector Networks. Machine learning 1995, 20, 273–297. [Google Scholar] [CrossRef]
- Cover, T.; Hart, P. Nearest Neighbor Pattern Classification. IEEE transactions on information theory 1967, 13, 21–27. [Google Scholar] [CrossRef]
- Fisher, J.E.; Shakoor, A.; Watts, C.F. Comparing Discontinuity Orientation Data Collected by Terrestrial LiDAR and Transit Compass Methods. Engineering Geology 2014, 181, 78–92. [Google Scholar] [CrossRef]
- Duda, R.O.; Hart, P.E. Use of the Hough Transformation to Detect Lines and Curves in Pictures. Communications of the ACM 1972, 15, 11–15. [Google Scholar] [CrossRef]
- Breiman, L. Random Forests. Machine Learning 2001, 45, 5–32. [Google Scholar] [CrossRef]
- Classification Learner Toolbox; The MathWorks Inc.: Natick, Massachursetts, 2024.
- Ghosh, R.; Schunnesson, H.; Kumar, U. Evaluation of Rock Mass Characteristics Using Measurement While Drilling in Boliden Minerals Aitik Copper Mine, Sweden. In Mine Planning and Equipment Selection; Drebenstedt, C., Singhal, R., Eds.; Springer International Publishing: Cham, 2014; ISBN 978-3-319-02677-0. [Google Scholar]
- Ghosh, R.; Gustafson, A.; Schunnesson, H. Development of a Geological Model for Chargeability Assessment of Borehole Using Drill Monitoring Technique. International Journal of Rock Mechanics and Mining Sciences 2018, 109, 9–18. [Google Scholar] [CrossRef]
- Aldrich, C. Process Variable Importance Analysis by Use of Random Forests in a Shapley Regression Framework. Minerals 2020, 10, 420. [Google Scholar] [CrossRef]
- Deng, S.; Aldrich, C.; Liu, X.; Zhang, F. Explainability in Reservoir Well-Logging Evaluation: Comparison of Variable Importance Analysis with Shapley Value Regression, SHAP and LIME. IFAC PapersOnLine 2024, 58, 66–71. [Google Scholar] [CrossRef]
Figure 1.
Representative drilling rigs employed in the collection of MWD data: a) Terex SKS 12, utilized for the drilling of 0.229m production blast holes and b) Epiroc D65, used in the creation of 0.165m wall control blast holes.
Figure 1.
Representative drilling rigs employed in the collection of MWD data: a) Terex SKS 12, utilized for the drilling of 0.229m production blast holes and b) Epiroc D65, used in the creation of 0.165m wall control blast holes.
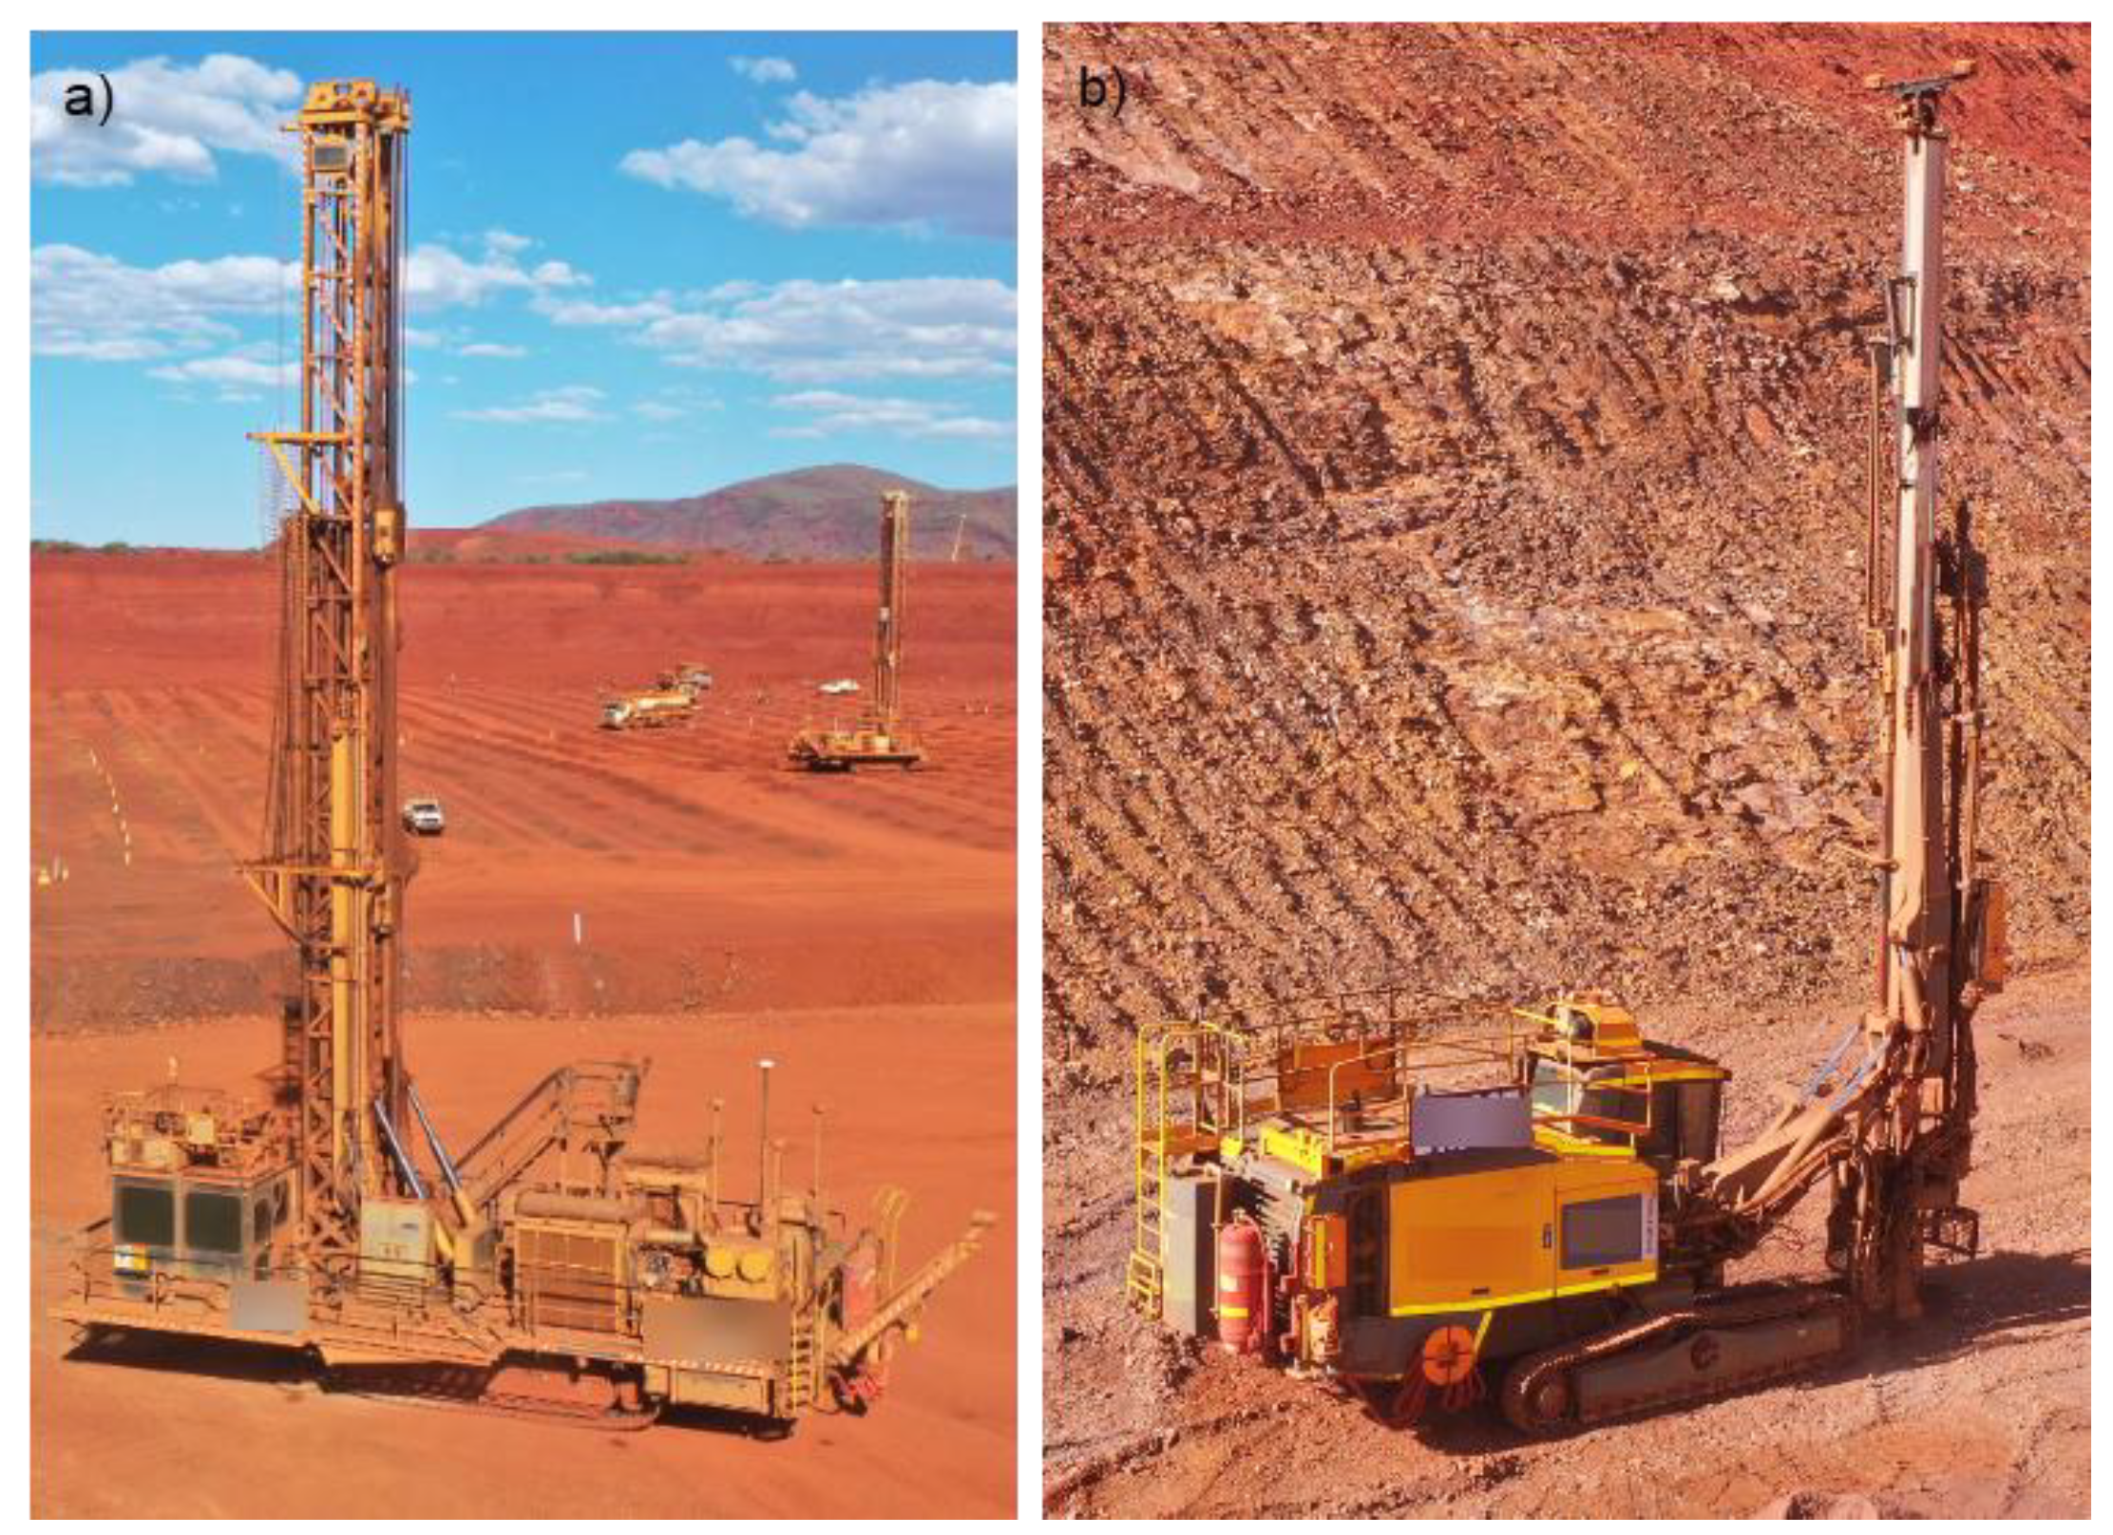
Figure 2.
Distributions of MWD datapoints for a) rop, b) tor, c) fob and d) bap.
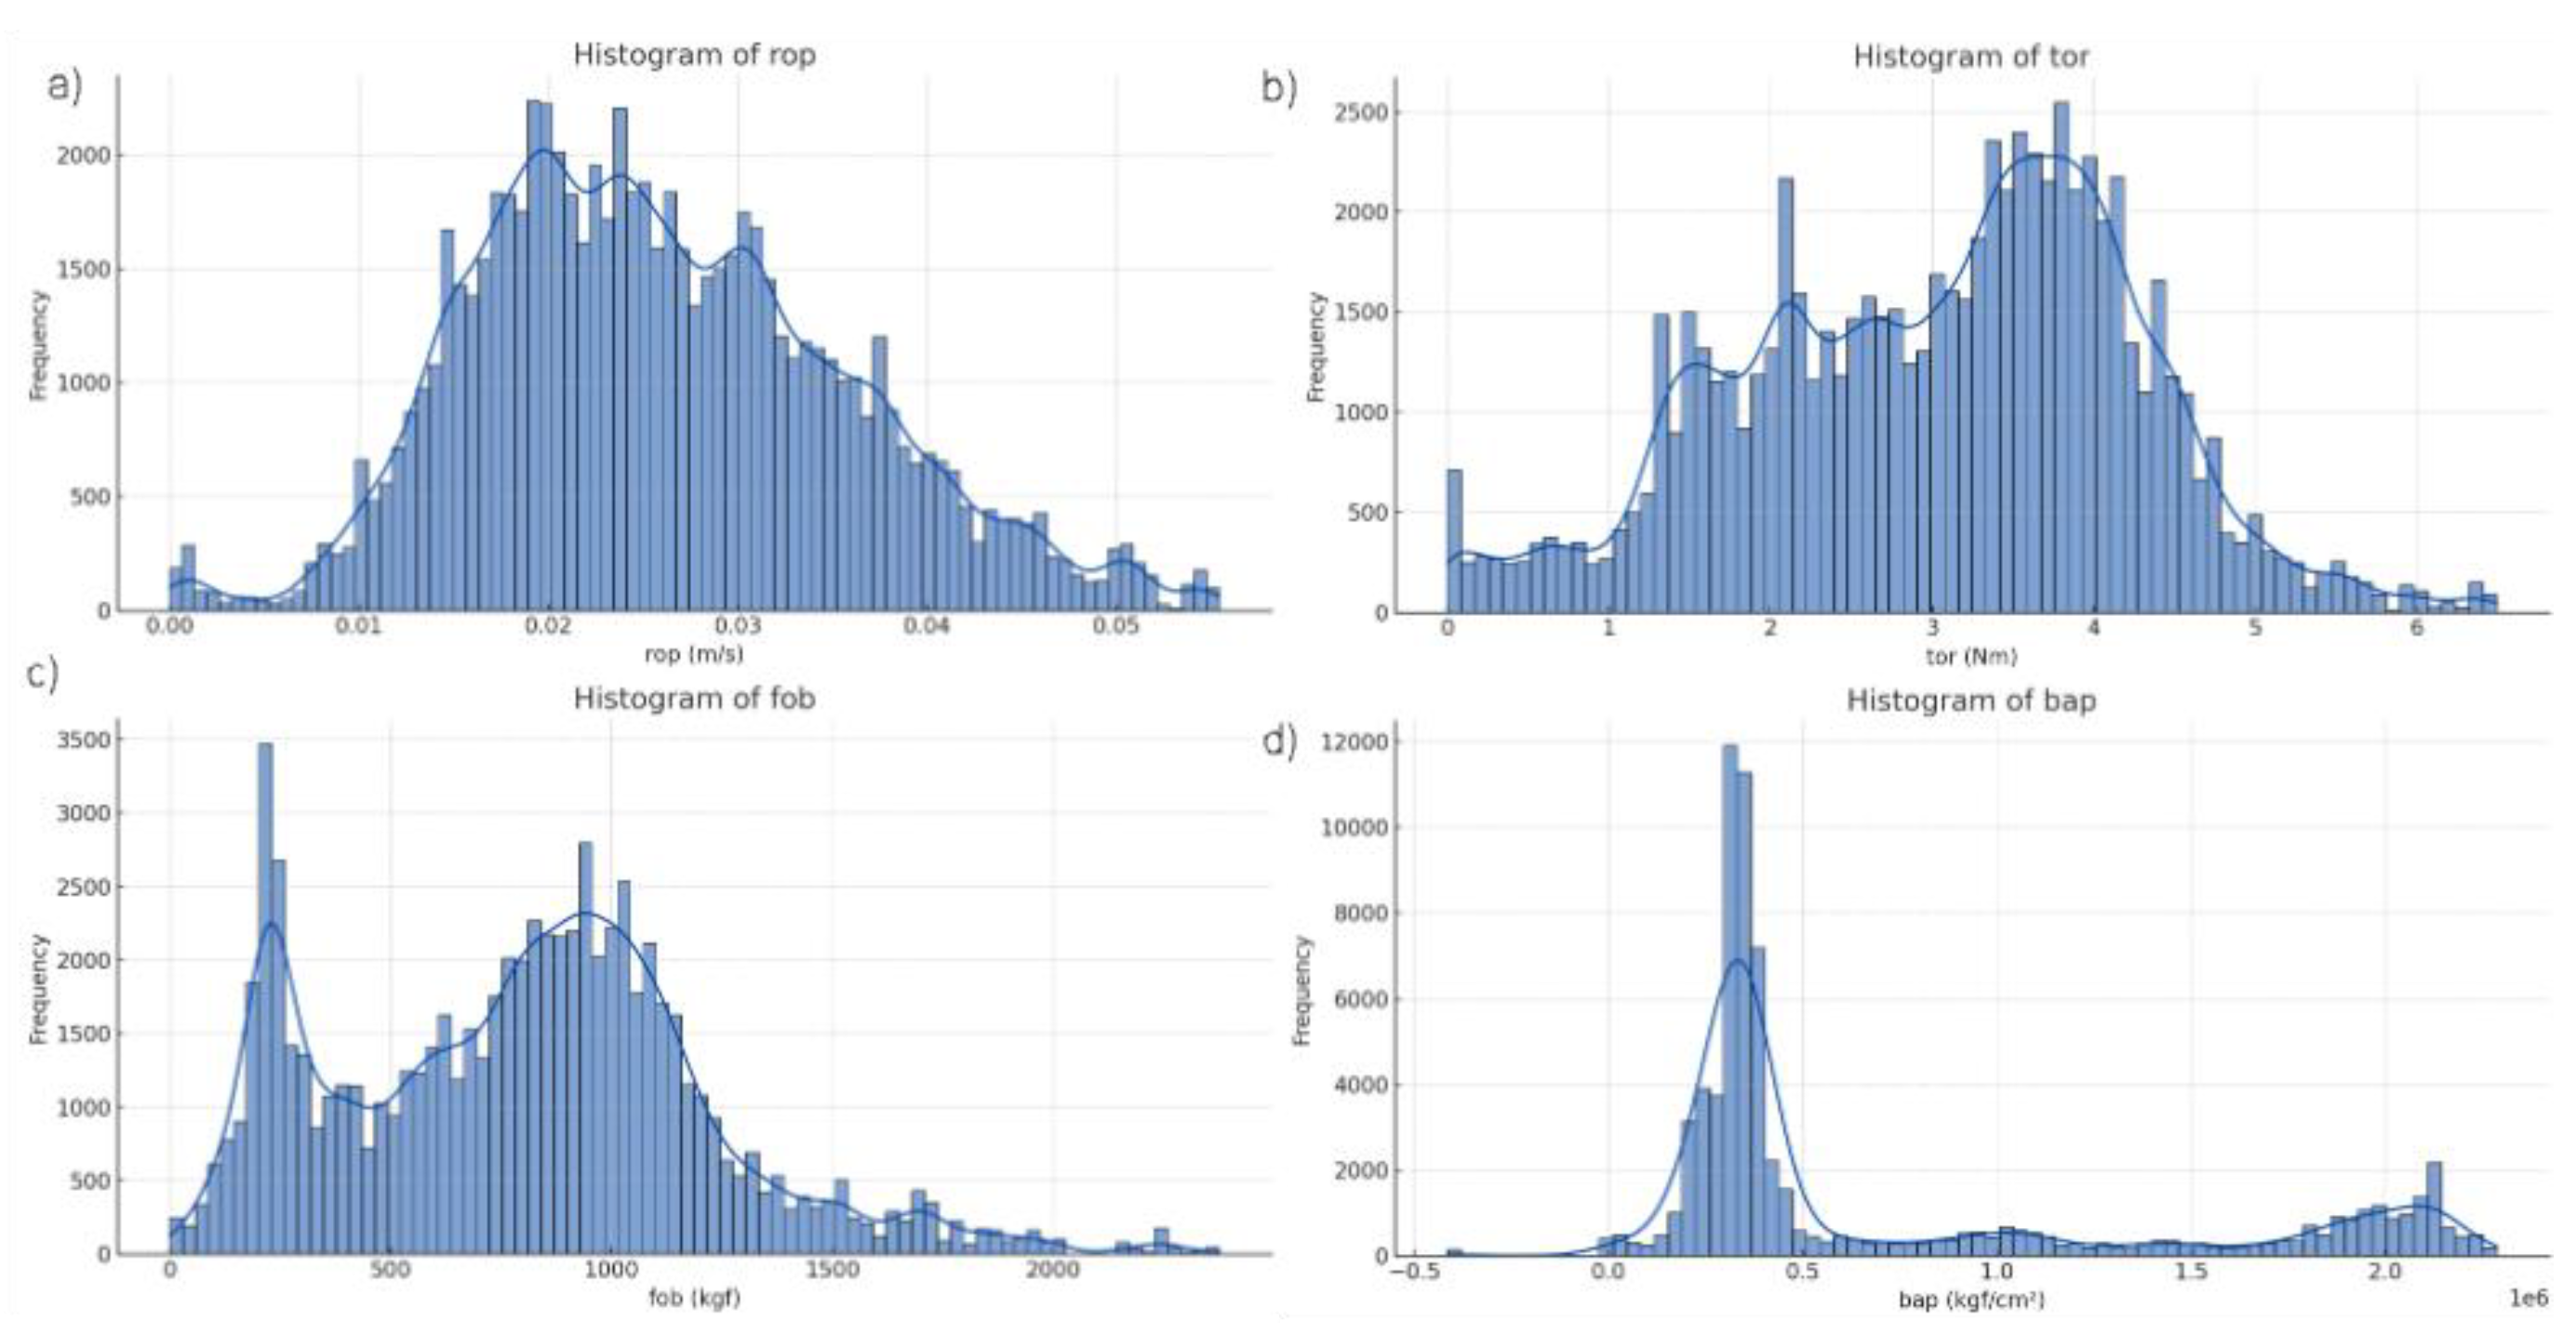
Figure 3.
Pearson Correlation Coefficient plot for MWD data variables.
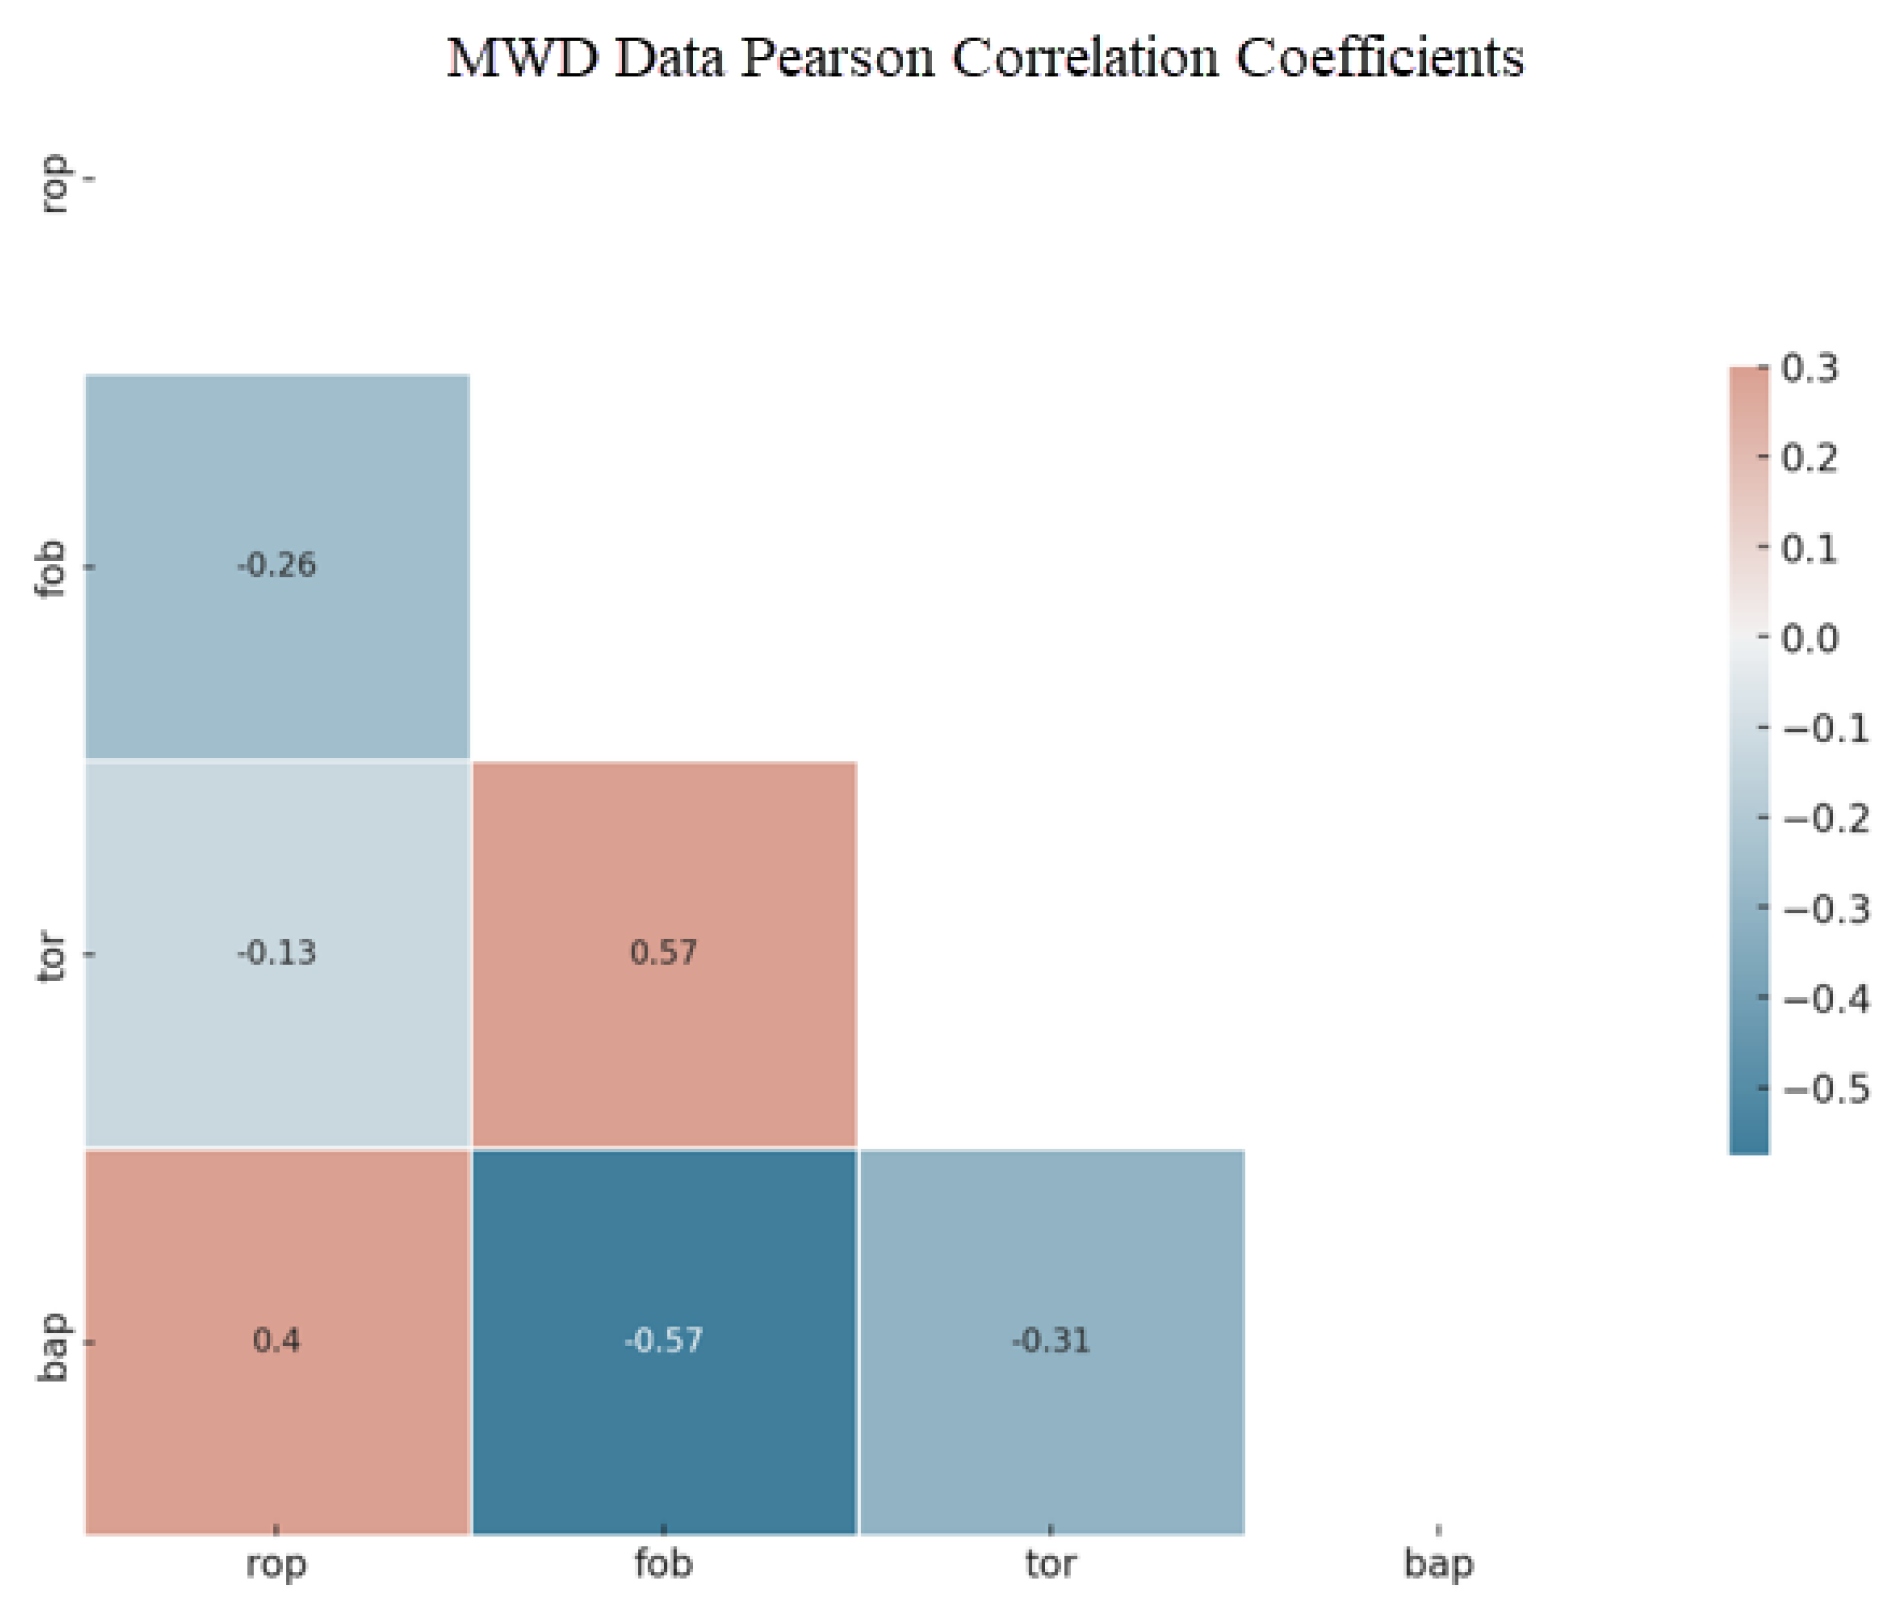
Figure 4.
Distribution of investigated geotechnical categories.
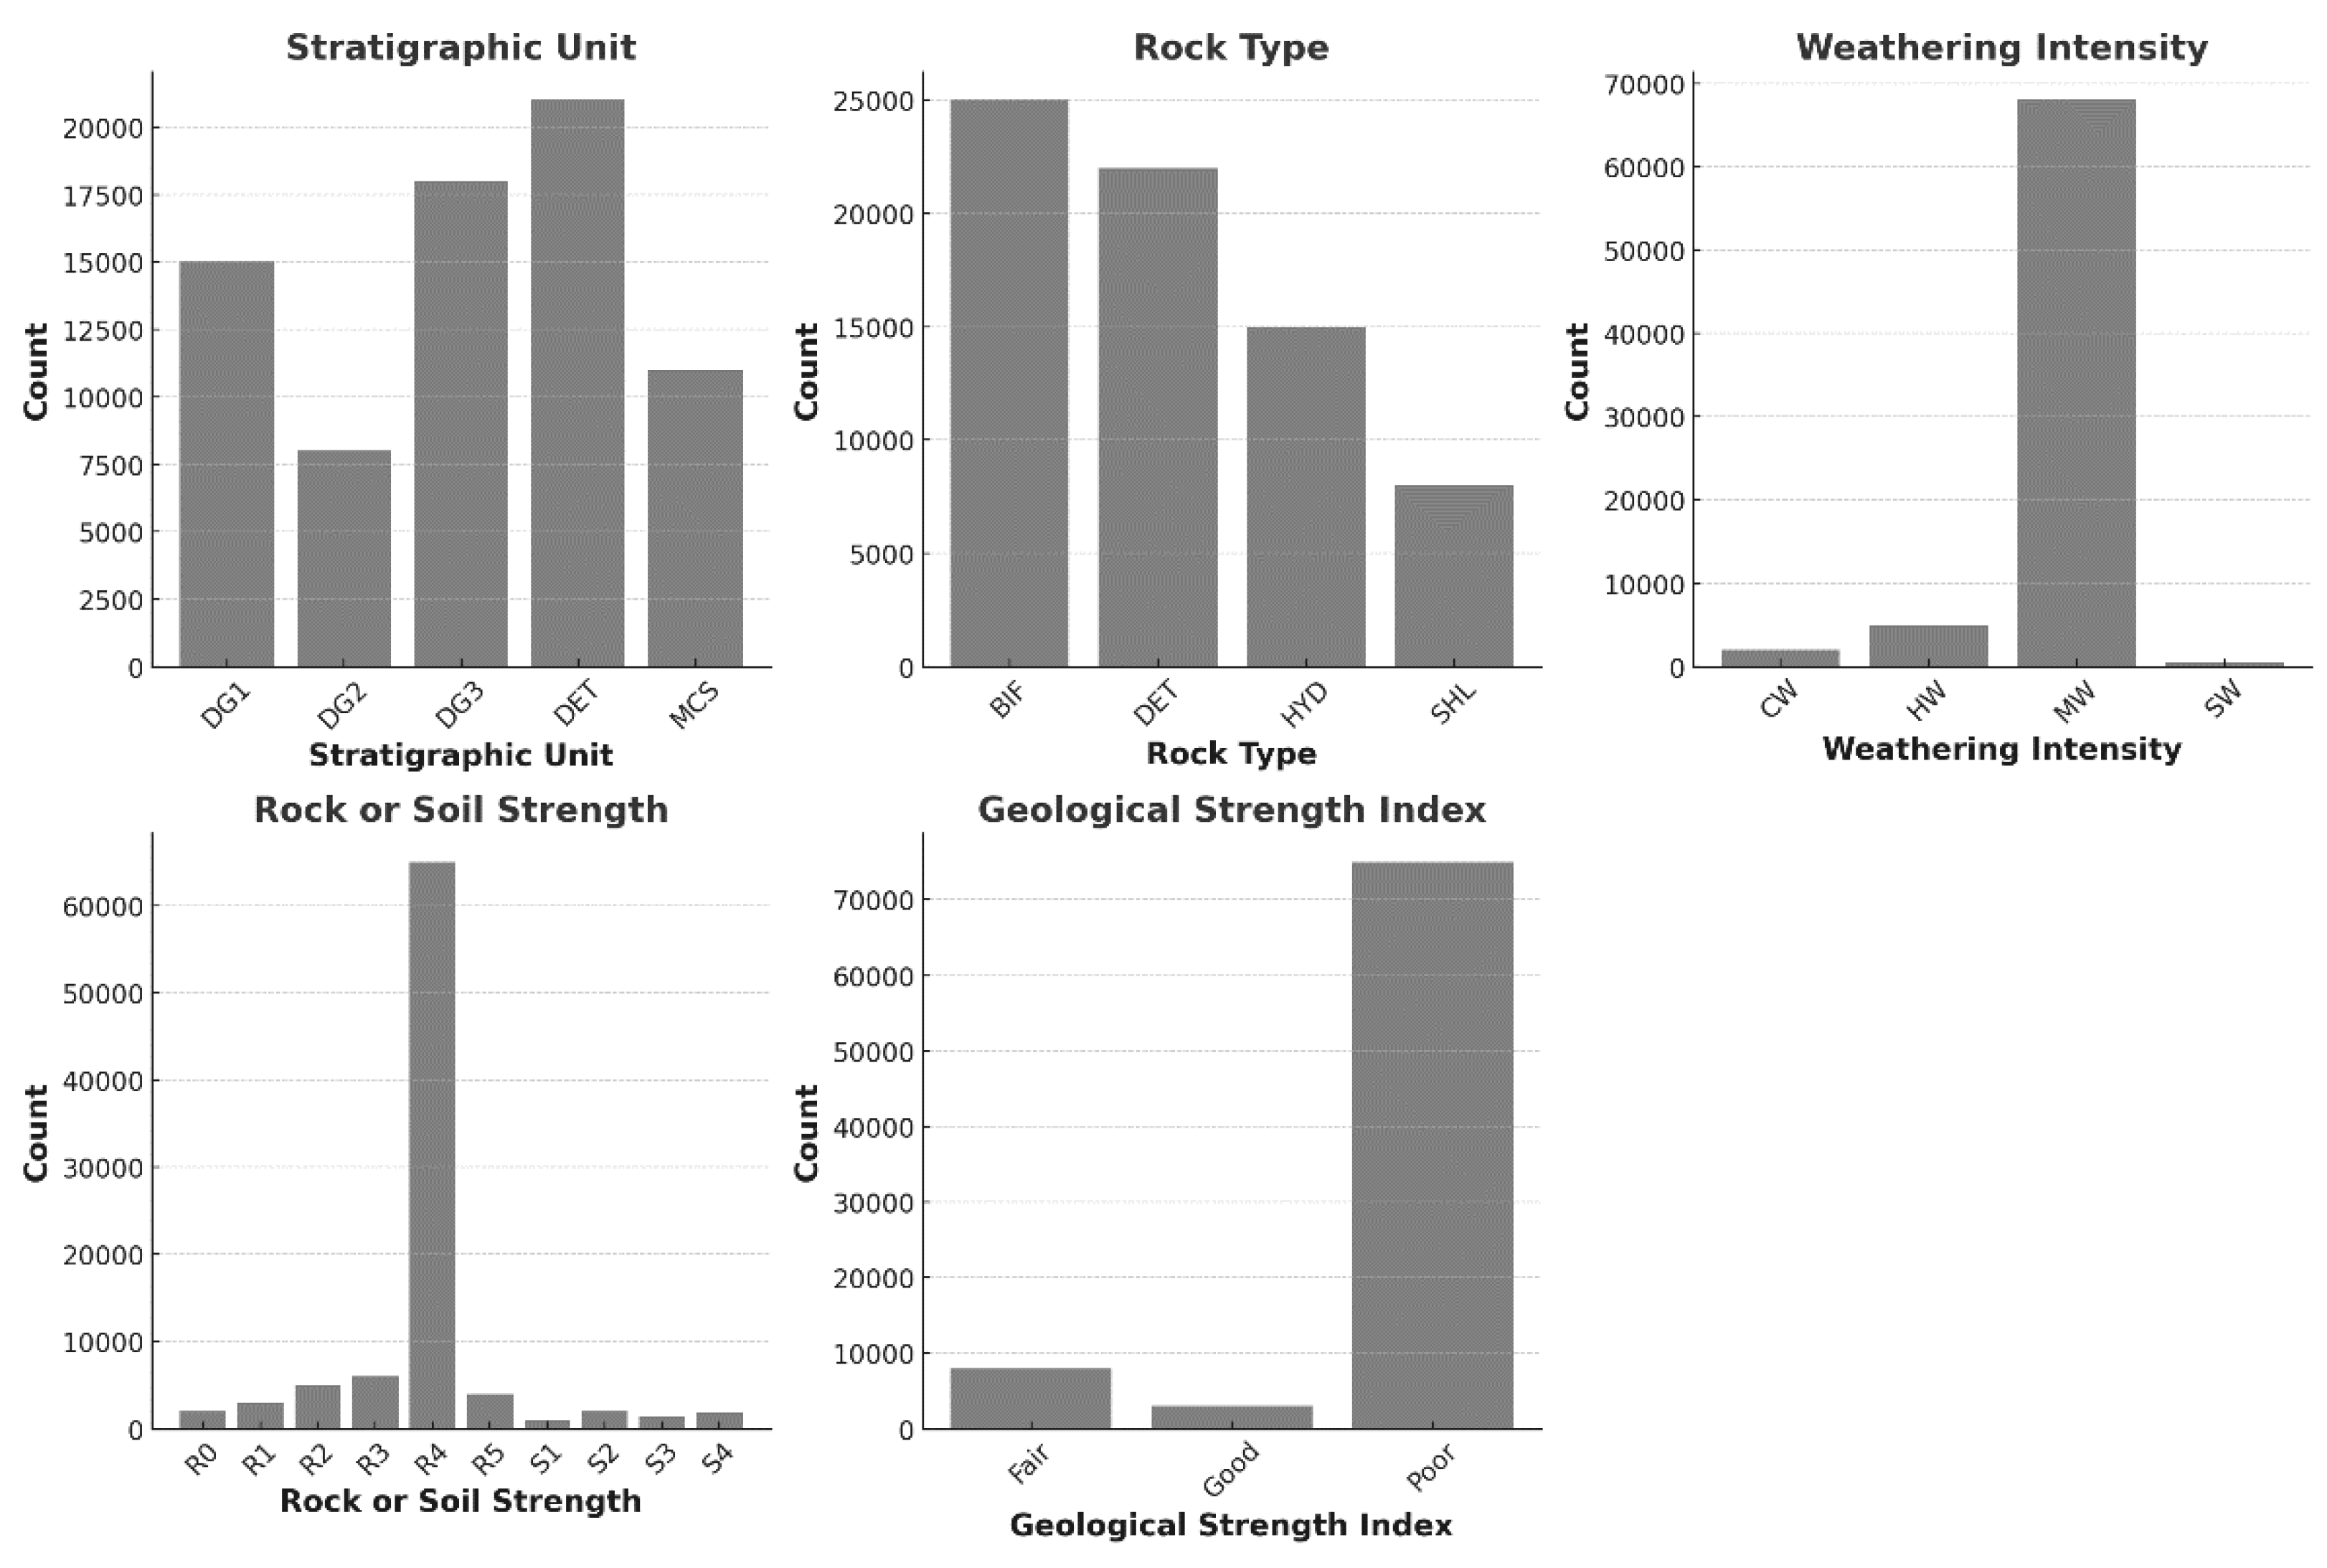
Figure 5.
MRMR and ReliefF results for MWD response features.
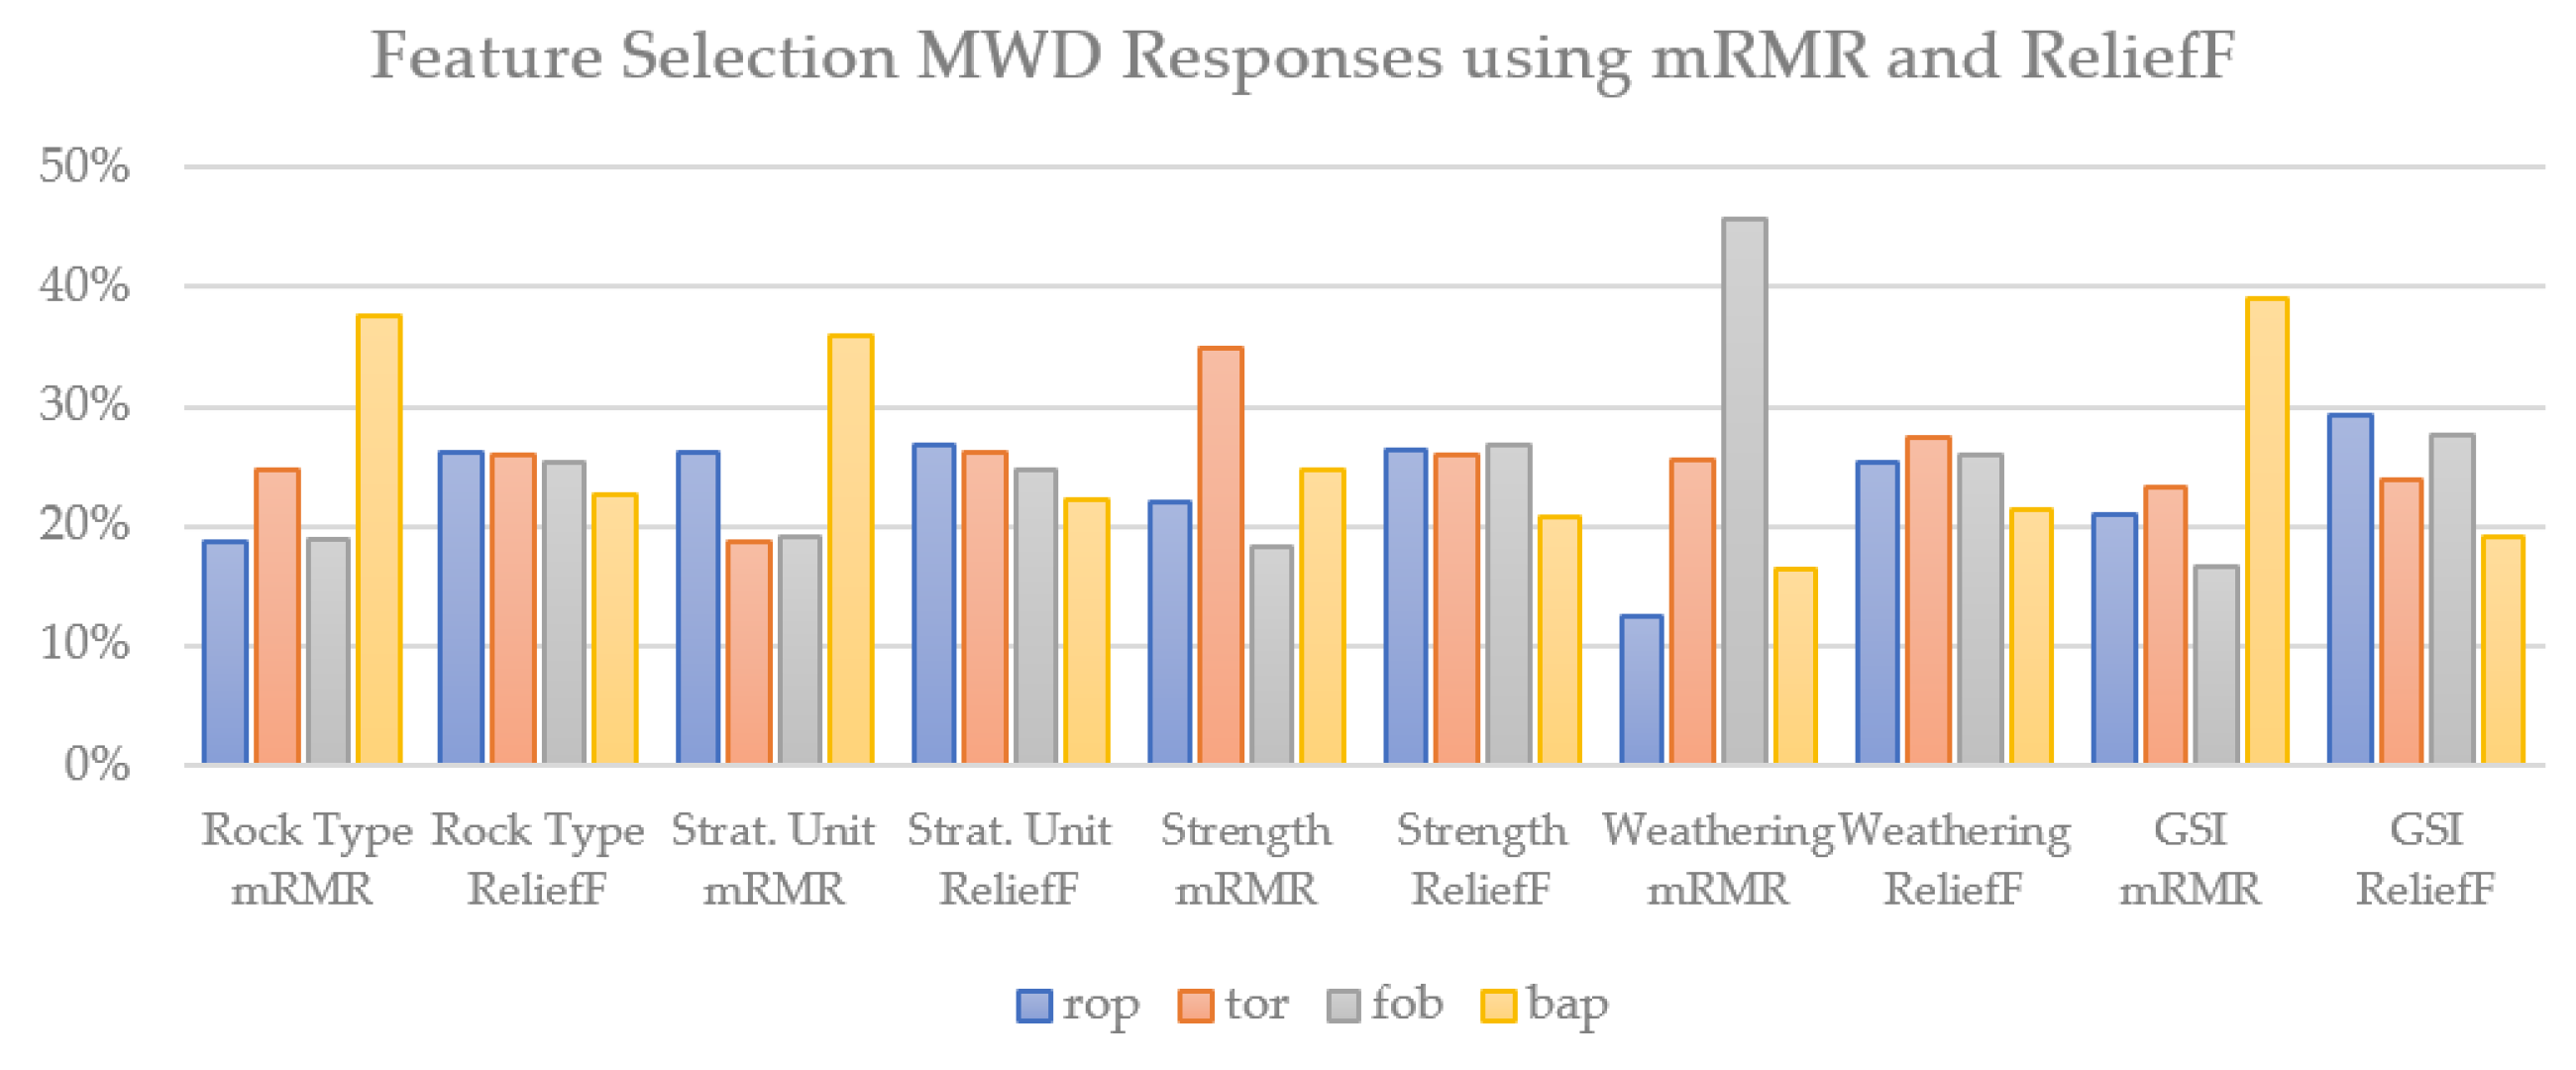
Figure 6.
Validation and Testing Cost Scores versus Training Duration for the investigated classification-based ML algorithms.
Figure 6.
Validation and Testing Cost Scores versus Training Duration for the investigated classification-based ML algorithms.
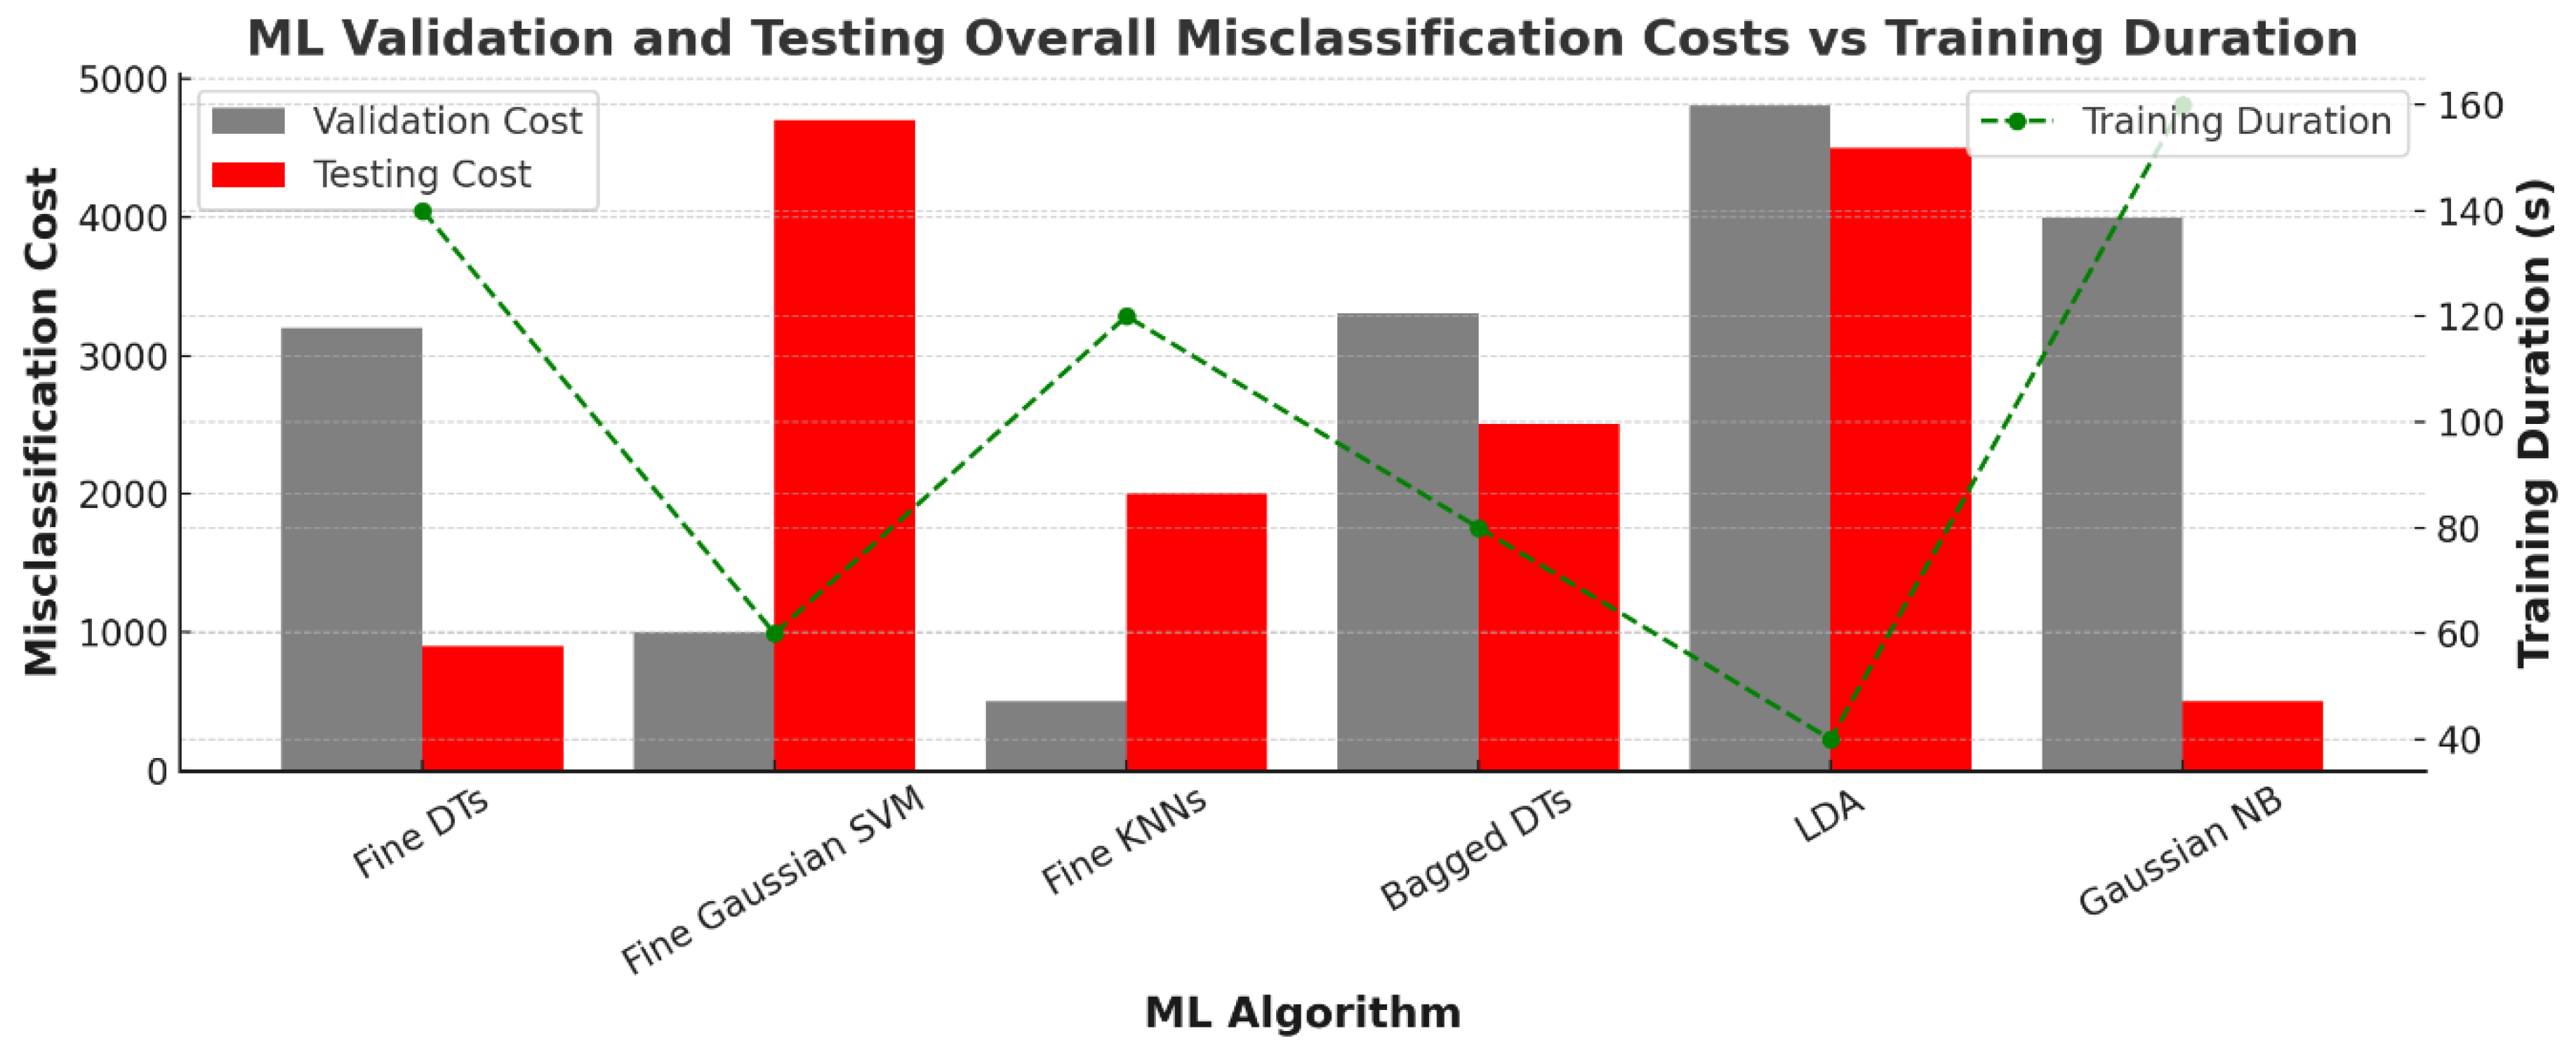
Figure 7.
Confusion matrices showing testing accuracies (%) for Rock Type using a) DTs, b) SVMs, c) KNNs, d) RFs, e) LDA and f) NB.
Figure 7.
Confusion matrices showing testing accuracies (%) for Rock Type using a) DTs, b) SVMs, c) KNNs, d) RFs, e) LDA and f) NB.
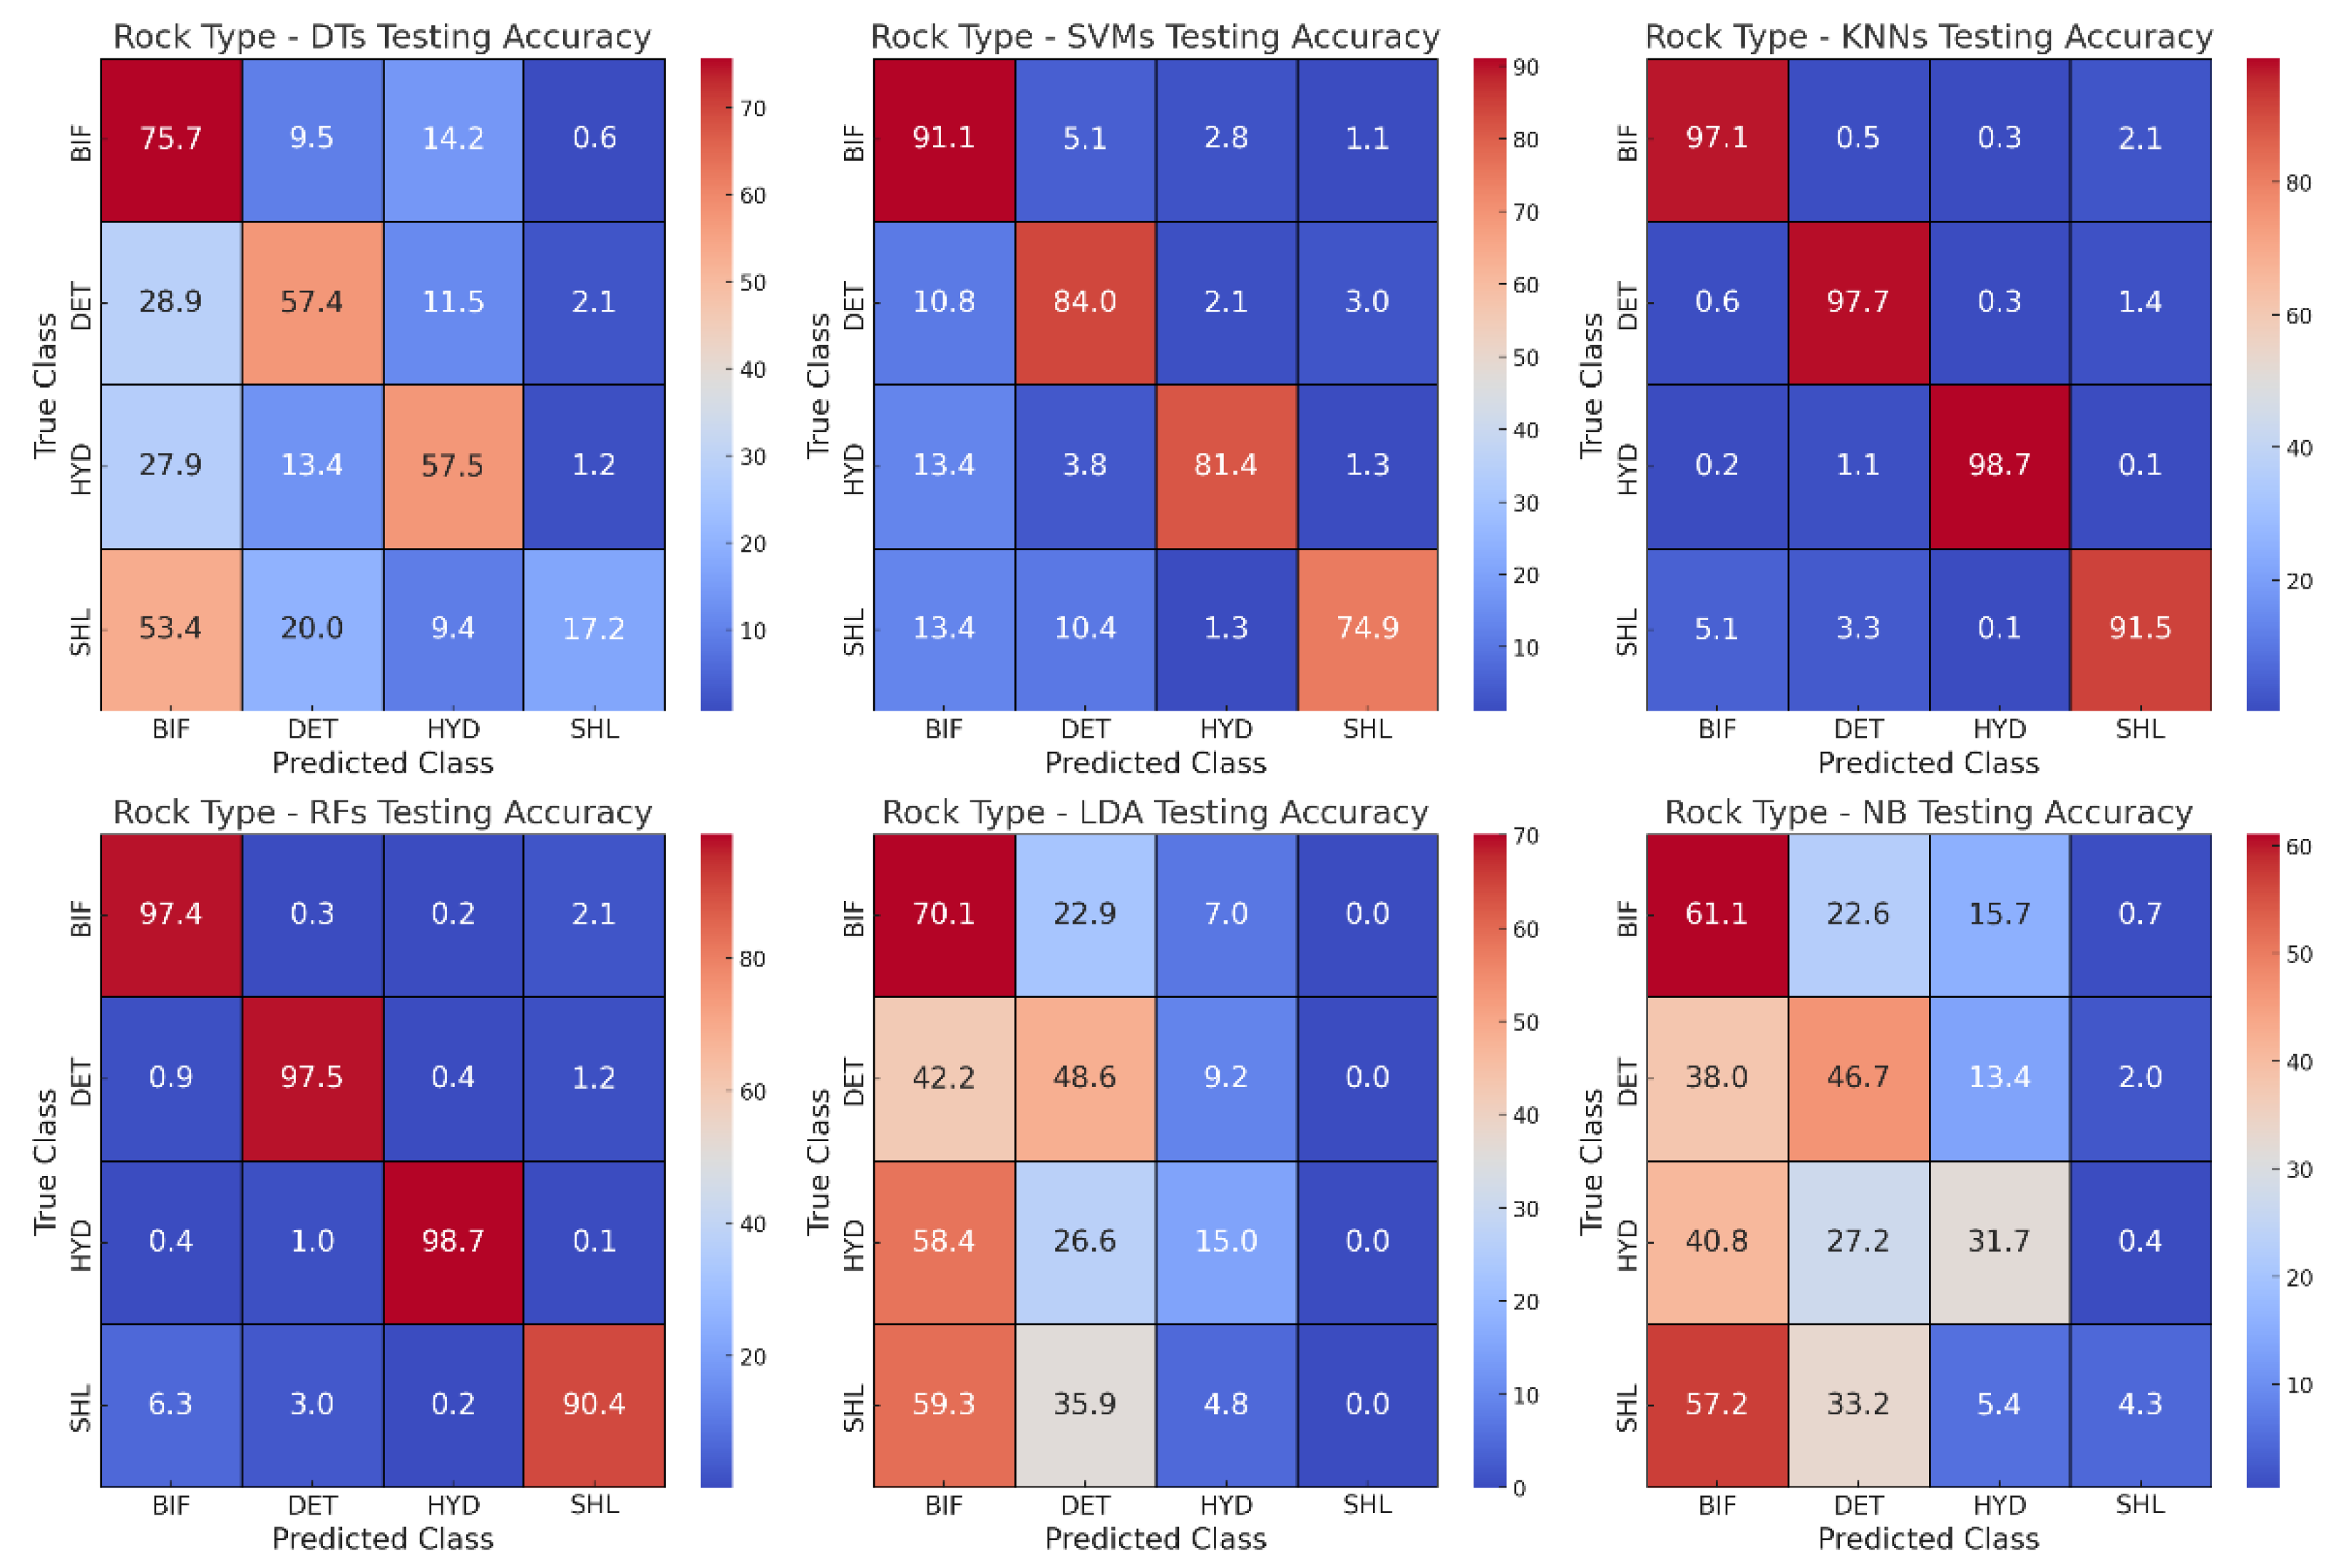

Table 1.
Rock weathering classes.
| Code | Type | Description |
|---|---|---|
| FR | Fresh | No visible sign of rock material weathering |
| SW | Slightly Weathered | Less than 5% of material altered |
| MW | Moderately Weathered | Less than 50% of rock is decomposed |
| HW | Highly Weathered | More than 50% of rock is decomposed |
| CW | Completely Weathered | 100% decomposed with intact structure |
| RS | Residual Soil | All rock material converted to soil |
Table 2.
Soil strength classes S0-S6 and rock strength classes R0-R6.
| Class | Term | Field Identification |
|---|---|---|
| S1 | Very soft clay | Easily penetrated several inches by fist |
| S2 | Soft clay | Easily penetrated several inches by thumb |
| S3 | Firm clay | Can be penetrated several inches by thumb with moderate effort |
| S4 | Stiff clay | Readily indented by thumb but penetrated only with great effort |
| S5 | Very stiff clay | Readily indented by thumbnail |
| S6 | Hard clay | Indented with difficulty by thumbnail |
| R0 | Extremely weak rock | Indented by thumbnail |
| R1 | Very weak rock | Crumbles under firm blows with a geological hammer |
| R2 | Weak rock | Shallow indentations made by firm blow of a geological hammer |
| R3 | Medium strong rock | Can be fractured with a single firm blow of a geological hammer |
| R4 | Strong rock | Requires more than one blow of a geological hammer to fracture |
| R5 | Very strong rock | Requires several blows of a geological hammer to fracture |
| R6 | Extremely strong rock | Only chipped with a geological hammer |
Table 3.
Comparison of the employed classification-based ML methods employed.
| ML Algorithm | Advantages | Drawbacks |
|---|---|---|
| Decision Trees [39] | Easy to understand and interpret Not sensitive to outliers |
Prone to overfitting Biased with imbalanced datasets |
|
Support Vector Machines [40] |
Effective in high dimensional spaces Outlier impact is minimized due to the margin maximization It is memory efficient |
Can be challenging to interpret Unsuitable for big data due to high training time Poor performance with overlapping classes |
|
K-Nearest Neighbours [41] |
Simple to implement No assumptions about the data Adaptable to multiclass classifications |
Computationally expensive Sensitivity to irrelevant features and data scale Must determine the value of K |
| Linear Discriminant Analysis [42] | Reduces dimensionality Avoids overfitting |
Assumes the data are normally distributed Assumes that all classes share the same covariance matrix |
|
Naïve Bayes [43] |
Simple and easy to implement Works well with high dimensions |
Makes a strong assumption about the shape of your data distribution Assigns a zero probability if variable is in test data but not training data |
|
Random Forests [44] |
Handles higher dimensionality well Effective for regression and classification Robust to outliers and nonlinear data |
Tends to overfit for some datasets with noisy classification tasks Model interpretability difficult due to many trees Longer training period compared to DTs |
Table 4.
Statistical values for MWD data.
| rop (m/s) | tor (Nm) | fob (kgf) | bap (kgf/cm2) | |
|---|---|---|---|---|
| Mean | 0.026 | 3.05 | 793 | 738,147 |
| Median | 0.025 | 3.21 | 817 | 366,918 |
| Standard Deviation | 0.010 | 1.21 | 427 | 677,120 |
| Minimum | 0.000 | 0.00 | 0 | -414,500 |
| Maximum | 0.055 | 6.49 | 2375 | 2,288,366 |
Table 5.
Validation and Testing Accuracies, and Validation Costs for the ML algorithms.
| ML Model | Decision Trees | Support Vector Machines | K-Nearest Neighbours | Random Forests | Linear Discriminant Analysis | Naïve Bayes | |
| Geological Strength Index | Validation Accuracy (%) | 98 | 98 | 98 | 98 | 97 | 97 |
| Testing Accuracy (%) | 98 | 98 | 98 | 98 | 97 | 97 | |
| Validation Cost | 1,547 | 1,410 | 1,062 | 1,102 | 2,309 | 2,293 | |
| Stratigraphic Unit | Validation Accuracy (%) | 50 | 83 | 96 | 33 | 32 | 96 |
| Testing Accuracy (%) | 51 | 83 | 95 | 33 | 32 | 95 | |
| Validation Cost | 29,377 | 10,458 | 2,510 | 38,980 | 39,614 | 2,605 | |
| Rock or Soil Strength | Validation Accuracy (%) | 87 | 93 | 95 | 95 | 85 | 85 |
| Testing Accuracy (%) | 87 | 94 | 95 | 95 | 85 | 85 | |
| Validation Cost | 8,407 | 4,553 | 3,184 | 3,270 | 10,005 | 9,939 | |
| Validation Accuracy (%) | 57 | 84 | 97 | 97 | 42 | 42 | |
| Rock Type | Testing Accuracy (%) | 59 | 85 | 97 | 97 | 42 | 43 |
| Validation Cost | 22,784 | 8,428 | 1,626 | 1,720 | 30,821 | 30,651 | |
| Validation Accuracy (%) | 88 | 93 | 95 | 95 | 85 | 85 | |
| Weathering | Testing Accuracy (%) | 88 | 93 | 95 | 95 | 85 | 85 |
| Validation Cost | 7,693 | 4,411 | 3,100 | 3,257 | 9,851 | 9,841 | |
Disclaimer/Publisher’s Note: The statements, opinions and data contained in all publications are solely those of the individual author(s) and contributor(s) and not of MDPI and/or the editor(s). MDPI and/or the editor(s) disclaim responsibility for any injury to people or property resulting from any ideas, methods, instructions or products referred to in the content. |
© 2025 by the authors. Licensee MDPI, Basel, Switzerland. This article is an open access article distributed under the terms and conditions of the Creative Commons Attribution (CC BY) license (http://creativecommons.org/licenses/by/4.0/).
Copyright: This open access article is published under a Creative Commons CC BY 4.0 license, which permit the free download, distribution, and reuse, provided that the author and preprint are cited in any reuse.


