Submitted:
10 February 2025
Posted:
11 February 2025
Read the latest preprint version here
Abstract
Deteriorating eyesight is increasingly prevalent in the digital age due to prolonged screen exposure and insufficient eye care, leading to reduced productivity and difficulties in maintaining focus during extended reading sessions. This systematic literature review, following PRISMA guidelines, evaluates 1782 articles, with 42 studies ultimately included, assessing their quality using the Mixed Methods Appraisal Tool (MMAT). The selected studies are categorised into eye metric classification, measuring comprehension, measuring attention and typography & typesetting. Recent advances have demonstrated the potential of machine learning to enhance eye movement predictions, such as classification of fixations and saccades, while other research utilises eye metrics to assess mental fatigue and attention levels. Additionally, modifications to typography have been explored as a means of improving focus and memory retention. The findings highlight the transformative role of eye-tracking technologies and machine learning in understanding reading behaviour, attention, and cognitive workload. However, challenges such as data scarcity, limited generalisability, and biases in existing methodologies persist. Addressing these gaps through standardised frameworks, diverse datasets, and advancements in synthetic data generation could enhance the accessibility, accuracy, and real-world applicability of eye-tracking solutions for improving reading comprehension and focus.
Keywords:
eye tracking
; artificial intelligence
; machine learning
; productivity
; eye health
; reading
1. Introduction
Prolonged screen use has led to an increase in Digital Eye Strain (DES), or computer vision syndrome, characterised by symptoms such as eye discomfort, headaches, blurred vision, and fatigue. The prevalence of DES surged during the COVID-19 pandemic, with studies reporting 80–94% of individuals experiencing symptoms, particularly those spending 7–10 hours daily on screens [1]. Common long-term effects include dry eye disease, myopia progression, and potential retinal damage, exacerbated by reduced blinking rates and excessive near work. These issues affect productivity and well-being, highlighting the urgent need for preventive measures and awareness.
Existing solutions, such as blue-light filters and ergonomic adjustments, aim to prevent eye strain but do not actively monitor or assess its effects. Eye-tracking technology offers a promising alternative, using metrics like fixations, saccades, and pupil responses to assess fatigue and mental workload [2]. These analyses offer insights into user fatigue levels, directly connecting to critical areas of interest such as reading comprehension and memory retention.
Recent advancements in machine learning, including convolutional neural networks (CNNs) and generative adversarial networks (GANs), have improved eye-tracking accuracy for metrics including fixations and saccades [3]. Techniques such as intelligent typography, involving adjustments to font and spacing, have also been explored to improve reading focus and retention [39].
Nonetheless, there remains a notable gap in understanding the role of physical eye health and its direct link to overall fatigue with eye movement data. This gap in research highlights the need for further exploration. This systematic literature review aims to address this by exploring not only the accuracy improvements in eye-tracking technology, but also less commonly examined metrics which could be used to further assess reading behaviour, comprehension and productivity. Additionally, this review will allow to pinpoint the challenges currently faced in the field, such as the limited availability of datasets.
2. Materials and methods
This systematic literature review was performed following the Preferred Reporting Items for Systematic Reviews and Meta-Analyses (PRISMA) guidelines [4].
2.1. Search Strategy
To ensure a comprehensive search for relevant studies, a targeted search string was developed based on the project’s focus areas, starting from keywords identified through an initial set of relevant papers, and validated via a series of focus groups with biomedical engineers and medical doctors with substantive expertise in evidence generation in medicine. Moreover, PUBMED mesh term finder was used to look for possible synonym key terms to ensure a complete search string. The identified key terms were combined using Boolean operators (e.g., AND, OR) and the final search string was obtained:
TITLE-ABS-KEY((“eye track*” OR “gaze track*” OR “ocular track*” OR “eye mov*” OR “gaze detection” OR “eye gaze” OR “pupil track*”) AND ( “machine learning” OR “ML” OR “artificial intelligence” OR “AI” OR “deep learning” OR “computer vision” OR “neural networks” OR “CNN” OR “pattern recognition” OR “computational model” OR “natural language processing” OR “NLP” OR “text comprehension” OR “image classification” ) AND ( “blink*” OR “fixation*” OR “saccad*” OR “pupil dilat*” OR “pupil constric*” OR “eye strain” OR “visual fatigue” OR “ocular fatigue” OR “cognitive load” OR “attention span” OR “digital fatigue” OR “screen time” OR “screen exposure” OR “reading fatigue” OR “focus loss” OR “biomedical” OR “visual attention” OR “Computer Vision Syndrome” OR “CVS” OR “asthenopia” OR “bloodshot eye” OR “eye redness” ) AND ( “productivity” OR “efficiency” OR “work performance” OR “focus enhancement” OR “reading comprehension” OR “reading skill” OR “reading performance” OR “cognitive function” OR “visual engagement” OR “task engagement” OR “productivity software” OR “performance optimi?ation” OR “fatigue management” OR “break suggestion” OR “cognitive engagement” OR “reading focus” OR “personali?ed feedback” OR “behavio?r analysis” OR “text highlight*” OR “word highlight*” OR “bionic reading” OR “memory” OR “medical imaging”))
The search was conducted on the Scopus and Web of Sciences databases. This initial search produced 1,782 articles, which were then filtered to include only publications in English and within the period from January 2015 to November 2024, i.e., the last 10 years, to consider only recent advancements in technology, reducing the set to 927 articles.
2.2. Selection Criteria and Screening
Eligible articles were evaluated based on three main areas: eye tracking, eye metrics, and productivity. Only journal articles, conferences papers and reviews were selected. The following inclusion and exclusion criteria were established.
2.2.1. Inclusion Criteria
A study was included if it met at least two of the following conditions:
- Utilises eye tracking technology in conjunction with machine learning techniques.
- Investigates productivity with a focus on reading comprehension, text highlighting, or screen usage.
- Addresses eye metrics such as fixations and saccades, or issues related to eye strain and fatigue.
2.2.2. Exclusion Criteria
A study was excluded if it met any of the following conditions:
- Focuses solely on eye diseases or other clinical eye conditions.
- Involves populations with neurodivergent characteristics or addresses neurodivergent conditions.
- Includes non-human participants.
- Studies that do not focus on reading stimuli or working at a computer.
2.2.3. Screening
On rare occasions, a study was included even if it did not meet the inclusion/exclusion criteria, if it was still deemed particularly relevant by the authors.
After establishing the criteria, two authors independently screened the articles by title, abstract, and then full text. A third author independently reviewed the results of the screening process. For the initial title screening, the two reviewers assigned responses of "Y" (Yes), "N" (No), or "M" (Maybe). Articles were advanced to the abstract screening stage if both reviewers marked them as "Y". However, in cases of disagreement or "M", the third reviewer resolved the discrepancy.
2.3. Data Extraction, Data Items and Quality Appraisal
Relevant data were systematically extracted and documented in a customised Excel sheet (see Supplementary Table A1), organised into eight main categories: (1) Objective of the Study, (2) Main Findings, (3) Participants’ Information, (4) Eye Tracking Technology Used, (5) Machine Learning Techniques, (6) Metrics for Eye Movement, (7) Content Shown to Participants, and (8) Productivity Metrics. These categories allowed for a structured comparison across studies, ensuring a thorough examination of key variables.
2.4. Quality assessment
Quality appraisal was performed using the Mixed Methods Appraisal Tool (MMAT), a well-established tool for assessing the methodological quality of diverse study designs, including qualitative, quantitative, and mixed-methods research [5]. This approach ensured consistency and transparency in evaluating the reliability of the studies included in the review.
Each study was assigned an overall quality rating based on the MMAT criteria. Studies meeting all relevant criteria were considered as high quality, while those with minor methodological concerns were rated as moderate quality. Studies with significant methodological limitations were considered of low quality.
2.5. Effect Measures
Due to the heterogeneity of the study designs and outcomes included in this review, a formal statistical synthesis of effect measures was not performed. Instead, a narrative synthesis approach was adopted to interpret the findings qualitatively. Key metrics, such as fixation durations, saccade velocities, and pupil dynamics were evaluated within the context of each study to identify trends and patterns relevant to the review’s objectives. While these metrics were not standardised into unified statistical measures, their qualitative interpretation provided valuable insights into the relationships between eye-tracking metrics, cognitive processes, and reading behaviour.
2.6. Data Synthesis
Extracted data was grouped into four thematic categories: General Eye Metrics and Tracking, Measuring Comprehension, Measuring Attention, and Typography and Typesetting. Within each category, key variables such as study objectives, methodologies, and findings were compared to identify trends and relationships. The results were summarised in tables and visual diagrams to provide a clear overview of the findings and highlight patterns and differences.
Heterogeneity was explored qualitatively by examining variations in study characteristics, such as participant demographics, settings, and methodologies. Methodological quality was considered during synthesis, with findings from studies at high risk of bias interpreted cautiously.
3. Results
The search string returned 1,782 hits, of which 73 articles reached the final screening, i.e., full text screening. Figure 1 shows the quantity of papers removed from the review at each stage of the screening. Out of 1,782 records identified, 855 were excluded due to irrelevance or duplication during the initial screening. The title screening further narrowed down the pool to 350 articles, excluding studies not related to productivity or eye tracking. At the full-text screening stage, 277 articles were excluded, predominantly because their focus was outside the scope of reading productivity-related eye tracking metrics. Following completion of the screening process, 42 articles were deemed relevant for the study.
As shown in Figure 2, the majority of articles were published in the last five years. This trend aligns with advancements in machine learning techniques and the increased availability of affordable eye-tracking devices.
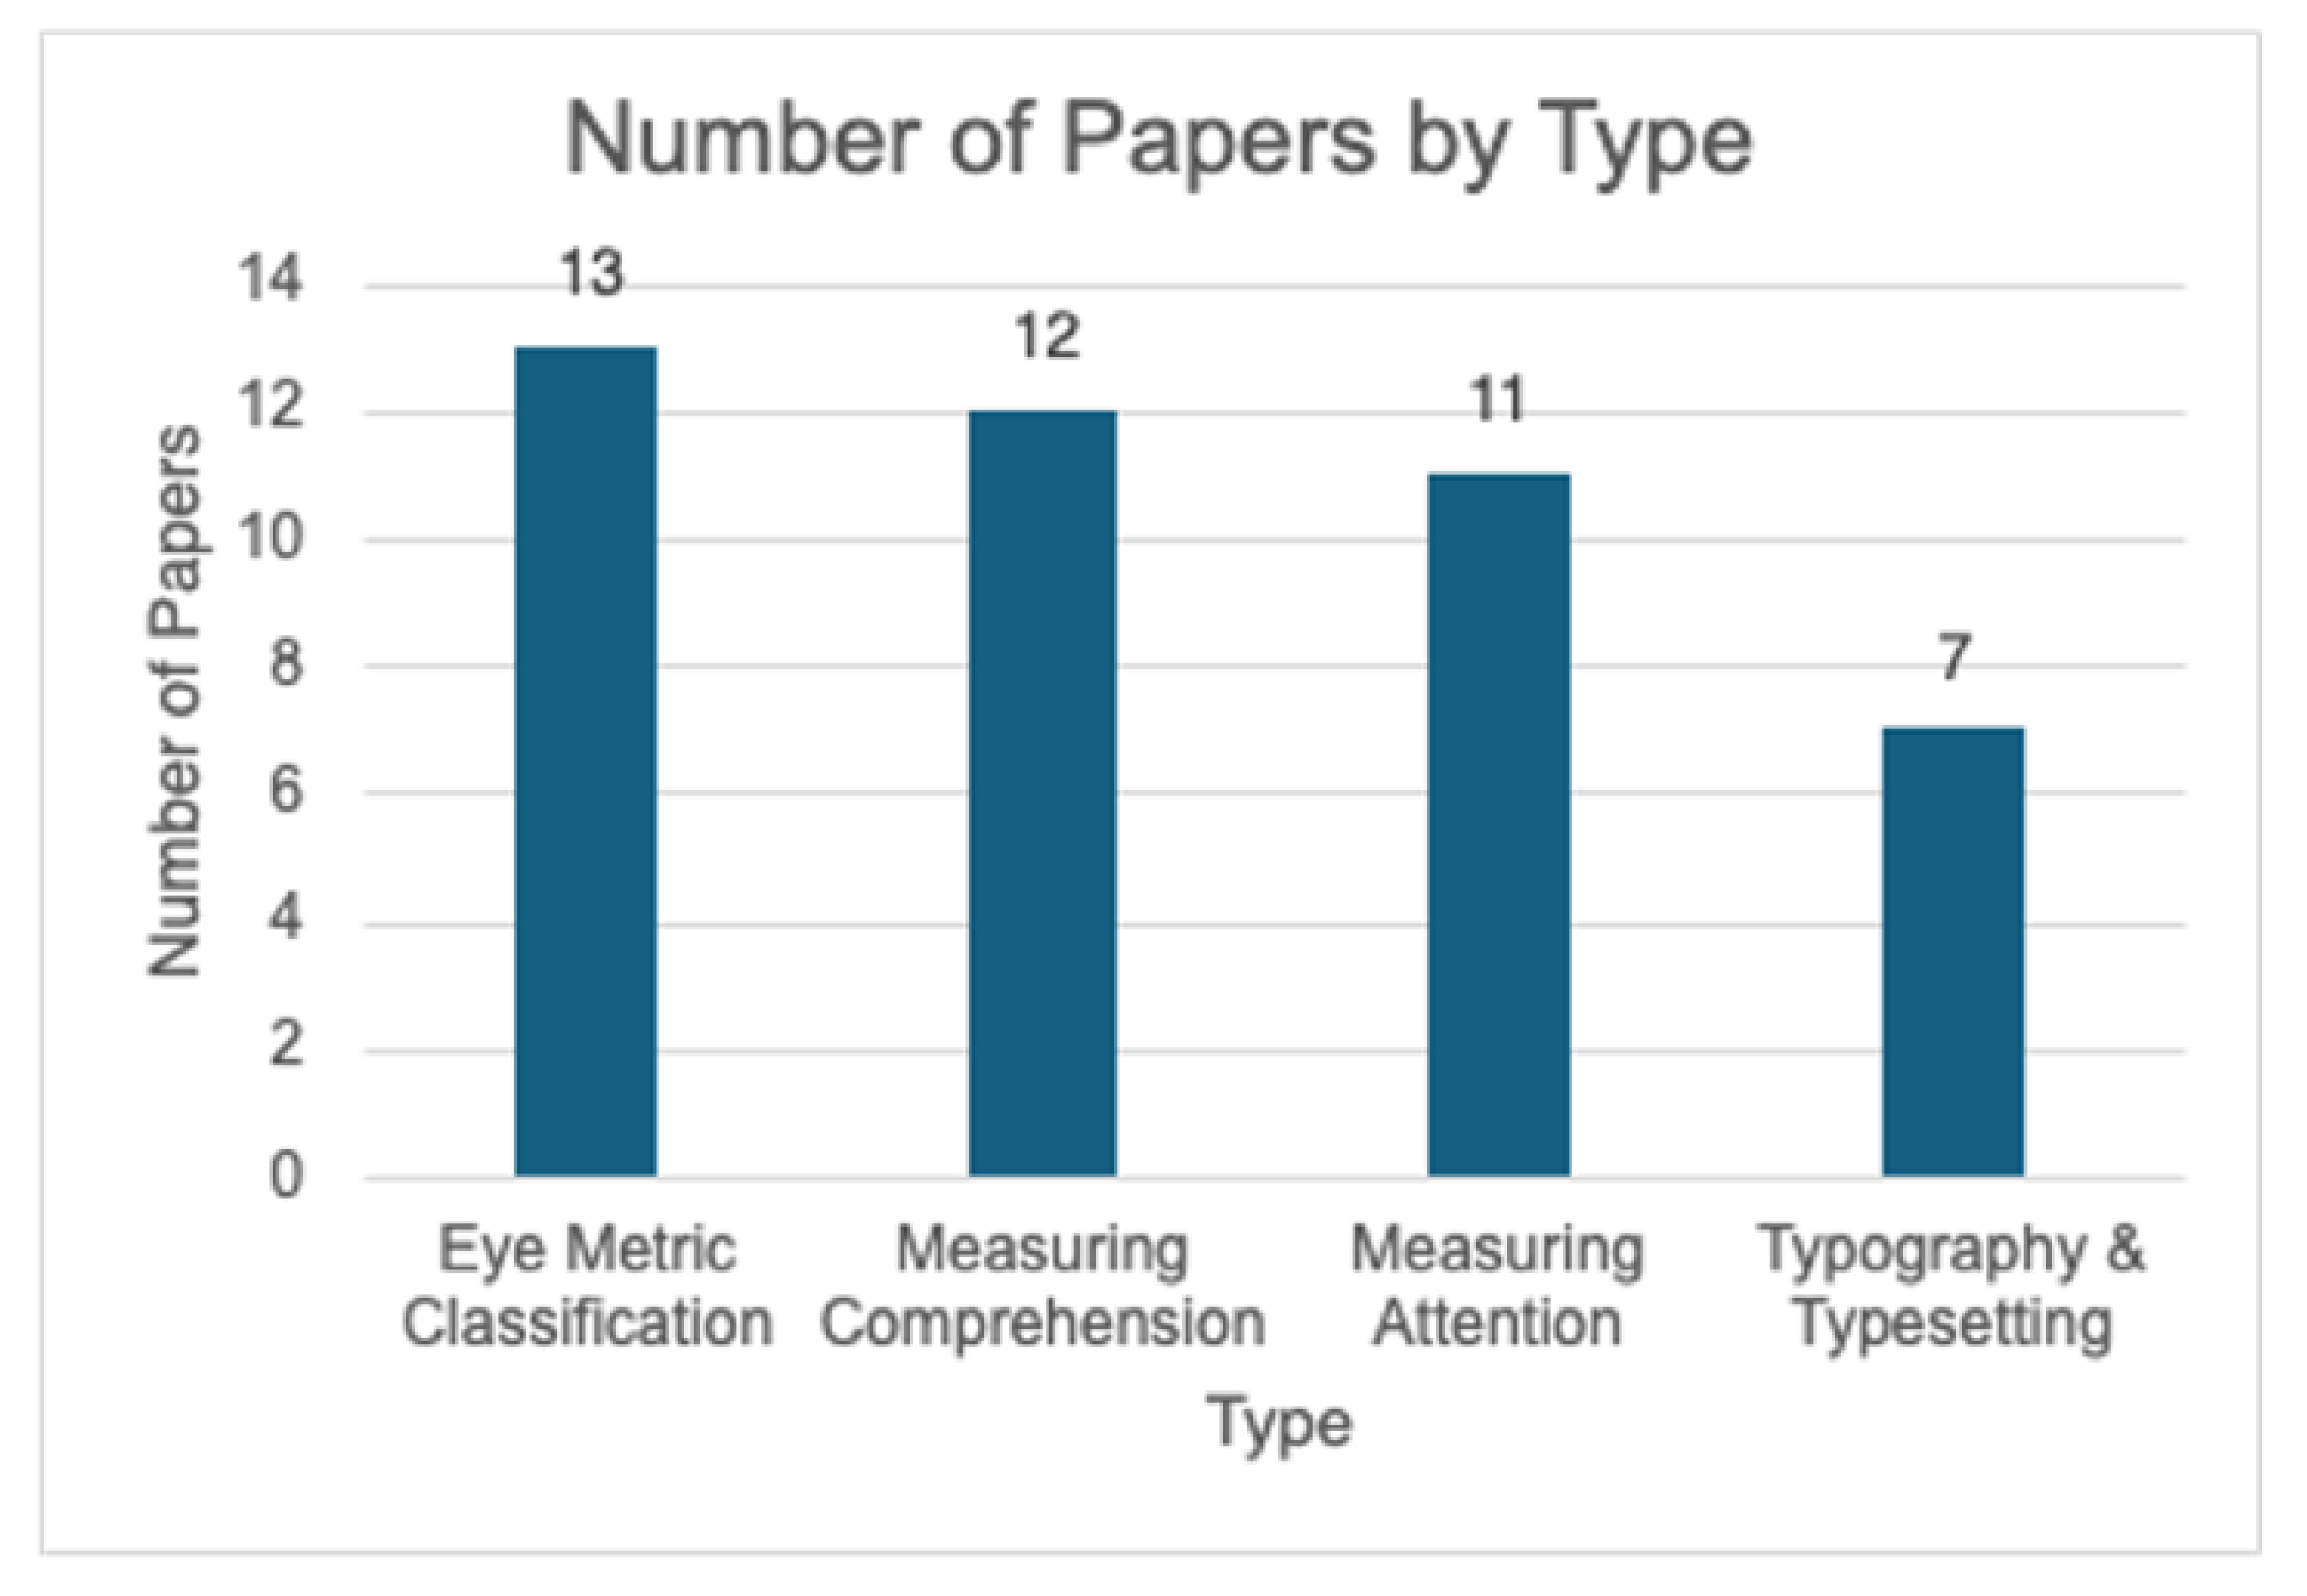
The articles were found to have four main themes: General Eye Metrics and Tracking, Measuring Comprehension, Measuring Attention, and Typography and Typsetting (Figure 3). Eye metric classification focuses on identifying patterns like fixations and saccades, while comprehension-related studies analyse reading performance. Articles on attention explore gaze fixation durations, and typography studies examine how text formatting affects readability. Overlap between categories, such as attention metrics influencing comprehension studies, highlights the interconnected nature of these themes.
3.1. Eye Metric Classification
This section reviews key studies focused on developing and validating methods for eye movement classification, highlighting the techniques used and their contribution to enhancing eye-tracking systems.
A review into eye tracking metrics in emotional and cognitive processes by Skaramagkas et al. noted eye and pupil movements hold strong correlation with cognitive workload, visual attention, and emotional states [6]. As no individual eye metric is sufficient to discriminate between individual states, a holistic analysis of several eye metrics is required through the use of real-time eye-trackers. Although several systems have been developed, the head-mounted approach has experienced the greatest adoption. In order to identify eye patterns, the most common method is the application of machine learning techniques.
The focus of several studies included in this review by Skaramagkas has been on extracting out several key metrics, namely fixations, saccades, microsaccades, smooth pursuit movement, pupil metrics, and blinks. Fixations involve maintaining gaze on a single location, with metrics like count, duration, and density indicating attention and interest. Saccades, rapid shifts between fixation points, are measured by amplitude, velocity, and frequency, reflecting visual exploration. Microsaccades, small retinal displacements during stationary viewing, counteract adaptation, have demonstrated constant duration and, as a result, velocity-amplitude correlations. Smooth pursuit movements enable tracking of moving objects, with their quality influenced by fatigue, distraction, and external factors. Pupil metrics, such as size and variation, reflect autonomic activity and are linked to emotional and cognitive arousal but are sensitive to lighting, age, and camera position affecting reliability - estimating pupil size in the ’normal’ state is a good approach to mitigate these effects. Finally, blinks are measured by rate and duration, influenced by environmental and cognitive factors. These metrics collectively enhance understanding of eye motion and its relation to cognitive states.
3.1.1. Classification of Eye Movements
Research by Popat et al. addresses the rising prevalence of Computer Vision Syndrom (CVS) through a deep learning model integrating a Convolutional Neural Network (CNN) and Long Short-Term Memory (LSTM) network for real-time blink detection [7]. The CNN identifies eye states (open or closed), while the LSTM captures temporal blink patterns from video streams. The model demonstrated high accuracy — 94.2% on non-RGB eye patch images and 91.4% on RGB facial images — showcasing its robustness across input types. This approach distinguishes itself by tailoring the CNN-LSTM model for live stream analysis, overcoming challenges such as computational inefficiency in prior methods.
Two studies demonstrate the effectiveness of hybrid 1D-CNN and BLSTM models for eye movement classification, achieving F1 scores of approximately 0.8 across datasets. The first study, trained on the GazeCom and Nyström-Andersson datasets, outperformed 12 state-of-the-art algorithms, particularly excelling in smooth pursuit detection through features like speed and acceleration across temporal scales [8]. The second study, targeting real-time classification for virtual workshops, showed improved accuracy, F1 scores, and Kappa coefficients over CNN-only and traditional methods [9], highlighting the robustness of hybrid models for eye movement analysis.
Several studies have focused on addressing the challenges of efficient and accurate eye-tracking on resource-constrained mobile devices, proposing hybrid approaches to balance computational efficiency and accuracy. One approach combines an SVM with Histogram of Oriented Gradients (HOG) features for region proposals and a lightweight LeNet-5 CNN for classification, enabling real-time blinking detection with a precision of 94.4% and a processing rate of 22 FPS on commodity smartphones [10]. Another study introduces GazeHFR, a biologically inspired framework that classifies eye movements into saccade and smooth pursuit phases by leveraging MobileNet [11]. The framework achieves a 7x improvement in efficiency and a 15% boost in accuracy compared to prior methods. Both approaches demonstrate the feasibility of lightweight, real-time models for mobile eye-tracking applications, even under the computational constraints of high-frame-rate mobile scenarios.
3.1.2. Eye Movement Patterns During Reading
Liao et al. (2017) used eye movement data to classify reading behaviours into five patterns: speed reading, slow reading, in-depth reading, skim-and-skip, and keyword spotting [12]. Using features including fixation duration, saccade length, and landing positions, an SVM classifier achieved high accuracy, particularly for keyword spotting (96.20%) and in-depth reading (93.75%). However, speed and slow reading were less precise due to overlapping behaviours. The inclusion of an “unknown” class improved classification reliability, demonstrating the potential of low-cost eye trackers for identifying reading styles. Despite its success, the study’s reliance on predefined behaviours in controlled settings limits its generalisability to real-world reading scenarios.
The studies by Hassan et al. [13] and Emoto et al. [14] highlight the potential of machine learning in eye movement analysis, with distinct but complementary approaches. Hassan et al. employ an LSTM-based model to classify reading behaviours into memory- and reasoning-based tasks, achieving high accuracies (95.39% and 94.5%) and demonstrating its value for cognitive research and AI-assisted healthcare. Emoto et al., on the other hand, introduce a lightweight CNN framework for real-time gaze estimation and eye-event detection, optimised for resource-constrained devices, offering scalability and efficiency without sacrificing accuracy.
Hohenstein et al. used linked linear mixed models (LMMs) to analyse how word properties, such as length, frequency, and predictability, impact fixation durations during reading [15]. Shorter, frequent, and predictable words reduced fixation durations, while durations peaked at word centres and were shorter at the boundaries of the word (IOVP effect). Skipping patterns showed skipped word properties affected subsequent fixation locations. Decomposing fixation location into predicted (psycholinguistic) and residual components revealed random oculomotor errors largely drive the IOVP effect, refining our understanding of cognitive and visual processes in reading.
Lin et al. introduce a low-cost, webcam-based eye-tracking system using deep learning and computer vision techniques to track eye movements, specifically pupil centre movement and eye corner positioning [16]. The system employs a coarse-to-fine approach with a Haar Cascade Classifier for face detection and a U-Net-based network for pupil localisation. A comparison with a commercial eye tracker (SMI RED250) revealed no significant difference in eye-movement-event switching accuracy (p<0.05), with a high correlation (Pearson coefficient = 0.707 ± 0.112). The system was applied in a Chinese reading test, demonstrating significant differences in reading performance between young, healthy older adults, and those with mild cognitive impairment, indicating its potential as an accessible and affordable tool for cognitive function assessment and eye-tracking research, particularly in low-cost settings.
Hofmann et al. demonstrated that probabilistic language models, such as n-grams and RNNs, outperform cloze completion probability (CCP) in predicting fixation durations during reading [17]. Language models accounted for a greater variance in metrics like gaze duration (GD) and single fixation duration (SFD), with n-grams excelling in syntactic predictions and RNNs capturing next-word preprocessing. In the Potsdam Sentence Corpus, for example, n-grams explained up to 8% of GD variance compared to CCP’s 3–4%. These findings highlight language models’ superiority in capturing cognitive processes during reading, especially when combining predictions across models.
3.1.3. Synthetic Eye Tracking Data Generation
The use of Generative Adversarial Networks (GANs) for generating synthetic eye-tracking data represents a significant advancement in addressing challenges associated with data scarcity in this field. Two studies, led by the same research group, introduced SP-EyeGAN, a framework designed to produce synthetic eye-tracking data that closely emulates real-world human gaze patterns [3]. This approach aims to mitigate the high costs and privacy concerns of collecting real eye-tracking data while providing an alternative for pre-training machine learning models.
SP-EyeGAN employs two distinct GANs: FixGAN, which focuses on generating micro-movements such as fixations, and SacGAN, which simulates macro-movements like saccades. While these networks share the same underlying architecture, they are trained separately to model distinct aspects of eye movements. The generated sequences incorporate key gaze features such as velocities and angles, allowing for the creation of data that statistically reflects human eye movement dynamics. The framework also incorporates a pipeline for pre-training neural networks using contrastive learning, where synthetic data serves as a foundation prior to fine-tuning models on smaller datasets of real labelled data for specific downstream tasks such as predicting reading comprehension or if it is the reader’s native language.
The results highlight the potential of SP-EyeGAN to enhance model performance in reading-related domains, such as comprehension and text difficulty assessment, where the synthetic data-driven approach has achieved state-of-the-art results. However, its impact is less significant in biometric contexts, including applications such as identity verification, ADHD detection, and gender classification, where synthetic data showed limited success [18]. Given the focus of this systematic review on reading applications, the success of SP-EyeGAN in these areas is particularly notable, demonstrating its ability to simulate the intricate gaze behaviours involved in text processing.
3.2. Measuring Comprehension
3.2.1. Multiple Choice Questions
One common method for measuring comprehension involves displaying text to participants, followed by multiple-choice questions. For example, the role of task-conditioned gaze behaviour in comprehension was explored in a study by Malmaud et al., which utilised the EyeLink 1000 Plus eye tracker to analyse the eye movements of 269 participants reading passages from the OneStop QA dataset [19]. The study found that pre-questioning enhanced focus on task-relevant content, suggesting that comprehension is closely linked to focused attention. By combining eye-tracking metrics with a RoBERTa machine learning model, the study aimed to bridge human and machine reading comprehension, using multiple-choice questions and reading time as key measures of comprehension.
Research by Ariasi et al. provided insights into the role of refutation text in reading comprehension [20]. Using the Tobii T120 eye tracker, the study evaluated 40 university students reading scientific texts in Italian. The experiment compared standard (non-refutation) and refutation formats across four passages, examining eye movement metrics such as first-pass progressive fixation time, forward fixations, reinspection time, and look-back fixation time. Readers of refutation texts showed better comprehension (mean score 5.33 vs. 4.35, p = 0.018)) and faster initial processing (first-pass fixation: 1.23 ms/character vs. 1.48 ms/character, p = 0.011) than those reading non-refutation texts. Refutation texts also prompted more integrative rereading (look-back fixation: 2.48 ms/character vs. 2.12 ms/character , p = 0.029).
Hijazi et al. investigated the prediction of comprehension difficulty using a combination of eye-tracking and machine learning techniques [2]. Employing the Tobii 5L desktop eye tracker, the study analysed gaze behavior, reading time, and revisit frequency to assess comprehension performance. Participants read English text paragraphs of varying difficulty levels, and comprehension was evaluated using multiple-choice questions. Logistic regression achieved 72% accuracy in predicting comprehension difficulty, with additional analysis performed using Linear Discriminant Analysis, highlighting the effectiveness of eye-tracking data in identifying comprehension challenges.
A study by Wallot et al. (2015) also investigated the relationship between eye movements and text comprehension during reading [21]. Results demonstrated that difficult texts led to longer fixation durations (202 ms vs. 220 ms, p = 0.003) and stronger power-law scaling for fixations (0.55 vs. 0.58, p = 0.008) and slower gaze step sizes (0.01 vs. 0.02, p = 0.025). Notably, power-law scaling at slower time scales emerged as a significant predictor of comprehension (p = 0.013), outperforming traditional metrics such as fixation count and regressions. These findings suggest that cognitive coordination, captured through power-law scaling, plays a critical role in comprehension during complex reading tasks, highlighting its potential as a superior measure compared to standard eye-tracking metrics.
Similarly, Lenhart et al. focused on classifying workload levels using microsaccades measured by the Tobii Pro Spectrum eye tracker [22]. Although the primary aim was workload classification, the study incorporated comprehension quizzes to establish a baseline for reading performance. SVMs were utilised to evaluate microsaccade patterns and their relation to cognitive effort during reading tasks. The findings indicated no statistically significant differences in reading comprehension related to workload levels, yet the inclusion of comprehension assessments added depth to the analysis.
The relationship between eye movements and comprehension was further explored by Babanova et al., who investigated the correlation between consumer-grade eye-tracking data and comprehension performance [23]. Using an iPad Pro for eye tracking, the study found that less-frequent, longer fixations and saccades were associated with better comprehension. Participants who answered all comprehension questions correctly exhibited shorter mean fixation durations (274 ms) compared to those with no correct answers (318 ms), with differences statistically significant (p<0.05). A linear mixed-effects model further confirmed that fixation duration negatively correlated with comprehension (p<0.001), while faster reading speed positively influenced performance (p<0.001).
The study by Southwell et al. extended this work by assessing comprehension 30 minutes after reading a lengthy 6,500-word text, as well as shorter 1,000-word texts [24]. Across three studies involving 381 participants, the results indicated that shorter, more frequent fixations correlated with higher comprehension. Regression models using eye-tracking data achieved significant correlations between predicted and observed comprehension scores, ranging from r=0.362 to r=0.384 (p<0.001), demonstrating robust predictive accuracy across different text lengths and contexts.
Finally, Ahn et al. explored the predictive capability of deep learning models in reading comprehension using eye-tracking data [25]. The study examined overall and passage-level comprehension, perceived reading difficulty, and first language through a CNN model (using features including fixation location, fixation duration, and pupil size) that achieved 65% accuracy in predicting overall comprehension, outperforming the null model by 11%. Although the CNN model generalised well across passages, its accuracy diminished when applied to new readers. An RNN model used in the same study demonstrated lower accuracy compared to the CNN. Data was collected from 95 undergraduate students who read four published SAT passages followed by corresponding multiple-choice SAT questions and self-evaluation questionnaires.
3.2.2. Behavioural metrics derived from eye movements
In addition to multiple-choice questions, behavioural metrics from eye movements have been used to predict comprehension using advanced machine learning techniques. For example, Fan et al. employed a Siamese convolutional neural network (SCNN) to predict reading comprehension levels based on cognitive patterns observed during reading [26]. The study, which used fixation count heatmaps captured by a Tobii Pro Spectrum eye tracker, successfully predicted participants’ English proficiency based on their performance on the CET-6 exam. The SCNN model proved effective with both ‘‘trained from scratch” and ‘‘pretrained with fine-tuning” strategies.
Rivu et al. [27] demonstrated that using ensemble methods significantly improved the accuracy of identifying problematic text during questionnaire completion. For sentence-level prediction, combining features such as the number of regressions and fixation duration per letter achieved an accuracy of up to 74% when using J48 classifiers with bagging. For word-level analysis, SVM with boosting achieved an accuracy of 76%, with the number of fixations and regressions being the most predictive features. These results highlight that integrating weaker features like pupil dilation with strong predictors can further enhance classification performance.
Cho et al. explored the use of time-frequency representations of eye blinks to investigate task difficulty during mental arithmetic tasks [28]. It found that blink entropy, a novel metric derived from time-frequency representations of eye-blink patterns, was significantly correlated with both perceived task difficulty (Spearman’s r = -0.341, p = 0.012) and correct answer rates during challenging tasks (r = 0.437, p = 0.07). Moreover, the use of LSTM models trained on blink spectrograms yielded higher classification accuracy for task difficulty (77.8%) compared to traditional blink metrics such as blink rate or duration, demonstrating the potential of advanced eye-blink analysis for cognitive state monitoring.
Southwell et al. demonstrated that gaze-based predictive models can assess deep reading comprehension with significant accuracy [29]. Using linear regression (LR) and random forest (RF) models, they found moderate correlations between predicted and human-scored self-explanation (SE) scores: r = 0.322 (Study 1) and r = 0.354 (Study 2) where p < 0.001 for both. Eye-tracking metrics such as fixation duration, saccade distance, and regressions significantly contributed to these predictions. The SE model also predicted delayed post-test comprehension, particularly inference-level comprehension after one week, with correlations up to r = 0.35. These findings suggest gaze metrics can reliably differentiate deep from shallow comprehension, offering generalisable insights into reading behaviour across participants. However, this study was ranked low quality in the MMAT as it was unclear if the data was representative of the target population, confounders were not accounted for, and there was not complete outcome data.
A study by Kaakinen et al. used both postural and eye movement recordings to measure changes in cognitive engagement while reading text [30]. Two eye metrics, total fixation time and individual fixation duration, were extracted by the eye tracking system, while a motion capture system was used to record head movements. Participants were informed about specific topics that parts of the texts they read would refer to. Memory recall was tested for both task-relevant and task-irrelevant text. Task-relevant text had longer total fixation time and better memory recall. Total fixation time and distance-from-screen both strongly correlated with memory performance. As participants get ‘into the flow of reading’, fixations tend to get shorter. It should be noted that individual fixation duration, does not reduce for task-relevant text over time.
3.3. Measuring Attention
The review by Skaramagkas et al. highlighted key eye metrics for identifying emotional and cognitive processes, particularly visual attention and cognitive workload [6]. Visual attention enables individuals to focus on relevant details while ignoring distractions, while cognitive workload reflects the mental effort required for tasks, influenced by task complexity, presentation style, and processing effort. The review analysed 21 studies and 14 datasets to identify top eye metrics and machine learning techniques for classifying cognitive workload.
Fixation frequency and duration strongly indicate visual attention, with longer fixations linked to focused target observation. Blink rate decreases as attention increases, while pupil size, number of fixations, and saccadic velocity positively correlate with rising mental workload. SVMs achieved the highest classification accuracy for cognitive workload using eye metrics alone, with an average accuracy of 78.64%. Incorporating biosignals such as heart rate further improved accuracy to 87.55%, highlighting the benefits of combining additional data sources.
3.3.1. Machine Learning Methods
A study by Chakraborty et al. uses a human-robot interaction system to extract head movement and eye features, then estimate the attention level of the user during three different tasks - reading, writing and browsing [31]. Visual Focus of Attention (VFOA) is categorised into: high, low, average, and no attention. These are classified based on how long the participant’s attention was on their work. Video capture was performed with a Raspberry Pi camera and a further external USB camera. HOG based feature detection is implemented using the dlib library. Four artificial neural networks (ANNs) and an RNN-LSTM are used for classification, all of which were trained with validation accuracies greater than 96% and area under the curve greater than 99%.
Bixler and D’Mello developed deep learning models to detect and predict mind-wandering (MW) during reading, achieving an F1 score of 0.45, a 29% improvement over chance (F1 = 0.35) [32]. The models used gaze features such as fixation duration, saccade length, and regressions, segmented into temporal windows. Global gaze features (aggregated metrics) outperformed local features (word-specific metrics) for MW detection. Significant differences between MW and non-MW instances were observed for features such as saccade proportion and fixation duration kurtosis (Cohen’s d ranging from -0.28 to -0.39, p<0.05). These results highlight the decoupling of eye movements from salient content during MW and the potential for gaze-based detection of attentional lapses in educational settings.
Bafna et al. investigated the relationship between eye metrics, cognitive load, and fatigue using data from a Tobii Eye Tracker 4C [33]. Participants read and memorised sentences of varying difficulty (Leipzig corpus) and reported fatigue levels on a seven-point Likert scale before and after sessions. A Hidden Markov Model was employed to label saccades, fixations, and noise, and Random Forest Regression was the best-performing model for mapping eye metrics and task performance data (e.g., typing speed, error rate) onto cognitive load and fatigue. Key features included blink frequency, eye height, task difficulty, and baseline pupil diameter, with blink frequency showing the strongest correlation to fatigue (r = 0.184, p = 0.012), although fatigue correlations were generally weak. Cognitive load predictions showed better accuracy, outperforming Monte Carlo baselines.
Sood et al. investigated the relationship between performance and attention in humans and neural models during question-answering tasks [34]. Attention similarity, measured via Kullback-Leibler (KL) divergence, showed significant correlations with task performance for LSTMs (r=-0.73, p<0.001) and CNNs (r=-0.72, p<0.001), where greater alignment with human visual attention improved accuracy. In contrast, XLNet achieved high accuracy (91%) but showed weak correlation (r = -0.16, p = 0.381), indicating performance was independent of attention similarity. This highlights the value of human-aligned attention in some models, but not all architectures.
Eye movement data has been used with a Random Forest (RF) algorithm to classify thought patterns across nine dimensions, particularly focusing on task relevance—whether attention remains on-task or shifts off-task [35]. Using Particle Swarm Optimisation (PSO), the top ten eye features linked to task relevance were identified, including fixation duration and saccade metrics (counts, durations, and velocity). The RF model demonstrated that off-task thoughts correlated with increased fixation counts and longer median fixation durations compared to on-task thoughts, reflecting attentional shifts during complex tasks.
A related study introduced the Cognitive Load and Eye Analysis Region (CLERA) model, which employs CNNs to classify cognitive load tasks based on blink detection and pupil position, achieving an accuracy of 66.58% [36]. By comparison, the RF model, which excluded blink data, achieved up to 96% accuracy in classifying attention levels. These findings suggest that blink metrics alone are less reliable indicators of attention changes, whereas combining multiple eye features, as done in the RF model, provides a more robust framework for analysing cognitive and attentional states.
A geometric modelling approach was employed to track eye gaze movements relative to screen position, classifying users as attentive or inattentive based on whether their gaze fell within defined screen boundaries [37]. The model utilised Haar Cascade algorithms for eye frame extraction and centroid detection for pupil tracking. While achieving an accuracy of 76.66%, the system faced significant environmental limitations, such as sensitivity to light variations. As a result, threshold values required frequent adjustment to maintain accuracy. Despite its potential for monitoring attention, the system’s effectiveness remains unverified, as no user testing was conducted to validate its ability to differentiate attention levels.
3.3.2. Statistical Methods
Wilcoxon rank-sum tests showed that attentive readers outperformed inattentive readers in fact-finding tasks, with higher effectiveness as measured by Mann–Whitney U tests (mean (M) = 0.93 vs. M = 0.33, p = 0.015) and greater efficiency, demonstrated by shorter fixation durations (M = 105,319 ms vs. M = 226,529 ms, p = 0.012) and fewer fixations (M = 274 vs. M = 619, p = 0.018) [38]. Both groups focused on the question area, using a question-oriented strategy, but attentive readers allocated resources more effectively. In content-understanding tasks, attentive readers adapted to a navigation-assistant strategy, with significantly lower fixation proportions on the question area (FDPQN: M = 0.60 vs. M = 2.95, p = 0.002), while inattentive readers maintained a question-oriented approach. The inattentive group occasionally succeeded through “win by uncertainty,” relying on clues, guessing, or domain knowledge rather than task-related information. These findings emphasise the role of adaptive strategies in improving cognitive resource allocation and task performance.
3.4. Typography and Typesetting
3.4.1. Font
A study by Ren et al. examined the impact of intelligent typesetting on enhancing attention and comprehension in Chinese text reading, leveraging font size, brightness, and hue adjustments to emphasise word importance [39]. Using the TextRank algorithm, key terms were highlighted based on their relevance. Eye-tracking metrics showed that larger font sizes, darker brightness, and warmer hues improved attention, while reading performance tests revealed that brightness-based typography yielded the highest accuracy (57.4%), outperforming standard typesetting (38.9%). Additionally, subjective evaluations confirmed improved readability, reduced fatigue, and greater visual appeal for these intelligent typesetting approaches.
Similarly, another study examined the impact of text capitalisation on reading performance among Chinese learners, comparing all-capitalised text, text with initial capital letters, and standard text formatting [40]. The study included 46 college students from Nanjing University of Science and Technology, comprising 21 English majors and 22 non-English majors. The comprehension accuracy rates were 92.31% for English majors and 94.87% for non-English majors. The findings revealed that all-capitalised text significantly increased both fixation count and fixation duration compared to normal text. For all-initial-capital text, sentences containing six or more capitalised words led to a marked increase in fixation duration () and Regressive Saccade Count (). These results indicate that while comprehension accuracy remained high across all typography types, capitalised formats imposed a significantly greater cognitive effort on participants.
Another study by Schotter et al. highlighted the limitation of word identification to 8 characters for both deaf and hearing readers (42 and 60 participants, respectively) [41]. Beyond this limit, reading rates plateaued, and fixation durations ceased to decrease. This underscores the importance of using clear, legible fonts to enhance word recognition within this character boundary.
3.4.2. Text Spacing
Studies on visual crowding and word spacing highlighted the importance of optimal text spacing for improving reading efficiency. Critical spacing, which reduces clutter and ensures clear visual separation between text elements, significantly enhances reading performance by enabling better word identification and reducing distractions. However, overly tight spacing increases fixation durations, hindering efficiency, while spacing beyond an optimal threshold provides no additional benefits [42]. Similarly, masking between words disrupts saccade planning, resulting in shorter saccades and slower reading rates (p<0.001). In the study by Schotter et al., readers showed a 21.57 words-per-minute improvement when moving from a 6-character to a 10-character window with clearer spacing [41]. Ideal line lengths of 50–70 characters (10–14 words) align with the natural perceptual span, minimising unnecessary eye movements and optimising reading speed.
3.4.3. Perceptual Span in Reading
The perceptual span, traditionally thought to extend 14–15 characters rightward and 3–4 characters leftward of fixation, has been re-evaluated in a study involving 36 native English speakers aged 18–25 with normal or corrected vision [43]. Using 80 sentences displayed in Courier font per session, the study applied systematic letter manipulations up to four words left of fixation, replacing letters with visually similar or dissimilar alternatives (e.g., “f” → “t” vs. “f” → “g”). Results showed that the perceptual span extends further left than previously assumed, encompassing up to two words ( 11 characters) left of fixation. Reading times increased by 1042.68 ms (n-1) and 188.97 ms (n-2), fixation durations lengthened by 13.83 ms (n-1) and 3.93 ms (n-2), and fixations rose by 2.89 (n-1) and 0.52 (n-2), while comprehension accuracy remained above 96%. These findings highlight the influence of typography on reading fluency and challenge existing models like E-Z Reader and SWIFT to account for expanded leftward perceptual spans.
Supporting these conclusions, the study by Schotter et al. found that the perceptual span extends 10–14 characters to the right of fixation, with word identification limited to 8 characters for both 60 hearing and 42 deaf readers [41]. Deaf readers demonstrated significantly faster reading rates (320.54 words-per-minute (WPM)) than hearing readers (253.71 WPM, p<0.001), emphasising the importance of optimising visual spans for readability.
Another study explored how shifting word characters left or right affects fixation duration and gaze direction [44]. The results revealed a tendency to skim the latter half of words after reading the initial portion. Similarly, context integration studies showed that antecedents in text increased go-past times at sentence-initial nouns (t(5,749)=2.20,p=0.3), while spillover words were read faster (t(5,729)=-3.96,p<0.01), reflecting smoother integration. Typographical cues like bold or italicised antecedents improved accessibility and reduced initial reading times by making key elements more visually salient [45].
In another study, pupil dilation was measured while reading at varying speeds using RSVP (Rapid Serial Visual Presentation), where words are displayed sequentially on a screen [46]. Grey backgrounds produced linear increases in pupil dilation as text speed rose, indicating no specific background effect on workload. However, a linear relationship between pupil dilation and perceived workload was only distinguishable at speeds between 200 and 450 WPM. The study, conducted using VR headsets, is limited by participant unfamiliarity with RSVP and potential differences in measurement accuracy across eye-tracking devices.
4. Discussion
4.1. General Interpretation of the Results
The findings of this review align with and extend prior evidence on the efficacy of eye-tracking metrics and computational techniques for understanding reading behaviour, cognitive workload, and attention.
A key theme identified is the growing reliance on machine learning models to classify and interpret eye metrics such as fixations, saccades, and blinks. Studies using hybrid models, like CNN-LSTM combinations, consistently demonstrated superior accuracy compared to traditional methods, with reported accuracies as high as 94.2% for blink detection and outperforming for classification of eye movement types (e.g., fixations, saccades) across multiple datasets [8,9,10,11]. These findings corroborate earlier research emphasising the importance of model architecture and dataset quality in achieving reliable classifications of eye movements.
The review also underscores the utility of synthetic eye-tracking data in addressing data scarcity, with frameworks such as SP-EyeGAN showing significant promise in pretraining machine learning models [3,18]. This innovation aligns with broader trends in data augmentation across machine learning domains and offers a scalable solution for enhancing performance in eye-tracking applications, especially in reading.
Regarding reading comprehension, eye-tracking metrics provide valuable insights into cognitive processes. Fixation duration, saccade length, and regression patterns were commonly linked to reading efficiency and comprehension. For instance, multiple studies demonstrated that refutation texts improve comprehension by encouraging rereading [20], while machine learning models successfully classified reading behaviours (e.g., speed reading, in-depth reading). However, reliance on controlled experimental conditions limits the generalisability of these findings to real-world reading contexts.
In the context of attention, eye-tracking metrics such as fixation count, duration, and saccadic velocity were strongly linked to visual attention and mental workload. For instance, decreasing blink rates were consistently associated with increased focus on specific targets. Frequent saccades relates to constant mind wandering and diminishing attention span. Machine learning models, particularly SVMs, achieved classification accuracies of approximately 79% using eye metrics alone, which increased to 88% when biosignals such as heart rate were included [6]. However, many studies relied on context-specific datasets, which limits the generalisability of these findings to reading tasks.
The review also examined the impact of typography on attention and comprehension. Key findings highlight that intelligent typesetting, such as bolding and italicising task-relevant text, facilitates regression patterns that reduce cognitive load and improve integration of new and prior information [39]. Conversely, fully capitalised text disrupts reading fluency by increasing fixation counts and saccades. A main finding includes placing emphasis on important words in a sentence results to better memory. Additionally, optimal text spacing was shown to enhance reading efficiency, with diminishing returns observed when spacing exceeded a critical threshold [42].
Lastly, the review draws attention to the challenges of adapting mobile eye-tracking systems for reading tasks. While advancements in lightweight models and hardware have improved accessibility, studies point to limitations in accuracy and the influence of external factors, such as lighting and head movement [6]. These findings suggest a need for further refinement of mobile systems to expand their applicability in diverse environments.
In summary, this systematic review contributes to the growing body of evidence demonstrating the interplay between eye-tracking metrics, machine learning methods, and reading behaviour. It confirms the utility of advanced computational approaches in enhancing the accuracy and applicability of eye-tracking technologies and highlights key directions for future research, such as addressing limitations in mobile systems and improving synthetic data generation frameworks.
4.2. Limitations of the Evidence
General eye metrics and tracking face several challenges, including variability in how fixations, saccades, and blinks are measured, as well as reliance on small, context-specific datasets that limit generalisability to real-world applications. Environmental factors such as lighting and camera positioning, along with individual differences like age and fatigue, also compromise reliability. In machine learning methods, biases in participant demographics and dataset composition, along with risks of overfitting, hinder generalisation. Many studies lack robust cross-validation, further weakening the reliability of reported accuracy metrics.
Reading comprehension studies often rely on predefined reading tasks and behaviours, which fail to capture natural variability in reading strategies. Subjective labelling, such as self-reported comprehension, introduces bias, while differences in reading ability and language proficiency among participants add variability to outcomes. Typography research frequently focuses on non-Latin scripts or artificial layouts that lack everyday applicability, with limited participant diversity and narrow exploration of text formatting or highlighting techniques.
Synthetic eye-tracking data, while useful in some contexts, often struggles to replicate real-world variability, especially for biometric applications like ADHD detection. Validation of synthetic data models against large-scale real-world datasets is also insufficient, limiting their broader applicability. Mobile eye-tracking systems face environmental sensitivities, hardware limitations, and a narrow focus on basic metrics, with limited exploration of complex dynamics like pupil dilation or saccade velocity. These combined challenges highlight the need for more standardisation, diverse datasets, and robust methodologies across eye-tracking research.
4.3. Limitations of the Review Processes
The review faced limitations in its search and inclusion criteria, relying solely on the Scopus database, which may have excluded relevant studies from other sources. Non-English studies were omitted, potentially overlooking valuable evidence, and older studies that could provide historical context or foundational methodologies were excluded due to a focus on recent research. The screening process involved subjective interpretation of relevance criteria, although bias was mitigated by involving multiple reviewers and resolving discrepancies through a third reviewer.
Data extraction was complicated by variability in study designs, including differences in experimental setups, participant populations, and metrics, making consistent synthesis of findings challenging. Quality assessments using the MMAT were performed by a single reviewer for consistency and efficiency, but this approach may have introduced bias despite strict adherence to guidelines and consultation with other reviewers for clarification.
Additionally, transparency in methods was limited by the absence of formal assessments of reporting bias and the certainty of evidence. This omission means the potential impact of selective outcome reporting remains unknown, and the confidence in the overall findings has not been systematically evaluated, affecting the interpretation and reliability of results.
4.4. Practice, Policy, and Future Research
4.4.1. Practice
This review highlights opportunities for advancing eye-tracking applications in reading. Integrating advanced machine learning models, like CNN-LSTM architectures, into commercial eye-tracking software can enhance real-time analysis of reading behaviours, benefiting education, workplace productivity, and healthcare.
The adoption of synthetic eye-tracking data frameworks, such as SP-EyeGAN, offers a cost-effective way to pretrain machine learning models, reducing reliance on time-intensive data collection while expanding accessibility.
Mobile eye-tracking systems also present opportunities for improvement. Developing lightweight algorithms and adaptable hardware can enhance accuracy in resource-constrained environments, such as classrooms and workplaces, by mitigating environmental challenges like lighting variations and head movement.
4.4.2. Policy
The review highlights the need for policies to standardise eye-tracking metrics like fixations, saccades, and pupil dynamics, ensuring consistency across research and commercial applications. Ethical data collection practices, including addressing dataset bias and implementing robust security measures, are essential to enhance trust and credibility.
Policies should also focus on accessibility by supporting the development of low-cost, portable eye-tracking systems for underfunded educational and clinical settings. Encouraging open-source datasets can foster collaboration and innovation, reducing barriers for smaller research groups and organisations.
4.4.3. Future Research
Expanding eye-tracking research to natural, uncontrolled environments is crucial for understanding real-world reading, comprehension, and attention processes, addressing the limitations of controlled settings. Including diverse demographics beyond university students is essential to capture broader variations in age, language, and cultural backgrounds.
Research on synthetic data should prioritise enhancing realism by incorporating behavioural and environmental variability, such as blinking, pupil dilation, and eye redness. Tailoring synthetic data for specific contexts, like reading or mobile devices, and validating models against large-scale, real-world datasets will ensure reliability and practical application, addressing data scarcity challenges.
Typography’s role in comprehension and attention requires further study, particularly intelligent features like bolding and spacing across multilingual scripts. Integrating NLP to identify key words could enhance memory retention and productivity. Greater focus on diverse user needs, including individuals with dyslexia or ADHD, is needed, as these groups may exhibit unique eye movement patterns that current models fail to accommodate.
Finally, exploring cognitive workload, attention, and typography in dynamic contexts, such as digital media and adaptive learning systems, could inform text layouts that optimise reading efficiency and comprehension across various environments.
Author Contributions
Conceptualization, L.A., S.A., B.H., M.N., A.S., W.A. and Z.L.; methodology, D.P., W.S.; software, L.A.; validation, L.A., S.A., B.H. and D.P.; formal analysis, L.A., S.A., B.H., M.N., A.S., W.A. and Z.L.; investigation, L.A., S.A., B.H., M.N., A.S., W.A. and Z.L.; resources, L.A., S.A., B.H., M.N., A.S., W.A. and Z.L.; data curation, L.A.; writing—original draft preparation, L.A., S.A., B.H., M.N., A.S., W.A. and Z.L.; writing—review and editing, L.A., S.A., B.H., W.S. and D.P.; visualization, L.A.; supervision, D.P. and W.S.; project administration, D.P.; funding acquisition, D.P. All authors have read and agreed to the published version of the manuscript.
Funding
Wanzi Su received support from UKRI Innovate UK grant (grant number 10031483).
Informed Consent Statement
Not applicable.
Data Availability Statement
The datasets used and/or analysed during the current study are available in the supplementary materials or from the corresponding author on reasonable request.
Acknowledgments
None.
Conflicts of Interest
None.
References
- Kaur K, Gurnani B, Nayak S, Deori N, Kaur S, Jethani J, et al. Digital Eye Strain: A Comprehensive Review. Ophthalmology and Therapy. 2022;11(5):1655–80. [CrossRef]
- Hijazi H, Gomes M, Castelhano J, Castelo-Branco M, Praça I, de Carvalho P, Madeira H. Dynamically predicting comprehension difficulties through physiological data and intelligent wearables. Scientific Reports. 2024;14(1). [CrossRef]
- Prasse P, Reich DR, Makowski S, Ahn S, Scheffer T, Jäger LA. SP-EyeGAN: Generating Synthetic Eye Movement Data with Generative Adversarial Networks. Zurich Open Repository and Archive (University of Zurich). 2023 May. [CrossRef]
- Page MJ, McKenzie JE, Bossuyt PM, Boutron I, Hoffmann TC, Mulrow CD, et al. The PRISMA 2020 statement: an updated guideline for reporting systematic reviews. BMJ. 2021;372:n71. [CrossRef]
- Hong QN, Fàbregues S, Bartlett G, Boardman F, Cargo M, Dagenais P, et al. The Mixed Methods Appraisal Tool (MMAT) version 2018 for information professionals and researchers. Educ Inf. 2018;34(4):285-91. [CrossRef]
- Skaramagkas V, Giannakakis G, Ktistakis E, Manousos D, Karatzanis I, Tachos N, Tripoliti E, Marias K, Fotiadis DI, Tsiknakis M. Review of Eye Tracking Metrics Involved in Emotional and Cognitive Processes. IEEE Rev Biomed Eng. 2023;16:260-77. Epub 2023 Jan 5. [CrossRef] [PubMed]
- Popat M, Goyal D, Raj V, Jayabalan N, Hota C. Eye movement tracking for computer vision syndrome using deep learning techniques. In: 2024 International Conference on Artificial Intelligence in Information and Communication (ICAIIC). 2024. p. 317-322. [CrossRef]
- Startsev M, Agtzidis I, Dorr M. 1D CNN with BLSTM for automated classification of fixations, saccades, and smooth pursuits. Behav Res Methods. 2019 Apr;51(2):556-72. [CrossRef] [PubMed]
- Hybrid model of eye movement behavior recognition for virtual workshop. ResearchGate. 2020. [CrossRef]
- Han Y-J, Kim W, Park J-S. Efficient eye-blinking detection on smartphones: A hybrid approach based on deep learning. Mobile Information Systems. 2018;2018:6929762. [CrossRef]
- Chang Y, He C, Zhao Y, Lu T, Gu N. A High-Frame-Rate Eye-Tracking Framework for Mobile Devices. IEEE Access. 2021 May. [CrossRef]
- Liao W-H, Chang C-W, Wu Y-C. Classification of reading patterns based on gaze information. In: 2017 IEEE International Symposium on Multimedia (ISM); 2017. p. 595-600. [CrossRef]
- Hassan A, Fan W, Hu X, Wang W, Li H. LSTM-based eye-movement trajectory analysis for reading behavior classification. SPIE. 2022 Apr;12247:73–73. [CrossRef]
- Emoto J, Hirata Y. Lightweight convolutional neural network for image processing method for gaze estimation and eye movement event detection. IPSJ Transactions on Bioinformatics. 2020;13(0):7–15. [CrossRef]
- Hohenstein S, Matuschek H, Kliegl R. Linked linear mixed models: A joint analysis of fixation locations and fixation durations in natural reading. Psychon Bull Rev. 2017 Jun;24(3):637–651. [CrossRef] [PubMed] [PubMed Central]
- Lin Z, Liu Y, Wang H, Liu Z, Cai S, Zheng Z, Zhou Y, Zhang X. An eye tracker based on webcam and its preliminary application evaluation in Chinese reading tests. Biomed Signal Process Control. 2022 Feb;74:103521. [CrossRef]
- Hofmann MJ, Remus S, Biemann C, Radach R, Kuchinke L. Language models explain word reading times better than empirical predictability. Front Artif Intell. 2022 Feb;4. [CrossRef]
- Prasse P, Reich DR, Makowski S, Scheffer T, Jäger LA. Improving cognitive-state analysis from eye gaze with synthetic eye-movement data. Computers & Graphics. 2024 Mar;119:103901. [CrossRef]
- Malmaud J, Levy R, Berzak Y. Bridging information-seeking human gaze and machine reading comprehension. In: Proceedings of the 24th Conference on Computational Natural Language Learning. Online; 2020. p. 142-152. [CrossRef]
- Ariasi N, Hyönä J, Kaakinen JK, Mason L. An eye-movement analysis of the refutation effect in reading science text. Journal of Computer Assisted Learning. 2017;33(3):202-221. [CrossRef]
- Wallot S, O’Brien B, Coey C, Kelty-Stephen D. Power-law fluctuations in eye movements predict text comprehension during connected text reading. Cognitive Science Society. Annual Conference. Proceedings (Online). 2015;2583-2588.
- Lenhart P, Thaqi E, Castner N, Kasneci E. Old or Modern? A computational model for classifying poem comprehension using microsaccades. In: Proceedings of the 2023 Symposium on Eye Tracking Research and Applications (ETRA ’23); 2023. p. 49. [CrossRef]
- Babanova K, Revazov A, Chernozatonskiy K, Pikunov A, Anisimov V. An application of eye movement parameters collected from mass market devices for the estimation of a text comprehension. Journal of Eye Movement Research. 2023;16(2). [CrossRef]
- Southwell R, Gregg J, Bixler R, D’Mello SK. What eye movements reveal about later comprehension of long connected texts. Cognitive Science. 2020;44(10):e12905. [CrossRef]
- Ahn S, Kelton C, Balasubramanian A, Zelinsky G. Towards predicting reading comprehension from gaze behavior. In: Proceedings of the ACM Symposium on Eye Tracking Research and Applications. 2020. p. 32. [CrossRef]
- Fan K, Cao J, Meng Z, Zhu J, Ma H, Ng AC, Ng T, Qian W, Qi S. Predicting the reader’s English level from reading fixation patterns using the Siamese convolutional neural network. IEEE Transactions on Neural Systems and Rehabilitation Engineering. 2022;30:1071–1080. [CrossRef]
- Rivu R, Abdrabou Y, Abdelrahman Y, Pfeuffer K, Kern D, Neuert C, Buschek D, Alt F. Did you understand this? Leveraging gaze behavior to assess questionnaire comprehension. In: Proceedings of the ACM Symposium on Eye Tracking Research and Applications (ETRA ’21 Short Papers). ACM; 2021. [CrossRef]
- Cho, Y. Rethinking eye-blink: Assessing task difficulty through physiological representation of spontaneous blinking. In: Proceedings of the 2021 CHI Conference on Human Factors in Computing Systems (CHI ’21). ACM; 2021. [CrossRef]
- Southwell R, Mills C, Caruso M, D’Mello SK. Gaze-based predictive models of deep reading comprehension. User Modeling and User-Adapted Interaction. 2023;33(3):687–725. [CrossRef]
- Kaakinen JK, Ballenghein U, Tissier G, Baccino T. Fluctuation in cognitive engagement during reading: Evidence from concurrent recordings of postural and eye movements. J Exp Psychol Learn Mem Cogn. 2018 Oct;44(10):1671-7. Epub 2018 Feb 1. [CrossRef] [PubMed]
- Chakraborty P, Ahmed S, Yousuf MA, Azad AKM, Alyami SA, Moni MA. A Human-Robot Interaction System Calculating Visual Focus of Human’s Attention Level. IEEE Access. 2021;9:93409-21. [CrossRef]
- Bixler R, D’Mello S. Automatic Gaze-Based Detection of Mind Wandering with Metacognitive Awareness. In: Ricci F, Bontcheva K, Conlan O, Lawless S, editors. User Modeling, Adaptation and Personalization. UMAP 2015. Lecture Notes in Computer Science, vol 9146. Springer, Cham; 2015. [CrossRef]
- Bafna T, Bækgaard P, Hansen JP. Mental fatigue prediction during eye-typing. PLoS One. 2021 Feb 22;16(2):e0246739. [CrossRef]
- Sood E, Tannert S, Frassinelli D, Bulling A, Vu NT. Interpreting attention models with human visual attention in machine reading comprehension. Proceedings of the 24th Conference on Computational Natural Language Learning. 2020;12–25. [CrossRef]
- Rahnuma T, Jothiraj SN, Kuvar V, Faber M, Knight RT, Kam JWY. Gaze-based detection of thoughts across naturalistic tasks using a PSO-optimized random forest algorithm. Bioengineering. 2024;11(8):760. [CrossRef]
- Ding L, Terwilliger J, Parab A, Wang M, Fridman L, Mehler B, Reimer B. CLERA: A unified model for joint cognitive load and eye region analysis in the wild. ACM Trans Comput Hum Interact. 2023 Dec;30(6):84. [CrossRef]
- Shilaskar S, Bhatlawande S, Gadad T, Ghulaxe S, Gaikwad R. Student eye gaze tracking and attention analysis system using computer vision. In:2023 7th International Conference on Computing Methodologies and Communication (ICCMC); 2023. p. 889-95. [CrossRef]
- Chen J, Zhang L, Qian W. Cognitive differences between readers attentive and inattentive to task-related information: an eye-tracking study. Aslib J Inf Manag. 2023;75(5):917-39. [CrossRef]
- Ren H, Yan T, Chen X, Lyu R, Liu Y. Intelligent Chinese typesetting model based on information importance can enhance text readability. Int J Hum Comput Interact. 2024;1-20. [CrossRef]
- Wei Y, Fu X. Effects of English capitals on reading performance of Chinese learners: Evidence from eye tracking. In: 2019 International Conference on Asian Language Processing (IALP); 2019. p. 108-14. [CrossRef]
- Schotter ER, Stringer C, Saunders E, Cooley FG, Sinclair G, Emmorey K. The role of perceptual and word identification spans in reading efficiency: Evidence from hearing and deaf readers. J Exp Psychol Gen. 2024 Oct;153(10):2359-77. [CrossRef]
- Chiu T, Drieghe D. The role of visual crowding in eye movements during reading: Effects of text spacing. Attention, Perception, and Psychophysics. 2023;85(8):2834-58. [CrossRef]
- Jordan TR, McGowan VA, Kurtev S, Paterson KB. A further look at postview effects in reading: An eye-movements study of influences from the left of fixation. J Exp Psychol Learn Mem Cogn. 2016 Feb;42(2):296-307. [CrossRef]
- Bicknell K, Levy R, Rayner K. Ongoing cognitive processing influences precise eye-movement targets in reading. Psychological Science. 2020;31(4):351-62. [CrossRef]
- Norberg KA, Perfetti C, Helder A. Word-to-text integration and antecedent accessibility: Eye-tracking evidence extends results of ERPs. Journal of Experimental Psychology: Learning, Memory, and Cognition. 2022 Apr;48(4):598-617. [CrossRef]
- Grootjen JW, Thalhammer P, Kosch T. Your eyes on speed: using pupil dilation to adaptively select speed-reading parameters in virtual reality. Proc ACM Hum Comput Interact. 2024 Sep;8(MHCI):284. [CrossRef]
Figure 1.
PRISMA flow diagram. *based on date and language criteria.
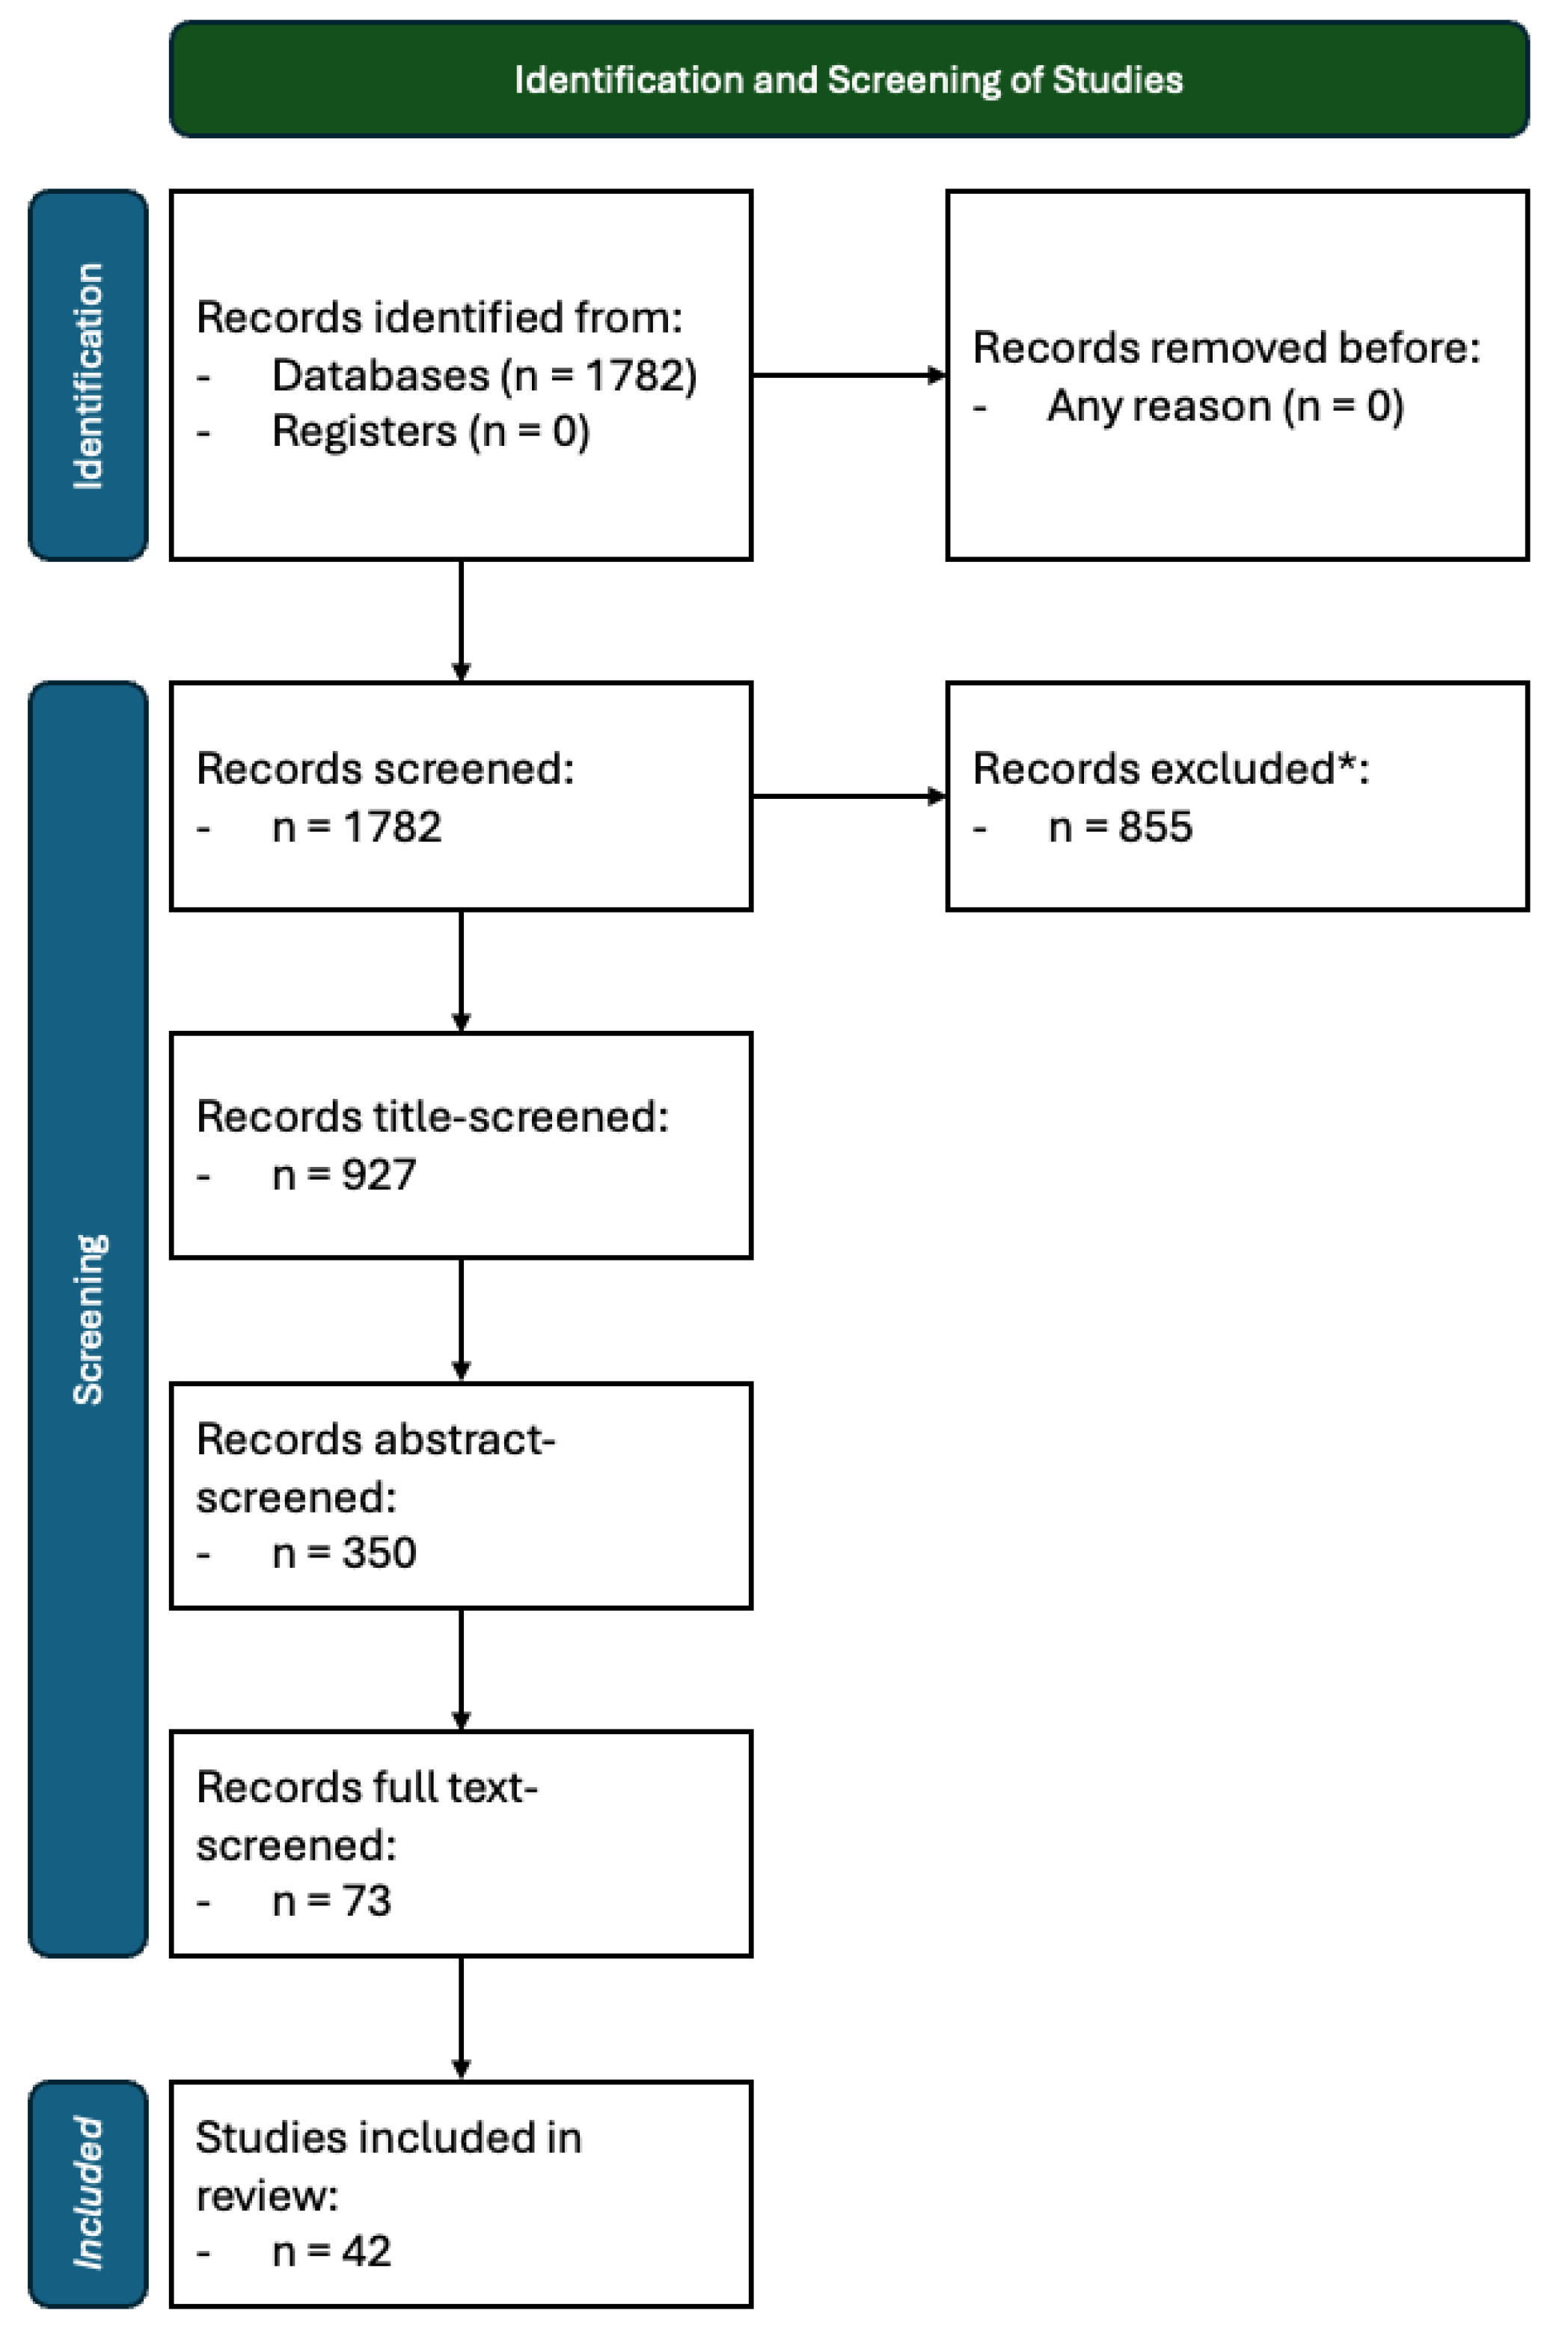
Figure 2.
Number of papers published by Year.
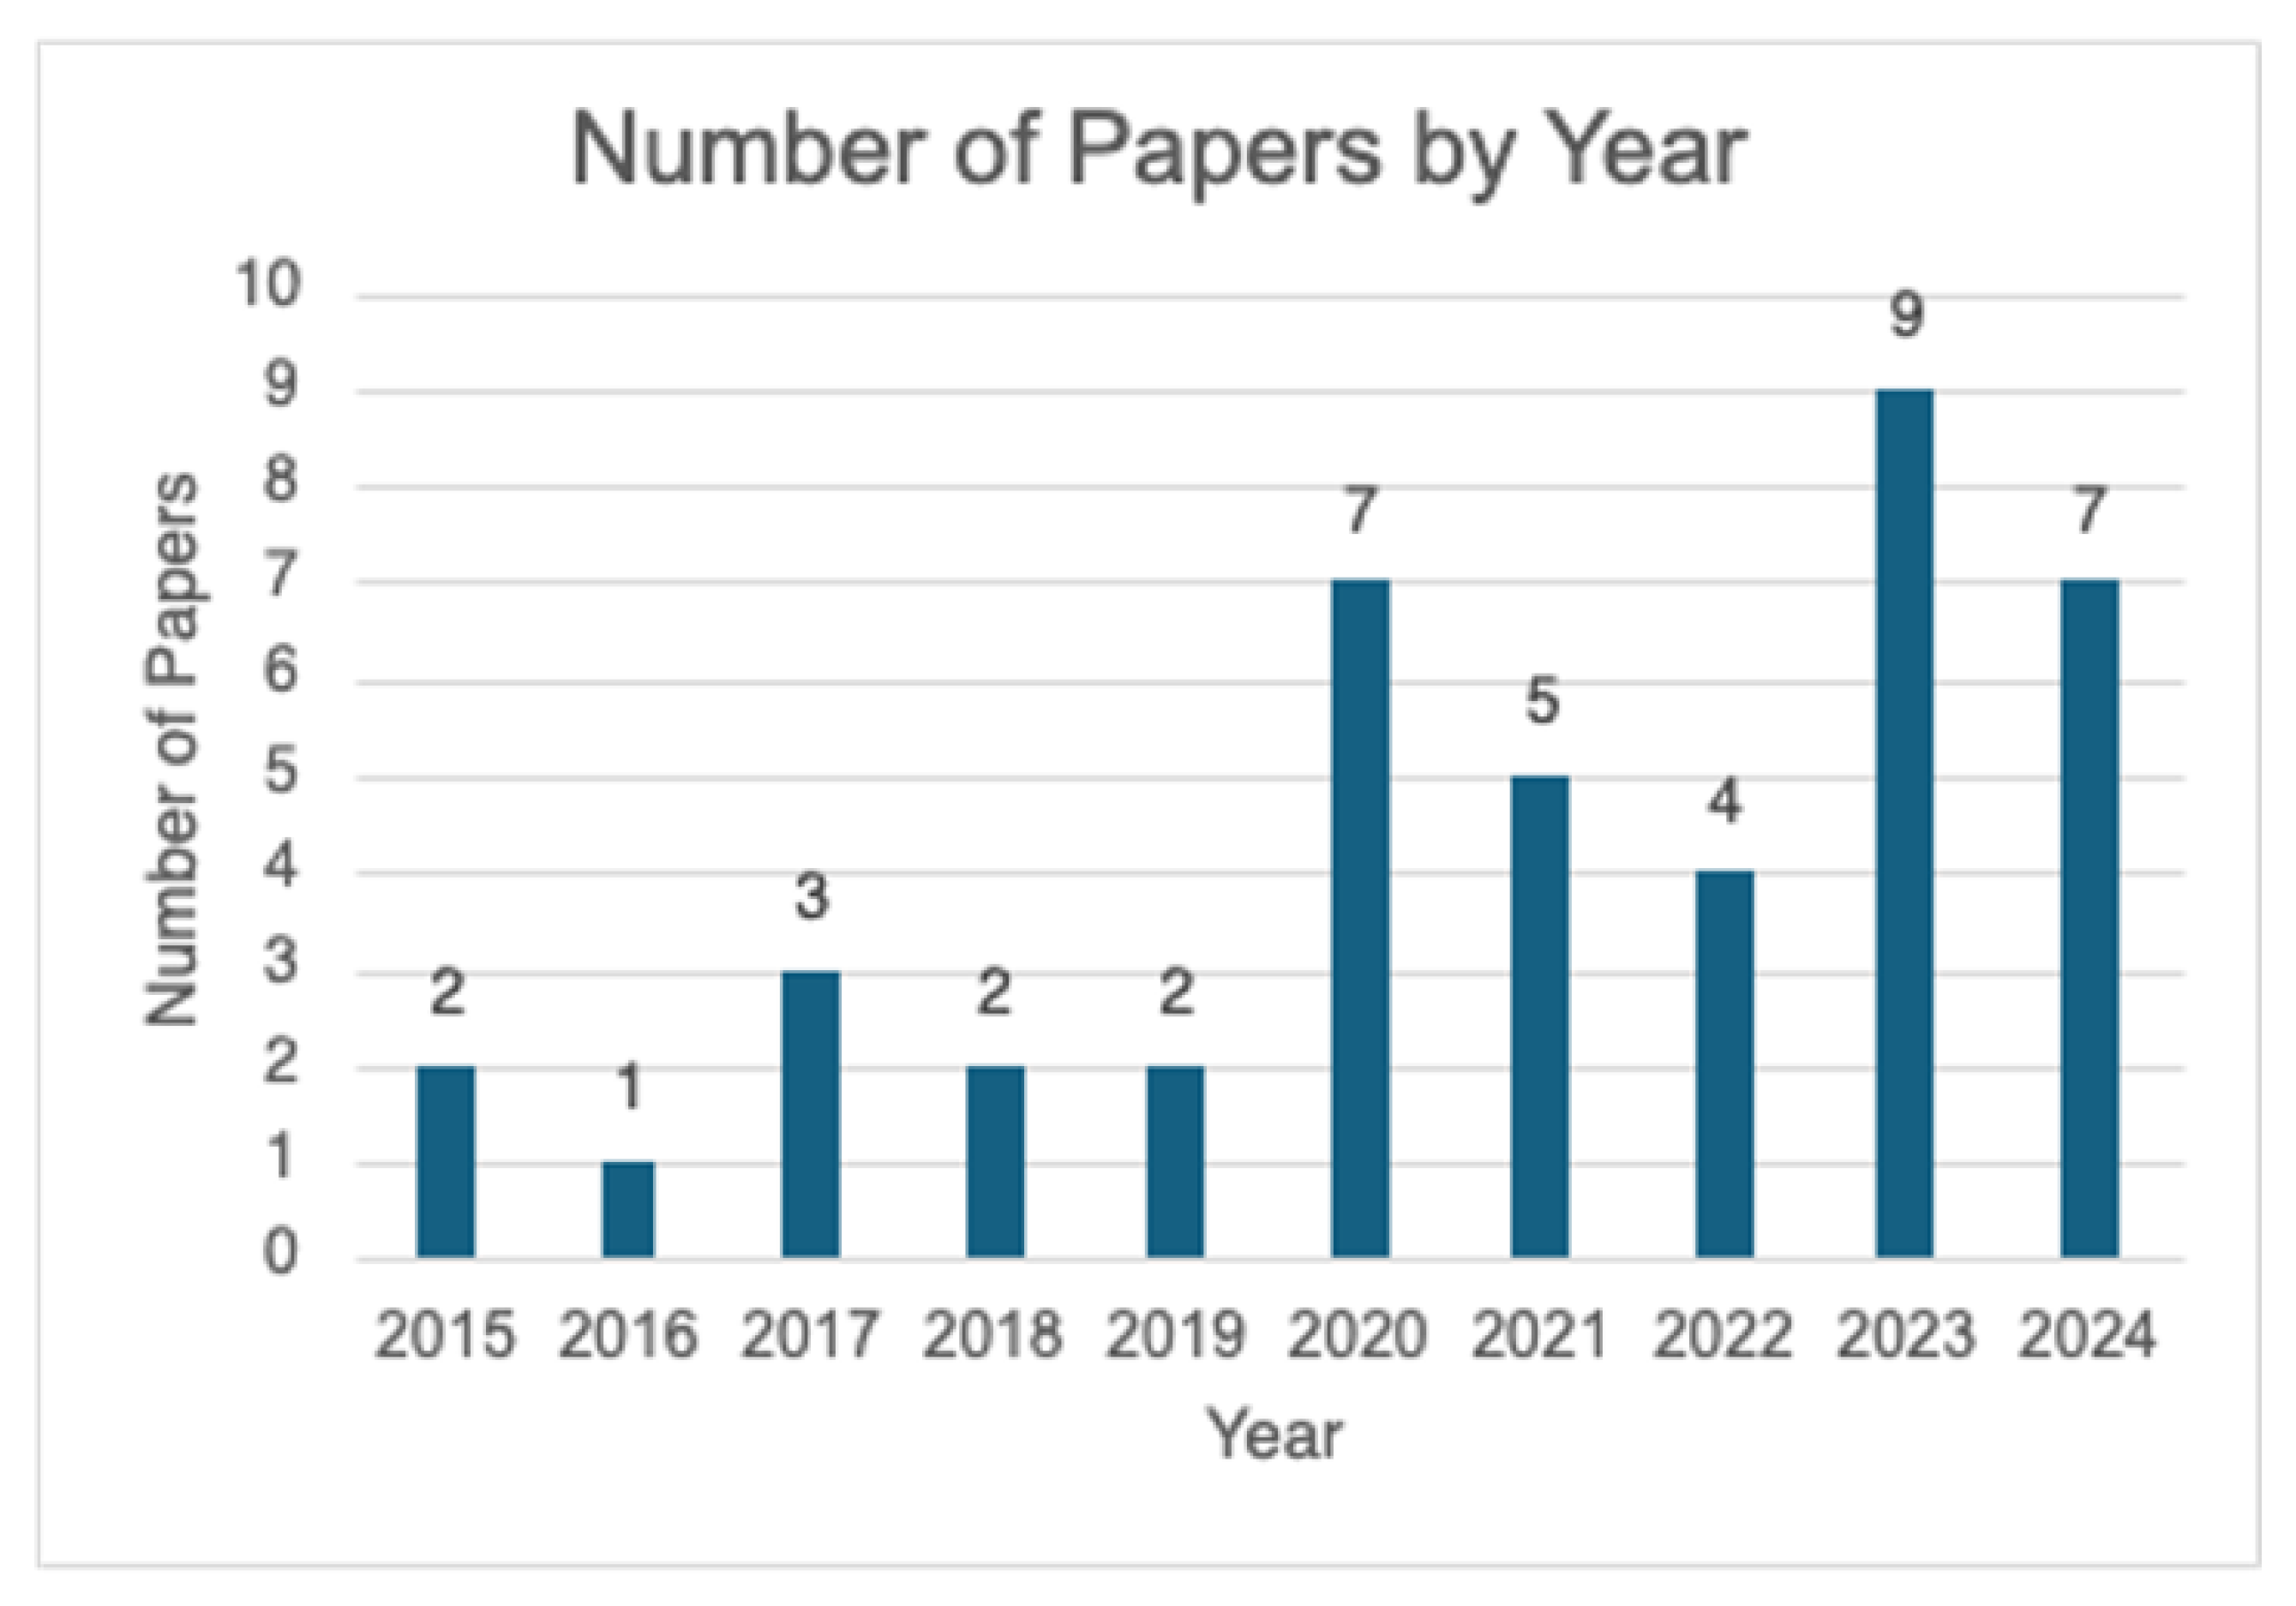
Figure 3.
Number of papers published by Type.
Disclaimer/Publisher’s Note: The statements, opinions and data contained in all publications are solely those of the individual author(s) and contributor(s) and not of MDPI and/or the editor(s). MDPI and/or the editor(s) disclaim responsibility for any injury to people or property resulting from any ideas, methods, instructions or products referred to in the content. |
© 2025 by the authors. Licensee MDPI, Basel, Switzerland. This article is an open access article distributed under the terms and conditions of the Creative Commons Attribution (CC BY) license (http://creativecommons.org/licenses/by/4.0/).
Copyright: This open access article is published under a Creative Commons CC BY 4.0 license, which permit the free download, distribution, and reuse, provided that the author and preprint are cited in any reuse.


