Submitted:
10 February 2025
Posted:
13 February 2025
Read the latest preprint version here
Abstract
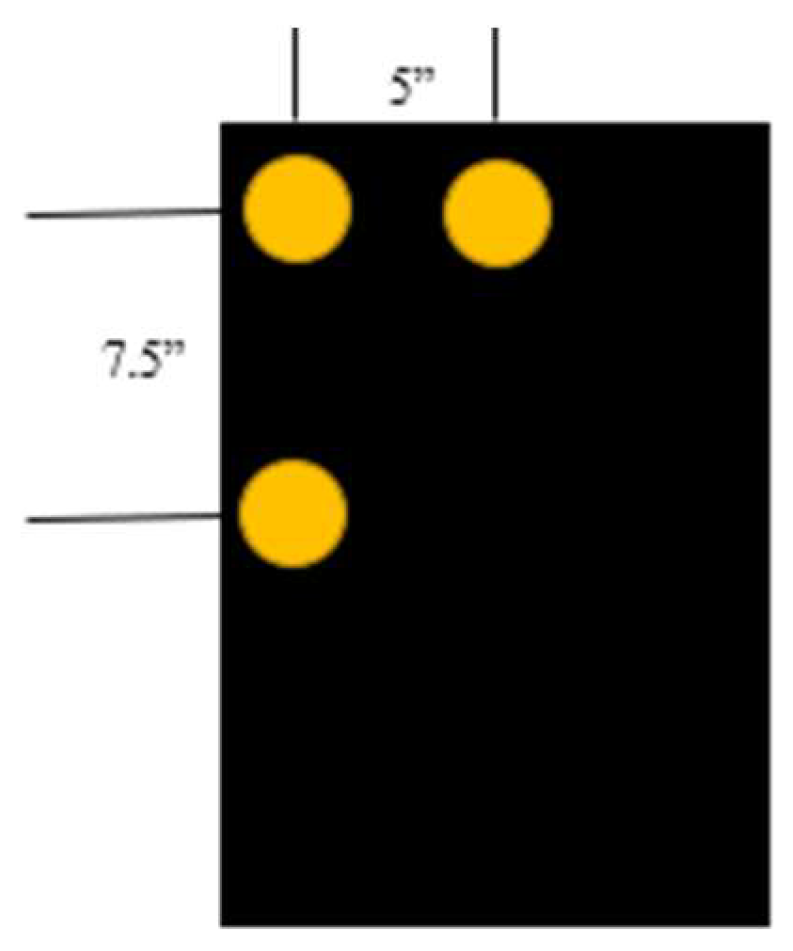
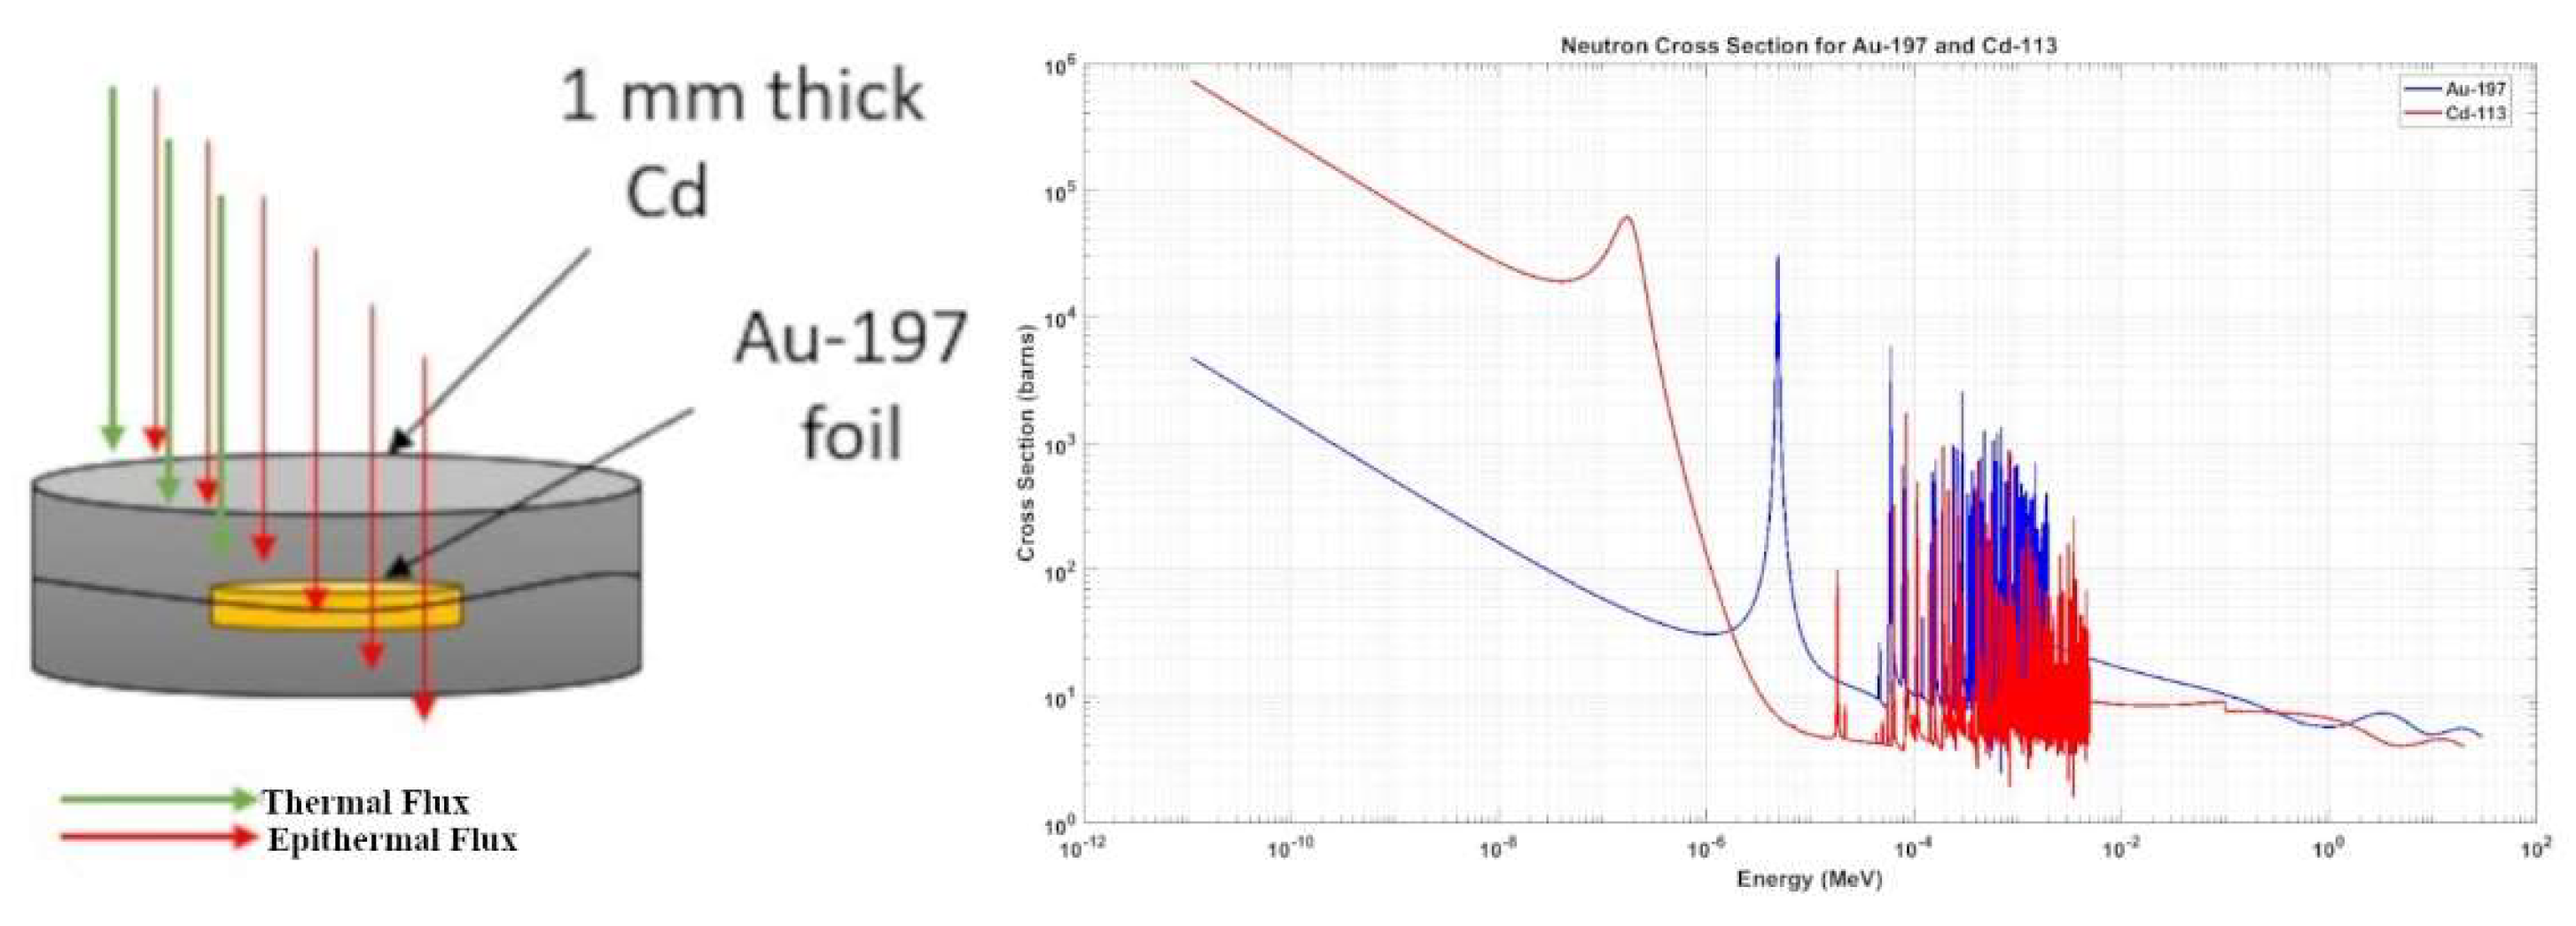
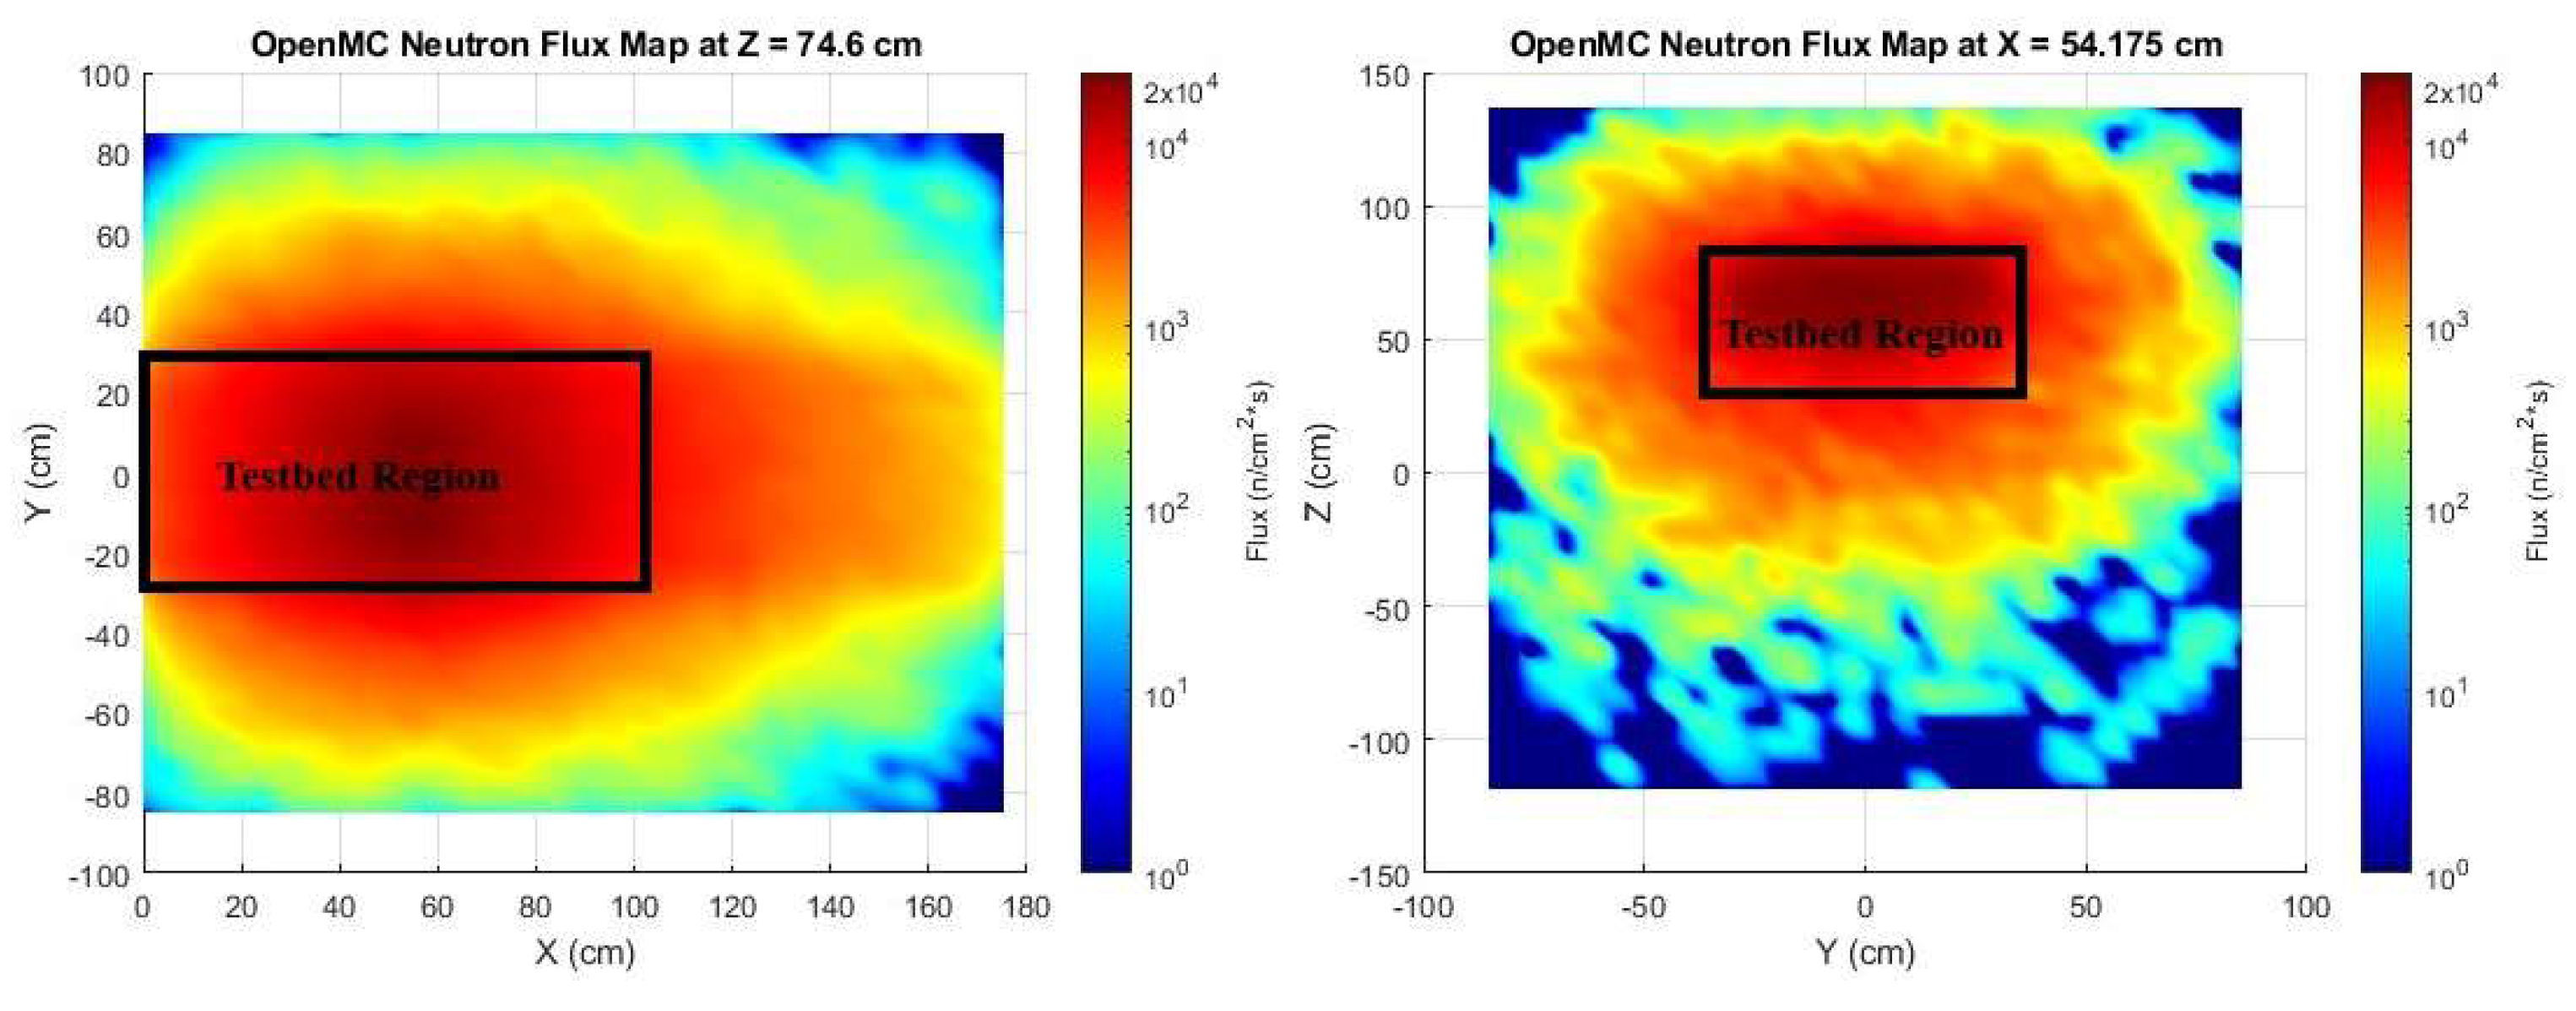
First demonstrated in 1942, subcritical and zero-power critical assemblies, also known as piles, are a fundamental tool for research and education at universities. Traditionally, their role has been primarily instructional and for measuring fundamental properties of neutron diffusion and transport. However, these assemblies could hold potential for modern applications and nuclear research. The Purdue University subcritical pile previously lacked a substantial testing volume, limiting its utility to simple neutron activation experiments for the purpose of undergraduate education. Following the design and addition of a mechanical and electrical testbed, this paper aims to provide an overview of the testbed design and characterize its neutron and gamma flux of the rearranged Purdue subcritical pile, justifying its use as a modern scientific instrument. The newly installed 1.5*10^5 cubic-centimeter volume testbed enables a systematic investigation of neutron and gamma effects on materials and the generation of a comprehensive dataset with the potential for machine learning applications. The neutron flux throughout the pile is calculated using gold-197 and indium-115 foil activation alongside cadmium-covered foils for two-group neutron energy classification. The neutron flux measurements are then used to benchmark a detailed geometrically and materialistic accurate Monte-Carlo model using OpenMC. The experimental measurements reveal the testbed has a neutron environment with a total neutron flux approaching 8.5*10^3 n/cm^2*s and a thermal flux of 5.8*10^3 n/cm^2*s, following the expected diffusion theory behavior. This work establishes the modified Purdue subcritical pile can provide significant neutron and gamma fluxes and a uniquely large volume to enable radiation testing of integral electronic components and as a versatile research instrument with the potential to support microelectronics testing, limited isotope production, and non-destructive imaging while generating valuable training datasets for machine learning algorithms in nuclear applications.
[M1]Reference citation is not allowed. Please revise.
Keywords:
1. Introduction
2. Literature Review
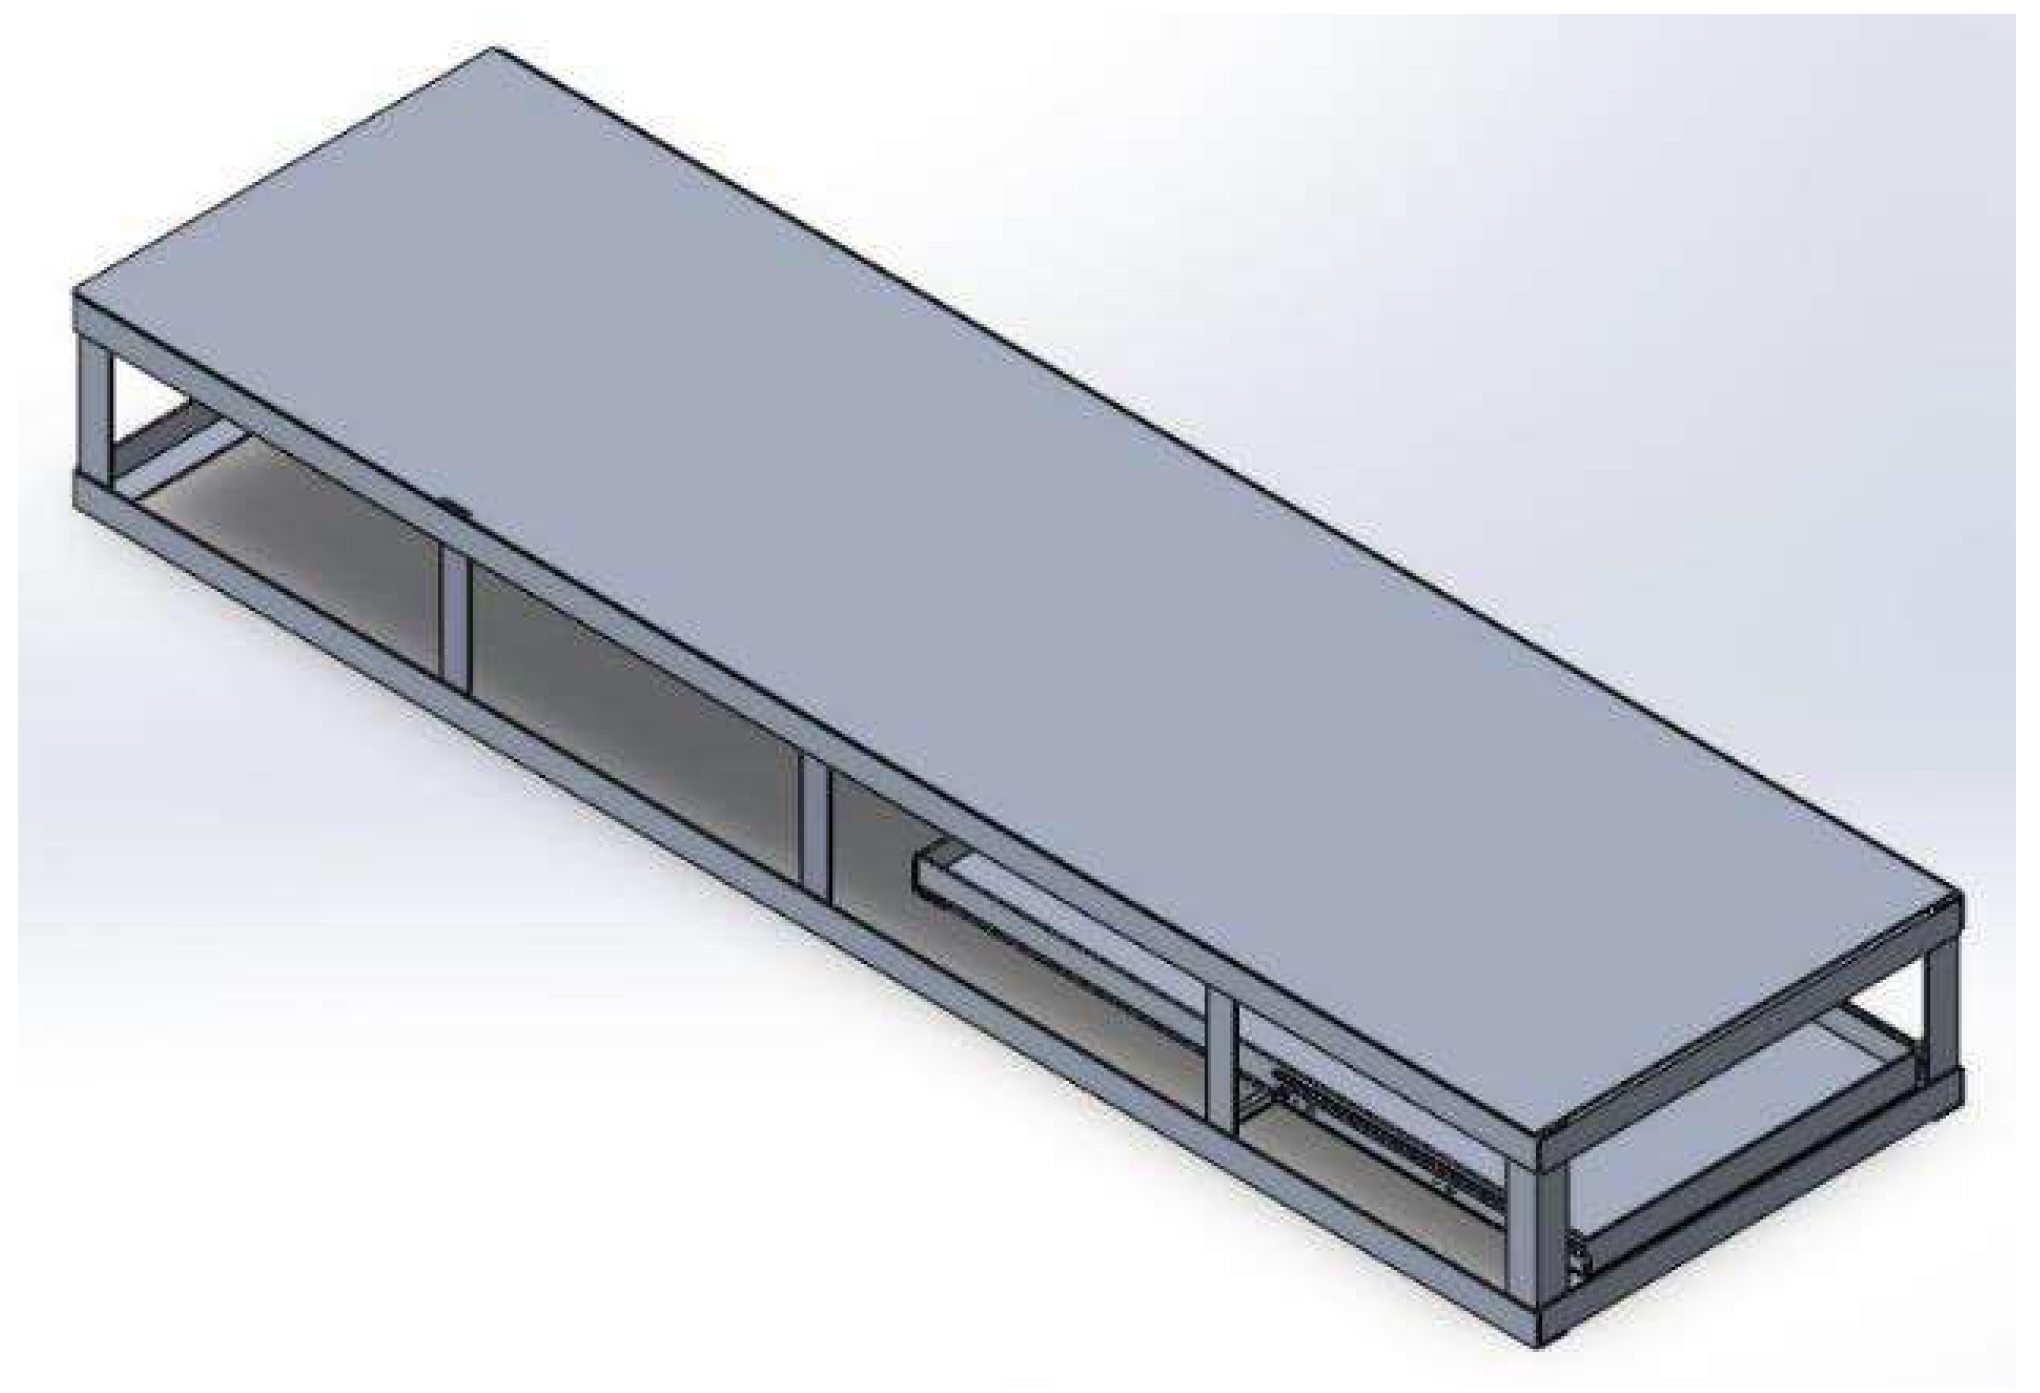
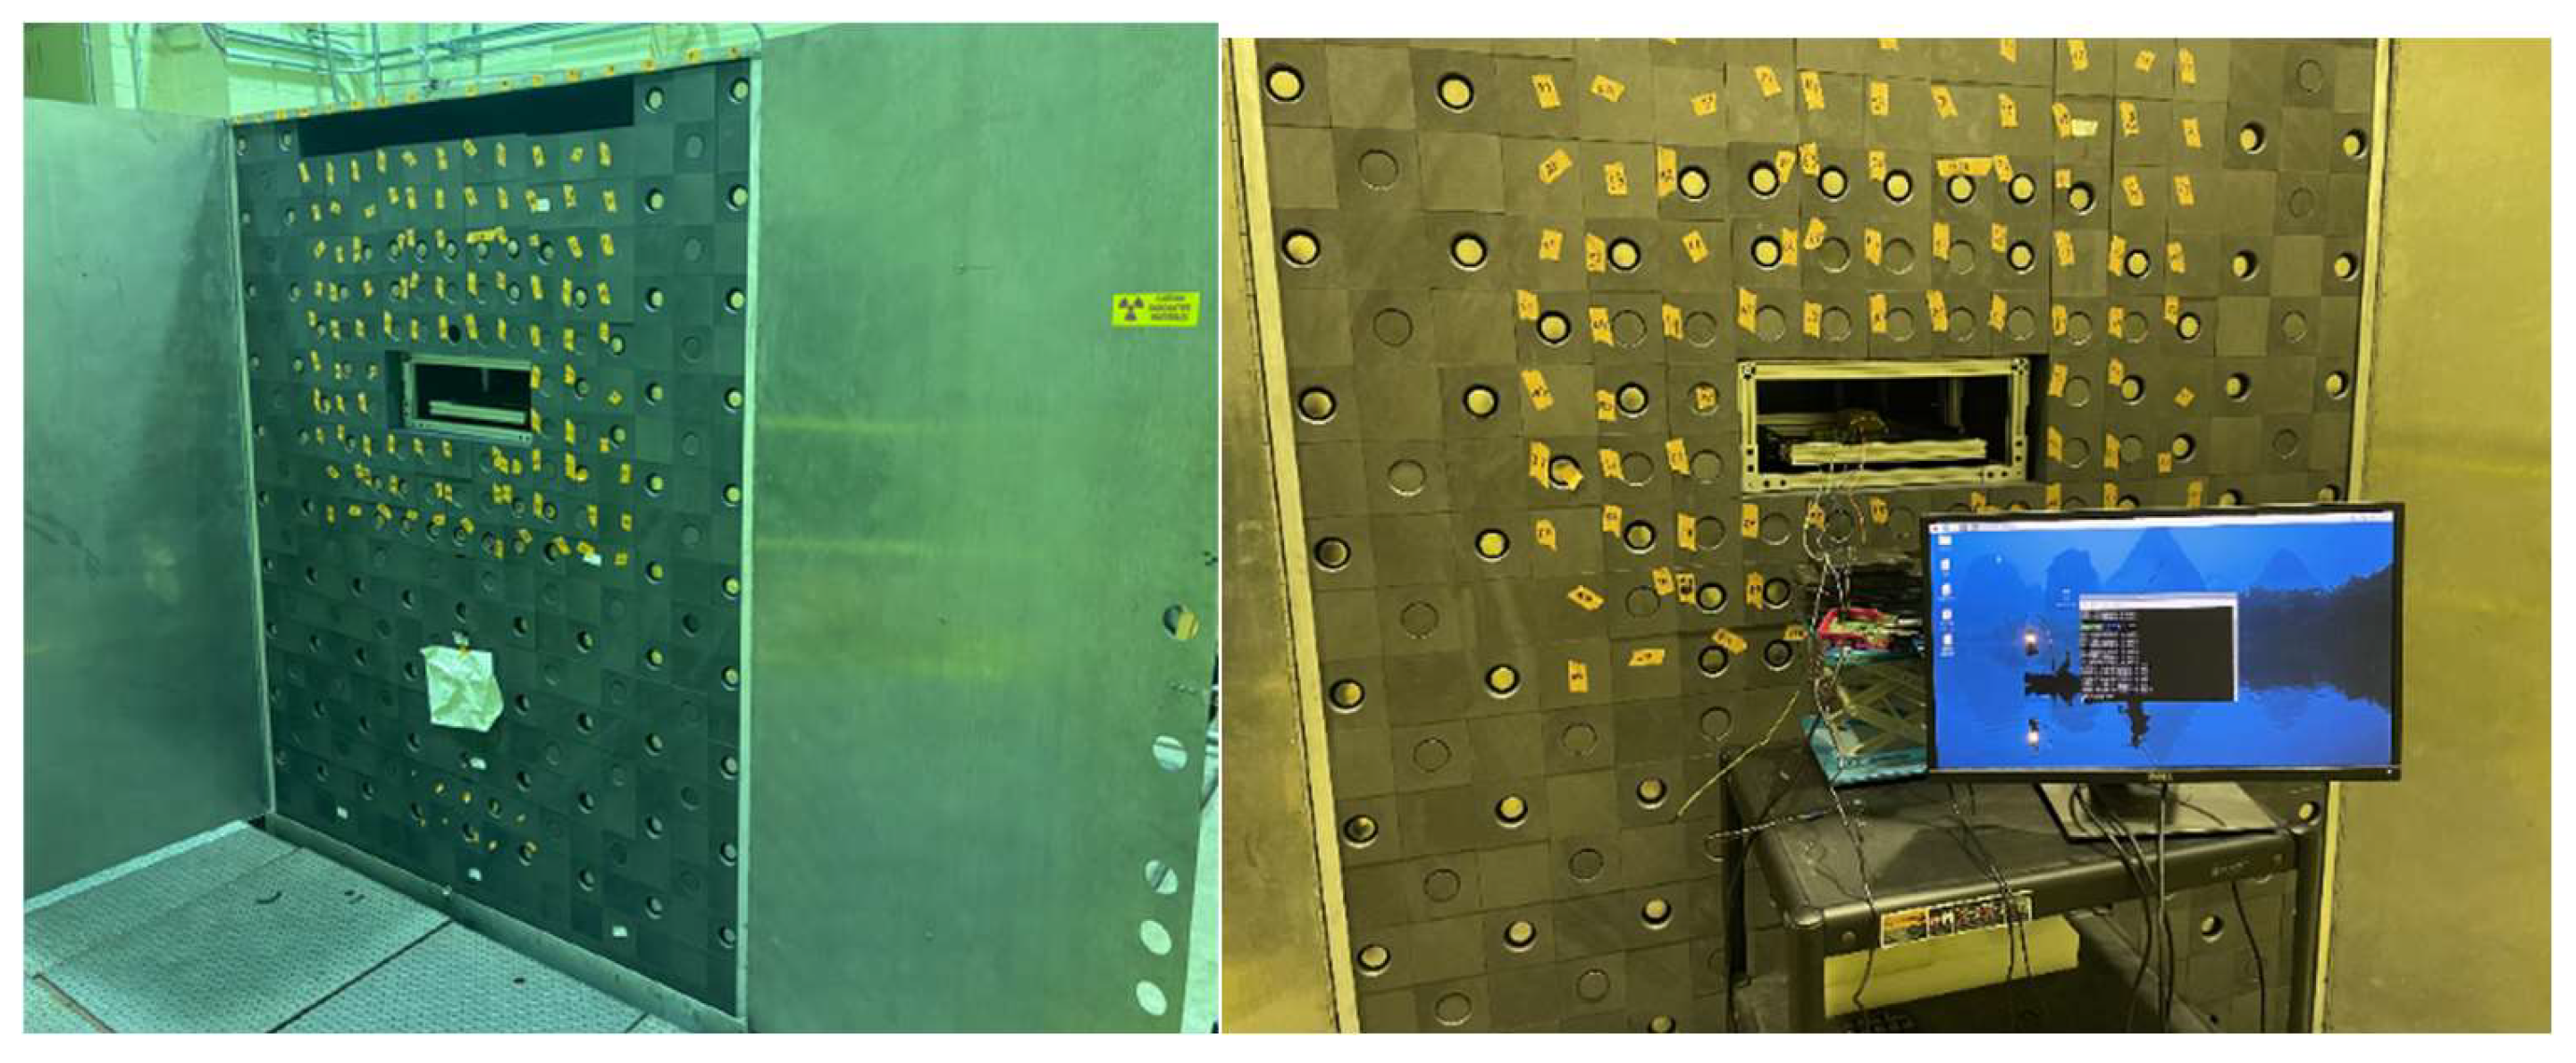
3. Modified Subcritical Pile Testbed
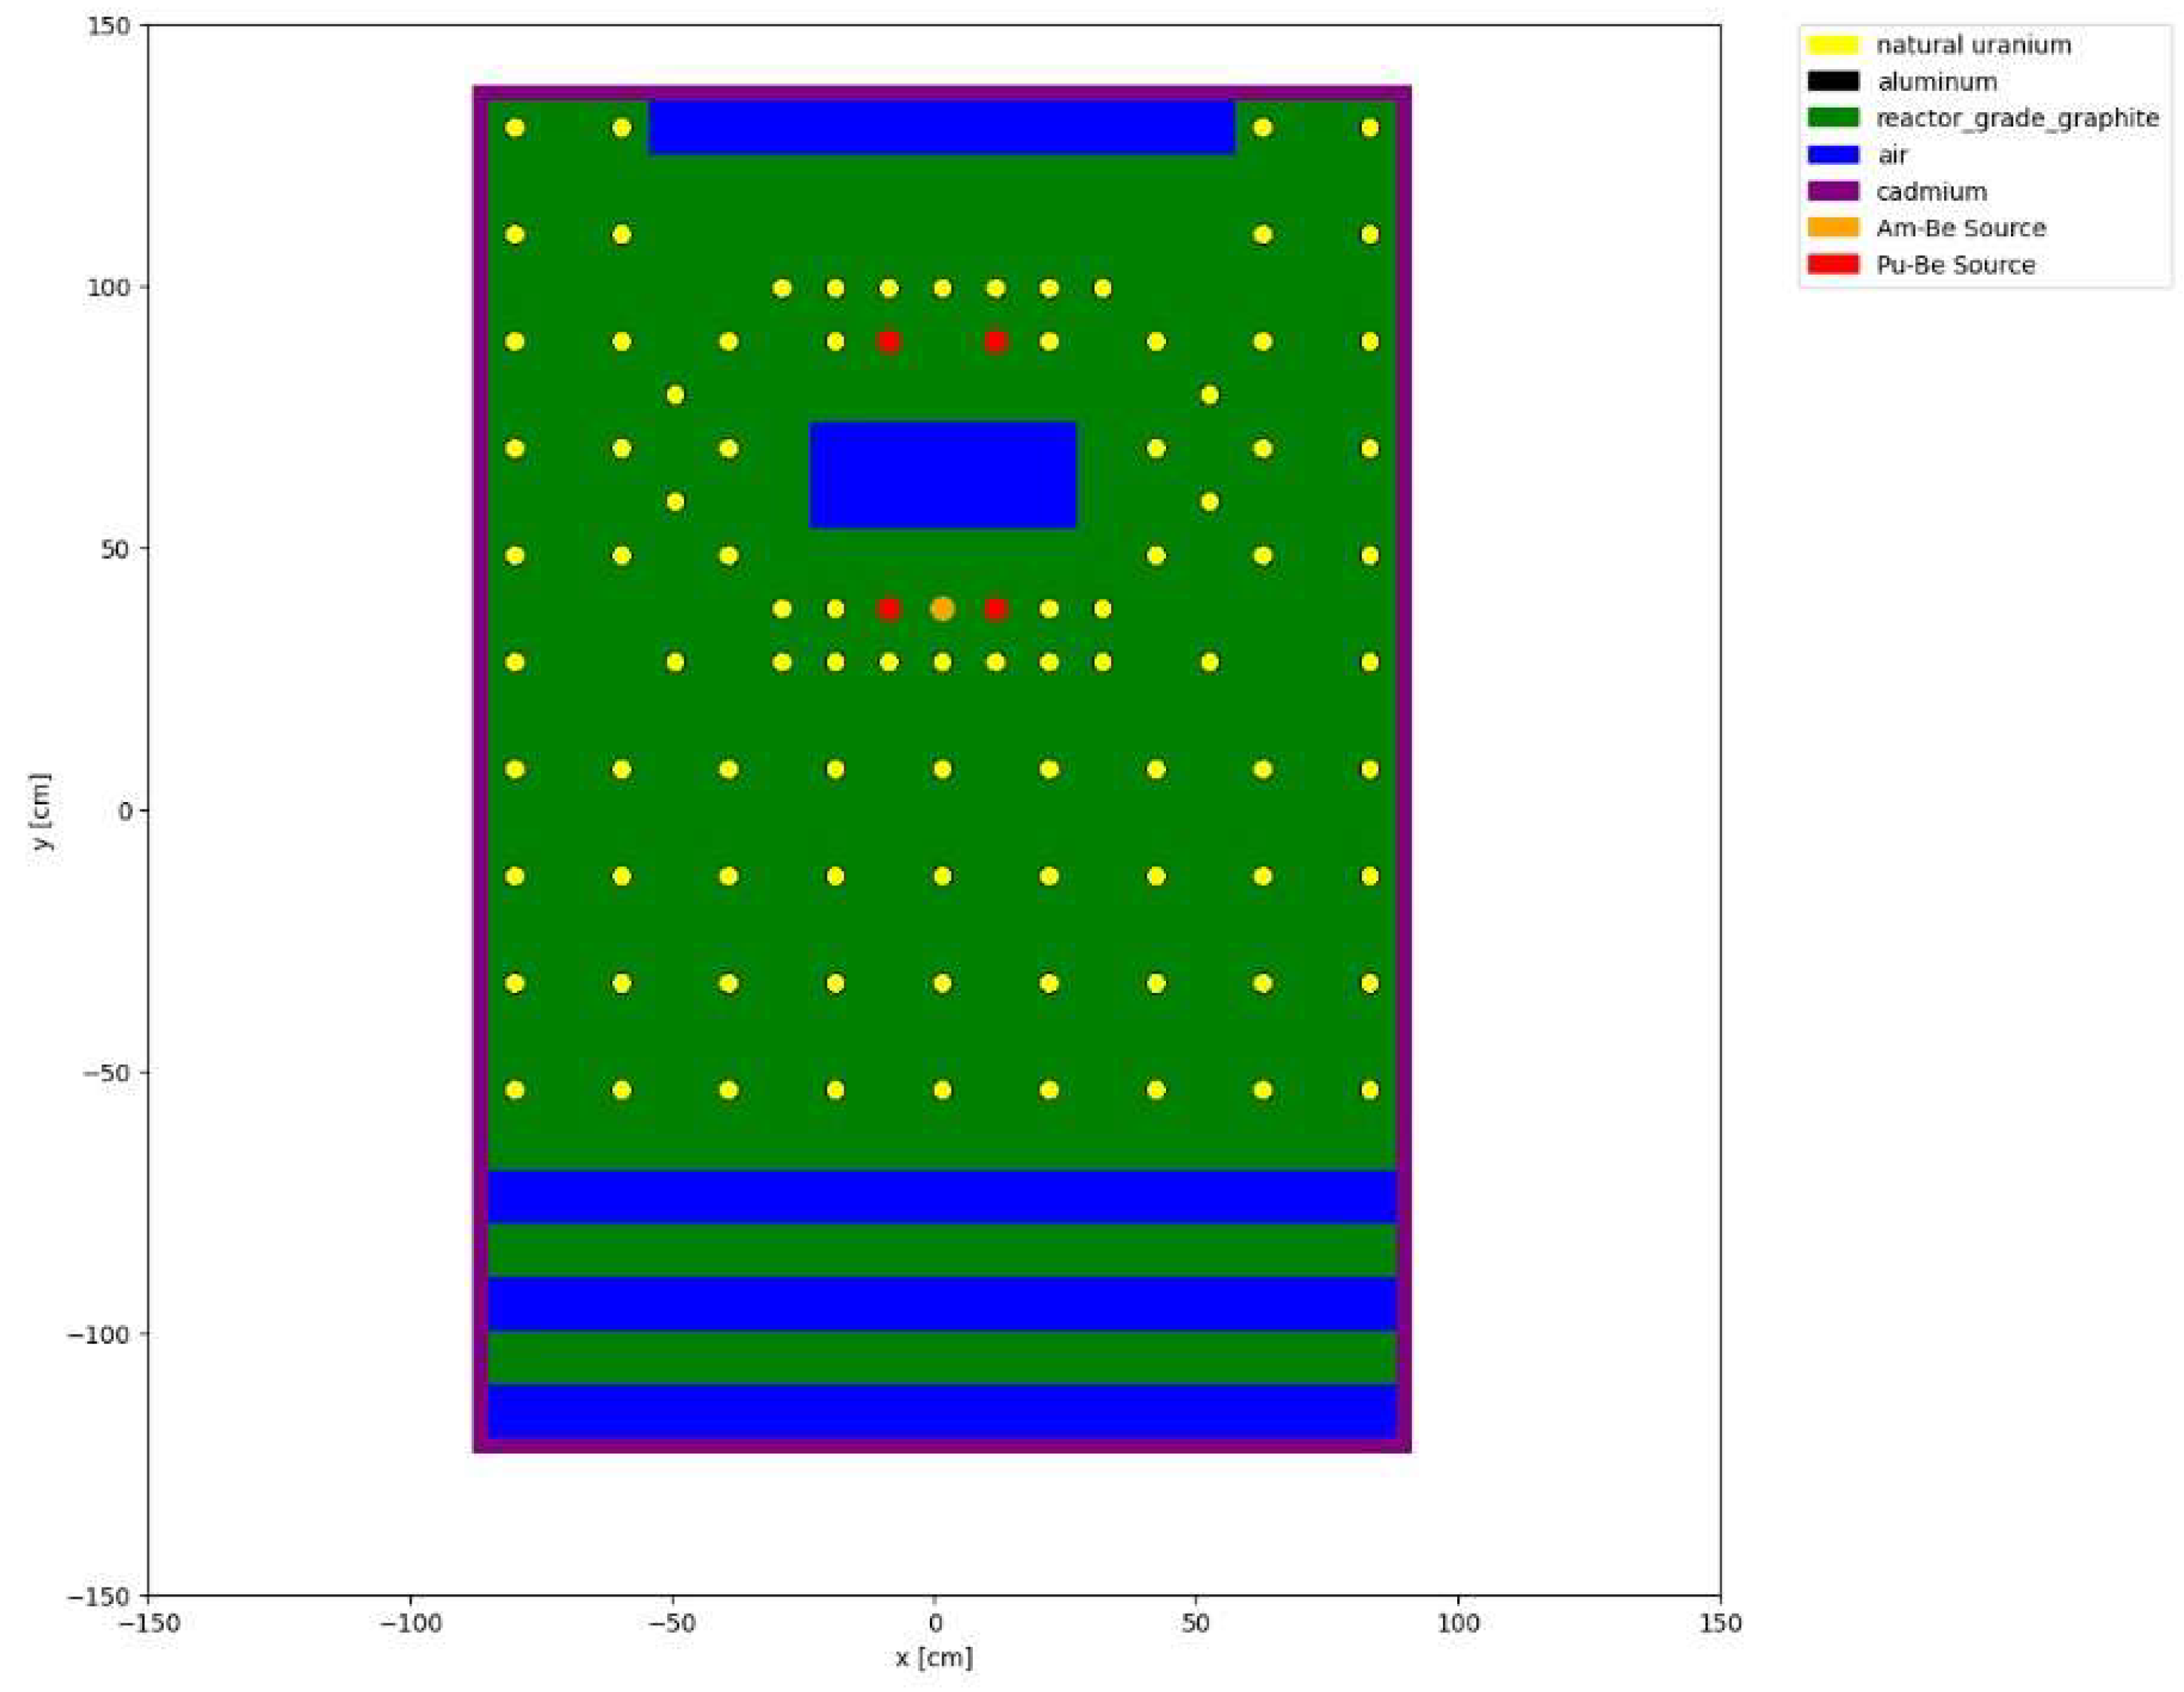
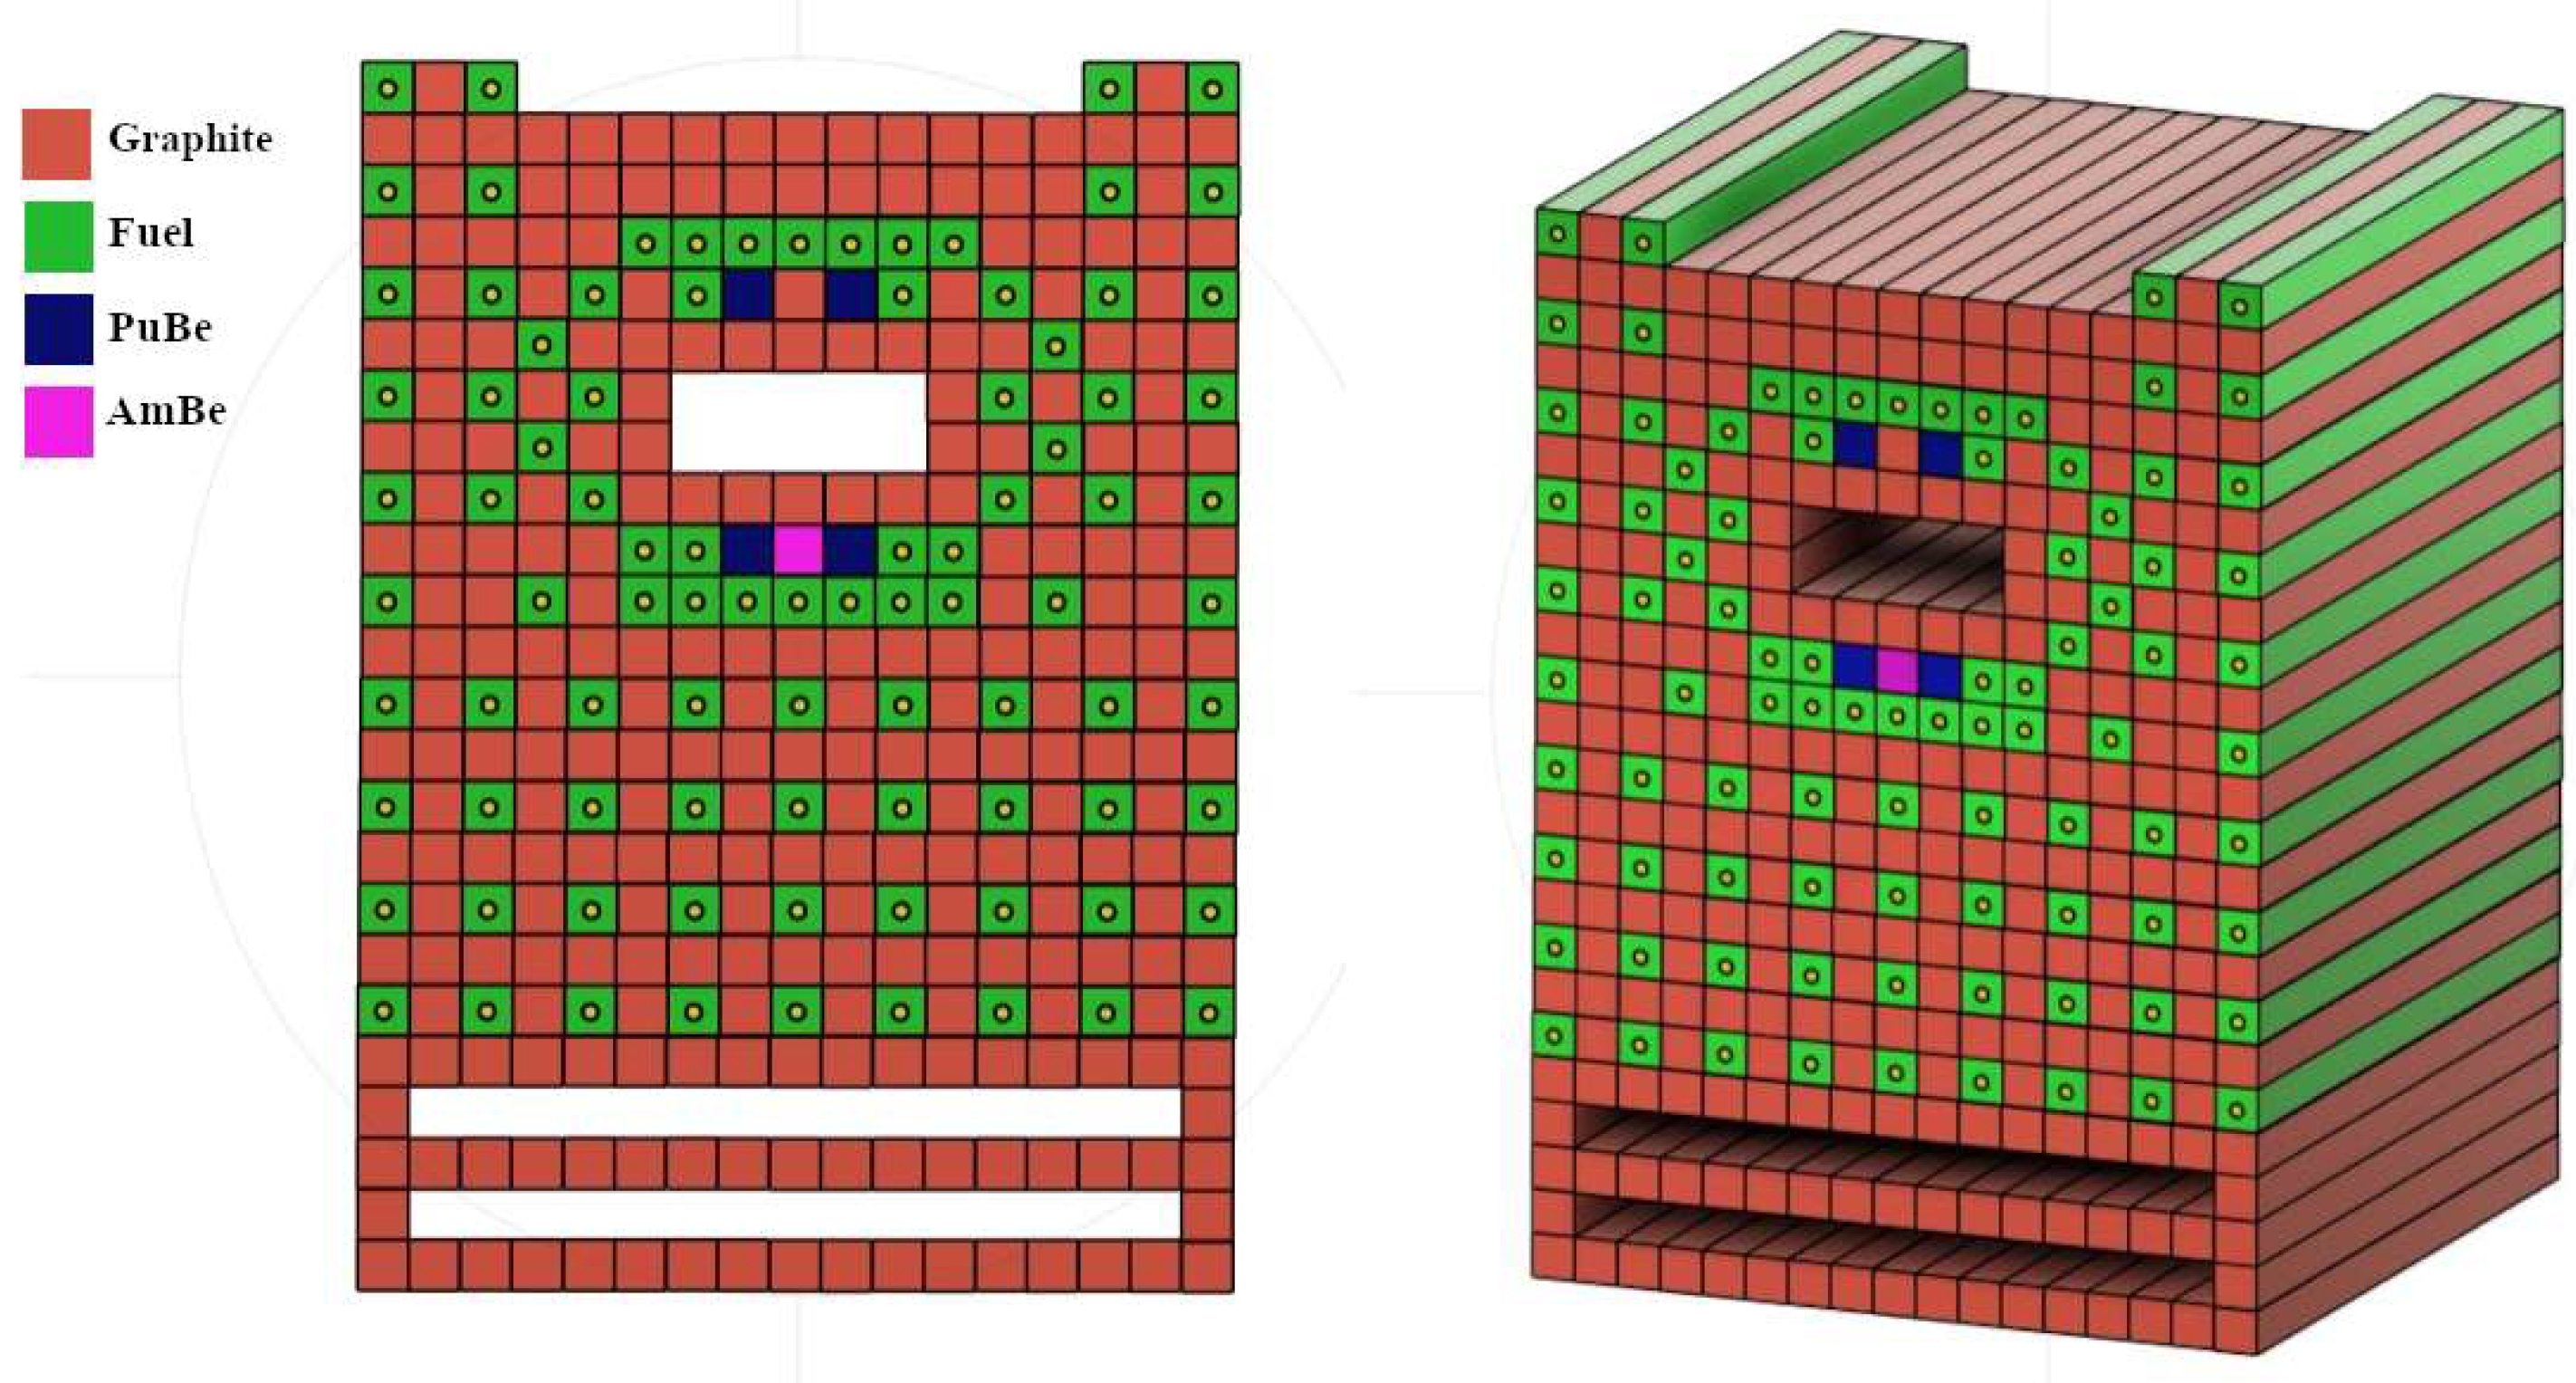
3.1. Pile Geometry
4. Methods
4.1. Neutron Interactions
4.2. Metal Foil Neutron Activation
4.3. Diffusion Theory
4.4. Two Group Neutron Profile
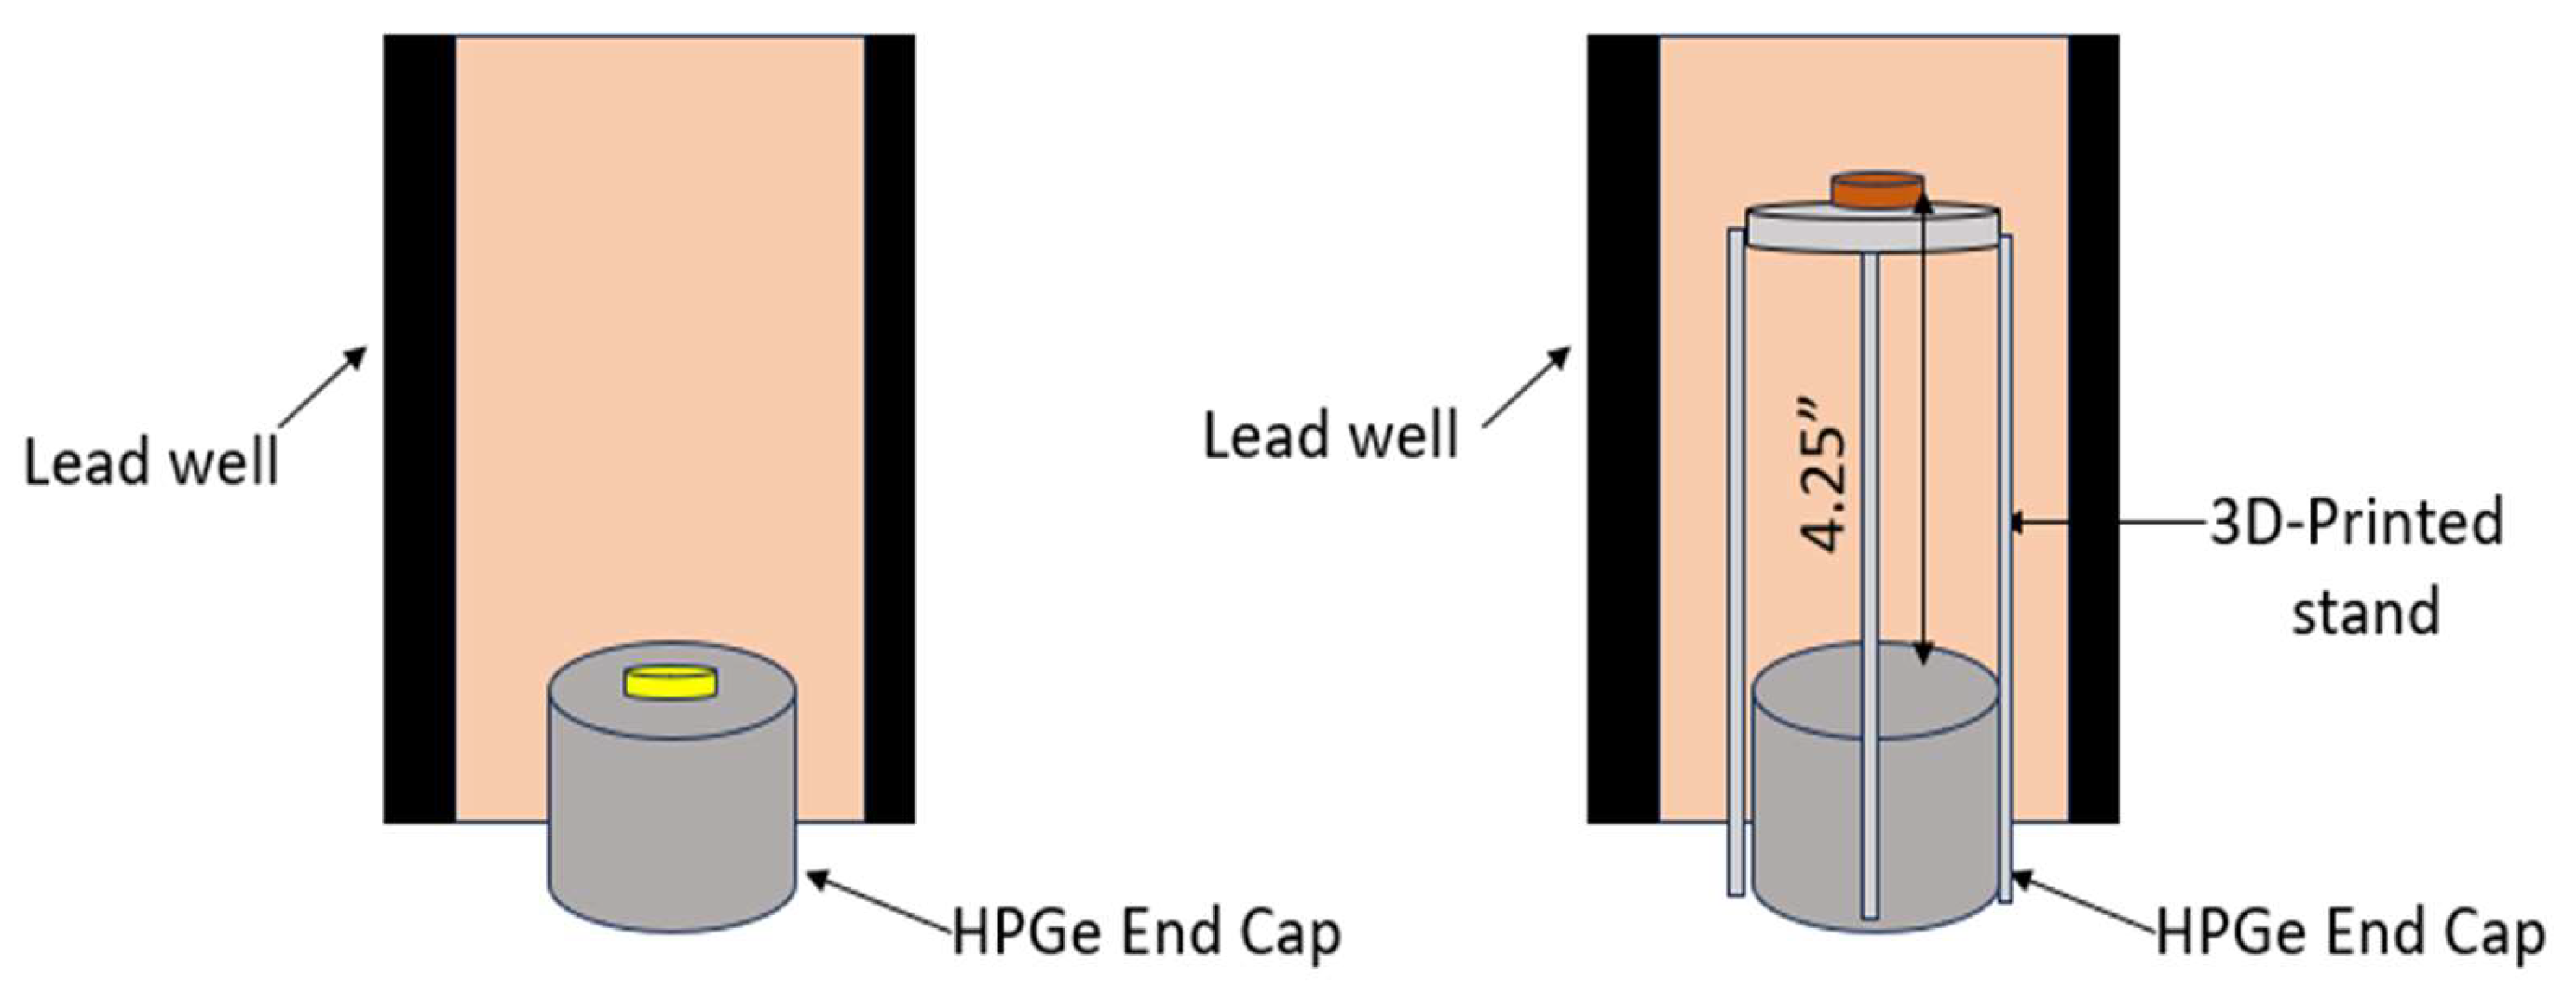
4.5. High-Purity Germanium Detectors
4.6. OpenMC Modeling
5. Results
5.1. Detector Energy Calibration
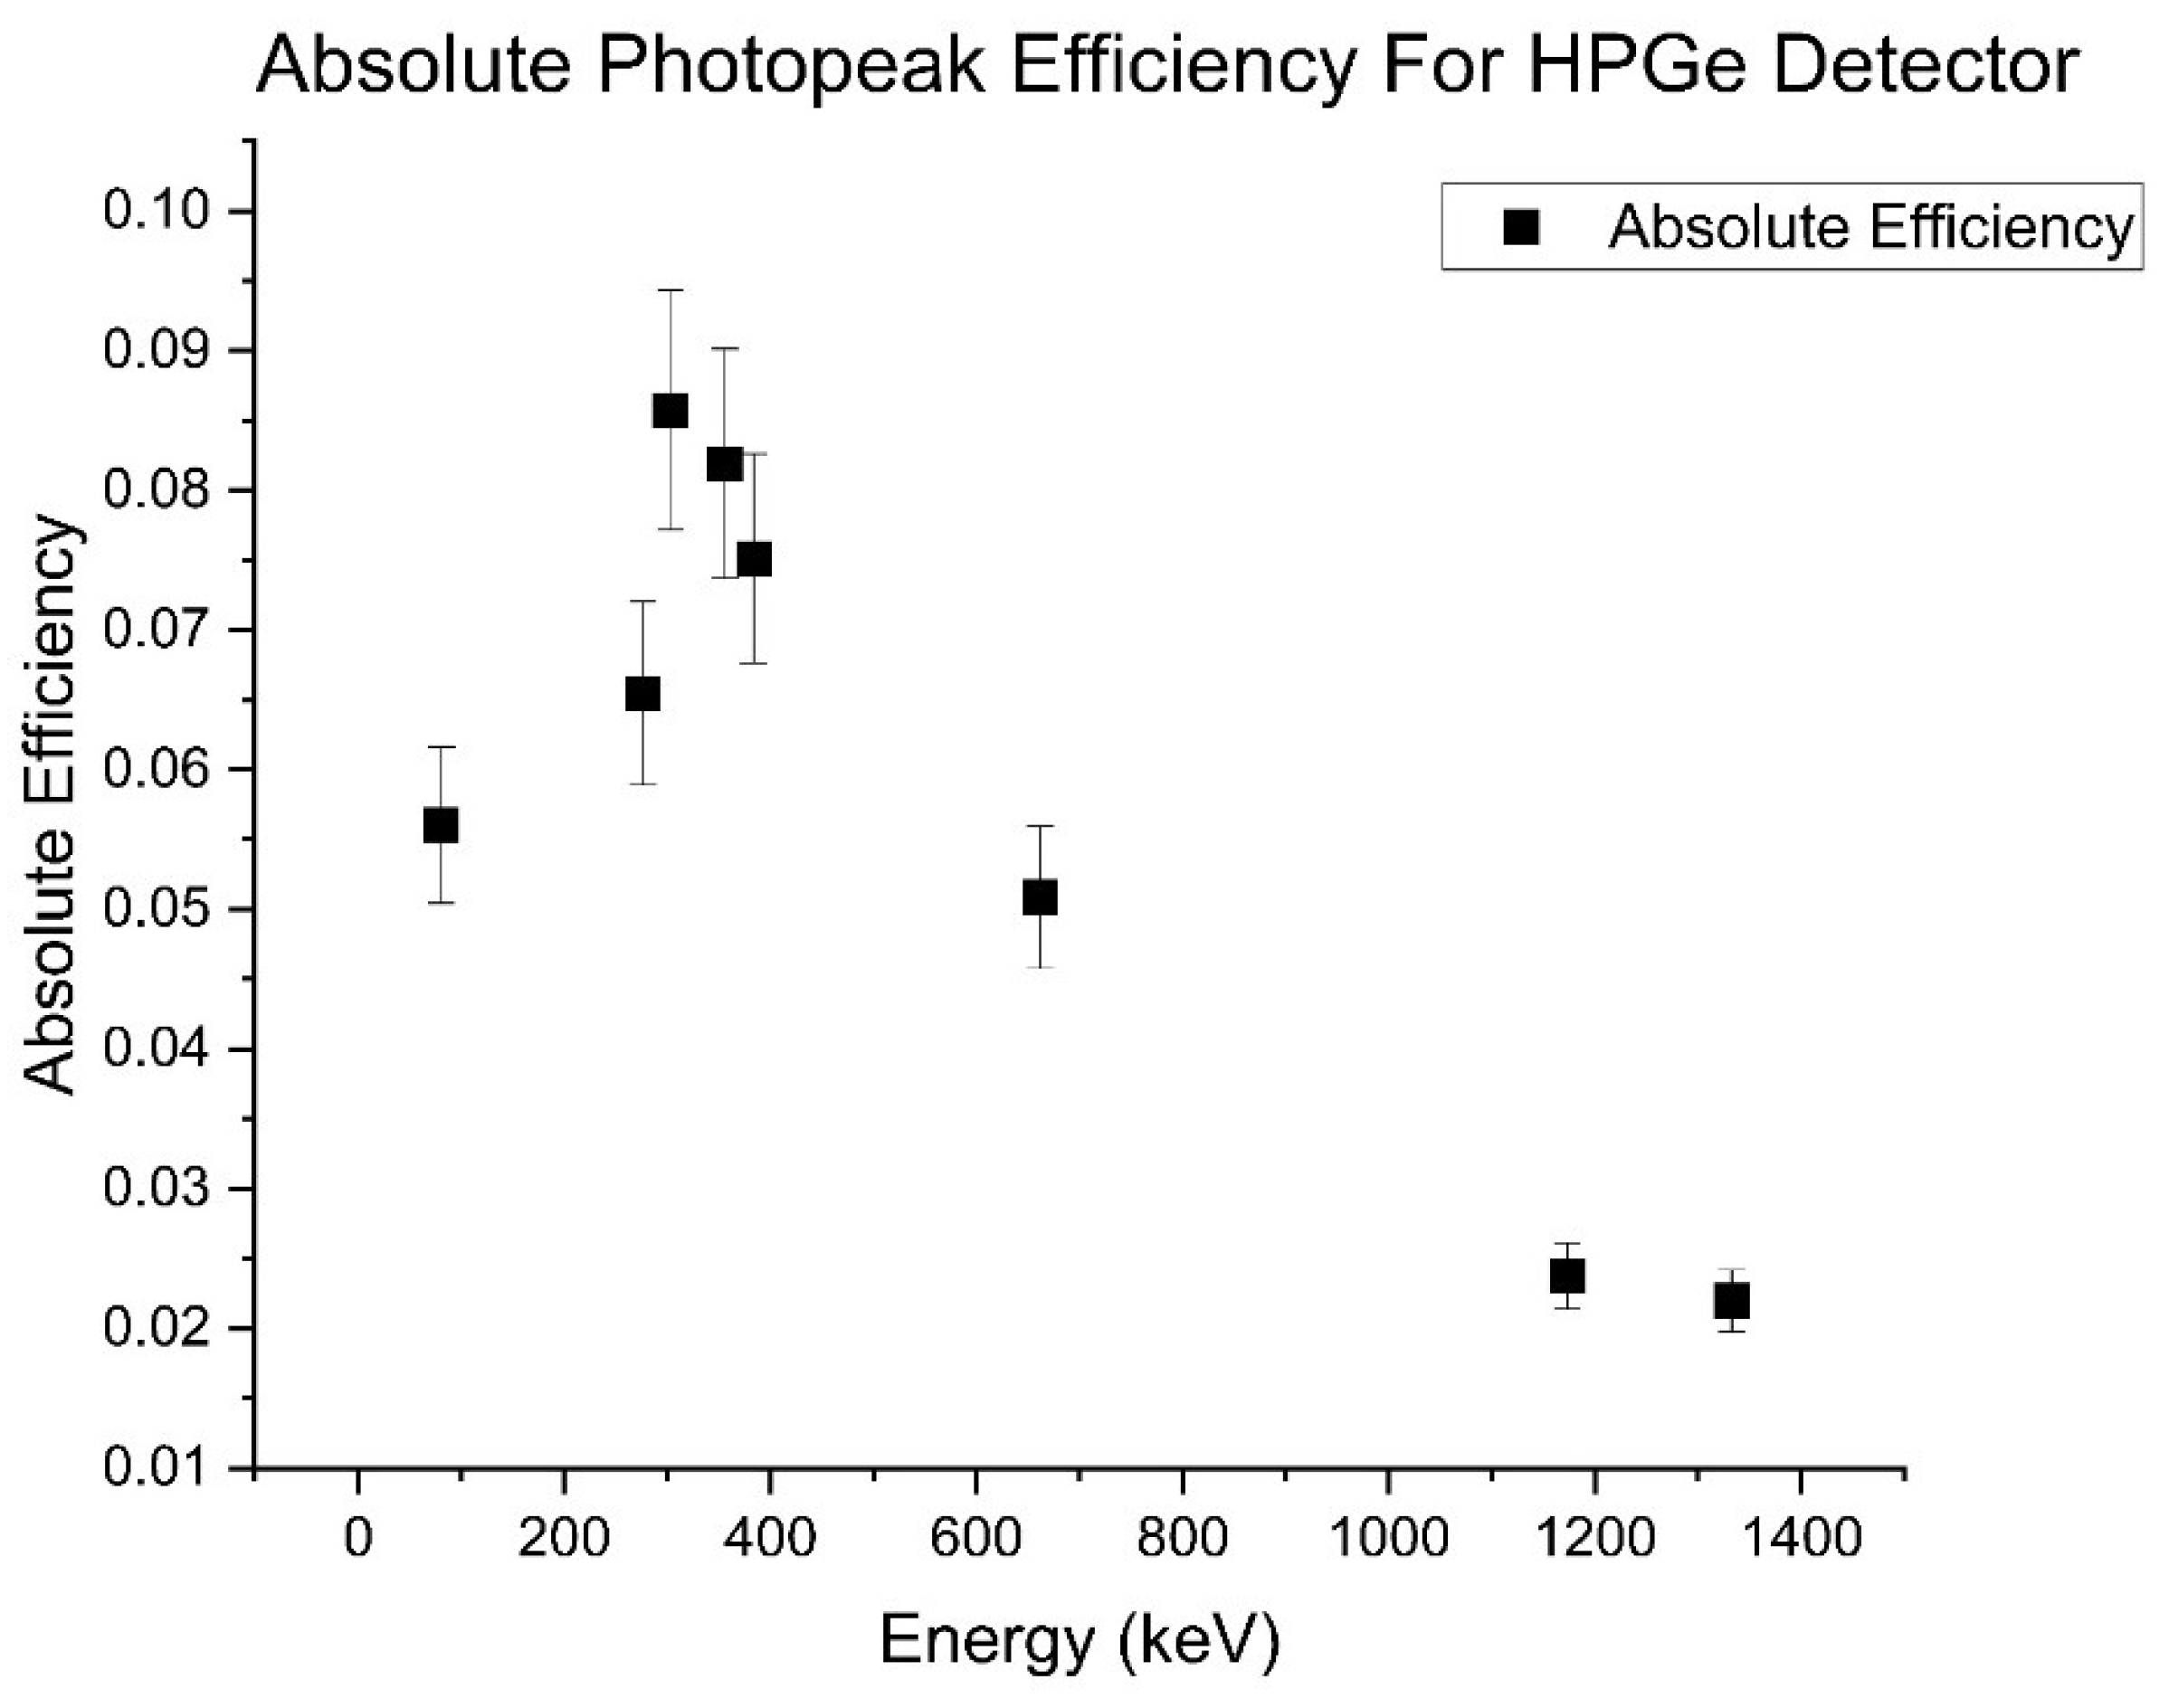
5.2. Absolute Photopeak Efficiency
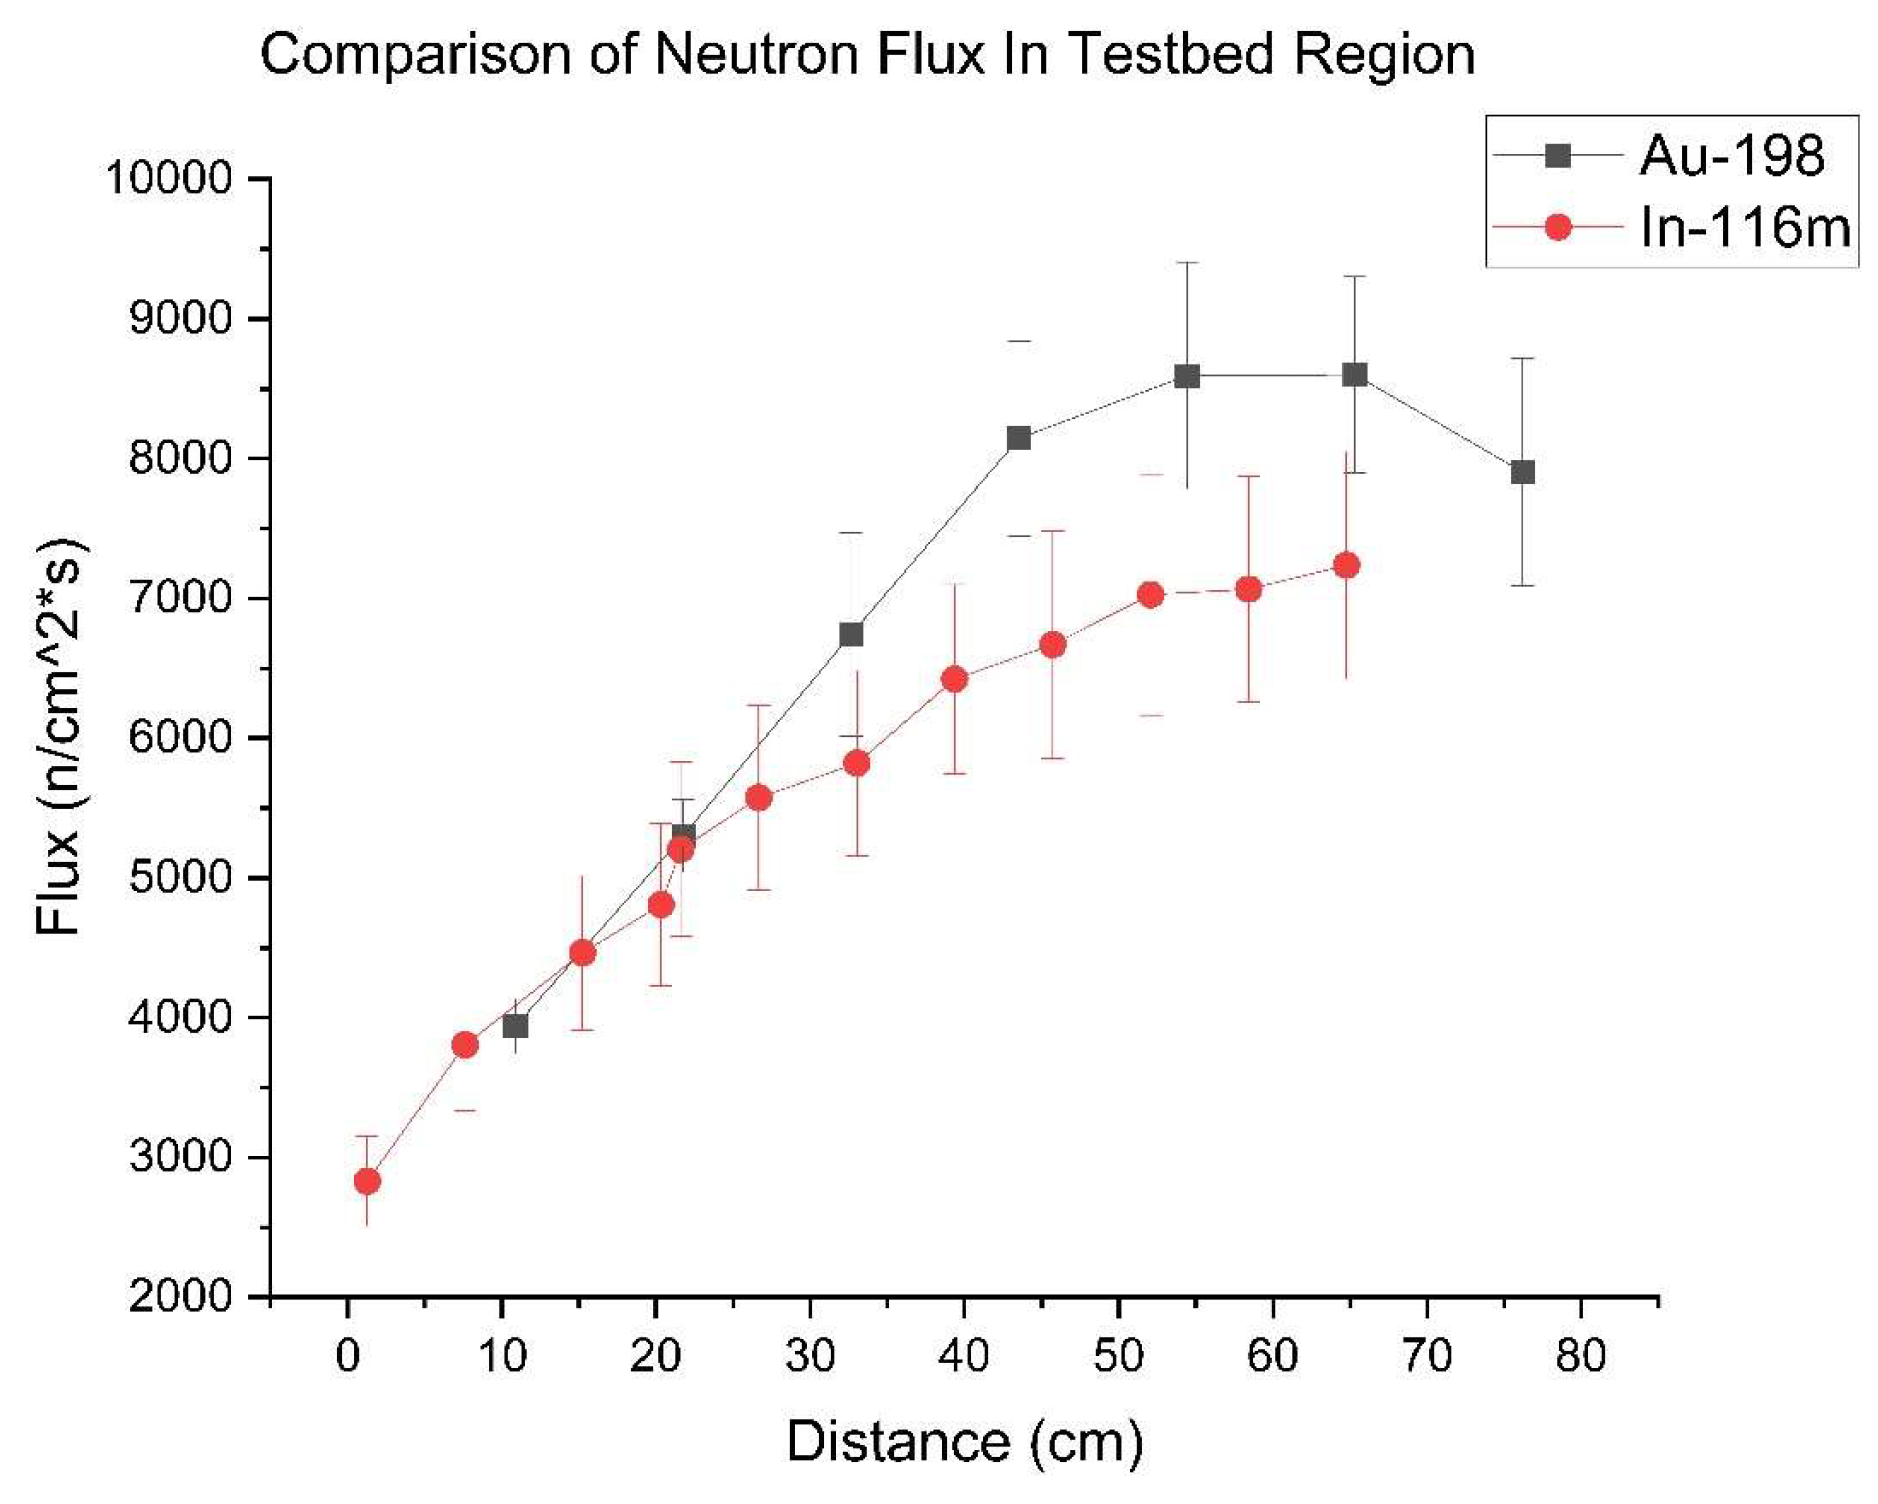
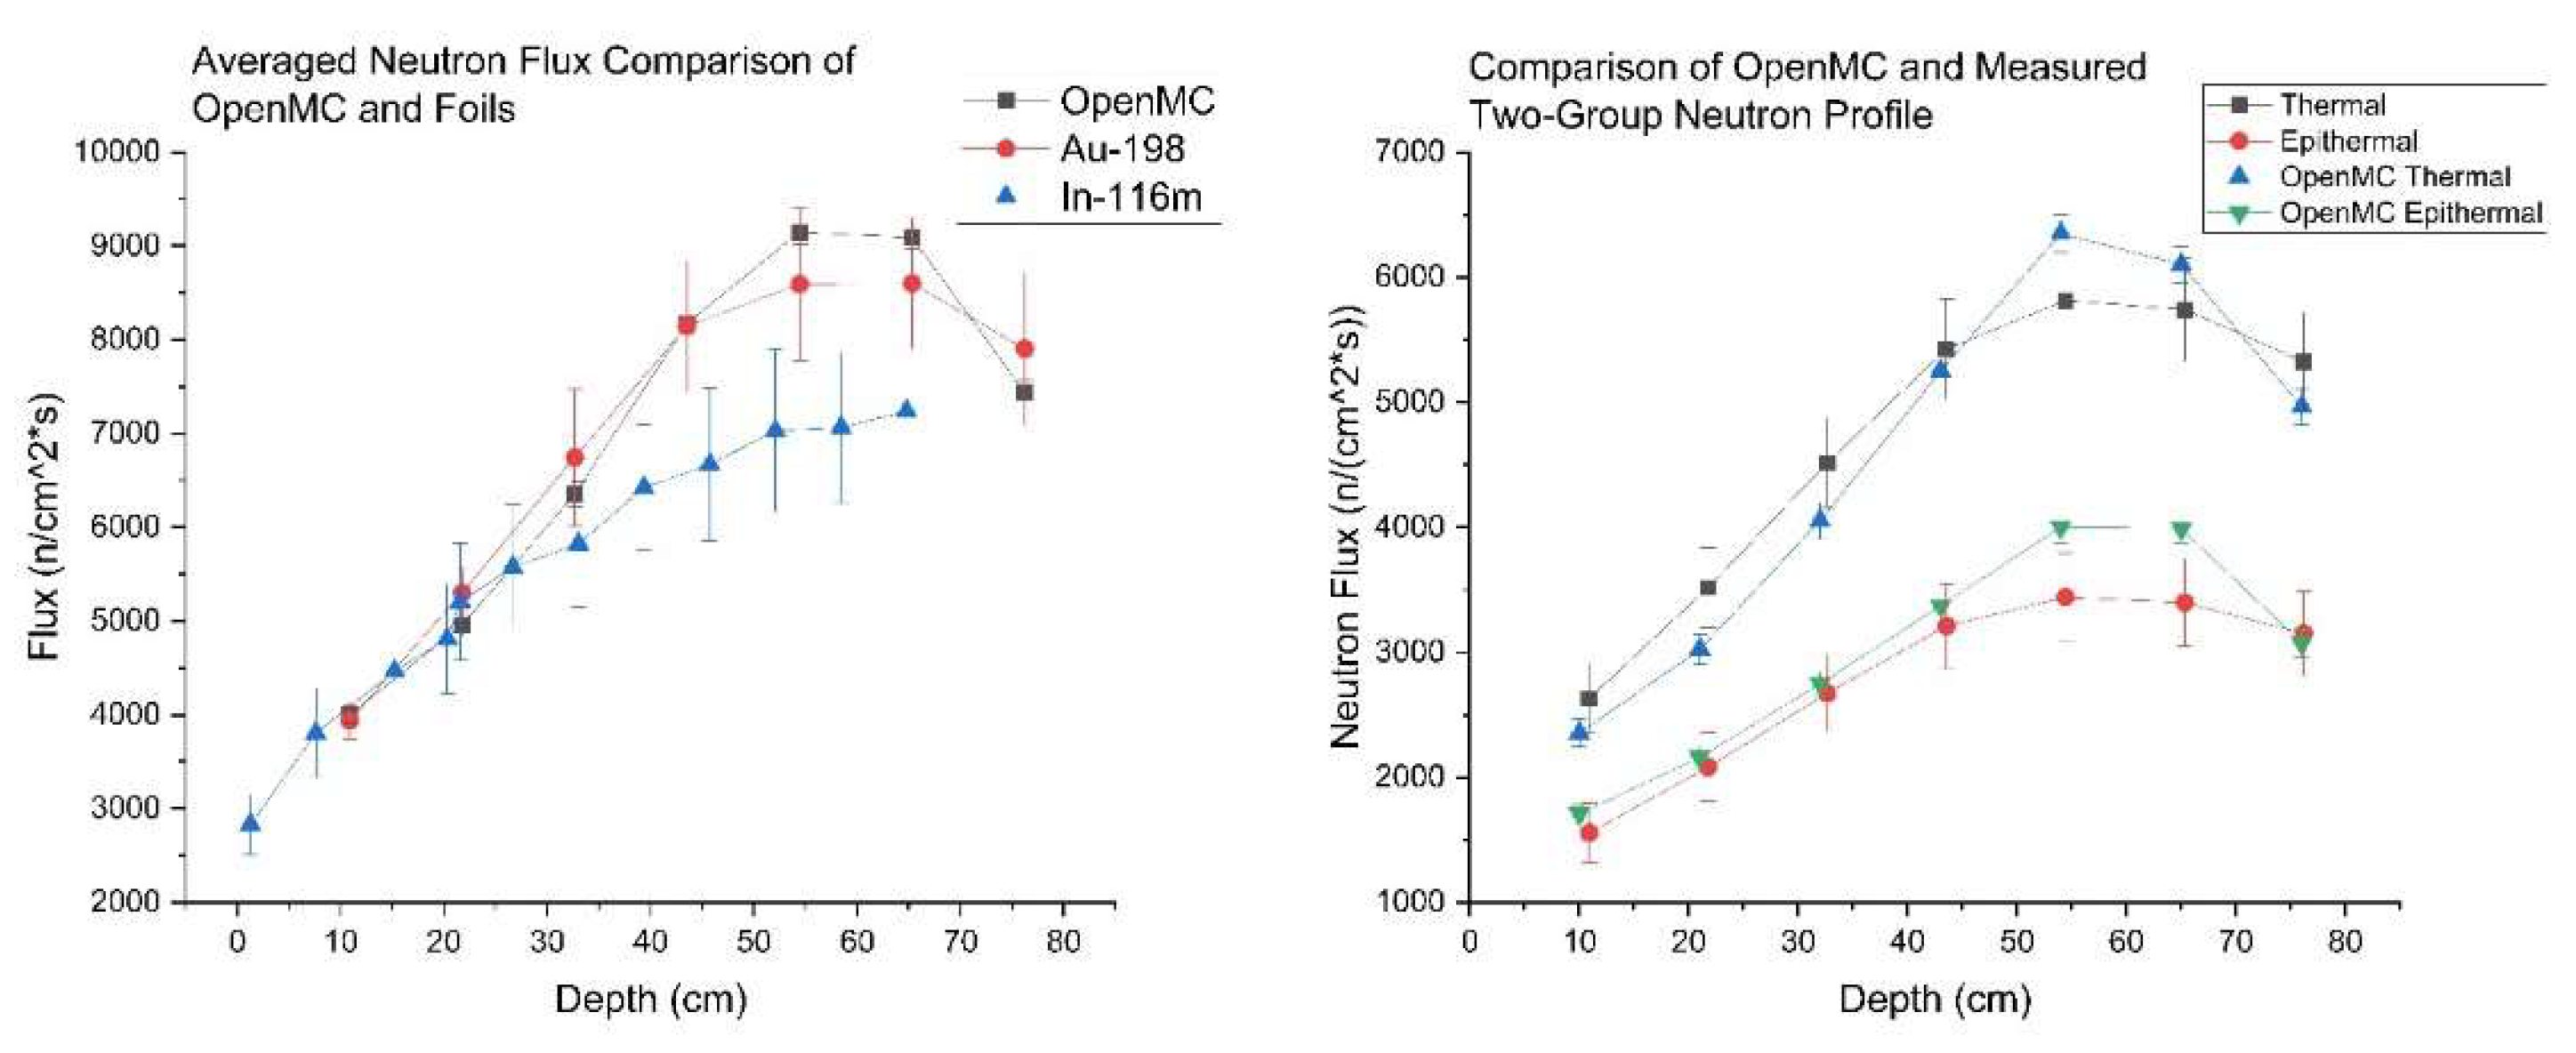
5.4. Testbed Region Neutron Flux Measured by Indium and Gold
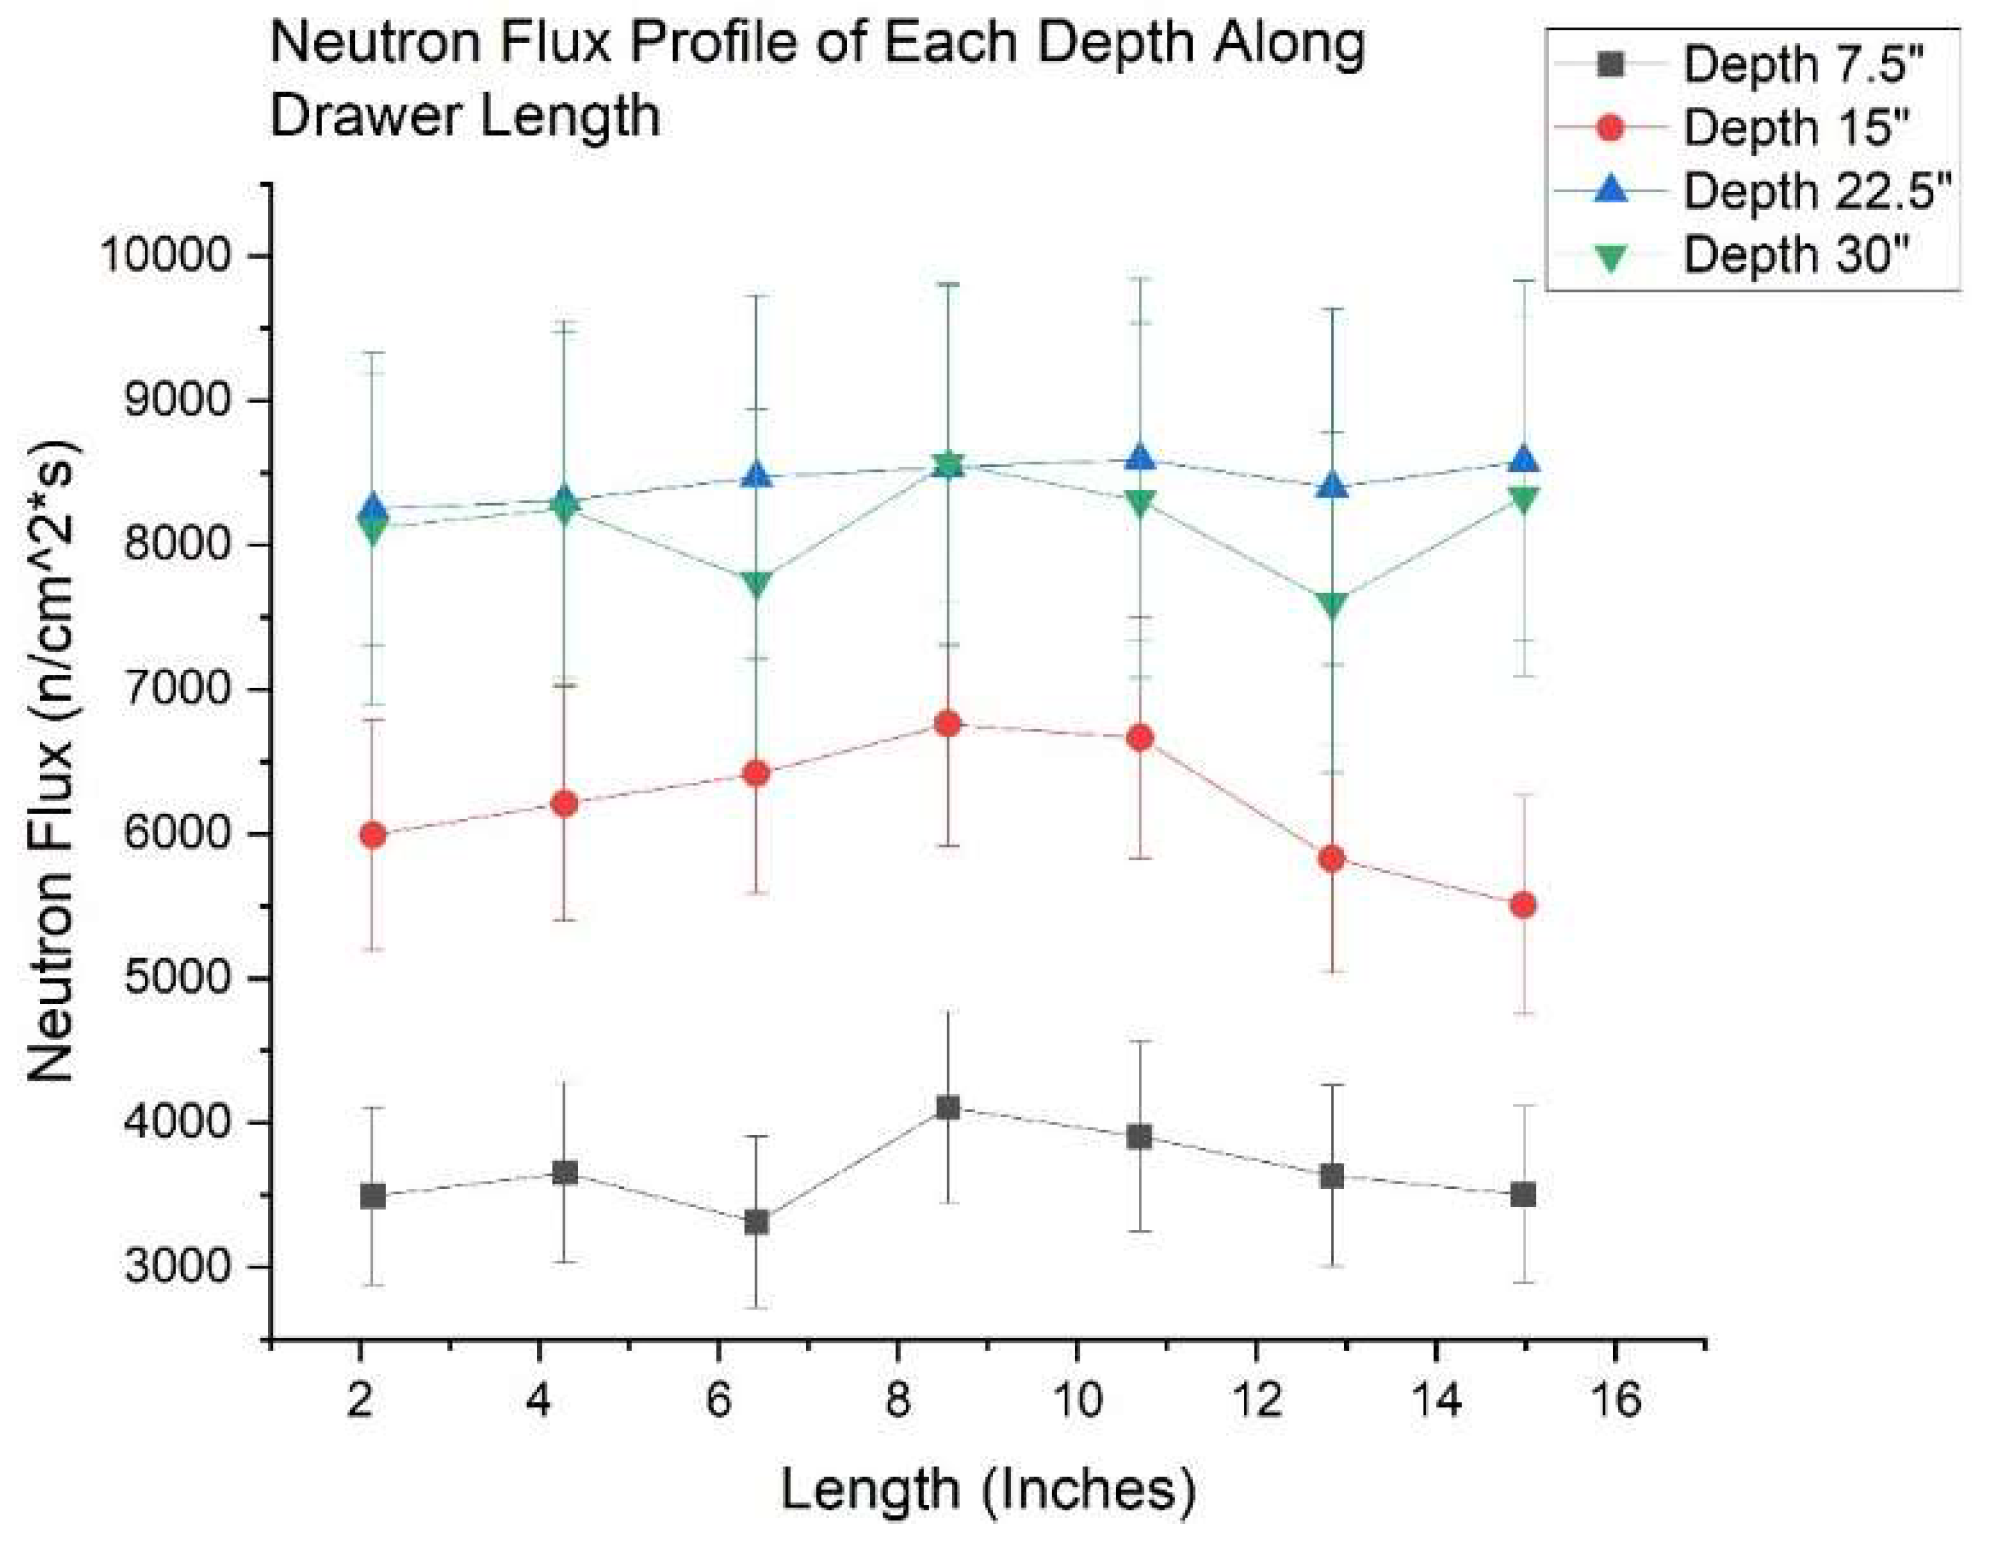
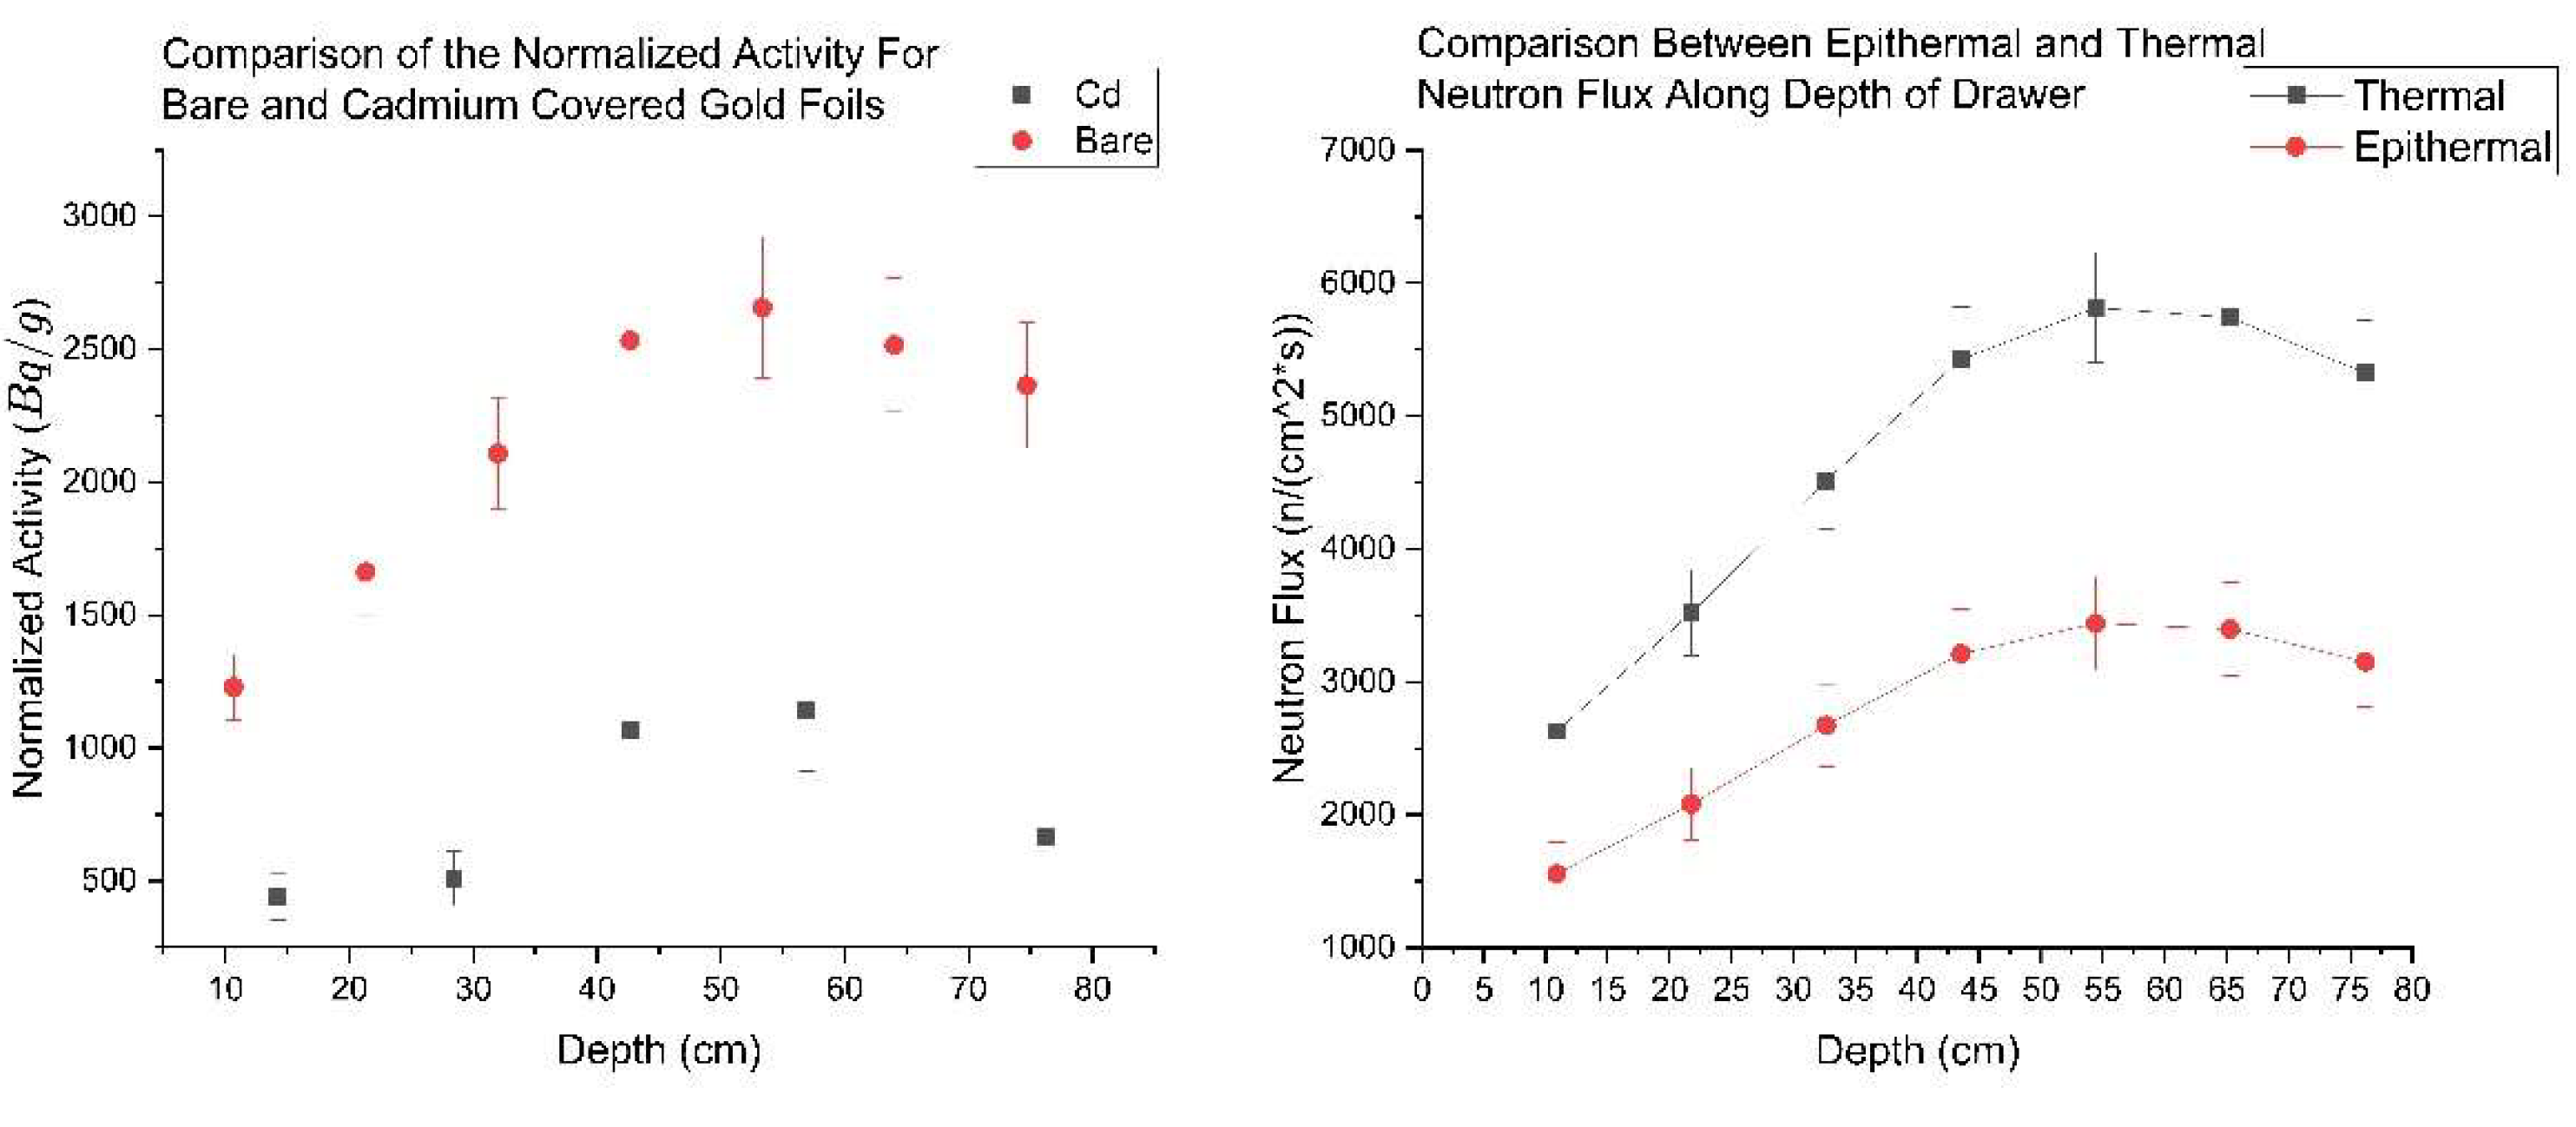
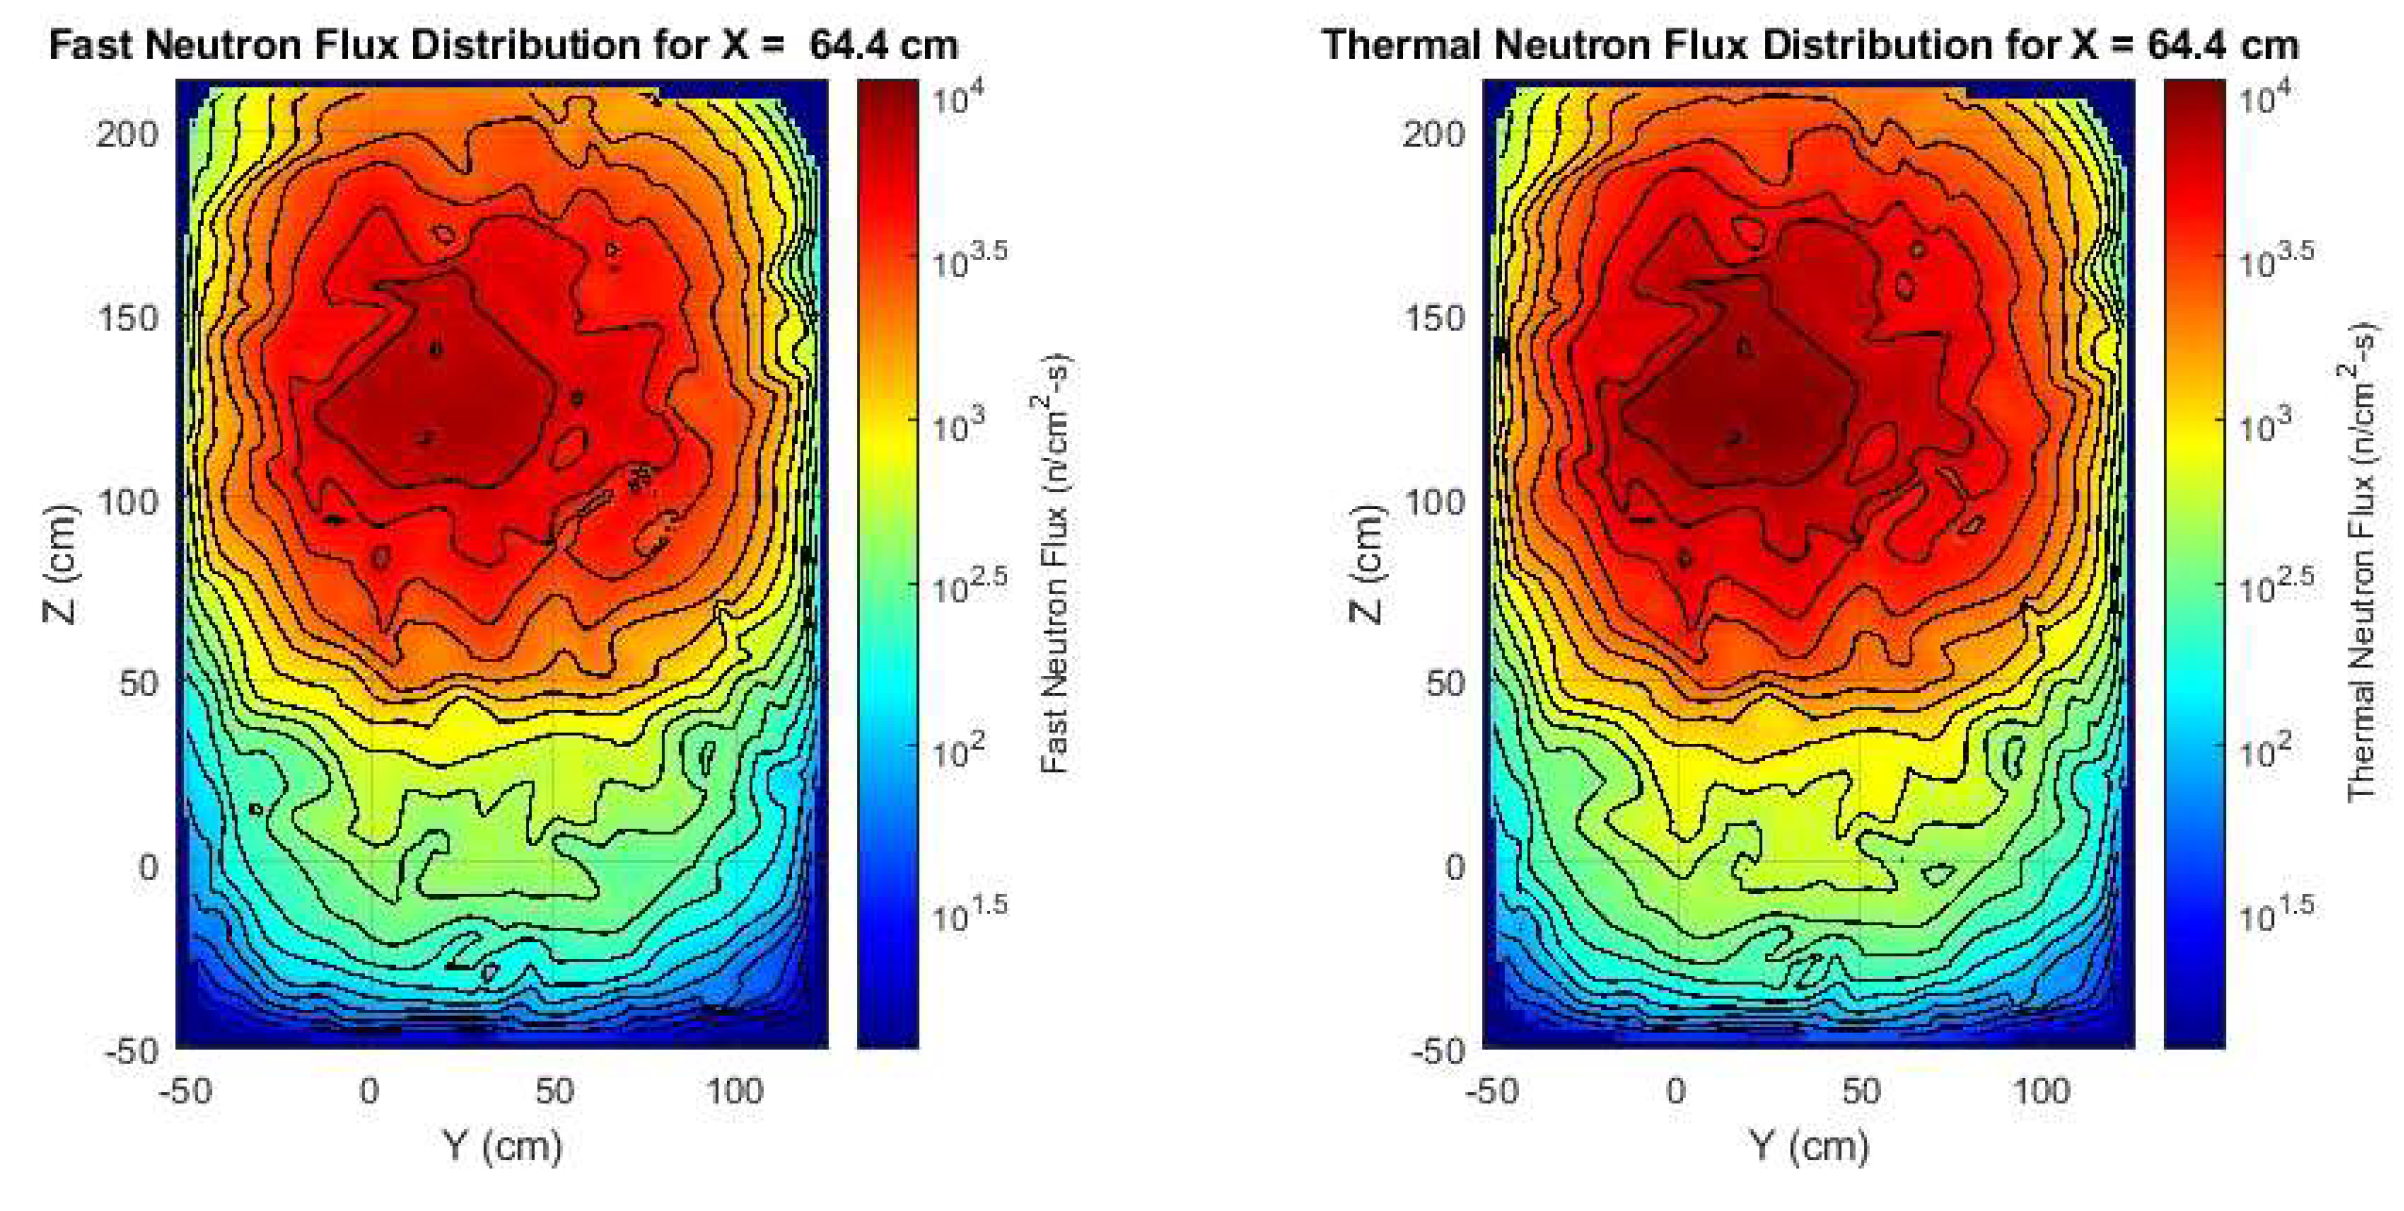
5.5. Two Energy Neutron Testbed Profile
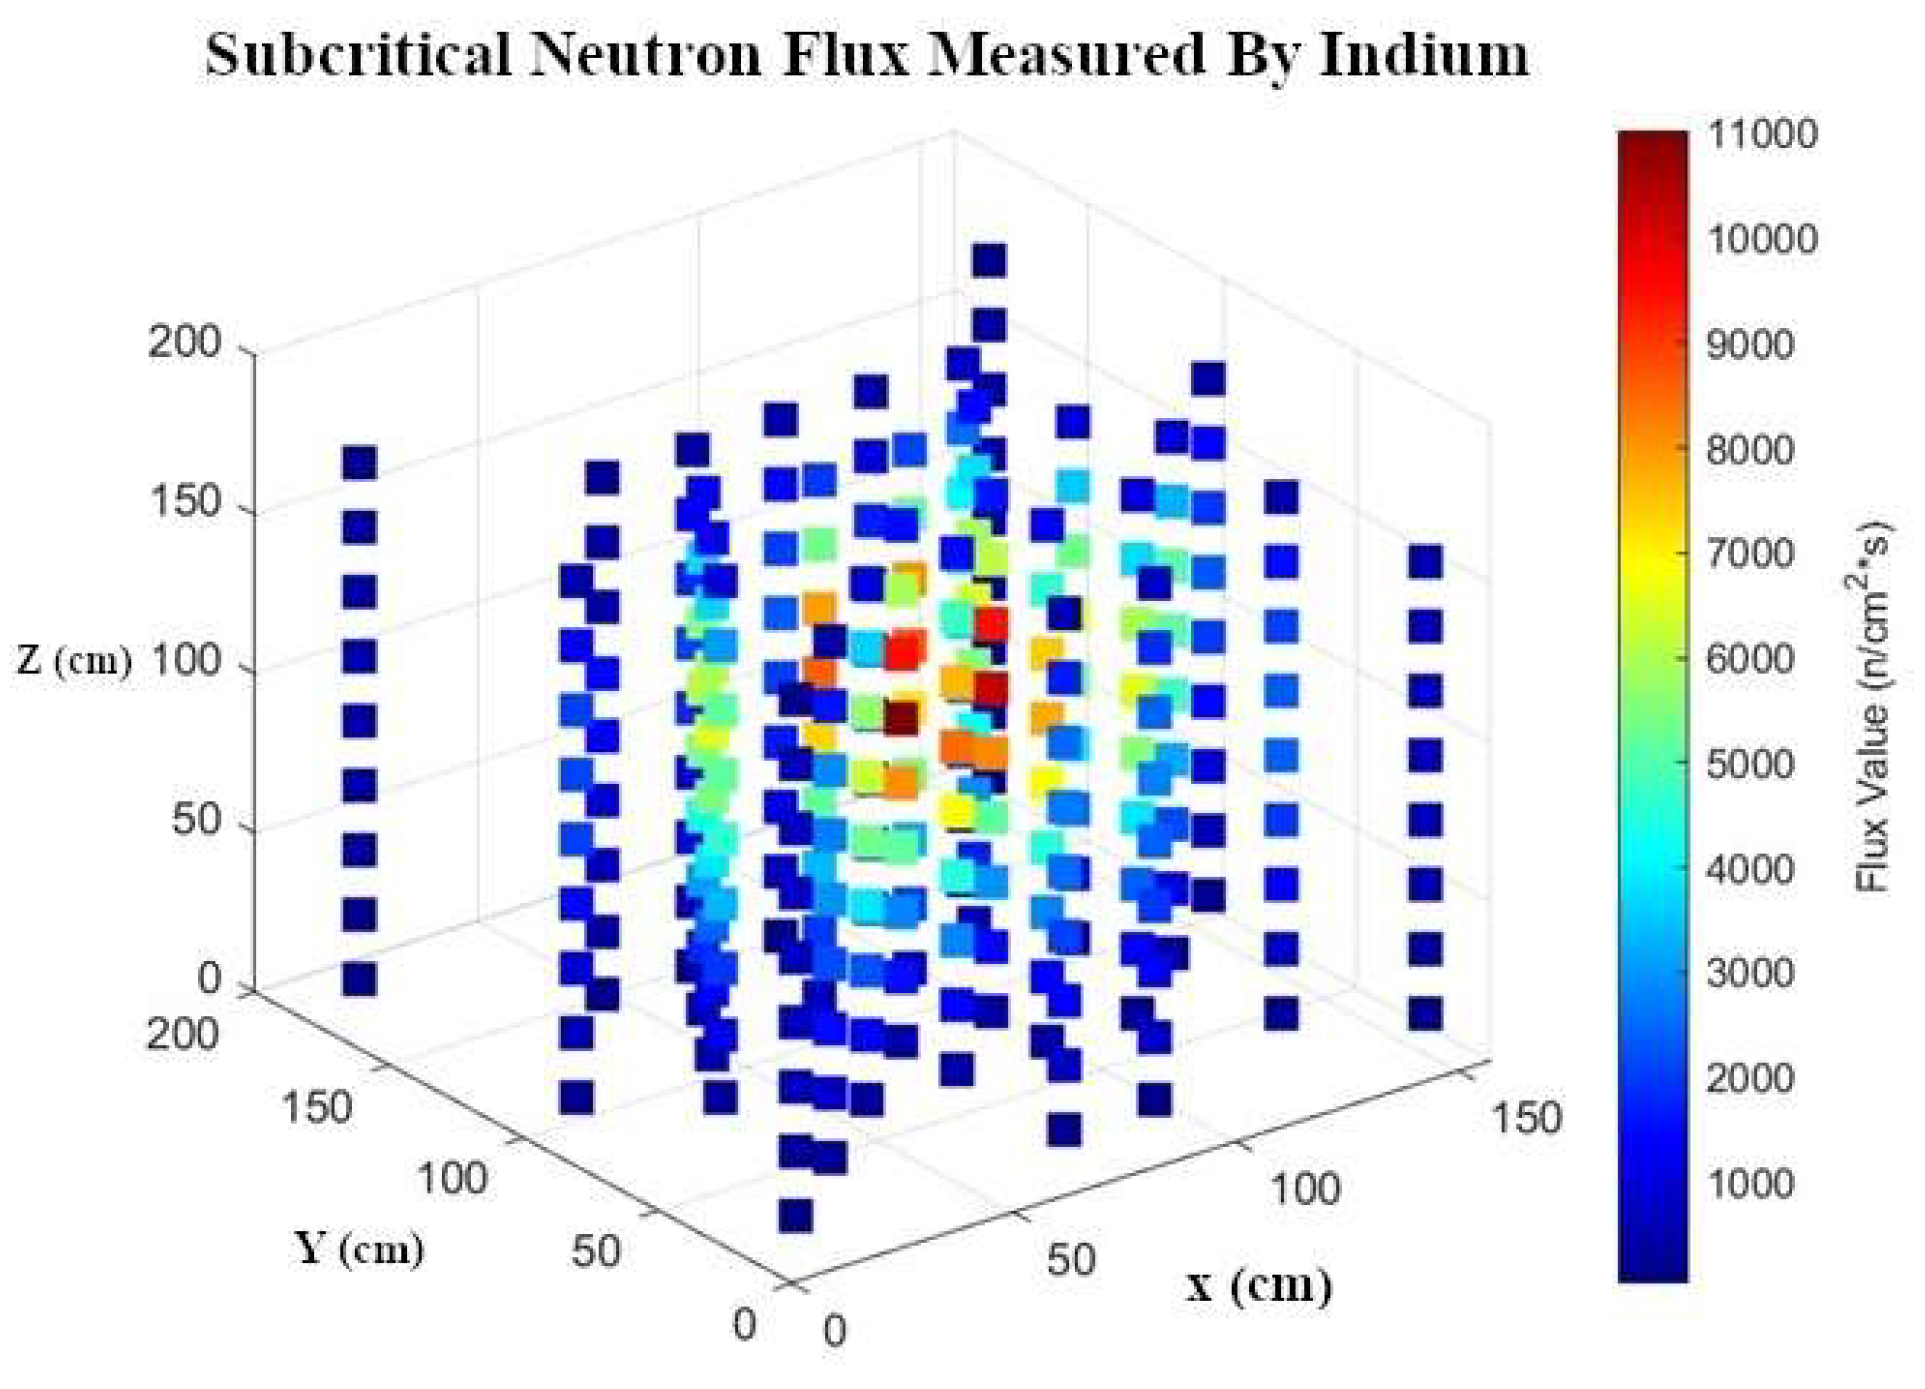
5.6. Complete Pile Volume Neutron Flux via Indium Foils
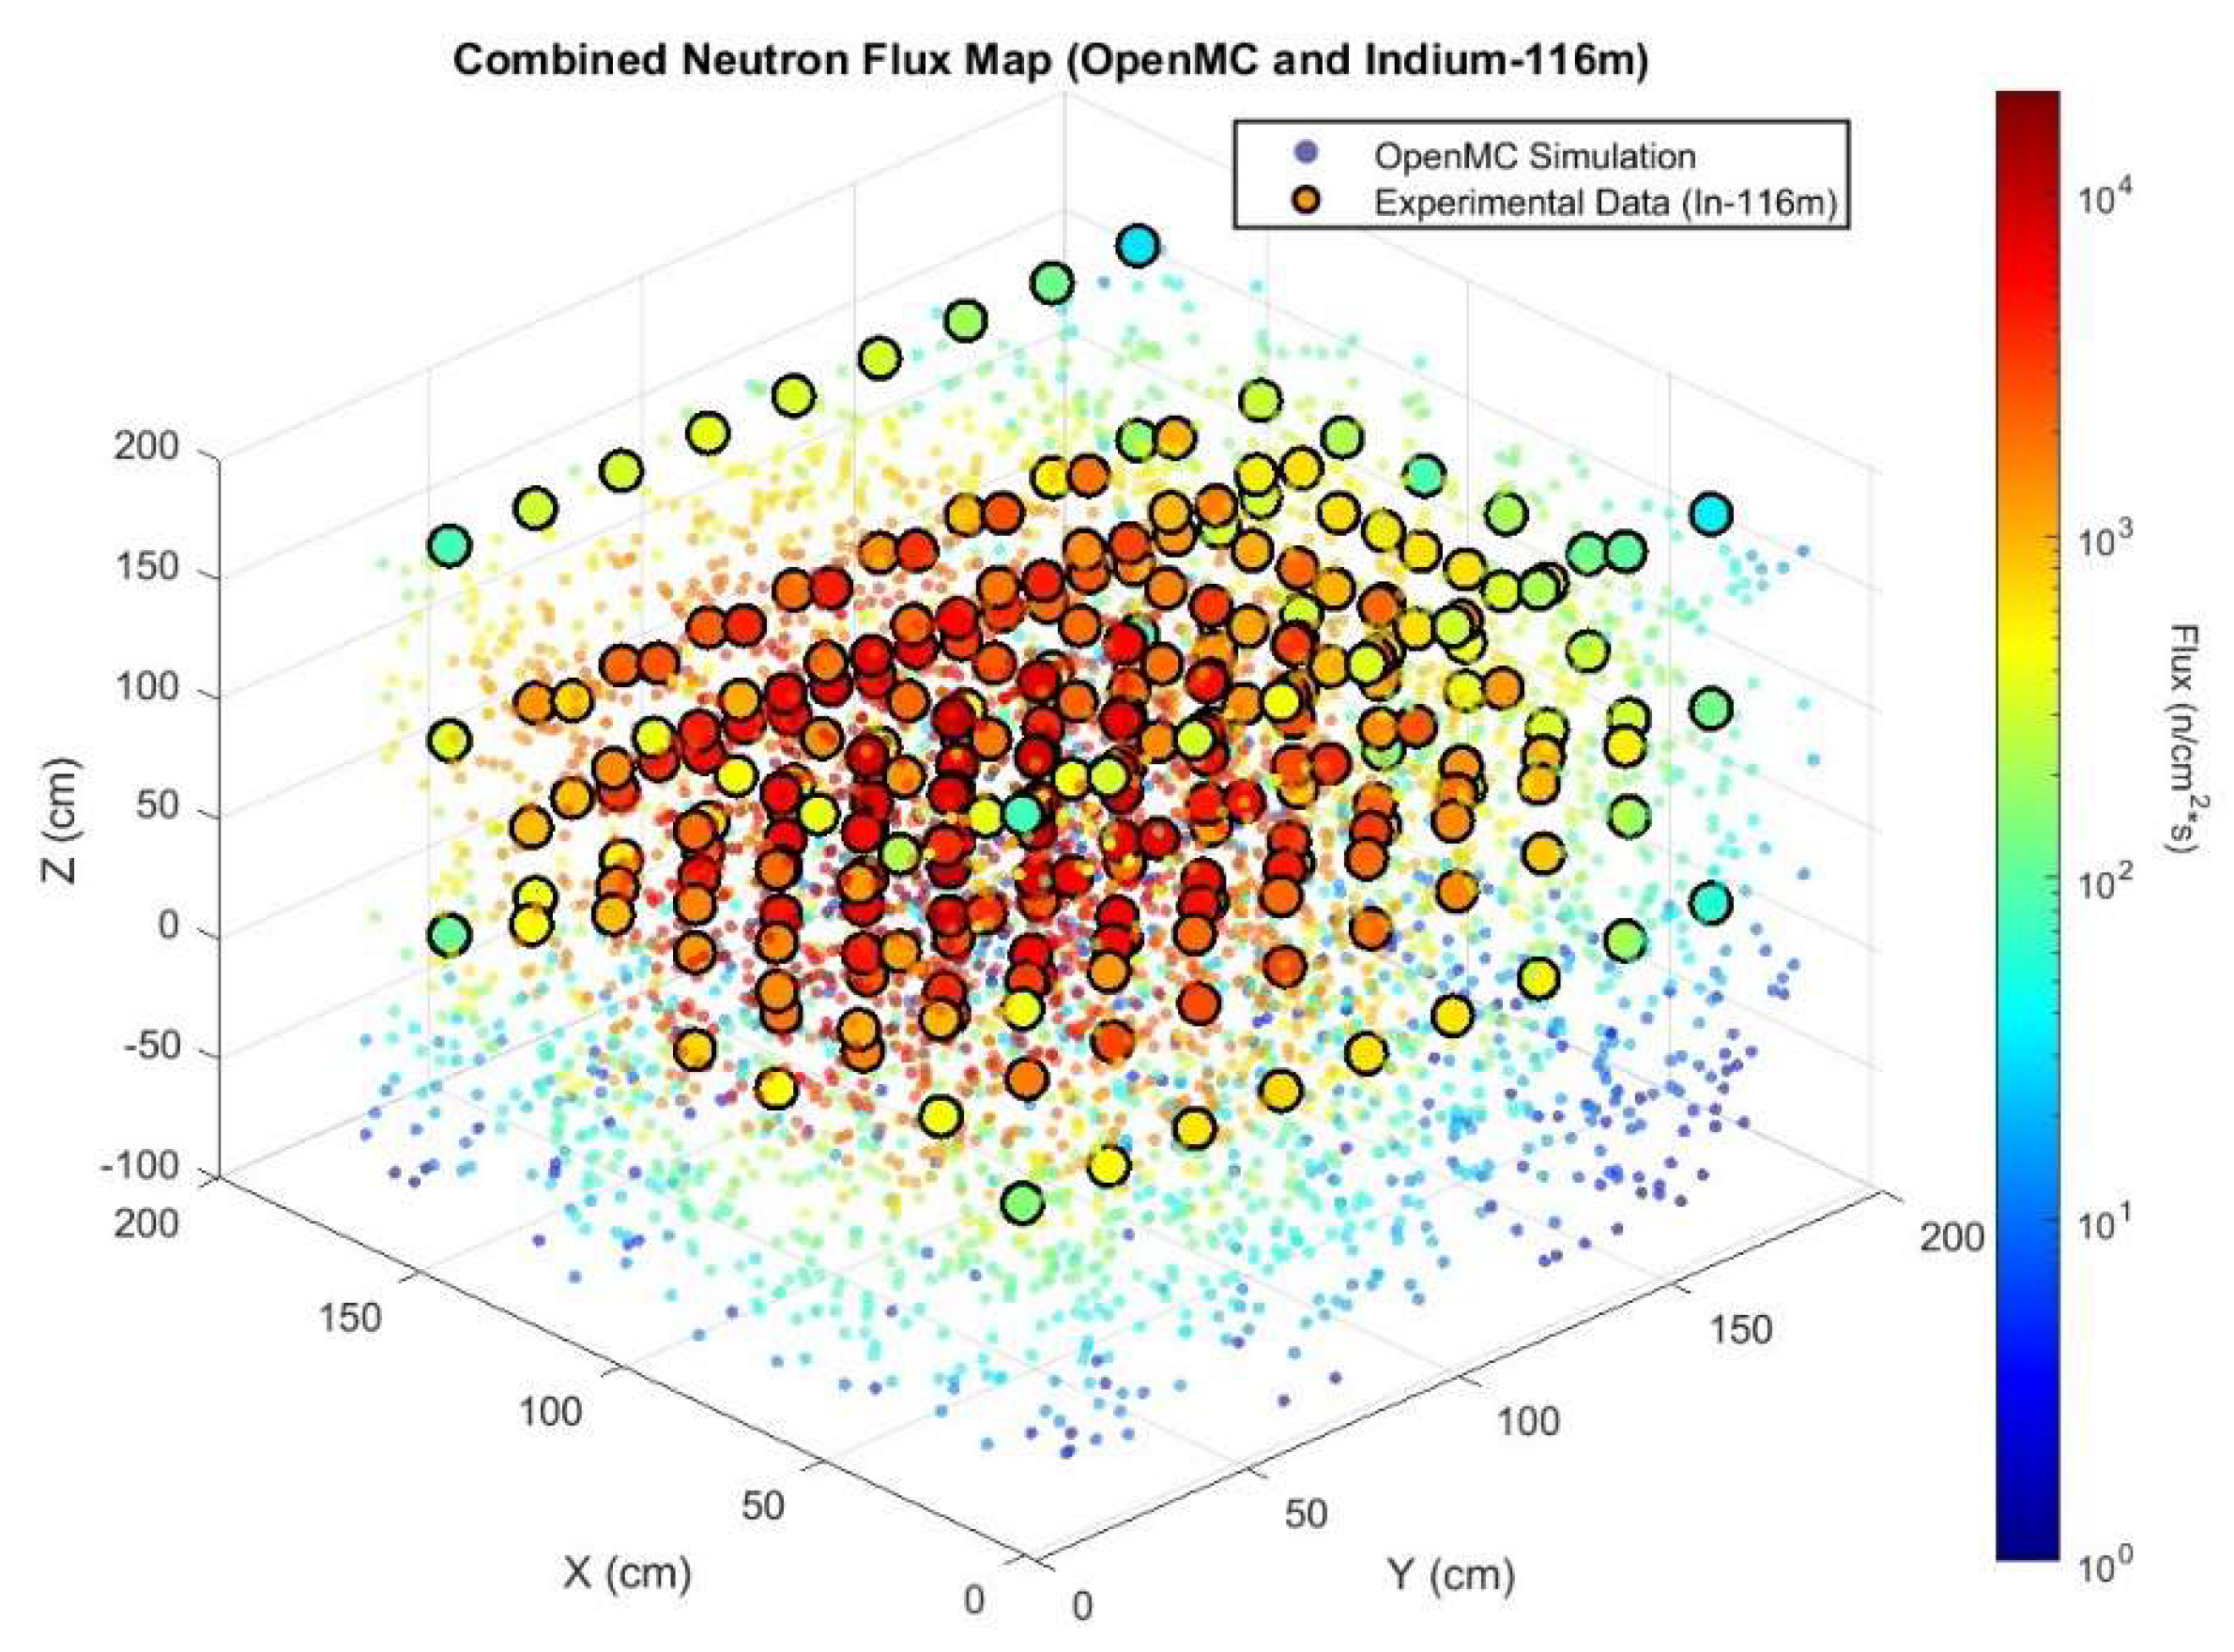
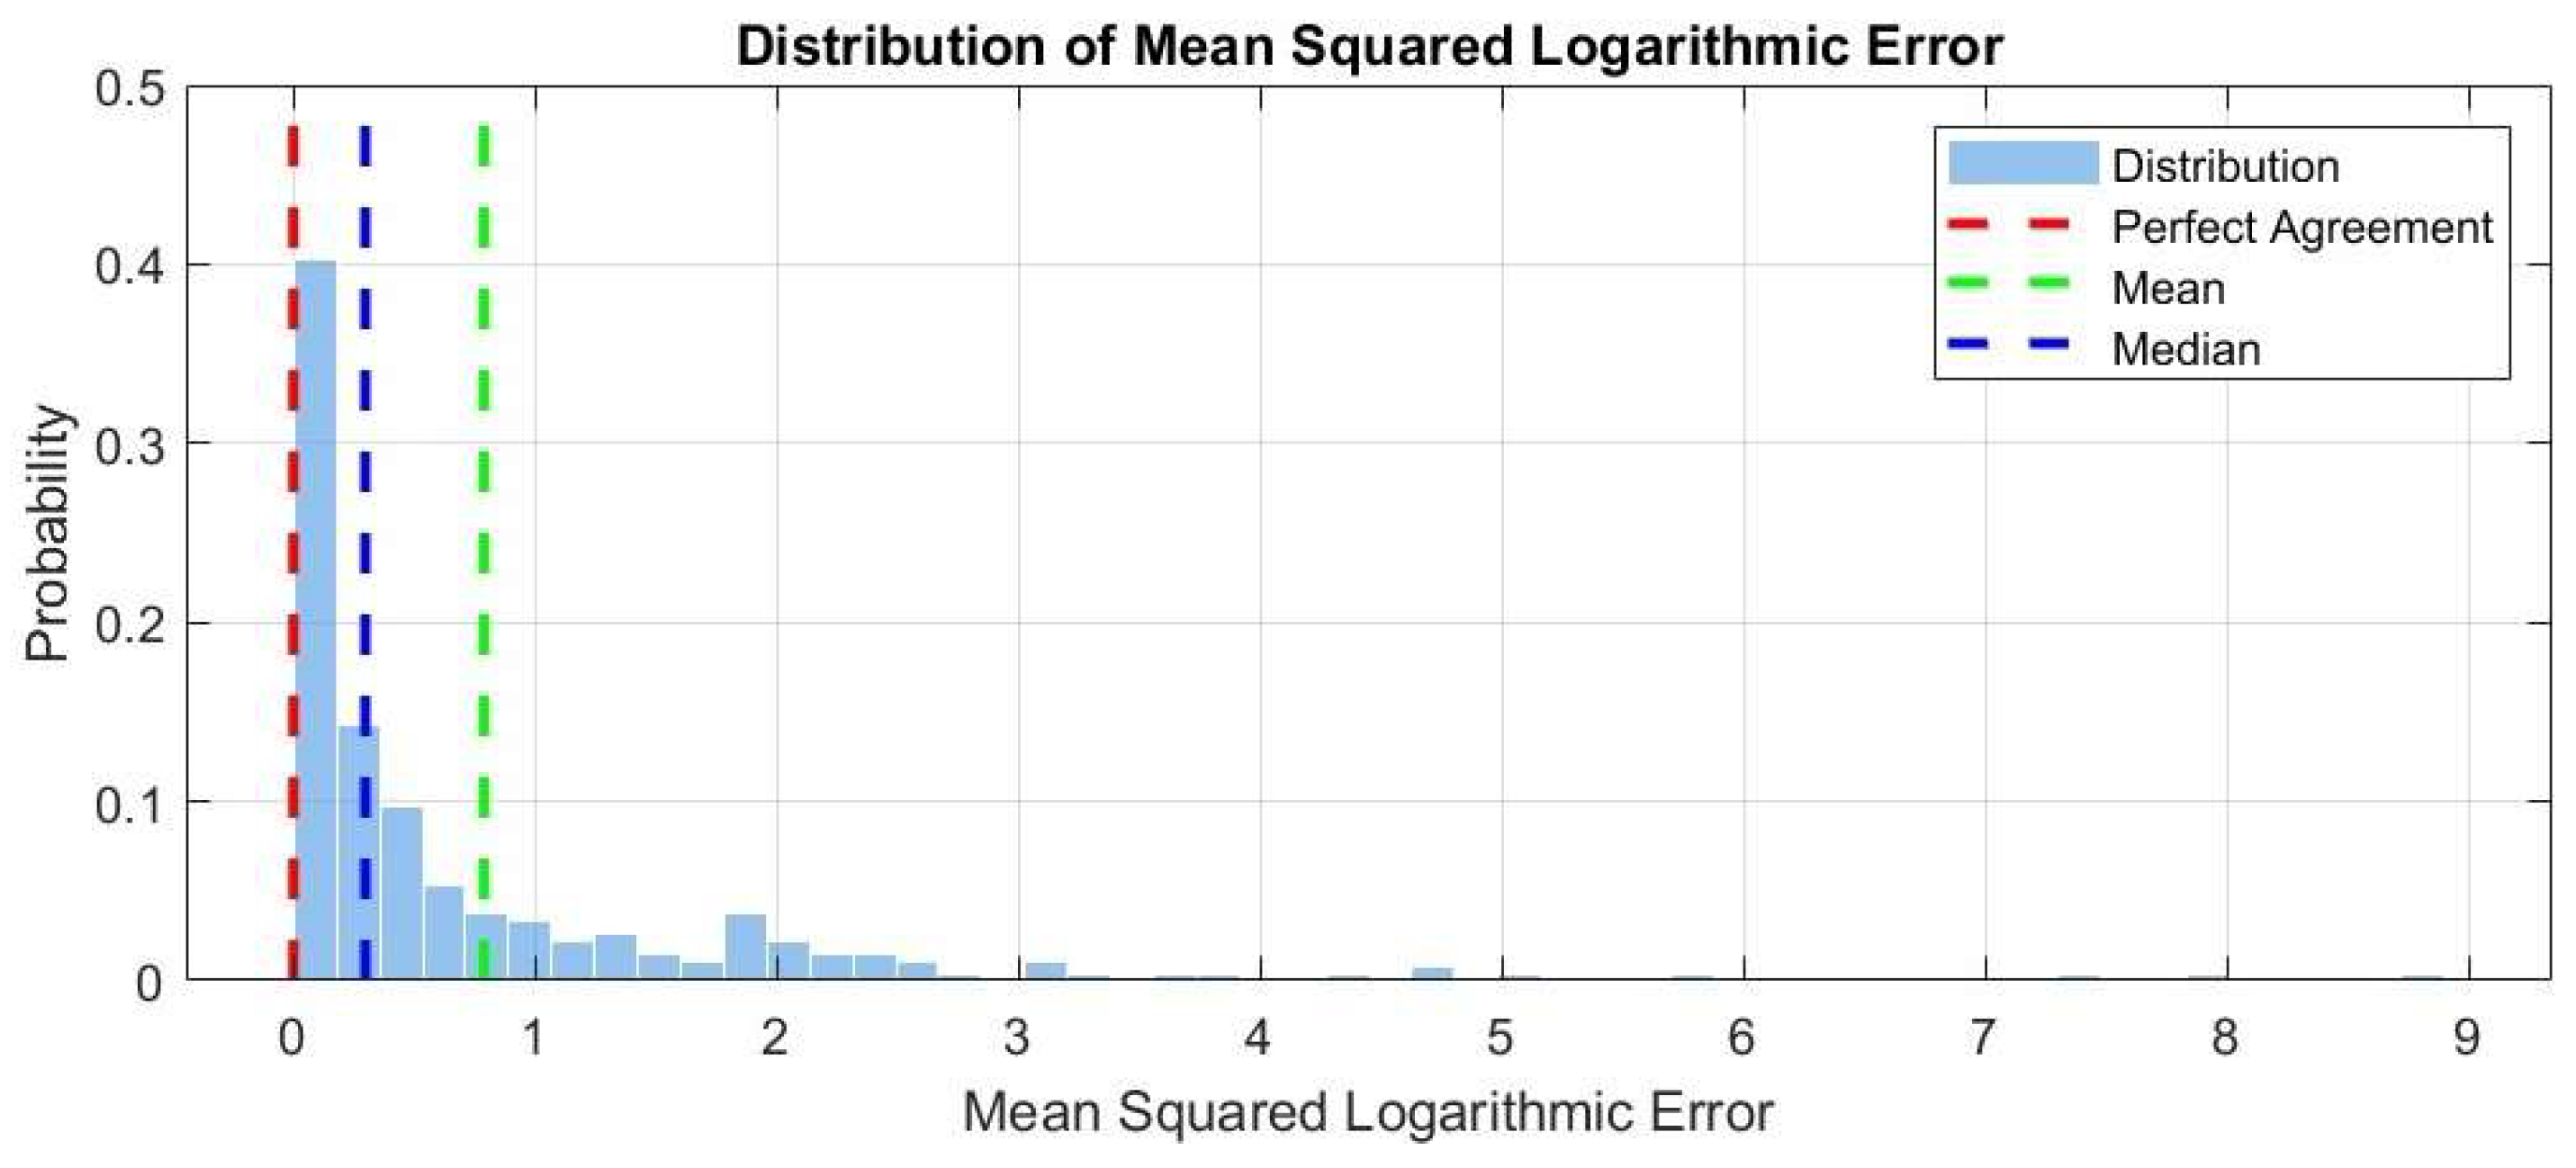
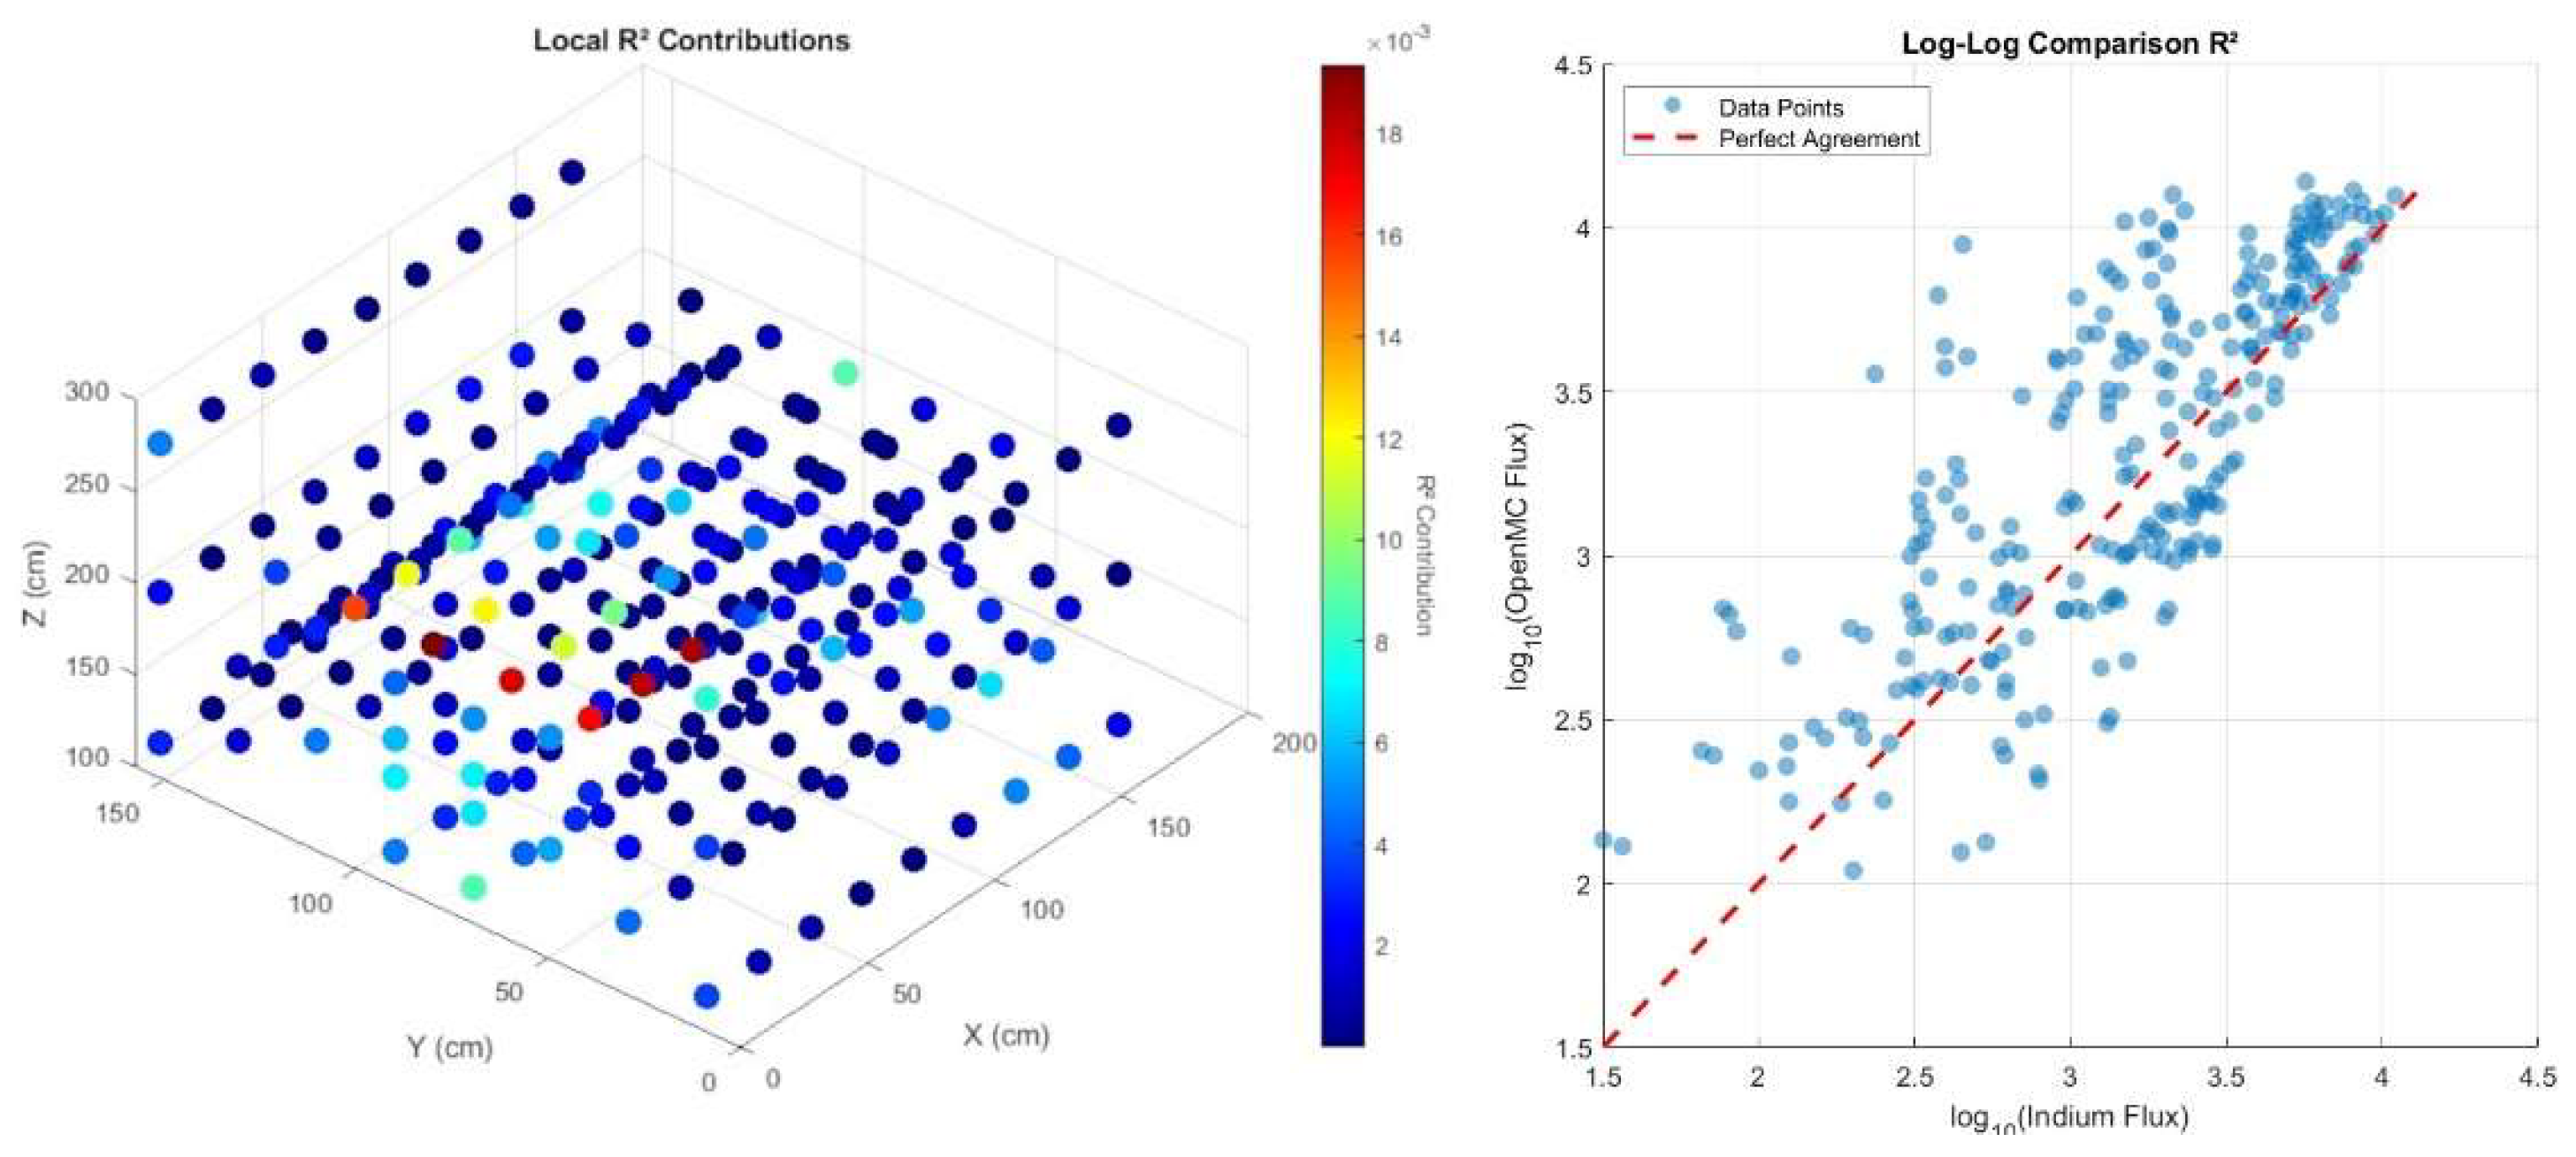
5.7. OpenMC Modeled Pile
6. Discussion
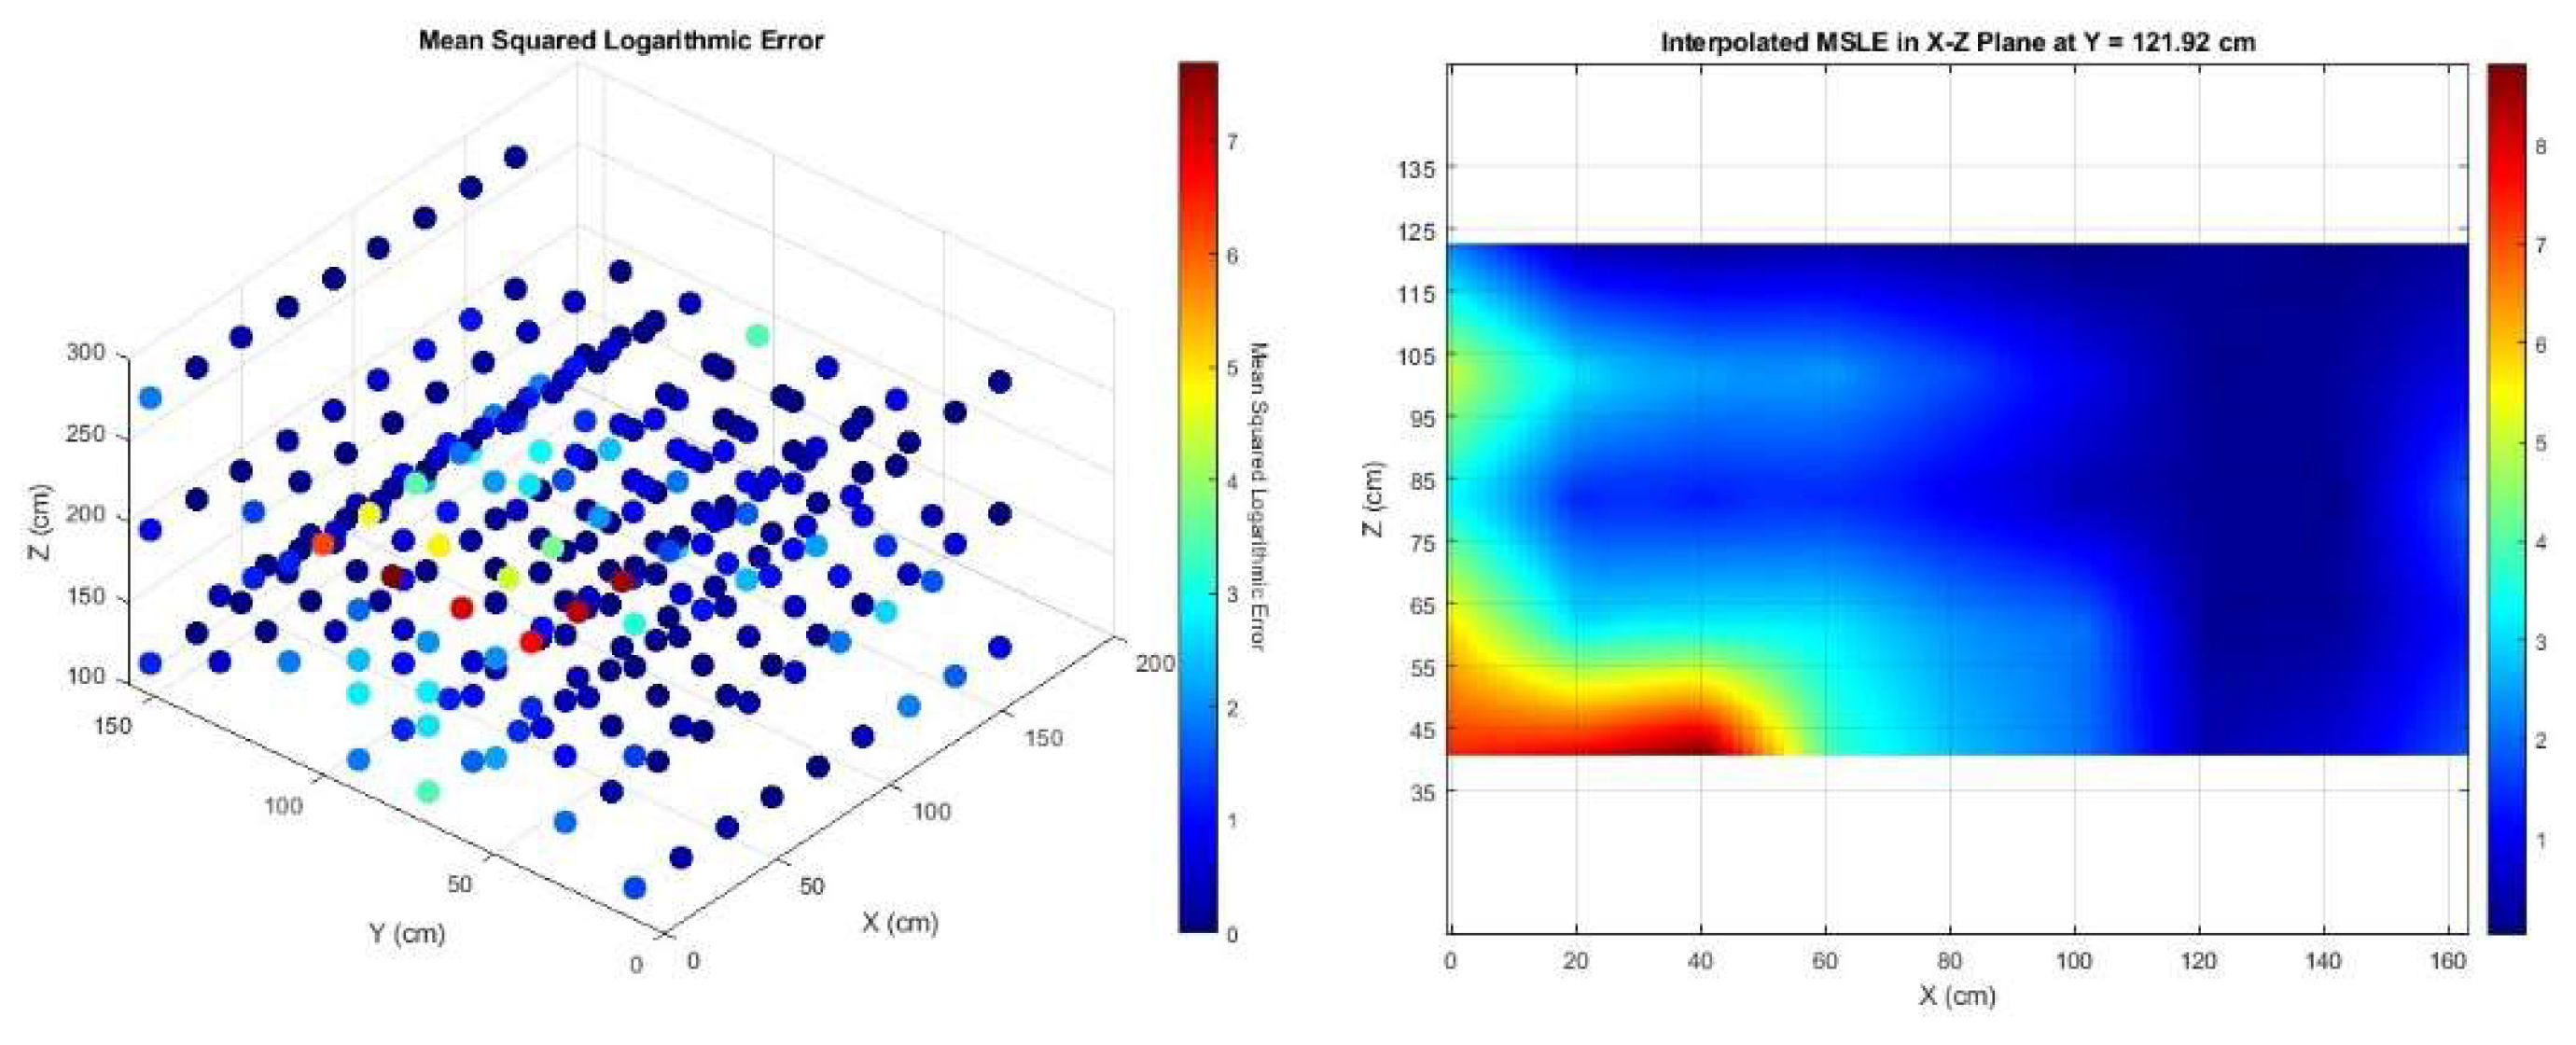
6.1. Subcritical Pile Error Analysis
6.2. Experimental Discussion
7. Conclusions
Author Contributions
Funding
Data Availability Statement
Acknowledgments
Conflicts of Interest
Appendix A

| Energy (keV) | Resolution (%) | Error (%) |
|---|---|---|
| 356 511 662 1173 1332 |
0.89 0.27 0.33 0.37 0.28 |
0.02 0.03 6E-3 0.02 2E-4 |
| Energy (keV) | Resolution (%) | Error (%) |
|---|---|---|
| 356 511 662 1173 1332 |
2.50 0.70 0.70 0.81 0.59 |
0.03 0.06 9E-5 0.03 2E-5 |
References
- Manhattan Project: CP-1 Goes Critical, Met Lab, December 2, 1942 Available online: https://www.osti.gov/opennet/manhattan-project-history/Events/1942-1944_pu/cp-1_critical.htm (accessed on 16 December 2024).
- RRDB Available online: https://nucleus.iaea.org/rrdb/#/home (accessed on 16 December 2024).
- Beck, J.N.; Lamberty, C.M. THERMAL NEUTRON ACTIVATION ANALYSIS—AN IMPORTANT ANALYTICAL TOOL. Applied Spectroscopy Reviews 2002, 37, 19–55, doi:10.1081/ASR-120004372. [CrossRef]
- Kardjilov, N.; Manke, I.; Hilger, A.; Strobl, M.; Banhart, J. Neutron Imaging in Materials Science. Materials Today 2011, 14, 248–256, doi:10.1016/S1369-7021(11)70139-0. [CrossRef]
- Lababsa, D.; Mazrou, H.; Belgaid, M. Performance Evaluation and Validation of OpenMC Code for Criticality Analysis of an MTR-Type Research Reactor. Annals of Nuclear Energy 2024, 206, 110617, doi:10.1016/j.anucene.2024.110617. [CrossRef]
- Vasili, K.; Seda Yilmaz; Matthew M. Niichel; Jonah Lau; Shripad Revankar; Lefteri Tsoukalas; Stylianos; Chatzidakis Exploring Quantitative and Qualitative Machine Learning Methods for Predicting Neutron Flux Values from a Simulated Molten Salt Reactor. In Proceedings of the TRANSACTIONS; Las Vegas, 2024.
- Yu, J.; Wilson, J.; Forget, B.; Dave, A.J.; Sun, K.; Phillips, B. Experimental Validation of a High Fidelity Monte Carlo Neutron Transport Model of the MIT Graphite Exponential Pile. Progress in Nuclear Energy 2022, 152, 104368, doi:10.1016/j.pnucene.2022.104368. [CrossRef]
- Sara Hauptman Characterization of the MIT Graphite Exponential Pile. Bachelor’s thesis, Massachusetts Institute of Technology, 2019.
- Persson, C.-M.; Seltborg, P.; Åhlander, A.; Gudowski, W.; Stummer, T.; Kiyavitskaya, H.; Bournos, V.; Fokov, Y.; Serafimovich, I.; Chigrinov, S. Analysis of Reactivity Determination Methods in the Subcritical Experiment Yalina. Nuclear Instruments and Methods in Physics Research Section A: Accelerators, Spectrometers, Detectors and Associated Equipment 2005, 554, 374–383, doi:10.1016/j.nima.2005.07.058. [CrossRef]
- Xoubi, N. Calculation of the Power and Absolute Flux of a Source Driven Subcritical Assembly Using Monte Carlo MCNP Code. Annals of Nuclear Energy 2016, 97, 96–101, doi:10.1016/j.anucene.2016.07.009. [CrossRef]
- Avelino Santos; Ademir X. Da Silva; Wilson F. Rebello; Victor L. Lassance Cunha Modeling of the CTEx Subcritical Unit Using MCNPX Code.; 2011; pp. 1–6.
- Dranga, R.; Blomeley, L.; Carrington, R. AN MCNP PARAMETRIC STUDY OF GEORGE C. LAURENCE’S SUBCRITICAL PILE EXPERIMENT. AECL Nuclear Review 2014, 3, 91–99, doi:10.12943/ANR.2014.00037. [CrossRef]
- Vega-Carrillo, H.R. Subcritical Nuclear Assembly 2015.
- Maldonado, G.I.; Xoubi, N.; Zhao, Z. Enhancement of a Subcritical Experimental Facility via MCNP Simulations. Annals of Nuclear Energy 2008, 35, 263–268, doi:10.1016/j.anucene.2007.06.022. [CrossRef]
- Bren Phillips; Jarod Wilson; Jiankai Yu; Andrea M. Molina-Dejesus; Benoit Forget; Akshay J. Dave; Kaichao Sun Demonstrating Autonomous Control Framework Using Graphite Exponential Pile; 2022; pp. 2–39;.
- Patrick Joseph O’Neal Comparison of 233U Production by Thorium Irradiation in Heavy Water Reactor and Accelerator-Driven Subcritical Pile. Master of Science, Texas A&M, 2020.
- Radaideh, M.I.; Jarrah, I.; Malkawi, S.; Khateeb, A.; Al-Issa, I. Reactivity and Flux Characterization of the Jordan Subcritical Assembly. Progress in Nuclear Energy 2018, 108, 43–53, doi:10.1016/j.pnucene.2018.05.003. [CrossRef]
- Asuncion-Astronomo; Marquez, J.M.; Olivares, R.U.; Romallosa, K.M.D. Utilizing the Philippine Research Reactor-1 TRIGA Fuel in a Subcritical Assembly; International Atomic Energy Agency (IAEA), 2020;
- Niichel, M. Development Of An Electronics Testbed For Radiation Testing In Gamma And Neutron Environments, Purdue University: West Lafayette, IN, 2024.
- Lewis, E.E. Fundamentals of Nuclear Reactor Physics; Academic Press: Amsterdam ; Boston, 2008; ISBN 978-0-12-370631-7.
- E10 Committee ASTM International. Test Method for Determining Thermal Neutron Reaction Rates and Thermal Neutron Fluence Rates by Radioactivation Techniques; DOI: 10.1520/E0262-17. [CrossRef]
- Sirakov; Kopecky; Young Au-197 (N,Tot).
- MUGHABGHAB Cd-113 (N,Tot) 2010.
- Abolaban, F.A.; Alawi, M.A.; Taha, E.M.; Elmoujarkach, E.; Banoqitah, E.M.; Alhawsawi, A.M.; De Maio, P.; Lopopolo, G.; Tolomeo, A.; Dimiccoli, V.; et al. ESTIMATION OF THERMAL & EPITHERMAL NEUTRON FLUX AND GAMMA DOSE DISTRIBUTION IN A MEDICAL CYCLOTRON FACILITY FOR RADIATION PROTECTION PURPOSES USING GOLD FOILS AND GATE 9. Radiation Protection Dosimetry 2021, 193, 176–184, doi:10.1093/rpd/ncab034. [CrossRef]
- 0751 - H122 - Basic Health Physics - 25 - Neutron Sources, US NRC, September 29, 2011. Available online: https://www.nrc.gov/docs/ml1122/ML11229A704.pdf.
- D.A. Brown, M.B. Chadwick, R. Capote, A.C. Kahler, A. Trkov, M.W. Herman, A.A. Sonzogni, Y. D non, A.D. Carlson, M. Dunn, et al., ENDF/B-VIII.0: The 8th Major Release of the Nuclear Reaction Data Library with CIELO-project Cross Sections, New Standards and Thermal Scattering Data. Nuclear data sheets; 2018; 148, pp.: 3-142.
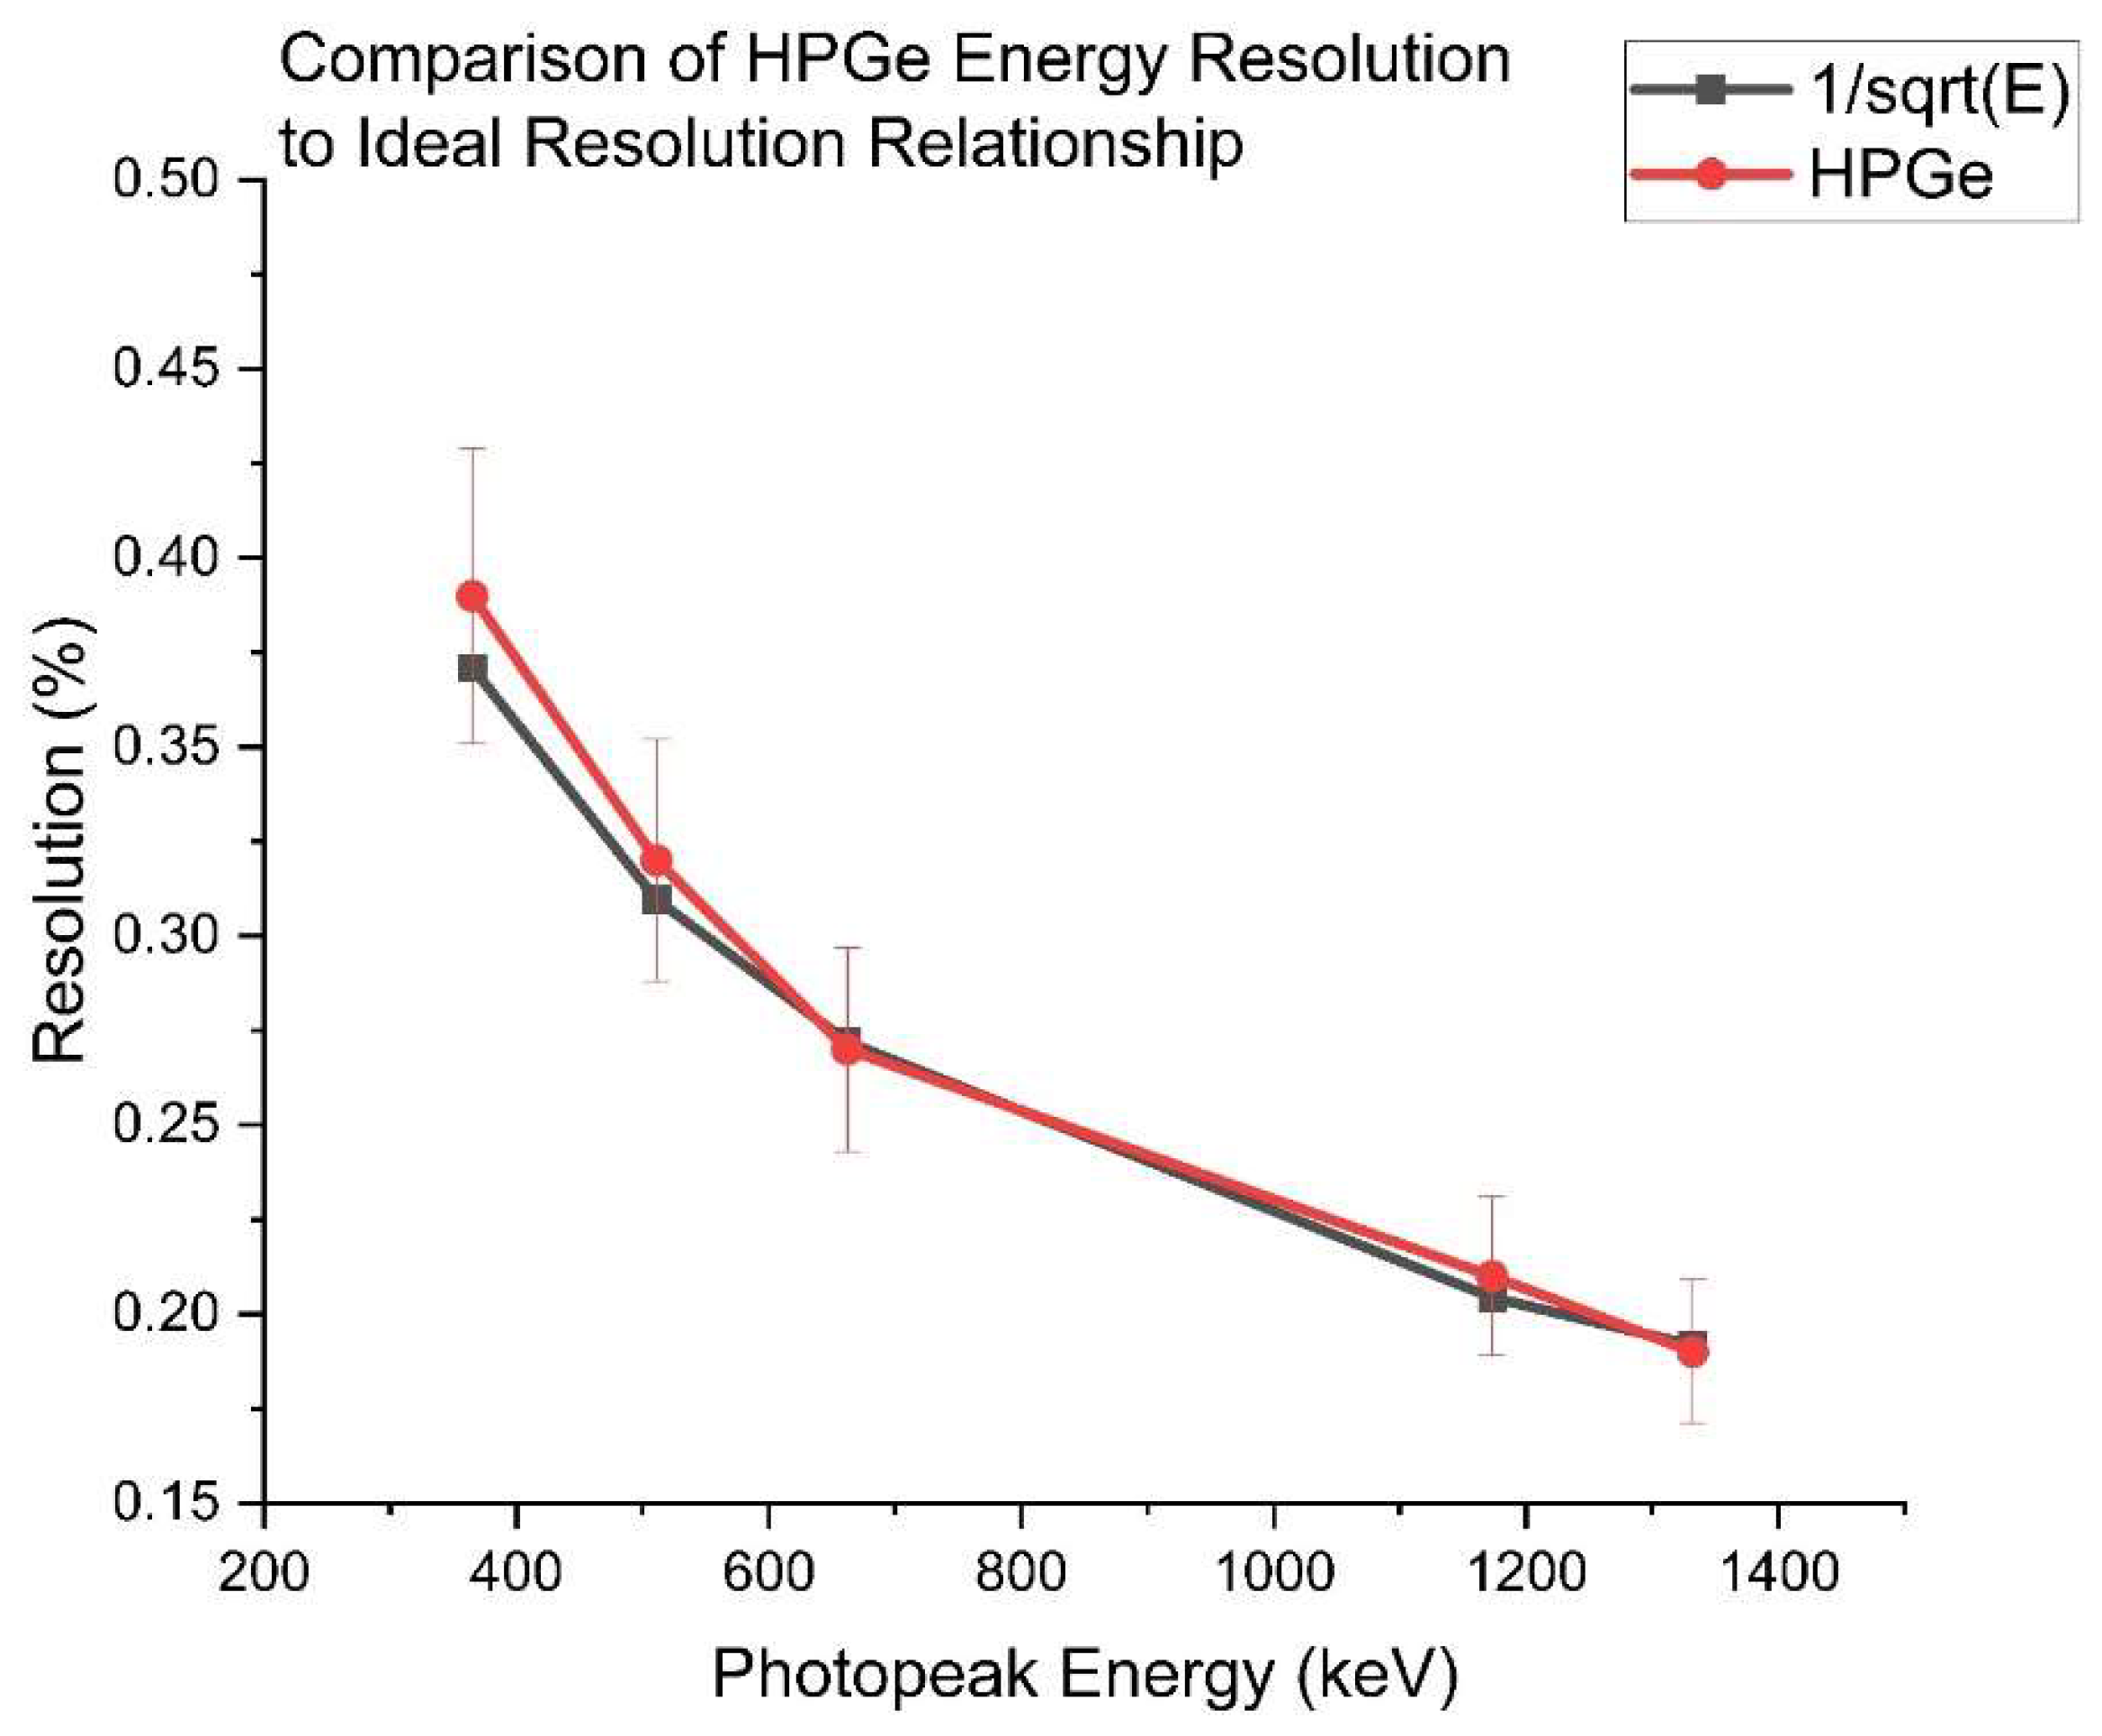

| Energy (keV) | Resolution (%) | Error1 |
| 356 (Ba-133) 511 (Na-22) 662 (Cs-137) 1173 (Co-60) 1332 (Co-60) |
0.39 0.32 0.27 0.21 0.19 |
0.038 0.030 0.027 0.022 0.017 |
| Energy (keV) | Efficiency (ε) | Branching Ratio |
|---|---|---|
| 416.9 | 7.22E-02 | 0.272 |
| 1097.2 | 2.78E-02 | 0.585 |
| 1293.56 | 2.24E-02 | 0.848 |
| Characteristic | Flux (n/cm^2*s) | Coordinates |
|---|---|---|
| Thermal Flux (Pile) | 1.32E+04 | (-29.91, 52.24, -31.05) |
| Thermal Flux (Testbed) | 6.66E+03 | (0.0, 53.0, -30.53) |
| Epithermal Flux (Pile) | 1.03E+04 | (-29.91, 52.24, -31.05) |
| Epithermal Flux (Testbed) | 3.95E+03 | (0.0, 53.0, -34.12) |
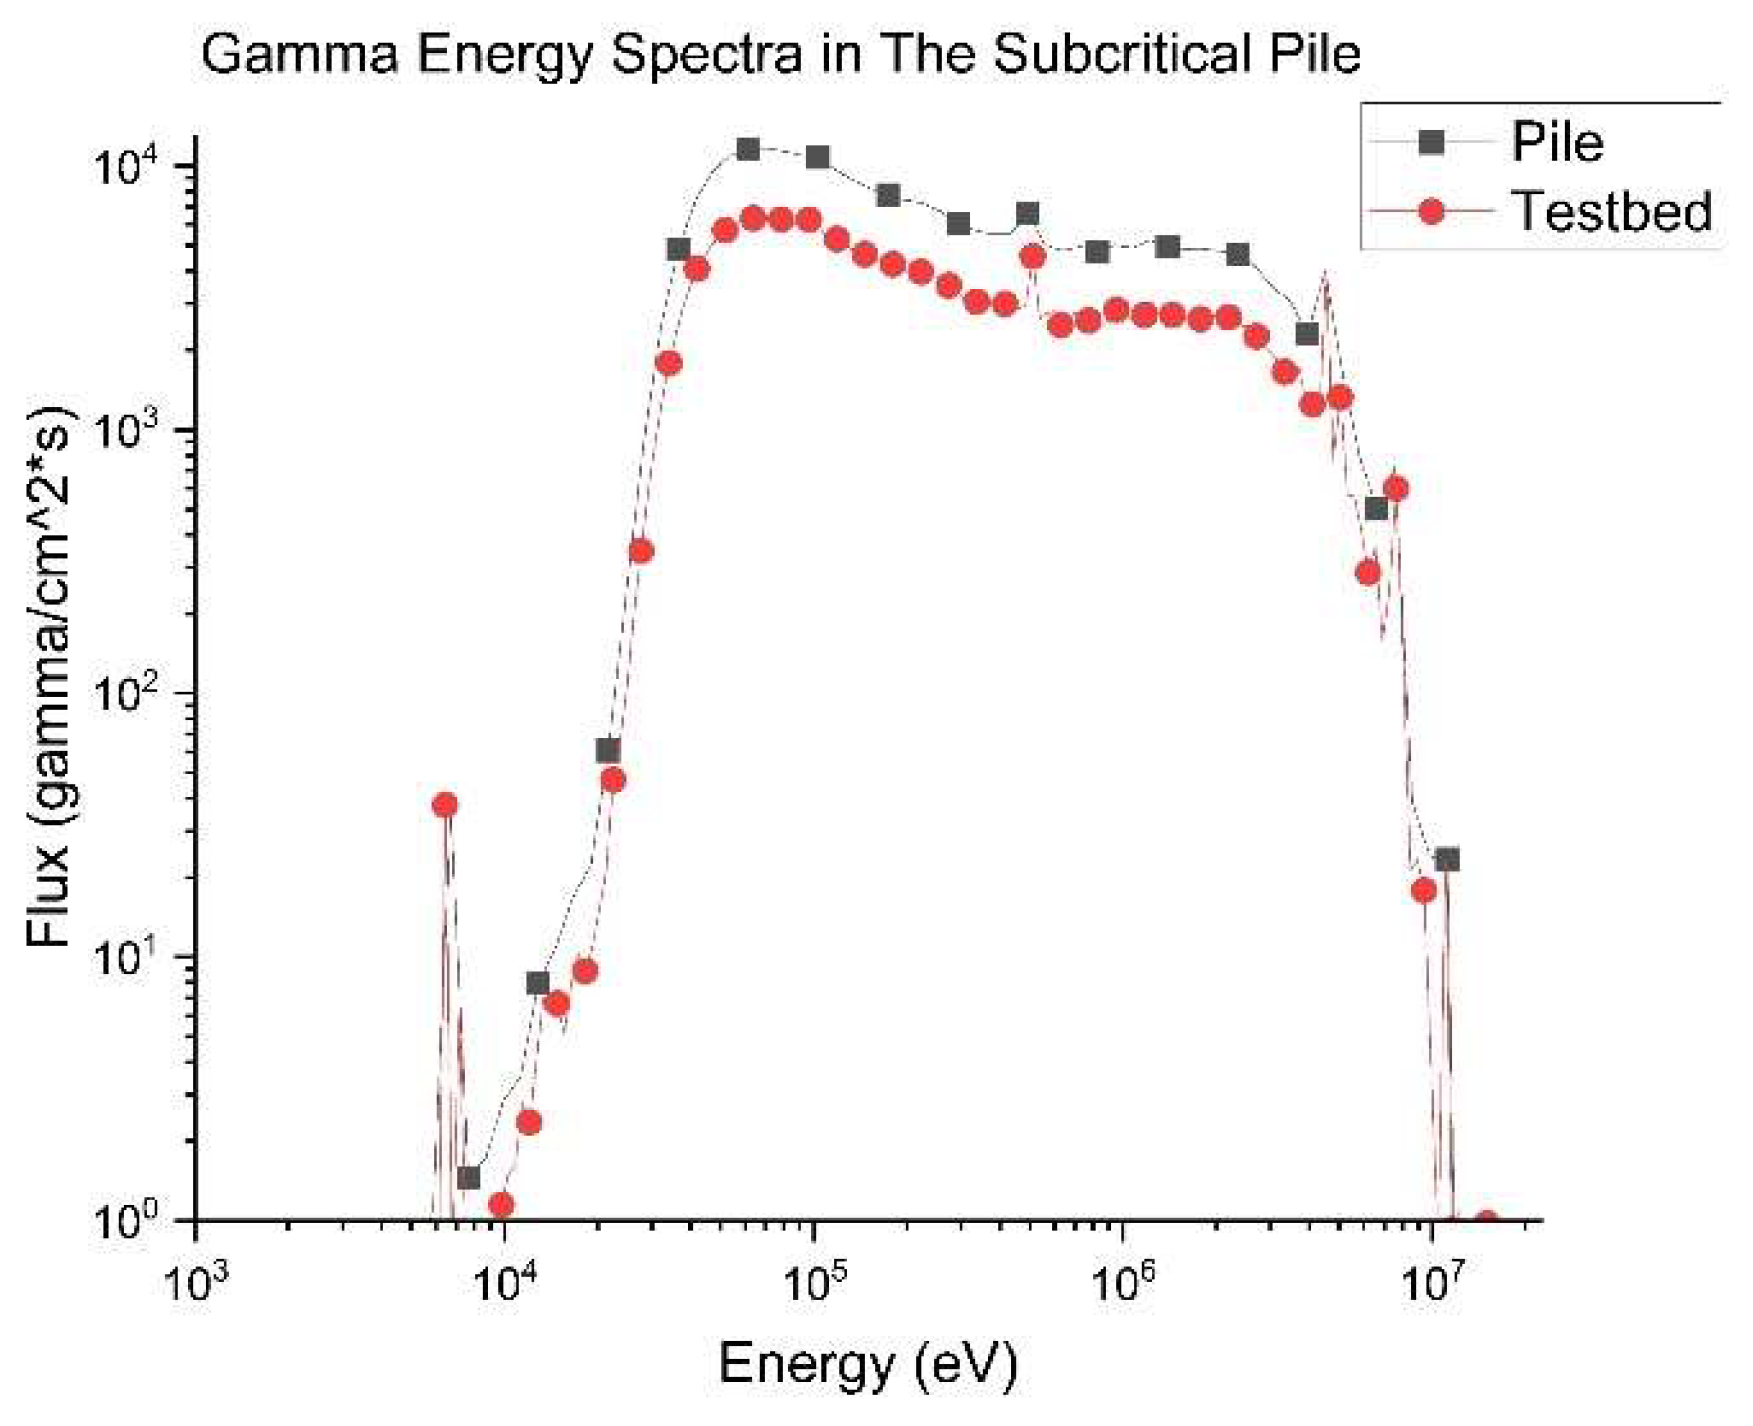
| Gamma Flux (Pile) | 1.18E+04 | (-29.91, 52.24, -31.05) |
| Gamma Flux (Testbed) | 5.96E+03 | (0.0, 65.0, -34.12) |
| Total Neutron Flux (Pile) | 2.43E+04 | (-29.91, 52.24, -31.05) |
| Characteristic | Energy (MeV) |
|---|---|
| Neutron Energy (Pile) | 1.70E+01 |
| Gamma Energy (Pile) | 1.44E+01 |
Disclaimer/Publisher’s Note: The statements, opinions and data contained in all publications are solely those of the individual author(s) and contributor(s) and not of MDPI and/or the editor(s). MDPI and/or the editor(s) disclaim responsibility for any injury to people or property resulting from any ideas, methods, instructions or products referred to in the content. |
© 2025 by the authors. Licensee MDPI, Basel, Switzerland. This article is an open access article distributed under the terms and conditions of the Creative Commons Attribution (CC BY) license (http://creativecommons.org/licenses/by/4.0/).


