1. Introduction
Pursuing optimal visual outcomes following cataract surgery remains a cornerstone of modern ophthalmology [
1]. Central to this objective is the precise calculation of intraocular lens (IOL) power, which is instrumental in determining the refractive outcome post-surgery. Given the growing demand for visual restoration with minimal dependence on corrective eyewear, particularly in advancing age-related cataract and refractive surgery, achieving high accuracy in IOL power prediction is paramount [
2]. However, despite significant advancements in biometric measurements and computational algorithms, variability in refractive outcomes continues to pose a challenge, underscoring the complexity of IOL power calculations [
3].
The accuracy of IOL power predictions is influenced by many factors, including, but not limited to, corneal curvature, axial length (AL), anterior chamber depth (ACD), and the selection of the IOL formula itself. Subject to biological and measurement-related uncertainties, these parameters can significantly impact the refractive outcomes achieved postoperatively [
4]. Numerous studies have sought to refine and validate the various IOL power calculation formulas [
5,
6,
7]. However, discrepancies between predicted and actual postoperative refraction persist, indicating the need for continued innovation and scrutiny in this field [
8,
9].
ARGOS ® (Movu, a Santec company) incorporates Swept-Source Optical Coherence Tomography (SS-OCT) technology and is used to measure key parameters of the eye, including AL, prior to cataract surgery. This allows AL calculations to be adjusted according to the variability in the length of each segment. Argos is pre-programmed with the Barrett Universal II (BU II) formula, which is an updated version of the Barrett Universal I formula [
10].
The original Ladas Super Formula (LSF) 1.0 incorporated axial length adjustment along the Wang-Koch axis and was composed of elements derived from the Hoffer Q, Holladay 1, and SRK/T formulas. It has been demonstrated that employing multiple formulas to select the most accurate one for a specific eye improves outcomes [
11].
The LSF v1.0b builds upon the framework of version 1.0. It integrates AI-assisted learning into the calculations to predict refractive error more accurately. These calculations are based on three input variables: AL, corneal power, and ACD [
12].
This study aims to analyze the results comprehensively by reviewing established and newer techniques. It will contribute to the ongoing discourse on optimizing refractive prediction models, which is central to achieving superior visual outcomes for patients undergoing refractive lens exchange procedures or cataract surgeries.
2. Materials and Methods
2.1. Study Population
The eyes included in the study were evaluated based on various criteria, and a total of 210 eyes which met these criteria were included in the research.
2.2. Power Analysis
The sample size for the study was determined through a power analysis. With an effect size of d=0.75, Power (1-β)=0.90, and an allocation ratio of 1, the minimum sample size was calculated to be equal in each group with a minimum of 93.
2.3. Study Design and Participants
Our study is a retrospectively designed observational research study. The refractive achieved following successful surgeries were analyzed within the scope of this investigation. The study was conducted between July 2021 and June 2024 in the Department of Ophthalmology at the Victor Babes University of Medicine and Pharmacy in Timisoara, Romania. All participants underwent a thorough ophthalmological examination before the surgical procedure. The study included individuals who had experienced successful IOL implantation to correct refractive errors or cataracts. The same individual conducted the measurements within a single session. Three measurements were taken, and their averages were used for analysis. In measuring the lens power, values were obtained using BU II and LSF formulas. These values were compared. Postoperative assessments were conducted at 1-3 months, and 3-12 months including spherical equivalent (SE). Postoperative analyses were performed on SE basis at 1-3 months, and 3-12 months. The frequencies of the eyes being within ±1.00 diopters and ±0.50 diopters were also calculated during the evaluation of SE values. Participants who did not return for follow-up at these dates were excluded from the study.
2.4. Exclusion Criteria
- -
History of ocular trauma
- -
Previous ocular surgeries
- -
AL measurements <21 mm or >26 mm
- -
Corneal or vitreous opacities
- -
Dry eye syndrome
- -
Retinal pathologies
- -
Glaucoma, or nystagmus.
- -
Participants who did not return for follow-up.
2.5. Surgical Procedure
The surgical procedure performed on the eyes involved a main incision made at an angle of 110 degrees, with an incision width of 2.2 mm. The first and second side incisions were created at angles of 30 degrees and 160 degrees, respectively, with each having an incision width of 1.2 mm. The study utilized monofocal, EDOF (Extended Depth of Focus), and trifocal lenses. The most commonly used brands were Alcon (Alcon Laboratories, Inc., Fort Worth, TX, USA), ZEISS (Carl Zeiss Meditec, Jena, Germany), and Johnson & Johnson (Basel, Switzerland).
2.6. ARGOS
The ARGOS SS-OCT device is a spectral-domain optical coherence tomography system that operates at a wavelength of 1060 nm, with a bandwidth of 20 nm and an A-scan rate of 3000 scans per second. It provides two-dimensional OCT imaging capabilities. Keratometry (K) is measured using a ring of 16 LEDs with a diameter of 2.2 mm. The device employs a corneal refractive index of 1.3375. The corneal diameter is measured based on the OCT image, which is further utilized as a reference to calculate the white-to-white (WTW) value under the guidance of Alcon's imaging system. Central corneal thickness (CCT), ACD, Lens Thickness (LT), and AL are measured using OCT, taking into account distinct refractive indices for each medium: cornea (1.376), aqueous and vitreous humor (1.336), and lens (1.410).
2.7. Examined Variables
- -
Gender
- -
Age of the participants
- -
AL
- -
ACD
- -
LT
- -
WTW
- -
K (flat and steep),
- -
SE.
2.8. Groups
- -
Group 1: The BU II formula. The most current version registered in the Argos device was used on the scheduled date of surgery.
- -
Group 2: The LSF formula used in this study was accessed from the latest version of the website [
13].
2.9. Ethics
The ethical approval for this study was obtained from the Ethics Committee of the Victor Babes University of Medicine and Pharmacy in Timisoara, Romania. All stages of the study were conducted in accordance with the principles outlined in the Declaration of Helsinki.
2.10. Statistical Analysis
Statistical analyses were conducted using SPSS version 25 (IBM Corp., Armonk, NY, USA). Descriptive statistics have been presented, including count, percentage, mean ± standard deviation, median, minimum, and maximum values. The normality of the data was assessed using the Kolmogorov-Smirnov test. Statistical relationships between group means were analyzed through the Student's t-test. Potential correlations were examined using Pearson correlation analysis. A p-value of less than 0.05 was considered the threshold for statistical significance.
3. Results
In our study, 210 eyes were examined. The mean age of the participants was 63.44±11.62 years. The youngest participant was 39, while the oldest was 91. Demographic data of the participants and measurement results obtained from ARGOS are presented in
Table 1.
The study's two most frequently used lens brands were ALCON and ZEISS. The subtypes of ALCON lenses included monofocal, EDOF, and trifocal lenses, of which mono-focal lenses were the most commonly used. For ZEISS lenses, monofocal and multifocal subtypes were employed, with mono-focal lenses being more frequently utilized compared to multifocal lenses (
Table 2).
The lens powers calculated using the BU II and LSFs were compared. The means of the two calculations were found to be very close, and no statistically significant difference was observed between them (
Table 3).
A potential correlation between the BU II and LSFs was analyzed using Pearson correlation analysis. The results showed that there was no statistically significant correlation between the data obtained from the two formulas (
Table 4).
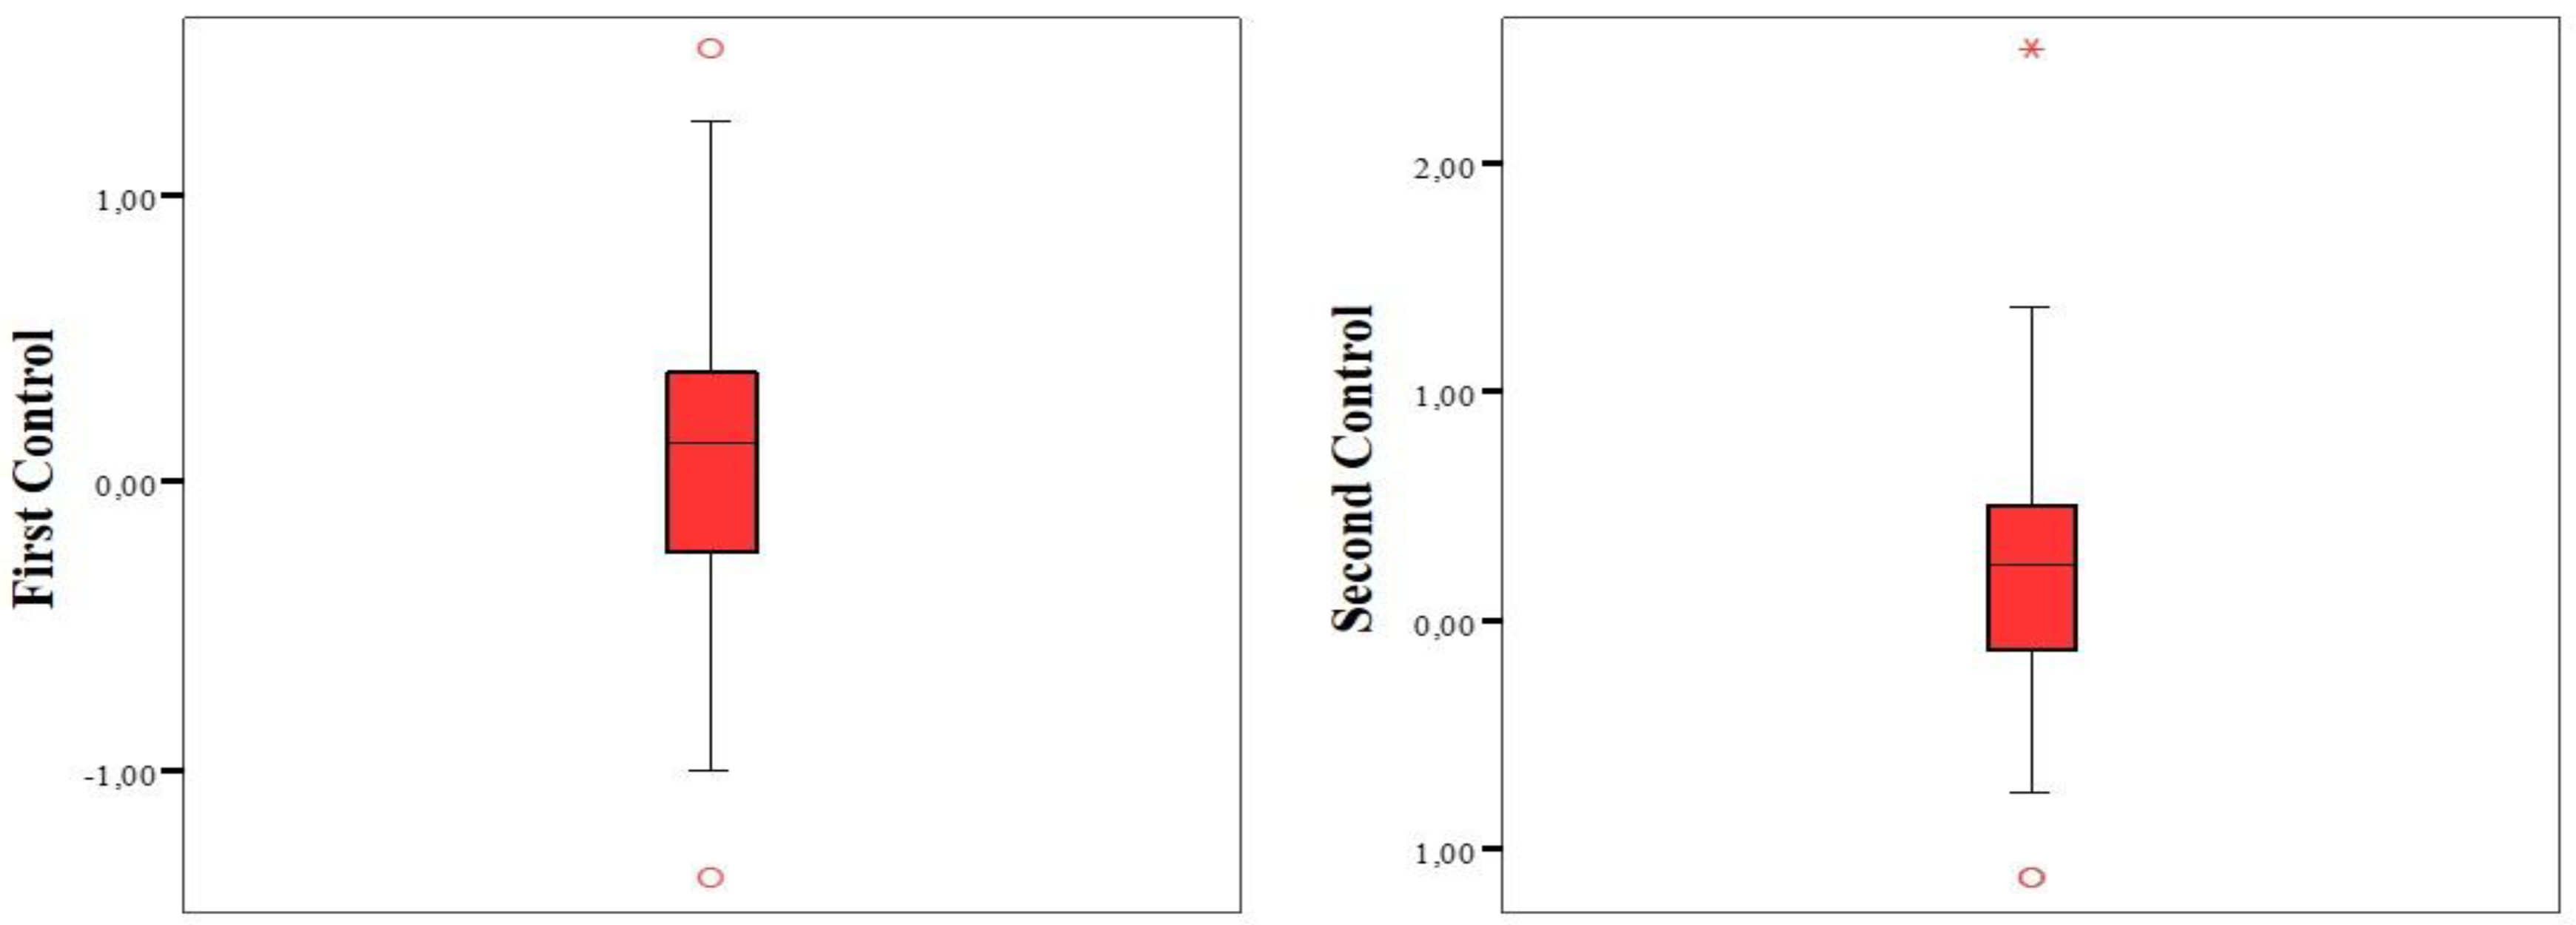
We compared the SE values calculated during the participants' first and second postoperative follow-ups. The SE values were similar, with no statistically significant difference (
Table 5).
The analysis of the calculated SE values for both controls revealed that the frequencies of eyes falling within ±1.00 and ±0.50 diopters were similar (
Table 6,
Figure 1).
4. Discussion
Our study aims to compare more traditional techniques with newer methods. Within this scope, the outcomes associated with these techniques have been examined through comprehensive analyses. It is anticipated that the findings will contribute to the optimization of refractive prediction models used to achieve superior outcomes for patients undergoing refractive lens exchange and cataract surgery.
Both formulas represent significant advances in ophthalmology, significantly improving visual outcomes after cataract surgery. However, the significant differences in their methodology and predictive accuracy deserve further discussion. BU II has a solid theoretical basis. It incorporates the concept of effective lens position and uses a five-variable matrix to optimize IOL power estimation. This formula has shown superior accuracy, especially in eyes with extreme biometric features. This is due to its ability to integrate ACD and K measurements with axial length, thus minimizing errors in postoperative refractive outcomes. Consistent with the literature, BU II exhibited lower mean absolute error (MAE) than traditional third- and fourth-generation formulas, underscoring its reliability and predictive accuracy [
14].
LSF represents a paradigm shift that utilizes machine learning algorithms to adapt to biometric differences. LSF offers a personalized approach to IOL power calculation by integrating experimental data from extensive databases. Since LSF tailors predictions to individual eyes, it lacks the limitations of traditional theoretical formulas. It is particularly promising in managing complex cases such as eyes with irregular corneal shapes or refractive surgery [
11].
The findings of several studies provide valuable insights into the topic. In one study, Pereira et al. demonstrated that the Kane formula provided more accurate data than the BU II and LSF formulas [
15]. Similarly, another study revealed that the Kane formula outperformed next-generation formulas regarding accuracy [
16]. Darcy et al. conducted a study with a huge sample size, concluding that while BU II and LSF yielded highly reliable results, they were inferior to specific other formulas with which they were compared [
17].
In a study, BU II and LSF were also found to produce reliable results; however, the Kane formula again demonstrated superior performance compared to the other formulas analyzed. Partial coherence interferometry measurements were employed in this study [
18]. Conversely, Rocha-de-Lossada et al. found that the Emmetropia Verifying Optical Formula (EVO) yielded lower MAE values when compared with the formulas evaluated in their study [
19].
In another study, BU II was reported to produce the lowest MAE values compared to EVO, Hill-RBF, LSF, and several other formulas. Supporting the superiority of BU II, Khatib et al. demonstrated that BU II outperformed EVO and Hill-RBF in terms of MAE [
20]. Similarly, Nemeth et al., in a study comparable to the present research, highlighted the prominence of BU II by comparing it with AI-based intraocular lens (IOL) formulas. The AI-based IOL formulas included in their study were Hill-RBF 2.0, Kane, and PEARL-DGS. While LSF was not included in their comparisons, the findings provide valuable insights, showing that BU II performed better than the other formulas evaluated [
21].
The observed variability in results across studies is attributed to differences in the types of lenses analyzed and the variations in sample sizes. Some studies included over ten thousand participants [
17], while others evaluated two monofocal IOL lenses instead of a single lens [
21]. These methodological differences likely explain the discrepancies in the reported findings.
In a study conducted in Korea and performed on more than 1500 eyes, the newly developed Eom IOL power calculator formula was compared with formulas including BU II and LSF. The results showed that EOm provided more accurate results than the other formulas. The following most reliable results were determined to be those provided by BU II and LSF. In comparisons made in terms of MedAE and IOL Formula Performance Indexes, it was observed that LSF provided more accurate results than BU II [
22]. These results are consistent with those obtained in our study.
When comparing these formulas, it is important to consider their performance in specific clinical scenarios. It has been noted that BU II performs better regarding refractive predictability in eyes with extreme axial lengths. This can be attributed to its high predictive power of posterior corneal curvature [
23]. LSF, on the other hand, can handle complex biometric variations better than traditional formulas, thanks to the adaptability provided by machine learning. Thus, it offers an innovative approach to personalized medicine [
11]. Another difference between the formulas is the ease of clinical application. BU II guarantees worldwide accessibility. It is integrated into commercially available biometry devices [
24]. In contrast, LSF requires special software or computational resources to implement [
25]. This is a limitation in resource-constrained environments.
There are some limitations in our study. First, the number of participants is likely to be limited. Increasing the sample size is extremely important regarding the generalizability of the data obtained. Second, only two formulas were examined in our study. Our study is a pilot study, and studies comparing more formulas will be planned for subsequent studies. The design of our study is another limitation. Prospective studies provide more reliable results than retrospective studies. Control of exposure factors is limited in retrospective studies. Missing history/background and/or missing information are shared. Selection and recall bias may affect the results.
5. Conclusions
The lens power averages of BU II and LSF were almost the same, indicating that both formulas provide comparable prediction accuracy. The results obtained from Pearson correlation analysis also showed that there was no significant correlation between the data obtained from the two formulas, indicating that neither formula is superior to the other.
In addition, the SE values recorded at the first and second postoperative follow-ups confirmed the consistency of the formulas. This finding emphasizes the clinical reliability of both formulas in providing stable postoperative refractive outcomes. According to these results, neither the traditional nor the AI-based method has a significant advantage in terms of accuracy or prediction consistency.
In this context, in clinical practice, the choice of one formula may be guided by surgeon preference, ease of integration into the workflow, or specific patient characteristics rather than intrinsic methodological superiority. AI is considered a revolution in ophthalmic calculations. Our study emphasized the importance of rigorous validation before adopting AI-based formulas as definitive replacements for traditional methods. Studies conducted on larger samples and with various patient demographics may provide more information on the performance of these formulas in various clinical scenarios.
Author Contributions
Conceptualization, I-IY, SY, LAB; methodology, SY, LAB and MM; validation, LAB, NM and HTS; formal analysis, MM, NM; investigation, NM, MM and HTS; resources, I-IY, SY, MM; data curation, NM, MM, HTS; writing—original draft preparation, SY, NM, MM and H-T.S; writing—review and editing, MM and HTS; visualization, I-IY, NM; supervision, MM and HTS; project administration, I-IY, SY, NM, LAB; All authors have read and agreed to the published version of the manuscript.
Funding
This research received no external funding.
Institutional Review Board Statement
The study was conducted in accordance with the Declaration of Helsinki, and ethical review and approval were waived by the Institutional Ethics Committee due to the retrospective nature of the study.
Informed Consent Statement
Informed consent was obtained from all subjects involved in the study through the standard refractive surgery consent form, which included permission for the use of anonymized data in research.
Data Availability Statement
The data supporting the findings of this study are available from the corresponding author upon reasonable request.
Acknowledgments
We would like to acknowledge Victor Babes University of Medicine and Pharmacy Timisoara for their support in partially covering the costs of publication for this research paper.
Conflicts of Interest
The authors declare no conflicts of interest.
Abbreviations
| AI |
Artificial Intelligence |
| IOL |
Intraocular Lens |
| AL |
Axial Length, |
| ACD |
Anterior Chamber Depth |
| SS-OCT |
Swept-Source Optical Coherence Tomography |
| BU II |
Barrett Universal II |
| LSF |
Ladas Super Formula |
| SE |
Spherical Equivalent |
| EDOF |
Extended Depth of Focus |
| WTW |
White-to-White |
| CCT |
Central Corneal Thickness |
| K |
Keratometry |
References
- Gómez-Correa JE, Vohnsen B, Pierścionek BK, Chávez-Cerda S, Kling S, Rozema JJ, et al. Roadmap on Advances in Visual and Physiological Optics. arXiv Prepr arXiv241114606. 2024.
- Stopyra W, Langenbucher A, Grzybowski A. Intraocular lens power calculation formulas—a systematic review. Ophthalmol Ther. 2023;12(6):2881–902.
- Norrby, S. Sources of error in intraocular lens power calculation. J Cataract Refract Surg. 2008;34(3):368–76.
- Voytsekhivskyy O V, Hoffer KJ, Tutchenko L, Cooke DL, Savini G. Accuracy of 24 IOL power calculation methods. J Refract Surg. 2023;39(4):249–56.
- Narváez J, Zimmerman G, Stulting DR, Chang DH. Accuracy of intraocular lens power prediction using the Hoffer Q, Holladay 1, Holladay 2, and SRK/T formulas. J Cataract Refract Surg. 2006;32(12):2050–3. [CrossRef]
- Olsen, T. Improved accuracy of intraocular lens power calculation with the Zeiss IOLMaster. Acta Ophthalmol Scand. 2007;85(1):84–7.
- Olsen T. The Olsen Formula BT - Intraocular Lens Calculations. In: Aramberri J, Hoffer KJ, Olsen T, Savini G, Shammas HJ, editors. Cham: Springer International Publishing; 2024. p. 731–40. [CrossRef]
- Kieval JZ, Al-Hashimi S, Davidson RS, Hamilton DR, Jackson MA, LaBorwit S, et al. Prevention and management of refractive prediction errors following cataract surgery. J Cataract Refract Surg. 2020;46(8):1189–97.
- Zhang Y, Li T, Reddy A, Nallasamy N. Gender differences in refraction prediction error of five formulas for cataract surgery. BMC Ophthalmol. 2021;21:1–7.
- Chong, C. Technology of SS-OCT Biometer: Argos Biometer. In: Intraocular Lens Calculations. Springer; 2024. p. 215–28.
- Siddiqui AA, Juthani V, Kang J, Chuck RS. The future of intraocular lens calculations: Ladas super formula. Ann Eye Sci. 2019;4(3):19.
- Liu Y-H, Li L-Y, Liu S-J, Gao L-X, Tang Y, Li Z-H, et al. Artificial intelligence in the anterior segment of eye diseases. Int J Ophthalmol. 2024;17(9):1743. [CrossRef]
- Ladas Super Formula v1.0b [Internet]. 2024 [cited 2024 Dec 12]. Available from: https://www.iolcalc.com/home.
- Aziz D, Osman M, Hassan N, Bahgat N. Evaluation of Barrett Universal II, SRK-T, and Haigis formulae for intraocular lens power calculation in myopes using optical biometry. J Egypt Ophthalmol Soc. 2021 Jul 1;114:69.
- Pereira A, Popovic MM, Ahmed Y, Lloyd JC, El-Defrawy S, Gorfinkel J, et al. A comparative analysis of 12 intraocular lens power formulas. Int Ophthalmol. 2021;41:4137–50.
- Connell BJ, Kane JX. Comparison of the Kane formula with existing formulas for intraocular lens power selection. BMJ open Ophthalmol. 2019;4(1):e000251.
- Darcy K, Gunn D, Tavassoli S, Sparrow J, Kane JX. Assessment of the accuracy of new and updated intraocular lens power calculation formulas in 10 930 eyes from the UK National Health Service. J Cataract Refract Surg. 2020;46(1):2–7.
- Maroun A, El Shami M, Hoyek S, Antoun J. Comparison of the accuracy of nine intraocular lens power calculation formulas using partial coherence interferometry. J Fr Ophtalmol. 2023;46(4):341–7.
- Rocha-de-Lossada C, Colmenero-Reina E, Flikier D, Castro-Alonso F-J, Rodriguez-Raton A, García-Madrona J-L, et al. Intraocular lens power calculation formula accuracy: comparison of 12 formulas for a trifocal hydrophilic intraocular lens. Eur J Ophthalmol. 2021;31(6):2981–8.
- Khatib ZI, Haldipurkar SS, Shetty V, Dahake H, Nagvekar P, Kashelkar P. Comparison of three newer generation freely available intraocular lens power calculation formulae across all axial lengths. Indian J Ophthalmol. 2021;69(3):580–4.
- Nemeth G, Kemeny-Beke A, Modis Jr L. Comparison of accuracy of different intraocular lens power calculation methods using artificial intelligence. Eur J Ophthalmol. 2022;32(1):235–41.
- Eom Y, Bae SH, Yang SK, Kim DH, Song JS, Cooke DL. Modified intraocular lens power selection method according to biometric subgroups Eom IOL power calculator. Sci Rep [Internet]. 2024;14(1):4228. [CrossRef]
- Guo C, Yin S, Qiu K, Zhang M. Comparison of accuracy of intraocular lens power calculation for eyes with an axial length greater than 29.0 mm. Int Ophthalmol [Internet]. 2022;42(7):2029–38. [CrossRef]
- Biswas P, Batra S. Commentary: Barrett’s Universal II formula: Time to change the old trends? Indian J Ophthalmol. 2020 Jan;68(1):64–5.
- Ladas JG, Siddiqui AA, Devgan U, Jun AS. A 3-D “Super Surface” Combining Modern Intraocular Lens Formulas to Generate a “Super Formula” and Maximize Accuracy. JAMA Ophthalmol. 2015 Dec;133(12):1431–6. [CrossRef]
|
Disclaimer/Publisher’s Note: The statements, opinions and data contained in all publications are solely those of the individual author(s) and contributor(s) and not of MDPI and/or the editor(s). MDPI and/or the editor(s) disclaim responsibility for any injury to people or property resulting from any ideas, methods, instructions or products referred to in the content. |
© 2025 by the authors. Licensee MDPI, Basel, Switzerland. This article is an open access article distributed under the terms and conditions of the Creative Commons Attribution (CC BY) license (http://creativecommons.org/licenses/by/4.0/).