1. Introduction
1.1. Opportunity Rover Mission
The Opportunity rover landed in Meridiani Planum on January 25, 2004, three weeks after its twin, Spirit. Due to the landing time, Opportunity is designated Mars Exploration Rover – B (MER-B). However, Opportunity was produced before Spirit, so the designation MER-1 is also used. The Spirit rover is designated MER-A or MER-2, respectively. Opportunity was active on Mars from 2004 until 2018 for 5111 sols (14 years, 138 days on Earth). During this time the rover had traveled a distance of 45.16 km [
1].
Mission included finding meteorites (e.g., Heat Shield Rock [
2] ) and exploration of Victoria crater [
3]. In 2011 it reached Endeavour crater [
4]. Eventually the mission is considered one of the NASA's great success.
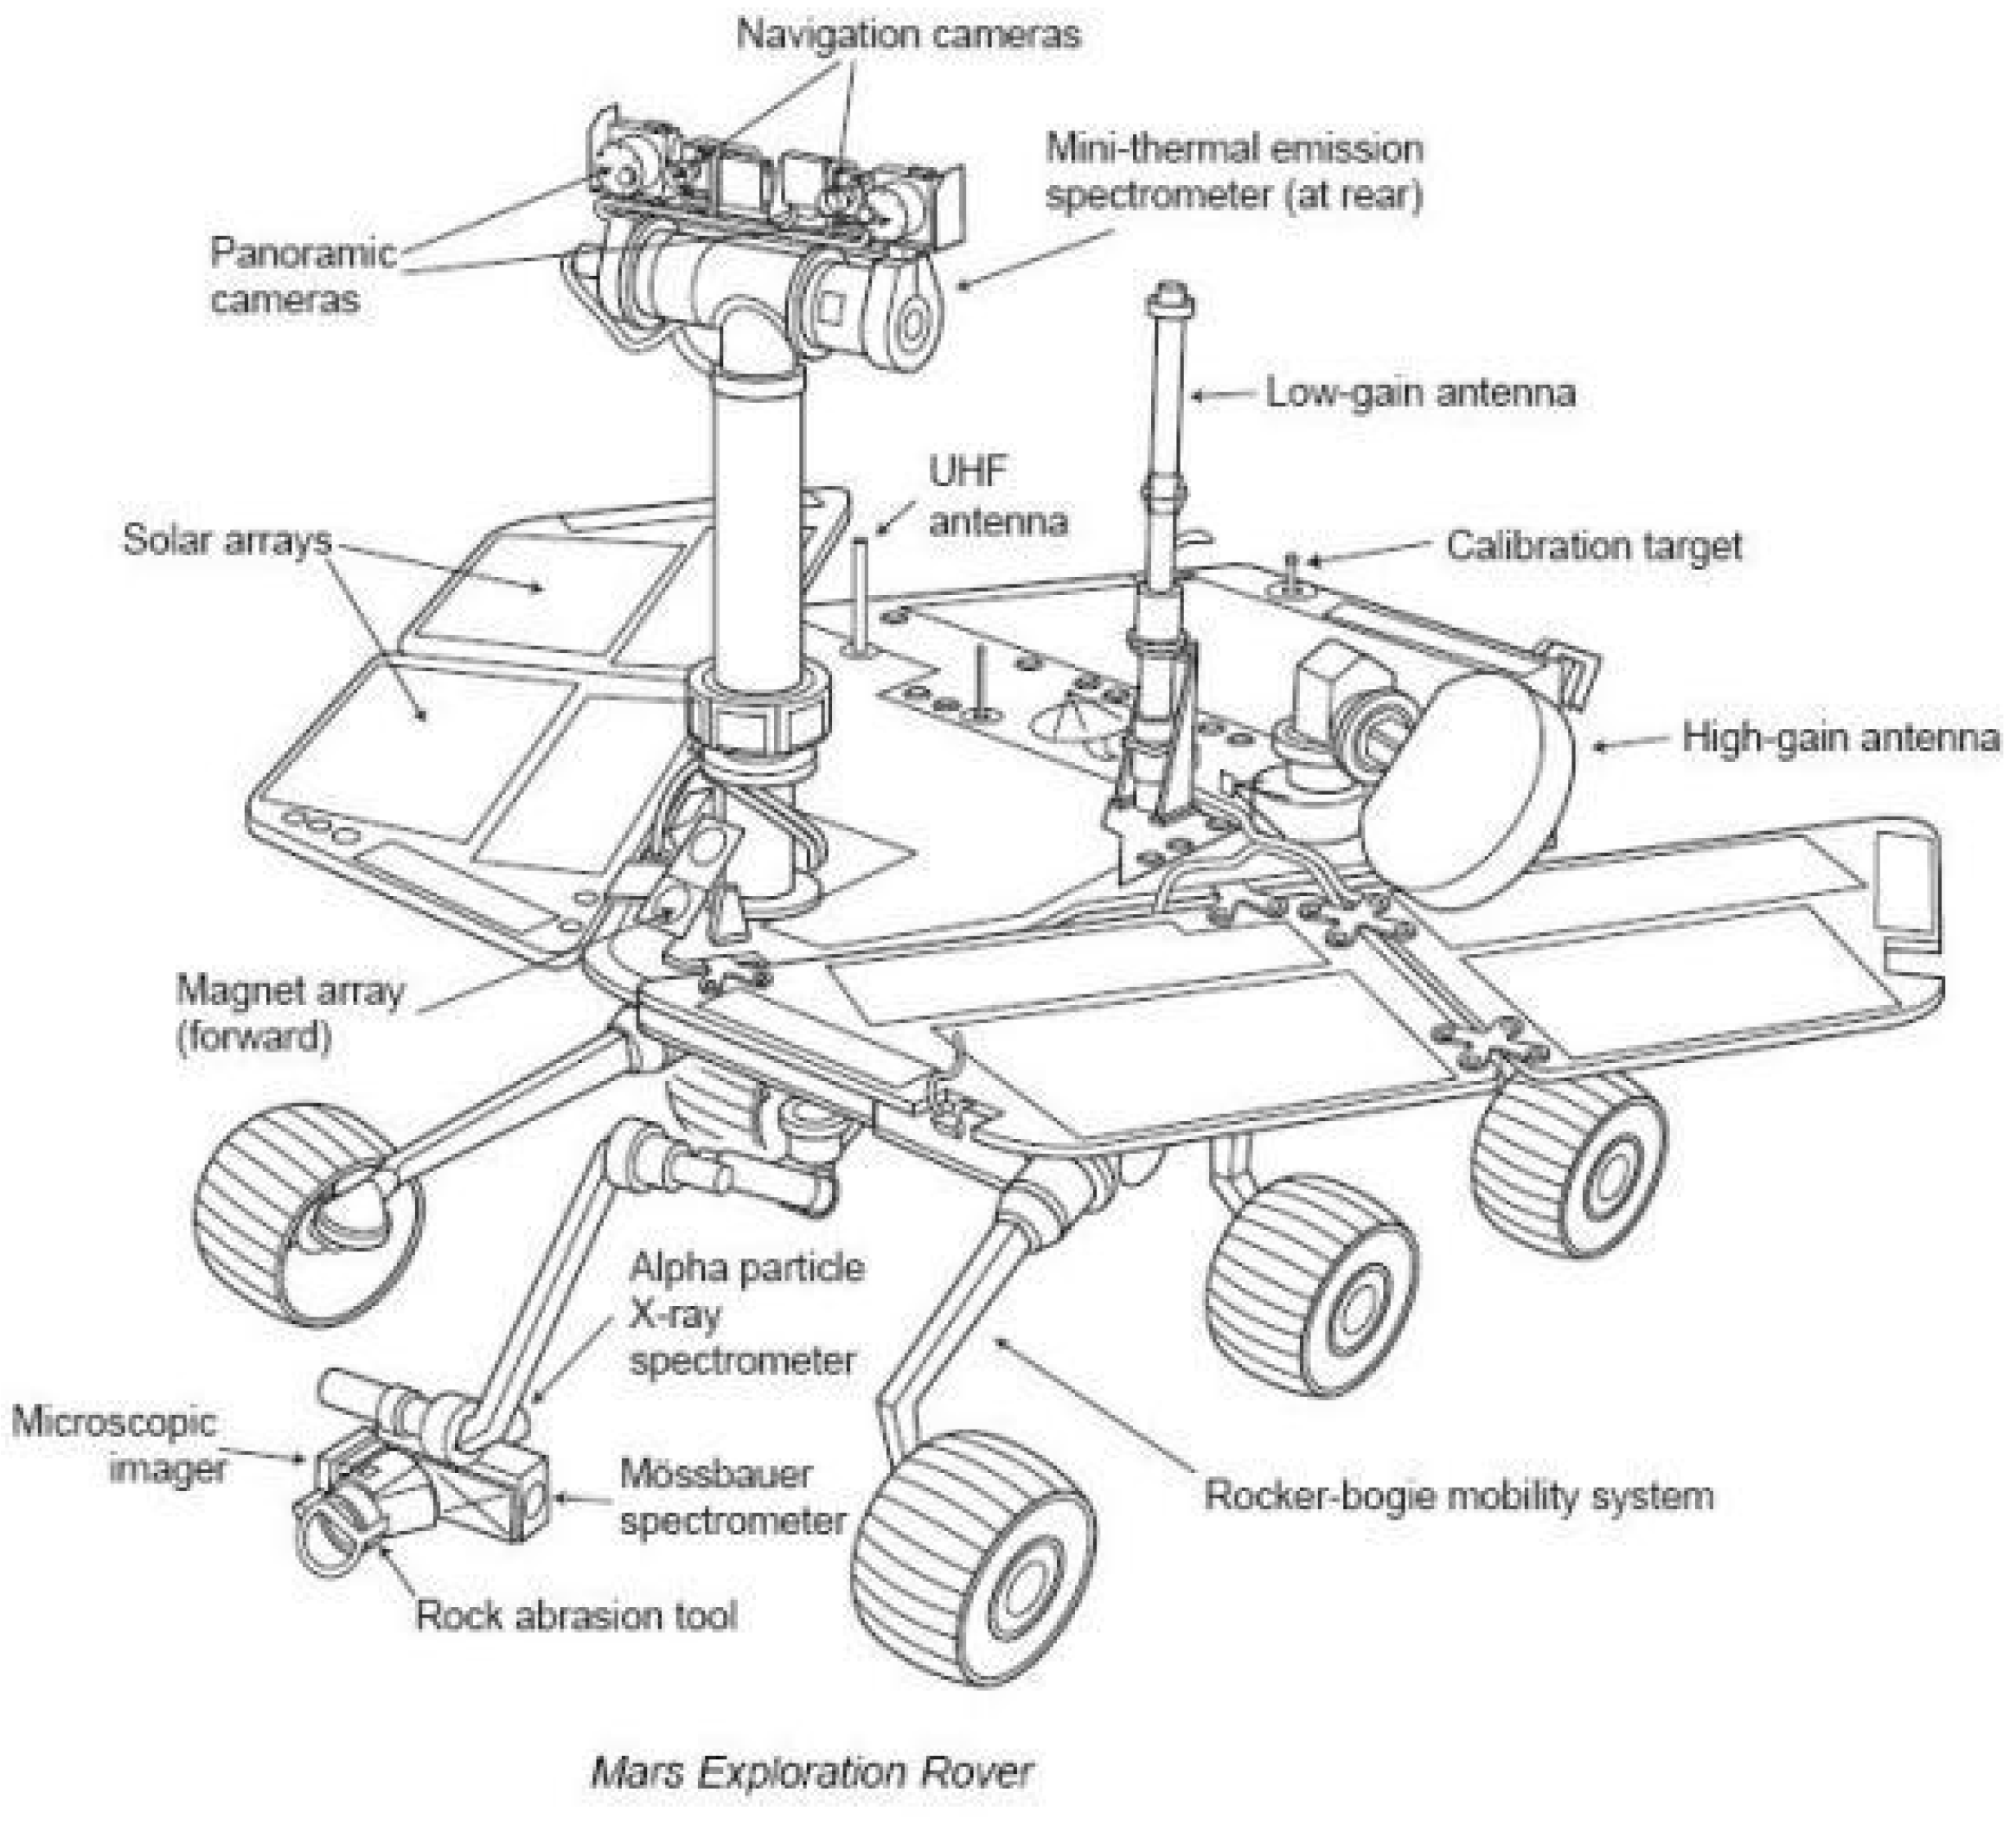
Three instruments on the Opportunity rover are the most important for our analysis. They are: Miniature Thermal Emission Spectrometer (Mini-TES, e.g., [
5], [
6]), the Alpha Particle X-Ray Spectrometer (APXS), and the Mossbauer spectrometer (MB) -
Figure 1.
The Mini-TES provides the mineralogy and thermophysical properties of the regolith. It is a Fourier transform spectrometer. It covers the wavelength range of 5-29 µm (corresponding to the wave number range from 339.50 to 1997.06 cm-1). The Mini-TES telescope is a 6.35 cm diameter Cassegrain telescope that provides a resolution of 20 mrad (it could be reduced to 8 mrad). The Mini-TES and 2 cameras (pancamera and navigation camera) are mounted on the Pancam Mast Assembly (PMA) and are located ~1.5 m above the ground. The PMA provides possibility 360o of azimuthal rotation and view from 30o upwards to -50o downwards.
APXS determines the elemental composition of the regolith. Alpha particles and X-rays (generated by radioactive sources) excite X-rays in the sample. The X-ray spectrum shows elements from sodium to yttrium. In addition, back-scattered alpha particles provide data on oxygen and carbon. Finally, the concentrations of the elements are obtained [
7].
Mossbauer spectroscopy (MB) is a method for quantitative analysis of iron-bearing minerals. In the Opportunity mission, the goal was to identify minerals containing iron (e.g. silicates, oxides, sulfates, carbonates, and sulfides). It can also determine the distribution of iron in different oxidation states (e.g. Fe
3+, Fe
2+) and measure the proportion of iron in some basaltic minerals (e.g. pyroxene, magnetite, olivine, ilmenite) [
8].
The microscopic camera, rock abrasion tool, MB, and APXS are mounted on a moving arm known as the Instrument Deployment Device (IDD). To measure, MB and APXS sensors must be placed close to the surface of the selected sample (by the IDD).
1.2. Meridiani Planum
Meridiani Planum is a plain lying within the boundaries of: Arabia Terra to the north, Noachis Terra to the south, Terra Sabaea to the east, and Ares Vallis to the west. The plain is covering an area of almost 175 000 km
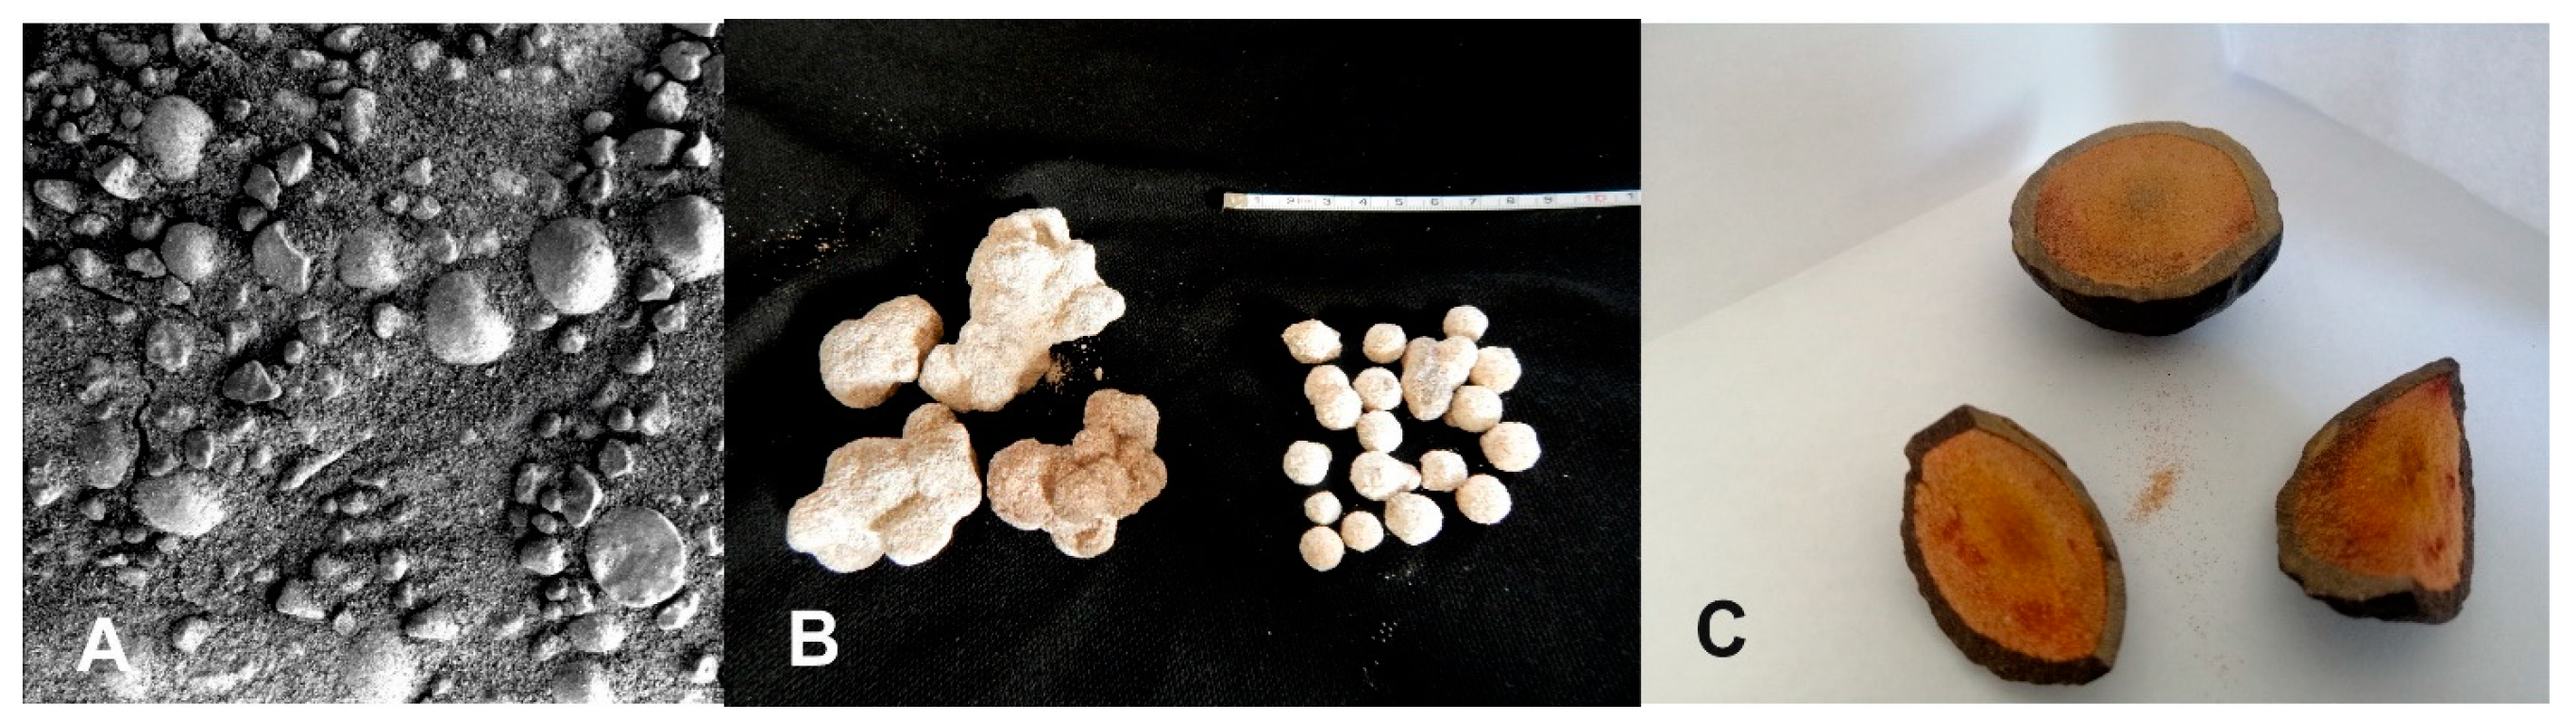
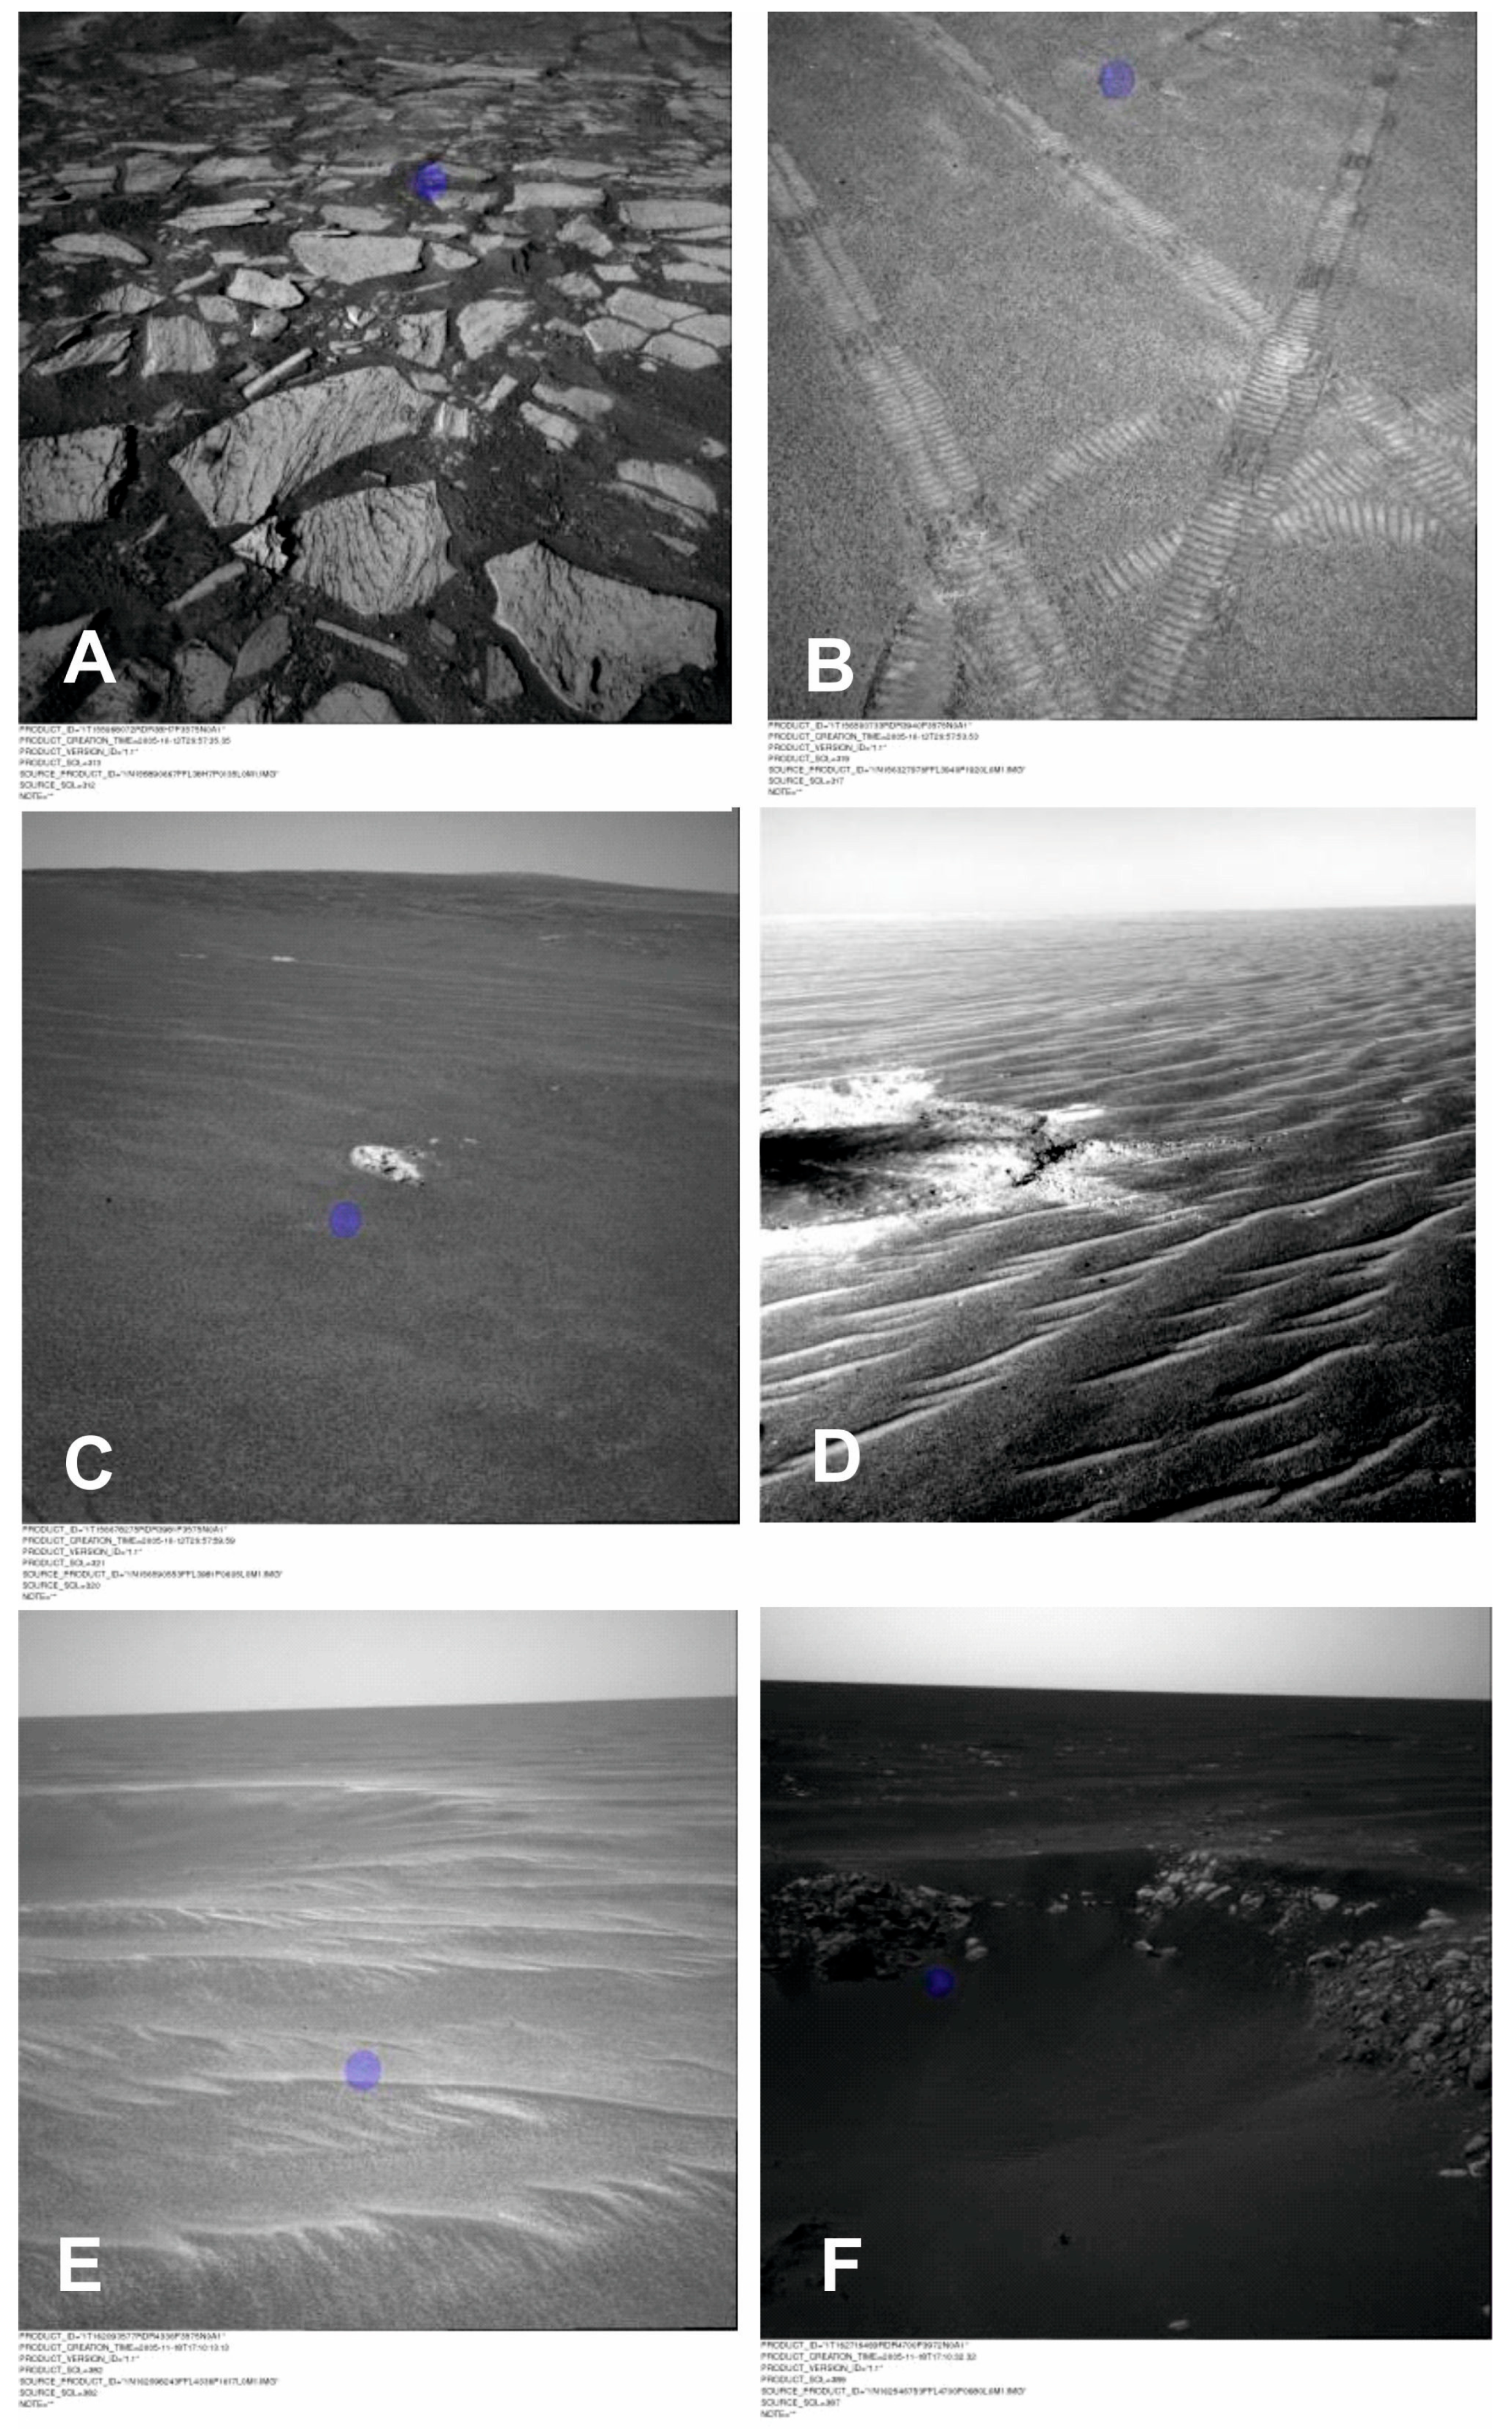
2. On the surface of Meridiani Planum there are extensive sandy areas of various fractions. There are also spherical concretions with a diameter of several mm to 1 cm, known as blueberries (
Figure 2A).
On Mars, there are 3 basic geological eras of the formation of the surface of Mars: Noachian, Hesperian, and Amazonian. On Meridiani Planum, the geological history was shaped in the following way [
9] [
10]:
Noachian - rivers bring large amounts of basaltic mud,
Hesperian - volcanism on Tharsis delivers large amounts of volcanic ash and sulfur acidifying the Meridiani reservoir,
Amazonian - water gradually began to dry out, leaving sedimentary minerals on the surface, wind erosion began to dominate. It was during this period that concretions called blueberries were formed.
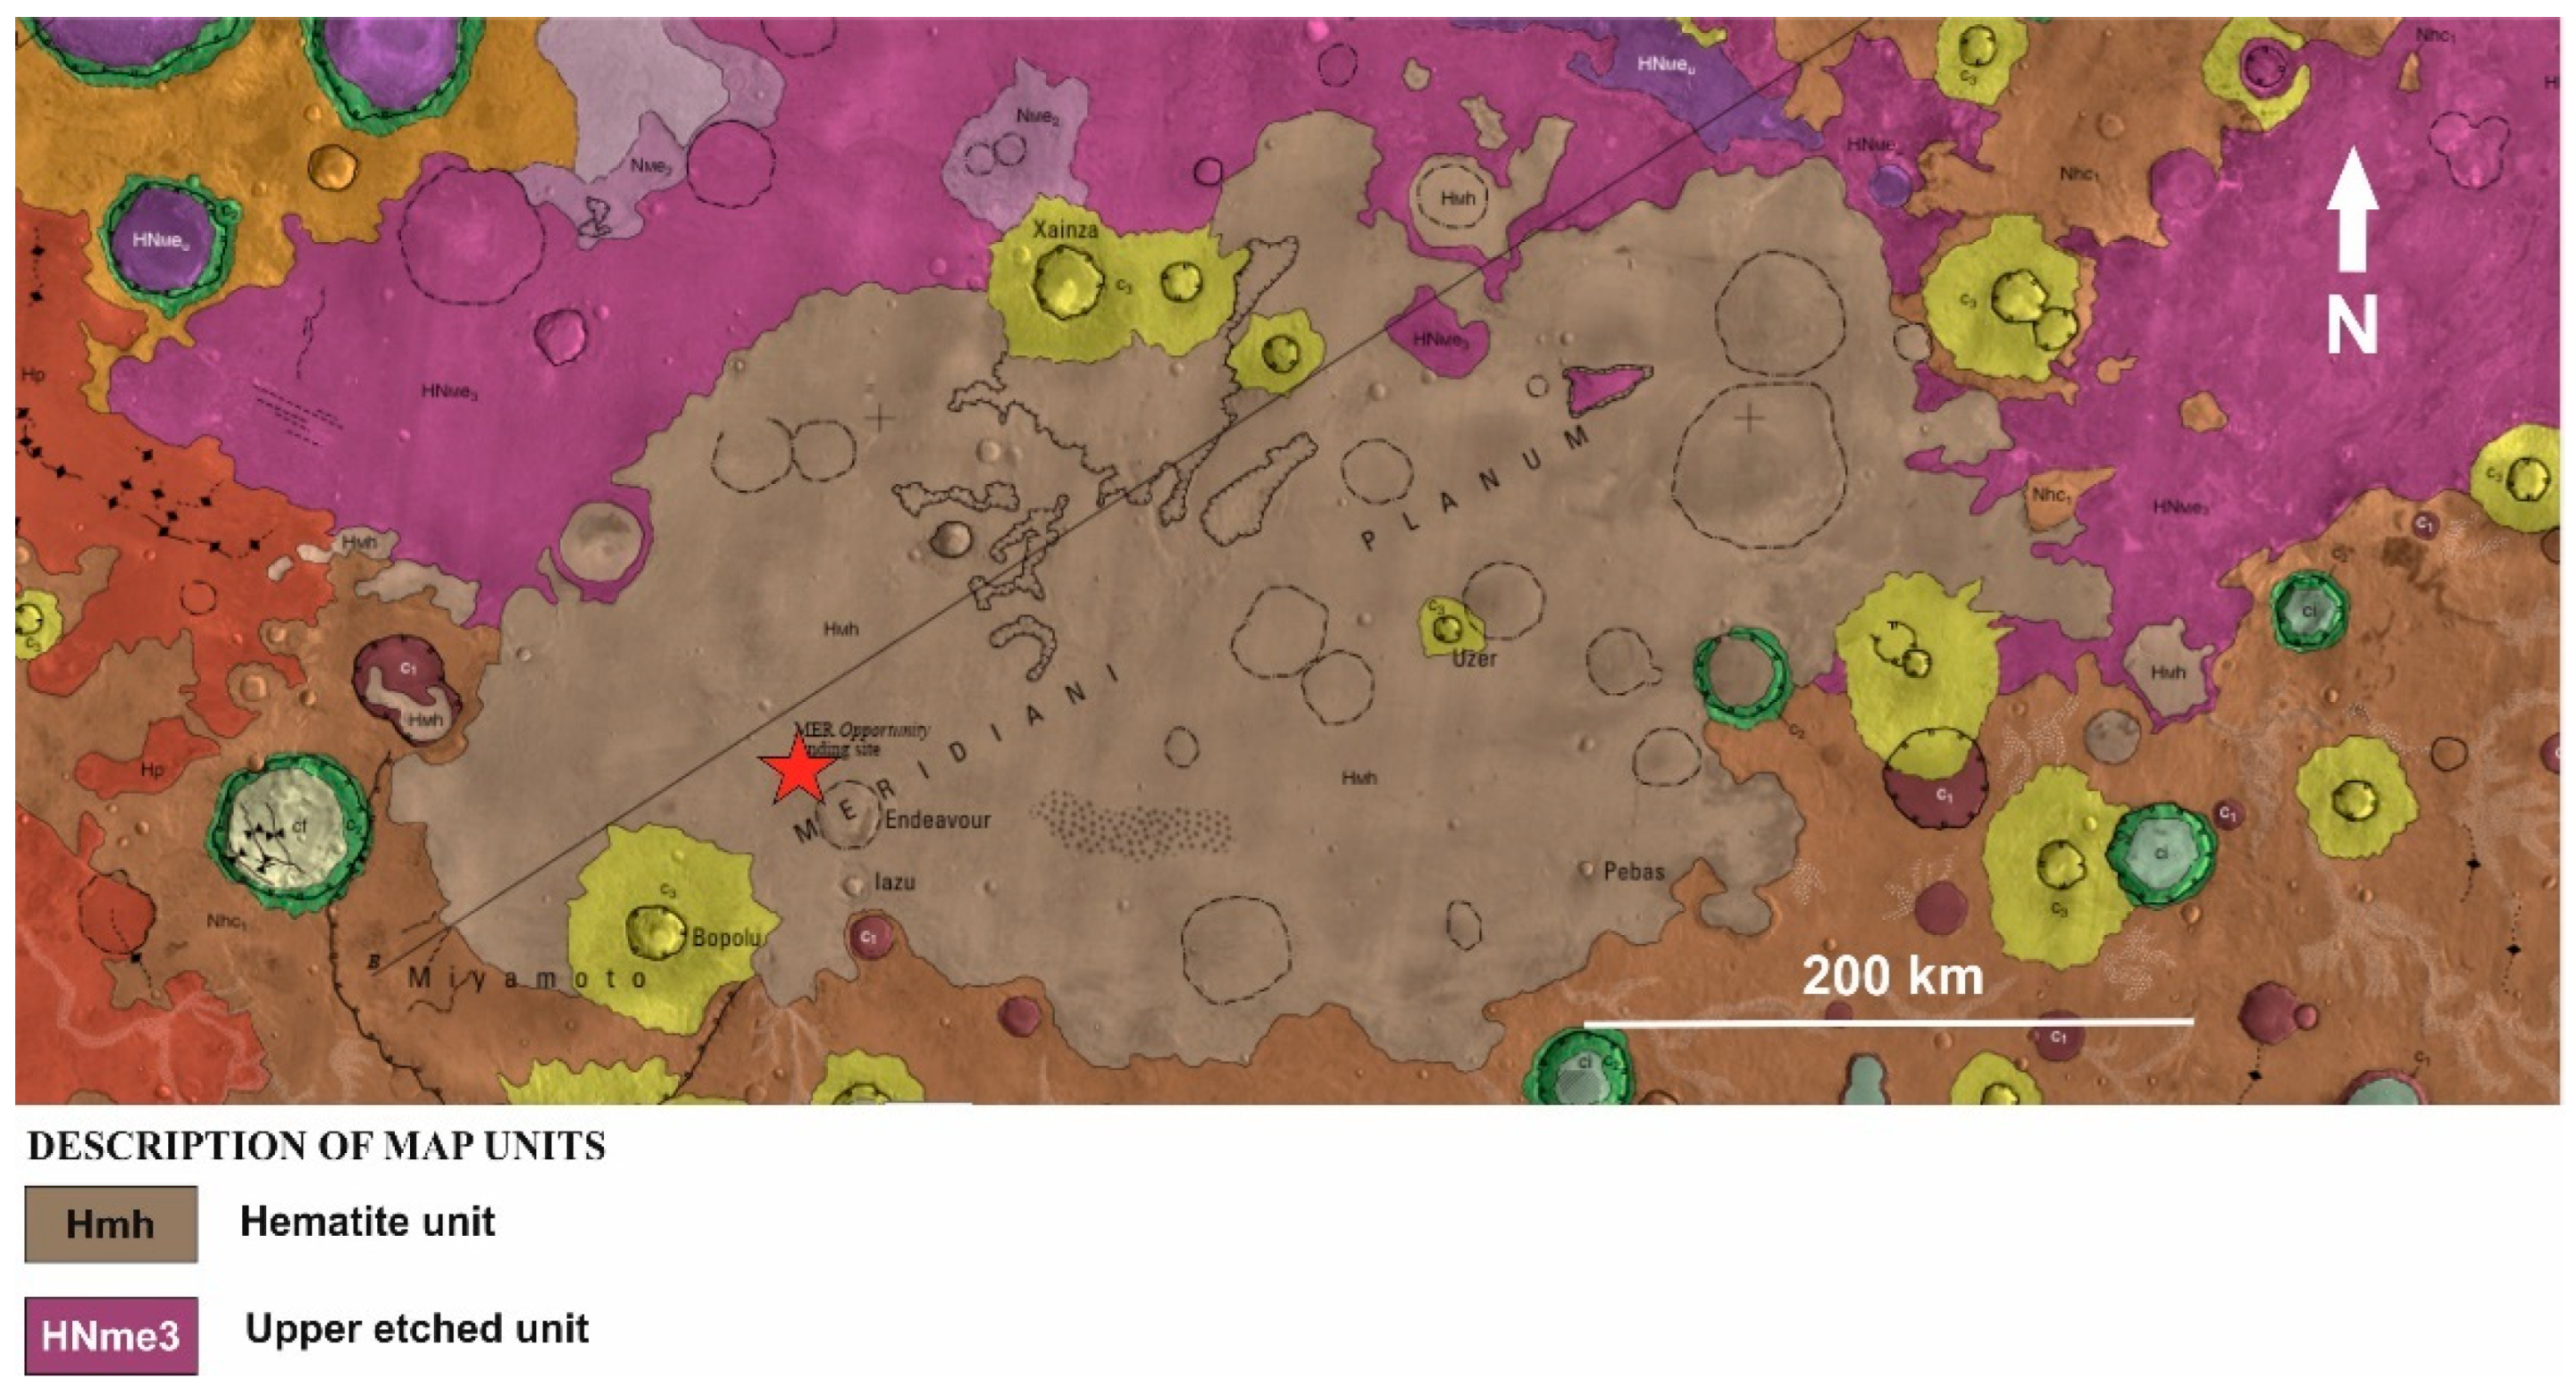
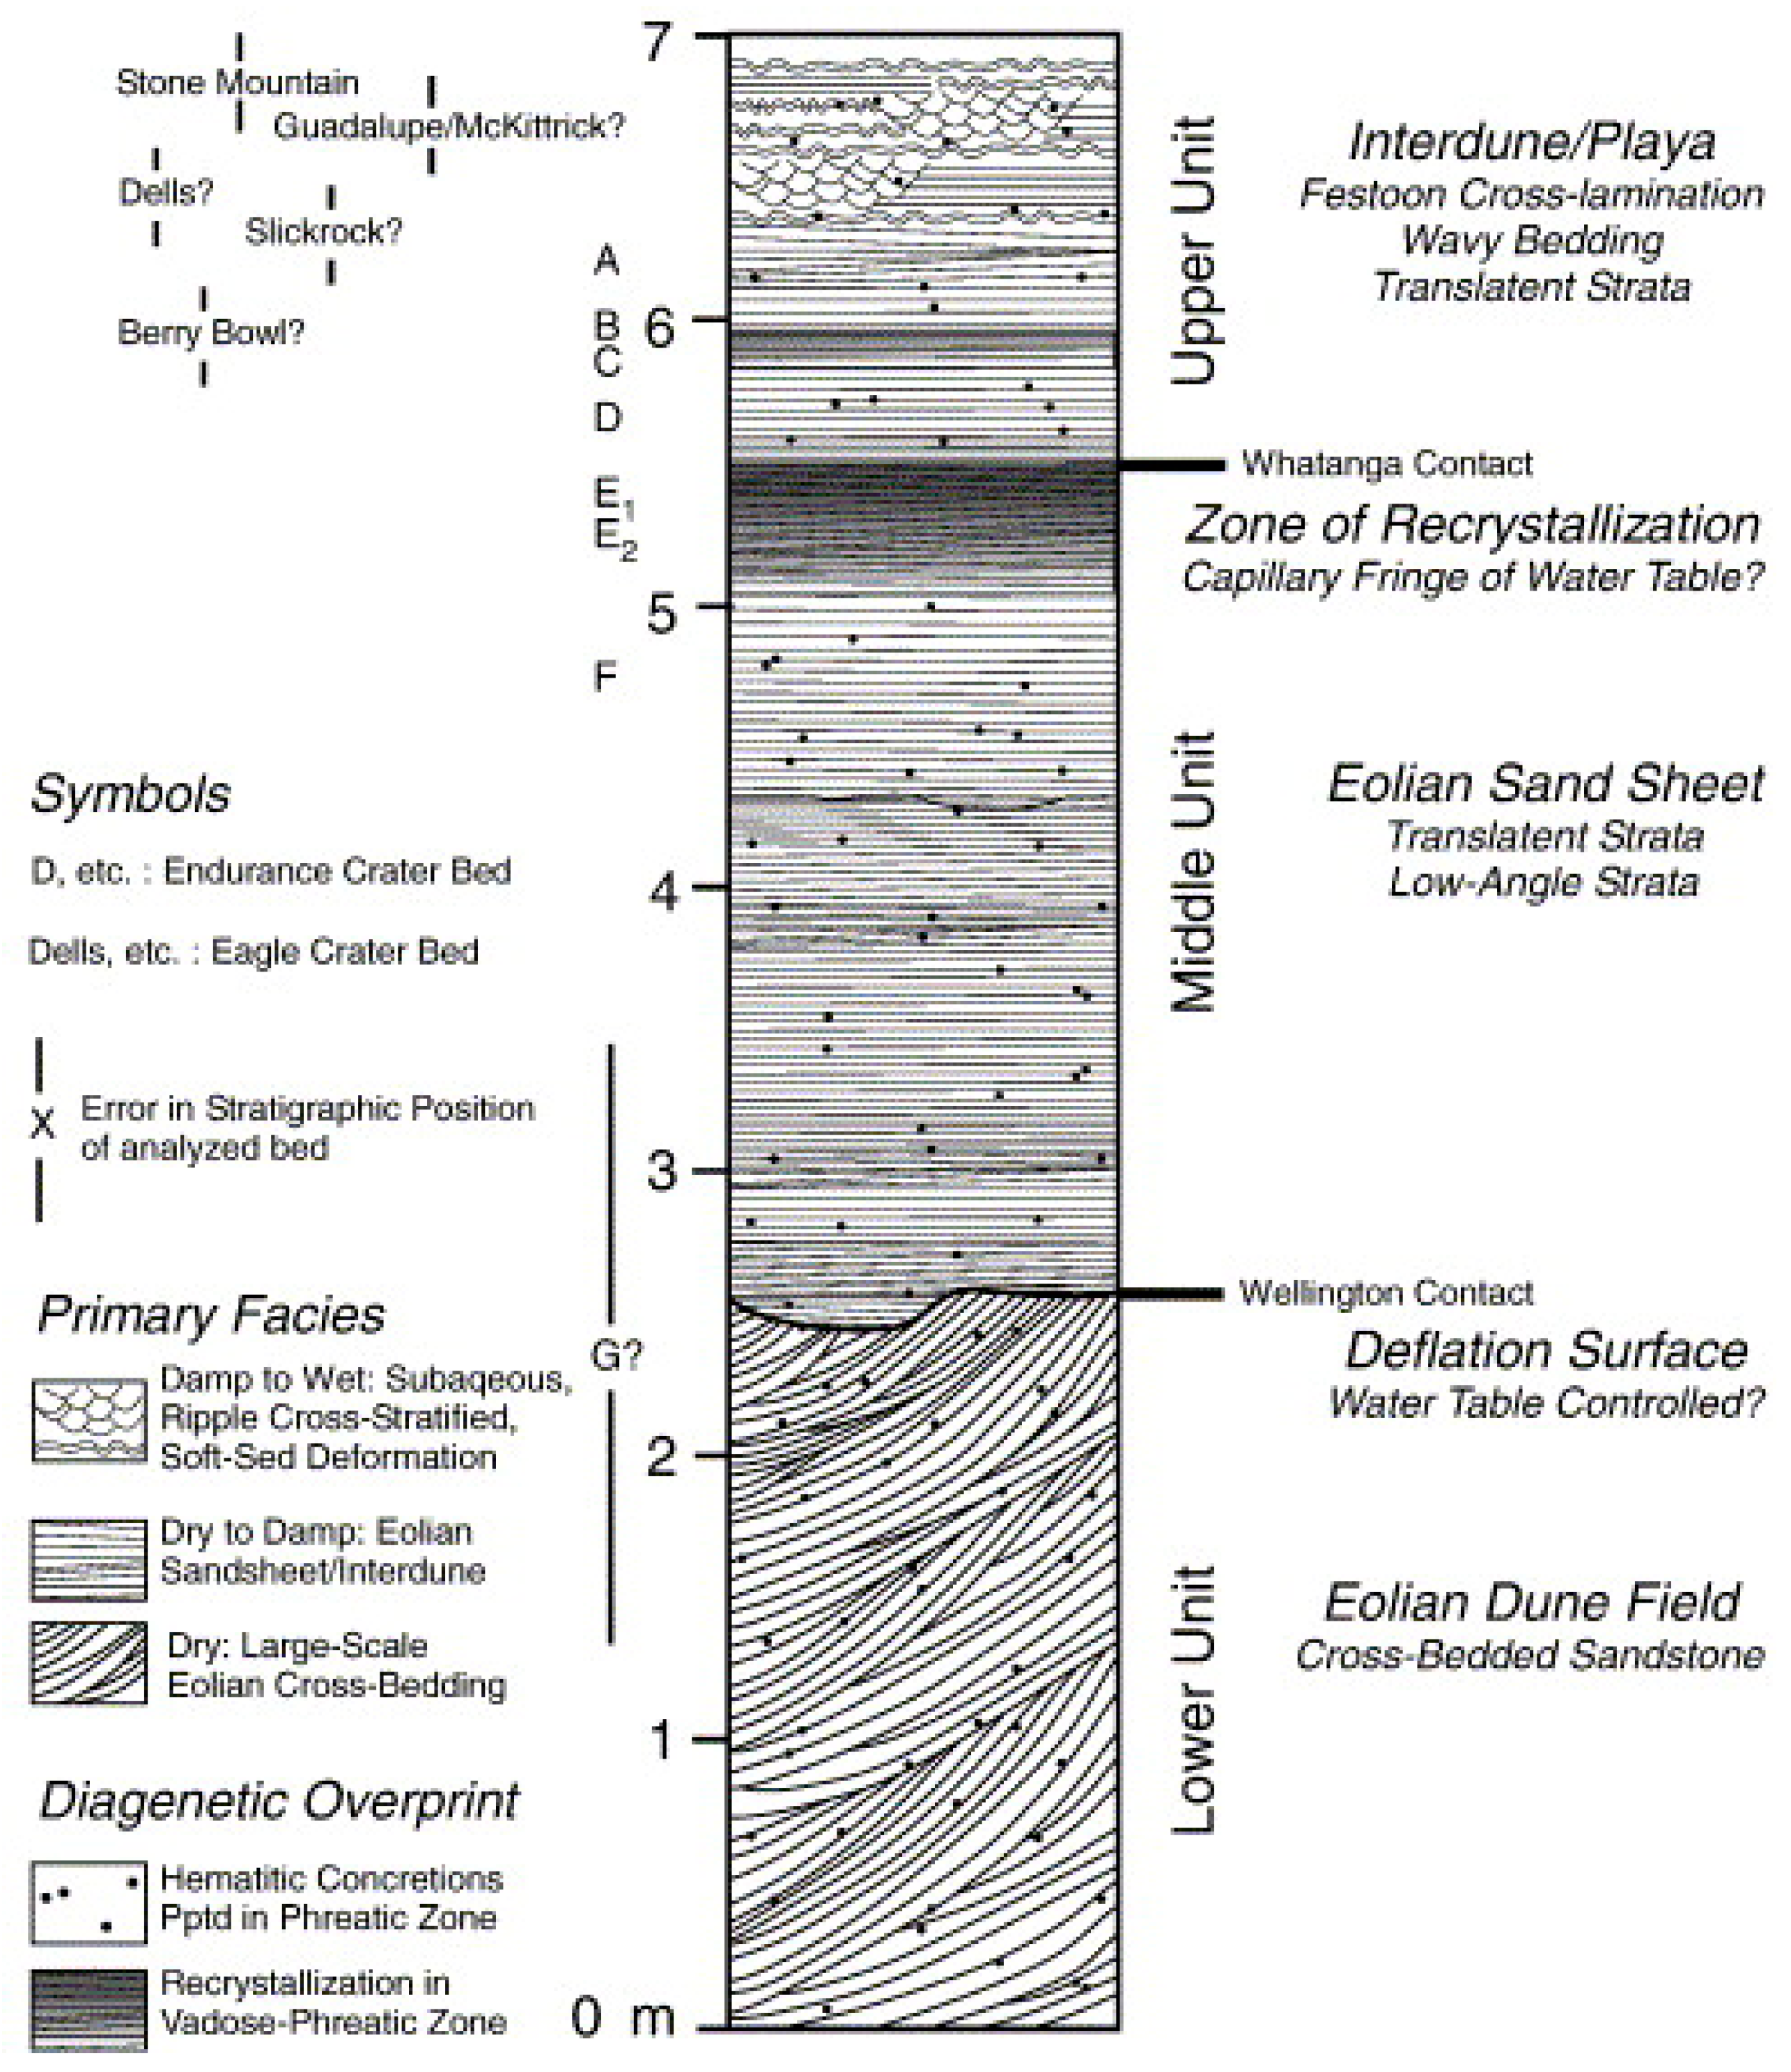
Meridiani Planum is a plateau covered with a variety of sediments -
Figure 3 and
Figure 4. The area is characterized by the presence of rock layers that are formed by long-term sedimentary processes. Analysis of orbital images and data from the Opportunity rover reveal the presence of sedimentary rocks, e.g. sandstones and mudstones. The region may have been subject to hydrothermal processes and of extensive volcanism during the Hesperian. Some structures and minerals, such as jarosite, may have been formed by the circulation of hot water beneath the surface, which could have influenced the deposition of sulfate minerals and the formation of sedimentary layers.
Today, dunes and aeolian ripples are common on Meridiani. The surface is covered with partially buried or filled impact craters (up to 50 km in diameter). The Hmh- Hematite unit (early Hesperian) unconformably overlies the heavily eroded HNMe3- Upper etched unit (Middle to late Noachian), characterized by local knobs, mesas, and outliers. The spherules most likely formed by chemical precipitation from iron-bearing groundwater or by volcanic processes. This suggest that the spherules formed in the upper etched (leached) unit (HNMe3), forming extensive surface deposits. Isolated, smaller exposures around the central, larger exposures suggest that the unit had a larger former extent [
11].
Many scientists believe that there were thermal springs or water reservoirs in the Meridiani Planum region. This is indicated by data from the Mars Global Surveyor (MGS) probe's Thermal Emission Spectrometer (TES), which identified elevated amounts of hematite on Meridiani.
Based on data from the Gamma Ray Spectrometer (GRS), a high hydrogen content was discovered. The GRS, installed on board NASA's Mars Odyssey, allowed mapping the chemical composition of Mars at a depth of 10 cm to 1 m below the surface by measuring gamma rays from space and their interactions with various surface materials. The GRS consists of the Gamma Sensor (GS), the Neutron Spectrometer (NS), and the High-Energy Neutron Detector (HEND). Neutron detection equipment, such as NS and HEND, measures neutrons of different energies released from the near surface of Mars by cosmic rays.
According to the interpretation of scientists [
12] (Mars Advanced Radar for Subsurface and Ionosphere Sounding) MARSIS radar (Mars Express probe) data indicates that the relatively low derived dielectric constant of Meridiani Planum sediments (~3.6 ± 0.6) is consistent with a sequence of thick, low-density porous basaltic sand. As can be seen, pore-filling water ice is therefore not necessary to explain the low dielectric constant of Meridiani Planum sediments [
12].
2. Methods
The Mini-TES is designed for remote determination of the mineral composition of the regolith of planetary bodies. In addition, it can be used to determine the surface temperature and/or properties of the atmosphere -
Figure 1. The Mini-TES is a miniaturized version of TES, installed on the orbiter Mars Global Surveyor (MGS). Mini-TES is placed on 2 rovers exploring Mars (Spirit and Opportunity).
Mini-TES provides high resolution infrared spectra over some range of wavelengths. By making measurements in the thermal infrared part of the electromagnetic spectrum. it has some ability to penetrate layers of dust. Such layers are common on the surface of Mars and pose a problem for remote observations. The range of Mini-TES spectrum corresponds to some characteristic bands of vibration spectra. They allow us to identify certain crystal structures of minerals. This makes it often possible to determine the mineralogy and various properties. In particular, detection of the following groups of minerals is possible: hydroxides, sulfates, phosphates, silicates, carbonates, and oxides [
5].
Mini-TES covers the spectral range from 1997.06 cm-1 to 339.50 cm-1 with a spectral sampling of 9.99 cm-1 (at 167 points). The extreme ends of each spectrum were excluded from deconvolution due to the lower signal to noise ratio (SNR) in these spectral regions.
The mission of the Opportunity rover lasted 5111 sols. However, the number and quality of late measurements were lower. We focus on data from the Mini-TES spectrometer taken from sol 313 to sol 395. We chose less discussed parts of the route of the rover. In these parts there are less other data (e.g. from APXS and MB). We do not average the results over a larger area. Our results concern the local differences that occur in a selected sectors of the rover's route Opportunity.
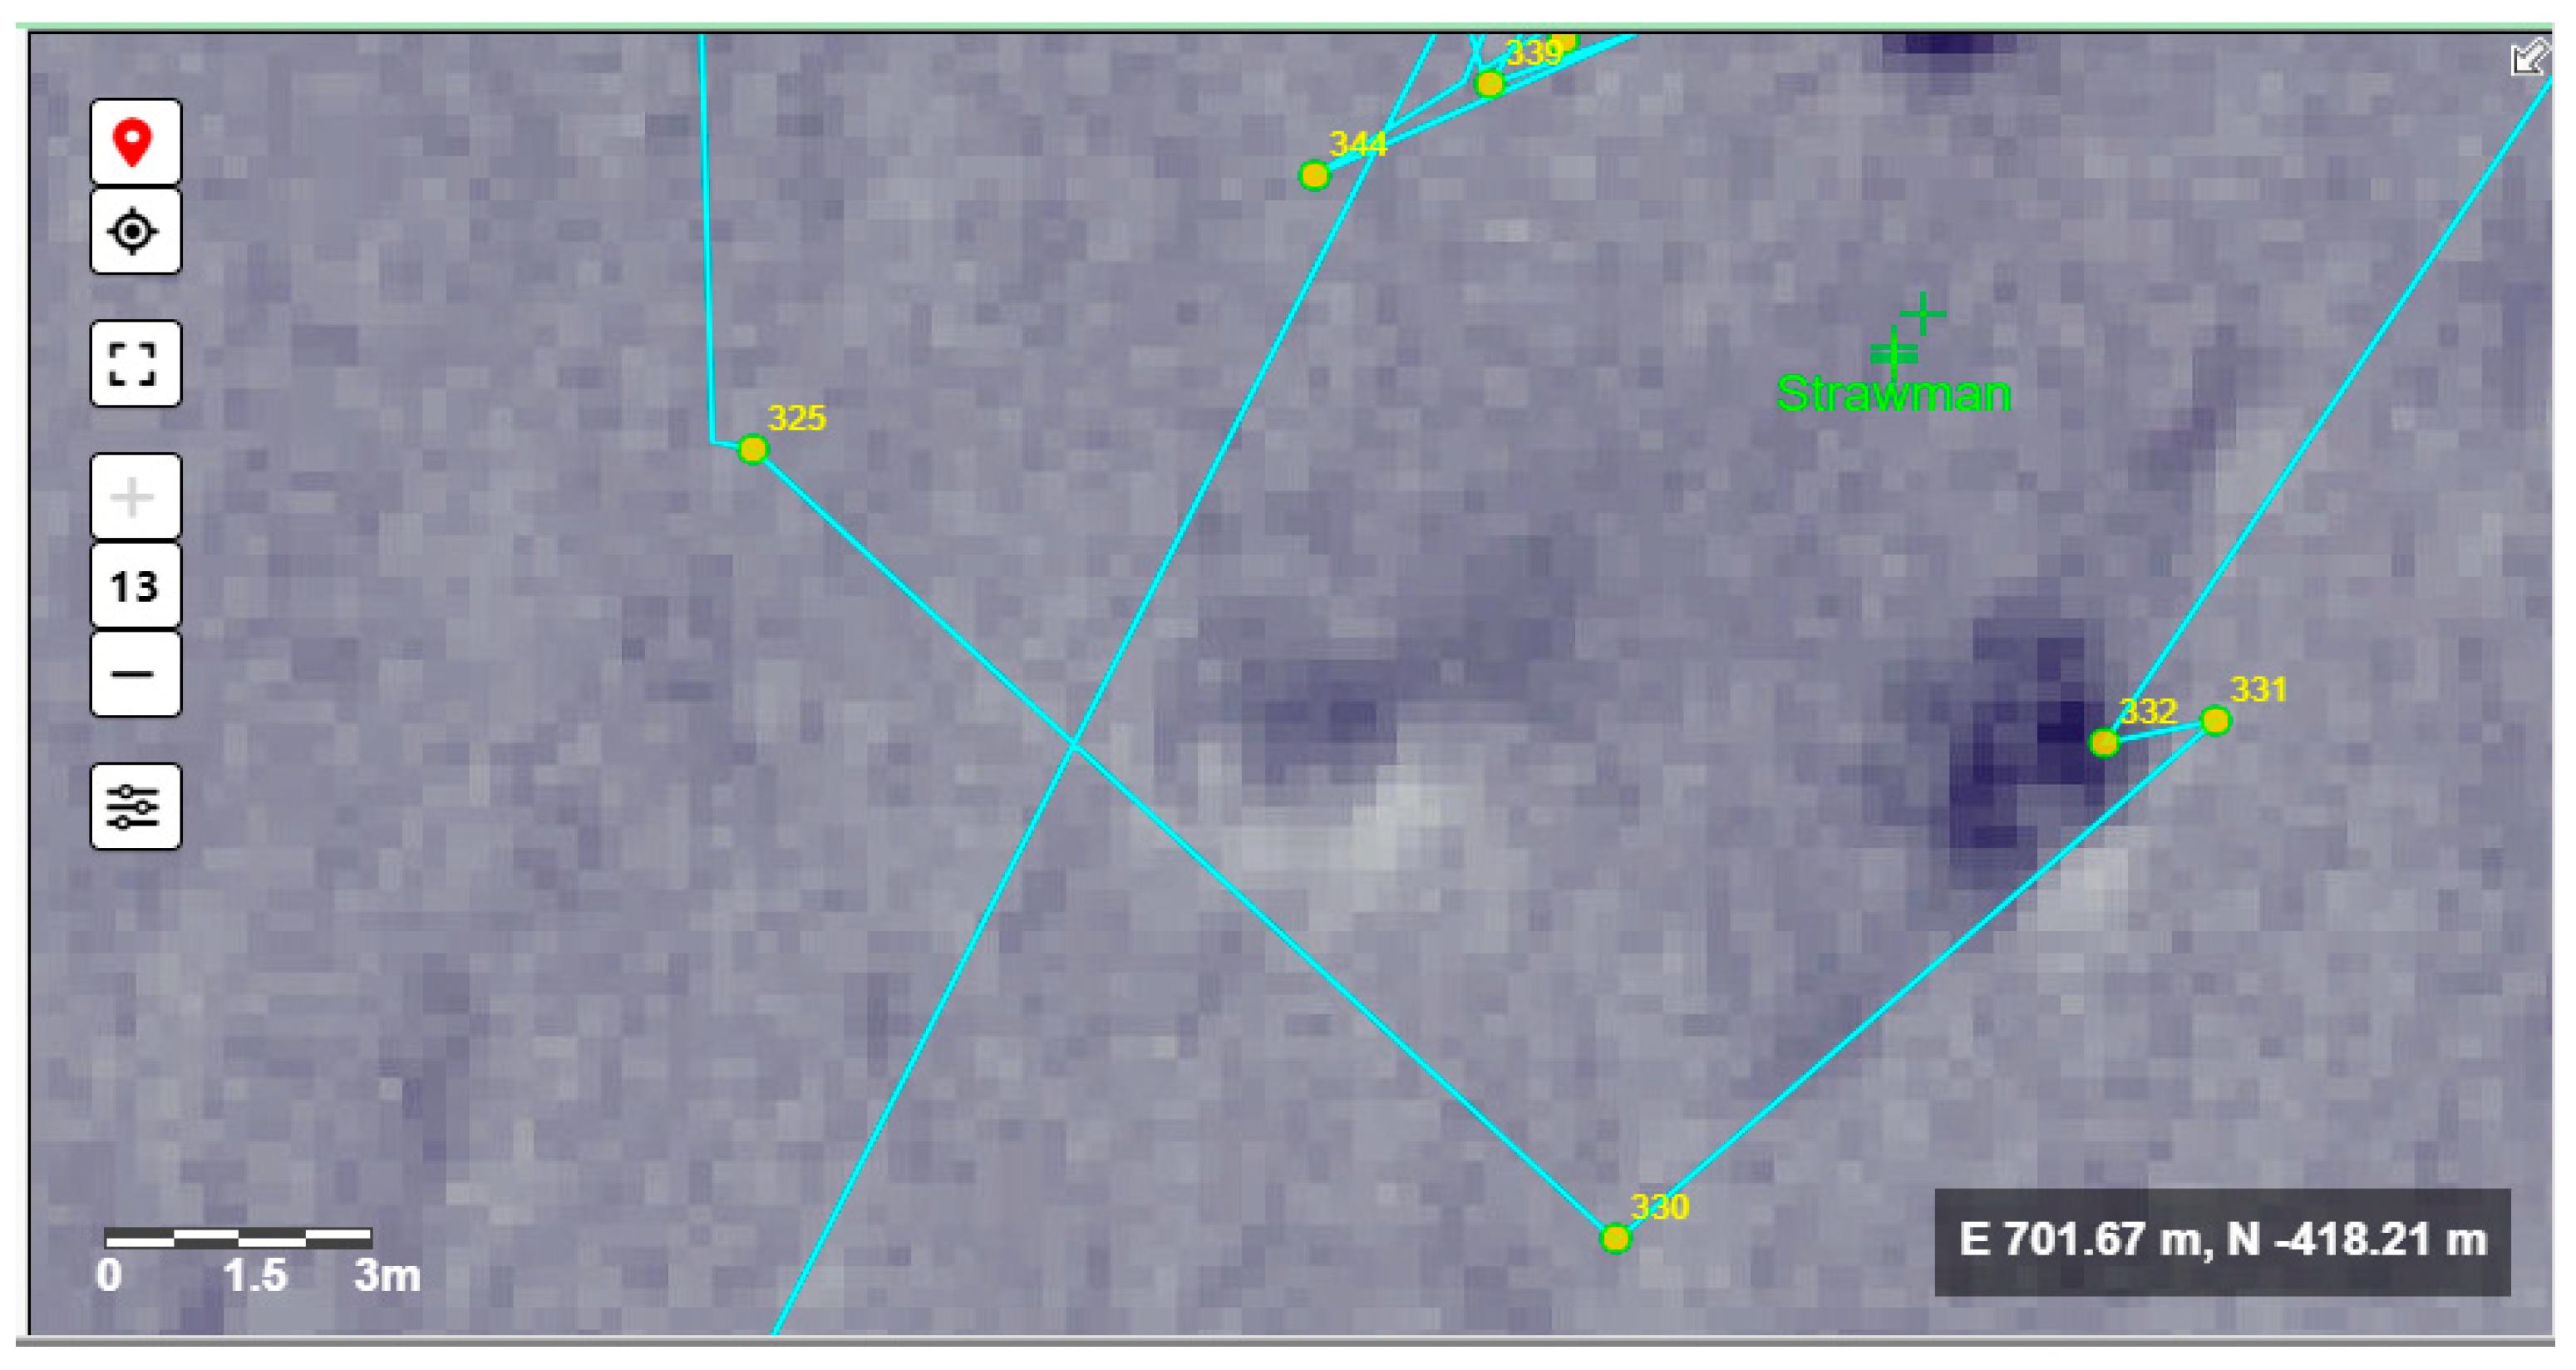
The position of the object being measured by Mini-TES is determined by the direction in which the instrument is facing. This direction is given by elevation and azimuth. Elevation is an angle counted from the horizontal level (downwards it has negative values). Since we are interested in the spectrum of the planet's surface. we use data with negative elevation (
Figure 5). In general, the elevation values ranged from approx. -50
o to approx. +30
o. For the height of PMA ~1.5 m the distance to the measured object is ~86 m for an elevation angle -1
o and ~1.25 m for an elevation angle -50
o. Of course, the exact distance depends on the inclination of the rover itself and the topography of the terrain.
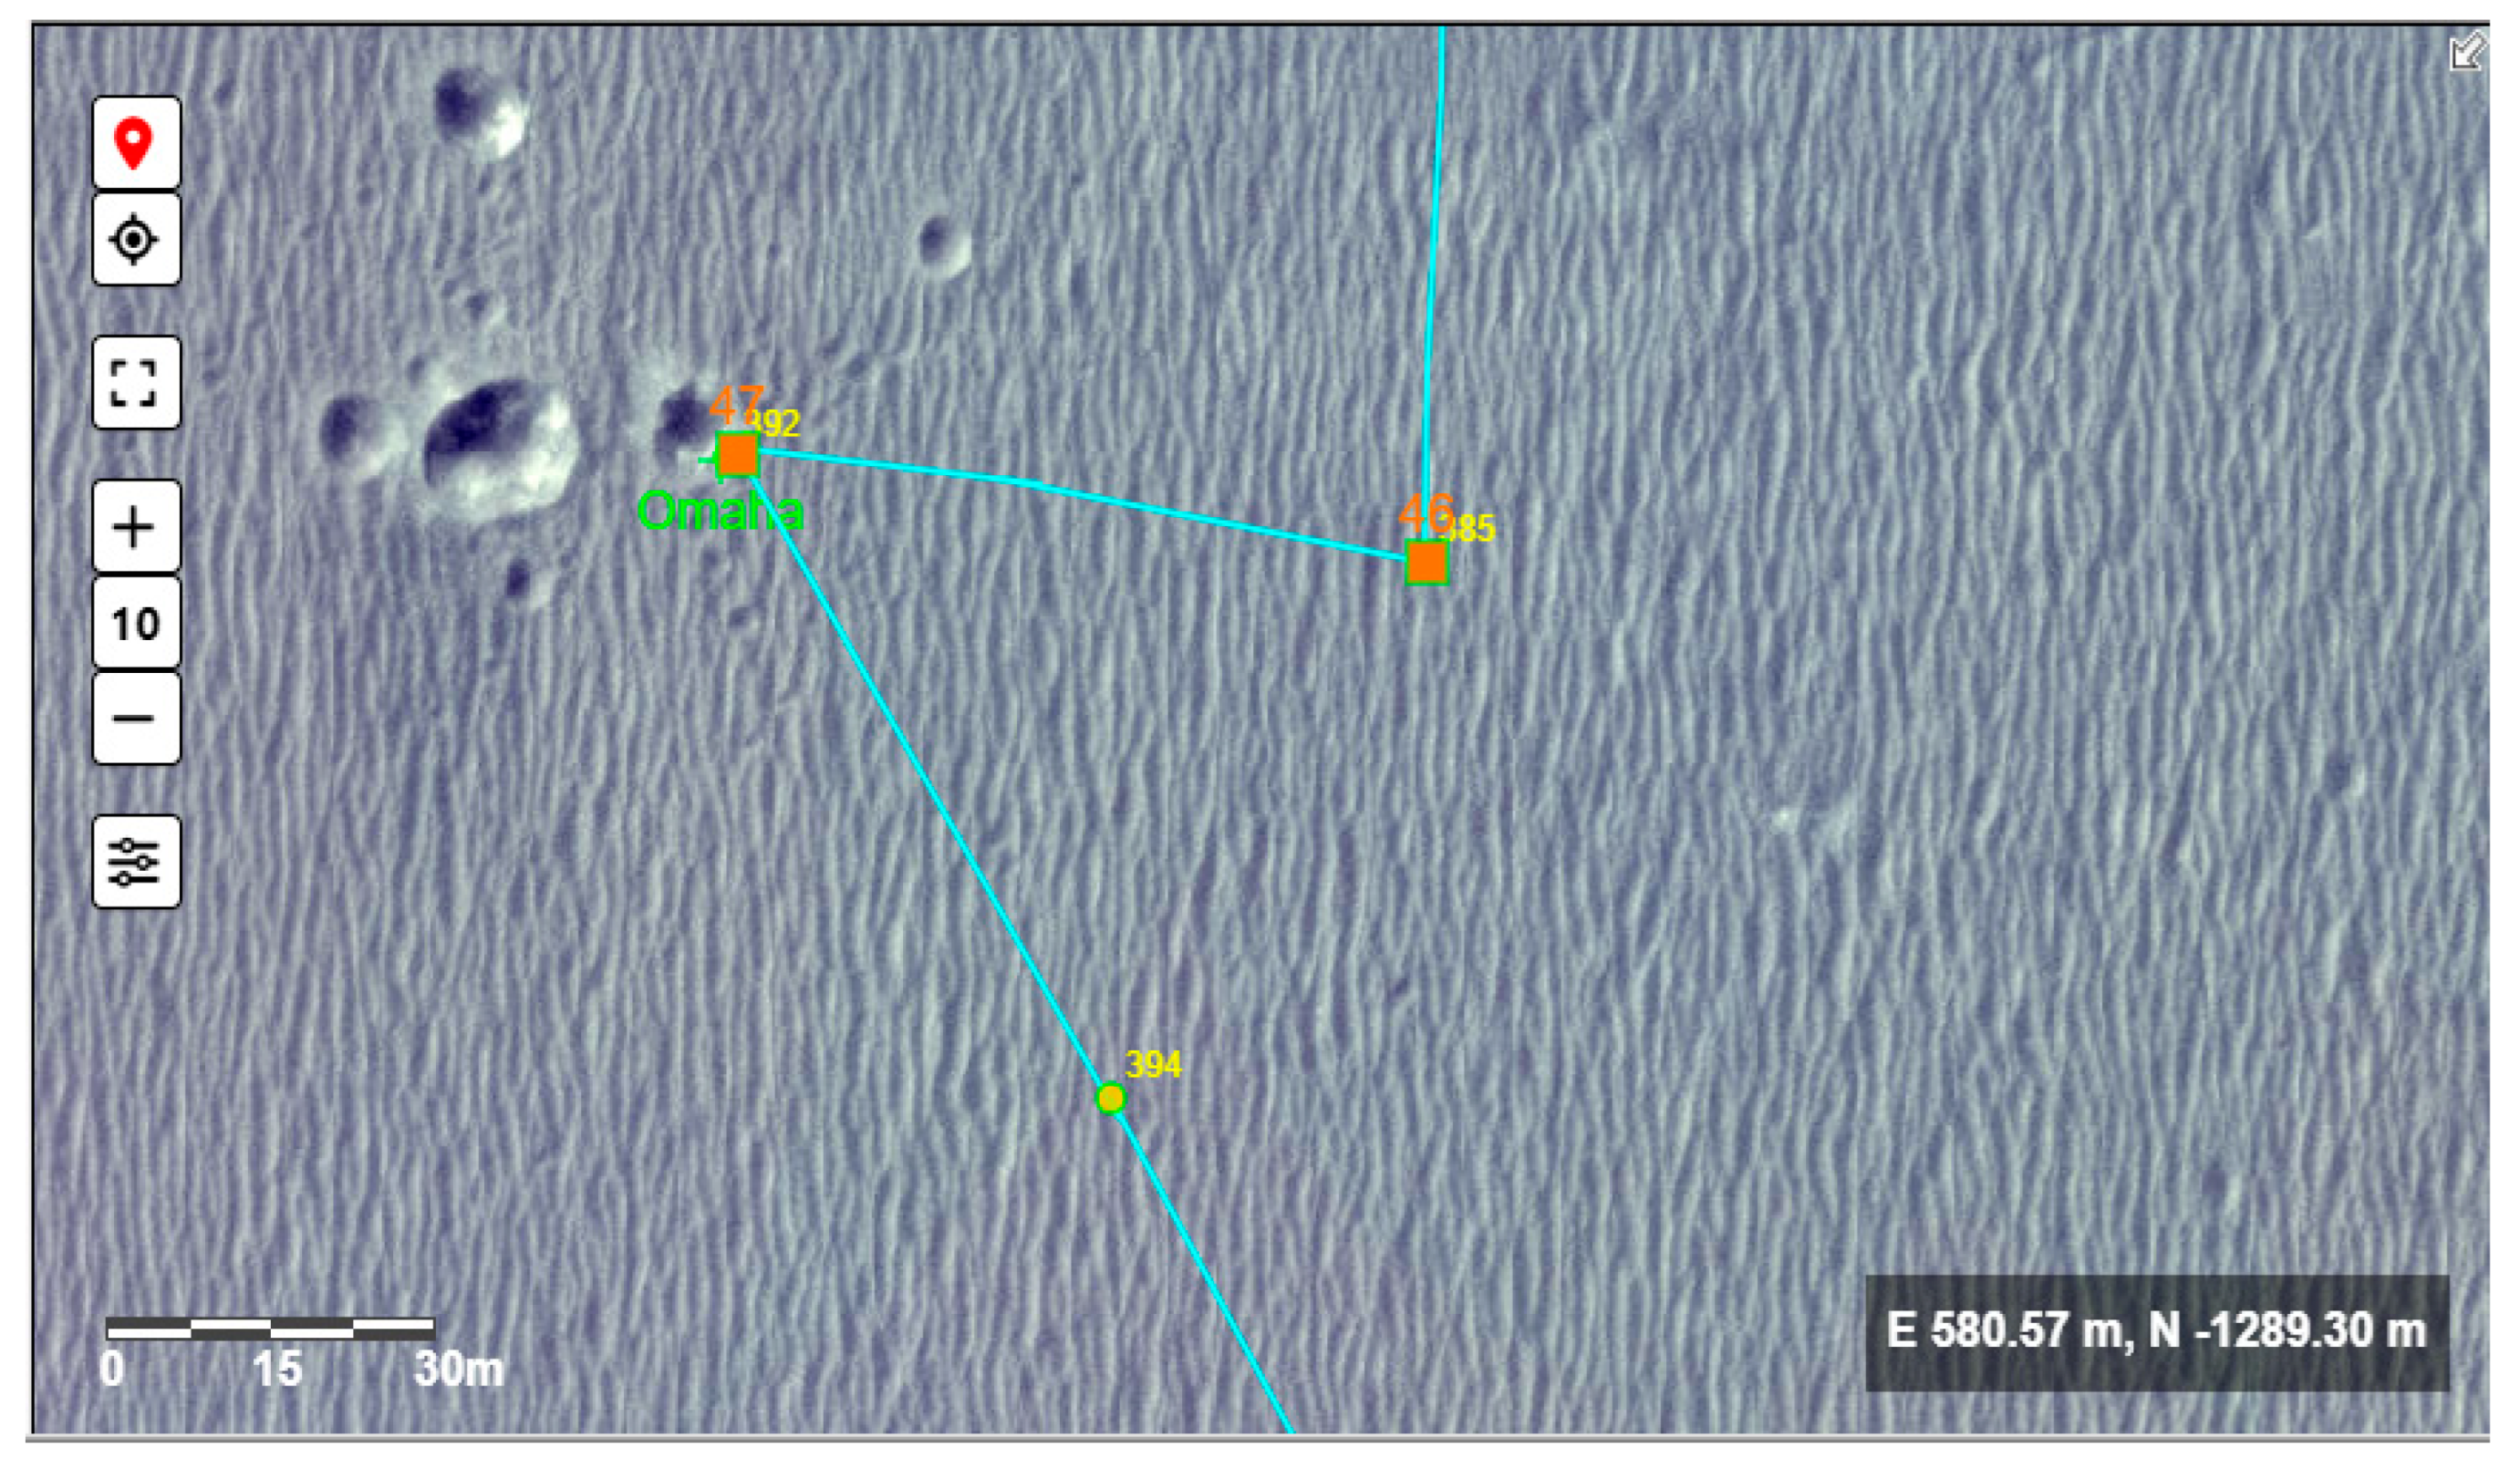
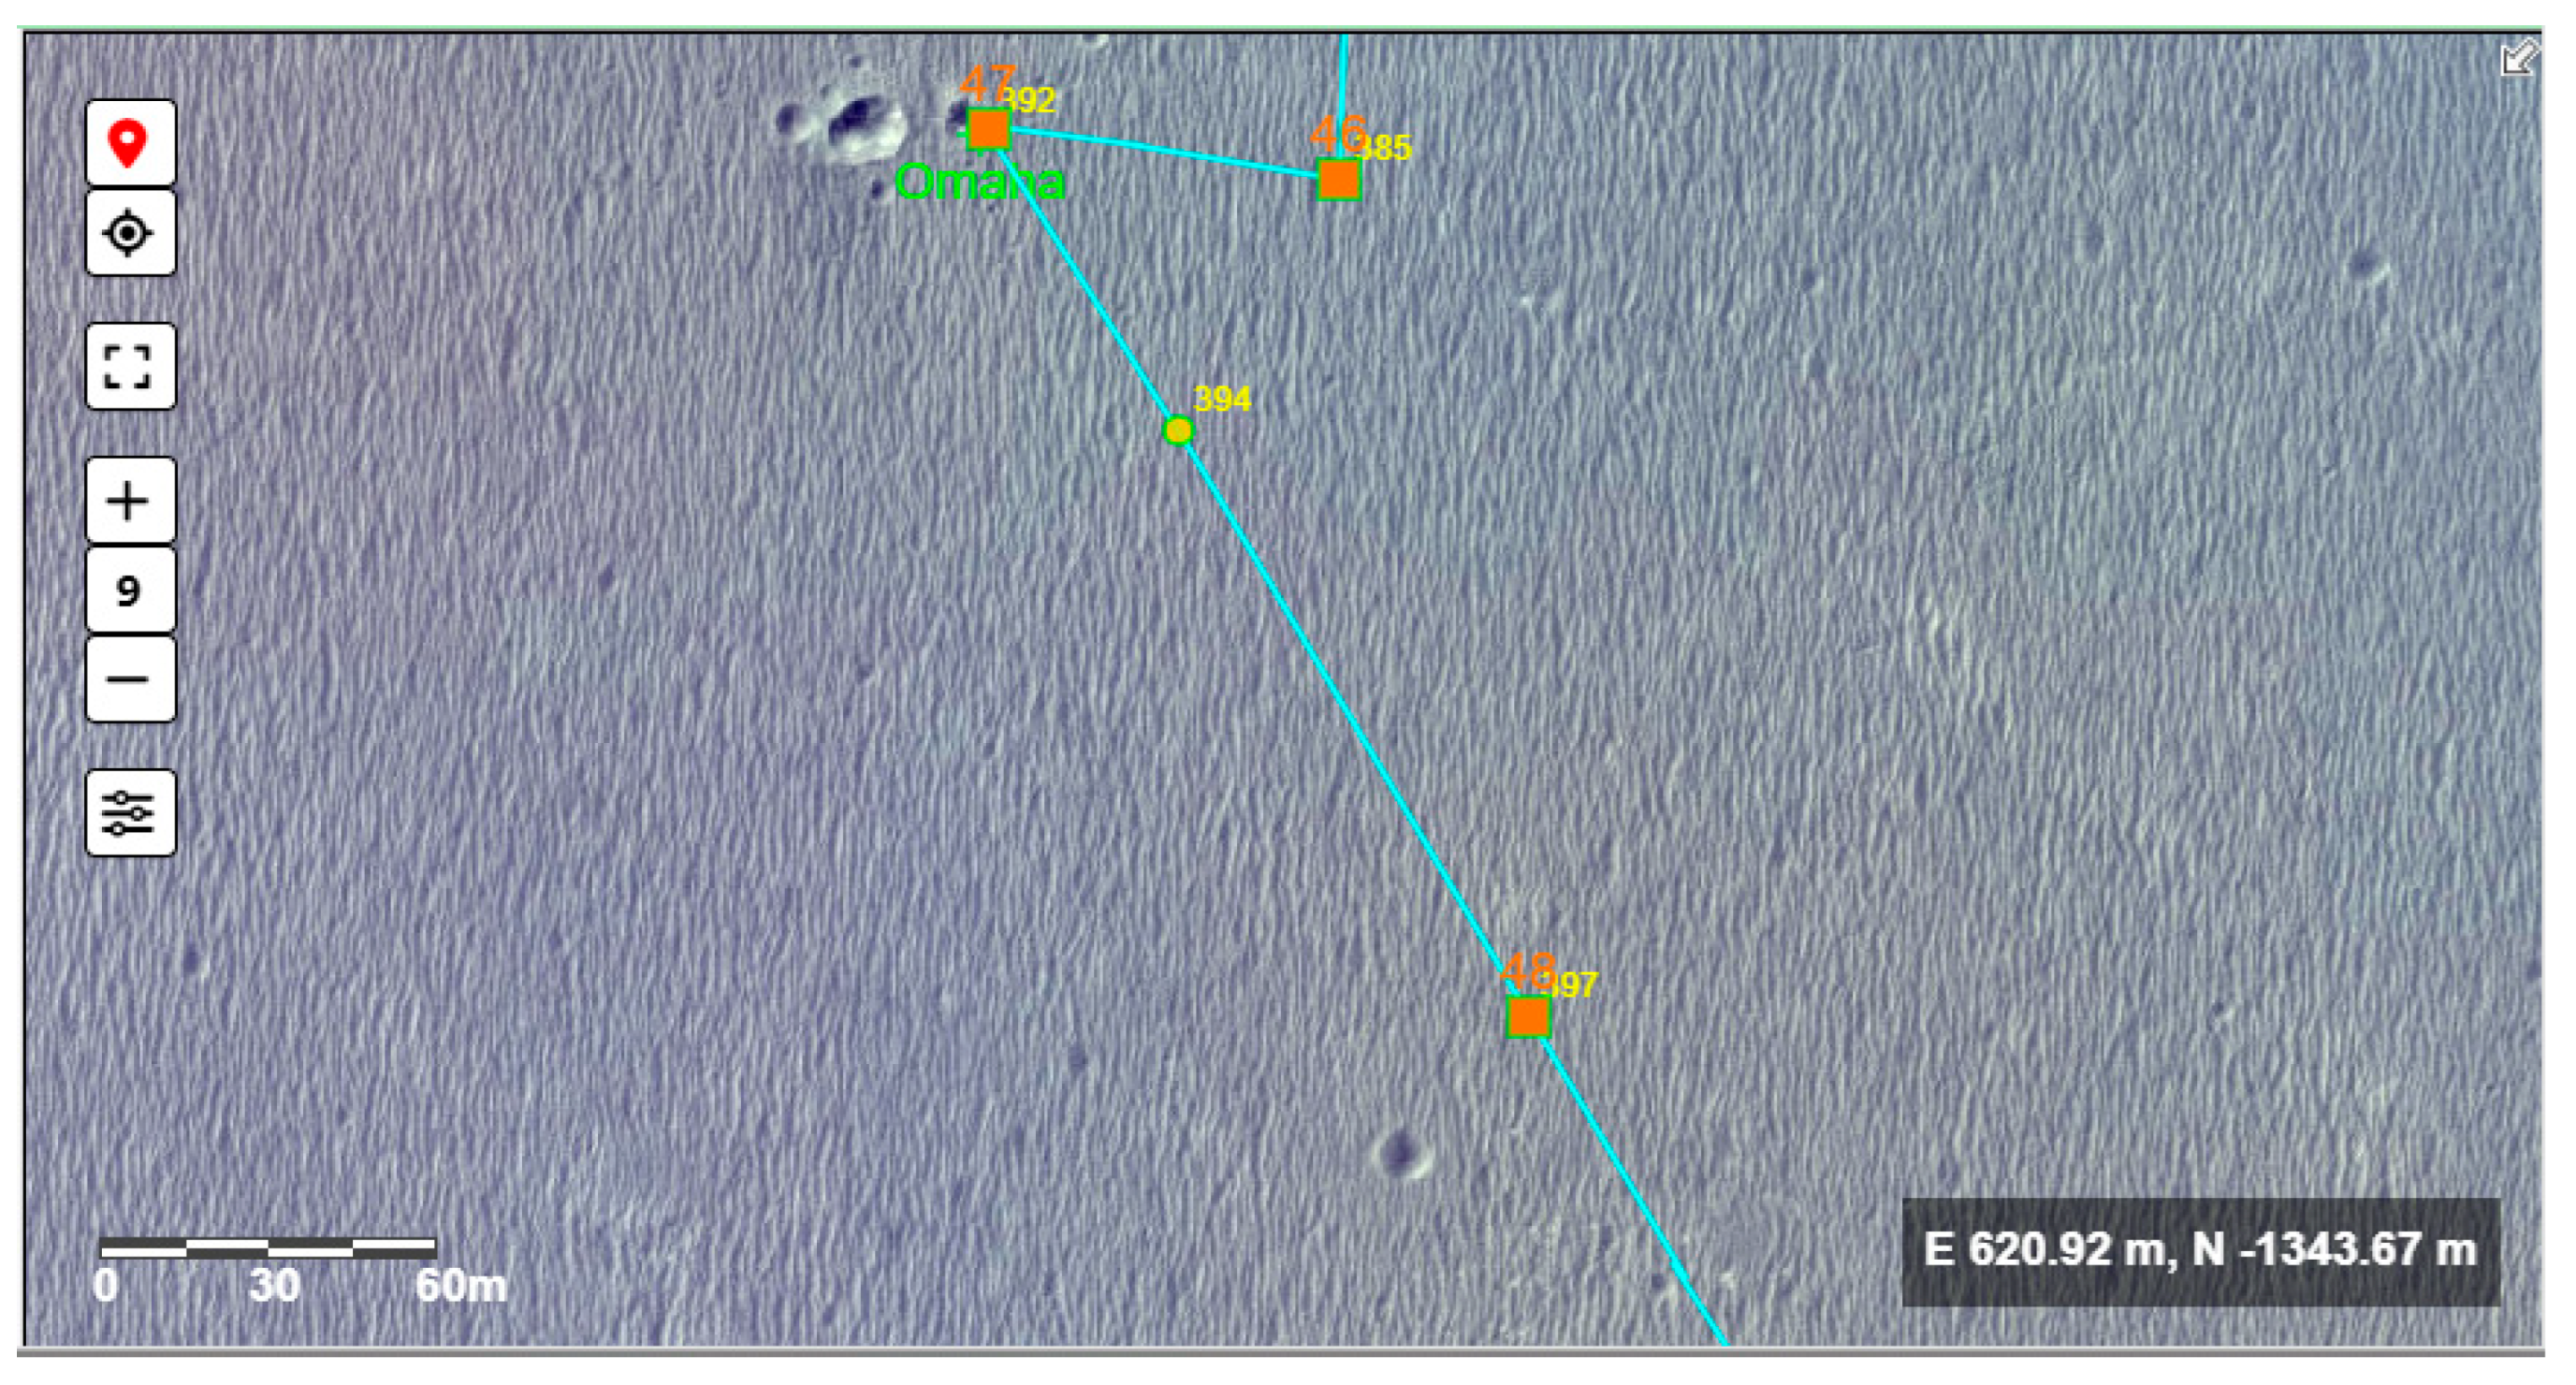
We often also have photos from some cameras taken in the same direction (
Figure 6), which allows us to determine the general characteristics of the terrain. In some places along the rover's route, tests were also carried out with other instruments (such as APXS and the Mossbauer spectrometer). Moreover there are also results from the Mars orbiter available (TES). Orbital TES data have much lower resolution, but allow the determination of large-scale changes (e.g., gradients).
In our work we use methods similar to those in [
14]. However, unlike there, we focus on typical areas of Meridiani Planum, not the rather untypical areas of outcrops within Eagle crater. Note that the mineralogy of the outcrops may be significantly different from that of the loose regolith.
The measurements were performed in series (packages) containing from several to several hundred measurements -
Table 1. Usually measurements in a given series were made for the same values of elevation and azimuth. In a few cases only, elevation and/or azimuth were changed systematically.
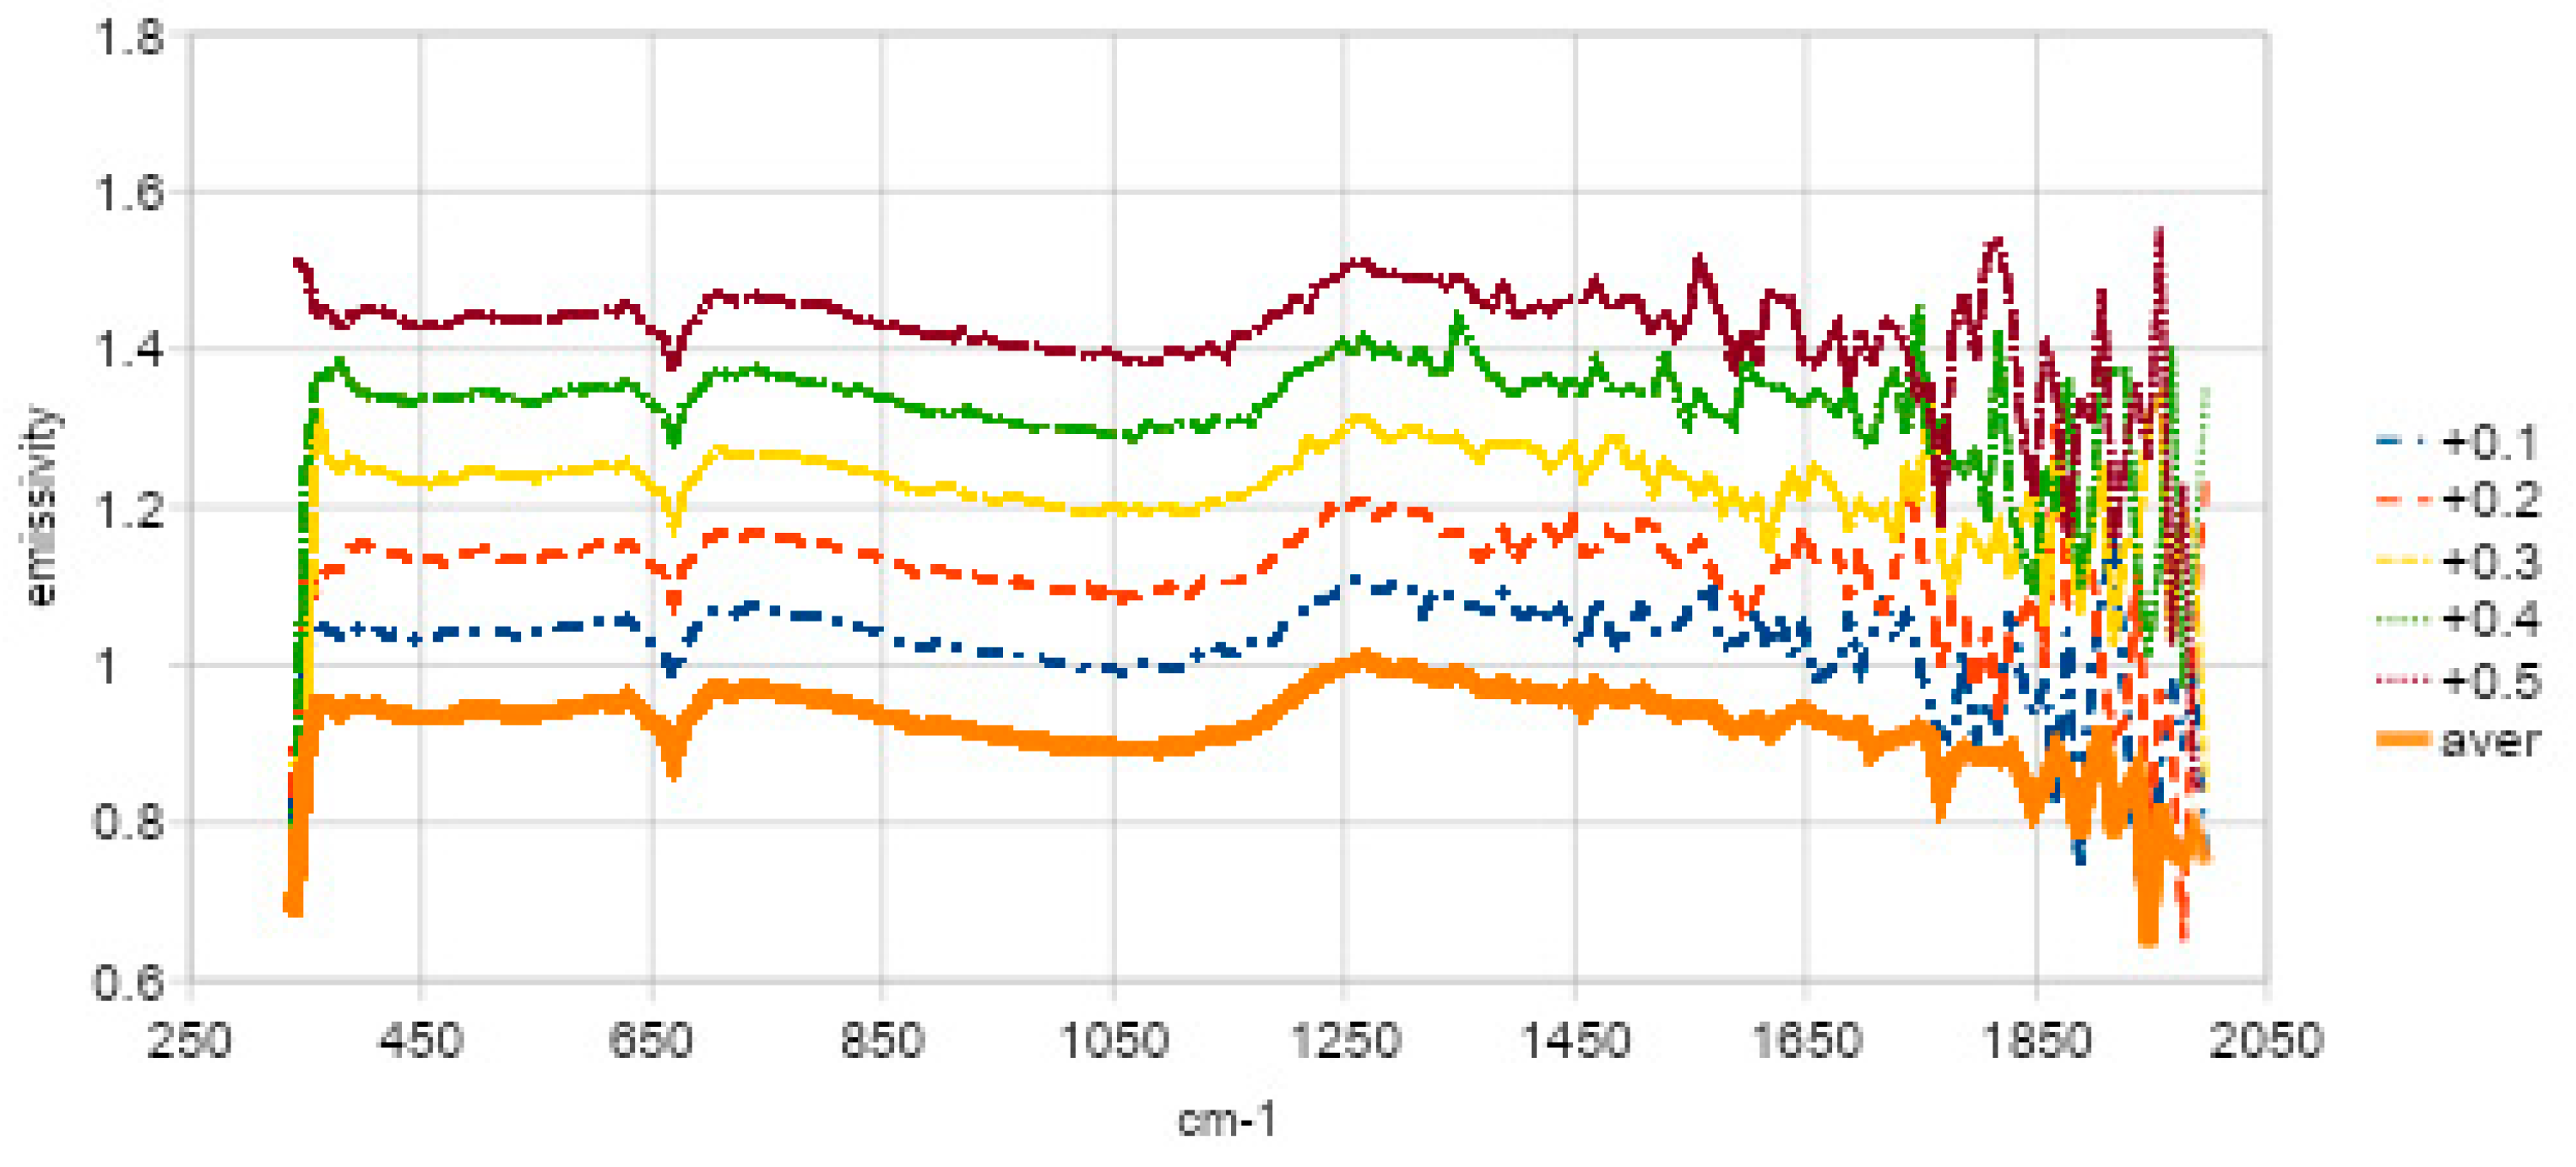
Figure 5 and
Figure 7 show examples of some of the problems when selecting data for interpretation. In
Figure 5 there are 5 profiles of emissivity taken during sol 394. As one can see, for the extreme values of wavelength the measurements show large fluctuations in values. Therefore, these profiles are averaged. Averaging reduces these fluctuations. Moreover we consider only spectra in the range 370-1500 cm
-1 excluding regions of largest fluctuations.
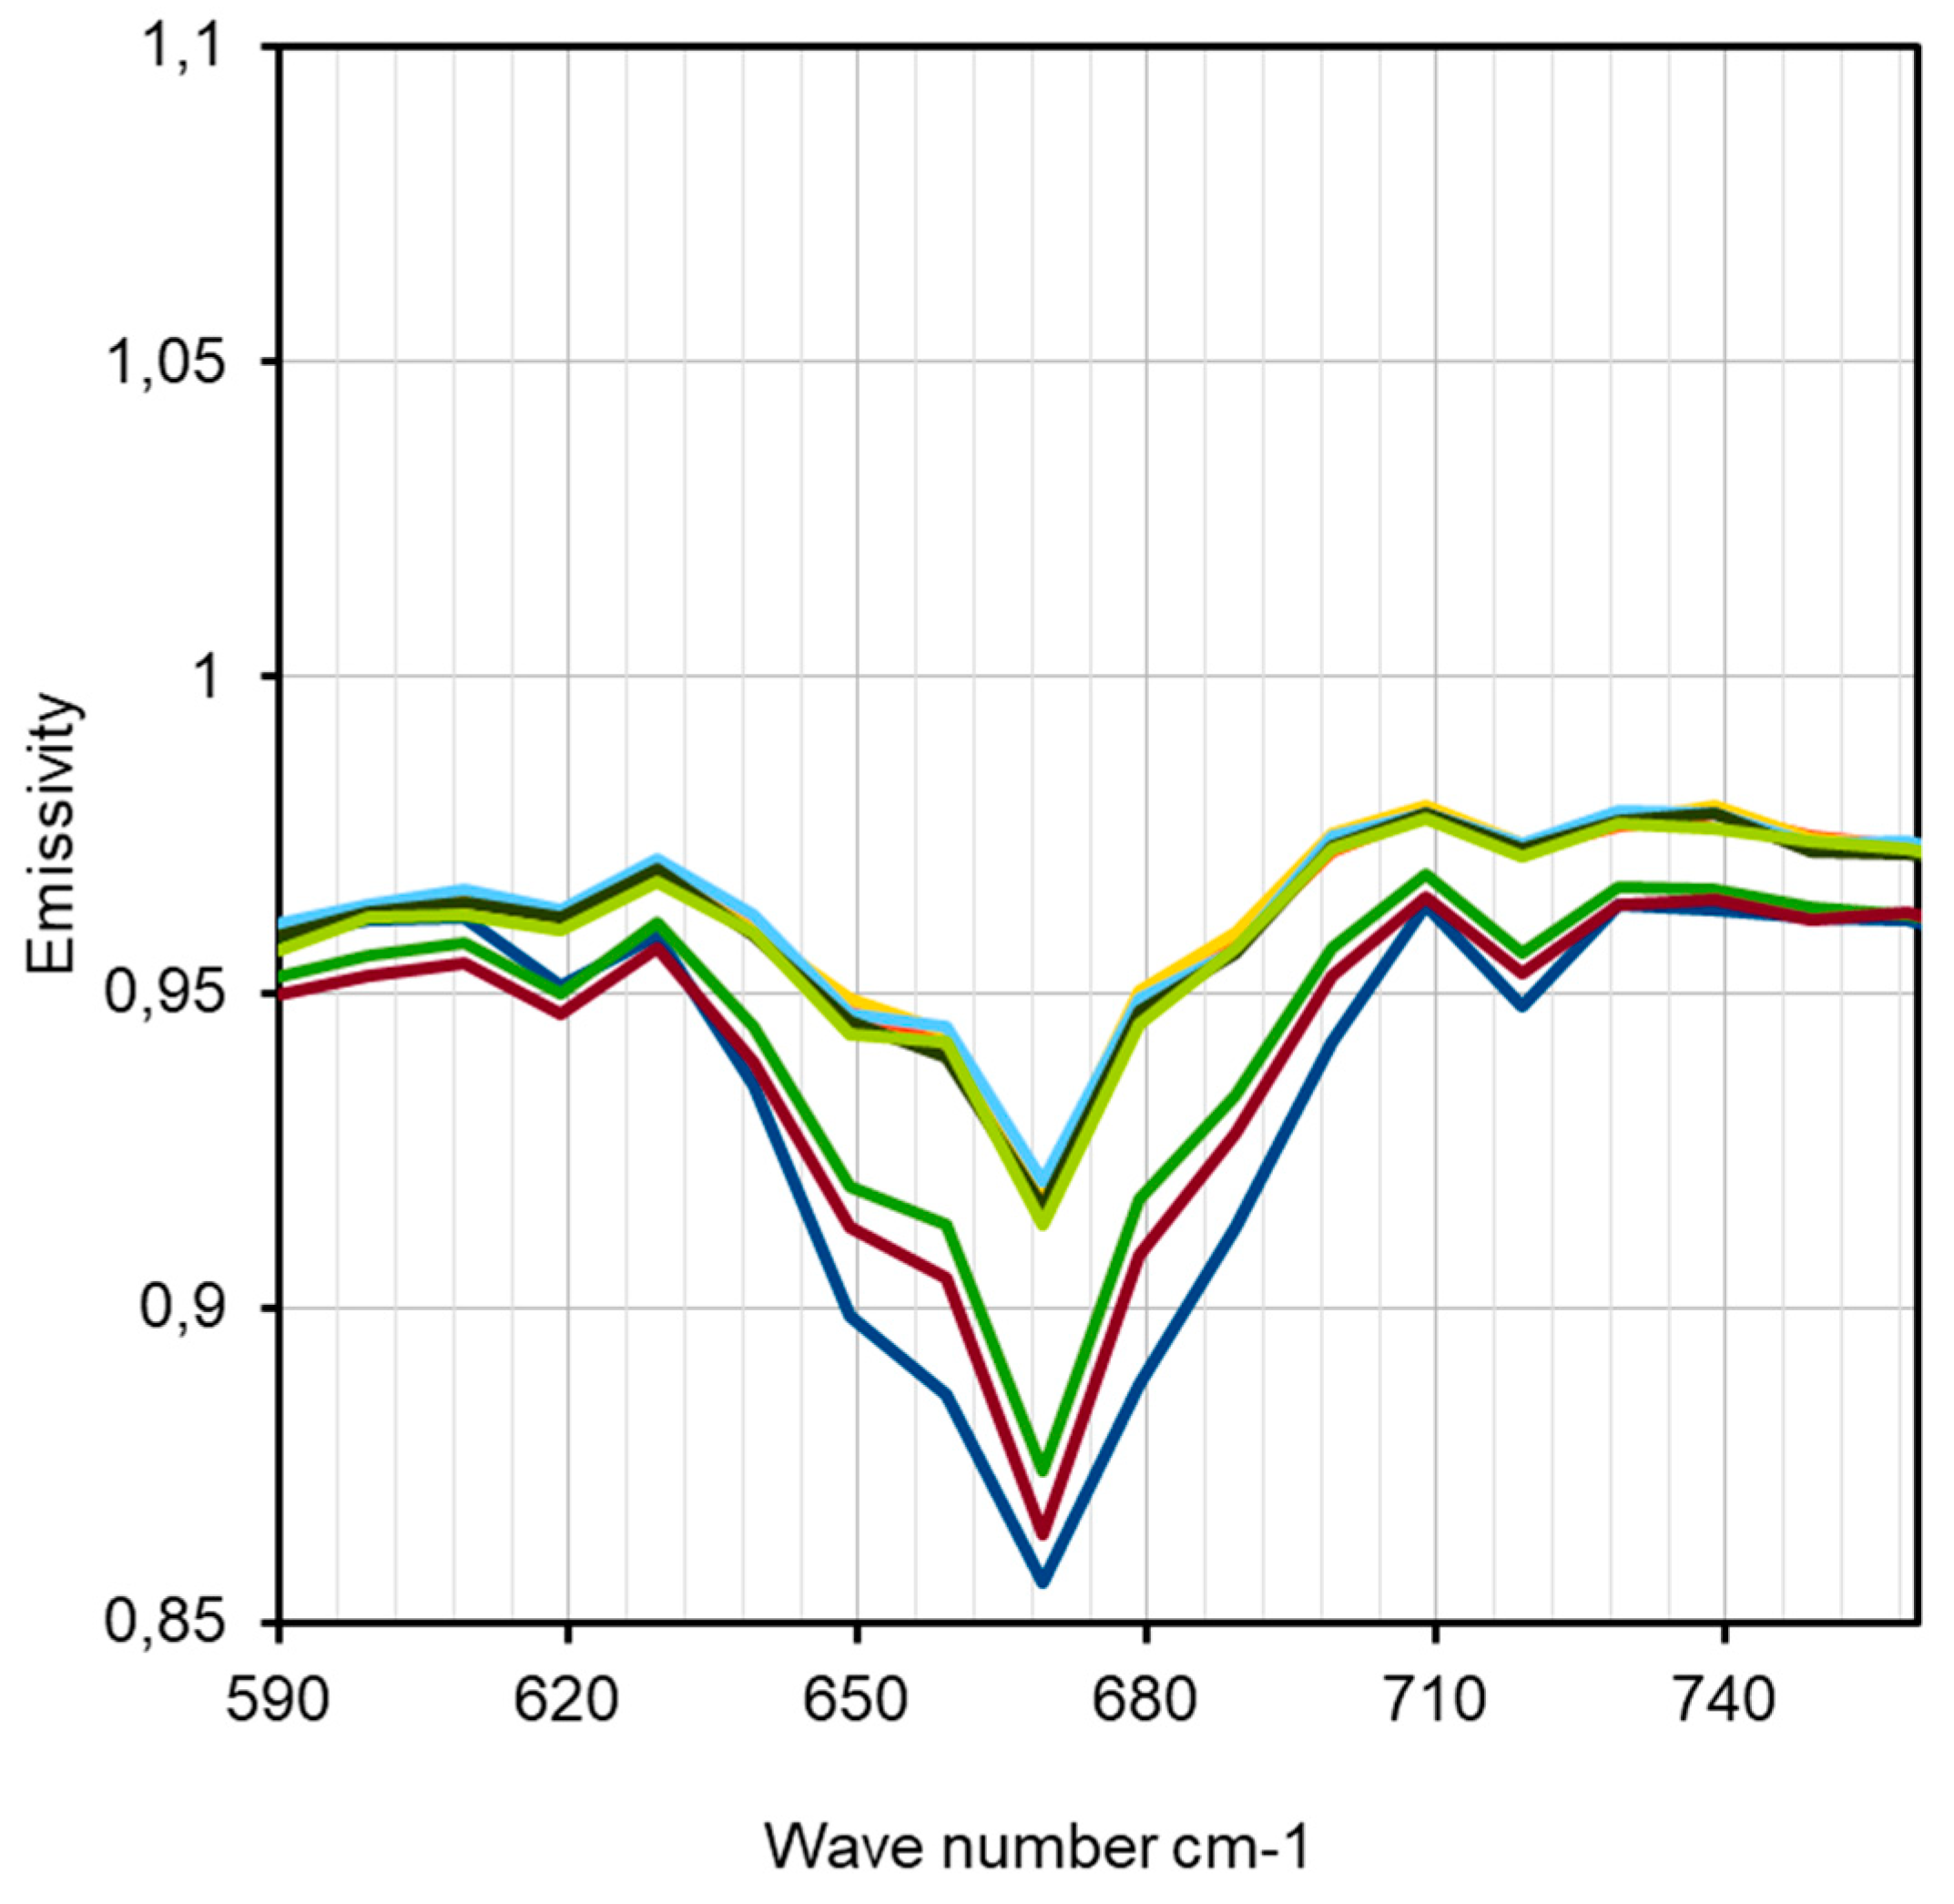
Figure 7.
Range of emissivity obtained from Mini-TES around the CO2 peak. In practice, we eliminate the range between 600 and 740 cm-1 from the interpretation. We also considered other methods of treating this peak (see text). Horizontal scale (wave number) in cm-1, vertical scale (emissivity) is dimensionless.
To remove the effect of the CO
2 peak a method of cutting out part of the spectrum is generally used, e.g. [
14]. This is also the main method used in our work. We used a notch from 600 to 740 cm
-1. We determined the mineralogical composition using the least squares method, using a linear spectral approximation from a selected library of mineral spectra. All software, data import and calculations in the research was made by L. Czechowski.
Another possible method of treating the CO2 peak is to approximate the spectrum in this range by an appropriate function. Of course, it would be best to use a function similar to the emissivity of the same minerals (without CO2 in the atmosphere). Using the least squares method, one could come closer to reproducing the mineralogy. Unfortunately, until we have relatively accurate information about the surface composition, it is difficult to choose such an interpolation. In practice, we only examined the linear or second degree interpolations and compared them with the results of the excision method.
2.1. Solution Stability
One of the properties for a reliable solution is stability towards small disturbances of data and/or methods. In order to determine the stability of our solutions, we examined the stability in respect to:
(i) relative to the initial solution approximation,
(ii) in terms of the required accuracy of the solution approximation,
(iii) relative to methods of data averaging (number or selection of averaged data),
(iv) stability against excluded regions of largest fluctuations (see above),
(v) stability towards different spectral libraries,
(vi) controls for removing unrealistic minerals from the solution.
The result of solution instability may be artifacts, i.e., the appearance of minerals (in the numerical solution) that were not present in the studied location. Therefore, to obtain an acceptable solution we use more minerals than necessary, including some whose probability of occurrence is low. The percentage value of the artifact may reach a few percent. A single occurrence of such minerals should be treated with caution as an artifact. However, if it appears systematically, then there is a high probability that this mineral was indeed present in the studied location, i.e., we are not dealing with an artifact. See also problems of pyrite and quartz discussed below.
4. Discussion
4.1. Mineralogy Along Rover's Route
The calculations described in
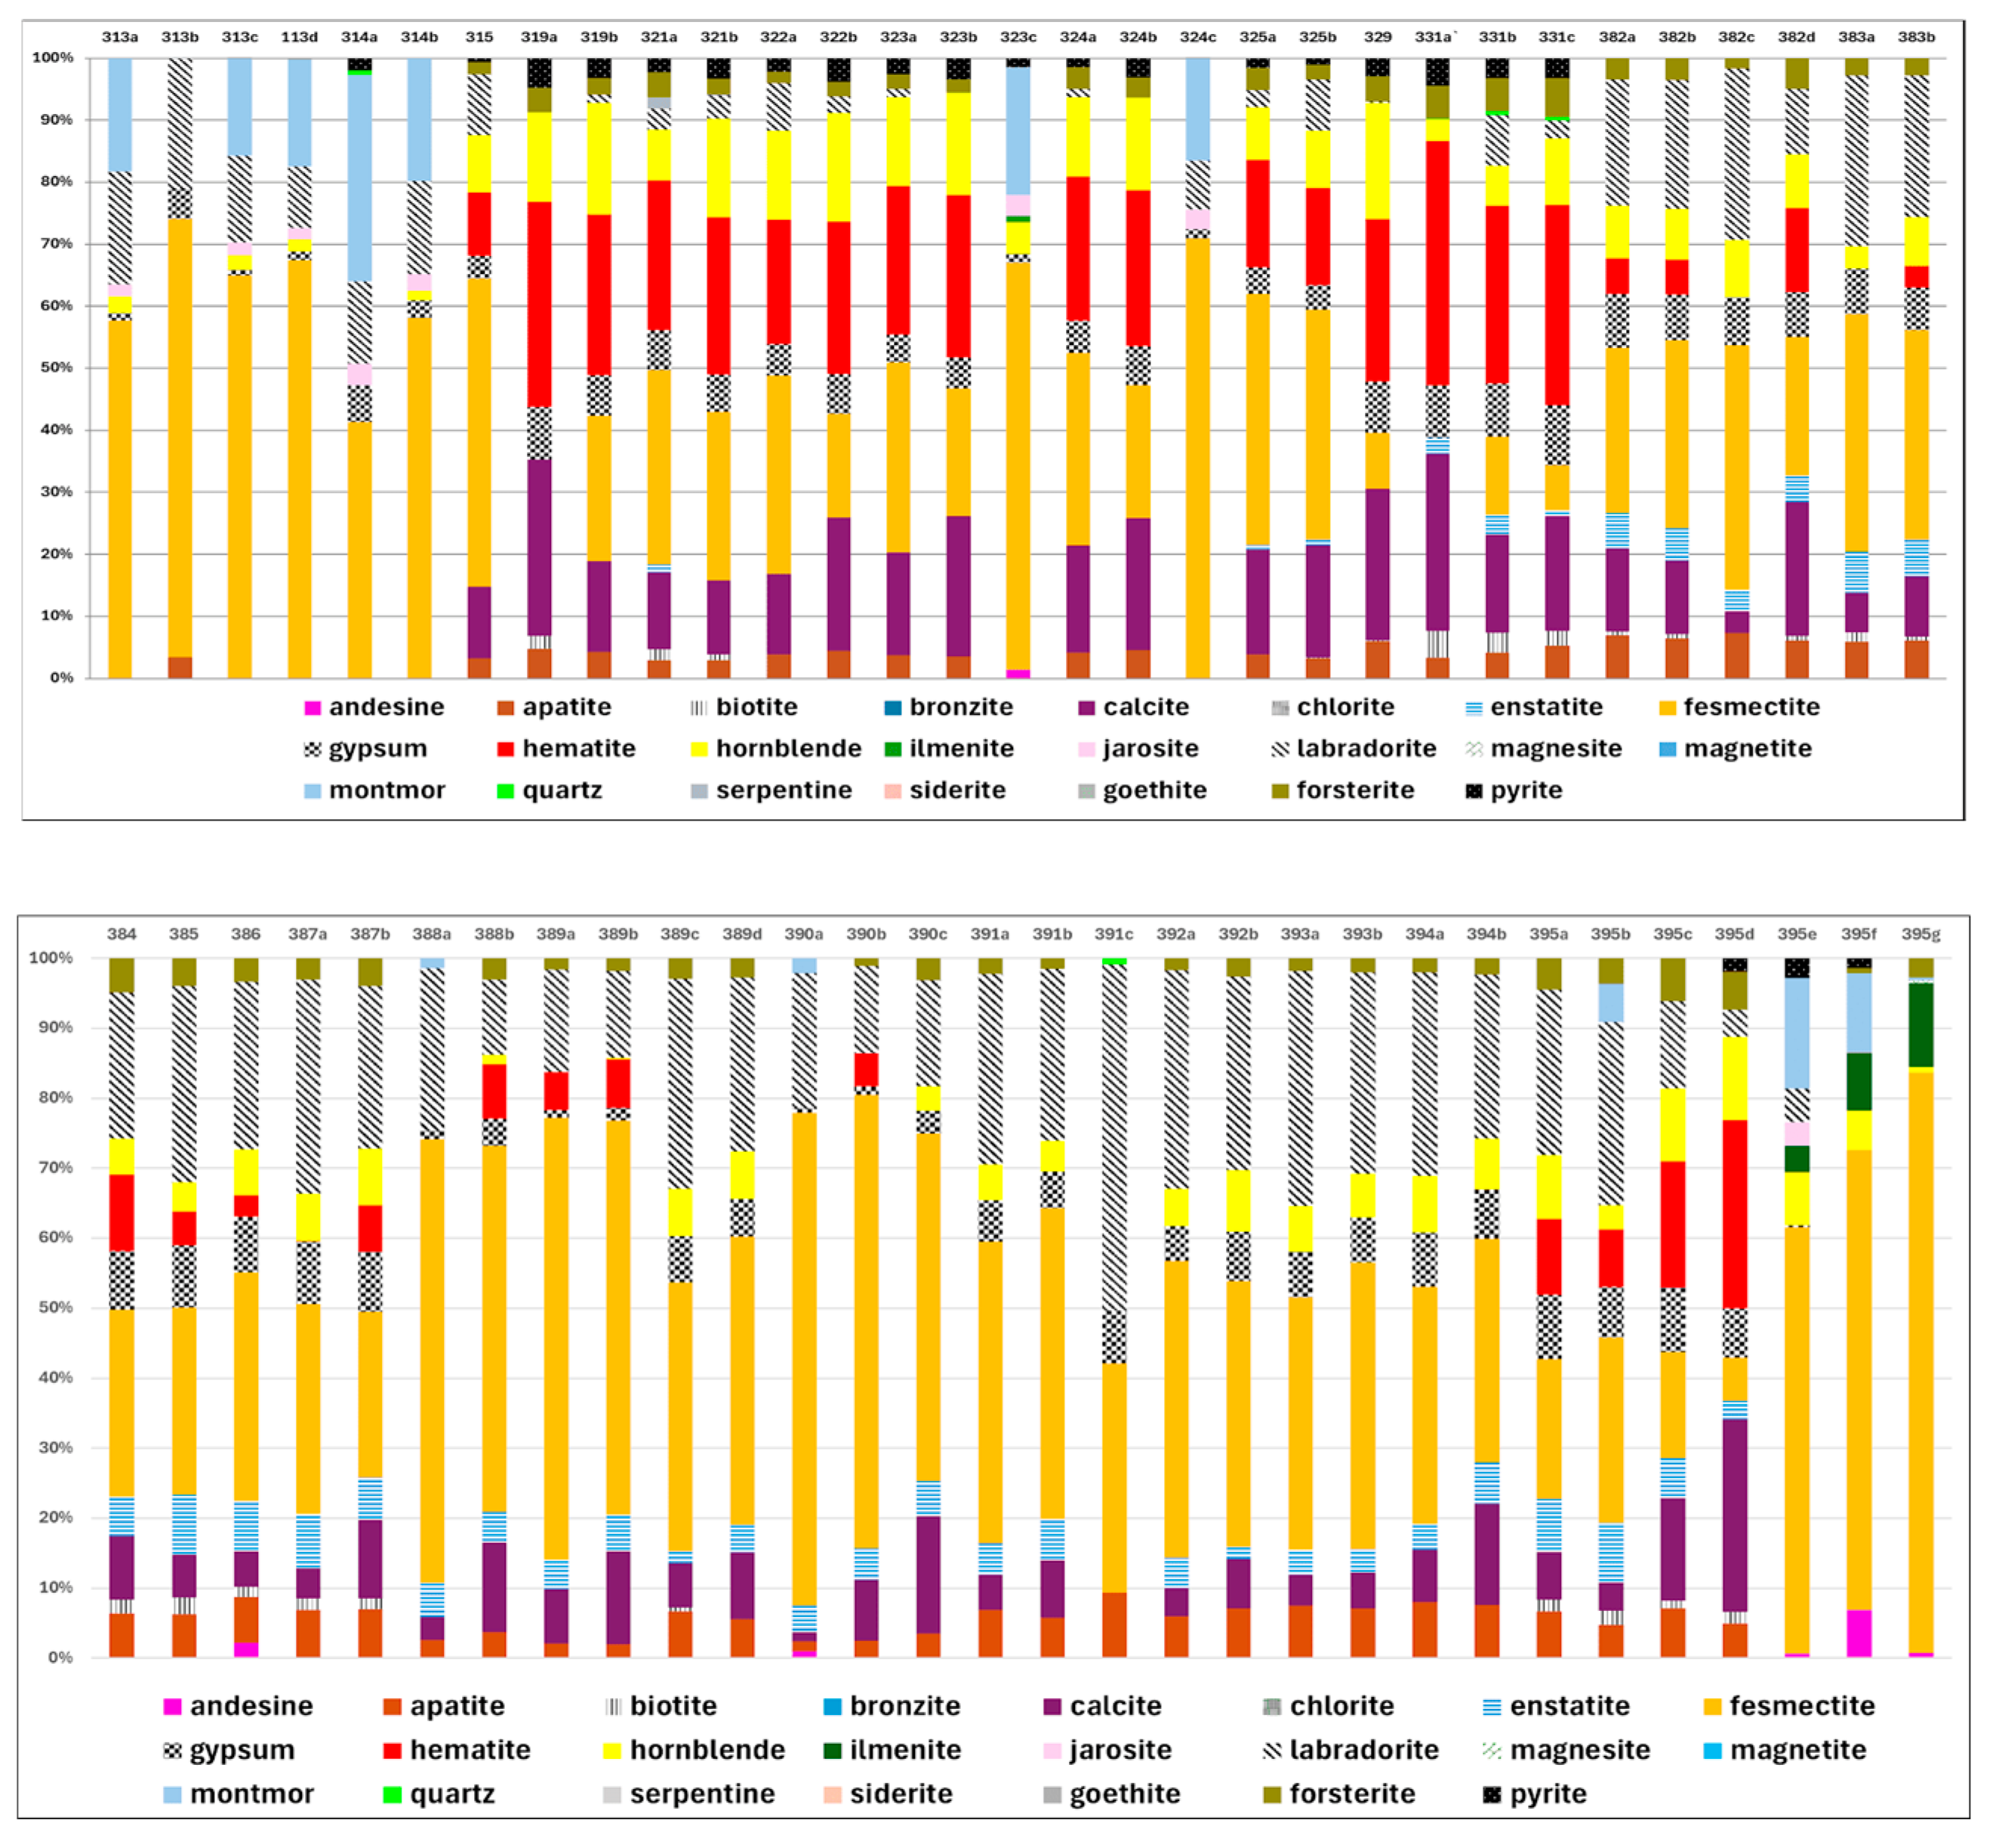
Section 3 have given the relative content of minerals whose library spectra were used in the calculations. Based on the mineralogy shown in
Figure 12 (61 bars), we distinguished 6 sectors on the rover's route.
Table 3 shows the average content of the considered minerals in each of the 6 sectors. Below we describe individual sectors of the route.
Table 3.
Our results after averaging over individual sectors of the rover's route. Empty cells indicate very small values (less than 0.1%).
Table 3.
Our results after averaging over individual sectors of the rover's route. Empty cells indicate very small values (less than 0.1%).
Range of sectors, from:
to:
Numbers of measurements
Sector No
|
313- 314b
6
1
|
315-331c
19
2
|
382a-389b
15
3
|
389c-394a
14
4
|
395a-395d
4
5
|
395e-395g
3
6
|
Average for all measurements |
| andesine |
|
0.1% |
0.1% |
0.1% |
|
2.8% |
0.21% |
| apatite |
0.6% |
3.6% |
5.5% |
6.1% |
5.9% |
|
4.31% |
| biotite |
|
0.8% |
0.9% |
|
1.6% |
|
0.57% |
| bronzite |
|
|
|
|
|
|
0.00% |
| calcite |
|
16.5% |
9.3% |
7.0% |
13.3% |
|
9.91% |
| chlorite |
|
|
|
|
|
|
0.00% |
| enstatite |
|
0.5% |
5.7% |
3.7% |
6.1% |
|
2.82% |
| fe-smectite |
60.0% |
27.7% |
37.7% |
43.4% |
16.9% |
69.8% |
38.31% |
| gypsum |
2.8% |
5.8% |
6.4% |
5.4% |
8.2% |
0.1% |
5.45% |
| hematite |
|
22.2% |
4.9% |
0.3% |
16.0% |
|
9.24% |
| hornblende |
1.4% |
11.5% |
5.2% |
4.9% |
8.7% |
4.6% |
6.94% |
| ilmenite |
|
0.1% |
|
|
|
8.0% |
0.41% |
| jarosite |
2.0% |
0.3% |
|
|
|
1.2% |
0.36% |
| labradorite |
15.2% |
3.2% |
21.1% |
26.9% |
16.6% |
1.6% |
15.04% |
| magnesite |
|
|
|
|
|
0.2% |
0.01% |
| magnetite |
|
|
|
|
|
|
0.00% |
| montmorillonite |
17.4% |
2.0% |
0.1% |
0.1% |
1.4% |
9.2% |
2.92% |
| quartz |
0.1% |
0.1% |
|
0.1% |
|
|
0.05% |
| serpentine |
|
0.1% |
|
|
|
|
0.03% |
| siderite |
|
|
|
|
|
|
0.00% |
| goethite |
|
|
|
|
|
|
0.00% |
| forsterite |
|
3.0% |
3.0% |
1.9% |
4.9% |
1.2% |
2.49% |
| pyrite |
0.3% |
2.6% |
|
|
0.5% |
1.4% |
0.94% |
| SUM |
99.98% |
100.00% |
100.00% |
99.97% |
100.00% |
100.00% |
100.00% |
4.1.1. Sector 1, (Containing Measurements from sol 313a to sol 314b, 6 Measurements in Total)
Measurements in sector 1 were performed on the surface of bright, fractured rocks (with visible layering). Spherules are visible on the surface. They are usually stuck to the rock. In this sector, the geomorphology has changed only slightly.
The main minerals found in sector 1 are minerals from the smectite group: fe-smectite (smectite with Fe contain) and montmorillonite - together over 67%. These are phyllosilicates (sheet silicates). Smectites are usually formed from the weathering of basalt (or its chemically equivalent gabbro or some volcanic glasses). Many smectites are formed in volcanic hydrothermal systems (e.g., geyser). The hot water may percolate the volcanic ash through fissures or pores. It leads to replacing silica by phyllosilicates.
Labradorite is also present in significant amounts (~15%). The labradorite ((Ca, Na)(Al, Si)4O8) is a calcium-enriched feldspar mineral. It is an intermediate to calcic member of the plagioclase series. Labradorite occurs in mafic igneous rocks and is common in basalt and gabbro. The same rocks may also be responsible for hornblende.
Gypsum (2.8%) and jarosite (2%) are present in small amounts. They are sulfate minerals. Gypsum is evidence of water in the past on Meridiani Planum. It may have been created during the evaporation of water reservoirs during volcanic exhalations in geysers. It can also crystallize from groundwater in rock crevices. This is the type of fissure gypsum that the rover found on its way. Jarosite is an indicator of strongly oxidizing conditions prevailing at the surface of Mars.
From the above description, it can be seen that the minerals in this sector are the result of the interaction of basalt rocks in the aquatic environment and hydrothermal processes. Minerals that testify to the participation of water in the history of Meridiani Planum are minerals from the smectite group and gypsum. Other minerals present are mainly components of basalt (labradorite, hornblende).
Despite the presence of spherules, no hematite was found in this sector (see discussion below).
4.1.2. Sector 2, (sols 315-331c, 19 Measurements in Total)
Here the rover crossed the crater boundary (and mineralogical boundary, sols 314/315) and entered the ejecta cover. The rover's route seems monotonous in this region, but there are differences in the morphology and appearance of the surface. Measurements were first performed on light-colored fractured rocks with visible layering (sol 315). Spherical concretions are visible over the entire surface. Then the rover entered a flat area covered with weathered coarse material. Bright weathered rocks are visible in the distance (sol 321a). The terrain changes into a more dune surface with ripples (sol 322a). Bright material is visible on the dune ridges. From the side, a small crater with bright ejected material is visible (in the photo from the rear camera) (sol 329). The dune area, covered with spherical concretions extends further. There are ripple ridges with light surface material (sol 331a).
We observe large mineralogical differences between sectors 1 and 2. In sector 2, the content of clay minerals is much lower, falling from 67% to approximately 29%. The content of labradorite is also lower (from 15% to 3.2%). Hematite (22%) and calcite (16.5%) appear. The content of gypsum (up to 5.8%) and hornblende (up to 11.5%) is increasing. The higher contents of gypsum and calcite probably indicate a greater importance of evaporite/sedimentation processes. Minerals labradorite, hornblende, forsterite (olivine), biotite, enstatite are the components of basalt rocks. Apatite also appears (3.6%).
Note that our results also indicate the presence of pyrite at almost all measurement sites in sector 2. The average pyrite content is 2.6%. Similar content appeared in sol 314a, but there it could be an artifact. In the case of sector 2 however, it is rather not an artifact, because pyrite appears systematically. The presence of pyrite is known from Martian meteorites (e.g., [
16]). However, there are problems with identifying pyrite from Martian artificial satellites. This is discussed, among others, in [
15].
4.1.3. Sector 3, (sols 382a-389b, 15 Measurements in Total)
In the beginning of the sector there is the dune area (sols 384 - 388a) covered with spherical concretions. There are wrinkle ridges with bright material on the surface. Larger dunes and a dune-covered crater are visible (sol 382a). Later, outcrops of light rocks are seen (sol 384). Then rock rubble are visible. Later there is a dune area. Spherules are visible on the surface (sol 388a).
The composition of the mineralogy of this sector is similar to that of the previous sector but there is a radical reduction in the amount of hematite (below ~5%, on average). However, the contents of fe-smectite (~38%) and labradorite (up to 21%) increase. Enstatite appears in significant amounts (5.8%).
4.1.4. Sector 4, (sols 389c-394a, 14 Measurements)
The rover drove onto the slope of a small crater (sol 389c) covered with dark material. A breccia of light-colored cracked rocks is visible around the crater. Next, the rover enters a dune area with visible rock debris and outcrops of light rocks (sol 390a-393a). Spherules are visible everywhere on the surface. Among the sulfates, there is jarosite, which is confirmed by the Mossbauer spectrometer. The main minerals here are clay minerals (fe-smectite, average 43%, max. 70%) and labradorite (~27%, max. 49%). Apart from one point (sol 390b) there is no hematite. However, we find: apatite, calcite, gypsum (total average ~18%), as well as minerals related to basalt rocks: enstatite, hornblende and forsterite (total average ~10%). We also have trace amounts of quartz (0.1%), possible an artefact.
4.1.5. Sector 5, ( sols 395a-395d, 4 Measurements)
Measurements were made on the surface with spherules. The amount of clay minerals decreases dramatically (in total they constitute only ~18%). Hematite appears again (16%). Basalt rock minerals dominate (labradorite, enstatite, hornblende, forsterite, biotite, total ~39%). They are accompanied by gypsum, calcite and apatite (together ~27%). Pyrite appears in the 395d measurement (below 2%, only).
4.1.6. Sector 6, (sols 395e -395g, 3 Measurements)
Measurements are taken on a surface with spherules. Stripes of light material are visible. In the last sector of the route there is a radical change in mineralogy. The mineralogy resembles that from sector 1. The share of clay minerals is very high (approximately 79%). There is no gypsum, calcite, or hematite. The difference from other sectors is the significant content of ilmenite (8%). Ilmenite, as a product of weathering of igneous rocks, often occurs in sands and gravels. Therefore, it is not strange that it appears in the dune area (where the rover was moving). Andesine, hornblende, jarosite and labradorite are also found in smaller quantities. Pyrite was observed in sol 395e and 395f (2.9% and 1.4%).
4.2. General Processes Along the Route
In the 5 sectors of rover's route considered, several groups of minerals were found: minerals that may be related to processes in the water reservoir (gypsum and calcite), phyllosilicates (fe-smectite and montmorillonite) and minerals occurring in rocks of basaltic composition (andesite, enstatite, labradorite, etc.). In the sector 6 neither gypsum nor calcite were observed. In the remaining sectors, the processes probably included hydrothermal processes, including the interaction of water and basaltic rocks leading to the formation of phyllosilicates and the processes of evaporation and/or precipitation of calcite and gypsum from aqueous solution. Similar processes occurred in other areas of Meridiani Planum. The absence of gypsum and calcite in the sector 6 indicates a lesser importance of evaporation and/or precipitation processes in this sector. Some other processes are discussed below.
4.2.1. Correlations
An inspection of
Table 3 indicates a few correlations between some minerals. There are positive correlations between the contents of the following minerals: calcite - gypsum, fe-smectite - montmorillonite, enstatite - forsterite. The corresponding values of the sample Pearson correlation coefficient are: 0.45, 0.44, 0.35. These correlations may reflect similar conditions of formation due to sedimentation/evaporation, weathering processes leading to phyllosilicates, or content of basaltic minerals. Note also the strong negative correlation between contents fe-smectite - hematite: - 0.73. This may indicate some transfer of Fe.
4.3. Problems of Hematite and Spherical Concretions
One problem in our results that needs to be explained is the lack of hematite in some places (e.g., sector 1 ) and the significant amount of hematite (e.g., 22%) in sector 2. We can observe a similar situation in some areas on Earth. The spherical concretions from Utah are similar in shape and size to the Martian concretions (known as blueberries). However, the Utah concretions in the Dakota Formation do not have hematite. They probably once had a coating of iron oxides that were dissolved by flowing meteoric solutions [
17]. The iron oxides were probably washed out of the concretions and recrystallized elsewhere. Indeed, in Utah, layers of red rocks with iron oxides are observed, alternating with white layers (from which the hematite was washed out). The solutions must have been acidic to dissolve the iron oxides. On the other hand, concretions from the Navajo Formation in Utah, called Moqui, preserve a layer of iron oxides. A similar explanation can be given for the absence of hematite in some places (and in concretions) in Meridiani Planum, despite the presence of hematite in concretions elsewhere. Such processes are investigated in our studies of the Utah concretions and other formations [
18], (
Figure 2 B, C).
Note also that observations of hematite made by the Thermal Emission Spectrometer on board the Mars Global Surveyor have shown that the region with hematite is not continuous and there are significant areas where the TES data do not show hematite. This is an analogy here to the situation we observed in some parts of Opportunity route, although MGS data are on another scale.
4.4. Problems of Pyrite and Quartz
Pyrite is a very interesting mineral, among others, because of its occurrence with various important minerals, including Au, Pt, Cu, Ni [
19]. These metals may be crucial for the future Mars colonies. However, for some reasons pyrite detection by Mini-TES is difficult. This is mainly related to the spectrum in the IR range. An important characteristic peak in the pyrite spectrum is located close to 400 cm
-1. This is close to the border of the range of spectra considered in the current work. This cut-off is forced by the unstable behavior of measurements outside some range. In addition, the spectra of several minerals also have their peaks in this range, e.g., marcasite, chalcopyrite, clinopyroxene, magnesite, dolomite, etc - [
15]. Despite these reservations, the presence of pyrite is very likely. In sector 2 it stays at the level 1.5%-3% (except for one measurement). This does not resemble the behavior of a random error. One can only have doubts about pyrite in sol 314a.
Note also that detecting pyrite from orbit is additionally difficult in the case of small size of the region with pyrite. Dust in the atmosphere of Mars can also distort the details of the spectrum.
Quartz also appears several times in our numerical solution. However, its amount is too low to consider this result reliable. It appears in minimal amount (average 0.05%) in quite random sols, so it may be an artifact.
4.5. Comparison with Mossbauer and APXS Results
The Opportunity rover was also equipped with a Mossbauer spectrometer (MB) and Alpha Particle X-ray Spectrometer (APXS). MB was to obtain the mineralogical identification of iron-bearing phases (e.g., oxides, silicates, sulfides, sulfates, and carbonates). The APXS is to determine the elemental composition of Martian soils or rocks. We found two sols, during which Mini-TES as well as MB and APXS measurements were taken. These are sols: 392 and 393. We used data from [
20].
Comparing the data from the Opportunity Mini-TES and APXS instruments, we can see a high SiO2 content - (39.4% APXS). This is due to the fact that there is a large amount of clay minerals on the surface - aluminosilicates, plagioclase, pyroxene, amphiboles and olivines. According to our interpretations based on Mini-TES, the sols 392 and 393 contain about 40% fe-smectites, 40% plagioclase, 3% pyroxene, 7% amphibole and 2% olivine.
Similarly, MB detected olivine in the amount of 1%. APXS detected (in sol 393) phosphorus and calcium indicating apatite, carbonates and silicates, which are components of basalt. Magnesium indicates olivine, plagioclase and pyroxene. Aluminum indicates aluminosilicates plagioclase and amphiboles. Our results from Mini-TES confirm the occurrence of these minerals (see
Table 4).
However, comparisons of sulfur and iron content give a more complicated picture. We must note here that APXS and MB results are difficult to directly compare with Mini-TES data. APXS and MB measurements are performed on a small fragment of the selected object (often rock). Rocks are usually cleaned beforehand. It is common to remove the weathered surface using an abrasive tool. In the discussed case, Omaha (defined as RU, i.e. rock undisturbed) was examined. By its nature, such an object does not participate in the movement that loose material may undergo. Note that the loose material is also important object of our considerations. Therefore, direct comparisons of Mini-TES and APXS are not always appropriate.
The object examined by APXS and MB could have been the source of material eroded and transported to neighboring locations. So, for comparisons, it is worth using our results from neighboring sites where the Omaha material may be transported.
Sulfur detected by MB is indirectly interpreted as jarosite. Sulfur in our area (sols 392 and 393) indicates gypsum (see
Table 4), but in neighboring sols the Mini-TES spectrum indicates jarosite (sol 395 – 3.36%).
Potassium identified by APXS may also indicate the presence of jarosite. The same is true for hematite, which occurs in significant quantities. In sector 5 of the rover's route (in measurements 395a-395d), Mini-TES indicates hematite occurring in 16% (average).
Titanium detected by APXS indicates ilmenite, which according to Mini-TES occurs in sol 395 in an amount of about 10%. In sols 392 and 393, according to Mini-TES analysis, there is no ilmenite.
5. Conclusions
In this work, we used some of the data from the Mini-TES of the Opportunity rover, which to our knowledge has been less interpreted so far - see
Table 1. In general, the results show similarity of mineralogy from the neighboring parts of the rover route. This indicates a general similarity of processes in the Meridiani Planum area. However, along the part of the route we studied, we encounter also clear differences in mineralogy.
One of the significant differences is the variable content of hematite. Despite the occurrence of spherules practically along the entire part of the route we considered, we do not observe hematite in some sectors. We interpret this as the effect of hematite washing out from these concretions. We observe a similar phenomenon on terrestrial spherules. This indicates that terrestrial and Martian concretions may have an analogous origin.
Another interesting result is the finding of a small but systematic content of pyrite in sector 2. Pyrite often accompanies economically important minerals. Unfortunately, the current data are not sufficient to determine whether these minerals are indeed associated with the pyrite observed along the rover's path.
We will continue to study the remaining parts of the Opportunity and Spirit rover routes.
We also plan extension of the study to other areas (e.g. Chryse Planitia, [
21]). Our current results on the interpretation of infrared spectra (e.g. TES) may help explain some structures observed there.