Submitted:
07 February 2025
Posted:
10 February 2025
You are already at the latest version
Abstract
Geospatial analysis plays a very crucial role in predicting environmental changes, especially in the context of CO2 emissions and climate forecasting. This study uses continent-wise geospatial analysis to assess the potential patterns and implications of CO2 emissions by 2100, using ML techniques. The objective of this research is to spatially integrate the data with ML models to predict the geographical distribution of CO2 emissions at regional levels, thereby ascertaining which factors are predominant in influencing rates of emissions. For this purpose, the world is stratified into continents so that fine-grained regional differences in trends of emissions may be understood, keeping in mind aspects such as population density, industrialization, energy consumption, and climate policies. These are regression, classification, and neural networks that the machine learning algorithms use on satellite data, demographic information, and economic indicators to predict future emissions. This helps explain those hotspots in the first place, regions of high vulnerability to impacts from emissions, and opportunities for targeted mitigation strategies. Ultimately, this study provides a basis for understanding the geographical dynamics of CO2 emissions and more effective strategies by policymakers and environmental researchers to achieve emission reduction and climate change mitigation in the following century.
Keywords:
Geospatial Analysis
; Machine Learning
; Carbon Dioxide
; Climate Forecasting
; Prediction Analysis
1. Introduction
Global carbon dioxide (CO₂) emissions have increased at a rapid rate, causing serious environmental issues that include climate change, air pollution, and ecological imbalances. With the rise in industrialization, urbanization, and fossil fuel consumption, monitoring and mitigating CO₂ emissions is the priority of researchers, policymakers, and environmental agencies (Adams & Nsiah, 2019; Caney, 2009; Chichilnisky & Heal, 1994). The traditional approach to estimating CO₂ emissions by using ground-based sensors, manual reporting, and statistical modeling is limited by the coverage area, costs, and the time required for data collection. This new approach integrates geospatial analysis with machine learning innovatively and efficiently to track CO₂ emissions at different geographic scales. In reality, machine learning enables the real-time monitoring of emissions, tracking of hotspots, and accurate prediction of trends in future emission levels by incorporating satellite imagery and remote sensing technology with predictive algorithms. This paper discusses the impact of geospatial analysis used in conjunction with machine learning techniques on the estimation and mitigation efforts of CO₂ emissions (Ezcurra, 2007; Gür, 2022; Zhang & Cheng, 2009).
Geospatial analysis is vital in tracking and understanding the spatial distribution of CO₂ emissions. Continuous, high-resolution measurements of atmospheric CO₂ concentrations are now offered through remote sensing technologies improvements, such as NASA's Orbiting Carbon Observatory (OCO-2) and the European Space Agency's Sentinel-5P. Using GIS and spatial modeling techniques, researchers can create maps of emission sources, generate land-use patterns, and assess the human influence activities that adversely affect CO₂ concentrations (Lee et al., 2012; Neumayer, 2004; Schmalensee et al., 1998). Geospatial methods help integrate socioeconomic and environmental data sets that provide insights into the factors that make up emissions in a manner that is more insightful than the information if considered in isolation, such as population density, industrial activities, or transportation networks. Geospatial analysis is critical in tracking and understanding the spatial distribution of CO₂ emissions. Improvements in remote sensing technologies, such as NASA's Orbiting Carbon Observatory (OCO-2) and the European Space Agency's Sentinel-5P, provide continuous, high-resolution measurements of atmospheric CO₂ concentrations. GIS and spatial modeling techniques allow researchers to map emission sources, analyze land-use patterns, and assess the impact of anthropogenic activities on CO₂ levels (Aldy, 2006; Fajardy et al., 2019). The integration of socioeconomic and environmental datasets using geospatial techniques helps analyze the factors that makeup emissions in a more insightful manner than if they were considered separately, such as population density, industrial activities, or transportation networks. Traditional geospatial methods may fail to explain interrelations that are complex and subtle; this is where machine learning improves data processing and predictive modeling capabilities.
Despite these advances in geospatial and machine learning approaches to CO₂ emission analysis, several challenges persist. Data availability and quality remain a significant issue, as satellite-based observations are often affected by cloud cover, spatial resolution limitations, and atmospheric interferences (Azdarpour et al., 2015; Sakakura et al., 2007; Tan et al., 2022). Moreover, the integration of multiple sources of geospatial and environmental data requires sophisticated pre-processing techniques for consistency and reliability. Another challenge is the interpretability of machine learning models, as complex deep learning algorithms often function as "black boxes," making it difficult for policymakers to understand the rationale behind specific predictions . Future research should focus on developing hybrid models that combine machine learning with physics-based climate simulations to improve the accuracy and transparency of emission estimates. Advancements in federated learning and decentralized data processing will handle issues related to privacy and potentially provide for larger-scale collaborative studies on the sources of CO₂ emissions. Researcher collaboration through state-of-the-art geospatial and AI-based applications can move the policy decision closer to an improved sustainable approach to global carbon management with effects that could combat the challenges of global climate change (Dowell et al., 2017; Montzka et al., 2011; Solomon et al., 2009).
Machine learning techniques have revolutionized the field of CO₂ emission analysis by making it possible to automatically process data, recognize patterns, and predict with high accuracy. Supervised learning algorithms like Random Forest, Support Vector Machines (SVM), and Gradient Boosting are used to predict CO₂ emissions based on historical data and geospatial factors. Deep learning methods, specifically Convolutional Neural Networks, have shown to be very effective in analyzing satellite imagery to find emission hotspots and detect changes in the environment. In addition, unsupervised learning methods, such as clustering and anomaly detection, aid in classifying regions based on their emission intensity, thus targeting policy interventions. Time-series forecasting models cover the area of CO₂ emission trends prediction. It empowers governments and industries to make data-driven decisions. The integration of geospatial data and machine learning ensures complete, comprehensive monitoring of CO₂ emissions, offering valuable insights to mitigate the impacts of climate change (Amin et al., 2022; Kätelhön et al., 2019).
2. Methodology
Data has been taken in this study from the yearly emissions from the year 1750 to 2024. It shows extensive data regarding the generation of carbon dioxide, population, GDP per capita, urbanization rate, and HDI across 196 countries and various continents. The period is multi-years long and holds much importance when explaining these interrelations concerning socioeconomic indicators with carbon dioxide generation. It covers raw and processed data that enables the building of predictive models about the economic and demographic influences on carbon dioxide generation. For this study, the data was cleaned and pre-processed to handle missing values and ensure consistency, and it was used to train and test machine learning models for forecasting carbon dioxide generation and also enabling prediction analysis up to 2100. The dataset is a reliable and widely cited resource for carbon dioxide emissions.
2.1. Data Pre-processing
The data pre-processing for this study involved several crucial steps to ensure the dataset was clean and ready for analysis. First, the dataset was loaded, and numeric columns containing commas (such as country-wise and carbon dioxide emissions) were converted to oat type by removing the commas (Kruppa et al., 2012; Mancini & Basso, 2020; Varoquaux et al., 2015). Missing values were handled by numeric columns with the mean value and categorical columns with the mode. This approach made sure that nothing was left out, so no data could affect the performance of the model. Then, new features were engineered on the pre-processed data to make the model predictive. Finally, the dataset was prepared for model training through one-hot encoding of categorical variables like region and group and standardization of numerical variables. These pre-processing steps played a significant role in making the model learn efficiently from the data and provide an accurate prediction (Y. Liu et al., 2021; Mittal & Kushwaha, 2024; Rodriguez-Galiano et al., 2015; Yang et al., 2023).
2.2. Model Architecture
The model was trained by exporting and quantifying the pre-existing datasets through geopandas library through gradient boosting regressor (Bajari et al., 2015; Brunton, 2021; Candanedo et al., 2018). The model architecture in this study utilizes the gradient-boosting regressor. The gradient boosting regressor is particularly well-suited for complex, nonlinear relationships in large datasets, making it an ideal choice for predicting carbon dioxide emissions generation. This model captures the intricate patterns in the data, such as the effects of GDP per capita, and population growth on emissions generation and prediction analysis, by combining the results of several decision regressors. Previous research in carbon credits and machine learning applications supports the model's ability to handle such complexity (Bowen & Ungar, 2020; Mansouri Tehrani et al., 2018).
The pipeline structured the model training process such that preprocessing and model training were streamlined. Normalization on numeric features such as Continent-wise, and emission quantification was applied, which standardized the data and prevented any particular feature from dominating the model. This preprocessing step is important because it ensures the model will equally weigh all features. The preprocessing steps together with the gradient boosting regressor ensured robustness and accurate prediction of the model in regards to carbon emissions generation across continents and countries diversely.
The key performance metrics utilized for the model evaluation were MSE, R², MAE, and RMSE. These metrics gave a comprehensive understanding of the performance of the model and its ability to generalize to new data. The Gradient Boosting Regressor performed well, with high predictive accuracy and low error metrics, which indicated that it was able to capture the nonlinear relationships between the features and carbon dioxide emissions generation effectively (Jonayat et al., 2018; H. Liu et al., 2022; Mazhnik & Oganov, 2020; Schmitz et al., 2023). The results were consistent with previous studies that have applied machine learning techniques to carbon emissions forecasting. This demonstrates the growing potential of machine learning models in the field of environmental science and carbon emissions management.
3. Results
By combining geospatial analysis with machine learning, this study uncovered valuable insights into the spatial patterns and future trends of CO₂ emissions through 2100. Using the Gradient Boosting Regressor model, we were able to predict emissions across different continents, taking into account factors like GDP per capita, population density, urbanization, and human development index (HDI). The model performed exceptionally well, as reflected in the low mean squared error (MSE), high R², and minimal root mean squared error (RMSE), demonstrating its ability to accurately capture the complex relationships between these socioeconomic factors and CO₂ emissions.
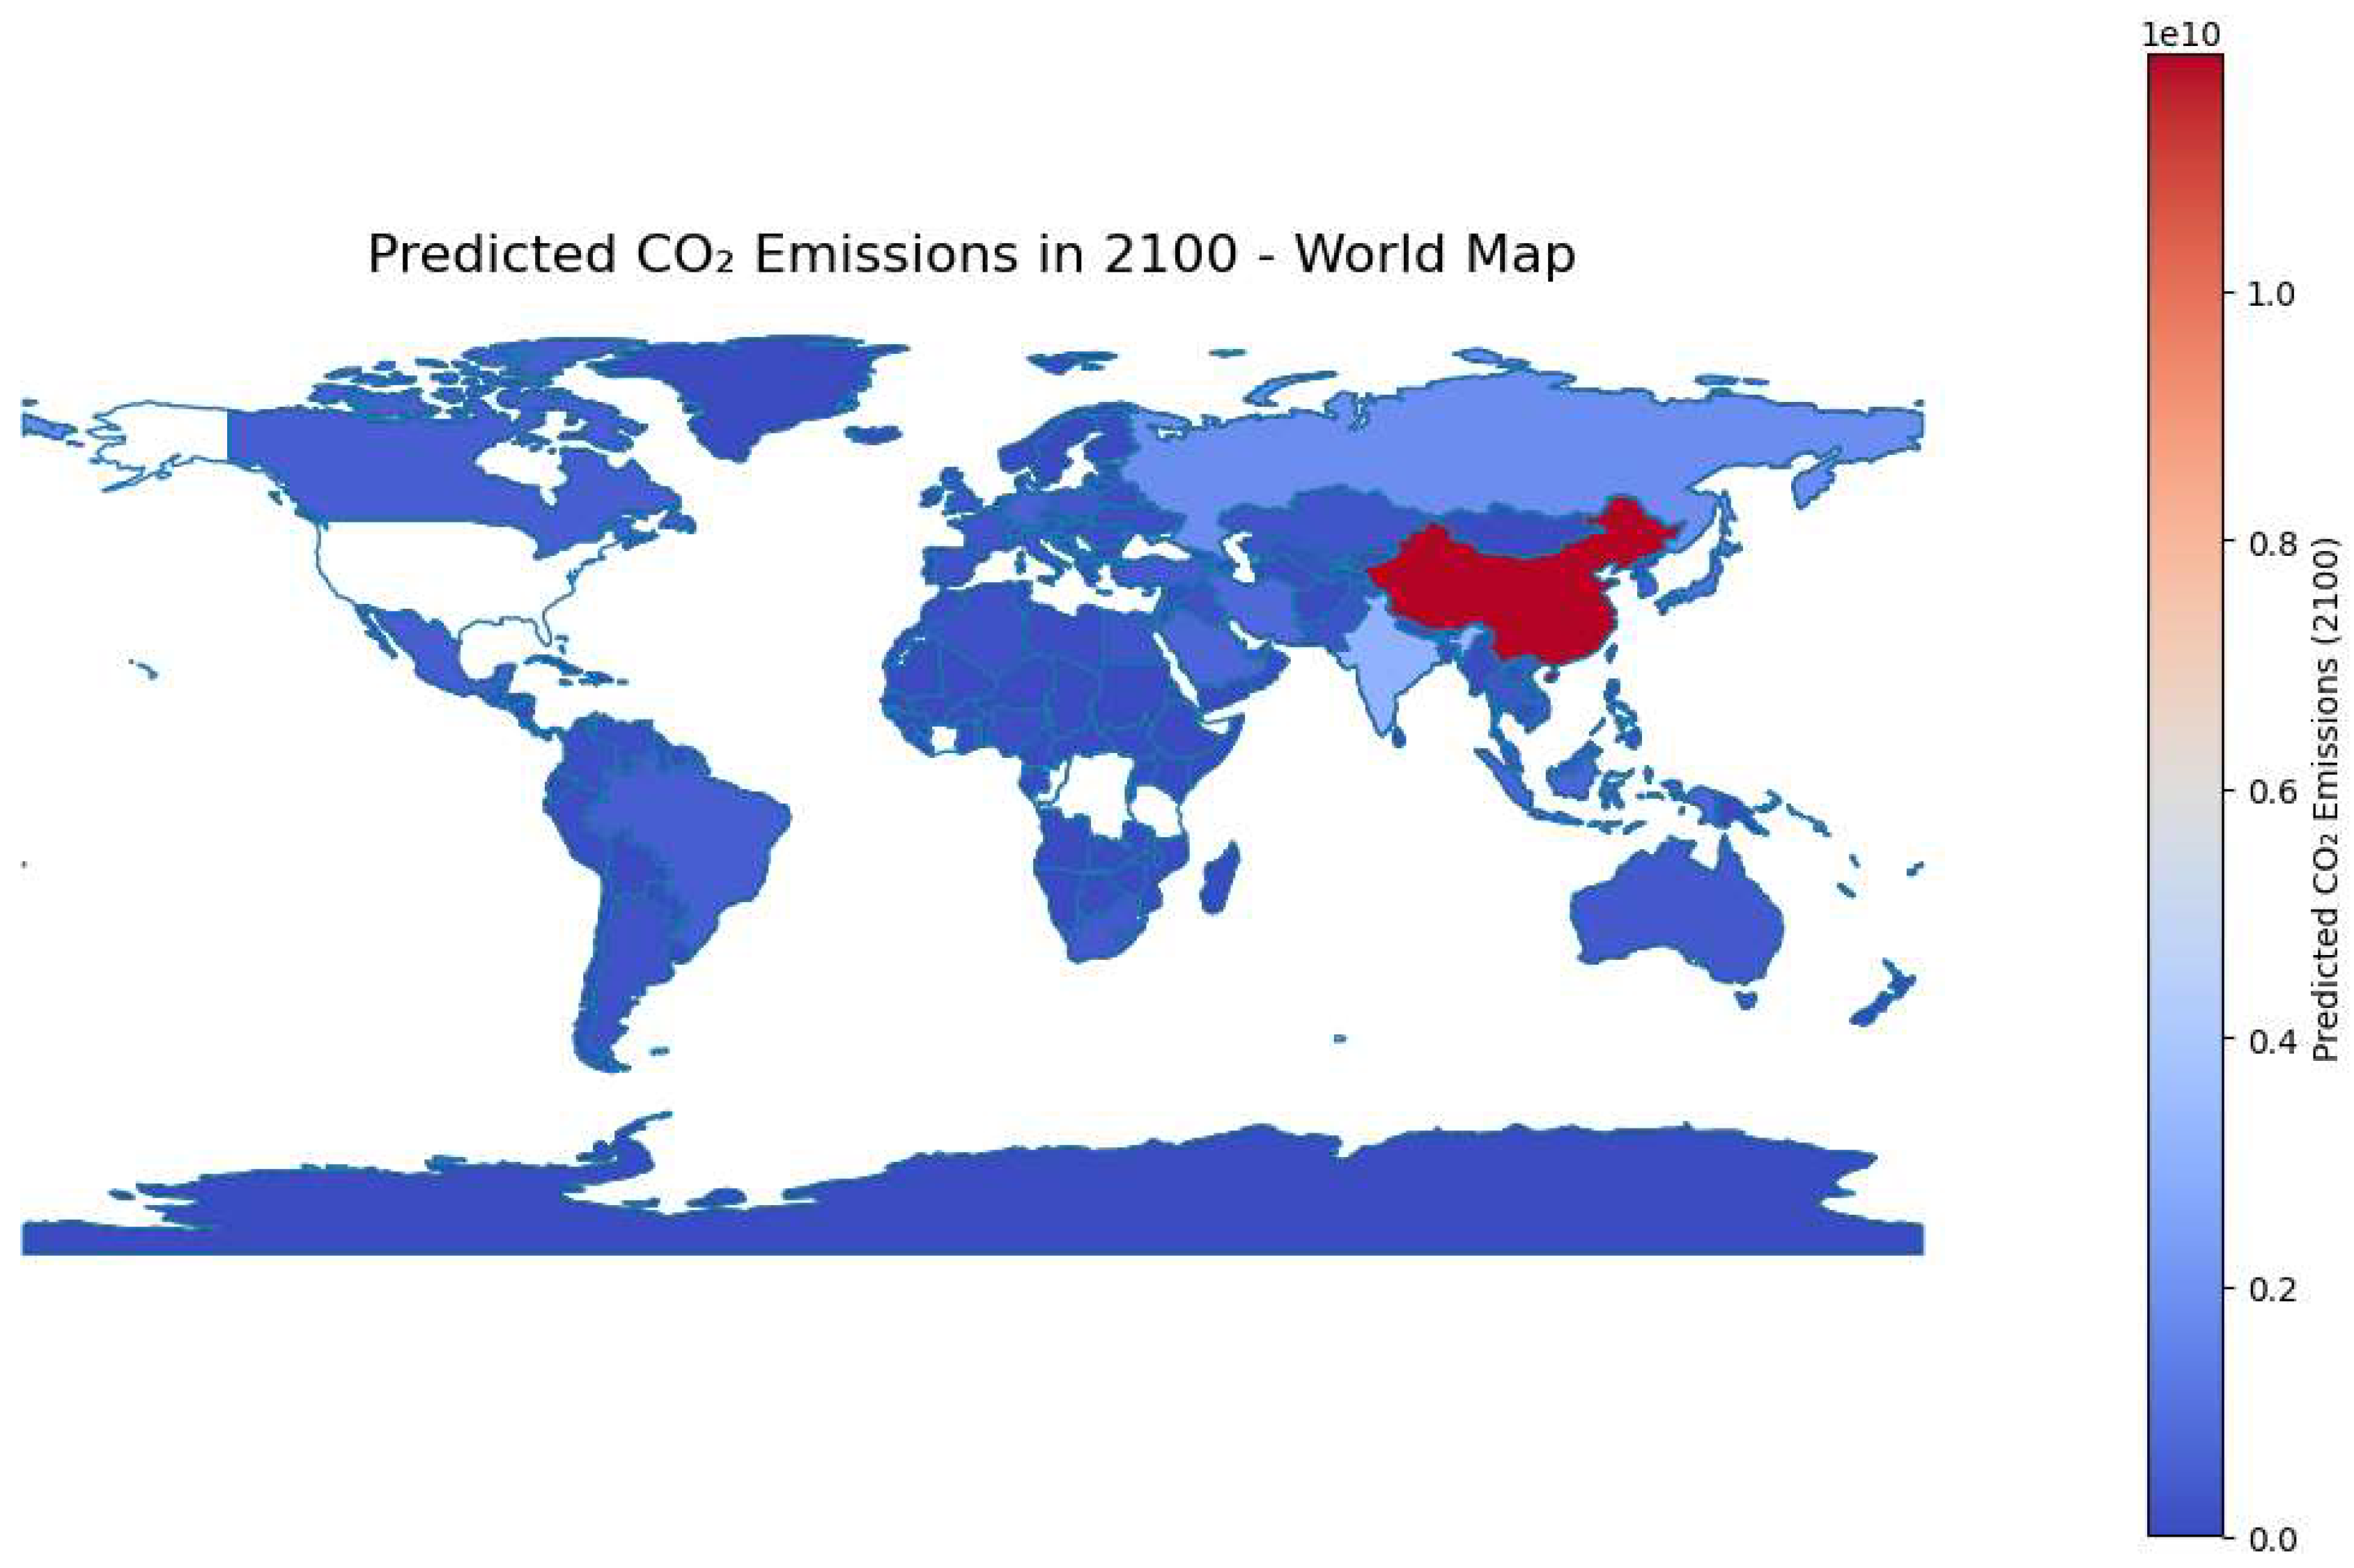
The emissions projections for 2100 revealed clear regional differences. Industrialized continents, like North America, Europe, and Asia, are expected to see the highest emissions, while Africa and South America, with their rapidly growing economies and urbanization, will also experience significant increases. The study identified key "hotspots" of high emissions, highlighting areas that are particularly vulnerable to the effects of climate change. These hotspots mainly appear in highly industrialized regions, pointing to the need for targeted, region-specific mitigation efforts.
The geospatial analysis provided a deeper understanding of how CO₂ emissions are distributed across the globe, enabling the identification of areas where interventions are most needed. By combining machine learning with spatial analysis, this study not only improved the accuracy of our predictions but also provided actionable insights that can guide policymakers in developing tailored strategies to address climate change. Ultimately, the results emphasize the power of using data-driven approaches to make more informed, effective decisions for the future of our planet.

Table 1.
Training results of the geospatial analysis.
| Mean Squared Error (MSE) | R² Score | Mean Absolute Error (MAE) | Root Mean Squared Error (RMSE) | |
| Africa | 49507844758115.18 | 0.9945 | 3101401.13 | 7036181.12 |
| Asia | 8380633465386773.00 | 0.9954 | 25183187.86 | 91545799.82 |
| Europe | 341247453552378.81 | 0.9934 | 9243527.28 | 18472884.28 |
| North America | 1834792941832279.25 | 0.9985 | 13160862.98 | 42834483.09 |
| South America | 20696340170559.54 | 0.9950 | 1605773.25 | 4549323.05 |
| Australia | 3487108281912.39 | 0.9995 | 601690.54 | 1867380.06 |
| Antarctica | 3356443.10 | 0.9086 | 916.15 | 1832.06 |
Figure 1.
Predicted CO2 Emissions in Africa.
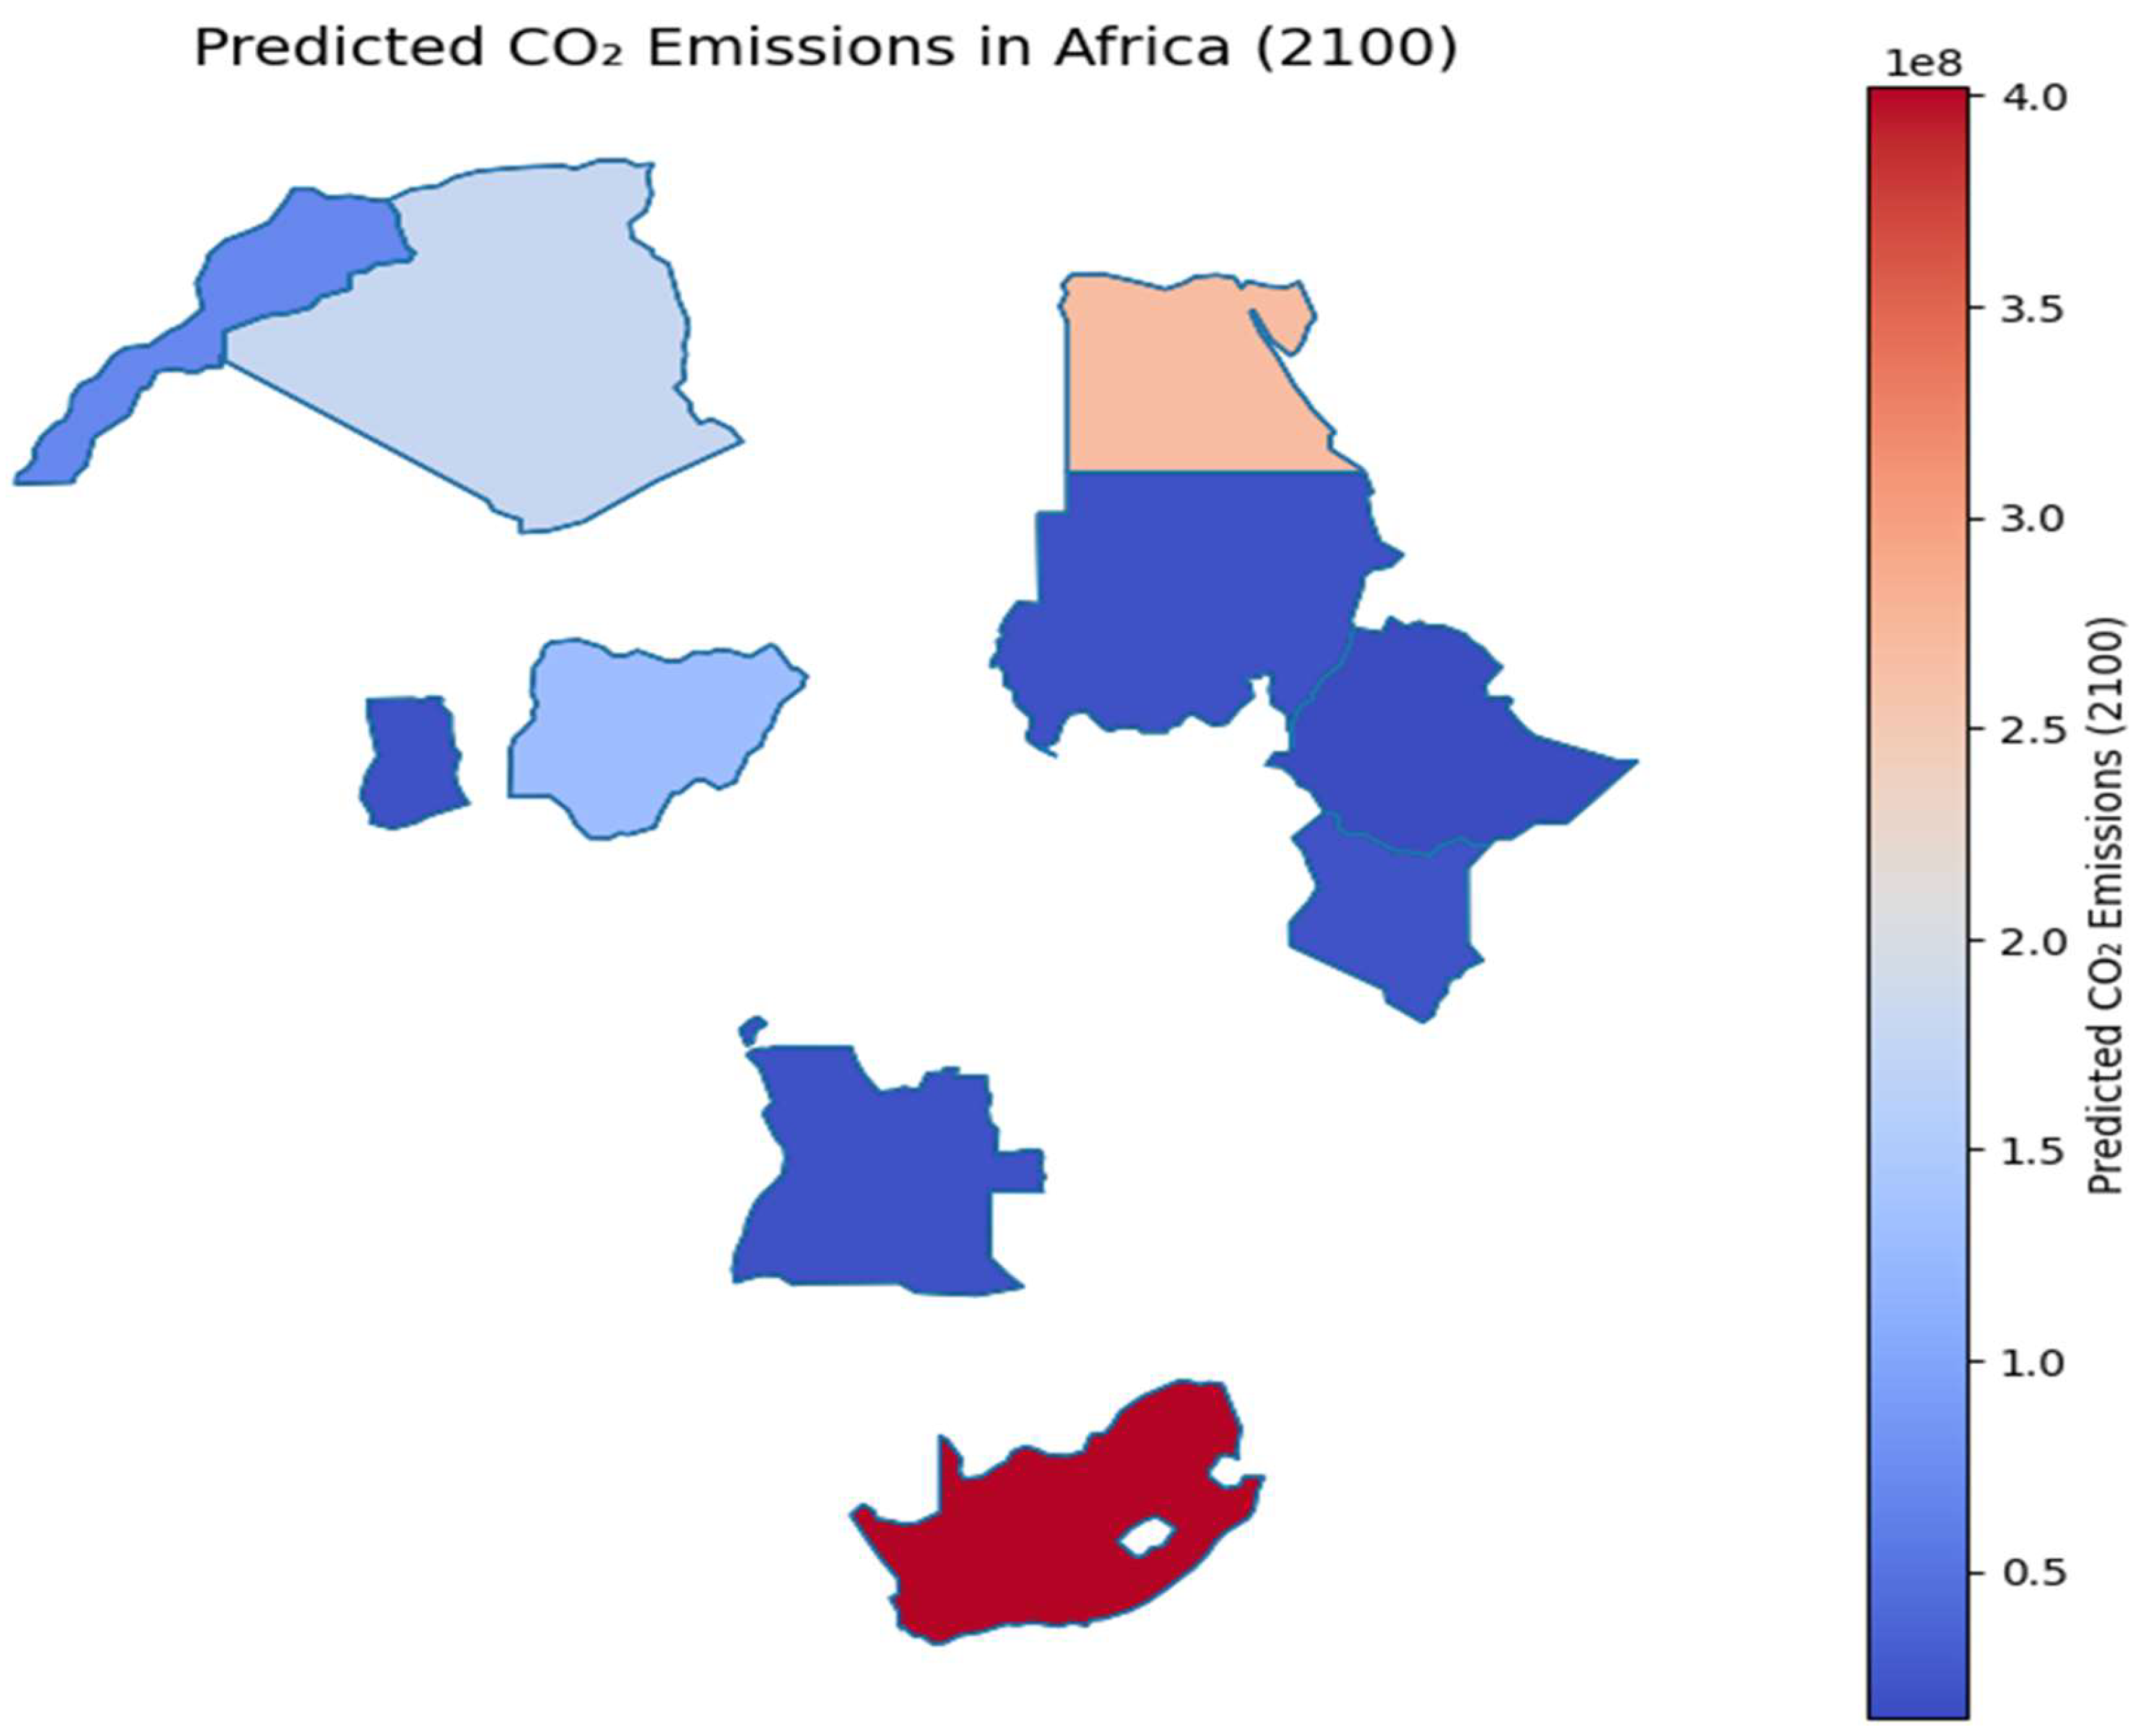
Figure 2.
Predicted CO2 Emissions in Asia.
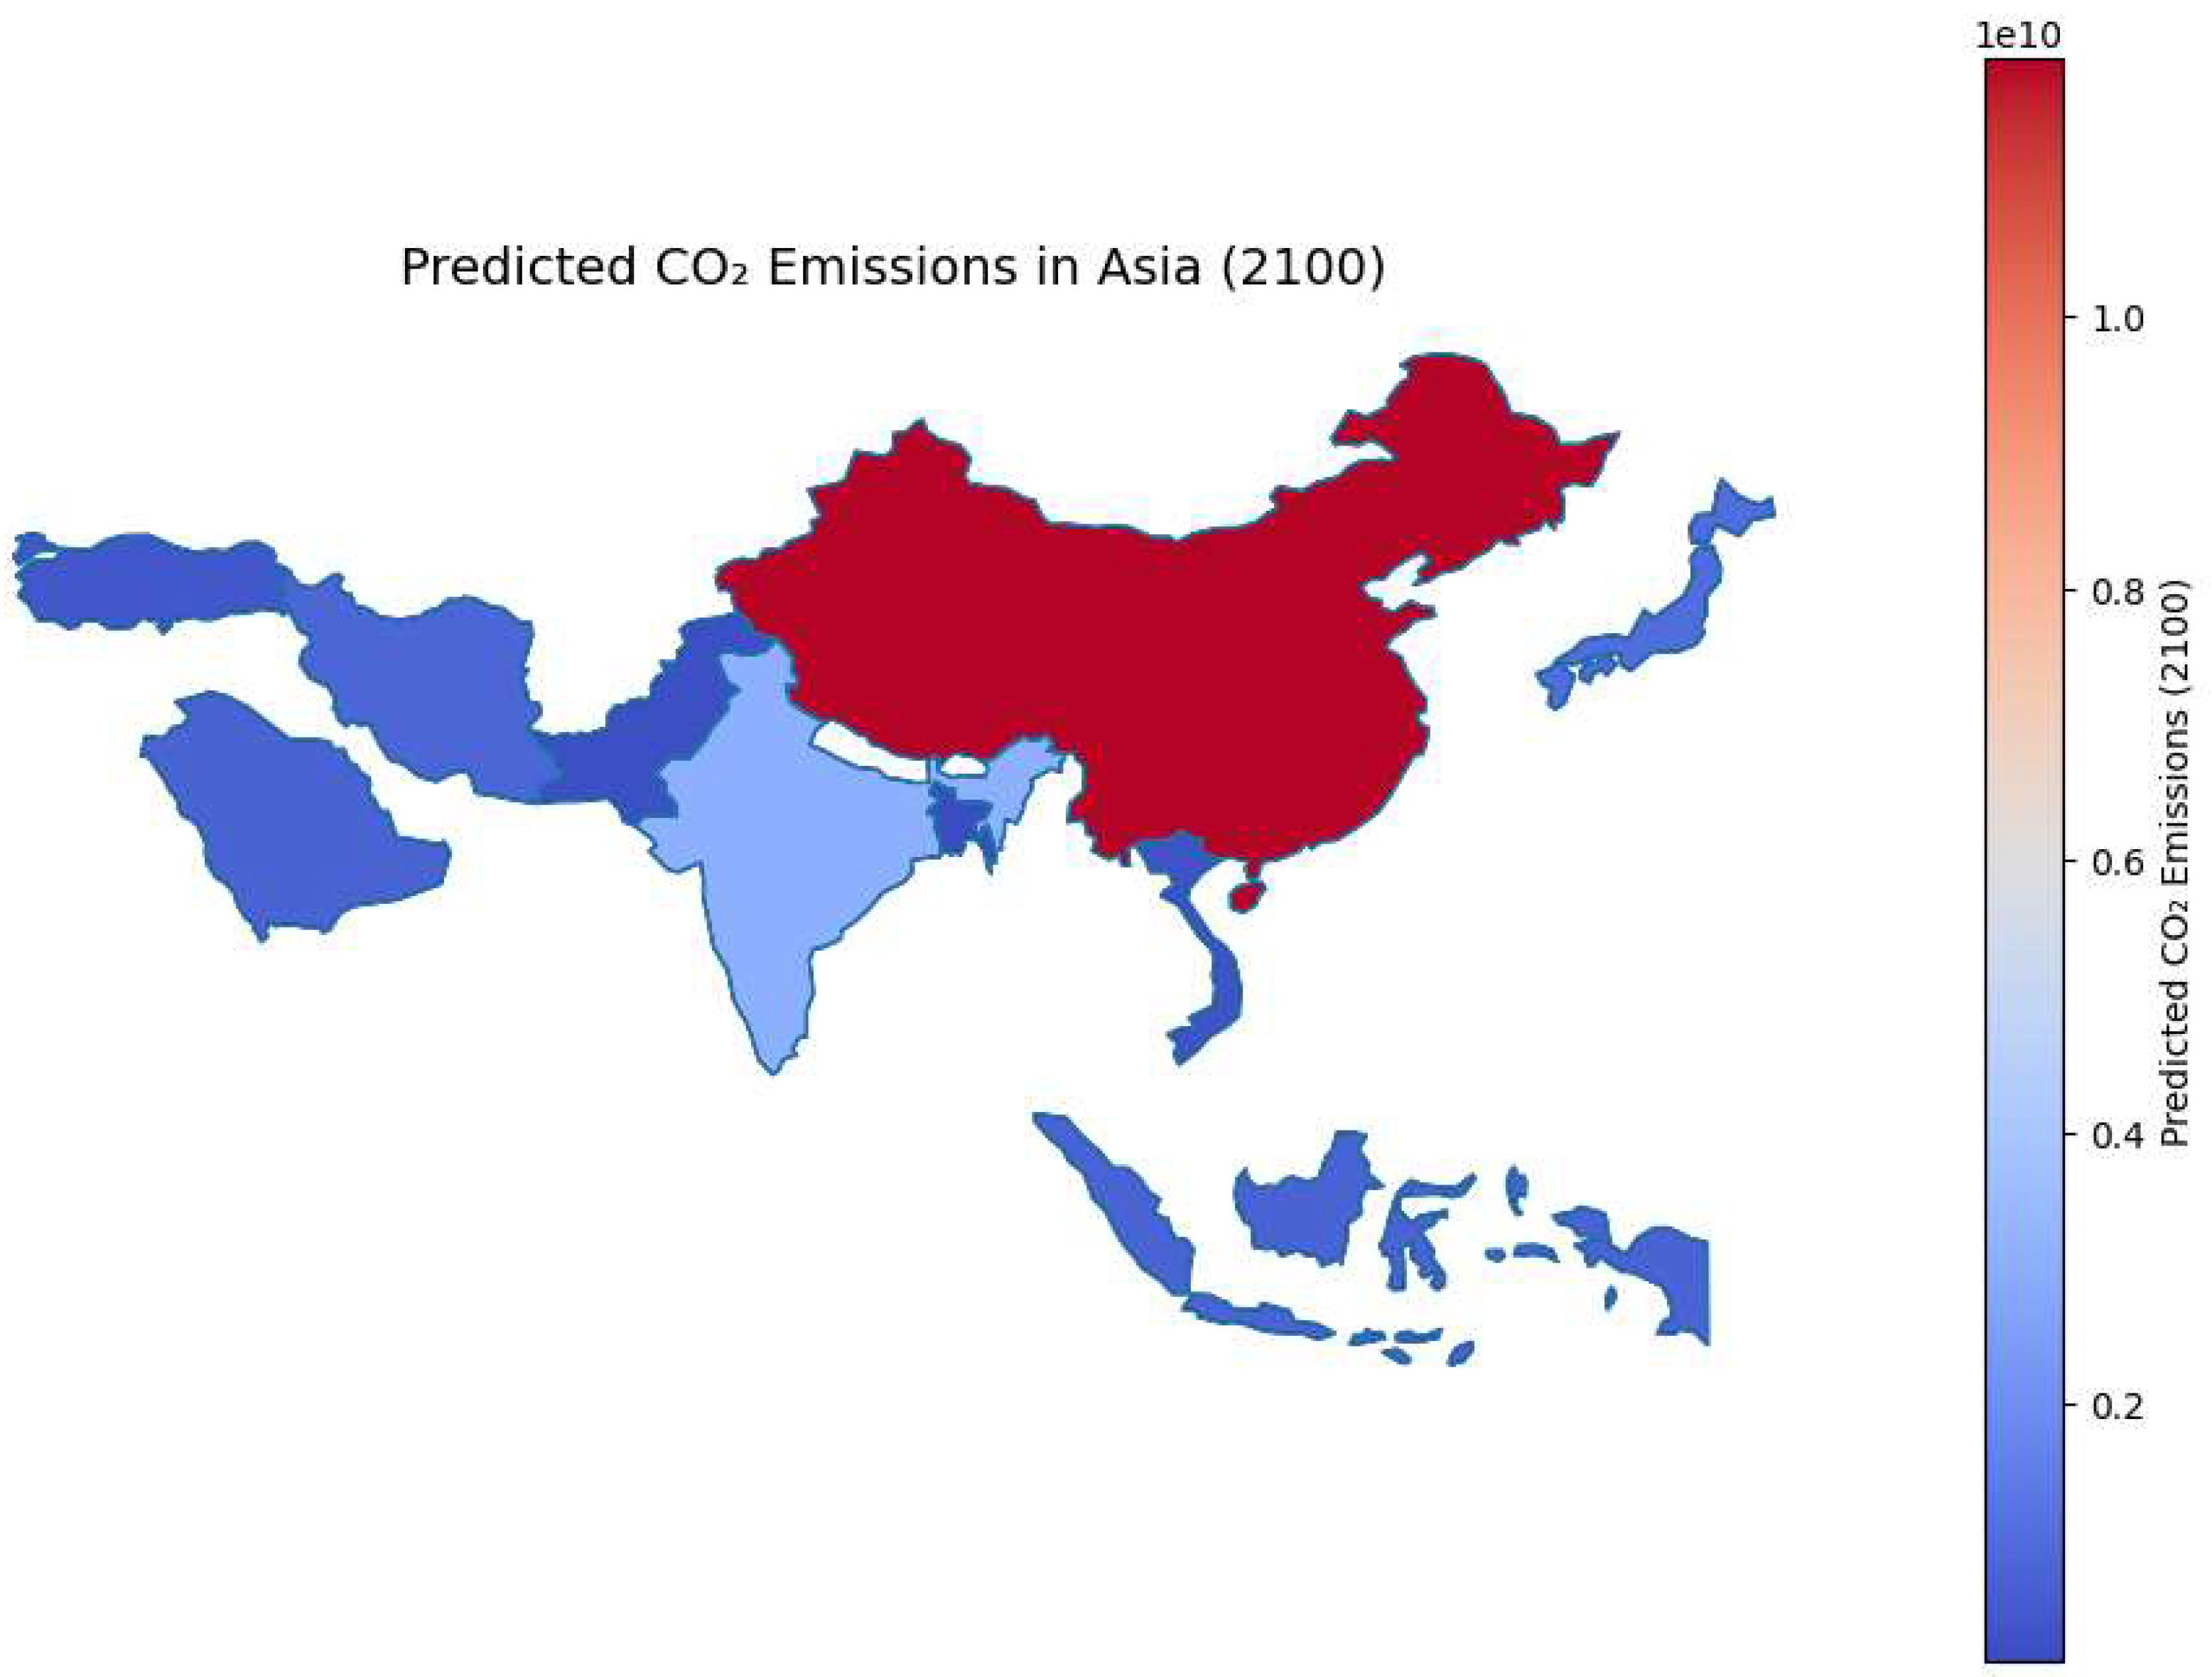
Figure 3.
Predicted CO2 Emissions in Europe.
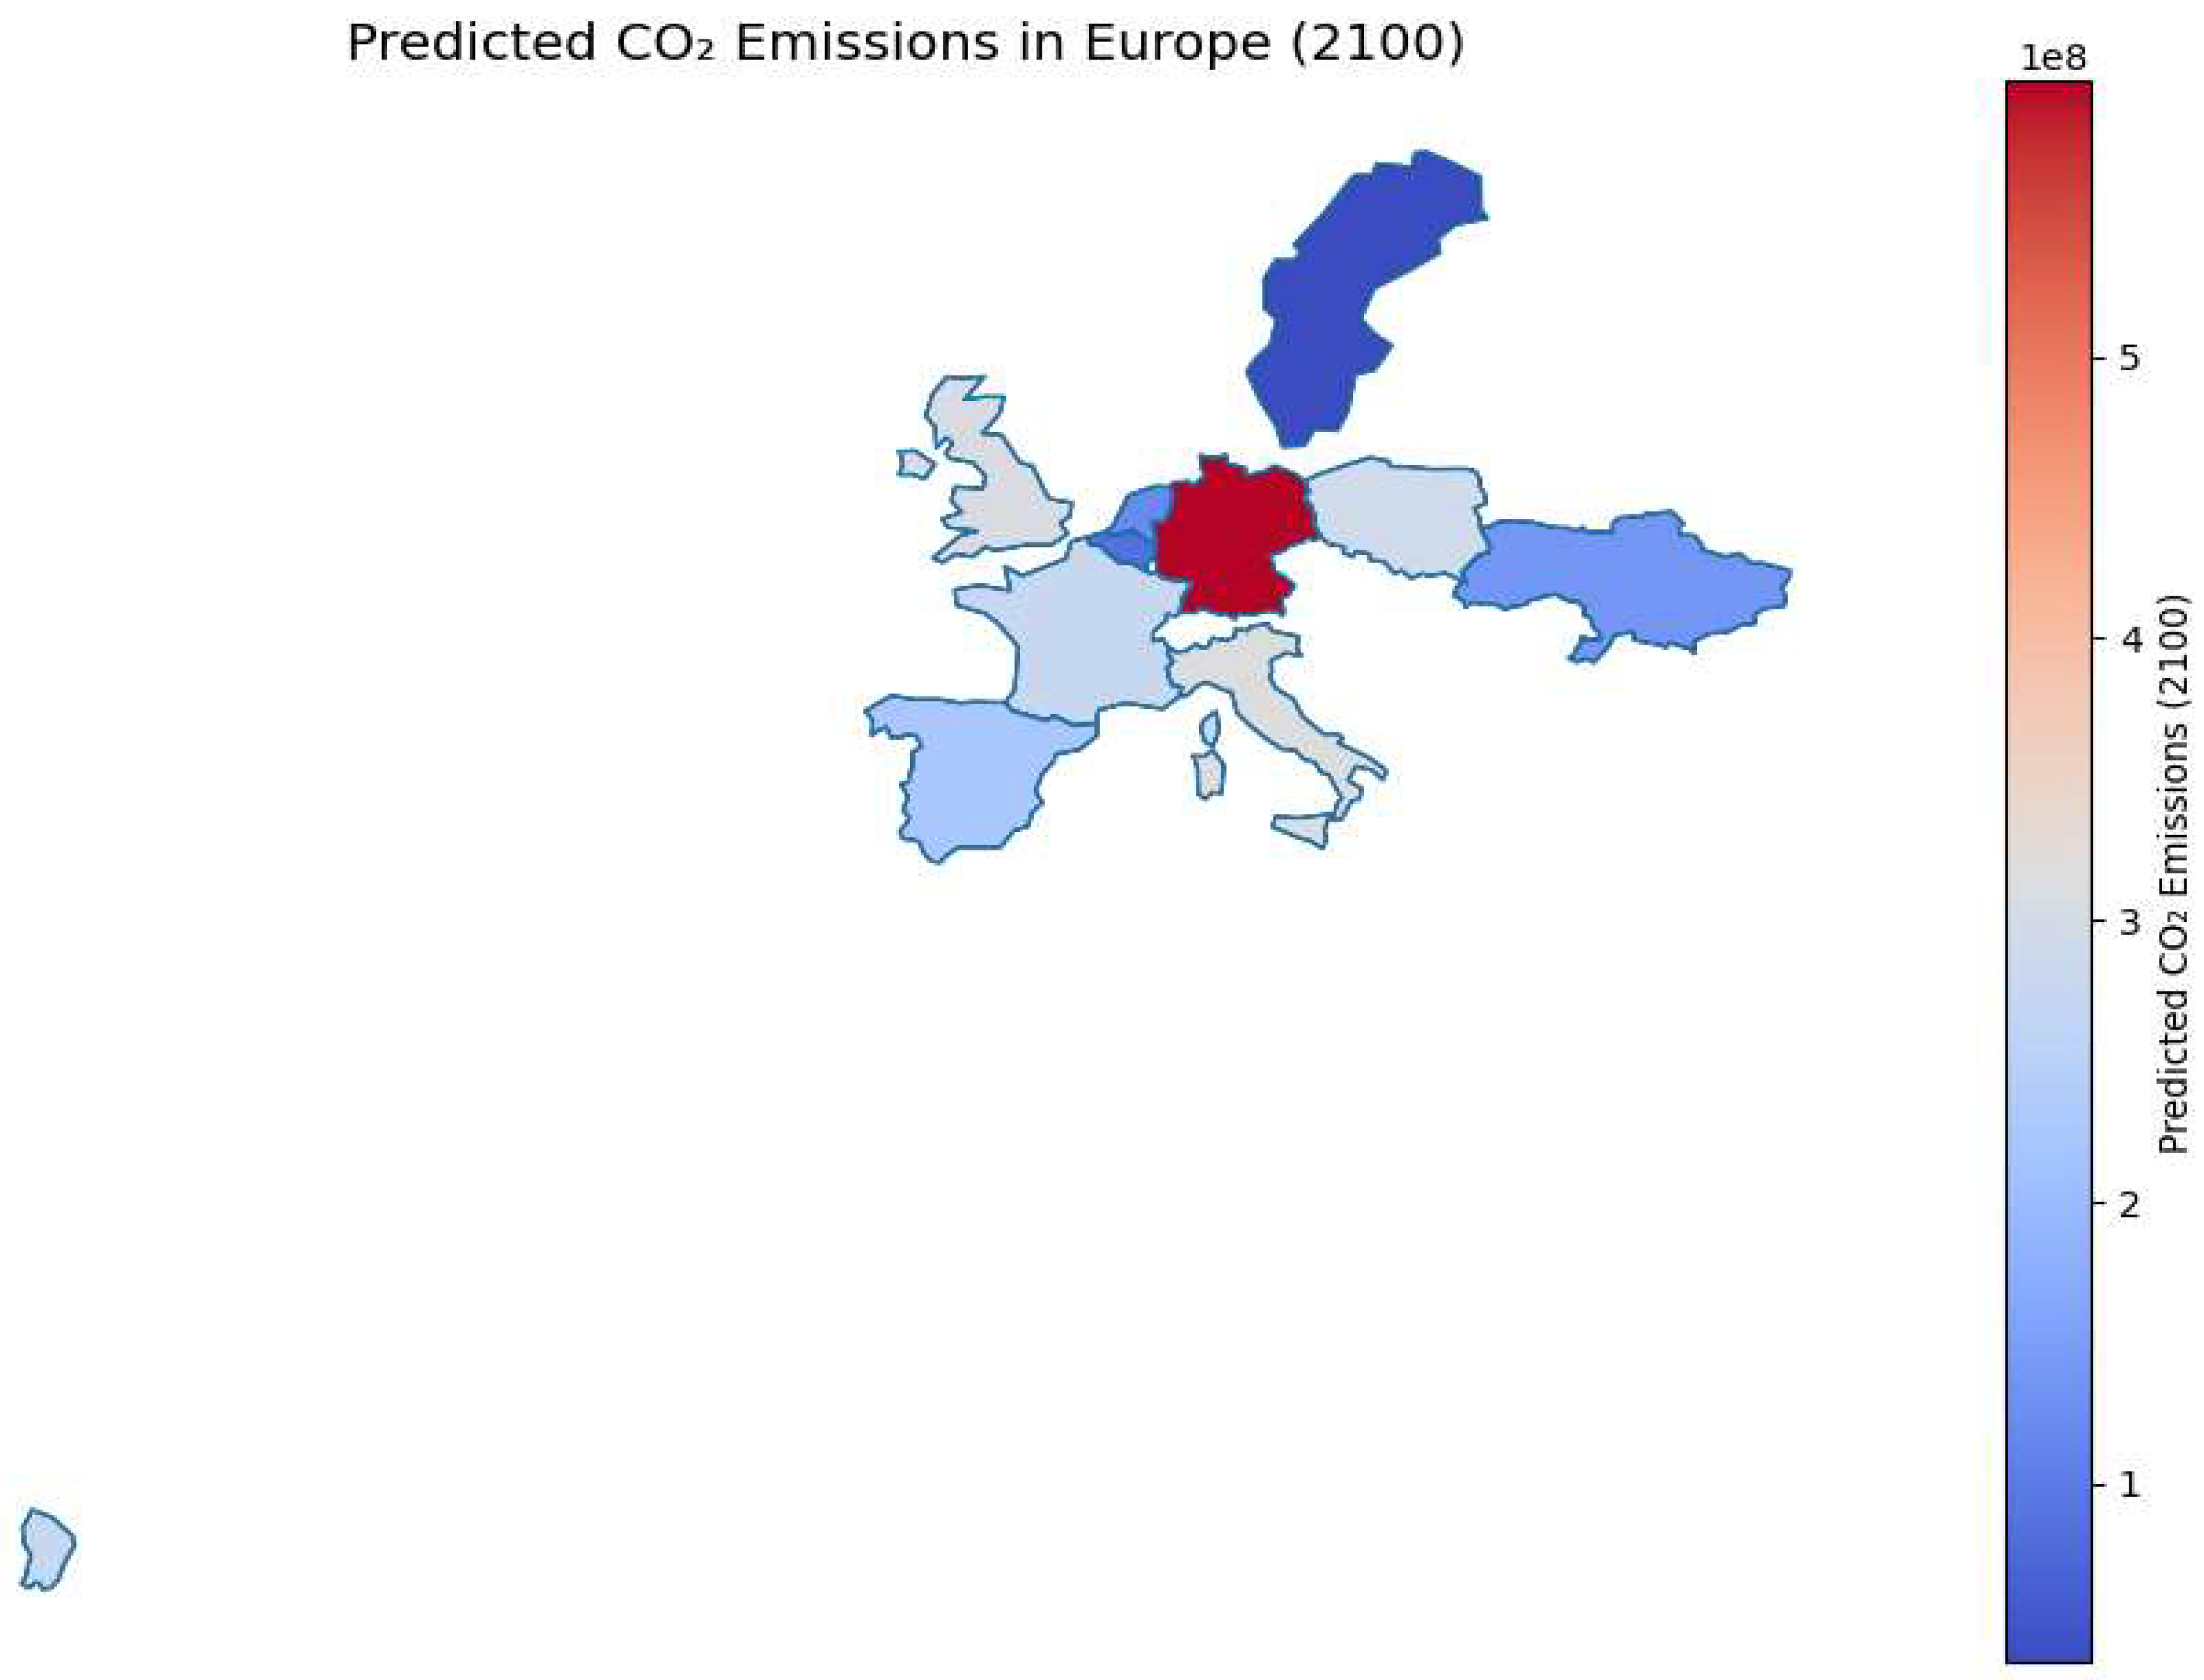
Figure 4.
Predicted CO2 Emissions in North America.
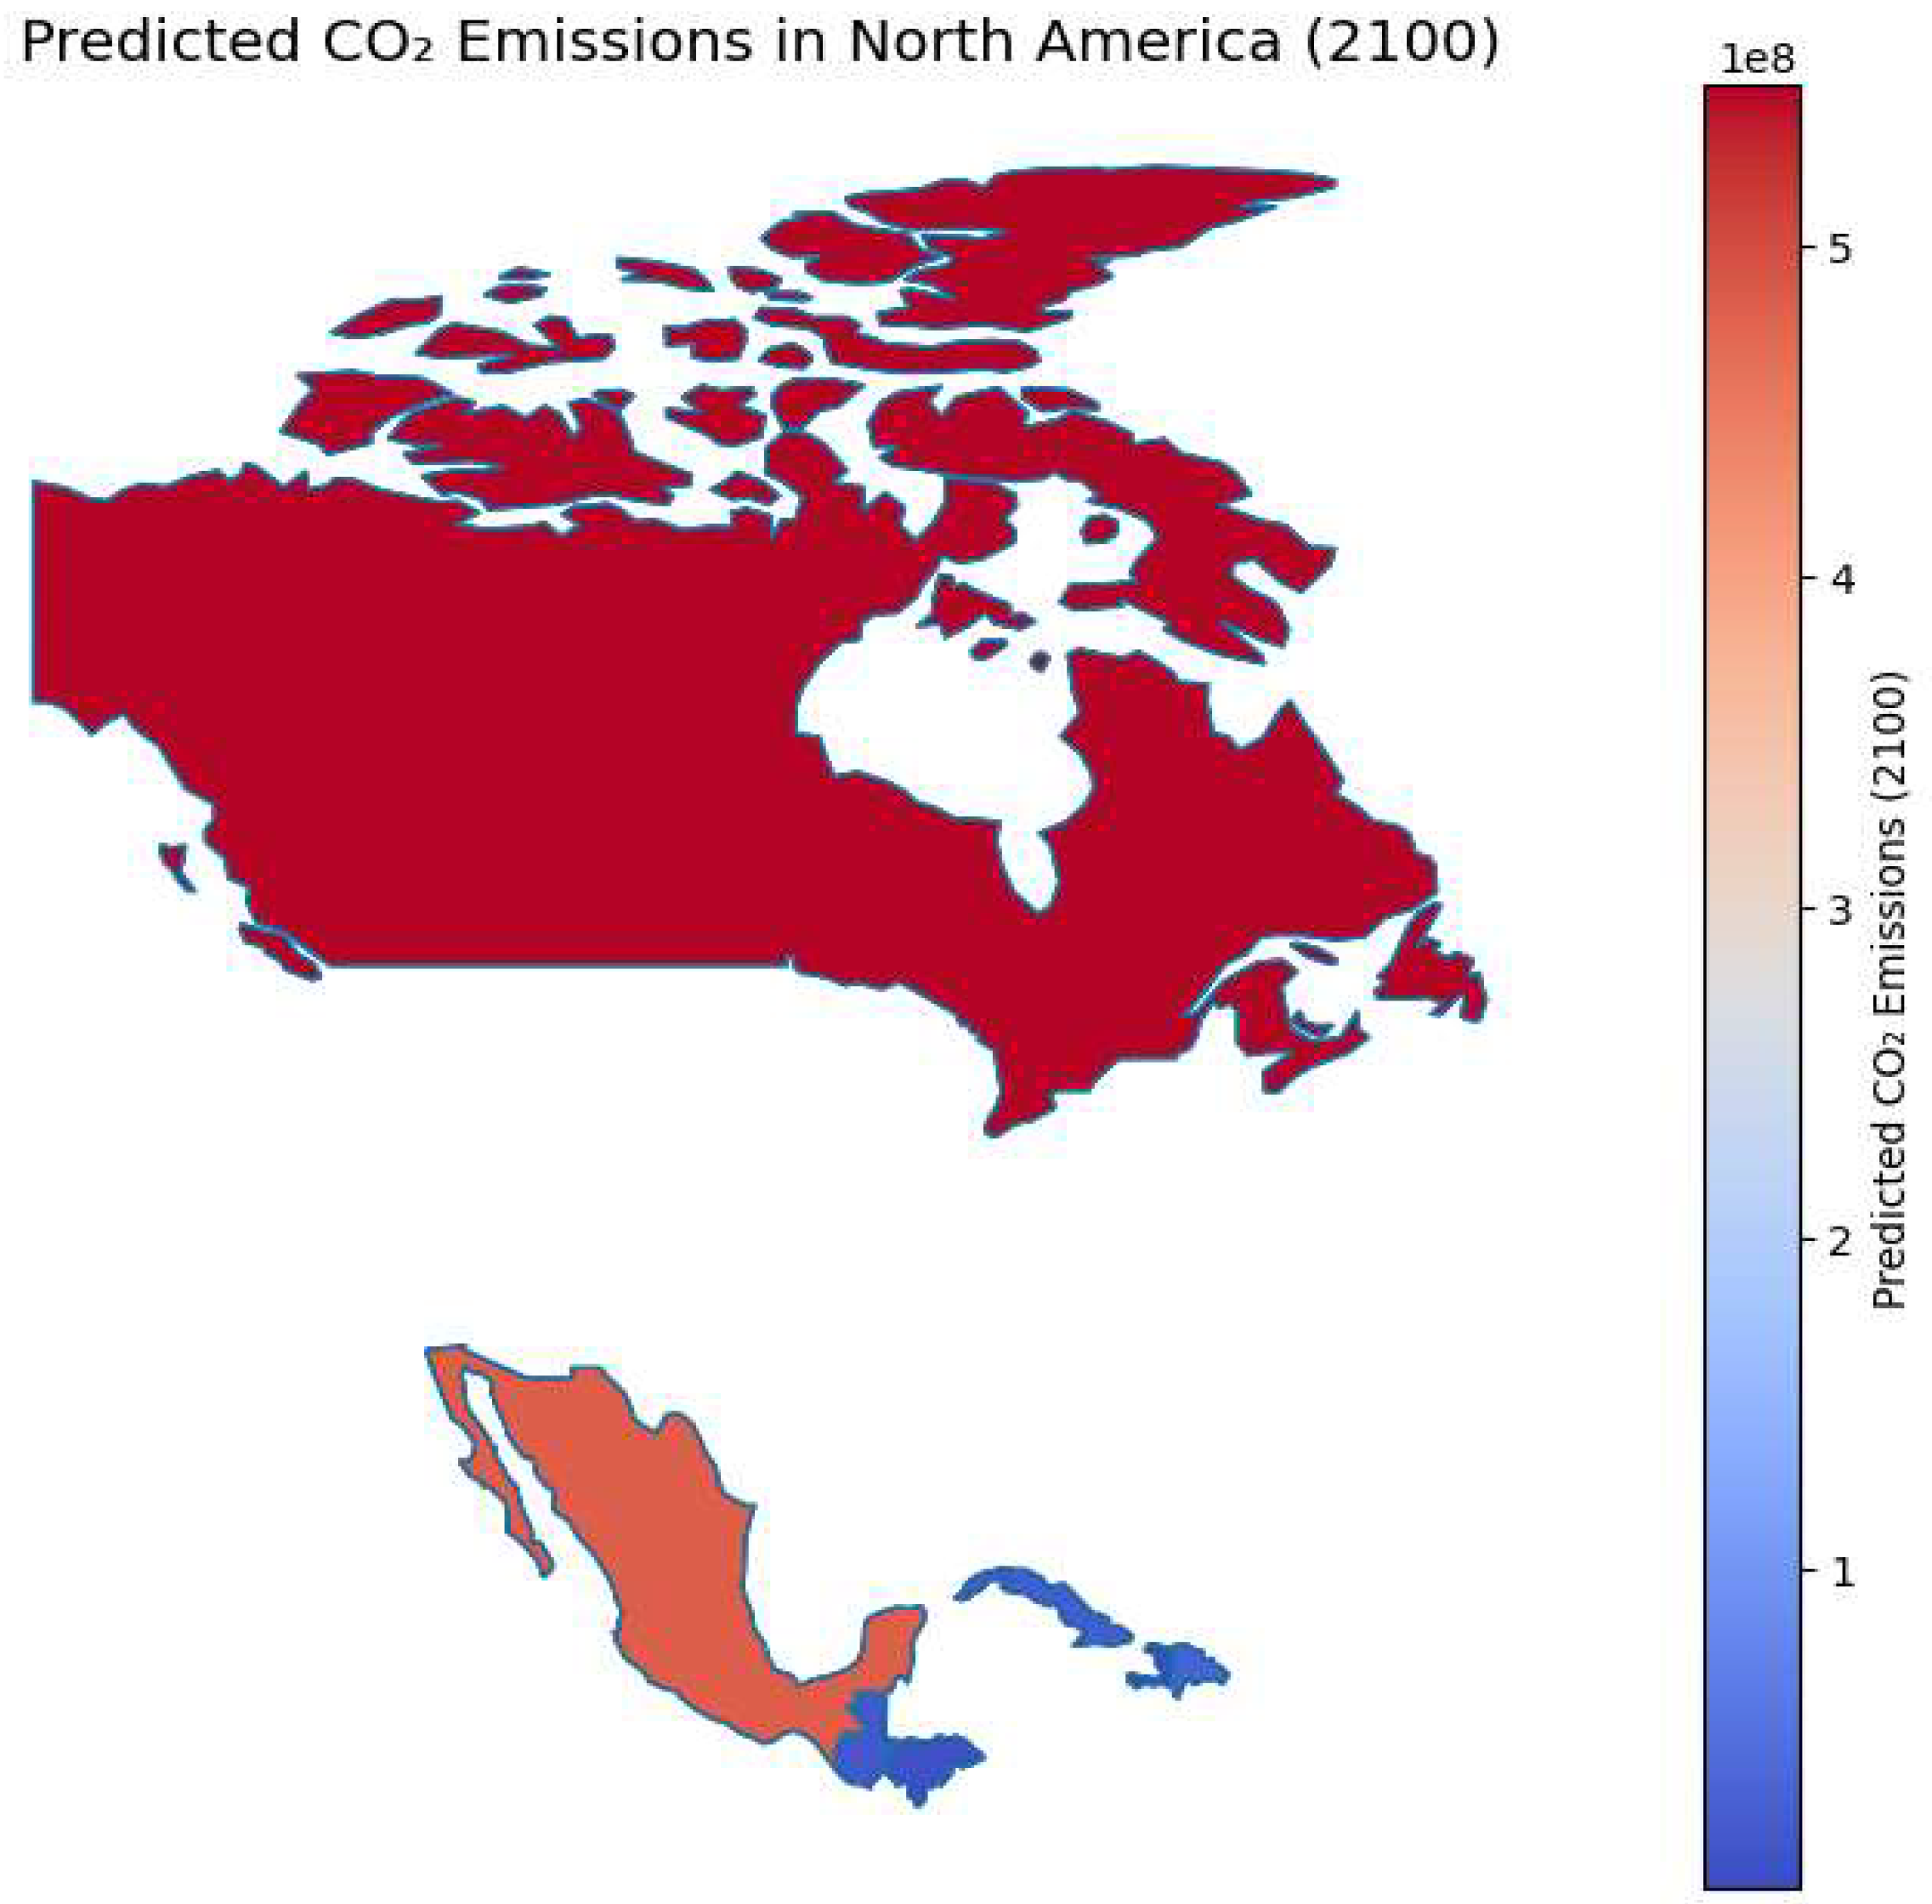
Figure 5.
Predicted CO2 Emissions in South America.
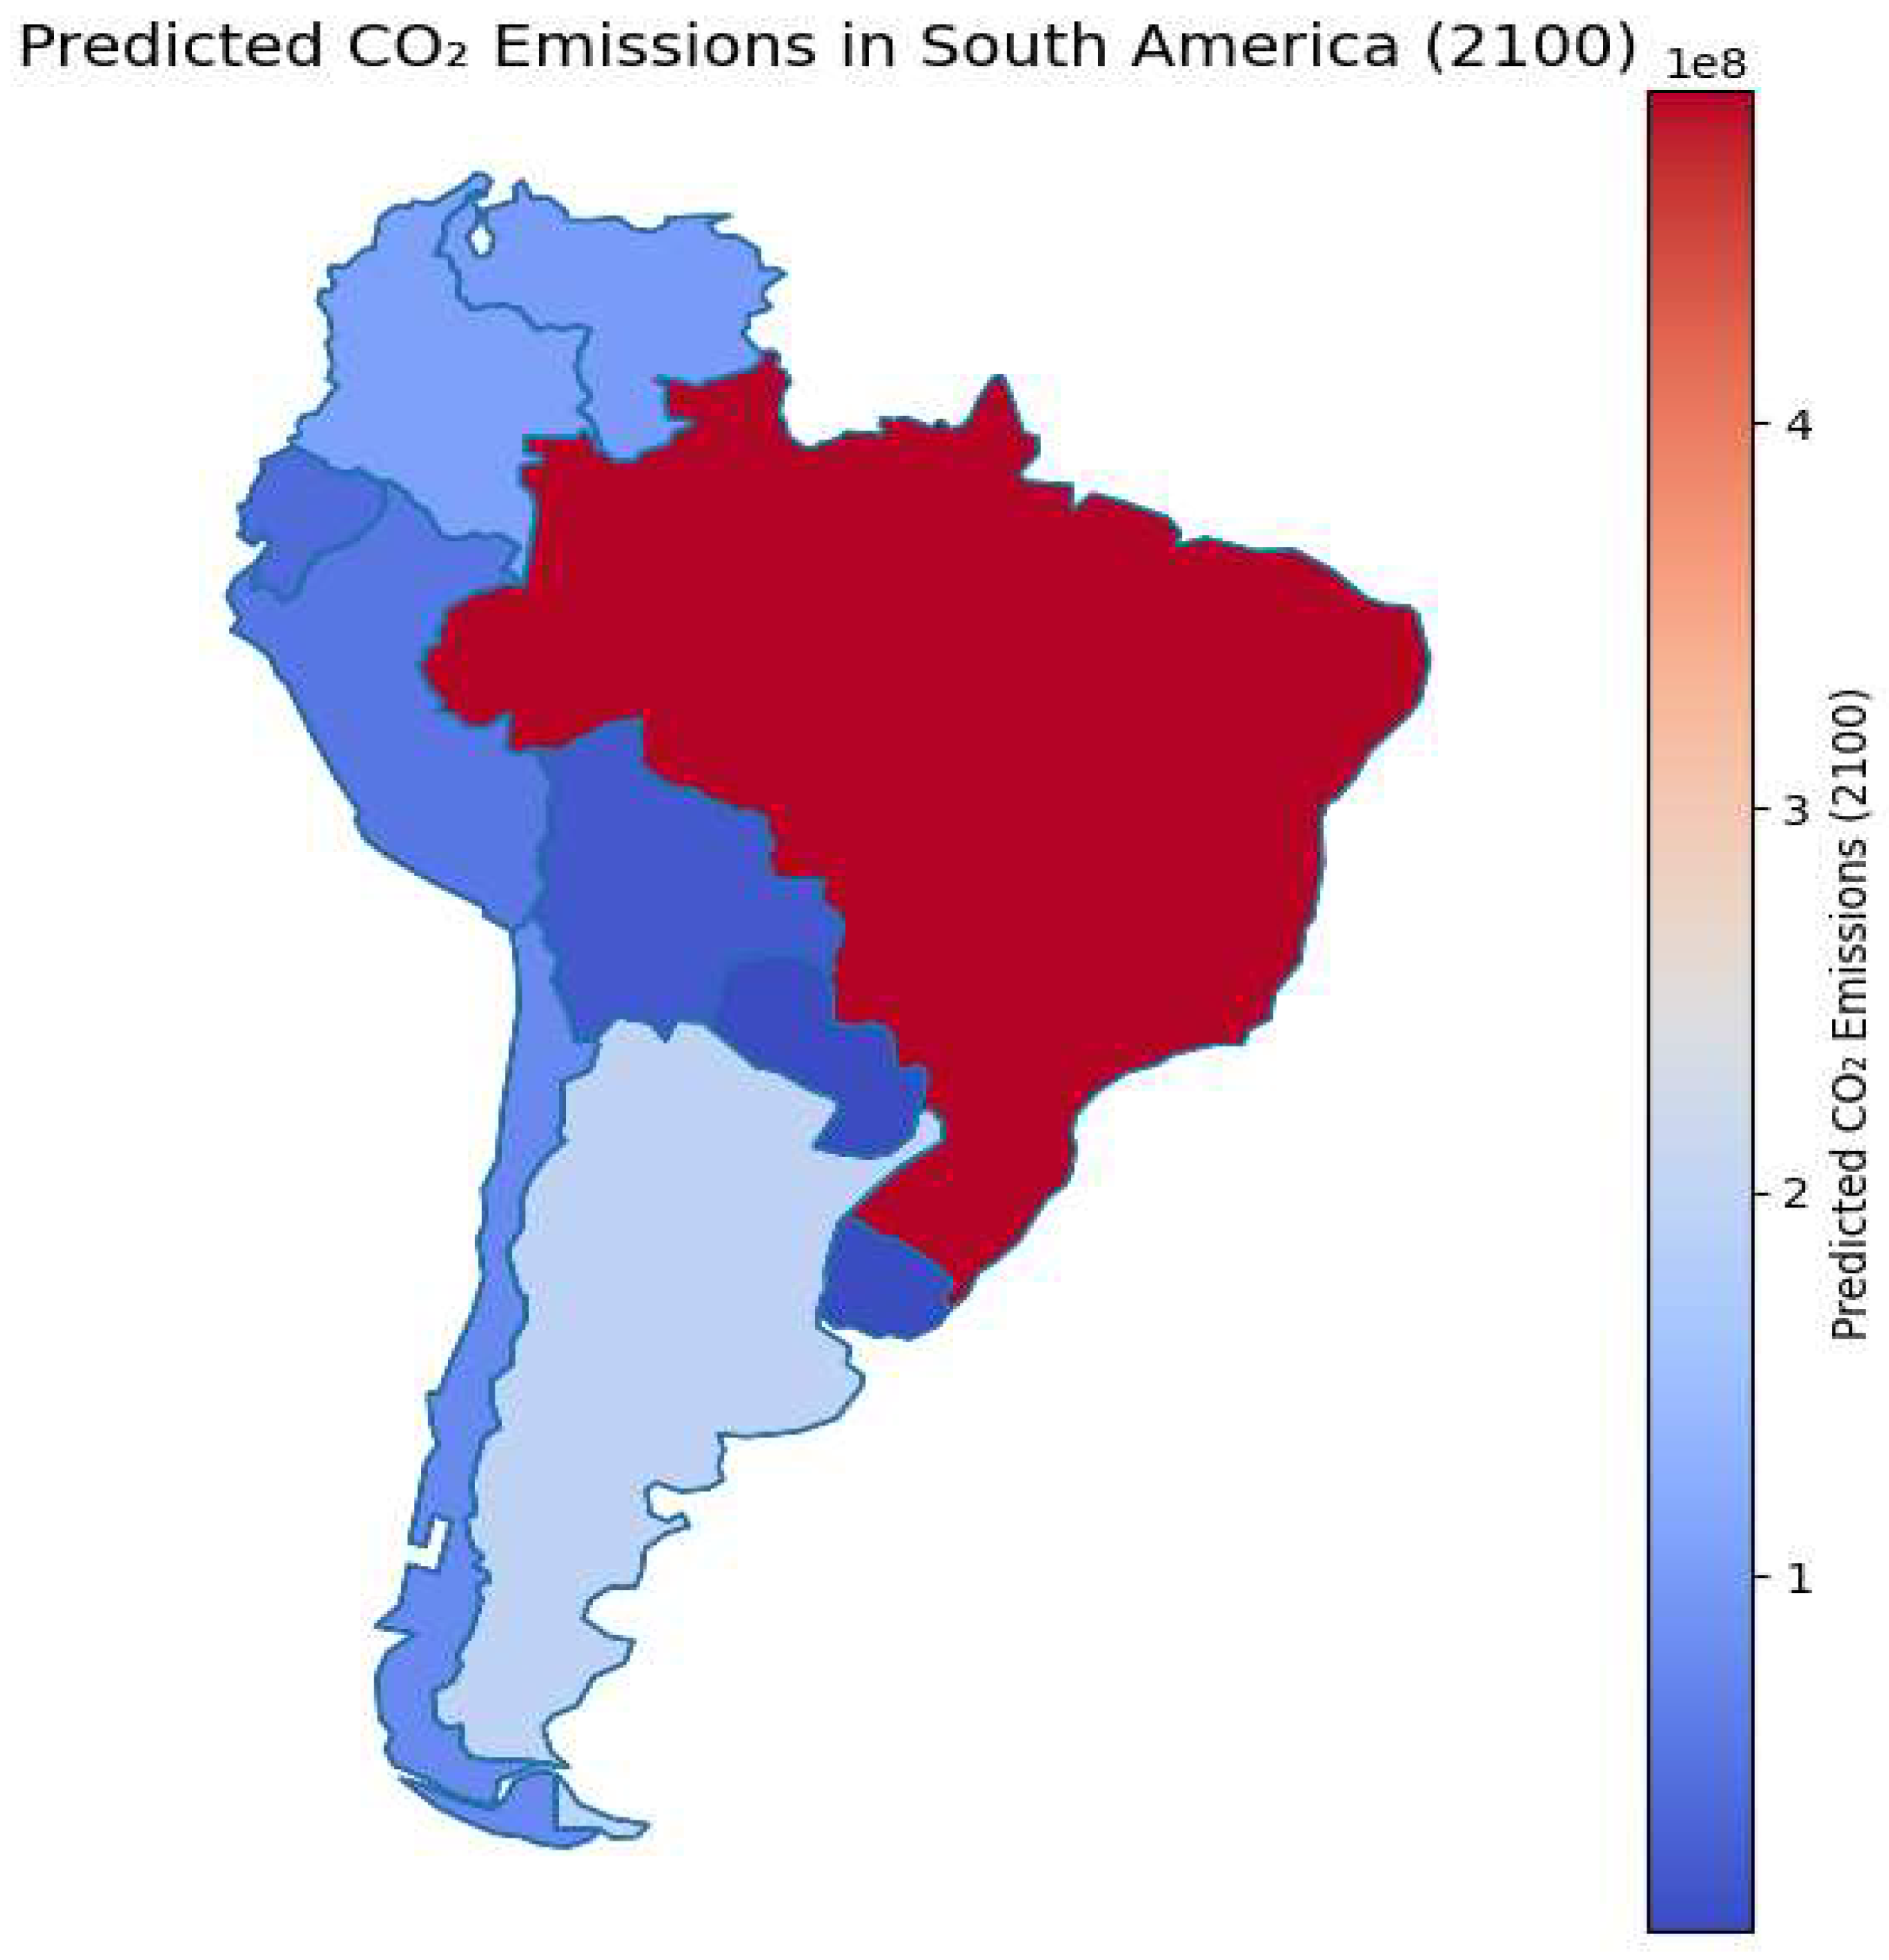
Figure 6.
Predicted CO2 Emissions in Australia.
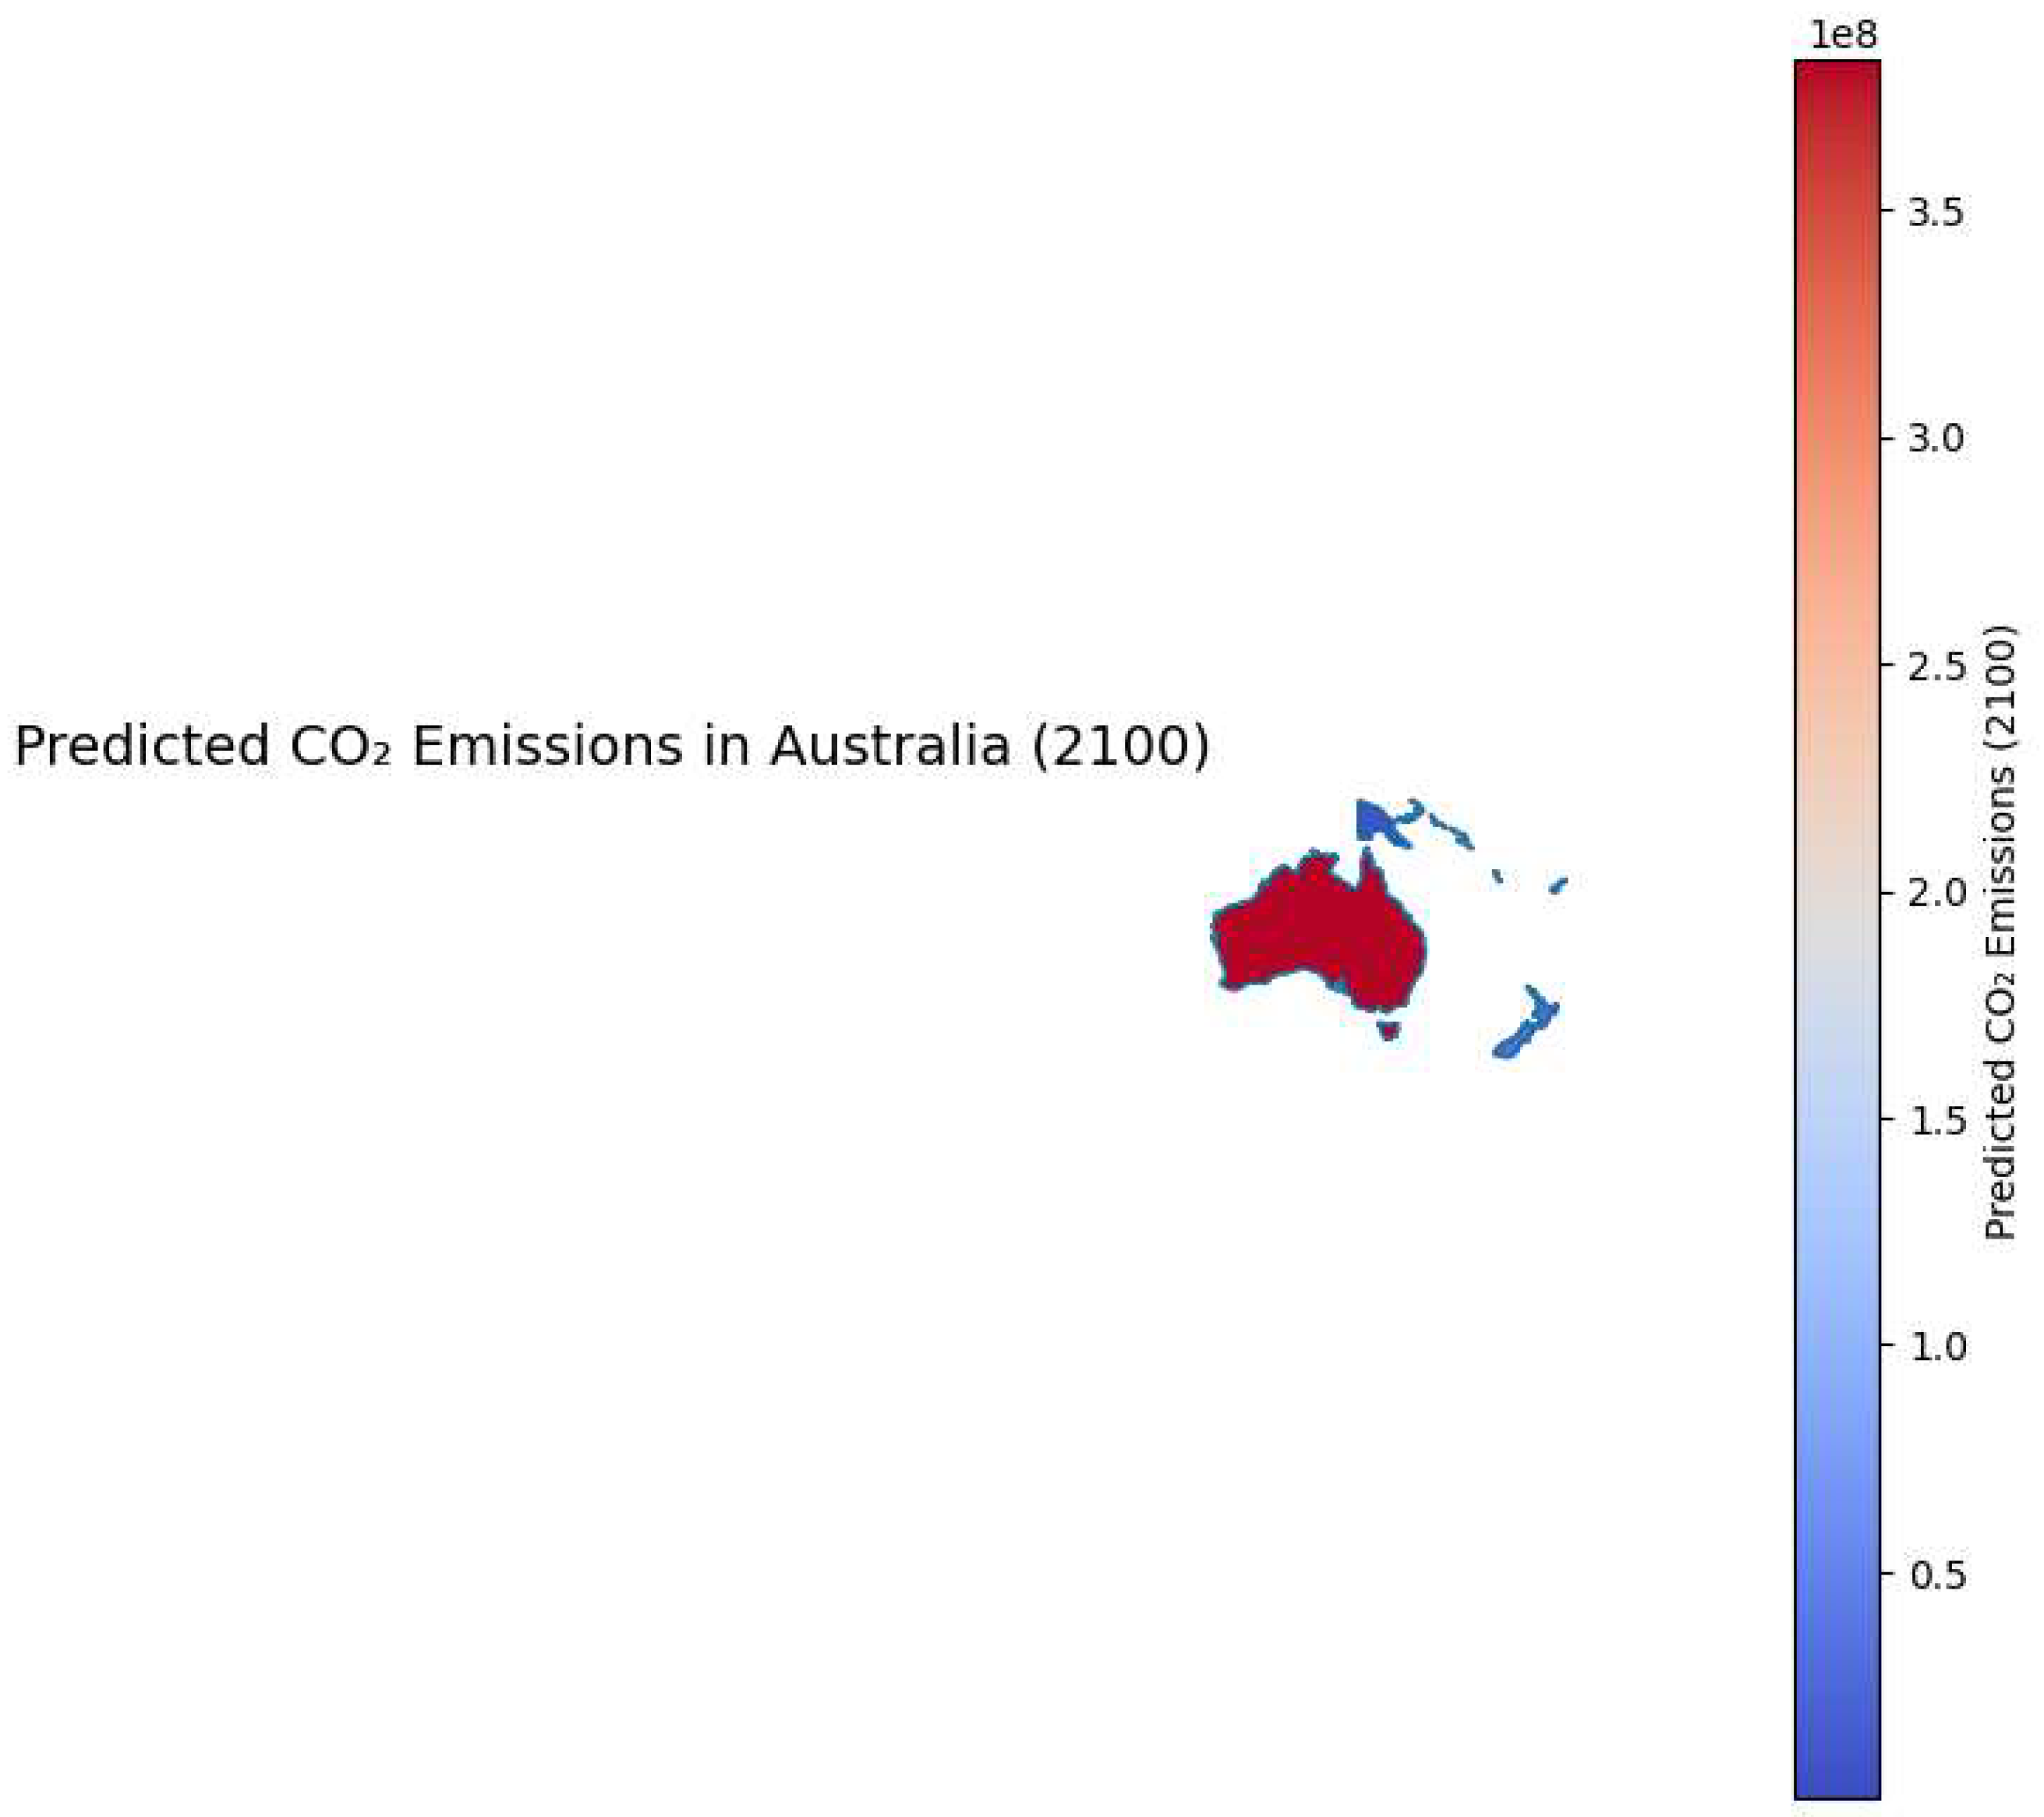
Figure 7.
Predicted CO2 Emissions in Antarctica.
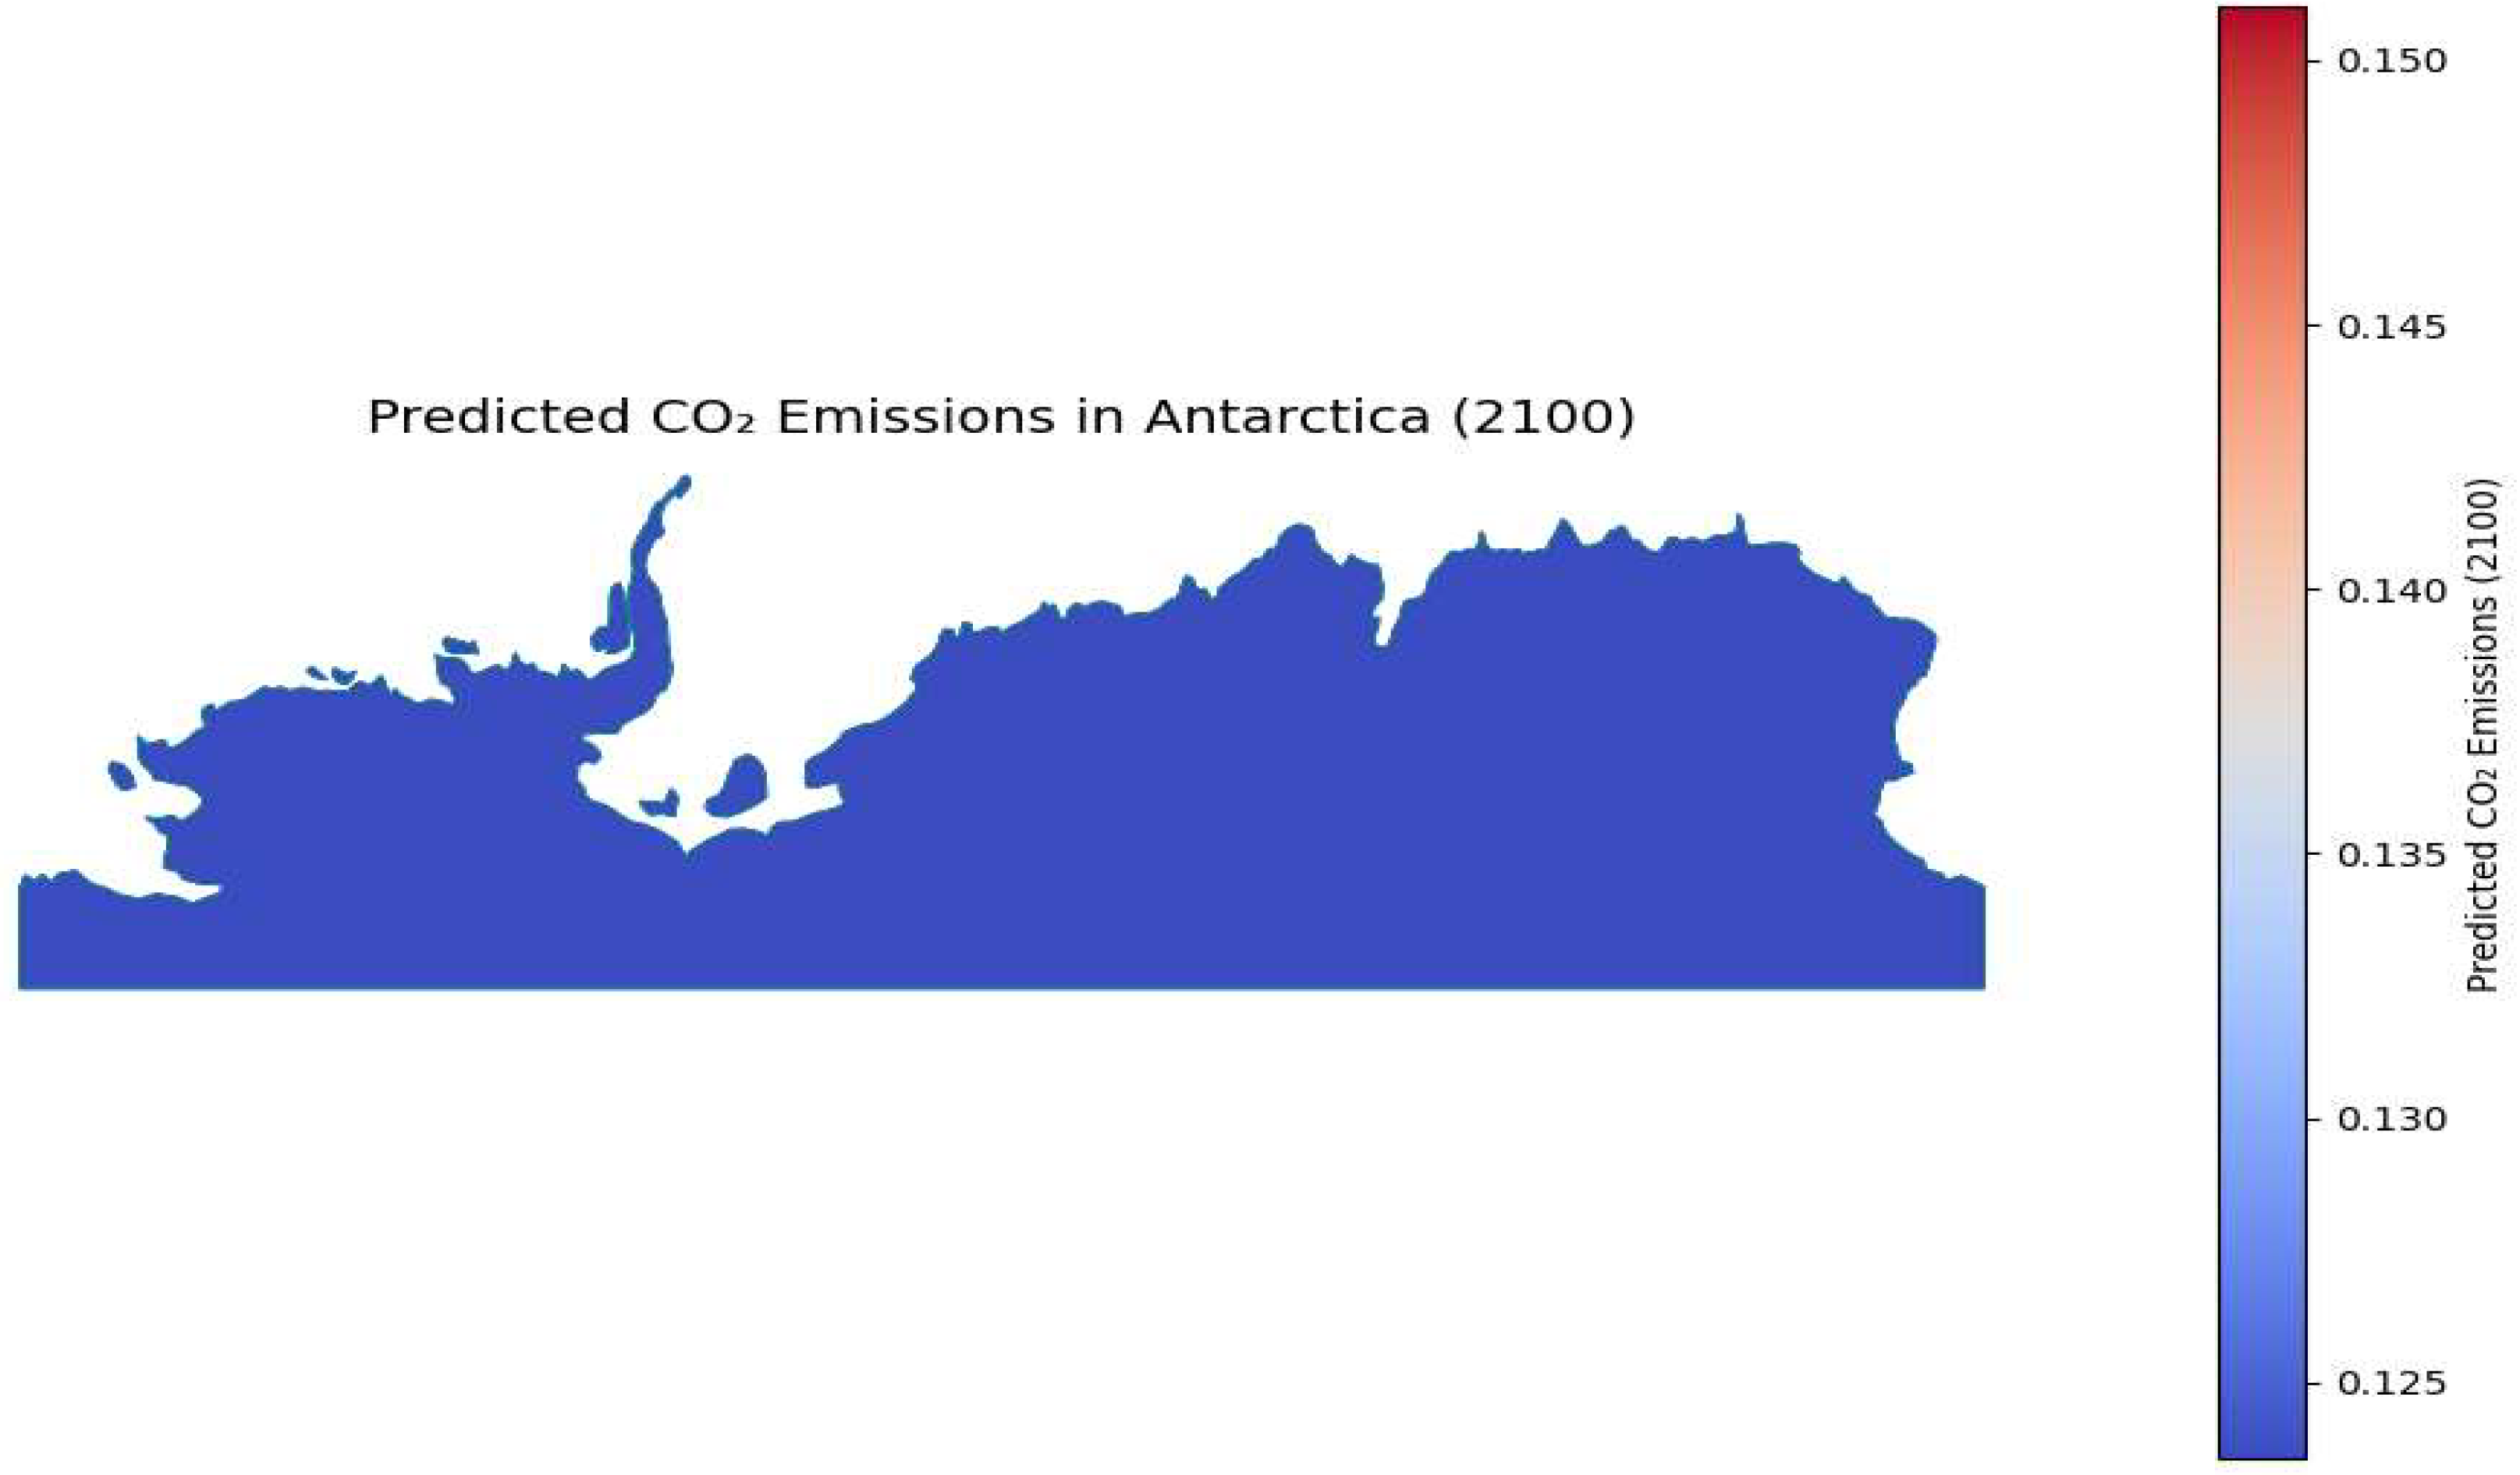
Figure 8.
Predicted CO2 Emissions in 2100-World Map.
4. Conclusions
This study highlights the transformative potential of integrating geospatial analysis with machine learning to predict global CO₂ emission patterns. By examining key socioeconomic factors such as GDP per capita, population density, urbanization, and HDI, we gained deeper insights into emission drivers and future trajectories. The Gradient Boosting Regressor model, combined with geospatial tools, proved highly effective, identifying emission hotspots with remarkable accuracy. Results reveal that while industrialized regions like North America, Europe, and Asia will remain major contributors, rapid emission growth is expected in Africa and South America. These findings emphasize the need for region-specific policies and targeted climate strategies using satellite data and machine learning. Ultimately, this research demonstrates the power of data-driven approaches in supporting sustainable climate action and lays the foundation for future interdisciplinary collaborations in addressing global climate challenges.
References
- Adams, S., & Nsiah, C. (2019). Reducing carbon dioxide emissions; Does renewable energy matter? Science of The Total Environment, 693, 133288. https://doi.org/10.1016/j.scitotenv.2019.07.094.
- Aldy, J. E. (2006). Per Capita Carbon Dioxide Emissions: Convergence or Divergence? Environmental & Resource Economics, 33(4), 533–555. https://doi.org/10.1007/s10640-005-6160-x.
- Amin, M., Shah, H. H., Fareed, A. G., Khan, W. U., Chung, E., Zia, A., Rahman Farooqi, Z. U., & Lee, C. (2022). Hydrogen production through renewable and non-renewable energy processes and their impact on climate change. International Journal of Hydrogen Energy, 47(77), 33112–33134. https://doi.org/10.1016/j.ijhydene.2022.07.172.
- Azdarpour, A., Guo, W., Asadullah, M., Asadullah, M., Mohammadian, E., Hamidi, H., Junin, R., & Karaei, M. A. (2015). A review on carbon dioxide mineral carbonation through pH-swing process. Chemical Engineering Journal. https://doi.org/10.1016/j.cej.2015.05.064.
- Bajari, P., Nekipelov, D., Ryan, S. P., & Yang, M. (2015). Machine Learning Methods for Demand Estimation. American Economic Review, 105(5), 481–485. https://doi.org/10.1257/aer.p20151021.
- Bowen, D., & Ungar, L. (2020). Generalized SHAP: Generating multiple types of explanations in machine learning. Arxiv.
- Brunton, S. L. (2021). Applying machine learning to study fluid mechanics. In Acta Mechanica Sinica/Lixue Xuebao (Vol. 37, Issue 12, pp. 1718–1726). Springer Verlag. https://doi.org/10.1007/s10409-021-01143-6.
- Candanedo, I. S., Nieves, E. H., González, S. R., Martín, M. T. S., & Briones, A. G. (2018). Machine Learning Predictive Model for Industry 4.0 (pp. 501–510). https://doi.org/10.1007/978-3-319-95204-8_42.
- Caney, S. (2009). Justice and the distribution of greenhouse gas emissions1. Journal of Global Ethics, 5(2), 125–146. https://doi.org/10.1080/17449620903110300.
- Chichilnisky, G., & Heal, G. (1994). Who should abate carbon emissions? Economics Letters, 44(4), 443–449. https://doi.org/10.1016/0165-1765(94)90119-8.
- Dowell, N. Mac, Fennell, P. S., Shah, N., Shah, N., & Maitland, G. C. (2017). The role of CO2 capture and utilization in mitigating climate change. Nature Climate Change. https://doi.org/10.1038/nclimate3231.
- Ezcurra, R. (2007). Is there cross-country convergence in carbon dioxide emissions? Energy Policy, 35(2), 1363–1372. https://doi.org/10.1016/j.enpol.2006.04.006.
- Fajardy, M., Patrizio, P., Daggash, H. A., Dowell, N. Mac, & Dowell, N. Mac. (2019). Negative Emissions: Priorities for Research and Policy Design. Null. https://doi.org/10.3389/fclim.2019.00006.
- Gür, T. M. (2022). Carbon Dioxide Emissions, Capture, Storage and Utilization: Review of Materials, Processes and Technologies. Progress in Energy and Combustion Science, 89, 100965. https://doi.org/10.1016/j.pecs.2021.100965.
- Jonayat, A. S. M., van Duin, A. C. T., & Janik, M. J. (2018). Discovery of Descriptors for Stable Monolayer Oxide Coatings through Machine Learning. ACS Applied Energy Materials, 1(11), 6217–6226. https://doi.org/10.1021/acsaem.8b01261.
- Kätelhön, A., Meys, R., Deutz, S., Suh, S., Stolten, D., & Bardow, A. (2019). Climate change mitigation potential of carbon capture and utilization in the chemical industry. Proceedings of the National Academy of Sciences of the United States of America. https://doi.org/10.1073/pnas.1821029116.
- Kruppa, J., Ziegler, A., & König, I. R. (2012). Risk estimation and risk prediction using machine-learning methods. Human Genetics, 131(10), 1639–1654. https://doi.org/10.1007/s00439-012-1194-y.
- Lee, M., Zhang, N., Zhang, N., & Zhang, N. (2012). Technical efficiency, shadow price of carbon dioxide emissions, and substitutability for energy in the Chinese manufacturing industries. Energy Economics. https://doi.org/10.1016/j.eneco.2012.06.023.
- Liu, H., Chan, V. K. H., Tantikhajorngosol, P., Li, T., Dong, S., Chan, C., & Tontiwachwuthikul, P. (2022). Novel Machine Learning Model Correlating CO2Equilibrium Solubility in Three Tertiary Amines. Industrial and Engineering Chemistry Research, 61(37), 14020–14032. https://doi.org/10.1021/acs.iecr.2c02006.
- Liu, Y., Zhang, D., Tang, Y., Zhang, Y., Chang, Y., & Zheng, J. (2021). Machine Learning-Enabled Design and Prediction of Protein Resistance on Self-Assembled Monolayers and Beyond. ACS Applied Materials & Interfaces, 13(9), 11306–11319. https://doi.org/10.1021/acsami.1c00642.
- Mancini, F., & Basso, G. Lo. (2020). How Climate Change Affects the Building Energy Consumptions Due to Cooling, Heating, and Electricity Demands of Italian Residential Sector. Energies. https://doi.org/10.3390/en13020410.
- Mansouri Tehrani, A., Oliynyk, A. O., Parry, M., Rizvi, Z., Couper, S., Lin, F., Miyagi, L., Sparks, T. D., & Brgoch, J. (2018). Machine Learning Directed Search for Ultraincompressible, Superhard Materials. Journal of the American Chemical Society, 140(31), 9844–9853. https://doi.org/10.1021/jacs.8b02717.
- Mazhnik, E., & Oganov, A. R. (2020). Application of machine learning methods for predicting new superhard materials. Journal of Applied Physics, 128(7), 075102. https://doi.org/10.1063/5.0012055.
- Mittal, H., & Kushwaha, O. S. (2024). Machine Learning in Commercialized Coatings. In Functional Coatings (pp. 450–474). Wiley. https://doi.org/10.1002/9781394207305.ch17.
- Montzka, S. A., Dlugokencky, E. J., & Butler, J. H. (2011). Non-CO2 greenhouse gases and climate change. Nature, 476(7358), 43–50. https://doi.org/10.1038/nature10322.
- Neumayer, E. (2004). National carbon dioxide emissions: geography matters. Area, 36(1), 33–40. https://doi.org/10.1111/j.0004-0894.2004.00317.x.
- Rodriguez-Galiano, V., Sanchez-Castillo, M., Chica-Olmo, M., & Chica-Rivas, M. (2015). Machine learning predictive models for mineral prospectivity: An evaluation of neural networks, random forest, regression trees and support vector machines. Ore Geology Reviews, 71, 804–818. https://doi.org/10.1016/j.oregeorev.2015.01.001.
- Sakakura, T., Sakakura, T., Choi, J.-C., & Yasuda, H. (2007). Transformation of carbon dioxide. Chemical Reviews. https://doi.org/10.1021/cr068357u.
- Schmalensee, R., Stoker, T. M., & Judson, R. A. (1998). World Carbon Dioxide Emissions: 1950–2050. Review of Economics and Statistics, 80(1), 15–27. https://doi.org/10.1162/003465398557294.
- Schmitz, M., Kim, J.-Y., & Jacobs, L. J. (2023). Machine and deep learning for coating thickness prediction using Lamb waves. Wave Motion, 120, 103137. https://doi.org/10.1016/j.wavemoti.2023.103137.
- Solomon, S., Plattner, G.-K., Knutti, R., & Friedlingstein, P. (2009). Irreversible climate change due to carbon dioxide emissions. Proceedings of the National Academy of Sciences, 106(6), 1704–1709. https://doi.org/10.1073/pnas.0812721106.
- Tan, C. H., Nomanbhay, S., Shamsuddin, A. H., Park, Y.-K., Hernández-Cocoletzi, H., & Show, P. L. (2022). Current Developments in Catalytic Methanation of Carbon Dioxide—A Review. Frontiers in Energy Research, 9. https://doi.org/10.3389/fenrg.2021.795423.
- Varoquaux, G., Varoquaux, G., Buitinck, L., Buitinck, L., Buitinck, L., Louppe, G., Louppe, G., Grisel, O., Grisel, O., Pedregosa, F., Pedregosa, F., Mueller, A., & Mueller, A. (2015). Scikit-learn: Machine Learning Without Learning the Machinery. https://doi.org/10.1145/2786984.2786995.
- Yang, H., Zou, C., Huang, M., Zang, M., & Chen, S. (2023). High-fidelity computational modeling of scratch damage in automotive coatings with machine learning-driven identification of fracture parameters. Composite Structures, 316, 117027. https://doi.org/10.1016/j.compstruct.2023.117027.
- Zhang, X.-P., & Cheng, X.-M. (2009). Energy consumption, carbon emissions, and economic growth in China. Ecological Economics, 68(10), 2706–2712. https://doi.org/10.1016/j.ecolecon.2009.05.011.
Disclaimer/Publisher’s Note: The statements, opinions and data contained in all publications are solely those of the individual author(s) and contributor(s) and not of MDPI and/or the editor(s). MDPI and/or the editor(s) disclaim responsibility for any injury to people or property resulting from any ideas, methods, instructions or products referred to in the content. |
© 2025 by the authors. Licensee MDPI, Basel, Switzerland. This article is an open access article distributed under the terms and conditions of the Creative Commons Attribution (CC BY) license (http://creativecommons.org/licenses/by/4.0/).
Copyright: This open access article is published under a Creative Commons CC BY 4.0 license, which permit the free download, distribution, and reuse, provided that the author and preprint are cited in any reuse.


