Submitted:
08 February 2025
Posted:
10 February 2025
You are already at the latest version
Abstract
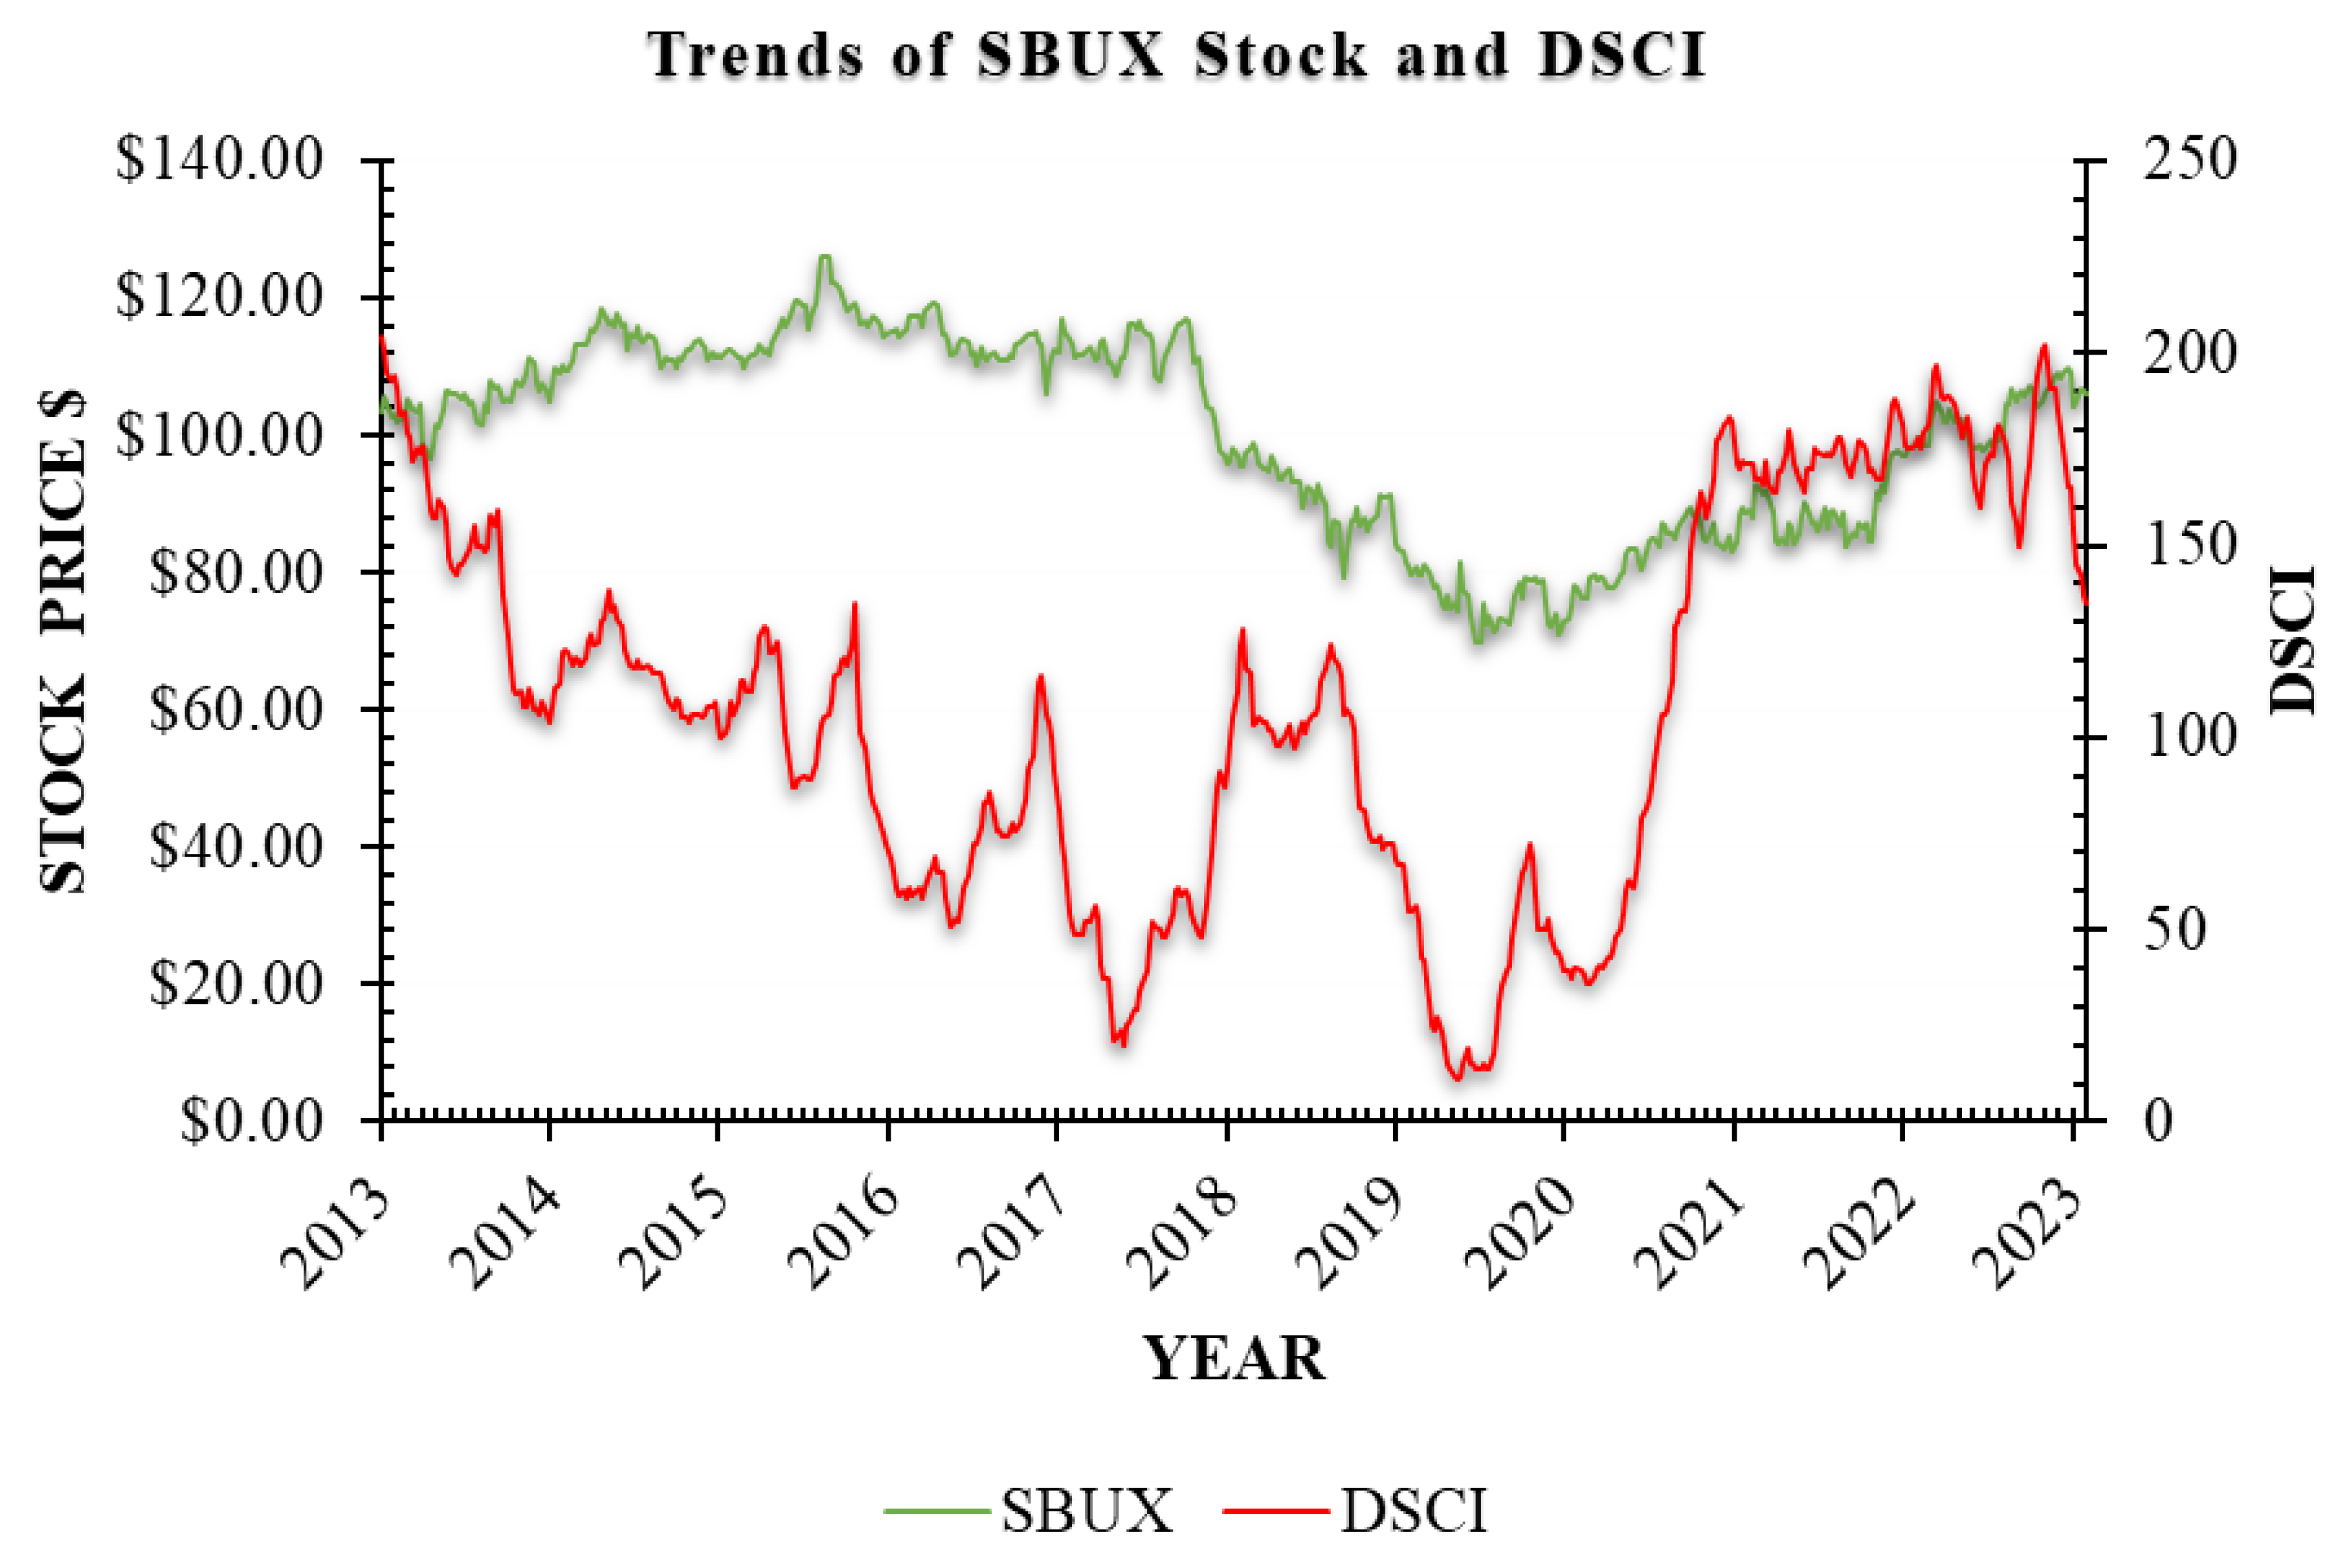
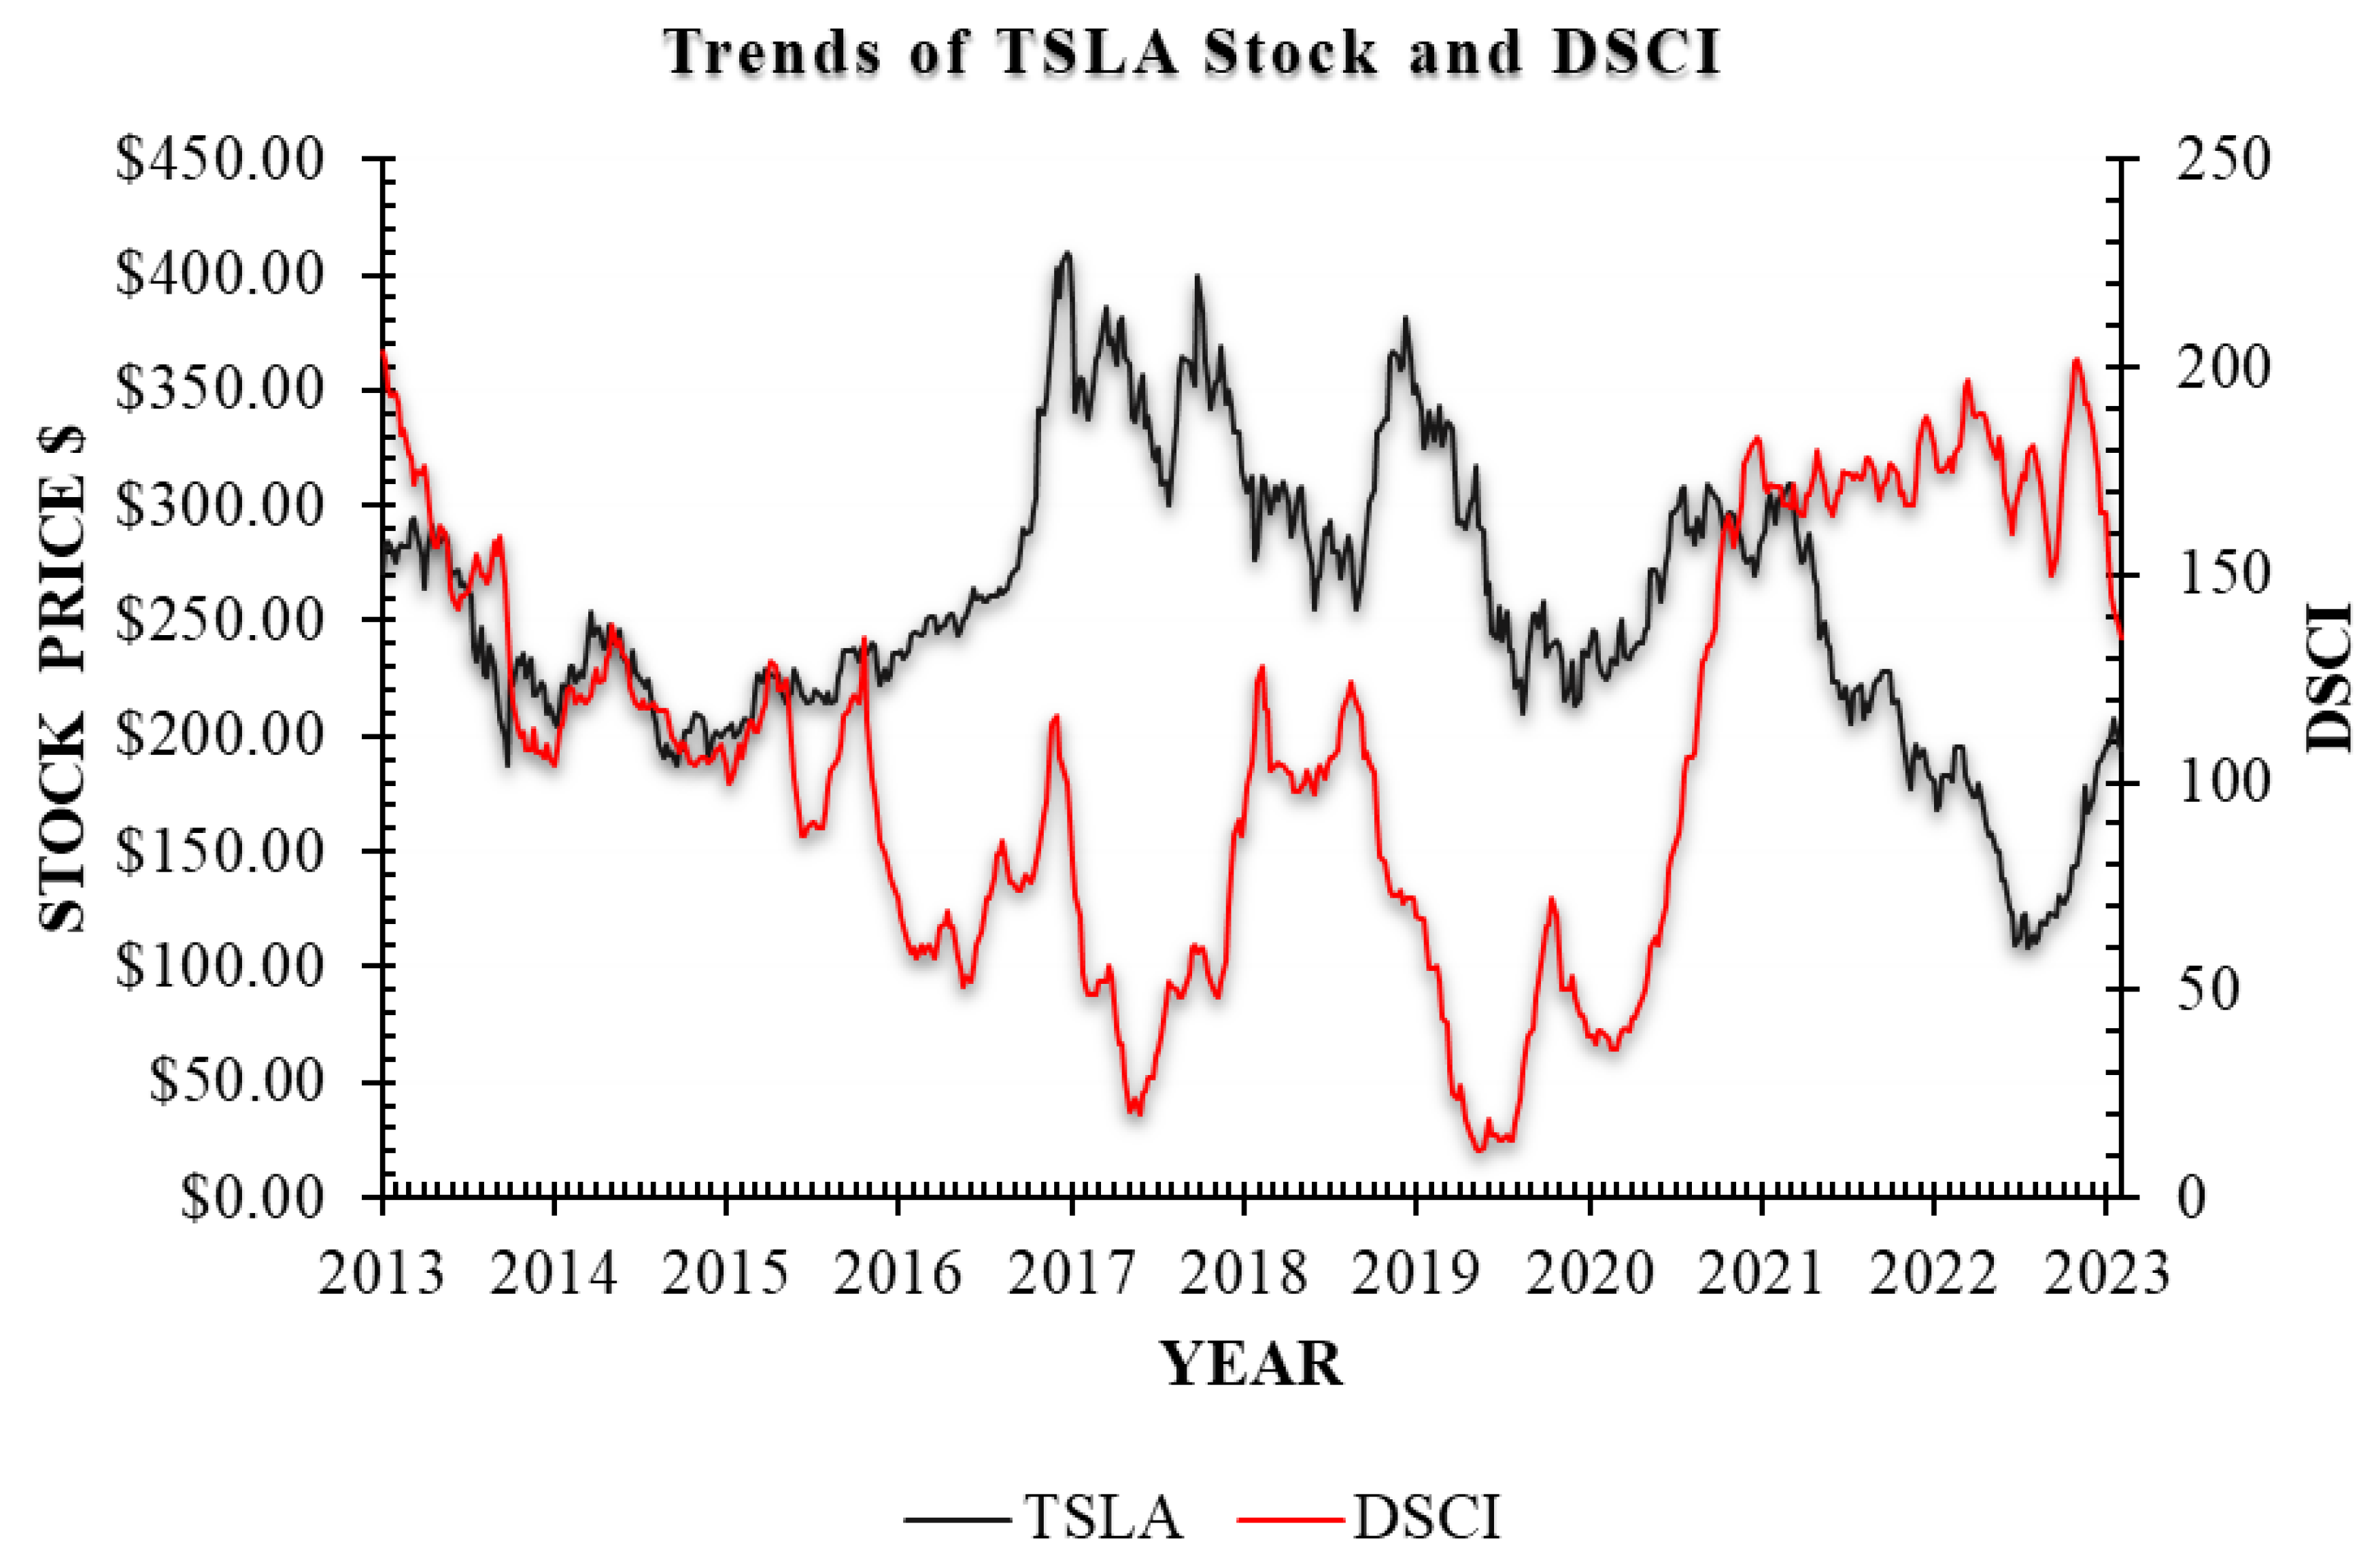
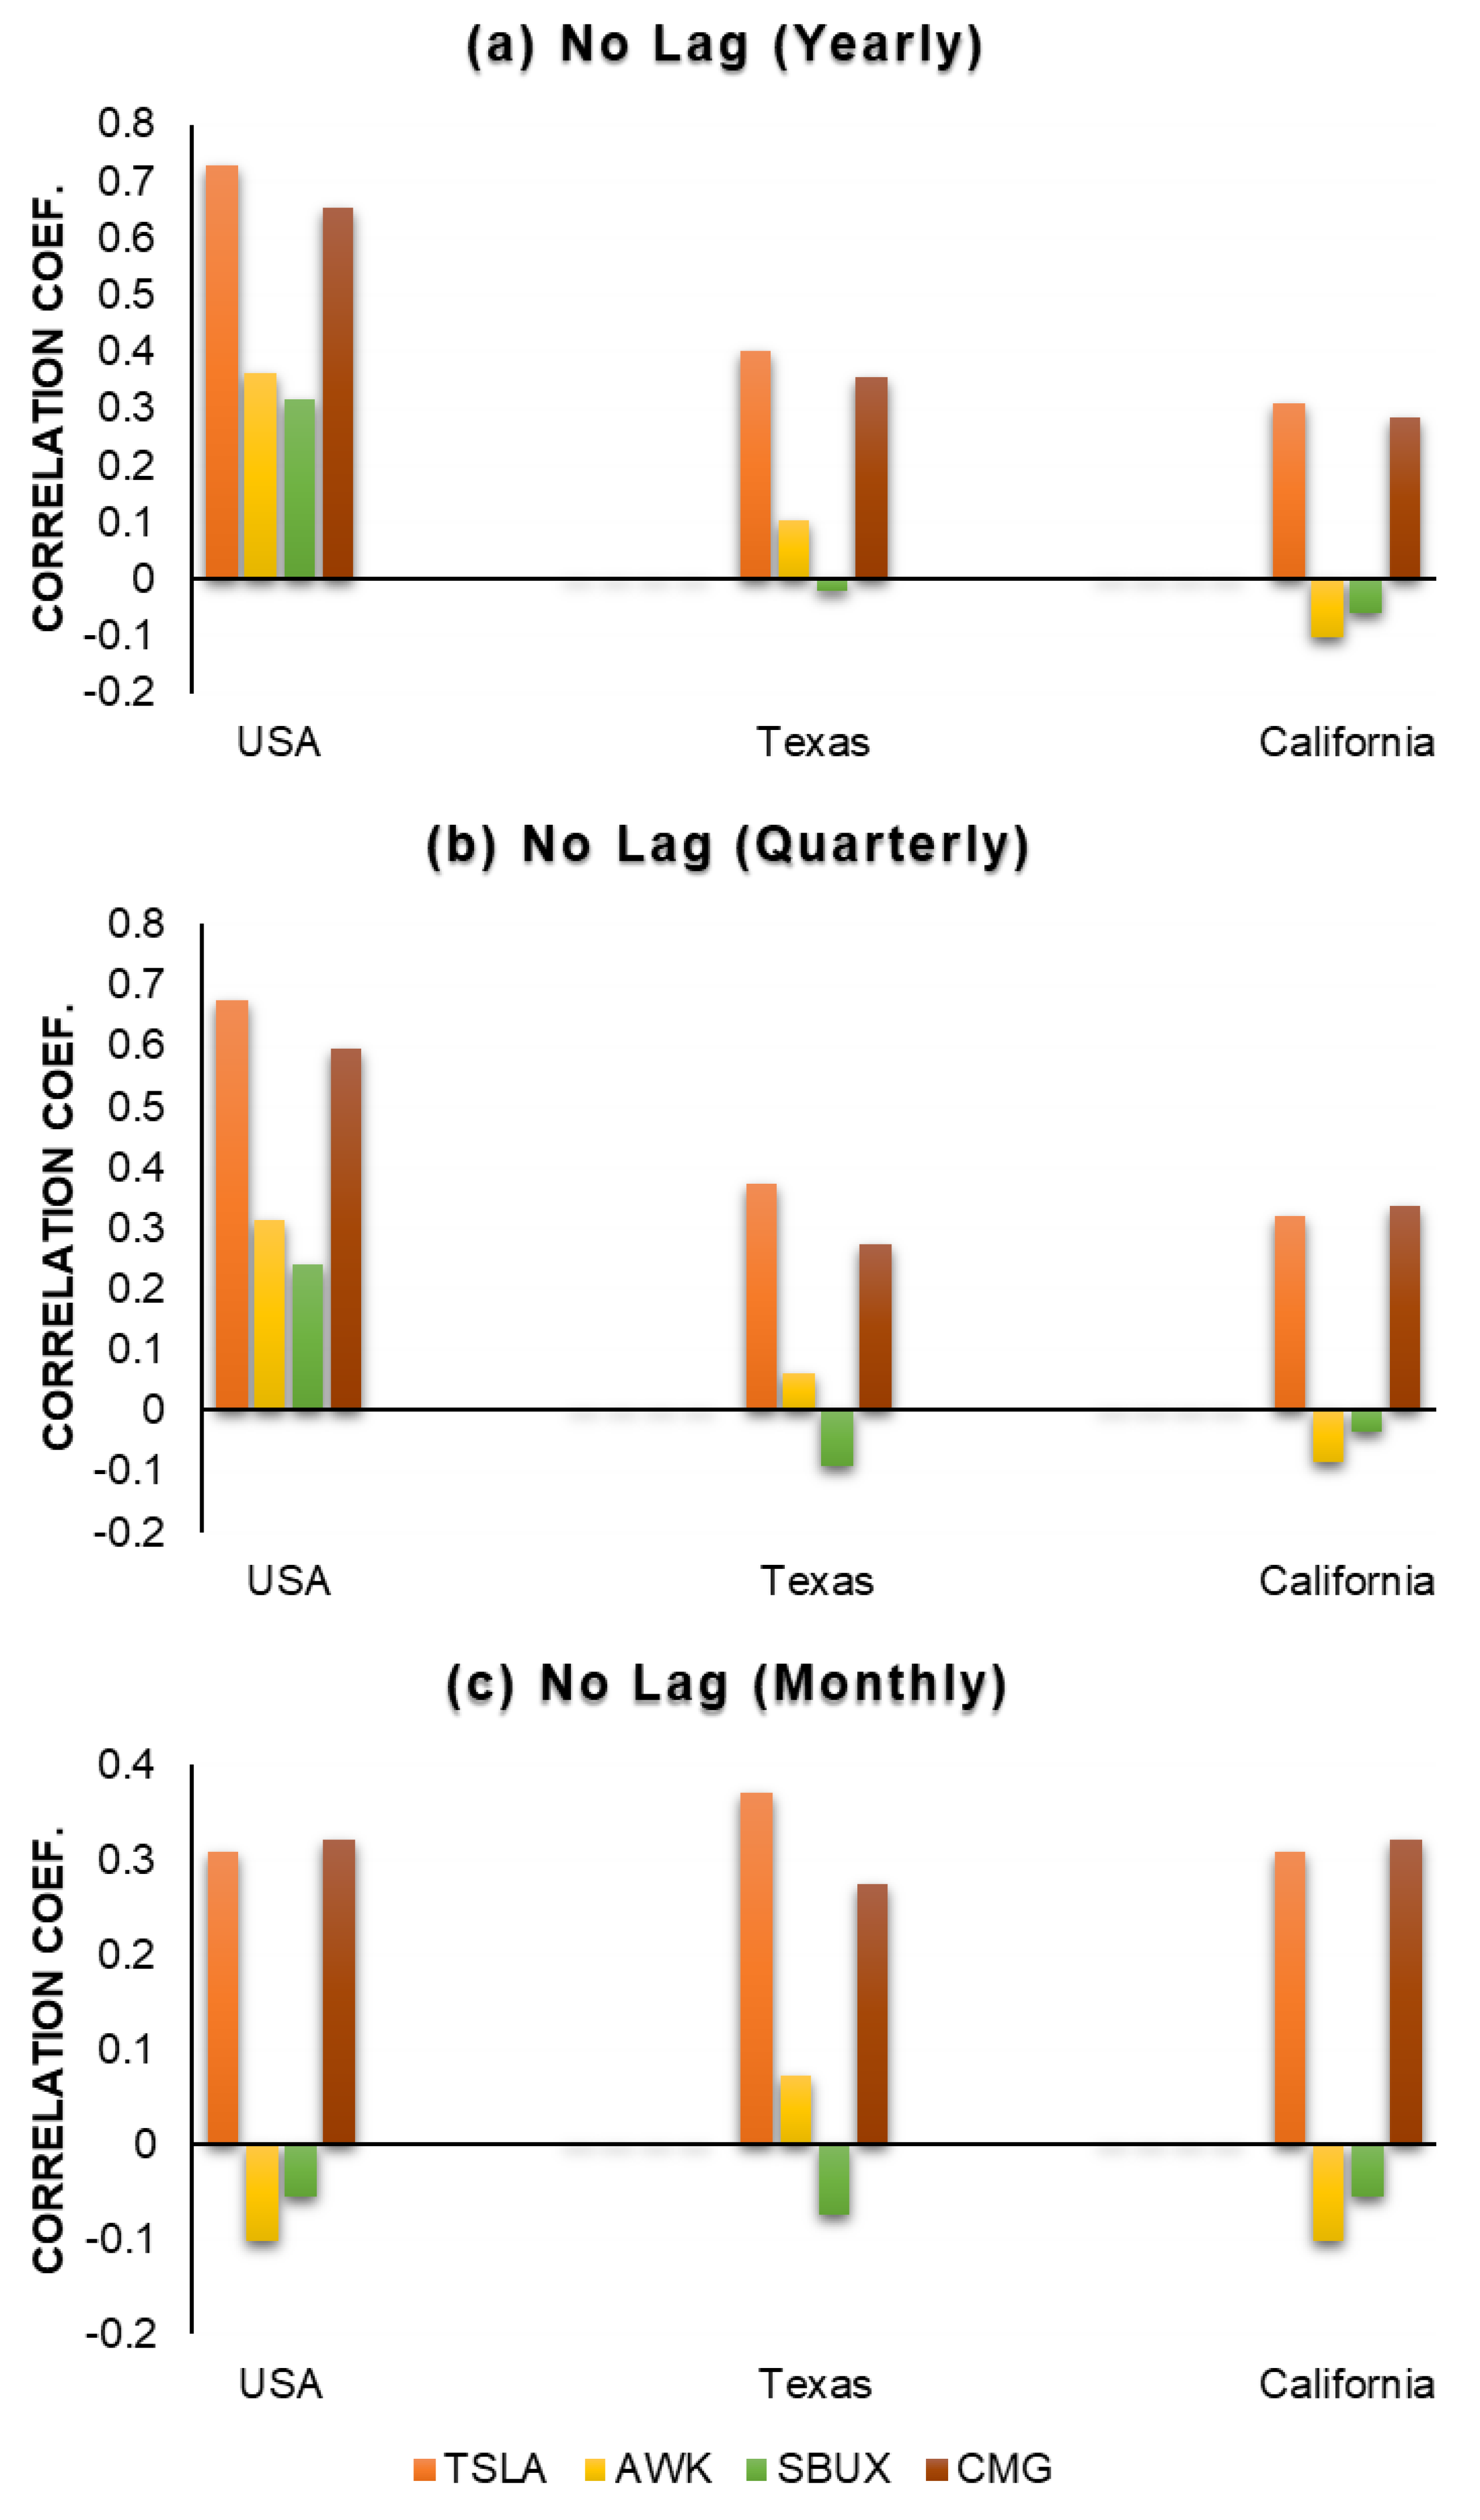
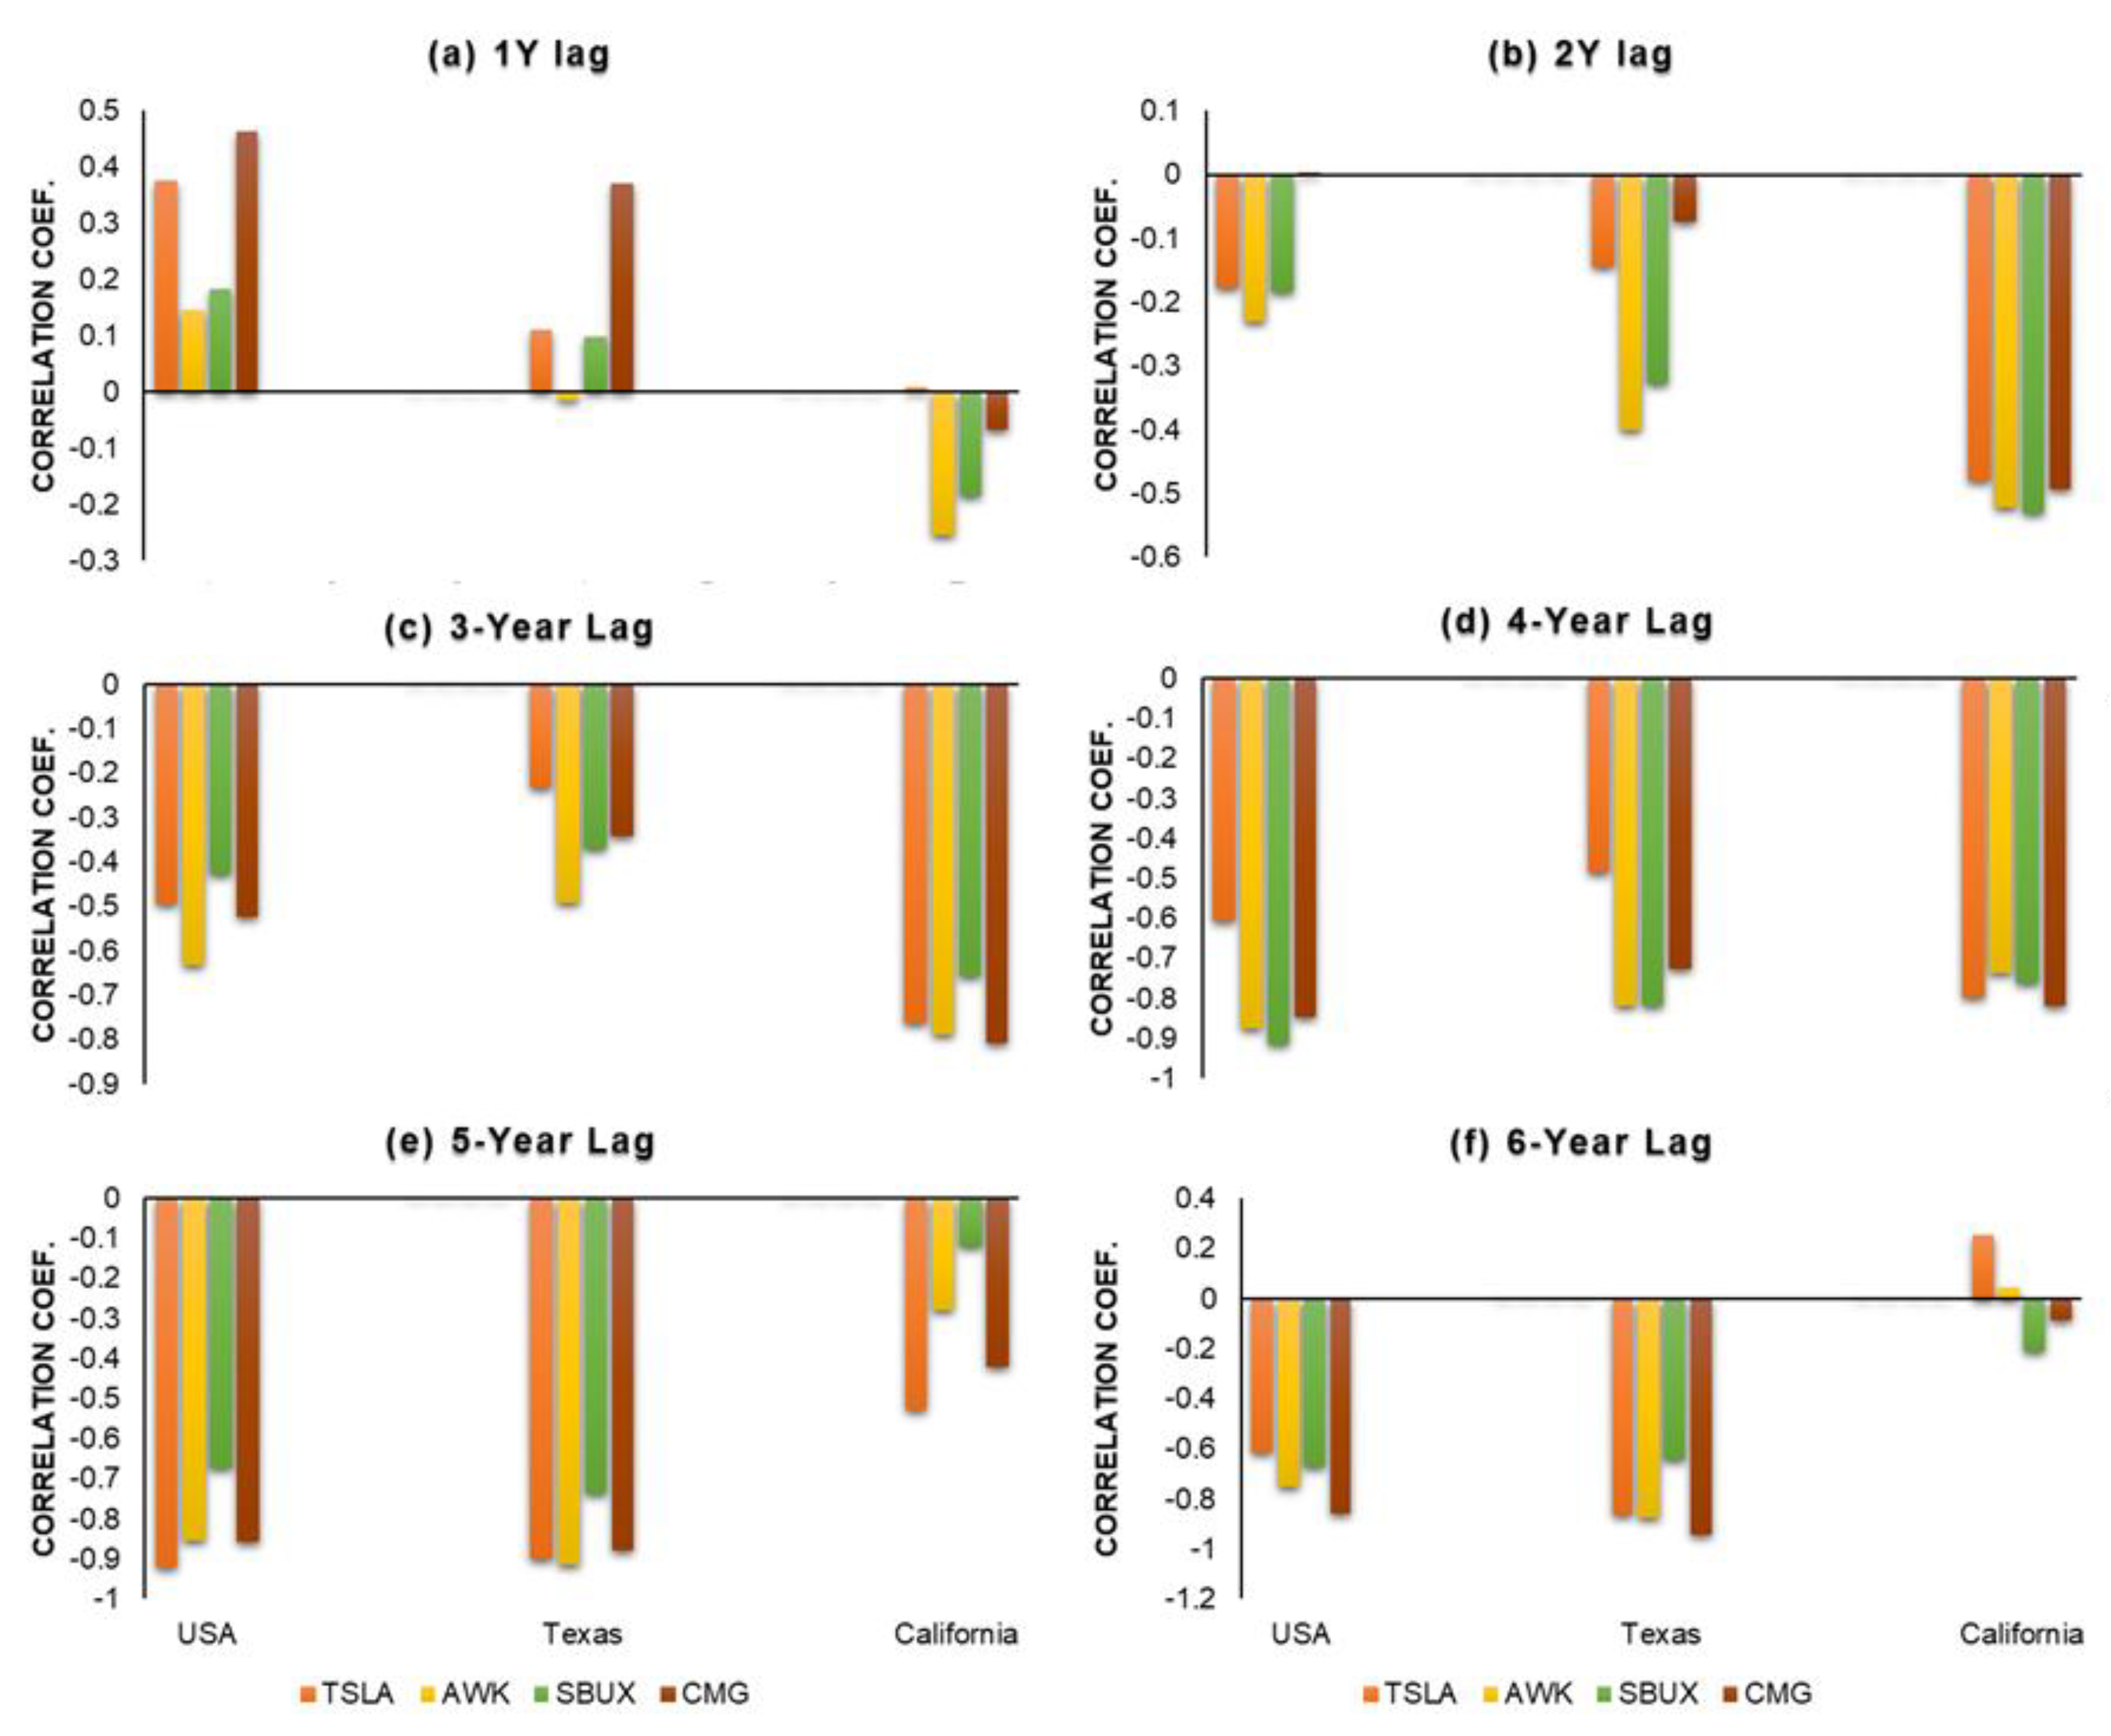
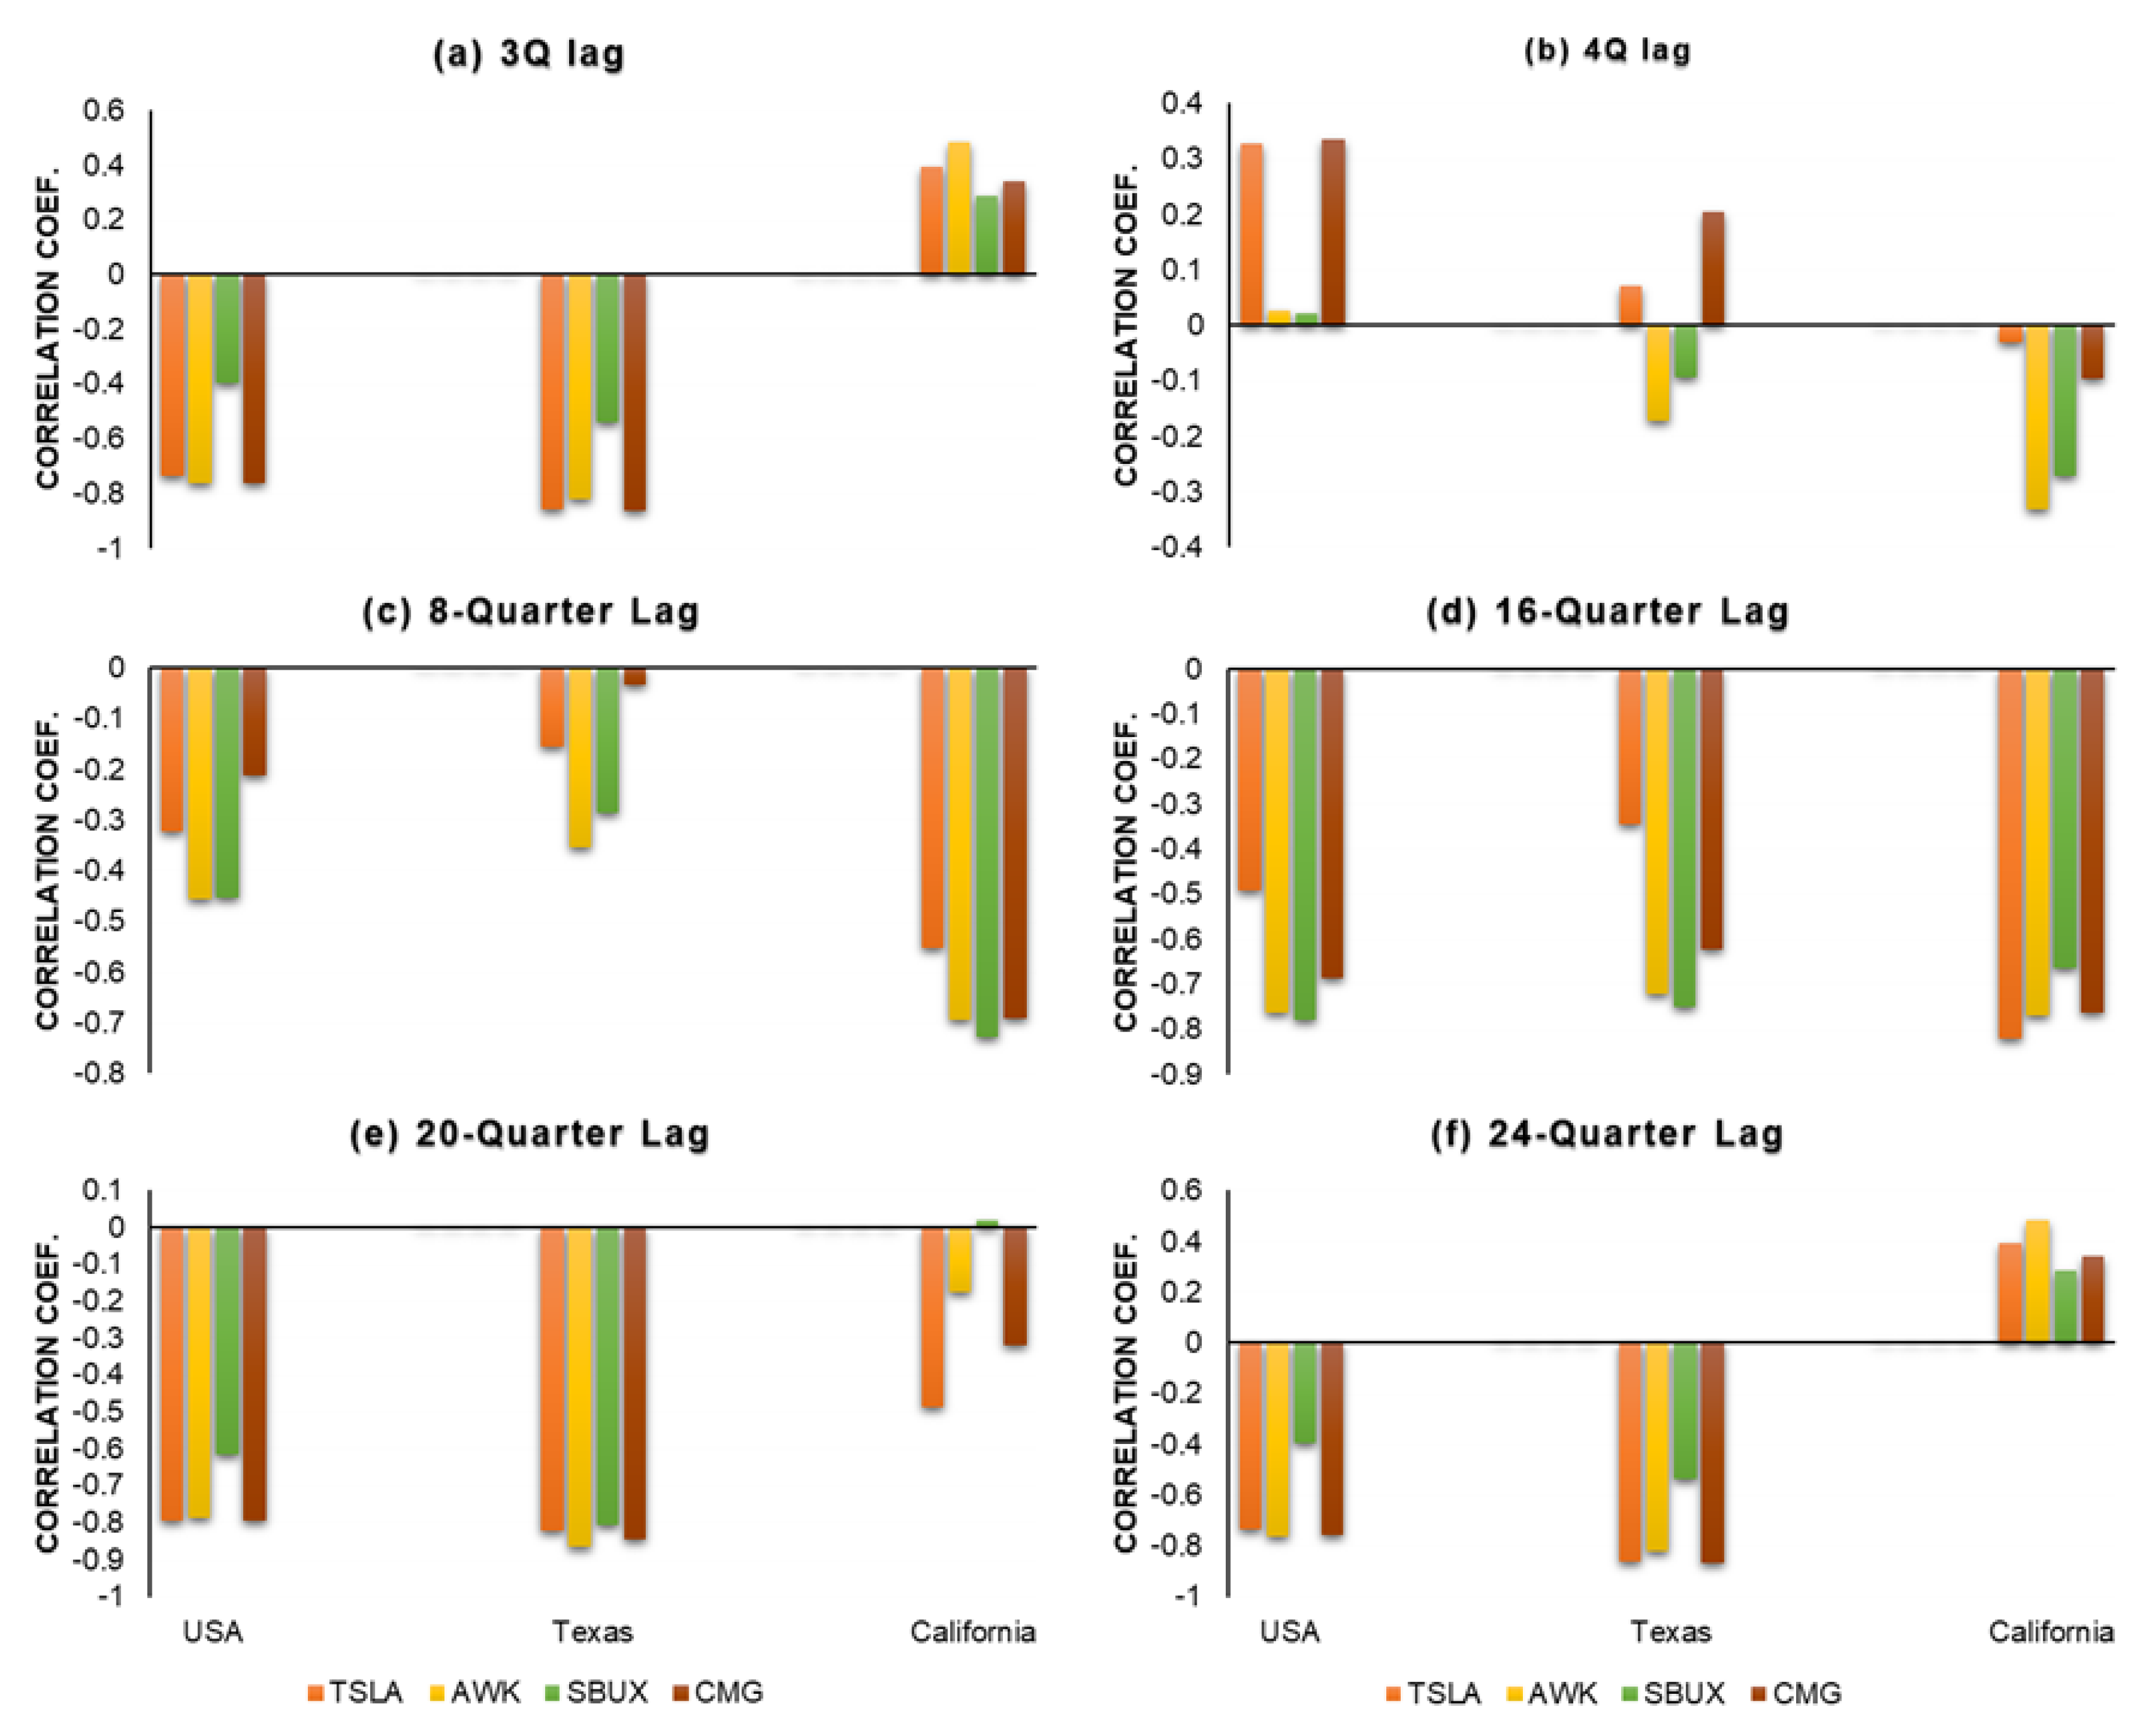
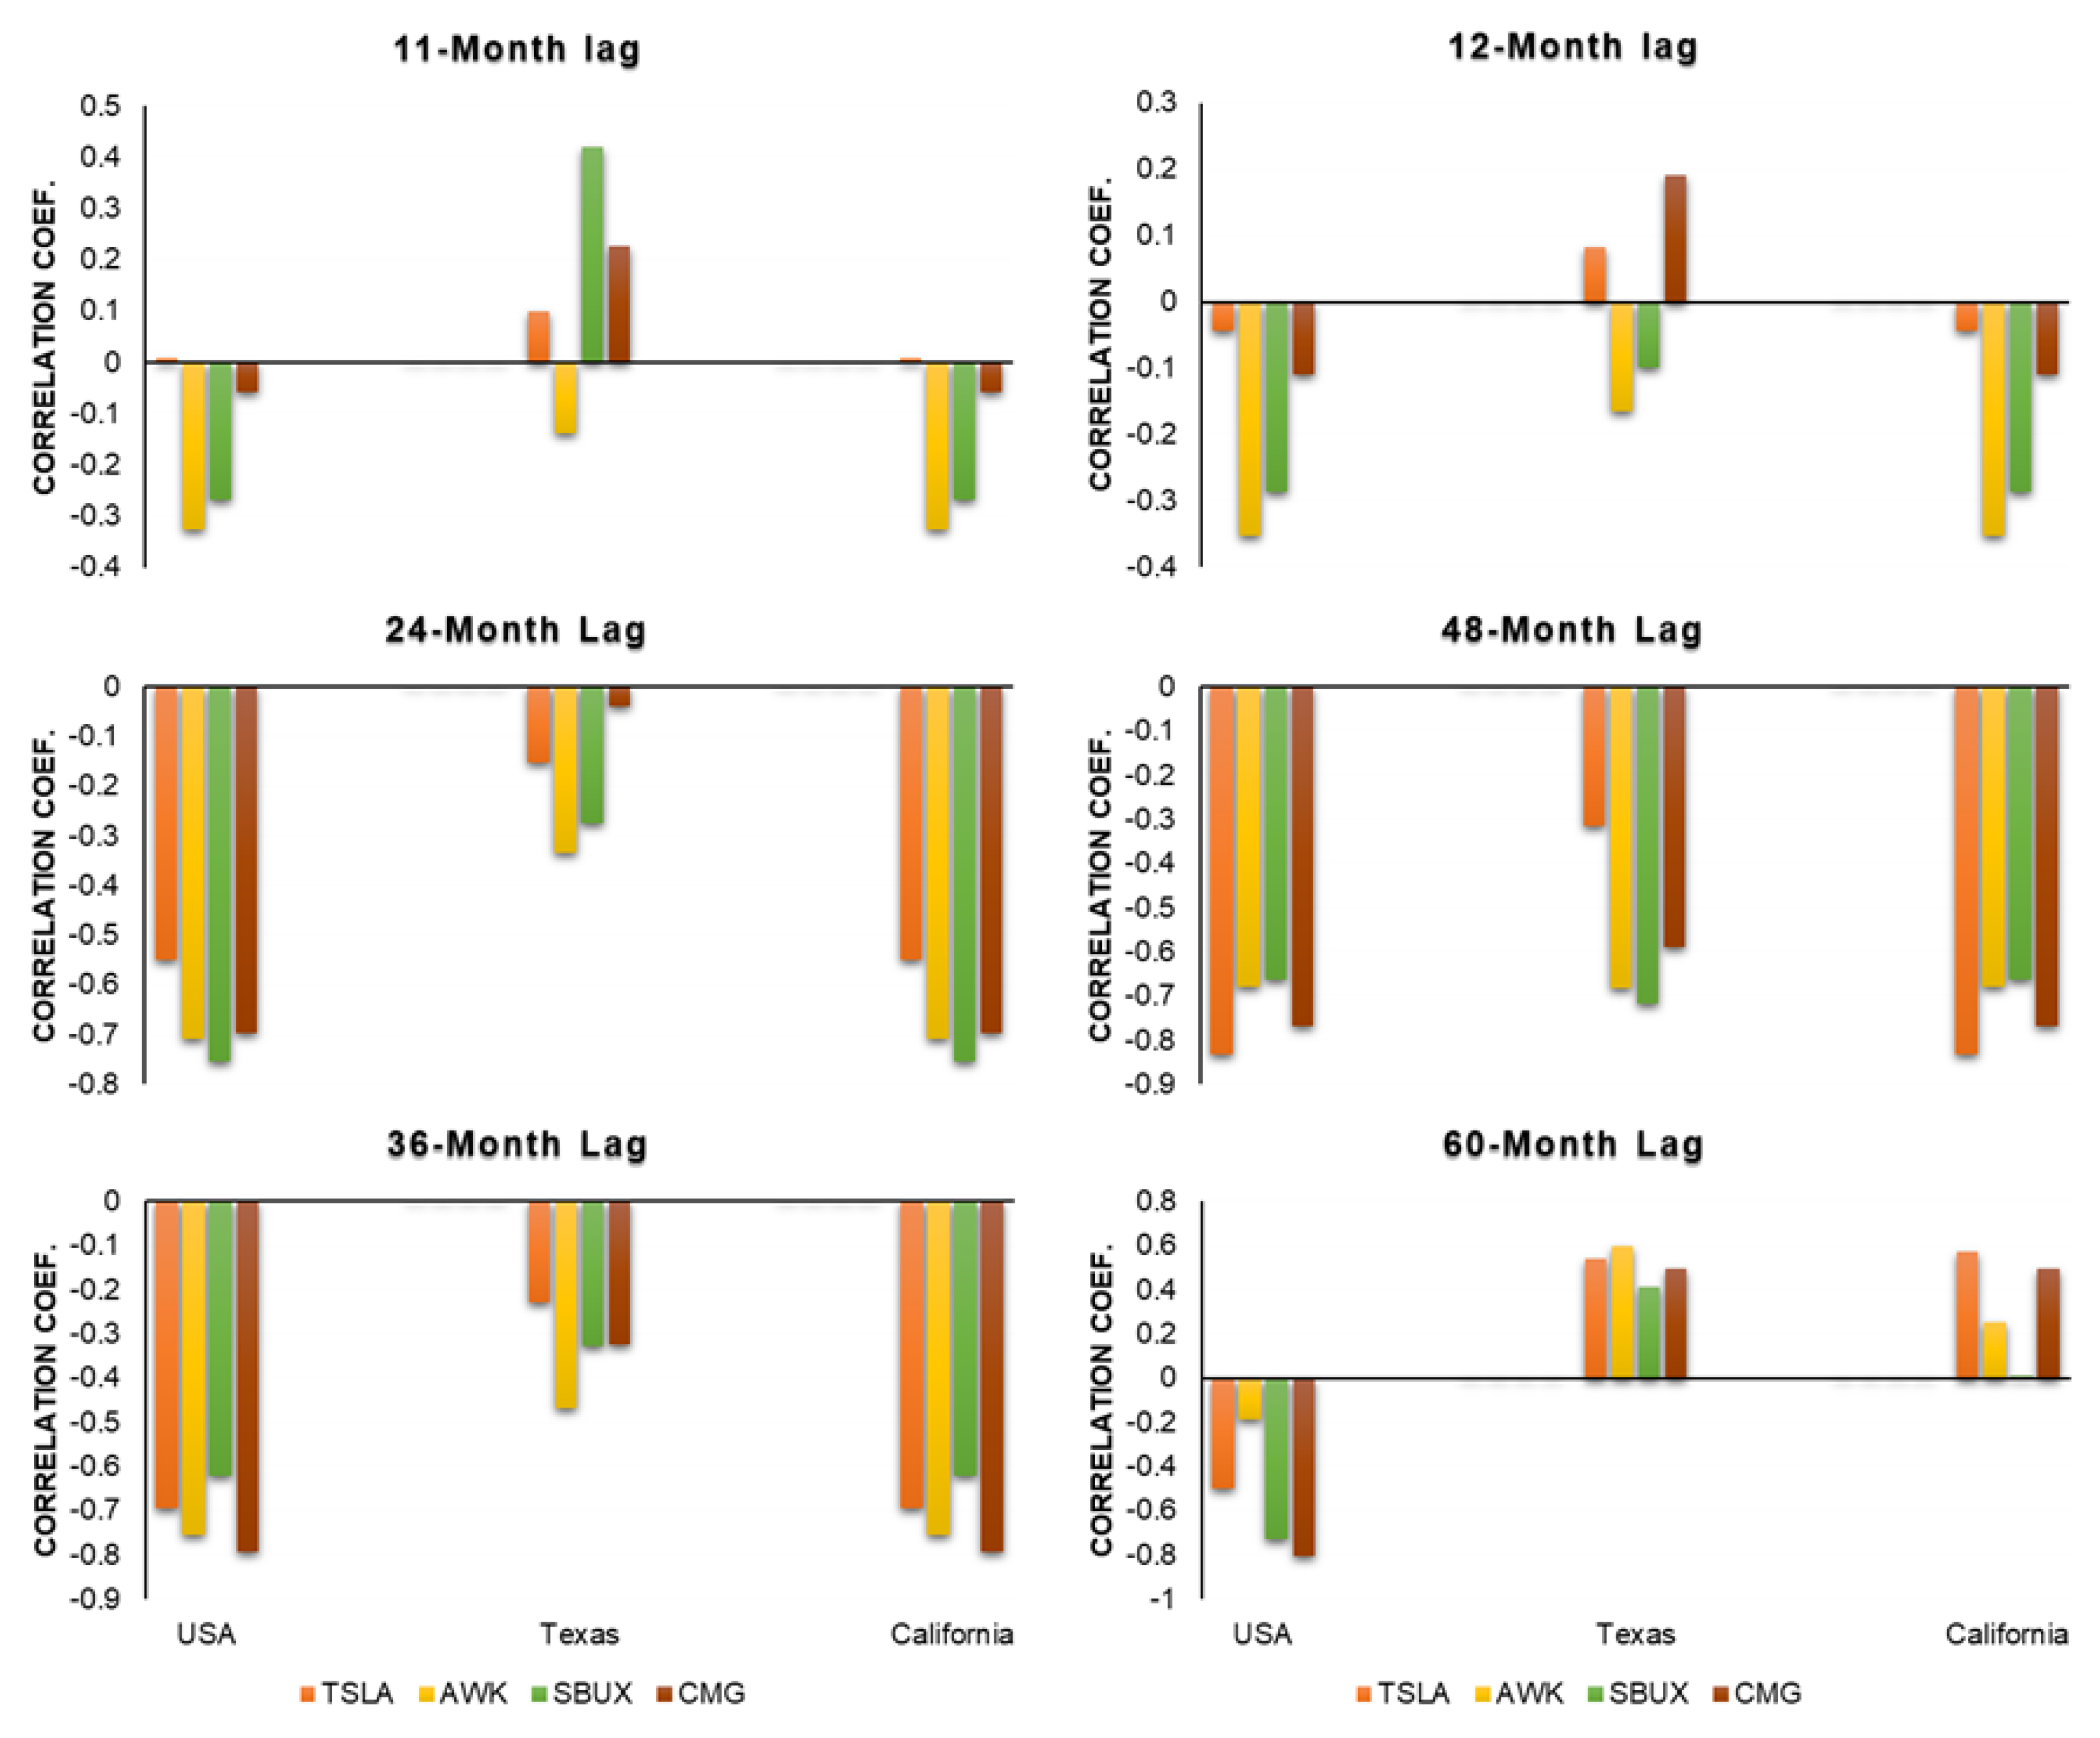
Drought has crucial impacts on socioeconomic sectors. Unlike other natural hazards (e.g., flood), drought has a creepy nature (initiates, propagates, and terminates gradually). Drought has significant impacts on socioeconomic sectors, yet its gradual and prolonged nature makes its effects challenging to quantify, particularly on financial markets. Consequently, its impacts on the stock market have been poorly quantified. This study aimed to analyze the relationship between drought severity, calculated using the Drought Severity and Coverage Index (DSCI), and stock performance in key sectors, including agriculture, water management, industrial manufacturing, and food services. Data for drought and stock market in the U.S. were obtained from the U.S. drought Monitor (USDM) and Nasdaq, respectively. Using Pearson correlation coefficients, we examined the relationship across monthly, quarterly, and yearly periods, considering no lag and other different lag times up to five years to account for delayed effects. The results revealed weak to strong correlations between drought severity and stock indices, varying with drought intensity and sector-specific characteristics. In particular, the agriculture and water management sectors showed strong negative correlations, with peak impacts observed after a 3-year lag. In contrast, industrial and food service sectors displayed weaker correlations due to their global operations and diversified supply chains. The weak correlation can be attributed to the impacts of the COVID-19 pandemic, as drought trends generally align with stock market performance, but this relationship was disrupted in 2019. These findings fill a critical gap in understanding the economic consequences of drought on financial markets and offer valuable information for forecasting stock market trends and helping businesses, investors, and policymakers better understand and address the financial risks associated with droughts.
Keywords:
1. Introduction
2. Methodology
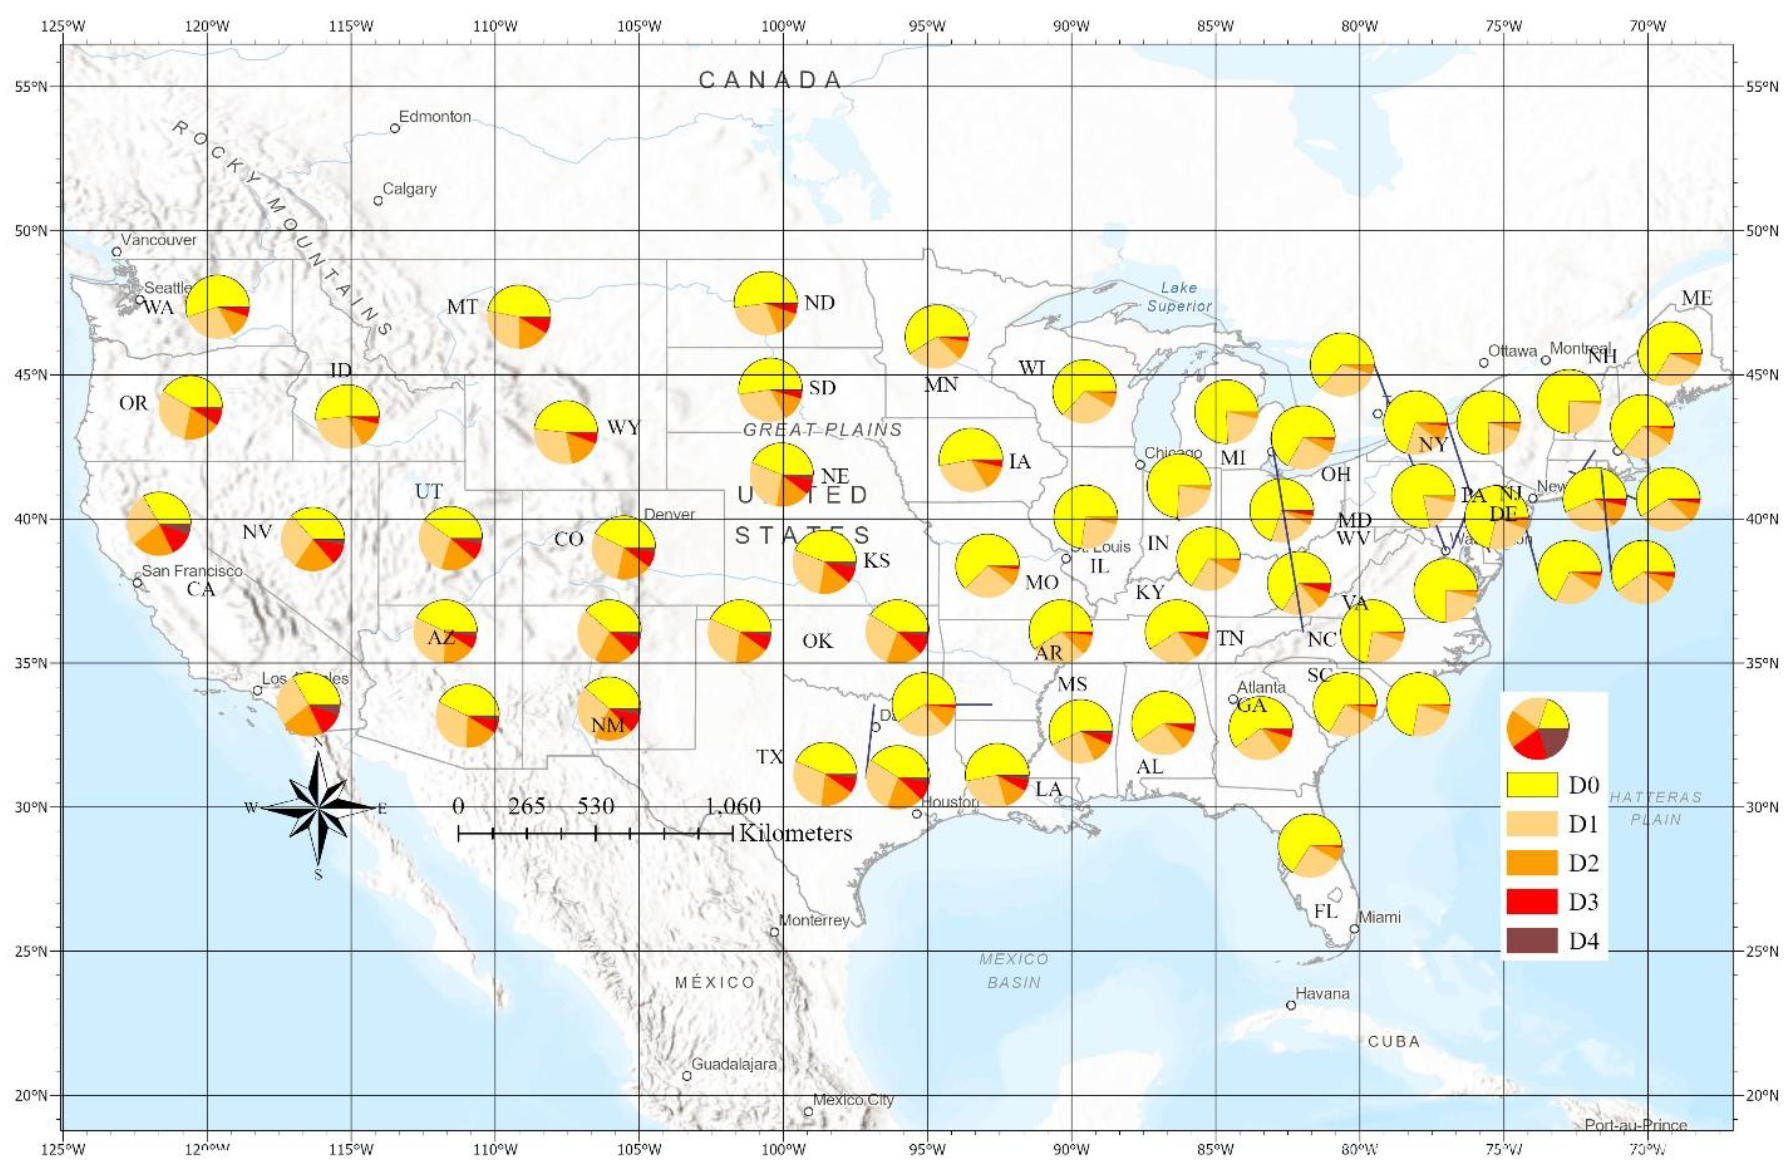
2.1. Study Area
2.2. Data Collection
2.2.1. DSCI
2.2.2. Selected Stocks in Water, Agricultural, and Industrial Sectors
2.3. Correlation Analysis
3. Results
3.1. Trends in Drought Severity and Stock Prices
3.2. Correlation Analysis
3.2.1. Yearly Analysis
3.2.2. Quarterly Analysis
3.2.3. Monthly Analysis
4. Discussion
5. Conclusion
References
- (n.d.). Historical Data. NASDAQ. Retrieved February 1, 2023, from https://www.nasdaq.com/market-activity/stocks.
- Akyuz, F. A. 2017. Drought Severity and Coverage Index. United States Drought Monitor. https://droughtmonitor.unl.edu/About/AbouttheData/DSCI.aspx.
- Bazrkar, M. H., J. Zhang, and X. Chu. 2020. Hydroclimatic aggregate drought index (HADI): A new approach for identification and categorization of drought in cold climate regions. Stochastic Environmental Research and Risk Assessment, 34(11), 1847-1870. [CrossRef]
- Chavas, J. P., Knapp, K. C., & Iqbal, M. (2016). The economic impact of drought: a US case study. Agricultural Economics, 47(3), 271-281.
- Chen, S., Miao, H., & Wang, Y. (2021). The Impact of Climate Change on Stock Market Returns: Evidence from the United States. Journal of Business Ethics, 168(4), 733-753.
- Cheng, X., Wang, Y., & Wu, X. (2022). The effects of drought on stock prices: An industry-specific perspective. Frontiers in Environmental Science, 10, 978404. [CrossRef]
- European Environment Agency. (2023). Stock-taking analysis and outlook of drought policies, planning, and management in EU member states. Retrieved from https://climate-adapt.eea.europa.eu/en/metadata/publications/stock-taking-analysis-and-outlook-of-drought-policies-planning-and-management-in-eu-member-states.
- Hong, H., Li, F. W., & Xu, J. (2019). Climate risks and market efficiency. Journal of Econometrics, 208(1), 265-281. [CrossRef]
- Hoover, J., Johnson, T., & Knudson, C. (2016). Wildfires and drought: perceived impacts on the electric utility industry in the western United States. Natural Hazards, 82(3), 1945-1961.
- Huynh, T. D., Nguyen, T. H., & Truong, C. (2020). Climate risk: The price of drought. Journal of Corporate Finance, 65, 101750. [CrossRef]
- Koomey, J. G., Deyette, J., & Wong, H. (2016). Economic and environmental impacts of the California drought. Environmental Research Letters, 11(7), 075009.
- Li, L., Guan, D., Tao, S., & Su, X. (2018). Effects of drought on US crop yields: a spatial econometric analysis. Environmental Research Letters, 13(5), 054021.
- Li, X., & Su, F. (2023). The Dynamic Effects of COVID-19 and the March 2020 Crash on the Multifractality of NASDAQ Insurance Stock Markets. Fractal and Fractional, 7(1), 91. [CrossRef]
- National Drought Mitigation Center. (2023). Agriculture and drought. Retrieved from https://www.drought.gov/sectors/agriculture.
- National Integrated Drought Information System (NIDIS). (n.d.). Agriculture. U.S. Drought Portal. Retrieved [Jan17, 2025], from https://www.drought.gov/sectors/agriculture.
- National Renewable Energy Laboratory. (2018). The water-energy nexus: impact of drought on electricity supply. Technical Report NREL/TP-6A20-71521.
- Schnepf, R. (2014). Drought in the United States: causes and issues for Congress. Congressional Research Service.
- Seager, R., et al. (2022). California’s exceptional drought conditions in 2021. Environmental Research Letters, 17(5), 0456. [CrossRef]
- U.S. Department of Agriculture. (2023). Potential drought impacts on prices and crop production. Retrieved from https://www.ndsu.edu/agriculture/ag-hub/ag-topics/farm-management/disasters/drought/crops/potential-drought-can-impact-prices-and.


Disclaimer/Publisher’s Note: The statements, opinions and data contained in all publications are solely those of the individual author(s) and contributor(s) and not of MDPI and/or the editor(s). MDPI and/or the editor(s) disclaim responsibility for any injury to people or property resulting from any ideas, methods, instructions or products referred to in the content. |
© 2025 by the authors. Licensee MDPI, Basel, Switzerland. This article is an open access article distributed under the terms and conditions of the Creative Commons Attribution (CC BY) license (http://creativecommons.org/licenses/by/4.0/).


