
Submitted:
07 February 2025
Posted:
08 February 2025
You are already at the latest version
Abstract
This study focuses on the analysis of the dwell time of vessels at the Port of Sines jurisdiction ar-ea, between 2010 and 2023, as an indicator of operational efficiency. A total of 157,515 records of vessel movements were analysed, using statistical modelling in Python. The overall average dwell time calculated for these 13 years was 0.55 days, for a medium number of port calls per year of 2199. This result highlights the operational efficiency of the Port of Sines, although the variability between the different terminals remains significant. The Multipurpose terminal regis-tered the longest dwell time (1.08 days), especially due to the diversity of cargo handled. In con-trast, the Container terminal had an average dwell time of 0.38 days. The anchoring frequency has emerged as critical for optimization. The implementation of the Just-in-Time principles is proposed as a strategy to reduce anchorage times, enhance coordination and collaboration within the operational chain, and mitigate greenhouse gas (GHG) emissions. Notwithstanding the effi-ciency attained by the Port of Sines, this study suggests that further enhancement of its opera-tional efficiency is feasible and desirable. This would contribute to the sustainability agenda and reinforce the port's position in the global trade landscape.
Keywords:
Port Efficiency
; Port Operations
; Dwell Time
; Maritime industry
; Just-in-Time
; Emissions
1. Introduction
Since the 1950s, there has been a considerable expansion in world trade, which currently accounts for above 50% of global economic output [1]. This development has increased the importance of maritime transport, assuming a central role in facilitating international trade in the contemporary global economy. It is therefore vital to improve the knowledge about the role of ports within the transportation system, which function as pivotal hubs that connect maritime routes with inland networks. Ports facilitate domestic and international trade by enabling supply chains and promoting the global connectivity of goods, significantly contributing to economic development.
According to reports from the International Maritime Organization (IMO), maritime transport is responsible for over 80% of world trade [2], which accounts for approximately 2.9% of global greenhouse gas (GHG) emissions [3]. This has led to a growing concern regarding measures that can be implemented to reduce these emissions and enhance energy efficiency. Since the debate of global greenhouse gas emissions reduction in ports arose and gained prominence in 2017 [4], the time that vessels spend at the ports has emerged as a means to reduce emissions. Despite this time being relatively brief compared to time spent at sea, inefficient port operations can cause port congestion, and disrupt intermodal logistics, increasing costs and environmental impacts.
In essence, vessel dwell time signifies the duration a vessel spends at a port, encompassing activities such as cargo handling and routine procedures. That is to say, it denotes the time interval between a vessel’s entry and exit from the port. The occurrence of extended dwell times is frequently attributed to factors such as inadequate coordination among stakeholders, inefficient scheduling, and unanticipated operational challenges. These circumstances can result in protracted berth waiting periods and congestion issues [4,5]. These delays also have implications for the environment, given the increases in fuel consumption and greenhouse gas emissions that they entail [6,7,8].
The United Nations Conference on Trade and Development (UNCTAD) has calculated, using MarineTraffic data, that ships in the 25 largest global economies spend an average of 1.16 days in ports [8]. The present study benchmarks the average vessel dwell time at the Port of Sines against the United Nations Conference on Trade and Development’s estimated figures for ports in the world’s largest economies. This comparison highlights the Port of Sines efficiency and identifies areas for further improvement. By integrating these methods, this study provides a detailed analysis of dwell time within each port zone, offering insights into efficiency levels and pinpointing operational challenges.
One way to improve this performance could be through the implementation of strategies such as Just-in-Time (JIT) arrivals could help to address several challenges associated with port operations. The JIT approach, originally developed during the 1960s and 1970s as a strategy to optimize supply chain management, aims to synchronize production and inventory processes with real-time consumer demand, thereby ensuring that vessels operate at optimal speeds, and arriving at port terminals when facilities and services are fully available [9]. The adoption of JIT practices has been shown to yield substantial environmental and operational benefits. For instance, it enhances environmental sustainability by reducing emissions and fuel consumption, with savings estimated to range from 2% to 20% [9,10,11].
In the implementation of JIT, an essential component is effective communication, as it enables the vessel's commanding officer to receive timely updates on the availability of port services and facilities, facilitating the adjustment of the vessel's speed to align with operational requirements [12]. Additionally, the successful execution of JIT strategies requires coordinated efforts among vessel operators and all port service providers to manage arrival schedules effectively. However, achieving these outcomes requires robust coordination and collaboration among all stakeholders in the maritime operational chain [13].
Despite the fact that a number of studies have been performed in order to assess and enhance port efficiency, including data envelopment analysis (DEA)[14,15], stochastic frontier analysis (SFA)[16,17], ordinary least squares (OLS) regression[18], analytic hierarchy process (AHP)[19,20], and directional distance function (DDF)[21], with a paucity of research focusing on the evaluation of vessel dwell times across distinct operational zones within a port, including their movement through the vessel traffic service (VTS) area from entry to departure [22,23].
In this context, this study analyzed the temporal patterns of vessel movements at the Port of Sines, Portugal, focusing on time management and navigation efficiency. The research aligns with the objectives of the NEXUS Agenda [24], which aims to develop and implement a smart berthing system in this port. The analysis of port efficiency is essential as it enables the optimization of operational performance, maximization of available resource productivity, and enhancement of operations even with limited resources [4].
This work will contribute to the objectives of the NEXUS Agenda, which focuses on the development and implementation of a smart berth solution at the Port of Sines. In particular, this document has the objective of analysing of temporal patterns can significantly enhance port efficiency by identifying and understanding variations in port activities over time. Furthermore, insights derived from temporal data enable the prediction and mitigation of potential bottlenecks, such as extended cargo dwell times or vessel delays, thereby facilitating proactive decision-making. By optimizing operational workflows, this approach supports the reduction of emissions, aligns with sustainability objectives, and improves overall productivity.
2. Materials and Methods
The present study employs bibliometric techniques combined with statistical analysis on vessel dwell times and evaluate efficiency at the Port of Sines. The subsequent section details the methodology presenting the framework to measure temporal efficiency. The following illustration (Figure 1) displays the area and location of each of the studied terminals in detail.
2.1. Bibliometric Analysis
A bibliometric analysis was conducted to establish a robust theorical framework [25], examining extant research on port efficiency and vessel dwell time. This approach assures that the study is connected to existing literature in maritime operations. The bibliometric analysis involved the following steps:
- Research Question Formulation: The bibliometric analysis was framed around the question: "How does vessel dwell time affect port efficiency?" This allowed to guide the selection of relevant publications and keywords.
- Data Collection and Keyword Extraction: The search terms “Port Efficiency”, “Port Operations”, and “Ship Time”, were entered into the Web of Science (WoS) database, resulting in the identification of relevant publications. This query yielded a corpus of research publications central to the topic.
- Keyword Co-Occurrence Analysis: The VOSviewer 1.6.20 software was utilized to analyse keyword co-occurrence, thereby creating a network of terms that frequently appear together. This co-occurrence analysis reveals thematic clusters within the research, highlighting key areas such as port efficiency, emissions, and just-intime arrival.
- Data Organization: The publications that met the inclusion criteria were organized with EndNote software, allowing for systematic tracking of sources.
Initially, were identified a total of 1,676 documents for consideration in this study in the WoS database. After applying the Open Access criteria, 531 articles remained. Further screening was conducted, excluding 55 documents that were not articles, 8 articles that were not written in English, Spanish, or Portuguese, and 454 articles unrelated to the study's theme. This process resulted in 14 articles for inclusion in the study.
To improve the quality and comprehensiveness of the study, additional sources of information were sought. To achieve this, were examined documents from various organizations and articles containing specific data not available in other publications. This supplementary search yielded 18 additional documents deemed. However, after assessing these documents for completeness to the study's requirements, the total was reduced further to 15.
To ensure transparency and replicability in the document selection process, a Preferred Reporting Items for Systematic Reviews and Meta-Analyses (PRISMA diagram) was employed (Figure 2). This diagram provides a detailed overview of the document selection workflow, systematically illustrating the number of articles and documents considered, excluded, and retained at each stage of the study's methodology [26].
Is important to notice that, despite being used in the document and present in the Figure 2, it should be noted that the bibliometric analysis results have been conducted exclusively on scientific articles and that are based on the theme, as these are the only publications that contain all the necessary information for the study.
2.2. Data Collection, Pre-processing, and Statistical Analysis of Vessel Dwell Time
The data concerning vessel movements at the Port of Sines, was provided by the Administration of the Ports of Sines and Algarve, S.A. (APS). The information was retrieved from two databases: the Single Port Window (2010–2021) and the Logistics Single Window (2021–2023). The analysed datasets comprise detailed timestamps and descriptions for every vessel movement, including the events such as entry, berthing, anchoring, and departure. The analysed data movements are presented in Table 1, with the corresponding meaning, enabling a better comprehension of the analysed data.
Figure 3 presents the most recurrent paths that vessels take after entering the port jurisdiction area. Through its analysis we can observe that vessels can follow three different routes, namely: berthing immediately after entering the port, which would be the most efficient way, anchoring in the anchorage areas or leaving the port jurisdiction and waiting to berth. The last two options keep the main engine running, so the emissions are maintained even when it is stationary. In most cases, anchoring and hovering are the result of the port’s inability of receive the vessels at the terminals or the earlier arrival of the vessels.
A pre-processing procedure was applied, in order to ensure the accuracy of the data, according the following steps:
- Data Quality Check: The raw data were examined to remove duplicate records, address missing values, and rectify inconsistencies in timestamps.
- Categorization of Movements: Vessel movements were categorized into specific stages, including entry in port jurisdiction, anchoring, berthing, and exit from the port jurisdiction. This categorization enabled a clear understanding of each manoeuvres duration within the port.
- Data Curating: Movement records were curated to filter out incomplete records and ensure that only verified data points were included in the analysis.
The analysis of vessel dwell time and movement was performed using the Python programming language in a Jupyter Notebook environment, with a focus on descriptive statistics to capture average times across different stages and terminals. This methodological approach yielded a comprehensive perspective on of time efficiency within the port’s jurisdiction, using the scale of the vessels instead of the IMO, since the scale changes between voyages and the IMO keeps the same. The research trailed the following steps:
- Mean Dwell Time Calculation: For each terminal (Liquid Bulk, Petrochemical, Multipurpose, Liquified Natural Gas, and Containers), the average dwell time was calculated based on vessel turnaround data, allowing for a terminal specific comparison of time efficiency.
- Manoeuvre Duration Analysis: Each manoeuvre was analysed to determine its average duration. Furthermore, the data was examined to identify changes in operations from 2010 to 2023.
- Anchoring Analysis: Given the established correlation between anchoring and dwell time, a focused analysis was conducted on anchorage patterns, particularly at the Liquid Bulk Terminal, where the majority of anchoring events occurred.
- Outliers Analysis: The outliers for each terminal were analyzed to assess both their quantitative impact on the results and their overall frequency.
3. Results and Discussion
3.1. Bibliometric Analysis Results
As we can observe through Figure 4, that illustrates the evolution of publications over the years, is evident that the thematic has gained expression since 2018, which, along with 2023, was the year with the most publications. Prior to this, the total number of publications was only four.
Figure 5 displays the number of citations received by each publication retrieved. This enables the identification of the most relevant articles based on their citation frequency. In this instance, the number of citations was retrieved from Google Scholar, as it was the sole database that contained all the articles. The subsequent analysis of the figure reveals that over half of the articles have received more than 20 citations, with a select few having amassed over 100 citations. The article with the highest number of citations is Data Envelopment Analysis (DEA) and Improving Container Port Efficiency, by Cullinane and Wang, with 170 citations.
As illustrated in Figure 6, a comprehensive visualization of the global distribution of publications across continents is provided, offering valuable insight into the research activity of different regions concerning this specific area. The numbers are based on the country where the institution affiliated with the corresponding author is located. There is at least one publication on each of the populated continents. Nevertheless, Asia and Europe prevail in terms of publications, with eight and nine, publications respectively.
The global distribution of publications across continents enabled an analysis of the regions most invested in this type of research. It is noteworthy that the continents with higher publication volumes tend to be home to larger ports, which are more likely to encounter greater challenges related to port efficiency.
In the VOSviewer analysis a deep examination of the data reveals a correlation between concepts such as "port efficiency" and "emissions," thereby emphasizing the pivotal role that operational enhancements play in reducing the ecological impact of port activities. By optimizing processes, ports can achieve greater energy efficiency, minimize waste, and significantly reduce their carbon footprint, thereby demonstrating the intrinsic linkage between sustainability and efficiency in modern logistics and maritime operations.
The keyword cloud generated by VOSviewer highlights the increasing focus on sustainability in port operations (Figure 7).
The VOSviewer-generated keyword cloud further corroborates the relevance of this study by highlighting key themes such as port efficiency, port-related emissions, and just-in-time operations. These findings underscore the investigation’s relevance and its timely nature.
Based on the documents included in this study, dwell time, a crucial element that directly affects port operations and, in turn, port competitiveness, is intimately related to port efficiency. Cruz et al. (2013) [14] point out that vessel turnaround time, that is fundamentally connected to dwell time, has a significant impact on maritime competitiveness. This assurance highlights the importance of time-based performance in port operations.
The possibility of virtual arrival (VA) and port call optimization (PCO) in reducing fuel consumption and CO2 emissions is investigated by Merkel et al. (2022) [21]. In a similar way, Alessandrini et al. (2019) [18] suggest utilizing historical AIS and LRIT vessel tracking data to improve resource allocation and ETA predictions while lowering vessel arrival uncertainties. In this context and, according to Aroca et al. (2020) [19] and Gonzalez et al. (2020) [2], Just-in-Time (JIT) operations are intended to further align vessel schedules with port operations, which will lower costs and emissions and, consequently, improve efficiency. These tactics are in line with approaches put out by Cullinane and Wang (2006) [9], who affirm that in order to decrease operational bottlenecks, it is important to measure and optimize time-sensitive operations. This method reinforces the value of time measures for assessing and enhancing port performance and supports studies on dwell time.
Through the assessment of the time efficiency of ship movements in marine ports, Feng et al. (2021) [17] contribute, highlighting the importance of time-sensitive procedures to identify delays and inefficiencies.
The revised literature on port efficiency metrics, advanced technologies, and data-driven approaches offers a solid basis and aligns with the conducted bibliometric analysis, highlighting the interconnected nature of time optimization and overall port efficiency.
The various analyses conducted were fundamental to this study. Specifically, they facilitated the inclusion of recent publications containing the most up-to-date information available. The credibility of the study was enhanced by the incorporation of several articles that have attained a high standing within the scientific community.
3.2. Statistical Analysis of Vessel Dwell Time Results
In this study, a total of 157,515 records were analysed, representing all the movements of the 29 567 vessels which entered into the port of Sines between 2010 and 2023. The total number of vessels that entered in each terminal is shown in Figure 8. From the analysis it can be seen that the Container Terminal is the one that has handled more vessels, with 13 553 vessels berthing at this terminal and the Liquified Natural Gas (LNG) Terminal is the one that handled less number of vessels, with 649 port calls.
Figure 9 shows the total time spent on each manoeuvre during the considered period. In this case, the years 2009 and 2024, have been included due to the fact that some vessels enter the port in 2009 and 2023, and leave in 2010 and 2024.
When analysing the following figure, it can be seen that manoeuvres such as berthing and anchoring have constant execution times between 2010 and 2023 and together account for a considerable part of the total dwell time (> 90%). In this case, the duration of anchoring manoeuvres has increased since 2016, which may have been a result of the developments in the Containers terminal. This is the manoeuvre where the evolution is more noticeable. The manoeuvre Completion of Mooring Reinforcement, which represents a specific action to enhance post-docking stability, was recorded only six times during the analyzed period. Due to its low frequency in relation to the total volume of the database, this manoeuvre was excluded from subsequent analyses.
Table 2 illustrates the different time metrics in each terminal and in the Port of Sines as a whole. More specifically, this table presents the percentage of vessels anchoring, the average times of anchoring, berthing and dwell time in each location.
Over the 13 years analysed, the Port of Sines had an average dwell time of 0.55 days, including 0.35 days of berthing time, which includes the loading and unloading cargo. Despite the overall efficiency of the operation, vessels spend an average of 0.18 days at anchor, which represents 33% of their total time in the port's jurisdiction. This suggests that one third of the time vessels spend in the port is spent at anchor.
The Liquid Bulk Terminal stands out with 60% of its vessels at anchor, the highest percentage among the port's terminals. However, the average anchorage time is 0.19 days, which is close to the port average. The terminal's total dwell time is 0.59 days, of which 0.38 days are spent on berthing manoeuvres. These results seem to indicate that, despite frequent anchoring, the terminal maintains operational efficiency by balancing high anchorage rates with efficient procedures.
The Multipurpose Terminal has the longest average dwell and berthing times of 1.08 days and 0.69 days respectively. Although only 20% of its vessels anchor, those that do spend an average of 0.35 days at anchor, the longest among of all terminals. These results appear to highlight the challenges the terminal faces in managing the different types of cargo, which have a significant impact on its overall efficiency.
The Container Terminal is the most time-efficient in the Port of Sines, with a total dwell time of only 0.38 days. Berthing operations are completed in an average of 0.24 days, reflecting the terminal’s high efficiency in cargo handling. Only 18% of vessels require anchorage, and those that do stay an average of 0.12 days (around 3 hours). These metrics underscore the terminal's operational excellence and its ability to minimise delays.
The LNG Terminal handles the fewest vessels of any of the port’s terminals, contributing to its excellent time metrics. Only 11% of vessels anchor, and while anchorages are rare, those that do stay longer than at other terminals. The terminal’s dwell time averages 0.60 days, with berthing accounting for 0.38 days, more than half of the total. Despite the low anchorage frequency, the long duration of berthing, due to the fact that the loading and unloading of this type of cargo takes a considerable amount of time to load and unload, affects the overall time efficiency of the terminal.
At the Petrochemical Terminal, 46% of the vessels are anchored, the second highest rate among the terminals. These vessels spend an average of 0.18 days at anchor, in line with the port average. The terminal’s total dwell time is 0.55 days, of which 0.35 days are spent berthing. Although its performance is in line with port averages, the reliance on anchorage for almost half of the vessels highlights potential areas for improvement to increase overall efficiency.
Throughout the port, berthing remains the most time-consuming operation as it includes both cargo handling and vessel mooring. While anchoring times have increased since 2021, there is some variability with some vessels anchoring for short periods (e.g. 10 minutes) and others for longer periods (e.g. 2 days). This variability indicates ongoing challenges in time management and possibly highlights the need for targeted optimisation in some of the terminals.
The following table (Table 3) presents the port metrics without consideration of the outliers, in order to see the impact that these cases have in the results. In a more specific way, the table presents the maximum operation time for each of the terminals, average dwell time without these vessels and the percentage and number of outliers in each of the terminals in specific, and in total. It is important to note that, in this study, the outliers were automatically sorted by the Tukey's Fences-method [27,28].
As can be observed in Table 3, the inclusion of outliers significantly decreases the values of vessel dwell times across terminals. In total, were identified 2884 outliers and several of them can be attributed to vessel-specific issues, in particular vessels requiring major repairs. The reasons for the extended time taken by the outliers include delayed operations, inspections, repairs, vessels conducting work in the port area, and prolonged vessel clearance processes due to adverse weather conditions.
In terms of the outlier’s vessels classification, and considering all the outliers, the majority are Oil Tankers, that sometimes go to more than one terminal during its stay at the port and Containers Vessels, that are the vessels that enter more frequently the port. On the contrary, the vessels with a dwell time superior to ten days, don´t have a dominant type, being, for example, Livestock carriers, Bulk Carriers, General Cargo Carriers and Container Ships.
Like it was said before, when the outliers are not considered, we can notice a significant reduction in dwell time across the terminals, especially at the Multipurpose terminal, which, when the outliers are not considered, is no longer the terminal with the highest dwell time. The Containers terminal also experienced a decrease in dwell time, strengthening the position of most efficient terminal.
In terms of outlier percentages, only the Multipurpose terminal presents an outlier rate exceeding 10%, with 26%. This finding shows the impact that the outliers have on dwell time at this terminal. The remaining terminals results align more closely with the expected operational performance, without any unexpected deviations.
In a port-wide level, the exclusion of the outliers reduces the average dwell time at the port by 0.10 days, making the dwell time of 0.45 days. Overall, 10% of the vessels entering the port are classified as outliers, a percentage that can be considered as a satisfactory metric for operational analysis.
The table below (Table 4) provides a detailed comparison of port performance worldwide, highlighting the best and worst performing ports in various cargo categories within the top 25 economies. This comparison serves as a benchmark to evaluate the Port of Sines against some of the largest and most important ports in the world. It also illustrates the disparity in the volume of port calls between Sines and these larger ports, highlighting why the efficiency of Sines cannot be directly compared with that of its international counterparts. Is important to notice that, in green are the countries that have the best metrics in each category and in red the worst.
From a global perspective, the Port of Sines demonstrates an impressive average dwell time of 0.55 days. This performance is notably lower than the global average of 1.16 days reported in 2020 by UNCTAD for the world’s 25 largest economies. However, it is important to contextualize these findings by considering the characteristics of the port. Sines is a medium-sized facility that handles a relatively low volume of vessel traffic compared to major international ports. These factors contribute significantly to its favourable time metrics. Nonetheless, the results validate the port's operational excellence while highlighting the importance of placing its performance in the broader context of global port operations.
In this case, we may imply, through the analysis of the obtained results, that the anchoring rates would benefit from the implementation of a Just-in-Time arrivals in the Port of Sines. The anchorage reduction and JIT strategies align with the maritime industry's decarbonisation objectives, addressing both operational and environmental needs. By improving anchoring and berthing processes, the Port of Sines can contribute to the broader goal of sustainable port management, making it a model for medium-sized ports aiming to balance growth with environmental responsibility. The positive impact of JIT can be confirmed by the successful implementation at Tanger-Med port, which highlights its significant positive influence on port operations, shipowners, and the environment, by ensuring efficient and timely docking [29].
Nevertheless, it is crucial to recognize that achieving a successful implementation of Just-in-Time (JIT) is inherently challenging. This is primarily due to the necessity for full commitment from all stakeholders involved, including management, employees, and suppliers. Additionally, effective JIT implementation requires the seamless sharing of critical information, which can be difficult to attain due to organizational barriers, confidentiality concerns, and the complexity of coordinating across multiple parties. These factors underscore the complexity of JIT adoption and the need for a well-coordinated, collaborative effort among all involved entities to overcome the inherent challenges [20].
4. Conclusions
The analysis of the obtained results for each of the terminals indicates that there is a big difference between them. This displays that the different concessionaires that manage each of the facilities and more importantly, the type of cargo that is handled, have a great impact on terminal dwell times.
Possibly the main problem associated with the Port of Sines is the anchoring frequency. Despite not handling a huge number of vessels like other ports around the world, the port still has a significant number of vessels that anchor. However, some of the vessels, only stay in the anchorage area for a short time (< 3 hours).
The navigation patterns in the Port of Sines between, 2010 and 2023, show that Sines possesses a good dwell time (0.55) when compared to the world top 25 economies (1.16). Despite this, is important to note that the port handles much fewer port calls than the ports considered in the largest economies studied. Taking this into account, it is not viable to affirm that the Port of Sines is more efficient than these ports, but it is safe to say that it is an efficient port. This efficiency could even be improved if the port managed to minimise the anchoring frequency, that occurs 38% of the time a vessel enters the port.
Although the results of the study were satisfactory, the analysis process encountered significant obstacles due to the lack of uniformity between the two databases. In particular, differences in terminology between the datasets caused substantial difficulties in interpreting, comparing and integrating the information. In addition, the presence of incomplete data posed a challenge, which was resolved by removing this information, as it could distort the results or lead to incomplete conclusions. Overall, these obstacles highlight the need for greater consistency and improvements in data collection and organization. Resolving these issues could improve the effectiveness of these studies by making them regular in the port, in order to understand the evolution of the efficiency of operations.
For future work, we propose the development of parametric prediction models to analyse vessel time and movement, with a specific focus on incorporating port manoeuvres. This comprehensive approach will integrate a comparative study between Estimated Time of Arrival (ETA) and Actual Time of Arrival (ATA). Such investigations would offer valuable insights into the adaptability and scalability of JIT practices. Alternatively, it could also focus on refining the models by adjusting key parameters, incorporating advanced optimization techniques, and expanding the range of evaluated metrics. This would enhance the accuracy and robustness of predictive tools, enabling more efficient port operations. Furthermore, the research could include a detailed quantitative analysis of delays and their root causes would provide deeper insights into operational inefficiencies, paving the way for targeted improvements. By pursuing these directions, these studies can contribute to the development of more reliable predictive models, improved port management practices, and a better understanding of the interplay between operational and environmental factors in maritime logistics.
The implementation of Just-in-Time could be a key figure in reducing anchoring, since it allows (and requires) a synchronisation between all the stakeholders, avoiding the arrival of vessels at a time when the services and facilities are not fully available. If successful, it would be possible to improve the terminal time, especially in the Liquid Bulk and Petrochemical terminals, where the anchoring frequency is higher. This implementation would also be essential to achieve more sustainable and productive vessel operations, reducing the generated emissions and the fuel consumption.
Author Contributions
Conceptualization, T.B., L.R. and F.B.; methodology, T.B., L.R., F.B. and C.I.; software, L.R. and F.B.; validation, T.B., L.R. and F.B.; formal analysis, L.R. and F.B.; investigation, T.B., L.R. and F.B.; data curation, S.M.; writing—original draft preparation, T.B., L.R., F.B. and C.I.; writing—review and editing, T.B., L.R. and F.B.; supervision, T.B.; project administration, T.B.; funding acquisition, T.B. All authors have read and agreed to the published version of the manuscript.
Funding
Content produced within the scope of the Agenda “NEXUS - Pacto de Inovação – Transição Verde e Digital para Transportes, Logística e Mobilidade”, financed by the Portuguese Recovery and Resilience Plan (PRR), with no. C645112083-00000059 (investment project no. 53).
Acknowledgments
We express our sincere gratitude to the Administração dos Portos de Sines e do Algarve (APS) for providing access to the necessary data and to the Agenda NEXUS for enabling our participation in this significant project.
Conflicts of Interest
The authors declare no conflicts of interest.
References
- Rodrigue, J.P.; Notteboom, T. Maritime Shipping and International Trade. In Port Economics, Management and Policy; Rodrigue, J.P., Notteboom, T., Eds.; Routledge: New York, NY, USA, 2021; Chapter 1.1. Available online: https://porteconomicsmanagement.org/pemp/contents/part1/maritime-shipping-and-international-trade/ (accessed on 28 May 2024).
- Gonzalez, O.; Koivisto, H.; Mustonen, J.; Keinänen-Toivola, M. Digitalization in just-in-time approach as a sustainable solution for maritime logistics in the Baltic Sea Region. Sustainability 2021, 13, 1173. [CrossRef]
- Shao, T.; Wu, D.; Ye, Y.; Li, H.; Dong, G.; Liu, G.; Zheng, P. A Novel Virtual Arrival Optimization Method for Traffic Organization Scenarios. Sustainability 2024, 16(1), 403. [CrossRef]
- Pallis, A.; Rodrigue, J. P. Port Efficiency. In Port Economics, Management and Policy, 1st ed.; Routledge: London, England, 2022; pp 424-437.
- Son, J.; Kim, D.-H.; Yun, S.-W.; Kim, H.-J.; Kim, S. The Development of Regional Vessel Traffic Congestion Forecasts Using Hybrid Data from an Automatic Identification System and a Port Management Information System. J. Mar. Sci. Eng. 2022, 10, 1956. [CrossRef]
- Kim, S.; Eom, G. Ship Carbon Intensity Indicator Assessment via Just-in-Time Arrival Algorithm Based on Real-Time Data: Case Study of Pusan New International Port. Sustainability 2023, 15, 13875. [CrossRef]
- Neagoe, M.; Hvolby, H.-H.; Turner, P. Why are we still queuing? Exploring landside congestion factors in Australian bulk cargo port terminals. Marit. Transp. Res. 2021, 2, 100036. [CrossRef]
- UNCTAD. Review of Maritime Transport 2019. 2020. Available online: https://unctad.org/system/files/official- document/rmt2019ch3_en.pdf (accessed on 28/05/2024.).
- Aroca, J.; Maldonado, J.; Clari, G.; García, N.; Calabria, L.; Lara, J. Enabling a green just-in-time navigation through stakeholder collaboration. Eur. Transp. Res. 2020, 12, 22. [CrossRef]
- GEF-UNDP-IMO GloMEEP Project and the GIA. 2020. Just-in-time Arrival Guide – Barriers and Potential Solutions. Available online: https://portcalloptimization.org/images/JIT%20Guide%20Final.pdf (accessed on 28/03/2024.).
- Merkel, A.; Kalantari, J.; Mubder, A. Port call optimization and CO2-emissions savings– Estimating feasible potential in tramp shipping. Marit. Transp. Res. 2022, 3, 100054. [CrossRef]
- International Maritime Organization. Just-in-Time Arrival Guide. International Maritime Organization: London, UK, 2019. Available online: https://portcalloptimization.org/images/JIT%20Guide%20Final.pdf (accessed on 26 May 2024).
- Nguyen, S.; Leman, A.; Xiao, Z.; Fu, X.; Zhang, X.; Wei, X.; Zhang, W.; Li, N. Blockchain-Powered Incentive System for JIT Arrival Operations and Decarbonization in Maritime Shipping. Sustainability 2023, 15, 15686. [CrossRef]
- Cullinane, K.; Wang, T. Data Envelopment Analysis (DEA) and Improving Container Port Efficiency. Res. Transp. Econ. 2006, 17, 1. [CrossRef]
- Krmac, E., & Mansouri Kaleibar, M. A comprehensive review of data envelopment analysis (DEA) methodology in port efficiency evaluation. Marit. Econ. & Logis., 2023, 25, 3. [CrossRef]
- Gavalas, D. Shipping Firms' Efficiency Evaluation through Stochastic Frontier Analysis. Mod. Econ. 2016, 7, 8. [CrossRef]
- Kammoun, R. The Technical Efficiency of Tunisian Ports: Comparing Data Envelopment Analysis and Stochastic Frontier Analysis Scores. Logist. Sustain. Transp. 2018, 9, 2. [CrossRef]
- Soleymani, A.; Sharifi, S.M.H.; Edalat, P.; Sharifi, S.M.M.; Zadeh, S.K. Linear Modeling of Marine Vessels Fuel Consumption for Ration of Subsidized Fuel. IJMT 2018, 10. [CrossRef]
- Rosa Pires da Cruz, M., Ferreira, J., & Garrido Azevedo, S. Key factors of seaport competitiveness based on the stakeholder perspective: An Analytic Hierarchy Process (AHP) model. Marit. Econ. & Logis., 2013, 15, 4. [CrossRef]
- Tseng, P.-H.; Cullinane, K. Key criteria influencing the choice of Arctic shipping: a fuzzy analytic hierarchy process model. Marit. Policy Manag. 2018, 45, 4. [CrossRef]
- Liao, Y.-H.; Lee, H.-S. Using a Directional Distance Function to Measure the Environmental Efficiency of International Liner Shipping Companies and Assess Regulatory Impact. Sustainability 2023, 15, 3821. [CrossRef]
- Feng, M.; Shaw, S.-L.; Peng, G.; Fang, Z. Time efficiency assessment of ship movements in maritime ports: A case study of two ports based on AIS data. J. Transp. Geogr. 2020, 86, 102741. [CrossRef]
- Alessandrini, A.; Mazzarella, F.; Vespe, M. Estimated Time of Arrival Using Historical Vessel Tracking Data. IEEE Trans. Intell. Transp. Syst. 2019, 20, 1. [CrossRef]
- NEXUS. 2025. NEXUS - Innovation Agenda for the Port, Multimodal and Transport Sector. Available online: https://nexuslab.pt/ (accessed on 28 January 2025).
- Öztürk, O. Bibliometric Review of Resource Dependence Theory Literature: An Overview. Manage. Rev. Q. 2021, 71, 3. [CrossRef]
- UNC Library. 2025. PRISMA: Systematic Reviews & Meta-Analyses. Available online: https://guides.lib.unc.edu/prisma (accessed on 28 January 2025).
- Hoaglin, D. C.; Iglewicz, B.; Tukey, J. W. Performance of Some Resistant Rules for Outlier Labeling. J. Am. Stat. Assoc. 1986, 81, 396. [CrossRef]
- Koren, O.; Koren, M.; Peretz, O. A Procedure for Anomaly Detection and Analysis. Eng. Appl. Artif. Intell. 2023, 117, 105503. [CrossRef]
- Ship Technology Global. 2021. Digitally controlling port arrivals: Timing is everything. Available online: https://ship.nridigital.com/ship_sep21/digital_automated_port_arrivals (accessed on 03 January 2025).
Figure 1.
Port of Sines terminal’s location.
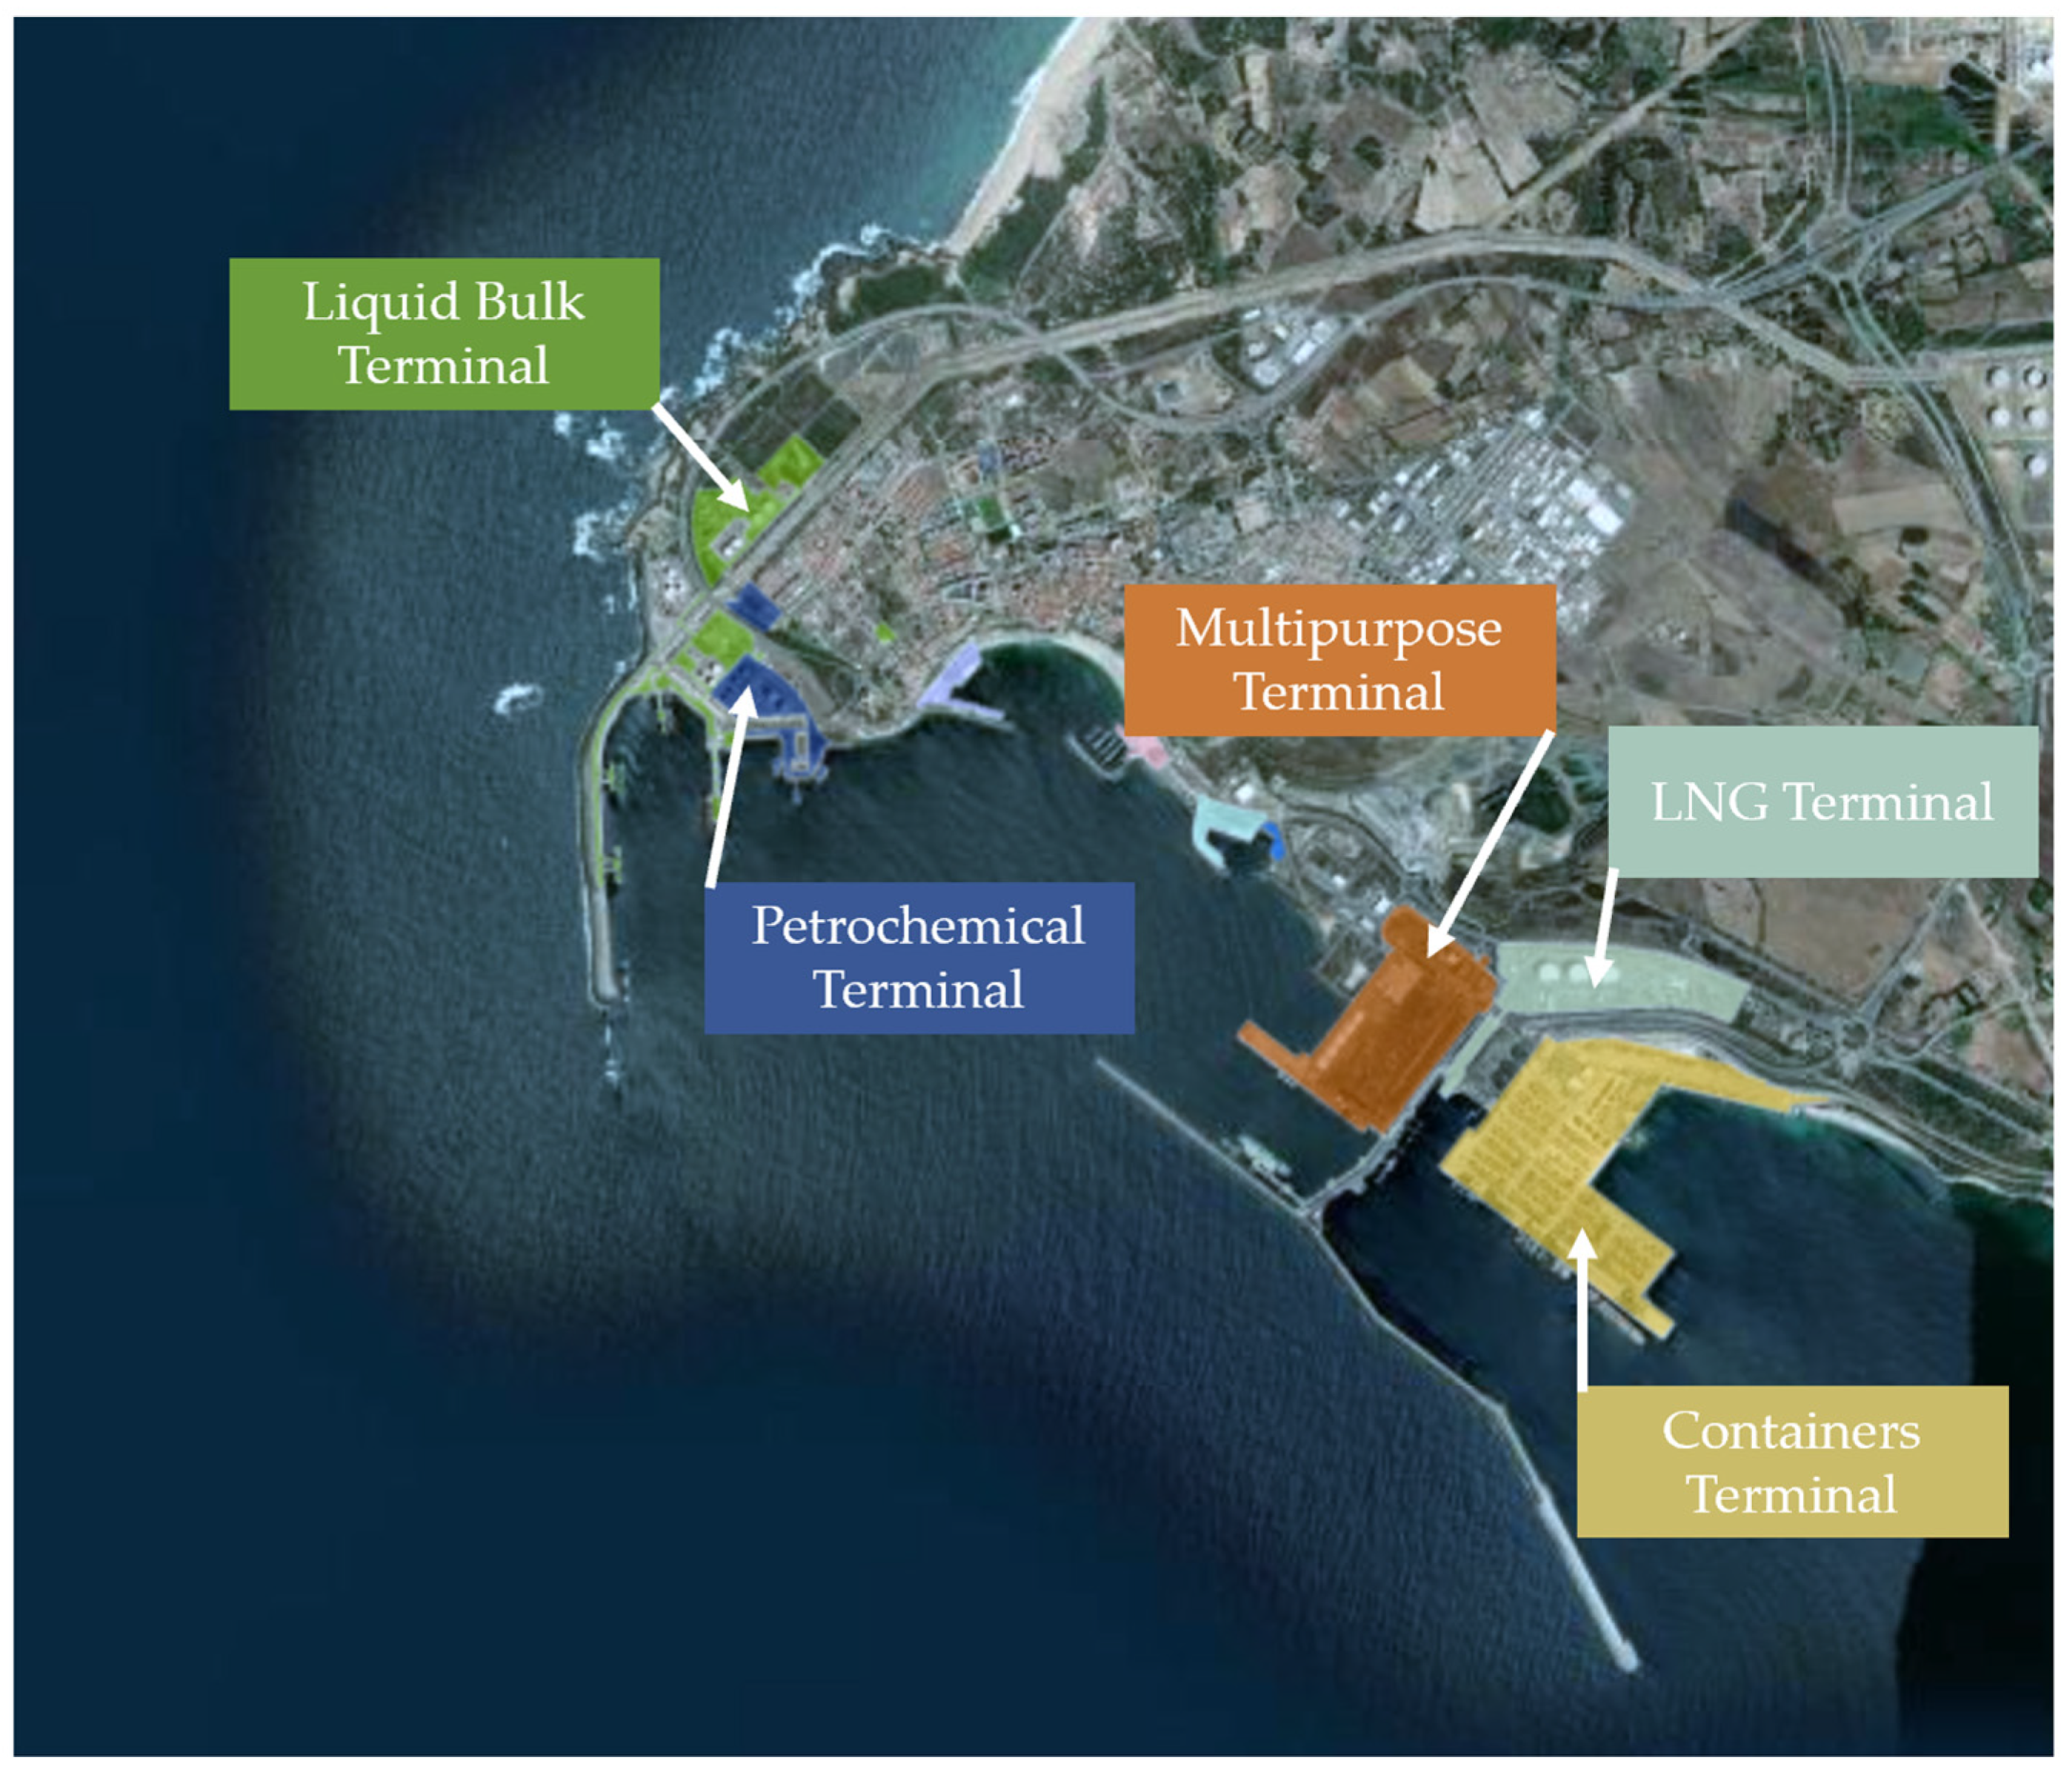
Figure 2.
PRISMA flow diagram.
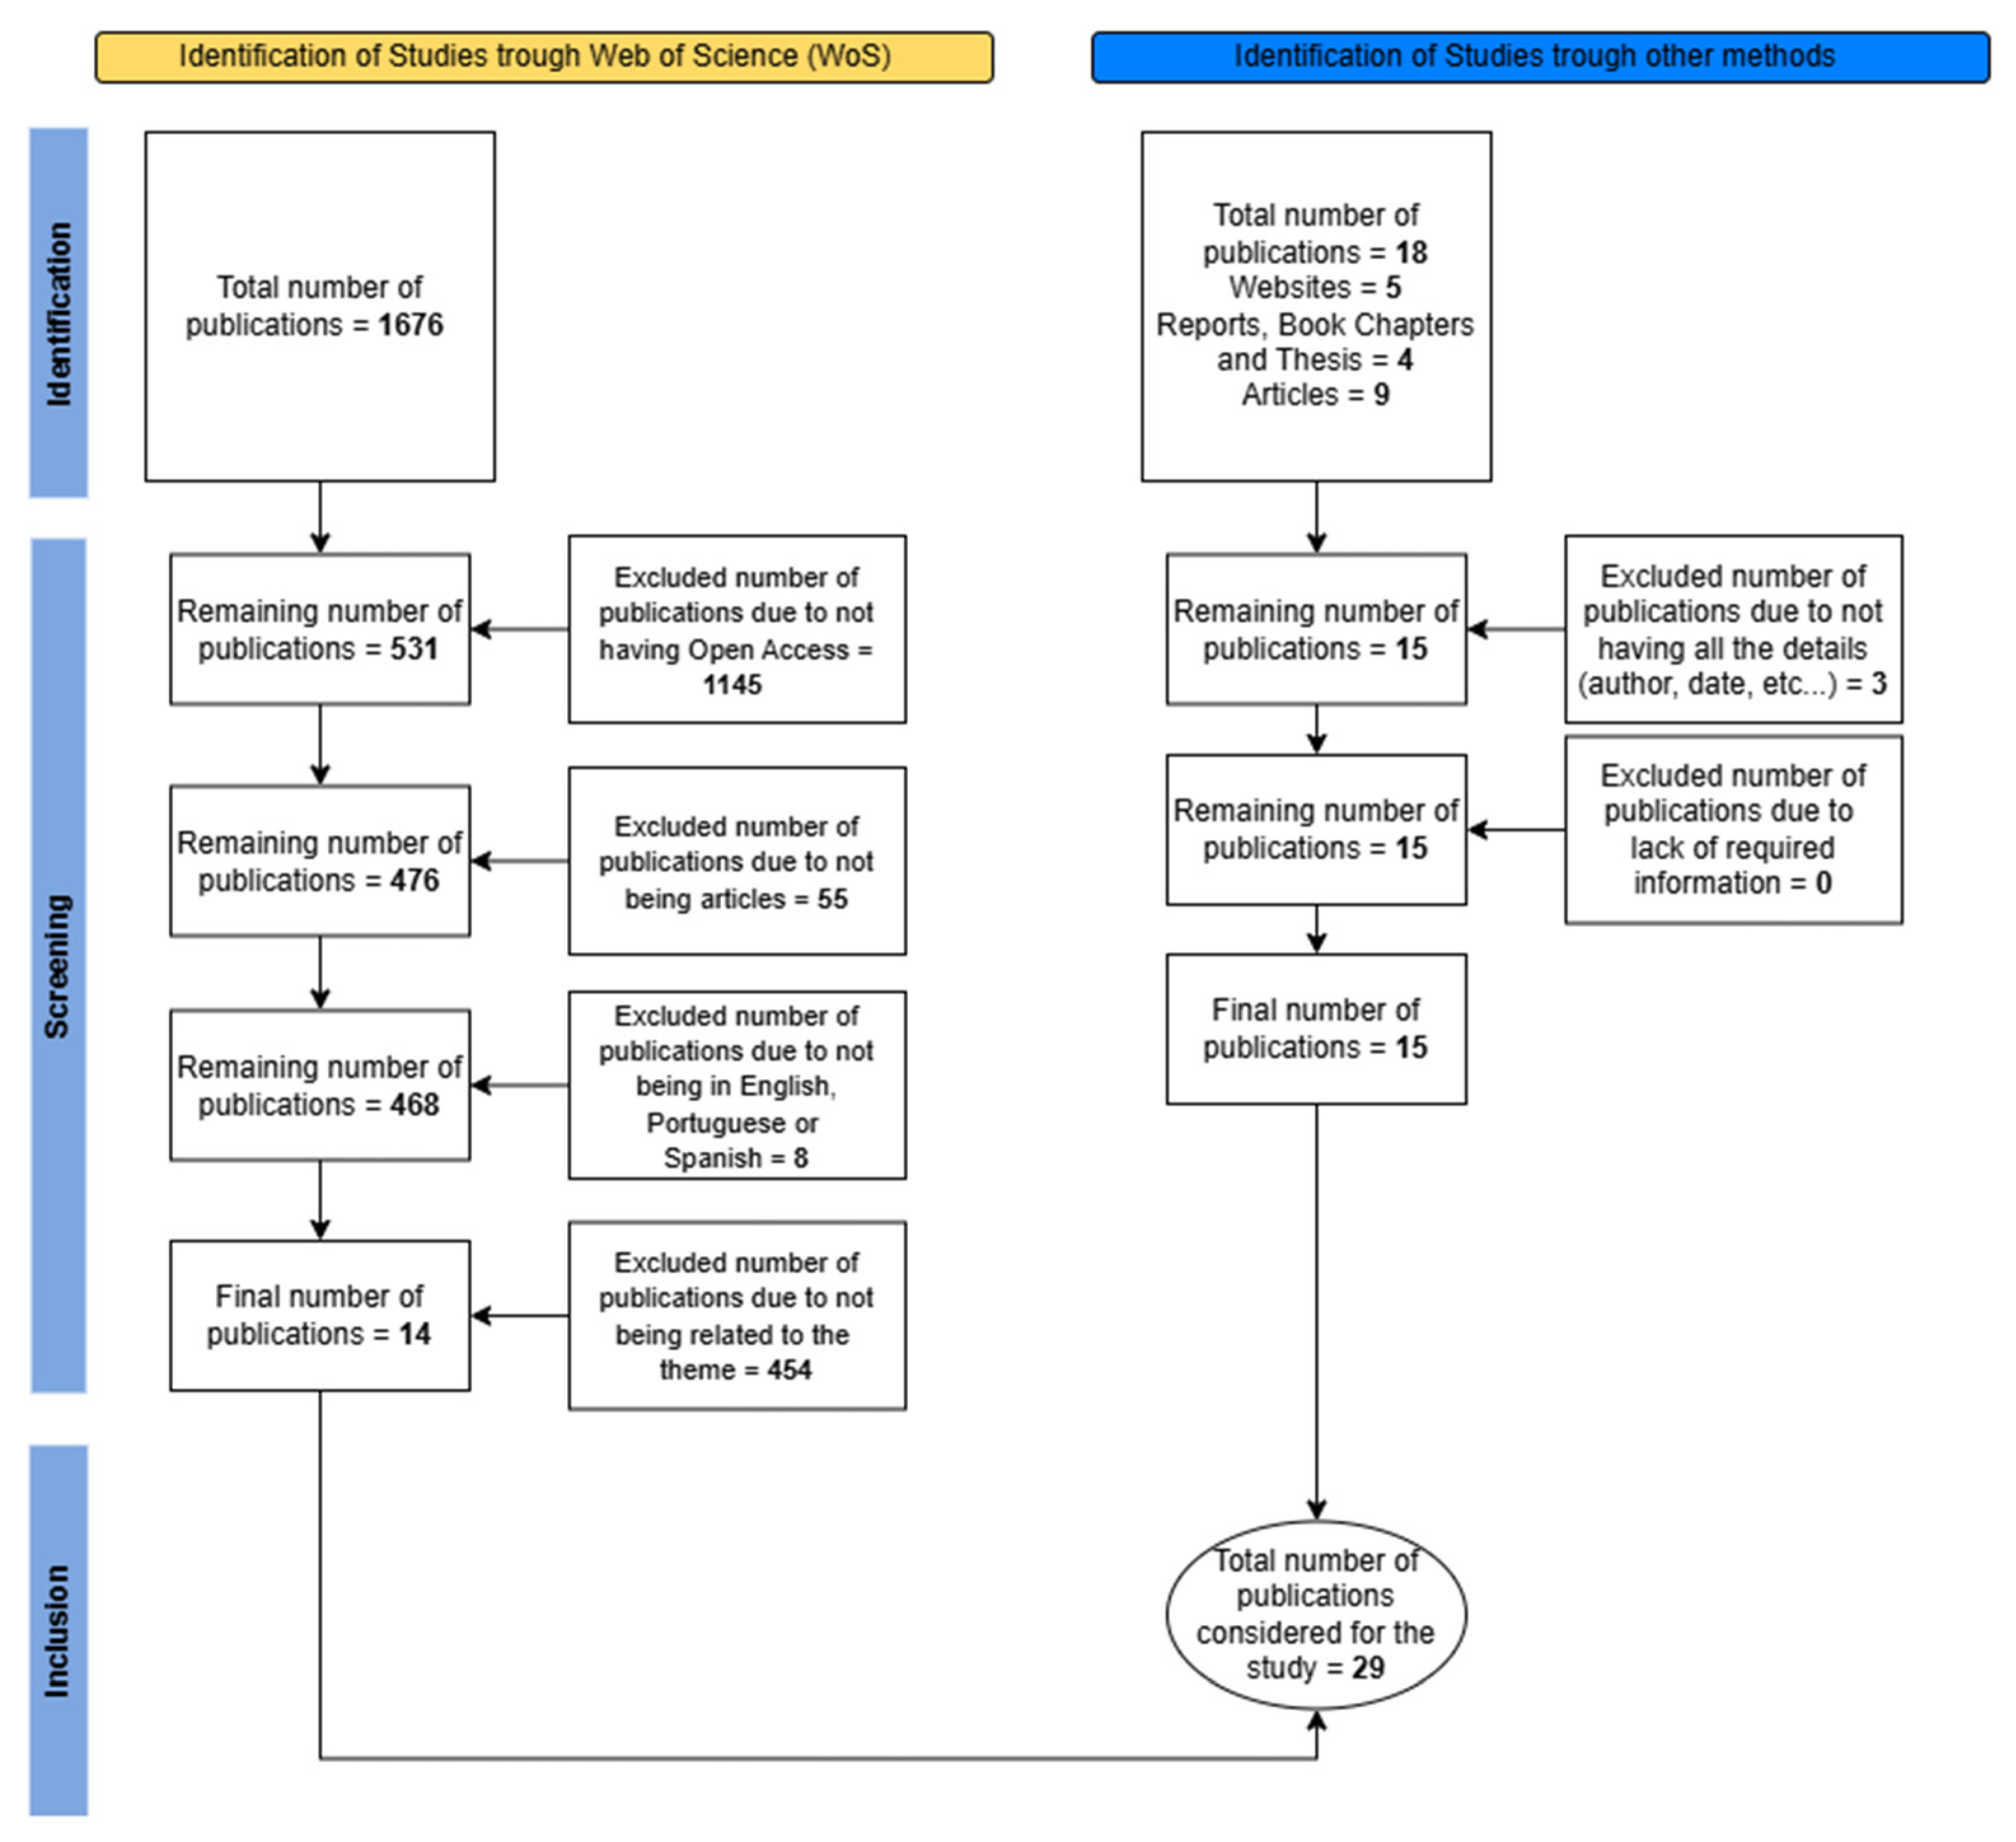
Figure 3.
Paths that vessels may take upon entering the port.
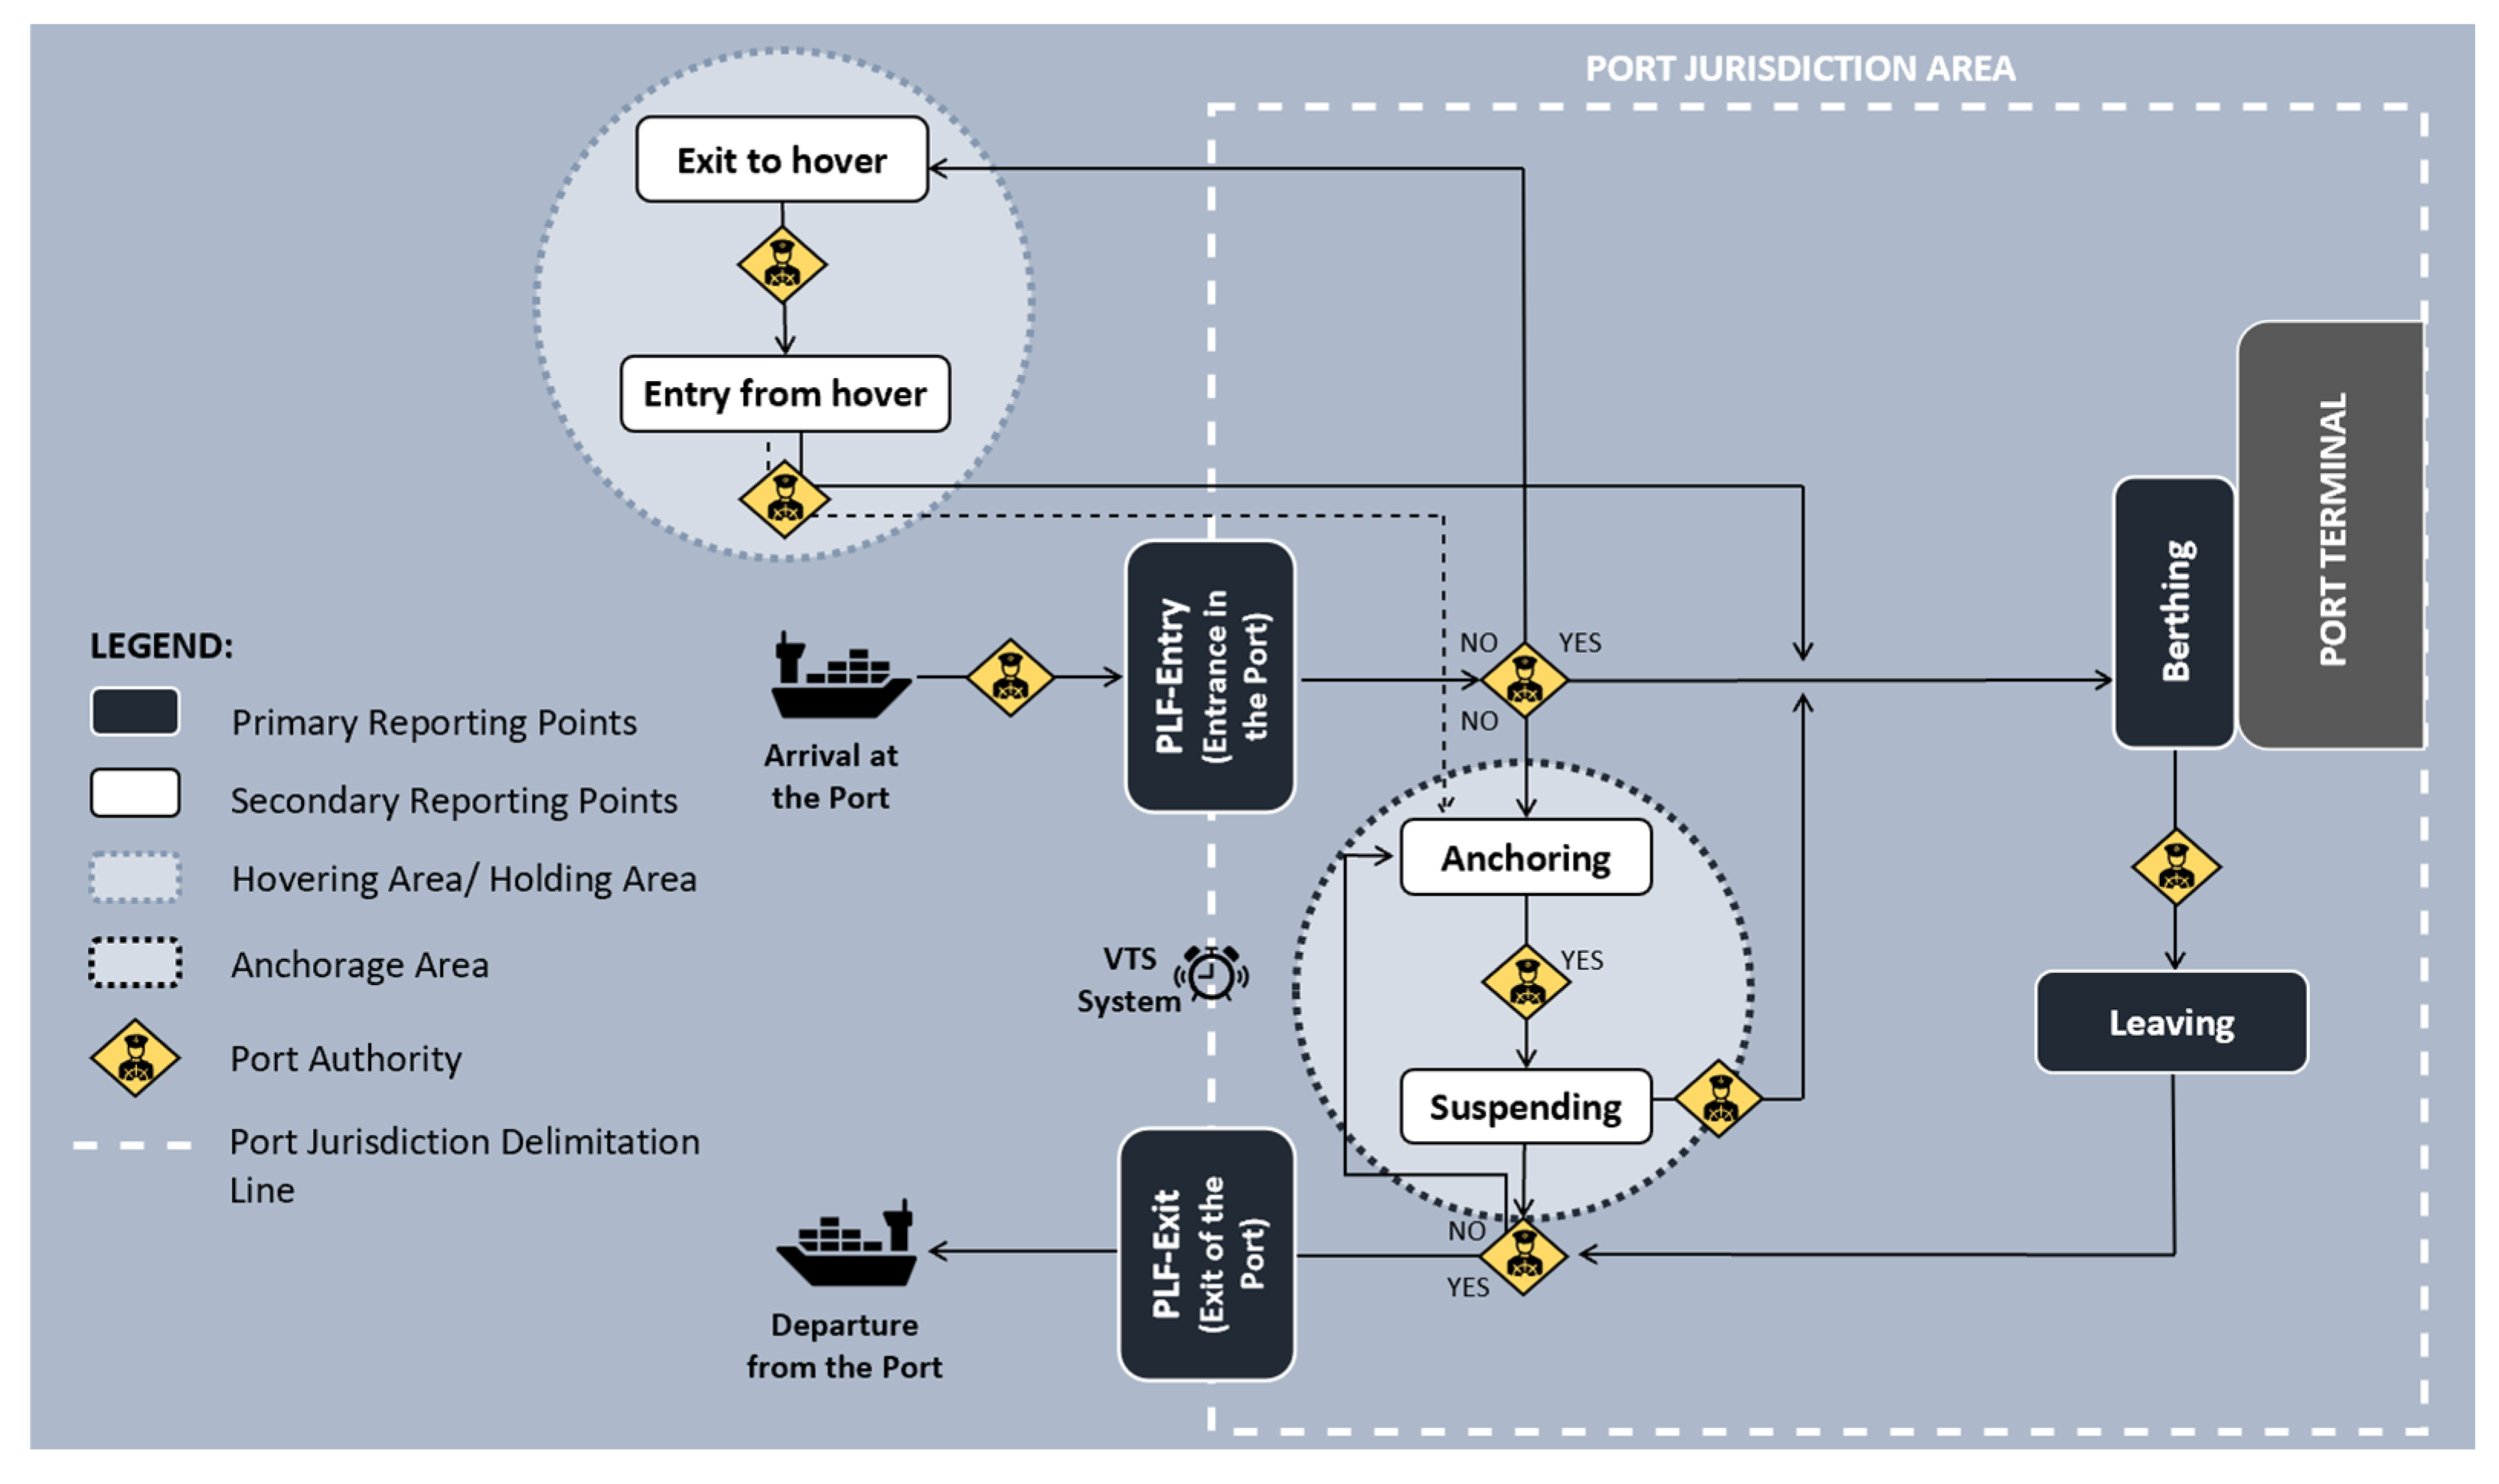
Figure 4.
Number of publications between 1975 and 2024.
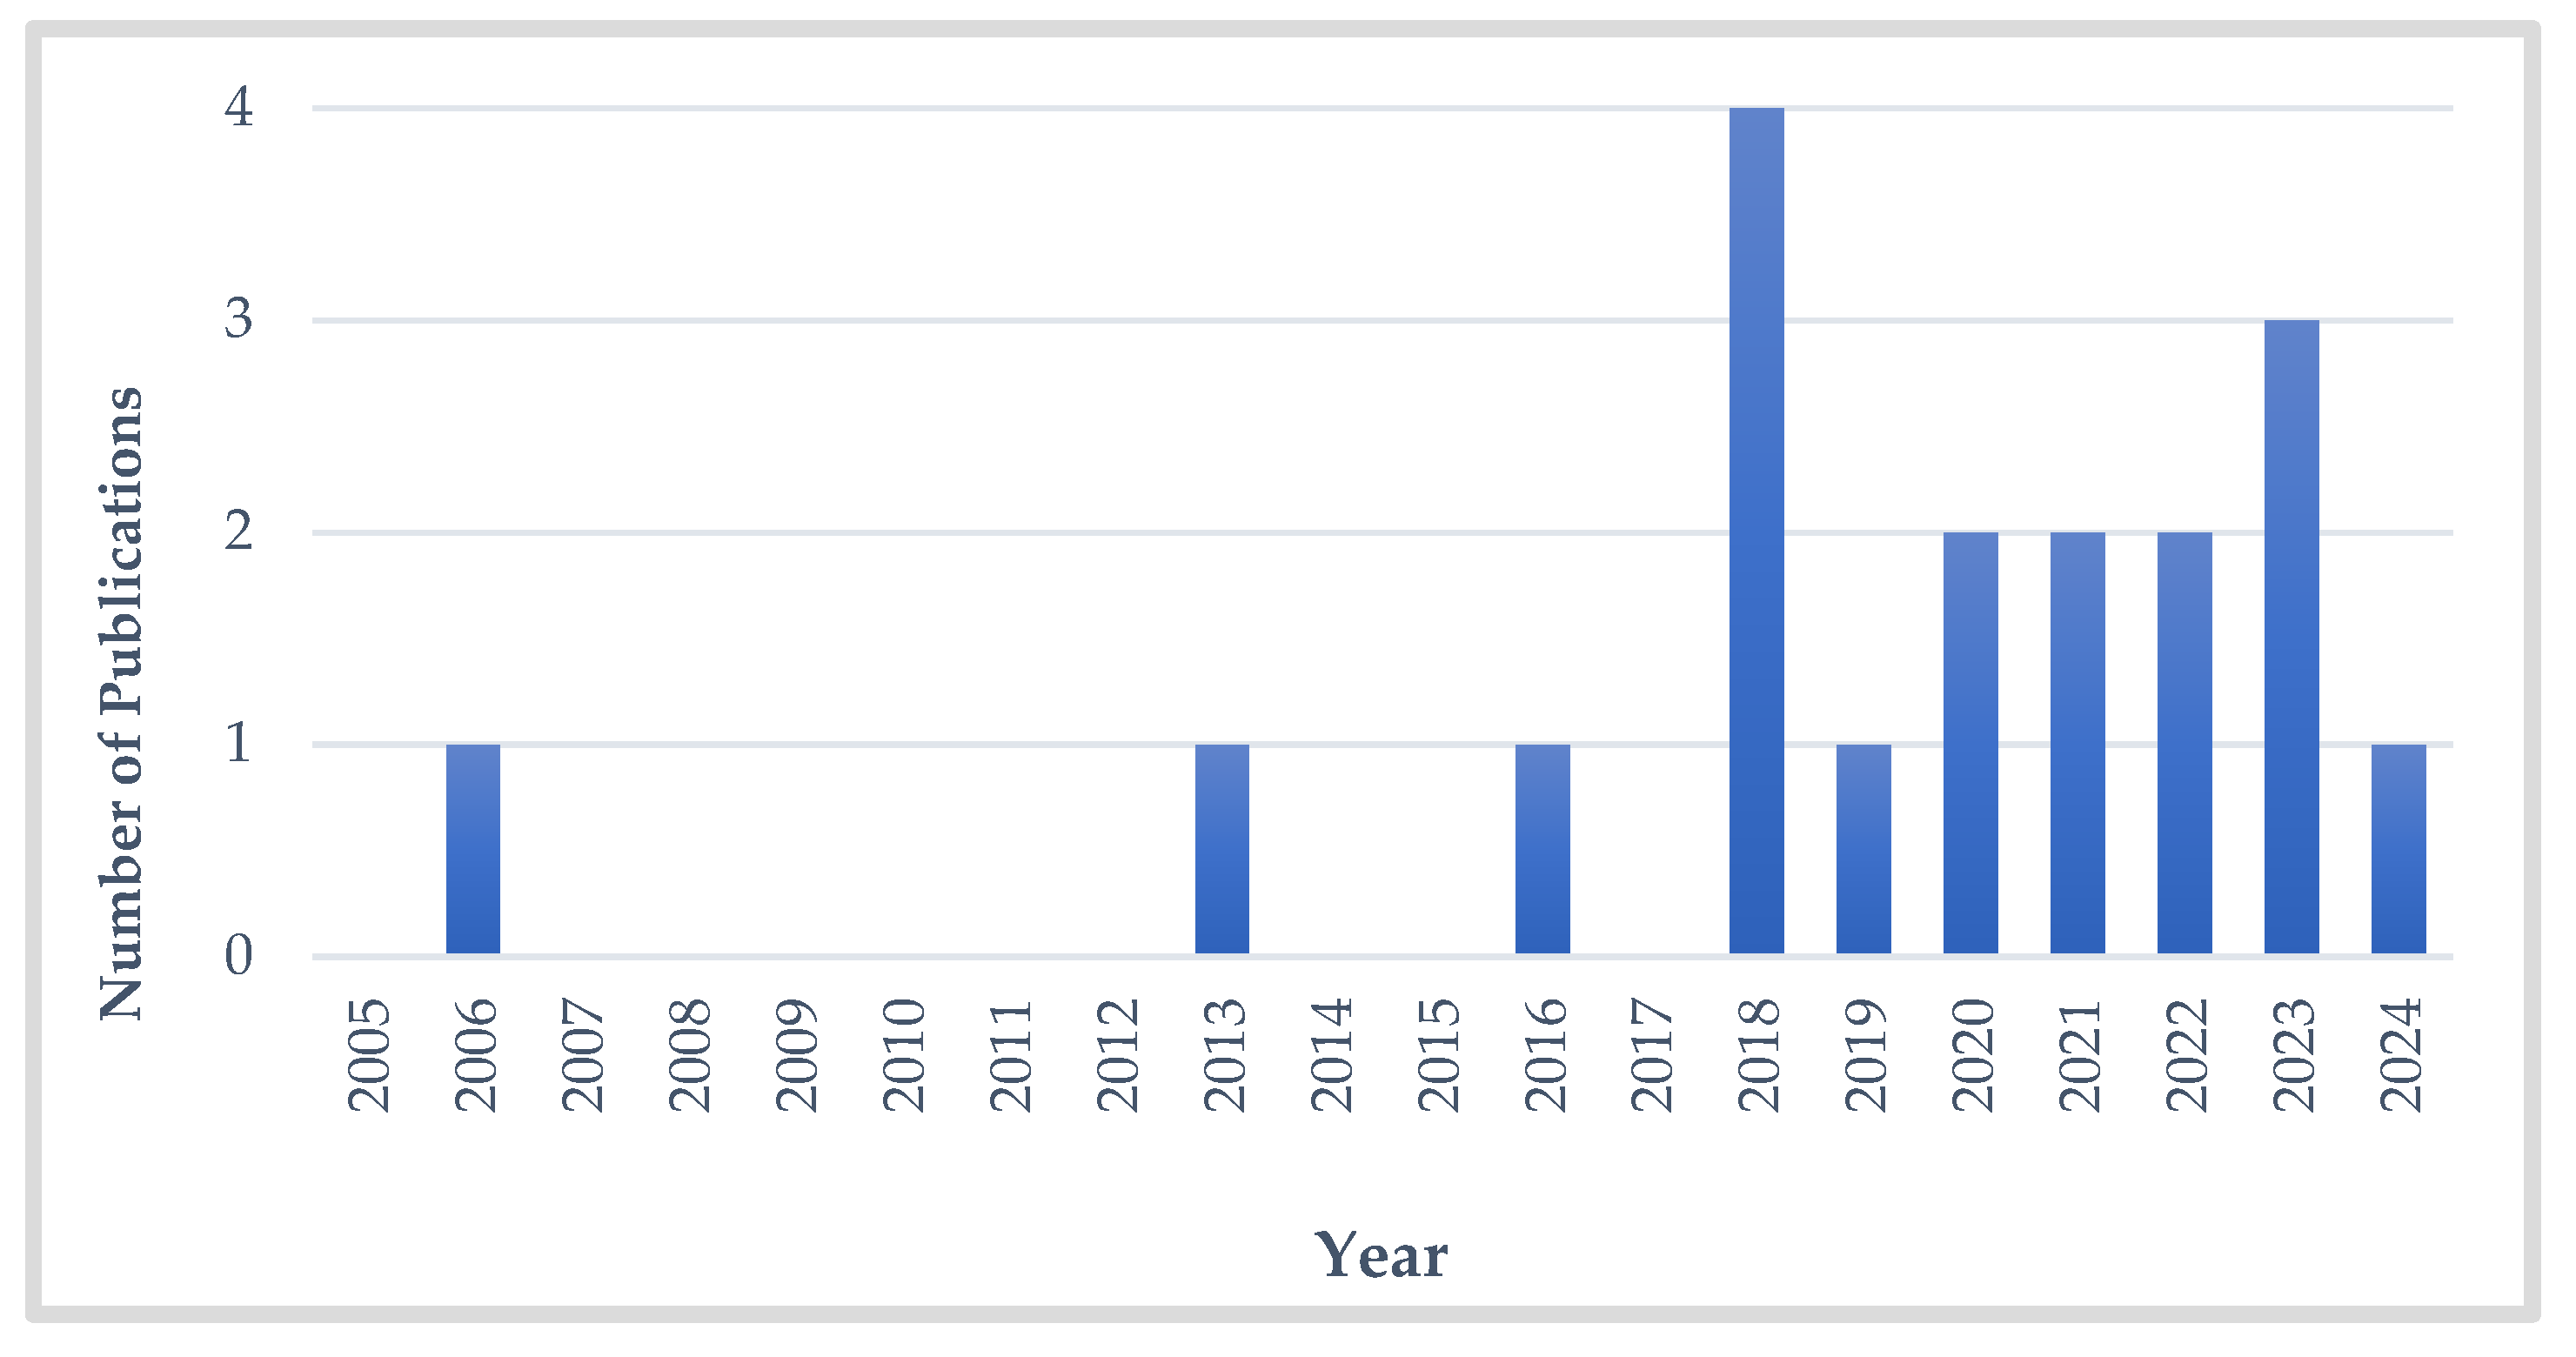
Figure 5.
Number of citations in each of the studied publications.
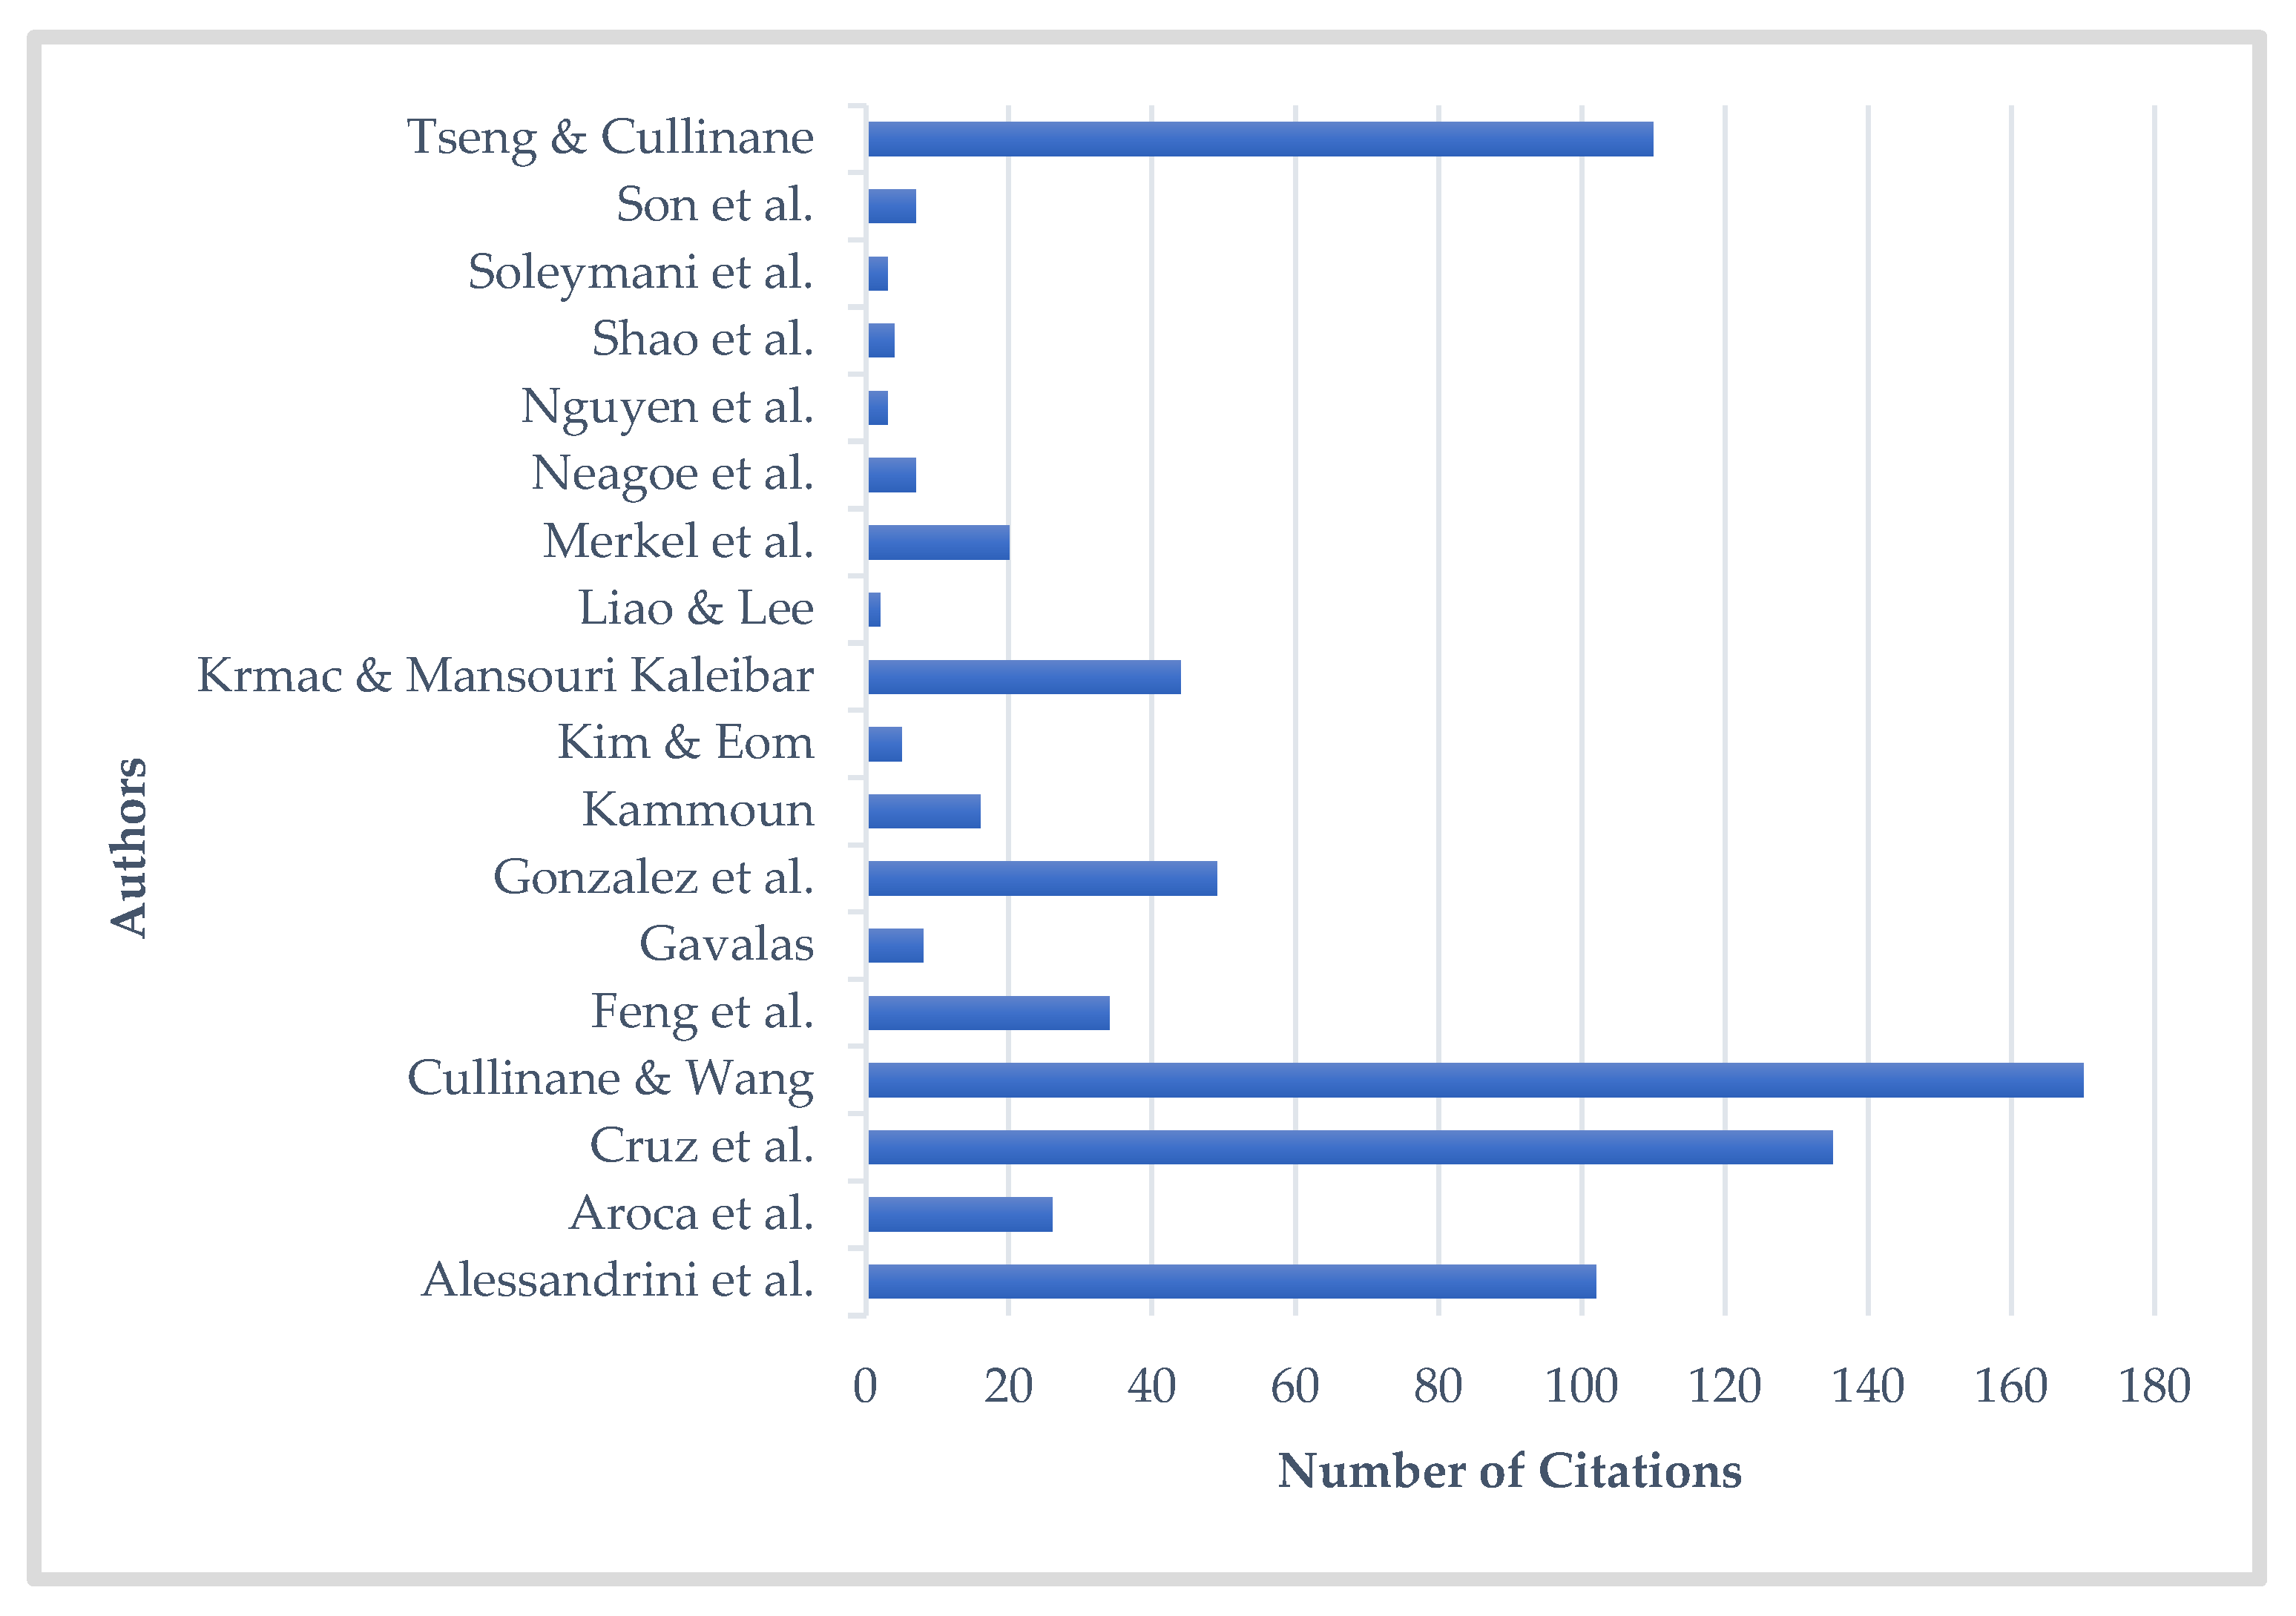
Figure 6.
Global distribution of the studied publications.

Figure 7.
VOSviewer keyword cloud.
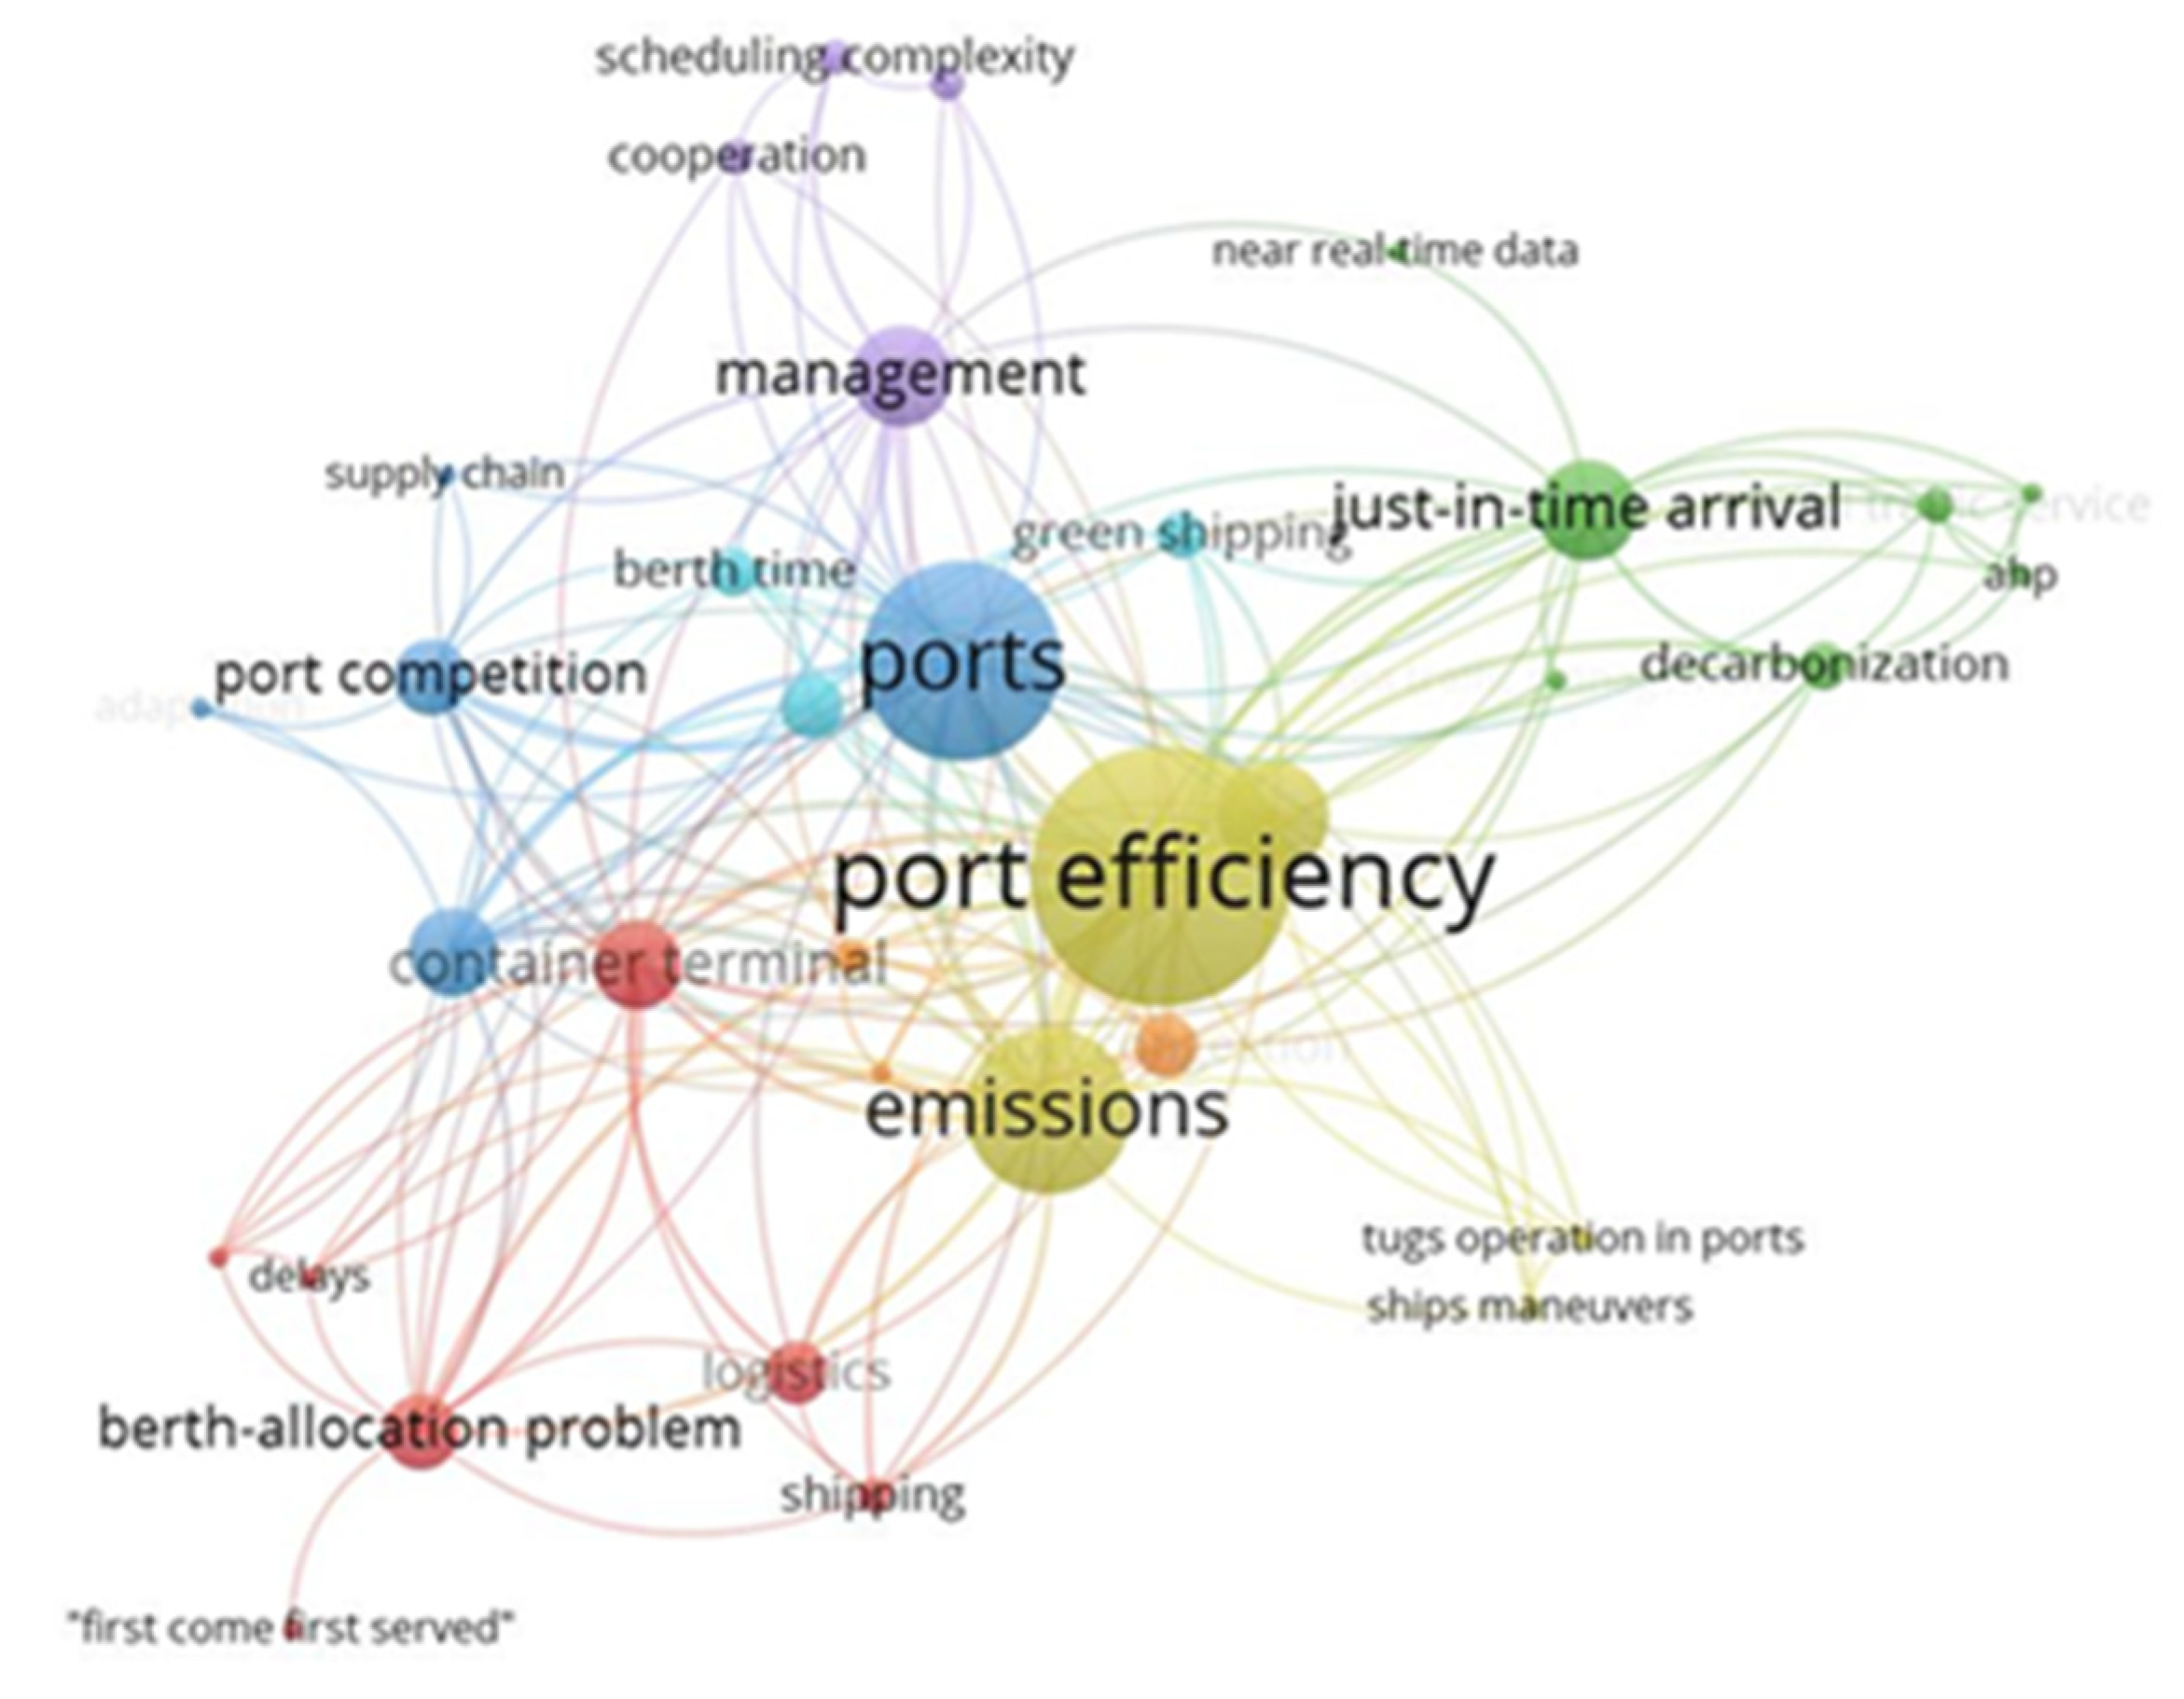
Figure 8.
Vessel entrances distribution by terminal.
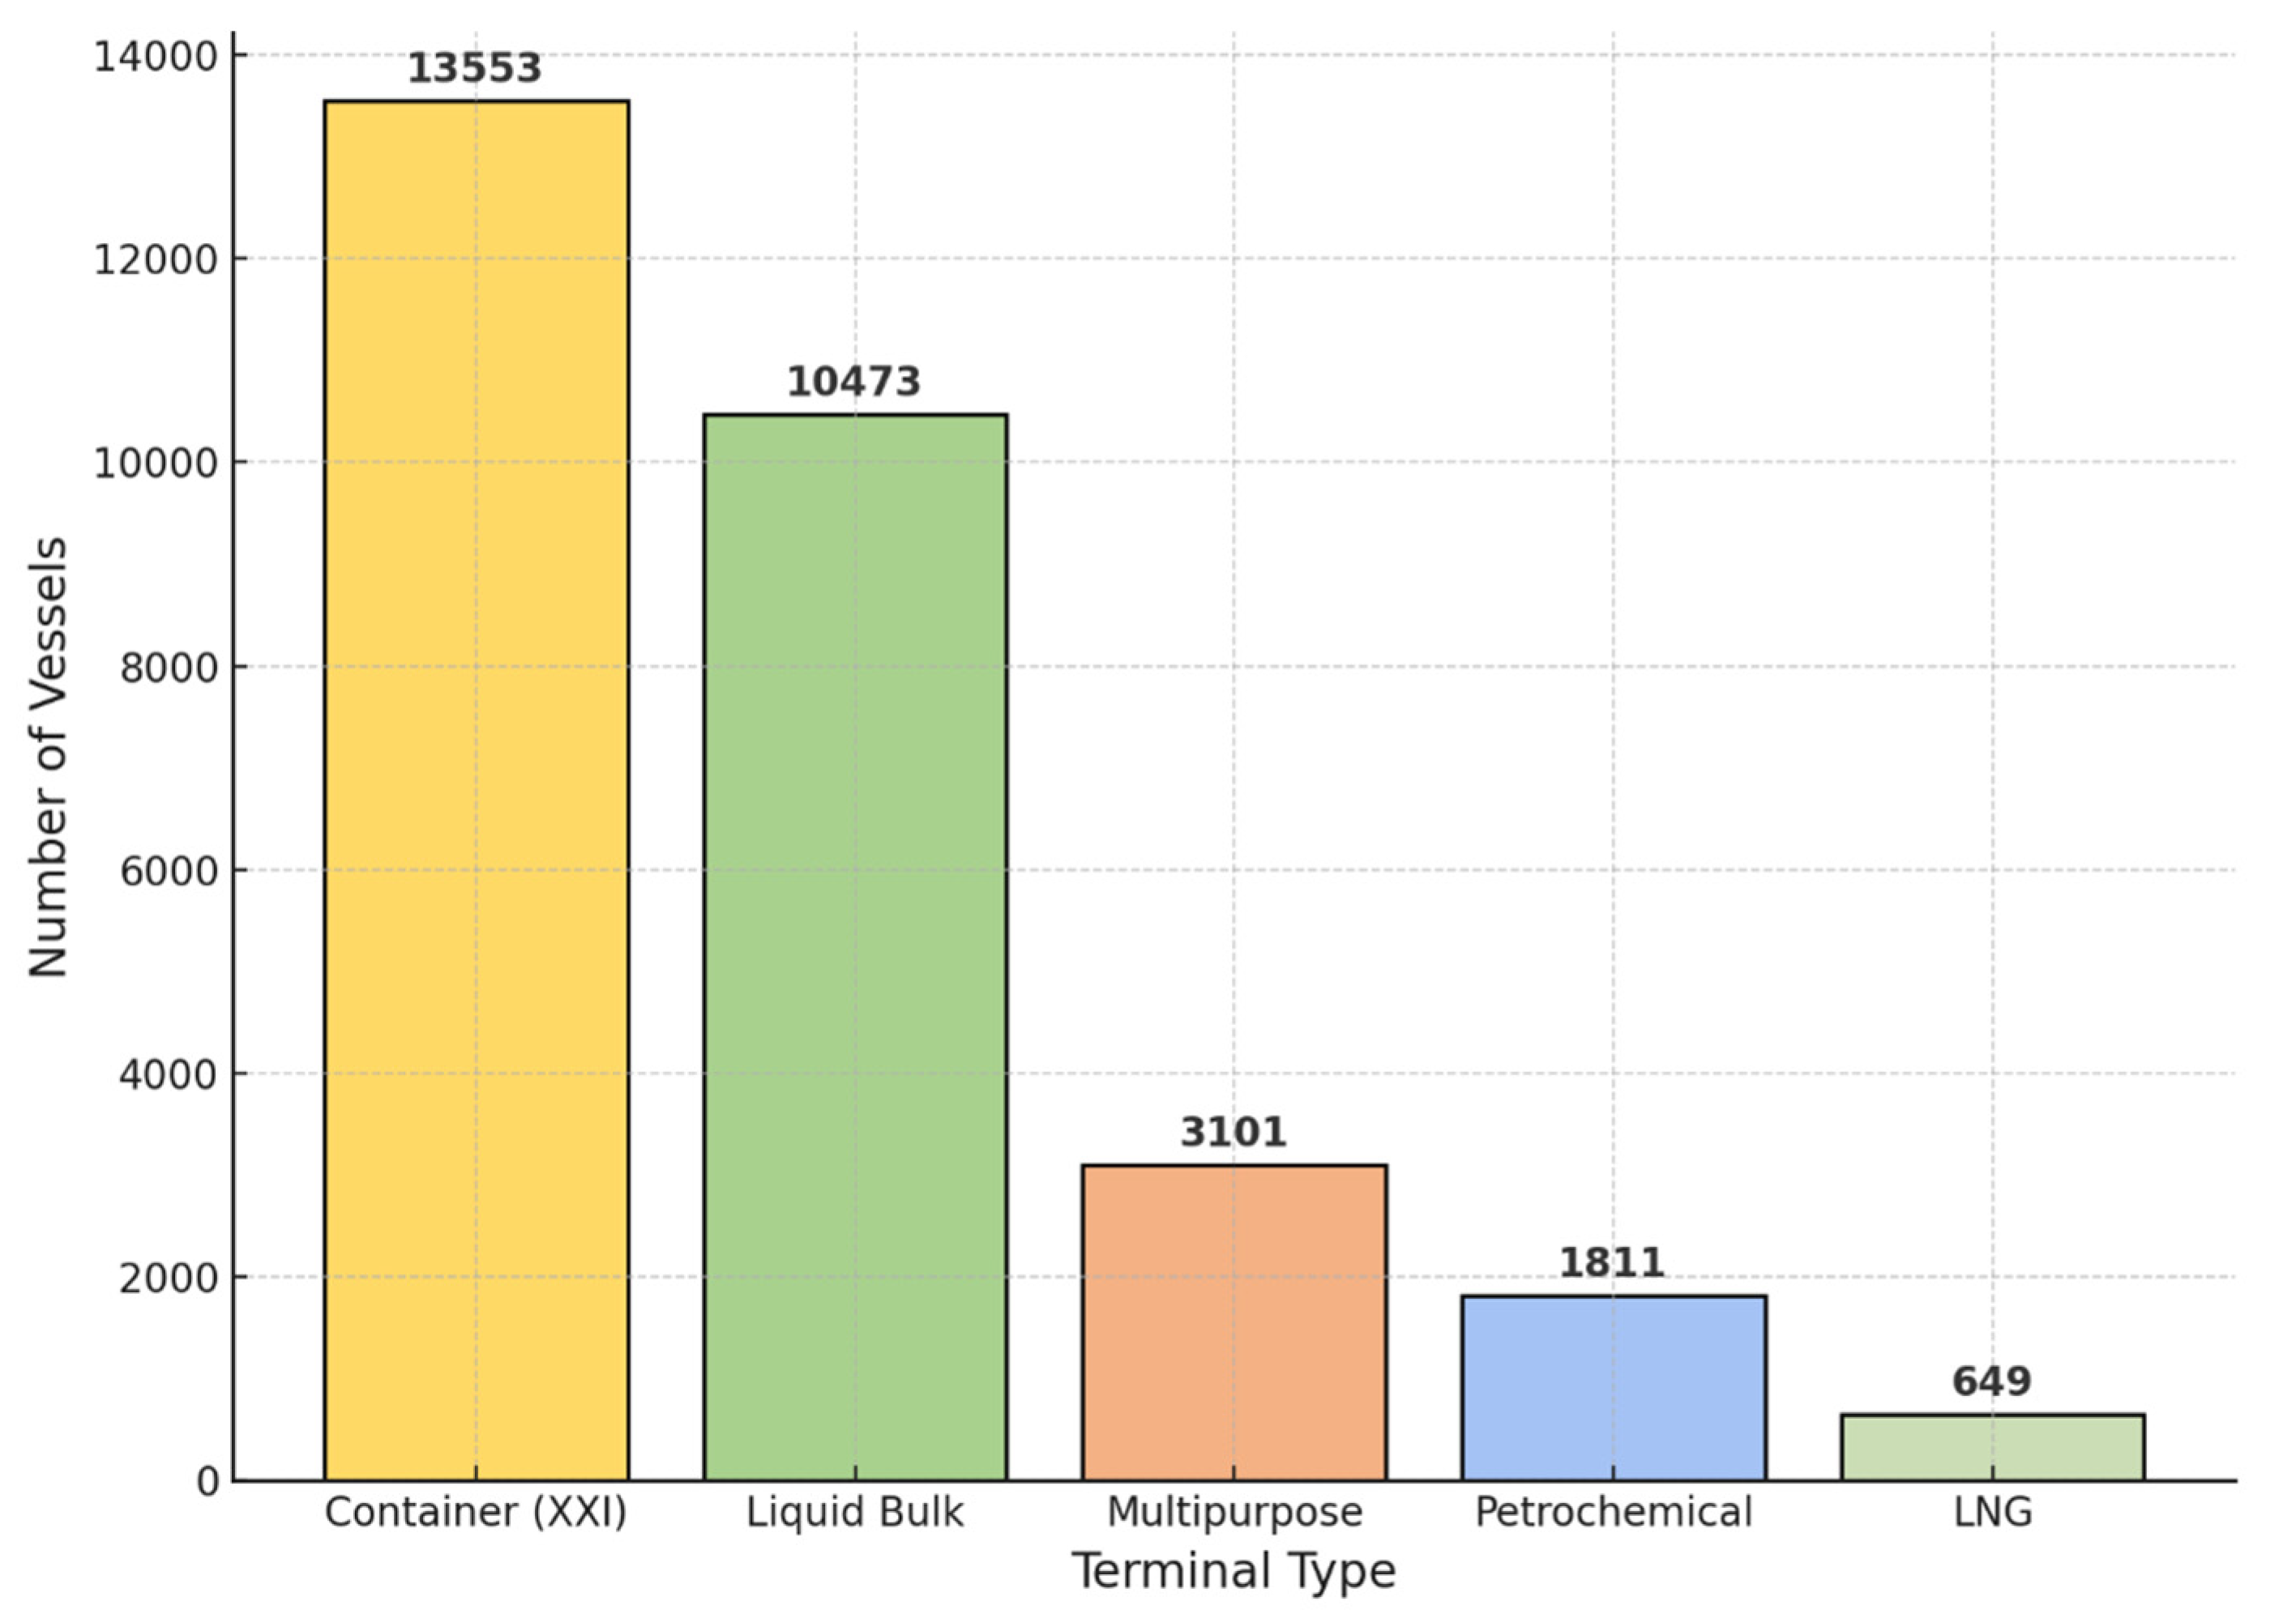
Figure 9.
Evolution of manoeuvres duration between 2010 and 2023.
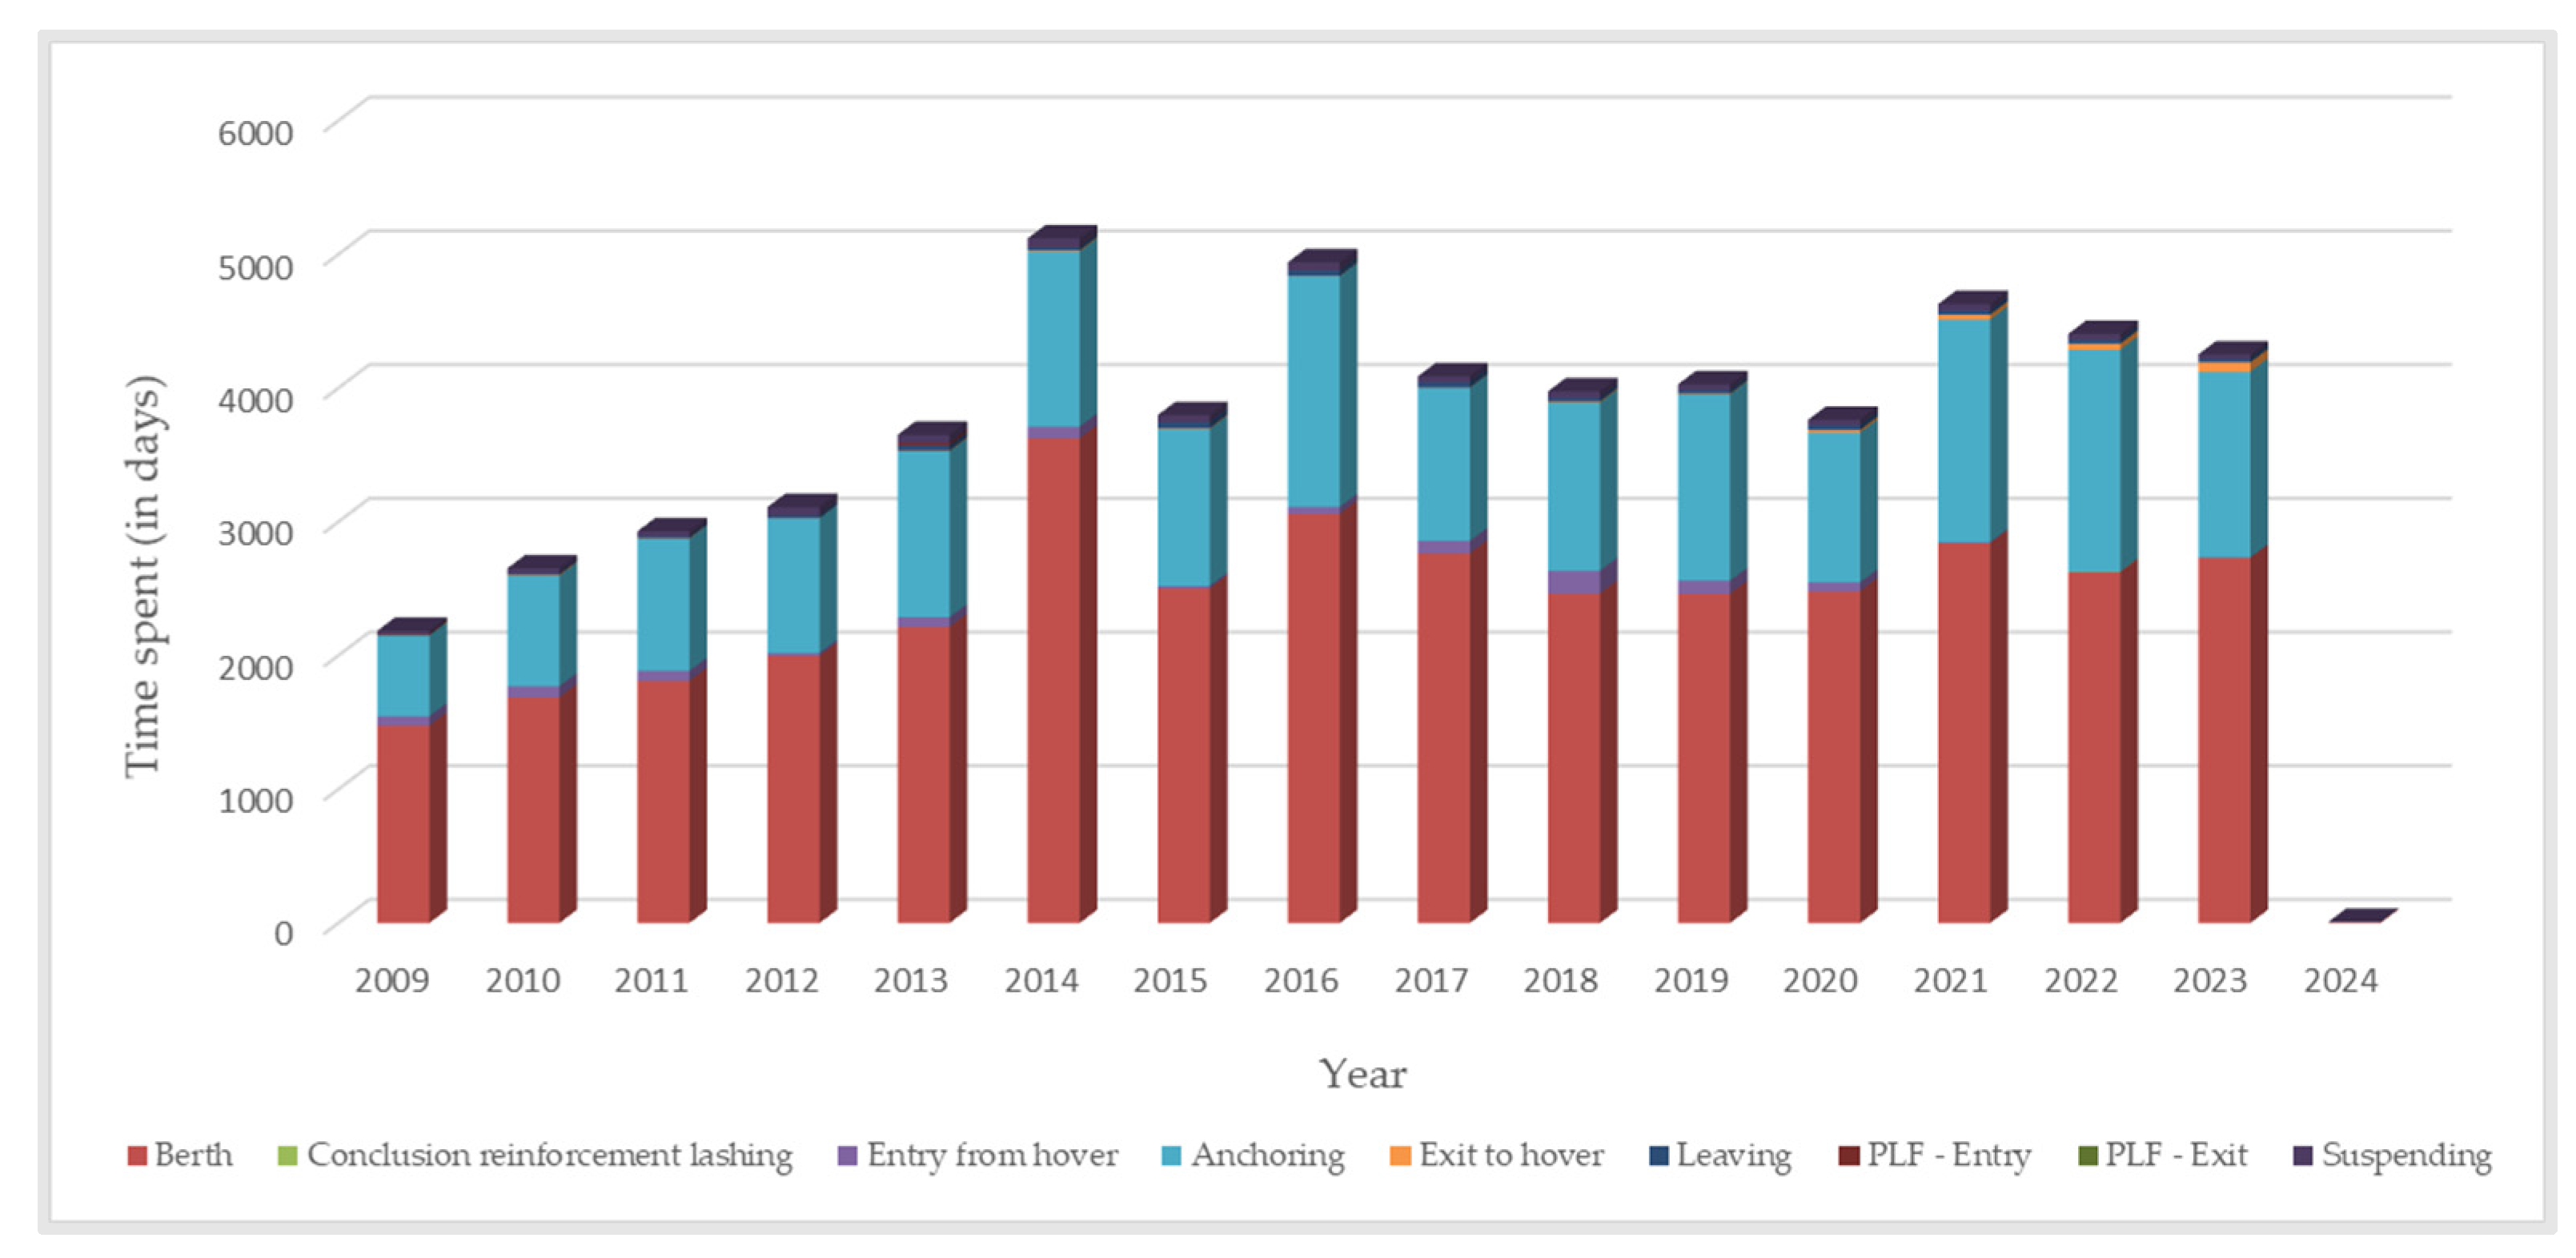

Table 1.
Glossary of each of the vessel’s movements.
| Glossary – Analysis of ship movement data | |
|---|---|
| PLF – Entry | Vessel's entry into the maritime port's jurisdiction area |
| Anchoring | Anchor the vessel in the anchorage areas. |
| Exit to Hover | Leaving the port area to wait for berth. |
| Entry from Hover | Entry in port area to berth after hovering. |
| Suspension | Weigh anchor to depart in order to berth. |
| Berth | Berth the vessel into the terminal and cargo loading/unloading. |
| Leaving | Departure of the vessel from the terminal. |
| PLF – Exit | Vessel's exit from the port's maritime jurisdiction area. |
Table 2.
Port Operations Summary: Port Calls, Dwell Times, Berth and Anchoring Metrics.
| Terminal | Total Number of Port Calls (Total) |
Average number of Port Calls (per year) |
Average Dwell Time (in days) |
Average Anchoring consuming Time (in days) | Maximum Vessel Dwell time (in days) | Average Berth consuming Time (in days) | Percentage of Vessels that Anchor (%) |
|---|---|---|---|---|---|---|---|
| Liquid Bulk Terminal | 10 473 | 748 | 0.59 | 0.19 | 11.85 | 0.38 | 60 |
| Petrochemical Terminal | 1 811 | 129 | 0.55 | 0.18 | 16.67 | 0.35 | 46 |
| Multipurpose Terminal | 3 101 | 222 | 1.08 | 0.35 | 349.17 | 0.69 | 20 |
| Liquified Natural Gas Terminal | 649 | 46 | 0.60 | 0.19 | 8.53 | 0.38 | 11 |
| Containers Terminal | 13 533 | 967 | 0.38 | 0.12 | 598.83 | 0.24 | 18 |
| Port Total | 29 567 | 2 112 | 0.55 | 0.18 | 598.83 | 0.35 | 38 |
Table 3.
Time metrics in each terminal without outliers (in days).
| Terminal | Maximum Vessel Dwell time without Outliers | Average Dwell Time without Outliers |
Number of Port Calls (Outliers) | Percentage of Outliers |
|---|---|---|---|---|
| Liquid Bulk Terminal |
2.80 | 0.53 | 628 | 6 |
| Petrochemical Terminal |
3.10 | 0.44 | 163 | 9 |
| Multipurpose Terminal |
6.30 | 0.49 | 801 | 26 |
| Liquified Natural Gas Terminal | 1.42 | 0.53 | 25 | 4 |
| Containers Terminal | 1.61 | 0.28 | 1267 | 9 |
| Port Total | 6.30 | 0.45 | 2884 | 10 |
Table 4.
Best and Worst Country dealing with each type of cargo (in days). Data Source: United Nations Conference on Trade and Development (UNCTAD), 2019.
Table 4.
Best and Worst Country dealing with each type of cargo (in days). Data Source: United Nations Conference on Trade and Development (UNCTAD), 2019.
| Country | Number of Port Calls | Liquid Bulk | Dry Bulk | Containers | Break Bulk | Liquified Natural Gas | Liquified Petroleum Gas | Average |
|---|---|---|---|---|---|---|---|---|
| Japan | 180 400 | 0.31 | 0.90 | 0.35 | 1.12 | 0.99 | 0.32 | 0.67 |
| USA | 72 485 | 1.64 | 1.84 | 1.00 | 1.79 | 1.28 | 2.03 | 1.60 |
| Singapore | 60 712 | 0.60 | 0.12 | 0.77 | 0.65 | 2.22 | 1.12 | 0.91 |
| Norway | 49 339 | 0.61 | 0.87 | 0.33 | 0.34 | 0.32 | 0.75 | 0.54 |
| Turkey | 47 488 | 1.11 | 4.00 | 0.63 | 1.52 | 1.31 | 1.36 | 1.66 |
| Brazil | 27 546 | 1.74 | 2.67 | 0.81 | 2.45 | 2.94 | 1.66 | 2.05 |
| Canada | 27 225 | 1.12 | 0.32 | 1.49 | 0.28 | - | - | 0.80 |
| Sines | 2 042 | 0.59 | 1.08 | 0.38 | 1.08 | 0.60 | 0.55 | 0.55 |
| Total | 1 884 818 | 0.94 | 2.05 | 0.70 | 1.11 | 1.11 | 1.02 | 1.16 |
Disclaimer/Publisher’s Note: The statements, opinions and data contained in all publications are solely those of the individual author(s) and contributor(s) and not of MDPI and/or the editor(s). MDPI and/or the editor(s) disclaim responsibility for any injury to people or property resulting from any ideas, methods, instructions or products referred to in the content. |
© 2025 by the authors. Licensee MDPI, Basel, Switzerland. This article is an open access article distributed under the terms and conditions of the Creative Commons Attribution (CC BY) license (http://creativecommons.org/licenses/by/4.0/).
Copyright: This open access article is published under a Creative Commons CC BY 4.0 license, which permit the free download, distribution, and reuse, provided that the author and preprint are cited in any reuse.


