
Submitted:
03 March 2025
Posted:
04 March 2025
You are already at the latest version
Abstract
This study evaluates the service quality and customer satisfaction of Niazi Express, a leading transport company in Pakistan. Using the SERVQUAL model, the research examines key factors such as punctuality, cleanliness, pricing, and staff behavior that influence customer perceptions. A quantitative approach was adopted, collecting data from 200 passengers and 50 employees through structured surveys. Statistical analysis reveals that punctuality and staff behavior significantly impact customer loyalty, while issues like fare transparency and service inconsistencies remain concerns. Findings indicate that enhancing service quality can improve customer retention and competitiveness. The study recommends improvements in operational efficiency, employee training, and fare policies to align services with passenger expectations. By addressing these areas, Niazi Express can enhance overall customer satisfaction and strengthen its market position. Future research can expand this study by comparing different transport services or incorporating qualitative insights from customer interviews to provide a deeper understanding of service quality dynamics.
Keywords:
Service Quality
; Customer Satisfaction
; Public Transportation
; Niazi Express
; SERVQUAL Model
Introduction
Customer satisfaction is a critical factor in the success of any service-based industry, particularly in the transportation sector. Public transport companies must ensure high service quality to retain customers and stay competitive. In Pakistan, the transport industry plays a vital role in facilitating mobility for millions of passengers daily. Among the prominent service providers, Niazi Express stands out as one of the largest intercity bus services (Kuo et al., 2023). However, despite its significant presence, customer complaints regarding punctuality, cleanliness, pricing, and staff behavior have raised concerns about its service quality.
Service quality in transportation is a multidimensional concept that encompasses reliability, responsiveness, assurance, empathy, and tangibles, as outlined in the SERVQUAL model. These dimensions directly influence customer perceptions and satisfaction levels. A well-maintained and customer-oriented service can lead to increased customer retention and positive word-of-mouth, ultimately benefiting the company’s profitability and market standing. Conversely, poor service quality can result in dissatisfied customers, decreased ridership, and a negative brand image (Wisutwattanasak et al., 2023).
Niazi Express, like other transport providers, faces various challenges in maintaining service quality. Passengers often highlight issues such as delayed departures and arrivals, inadequate customer support, overpricing during peak seasons, and lack of cleanliness in buses and terminals. These factors negatively impact the overall customer experience, discouraging repeat usage and loyalty. Thus, assessing service quality and understanding passenger expectations are crucial for identifying gaps and implementing necessary improvements (Kumari & Perera, 2021).
This study aims to assess service quality in Niazi Express through the SERVQUAL model, evaluating dimensions such as reliability, responsiveness, and assurance. Given that public transport services in Asia often struggle with operational inefficiencies and customer satisfaction concerns, this research aligns with the objectives of ATS by addressing Asia-specific transportation challenges and proposing evidence-based solutions to improve public transit efficiency in emerging markets.
Ultimately, this research contributes to the broader discussion on service quality in public transportation by offering practical solutions for improving customer satisfaction (Al-Rashid et al., 2021).. By addressing service gaps and implementing customer-centric strategies, transport companies like Niazi Express can enhance their competitiveness and ensure a better travel experience for passengers across Pakistan.
Research Problem
Public transportation services are essential for facilitating mobility, yet customer satisfaction often remains a challenge due to service quality issues. Niazi Express, one of the leading transport providers in Pakistan, faces customer concerns related to punctuality, cleanliness, pricing, and staff behavior. Passengers frequently report inconsistencies in service delivery, including delays, overpricing during peak seasons, and inadequate customer support (Iqbal et al., 2020). These factors negatively impact customer loyalty and the overall brand reputation of the company. Given the competitive nature of the transport sector, it is crucial to assess the service quality of Niazi Express and determine how it affects customer satisfaction. Identifying key service gaps will help in developing strategies for improvement, ensuring higher customer retention, and enhancing the company’s market position.
Research Questions:
- How does service quality impact customer satisfaction in the case of Niazi Express?
- What are the key determinants of customer satisfaction in public transportation?
- What are the major service gaps in Niazi Express’s operations?
- How does customer perception of service quality influence their loyalty to Niazi Express?
- What improvements can be made to enhance customer satisfaction and service efficiency?
Research Objectives:
- To analyze customer perceptions of Niazi Express’s service quality.
- To identify the factors that influence customer satisfaction in public transportation.
- To assess the relationship between service quality and customer loyalty.
- To evaluate service discrepancies between customer expectations and actual service delivery.
- To provide strategic recommendations for improving service quality in Niazi Express.
Literature Review
The public transport sector is fundamentally dependent on the quality of service and the satisfaction of customers, both of which are critical for the success and sustainability of any service industry (Ibrahim et al., 2022). In the past years, transport companies have faced increased competition and evolving customer expectations. The enhancement of service quality and customer satisfaction is crucial for maintaining market position and attracting new customers (Cruz & Sarmento, 2020). Essential mobility services are served by local transport companies, whose role is crucial in the daily lives of the urban dwellers. But these companies often struggle with infrastructure, operational efficiency and customer service. This is to understand the factors that affect service quality and customer satisfaction in this context to improve total performance and also to improve the travel experience of the commuter (Ahijo, 2022).
Service quality plays a key role in affecting customer satisfaction and commitment in the public transport business (Javid et al., 2021). Reliability is explored as a service quality dimension in public transport in several studies. Factors that influence these dimensions include vehicle condition, driver behavior, punctuality and information availability(Tanwar & Agarwal, 2024).
Customer satisfaction is a complicated one and measures how service quality is perceived and whether customer expectations are met (Oliver, 1980). Since different factors such as the physical environment, behaviour of service provider as well as the experience of using the service can affect service quality.
A variety of factors in the service quality of the transport sector influence customer satisfaction. The punctuality of the bus service is essential for achieving customer satisfaction. Should the bus service maintain punctuality and the company guarantee timely departures and arrivals, it will cultivate a loyal customer base. The conduct of employees significantly contributes to customer loyalty; therefore, it is essential for company personnel to exhibit exemplary behavior to gain the customers satisfaction (Arslan, 2020). Charging adequate fares by the company is an effective strategy to achieve customer loyalty; the company should implement fair pricing for its customers. Cleanliness is a significant factor that impacts customer loyalty. The responsiveness of the employees and management in addressing issues and providing satisfactory solutions to customer complaints will significantly influence customer loyalty. The company should offer a diverse range of services that align with customer needs, which will also be beneficial for achieving customer loyalty (Van Lierop et al., 2018). The duration required by management to address customer complaints directly impacts the operational time utilized by both management and employees, which in turn affects customer perceptions. Reducing the time taken by the company below the specified duration will enhance customer perception and foster loyalty among clients. The various factors influencing service quality are essential for the transport company to enhance its service offerings and achieve customer loyalty and satisfaction.
Theoretical Framework
The theoretical framework serves as the foundation for understanding the relationship between service quality and customer satisfaction in public transportation. It integrates key theories and models, including the SERVQUAL model, Expectation-Confirmation Theory, and customer loyalty concepts, to explain how service quality perceptions influence customer behavior. This study applies these theories to assess Niazi Express’s service quality and its impact on customer satisfaction and loyalty.
Service Quality
The SERVQUAL Model represents one of the most established mechanisms to measure service quality because Parasuraman, et al., published it in 1988. The SERVQUAL model ensures an organized assessment of public transport service quality by detecting main service shortcomings which influence customer satisfaction according to Mikhaylov et al. (2015). The five core elements described in the SERVQUAL Model determine customer success in assessing service quality support. Tangibilityis the physical facilities, equipment, and appearance of service personnel. Customers assess the quality of transport services through bus hygiene standards alongside waiting area and seating arrangements (Mikhaylov et al., 2015). Reliability stands for a dependable service that performs as promised accurately. The scheduled transport service quality measurement consists of accurate operating according to schedule (Javid et al., 2021). Responsibility stands for a service organization demonstrate responsiveness by showing readiness to help customers along with their dedication to rapid service delivery. Customers receive support services as well as complaint resolution and rapid problem correction through this system (Arslan, 2020). Assurance depend on employee courtesy together with their knowledge base and inspiration of trust which leads to assurance. Driver conduct as well as ticketing staff professionalism and platform safety protocol both contribute to transport sector service quality (Njelita & Opara, 2023b). Empathy is the provision of individualized care to passengers forms a core aspect of empathetic service which includes proactive employee understanding of client requirements (Anantharanthan Parasuraman et al., 1991).
Figure 1.
“SERVQUAL Model (Parasuraman et al., 1988)”.
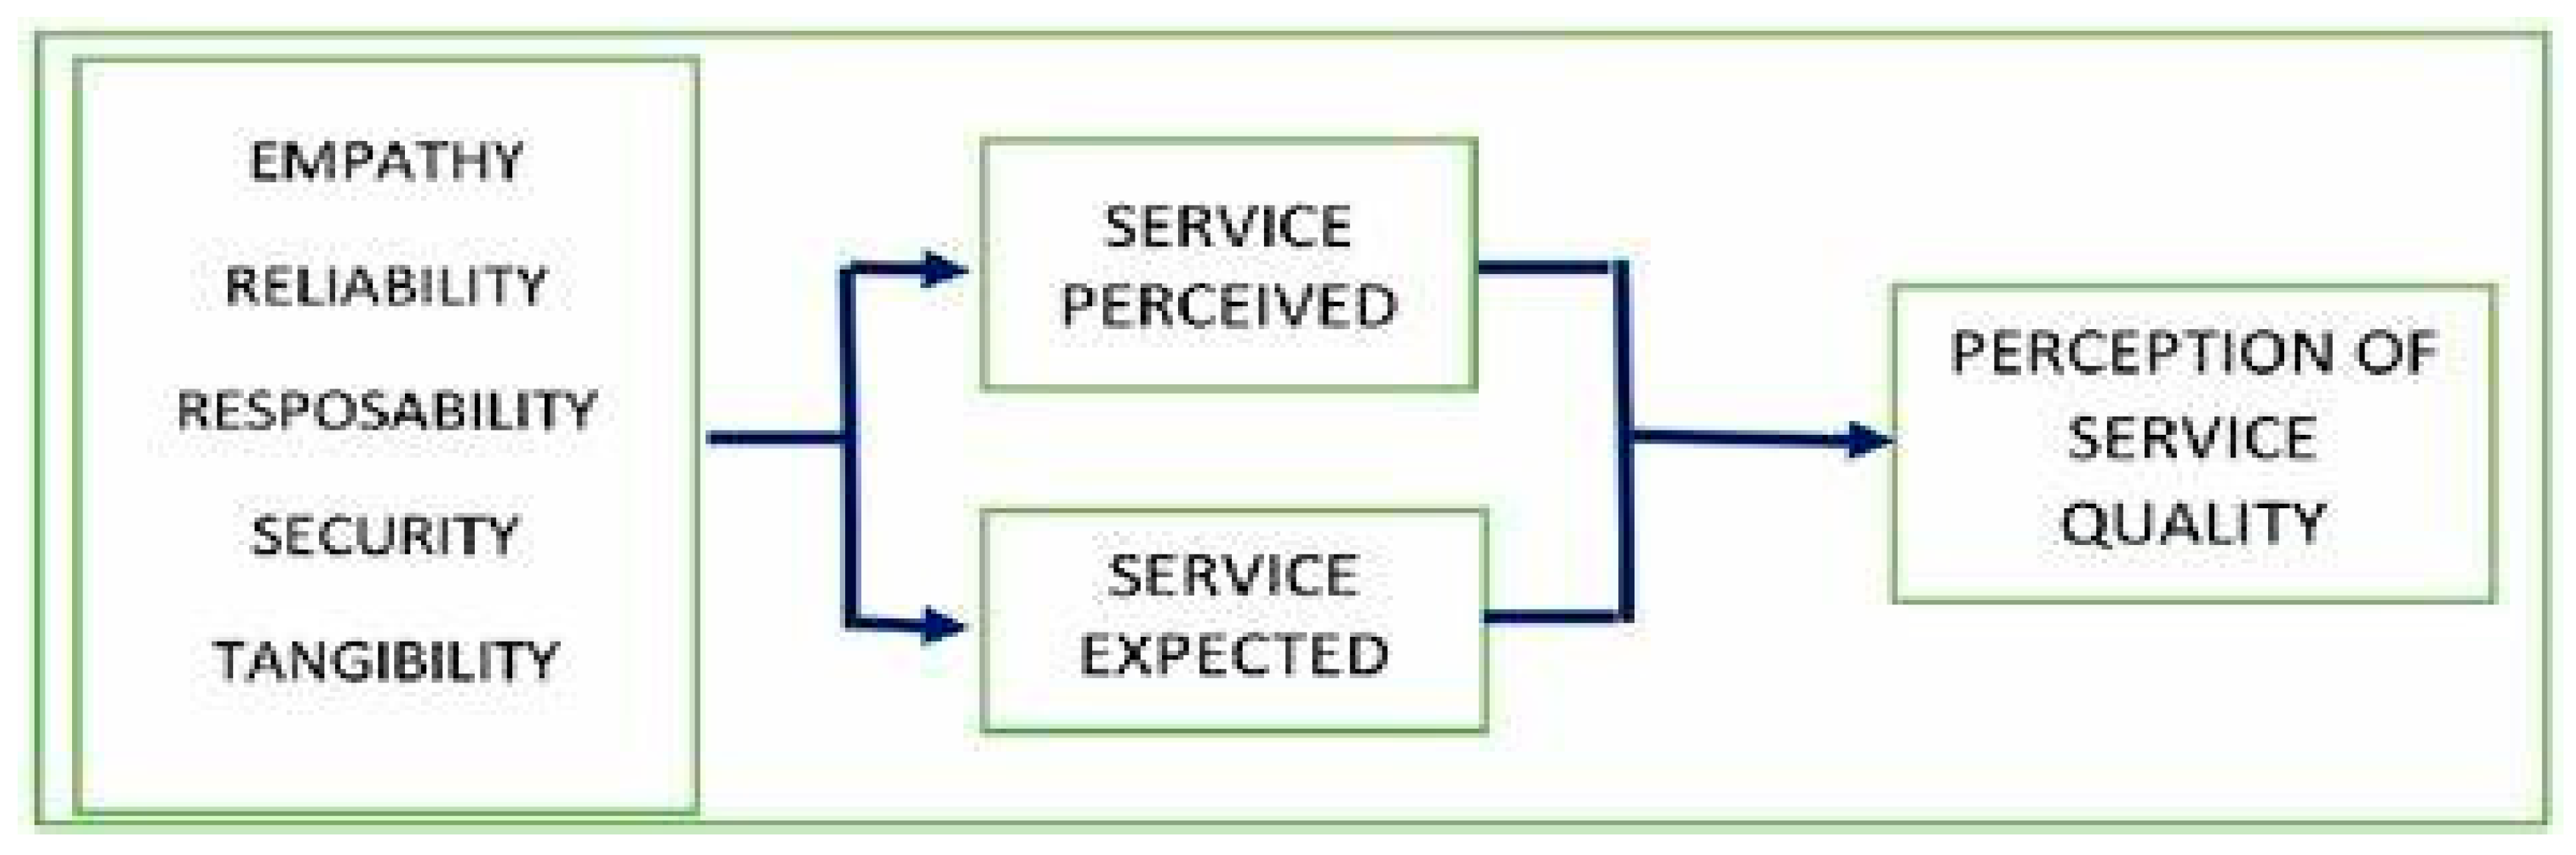
These dimensions help evaluate service quality gaps by comparing customer expectations with actual service experiences. This model will be used to measure Niazi Express’s service quality.
Expectation-Confirmation Theory (Oliver, 1980)”
The Expectation-Confirmation Theory (ECT) explains how customer satisfaction is formed based on the confirmation or disconfirmation of expectations. It suggests that:
Figure 2.
Expectation-Confirmation Theory (Oliver, 1980).
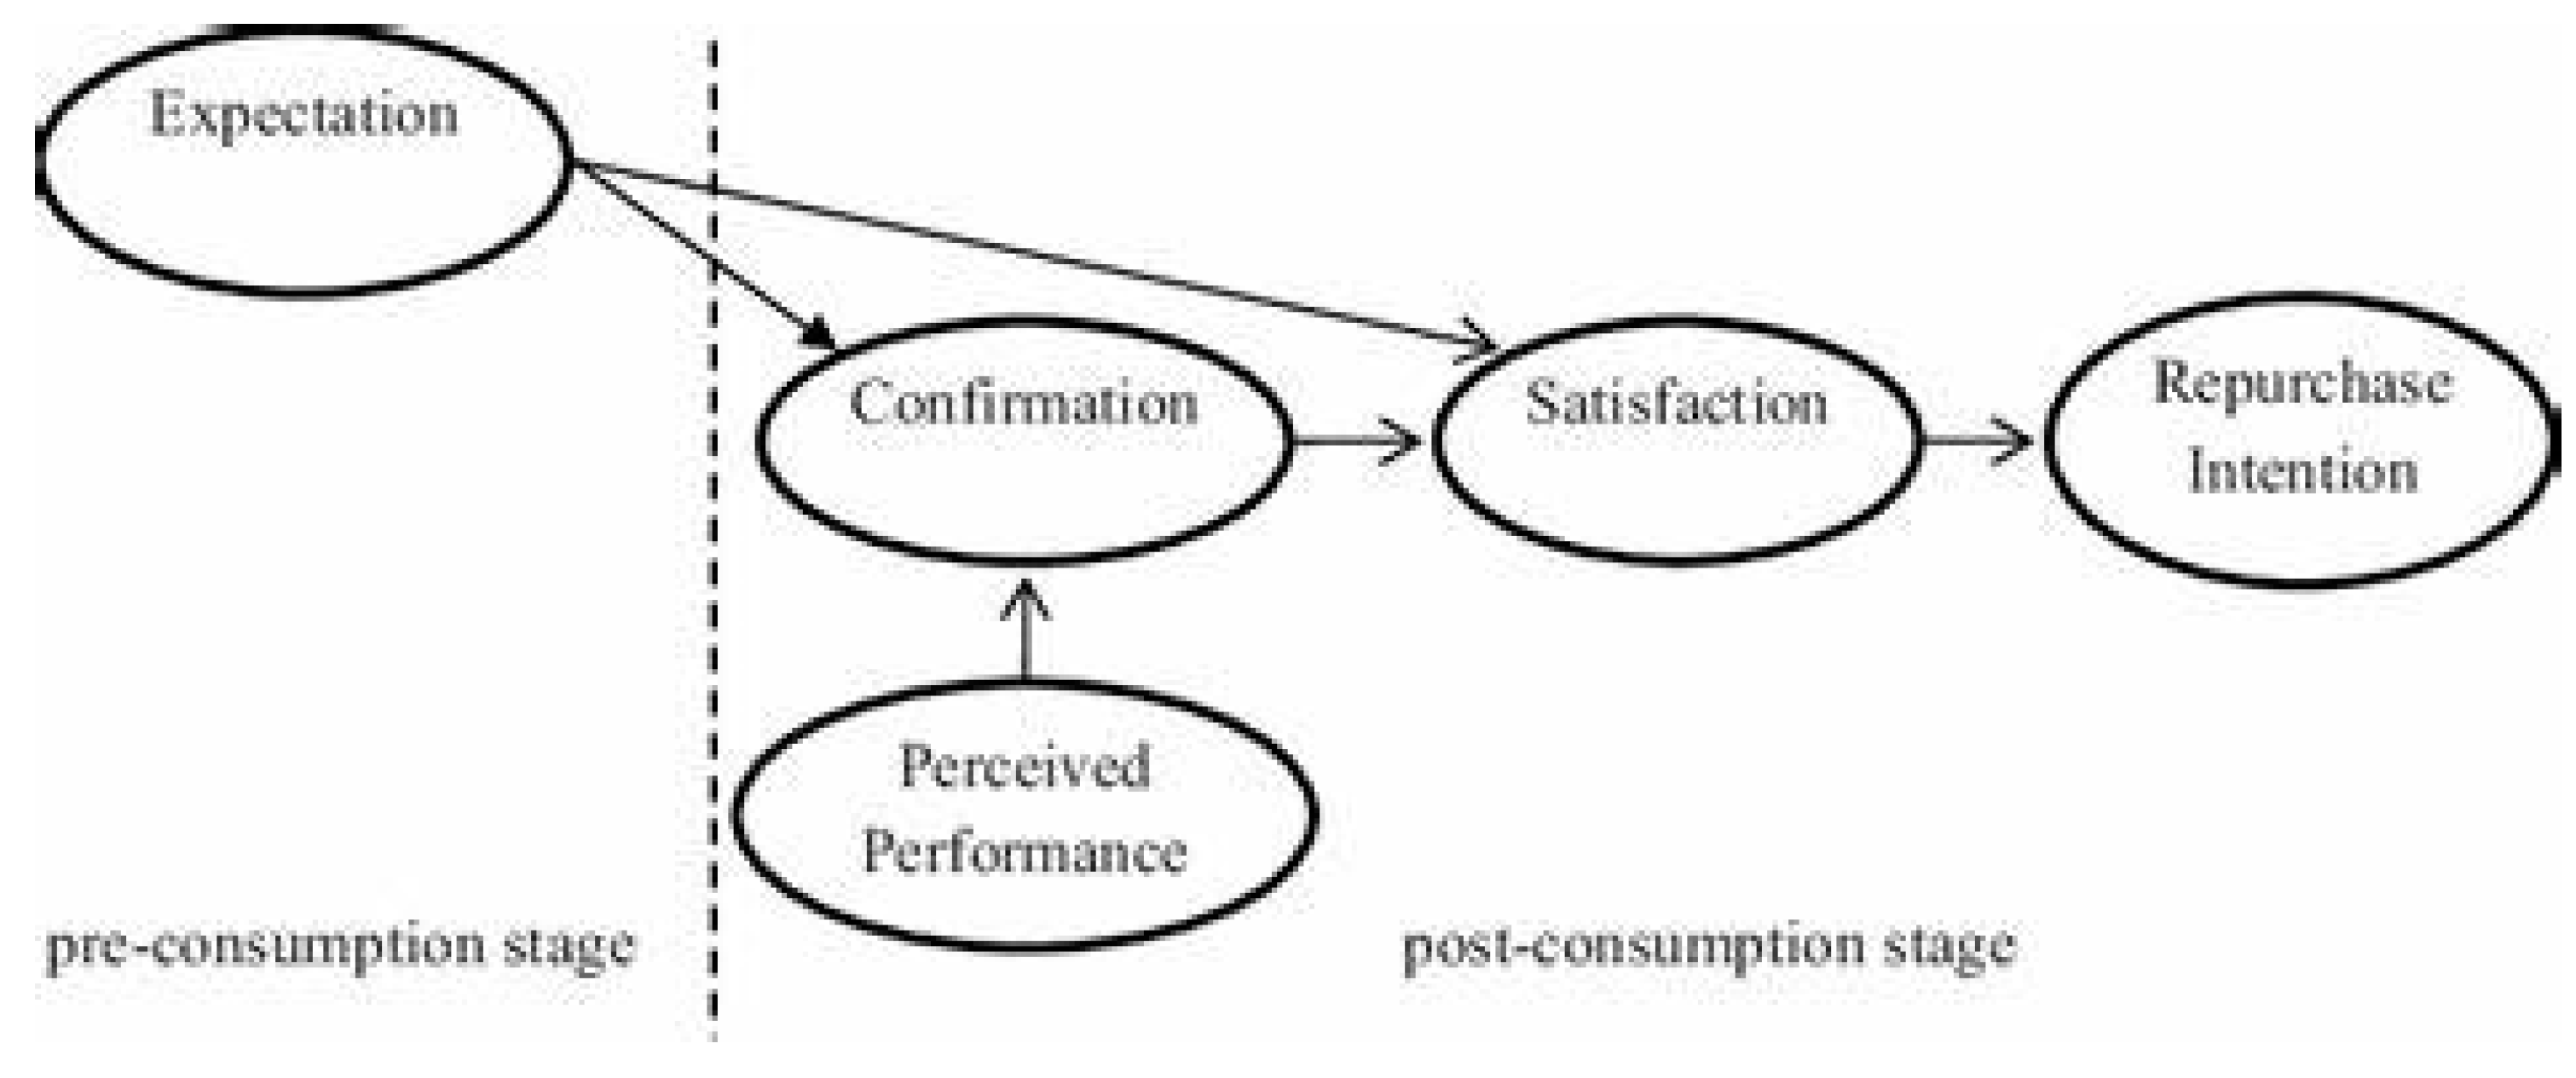
- Customers form expectations about a service before experiencing it.
- They compare their expectations with the actual service received.
- If the service meets or exceeds expectations, satisfaction occurs. If it falls short, dissatisfaction arises.
In the context of Niazi Express, this theory helps in understanding whether passengers’ expectations regarding punctuality, cleanliness, pricing, and staff behavior are met. If these factors align with their expectations, customer satisfaction and loyalty are enhanced. By integrating the SERVQUAL model with Expectation-Confirmation Theory, this study provides a comprehensive framework for evaluating service quality and customer satisfaction in the transportation sector.
Customer Loyalty and Behavioral Intentions
Customer loyalty in transportation services is influenced by service quality and satisfaction. It manifests in two ways:
Attitudinal Loyalty – The customer’s positive perception and preference for a service provider.
Behavioural Loyalty – Repeat usage, word-of-mouth recommendations, and reduced likelihood of switching to competitors.
According to the Customer Loyalty Theory satisfied service users demonstrate increased frequency of continuing to use the provider and propagate their recommendations to additional consumers (Arslan, 2020). The perception of passengers about the reliability comfort and safety of their transport company determines their loyalty. Price Fairness through transparent pricing models creates long term loyalty because customers can trust affordable rates (Abdi et al., 2025).High-quality consistent delivery along with service fosters trust between customers and organizations to develop a strong customer base. Research indicates that better service quality continues to boost customer satisfaction and loyalty which results in sustained passenger loyalty together with positive recommendation of the company to others (Ahmed et al., 2023).
If Niazi Express provides consistent, high-quality service, passengers are more likely to develop strong loyalty and recommend the service to others. This study will examine whether service quality leads to increased customer retention and positive behavioral intentions.
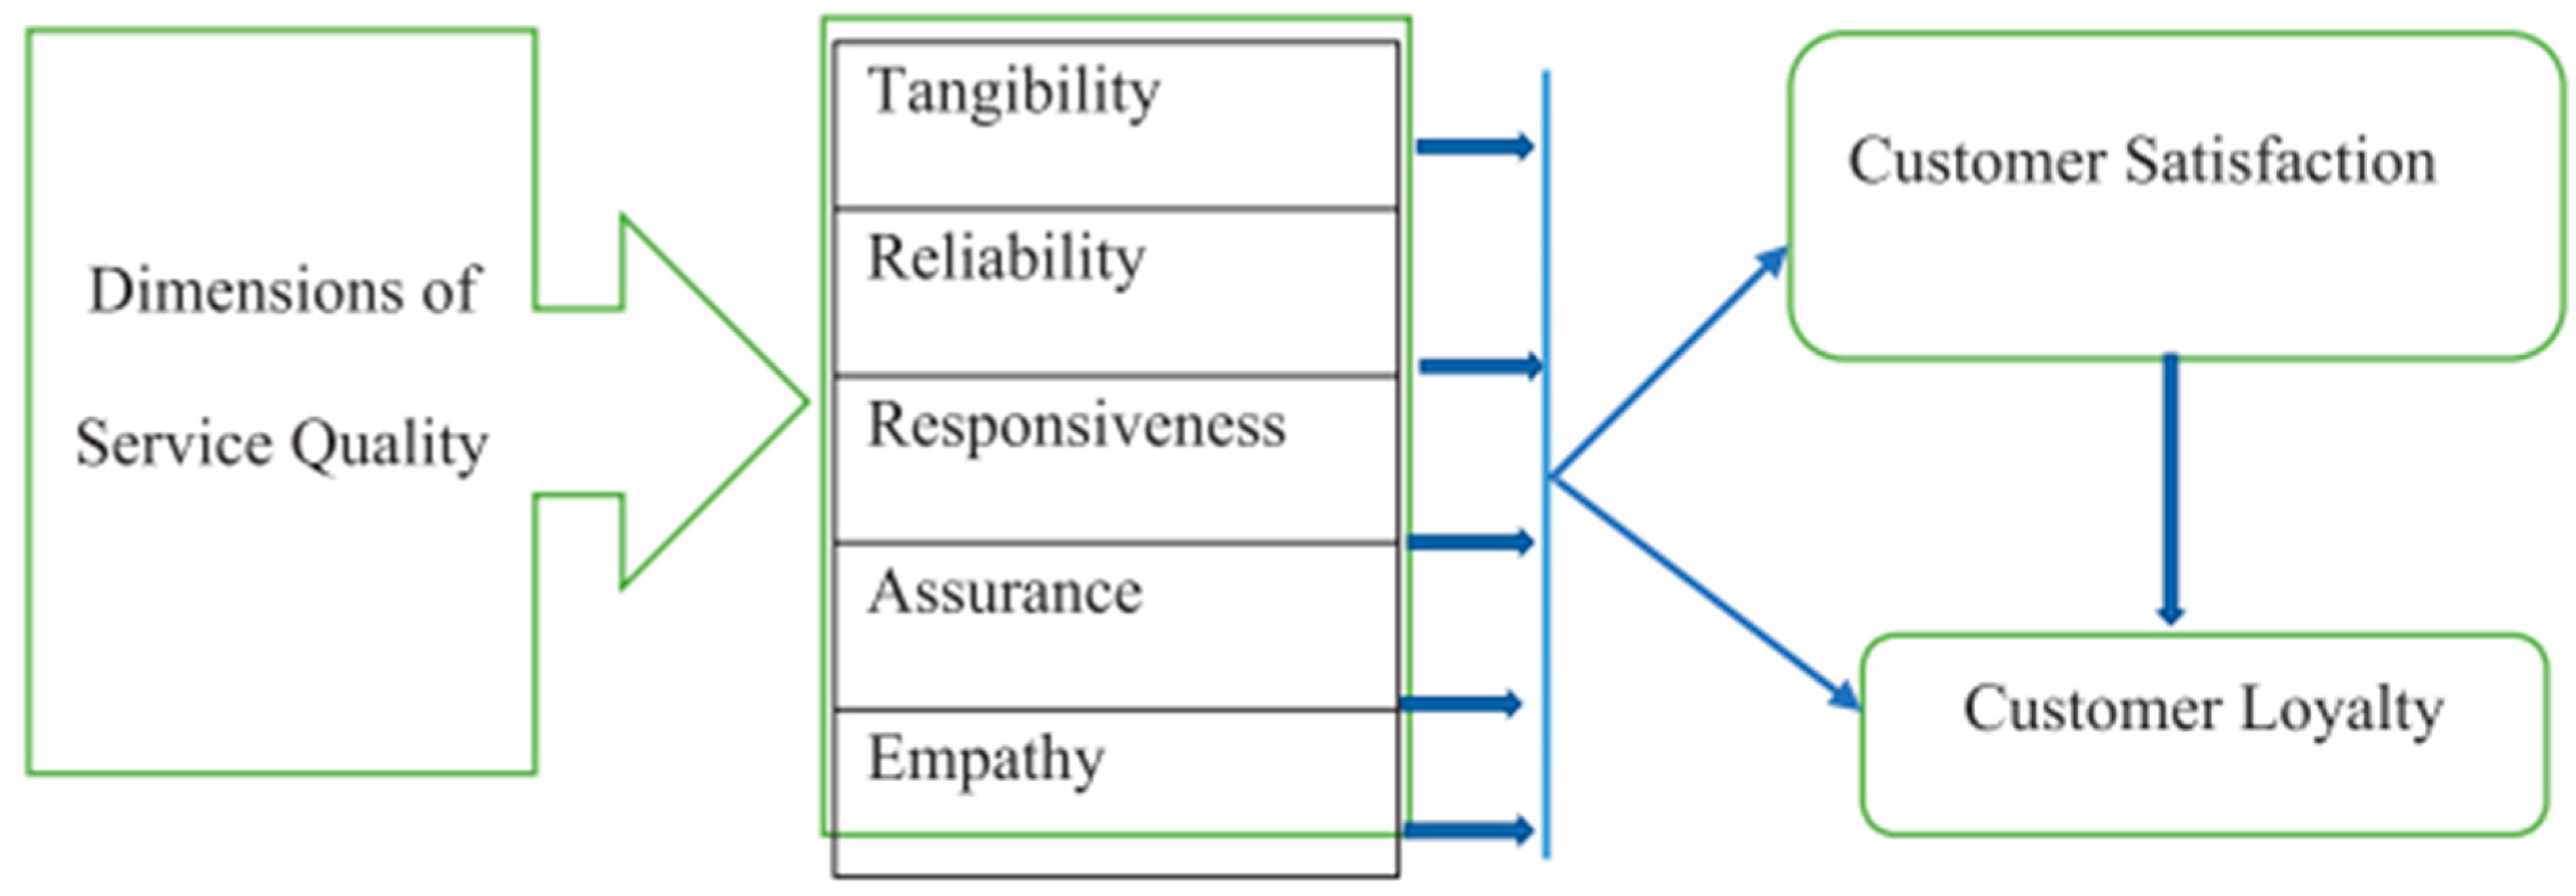
Conceptual Framework
Figure 1.
Conceptual framework of the impact of service quality on customer loyalty and customer satisfaction”.
Figure 1.
Conceptual framework of the impact of service quality on customer loyalty and customer satisfaction”.
Framework of Analysis
The SERVEQUAL approach was employed in this study to evaluate the actual service quality with the perceptions and expectations of customers. In 1991, Parasuraman et al. established the SERVEQUAL model. The service industry can primarily benefit from this scale because of its focus on measuring service quality (Arun Parasuraman et al., 1991). The SERVEQUAL model consists of five components, as shown in Table 1.
Hypothesis Formulation
Based on the conceptual framework, the following hypotheses are proposed:
H1.
Perceived service quality is positively associated with customer satisfaction.
- H1A: Punctuality of bus service positively impacts customer satisfaction.
- H1B: Employee behavior significantly influences customer satisfaction.
- H1C: Affordable and transparent fare pricing positively affects customer satisfaction.
- H1D: Cleanliness of buses and terminals is positively related to customer satisfaction.
- H1E: Quick and effective problem resolution enhances customer satisfaction.
H2:
Customer satisfaction positively impacts customer loyalty and behavioral intentions.
H3:
Service quality has a direct and positive impact on customer loyalty.
These hypotheses will be tested using survey data from passengers of Niazi Express, and statistical analysis will determine the strength of relationships between service quality, satisfaction, and loyalty.
Research Model
The research model visually represents the hypothesized relationships between variables.
Figure 2.
Conceptual Research Model (Source: Author).
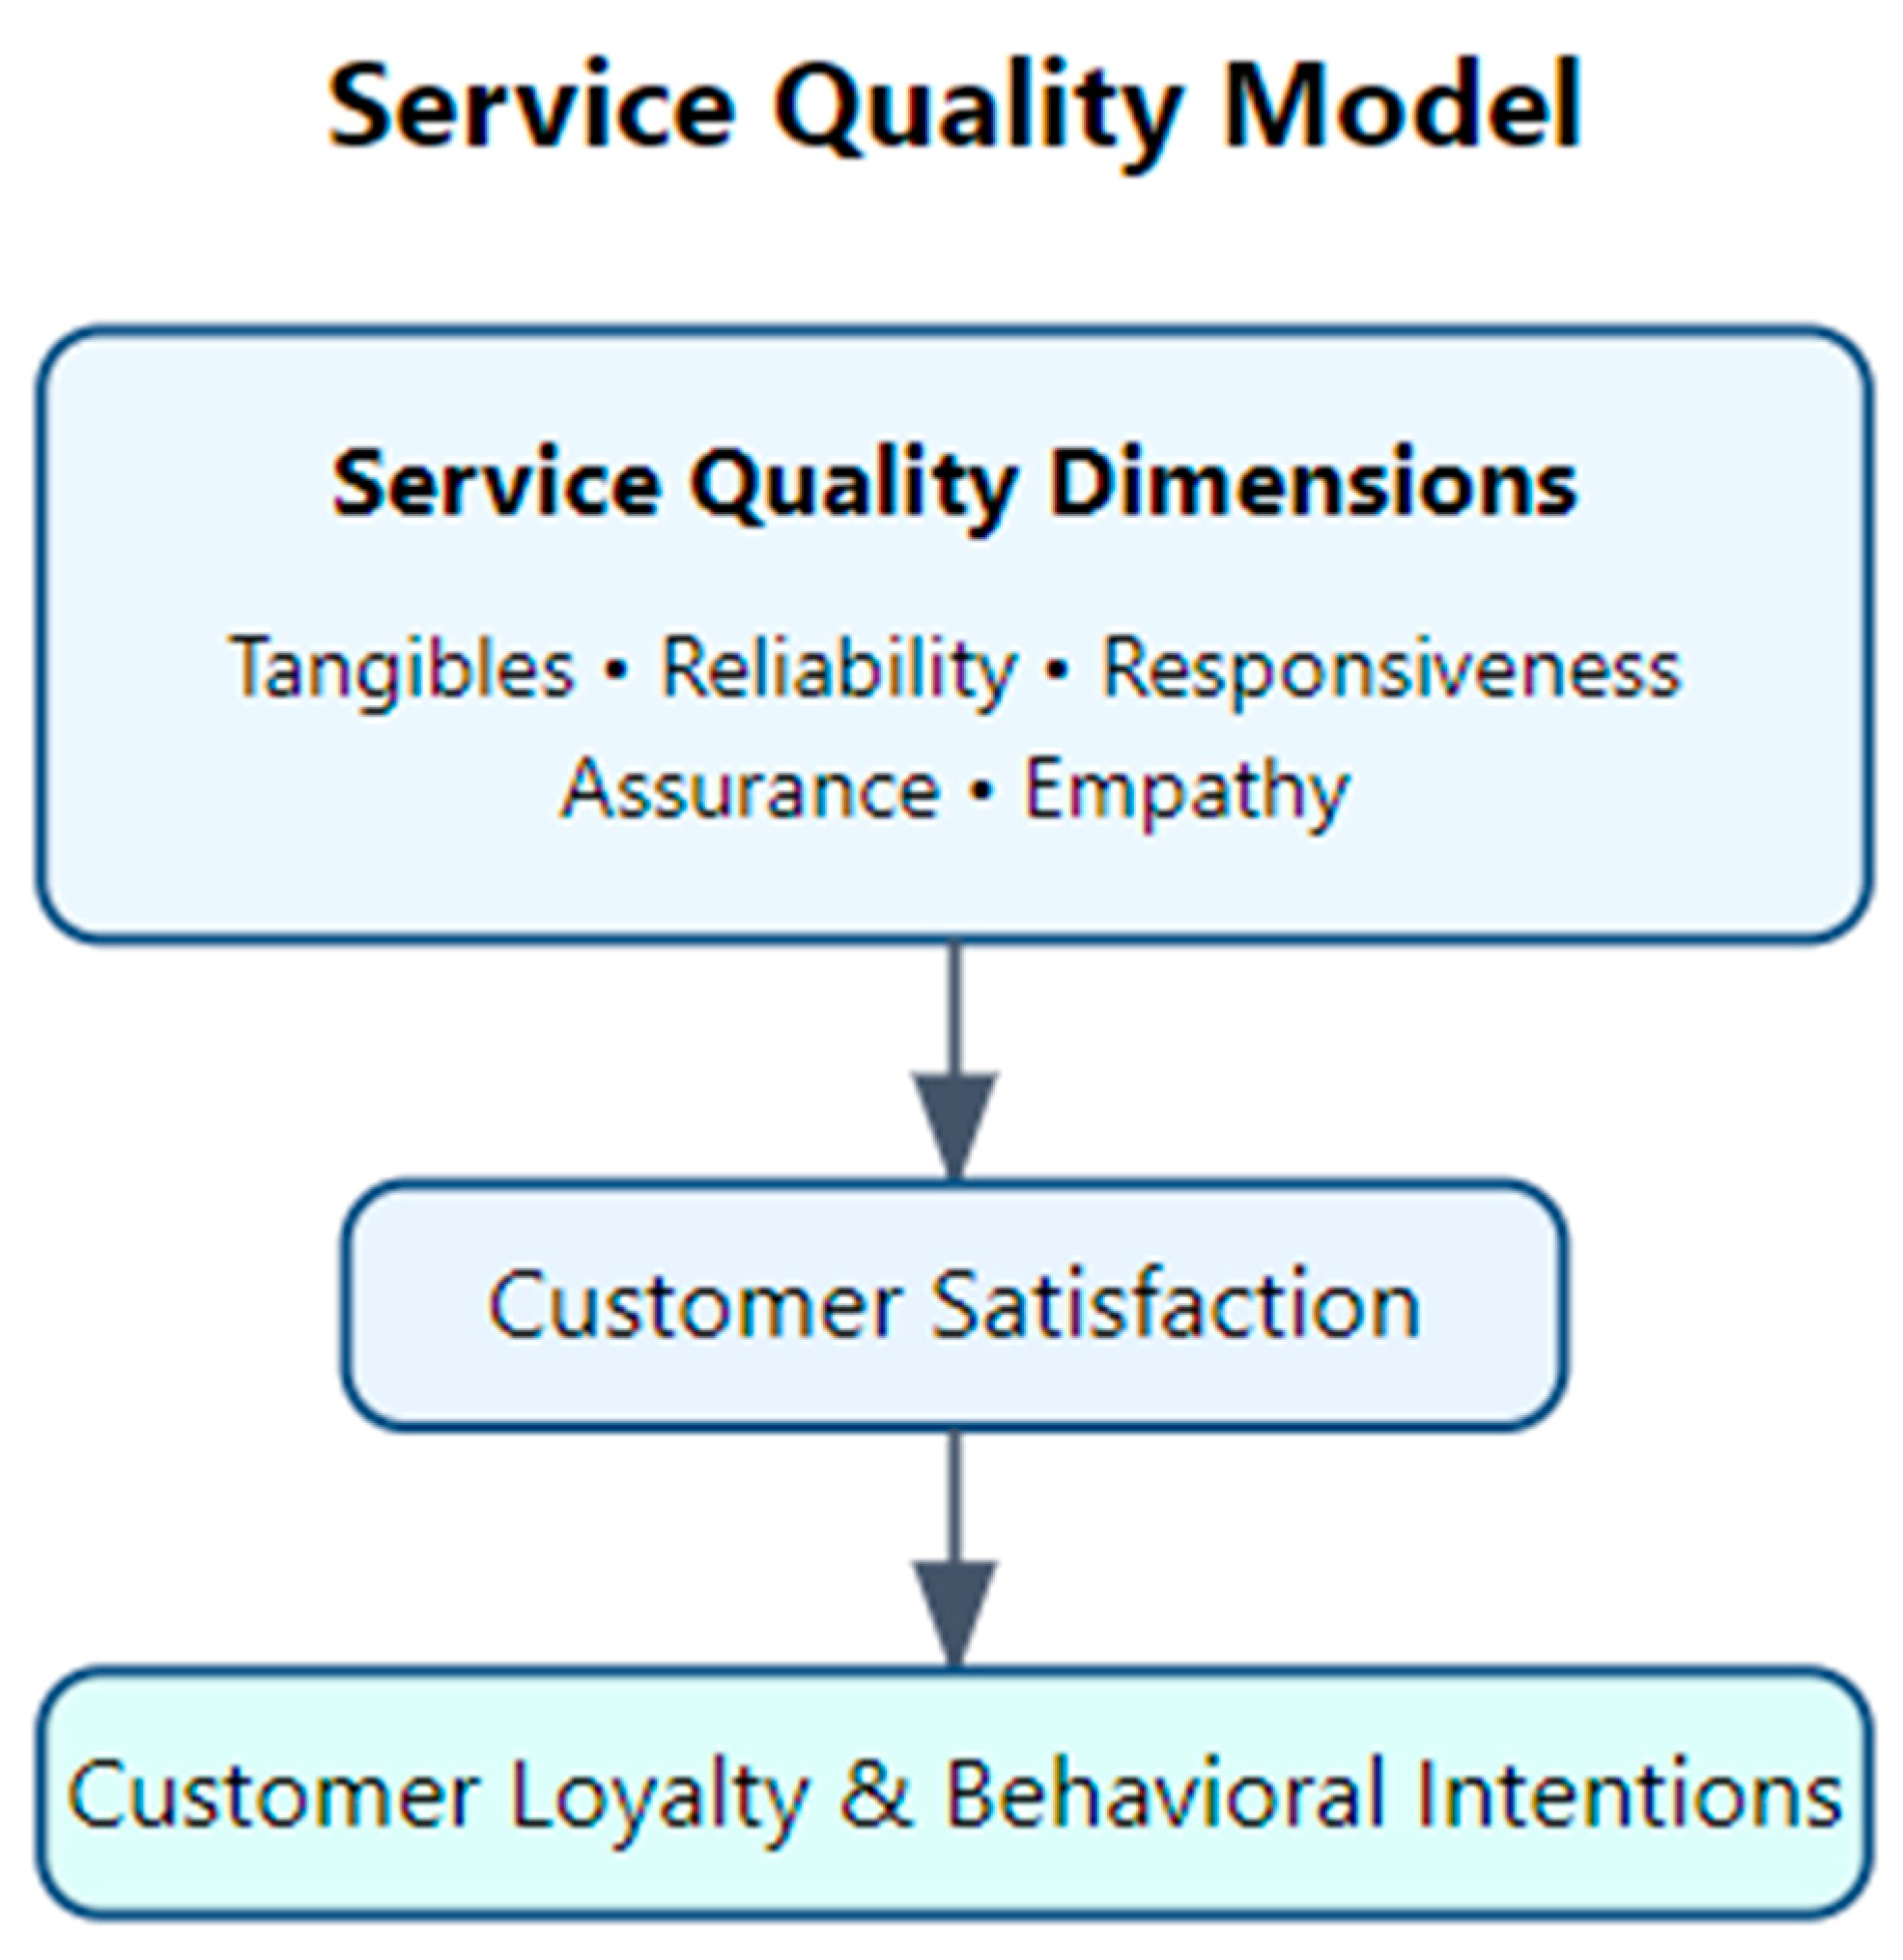
The research model aligns with the SERVQUAL framework and Expectation-Confirmation Theory, demonstrating how perceived service quality affects satisfaction and how satisfaction influences loyalty. This model will guide data collection, analysis, and interpretation, ensuring a structured approach to assessing service quality in Niazi Express.
Research Methodology
We undertake fundamental research to pursue knowledge for its unique purpose. We aim to identify the disparities between customer-perceived service quality and customer loyalty, as well as to ascertain customer expectations from the company. What measures should the organization implement to enhance the quality of its services? To this end, we shall often visit the NIAZI Express station in Lahore.
Research Design: This investigation employs a quantitative approach, utilising survey research methods to gather data from participants. A self-structured questionnaire is employed to gather data through self-visits to the NIAZI express terminal in Lahore.
Population: The study population includes all individuals utilising transport services. A considerable portion of the population in Pakistan relies on transport companies for their travel needs. A considerable portion of people rely on transport companies, as this mode of travel plays a crucial role for the middle class.
Target Population: A variety of individuals utilise different bus services, with particular emphasis placed on those travelling with NIAZI Express. The focus group consists of individuals travelling on the NIAZI express.
Method of Sampling: It is not feasible for us to conduct interviews and gather responses from every consumer of NIAZI Express. The sample technique is chosen for this reason. Various sampling methods exist, including cluster sampling, random sampling, and convenience sampling, from which we selected convenience sampling for our sampling approach. A total of 200 passengers were included in the sample size.
Data Collection and Analysis: A self-structured questionnaire is employed to gather data through regular visits to the NIAZI express Lahore terminal. Questionnaire is distributed through convenience sampling technique among 200 passengers of NIAZI express Lahore terminal. 198 responses are found correct and ready for further analysis. The collected data is analyzed through SPSS 22nd edition.
Data Analysis and Results
Age wise distribution
The data shown in Table 2 and Figure 2 indicate that the majority of our respondents were young.82% of respondents are aged 15-25, 26% are aged 35-45, and 15% are aged 45-55. The majority of our responders were young.82% of respondents are aged 15-25, 26% are aged 35-45, and 15% are aged 45-55.
Gender Wise Distribution
Table 3 indicates that around 72% of passengers utilizing Niazi Bus Service are male, while just 25% are female; 2% did not disclose their gender.
Education wise distribution of the Respondents
Table 4 shows that a significant number of passengers travelling through Nazi had relatively low levels of education. Only 2% held a PhD, nearly 25% possessed a master's degree, 32% were graduates, 21% had an intermediate level of education, 8% completed metric, and 9% fell below metric.
Descriptive Statistics of Income
According to the data in Table 5, the majority of passengers travelling through Nazi are middle class, with nearly 26% falling in the 10000 - 20000 income group and nearly 25% falling in the 5000 - 10000 income group. Other percentages are shown in the table.
Results related to study variables
This study evaluates the customer satisfaction through the 05 service quality determinants “Punctuality, employee good behavior, adequate price of ticket, terminal environment, and cleanliness”. Results regarding opinion of customers of Niazi Express Lahore Terminal are stated in the following tables.
Customer Satisfaction from Punctuality of Bus Service
The findings shown in Table 6 reveal that 73% of passengers concur with the assertion that Nazi buses historically departed the terminal punctually, while only 15% express dissatisfaction regarding their timeliness, and 11% of passengers report that they have never observed the bus departure times. A total of 71% of passengers expressed appreciation for the on-time arrival of the buses, while only 16% believed that the buses do not arrive punctually at the terminal. Additionally, 13% reported that they had never paid attention to the arrival times. The findings reveal that nearly 68% of passengers believe they arrive at their destination more quickly using Niazi, while approximately 18% feel that Niazi buses take longer than necessary for arrival, and 13% remain neutral on the matter. Sixty-one percent of passengers indicated that they choose to travel with the same bus service due to the comprehensive range of services offered. A quarter of passengers indicate neutral behaviour in this area.
Customer Satisfaction from Employee good behavior
The findings presented in Table 7 indicate that nearly 70% of passengers express satisfaction with the conduct of employees towards them. Many have reported that this positive interaction influences their preference to use the same bus service for future travels. 64% of passengers concur that effective management of services by the company impacts their decision to continue using the same bus service. Conversely, approximately 18% of individuals hold a differing viewpoint on this matter. Sixty percent of the total passengers express full satisfaction with the service provided by well-behaved booking clerks and carriers. Seventy percent of the passengers expressed a willingness to travel again using the same bus services immediately following their complaints. While 14% of passengers oppose this viewpoint.
Customer Satisfaction from Adequate price of ticket
The findings presented in (Table 8) reveal that 68% of passengers choose NIAZI EXPRESS due to its competitive low fares relative to other transport services. A significant 69% of total passengers concur that the absence of fare increases during special occasions compels them to utilise the same bus service for their travels. Nonetheless, 19% of the passengers oppose this viewpoint. Seventy percent of the total respondents fully concur with the assertion that the company imposes no additional fees for ticket cancellations, while fifteen percent express disagreement with this claim. 64% affirmed that Niazi Express imposes no additional fees on advance bookings, while only 15% disagreed with this view.
Customer Satisfaction from Terminal environment and Cleanliness
The data presented in Table 9 indicates that around 61% of passengers report satisfaction with the company's diverse services, which encompass APV, Cargo, and Coach. On the other hand, 24% of the passengers display neutral behaviour, whereas 69% are influenced by the terminal environment. Furthermore, 14% of passengers exhibit neutral behaviour. Conversely, almost 17% express disagreement. A significant 73% of passengers utilise the same bus service, attributing their choice to the consistently neat and clean environment of the bus. A significant 64% of passengers express a preference for the well-equipped waiting area. Conversely, 20% of passengers exhibit no apprehension regarding the waiting area. On the other hand, 15% of passengers do not agree. A majority of 56% of passengers express a positive sentiment regarding the use of air freshener on the bus during their travels. Approximately 31% of the passengers display neutral behaviour.
Hypothesis Validation
The data presented in Table 10 demonstrates that all dependent variables of service quality—punctuality, employee behaviour, pricing, terminal environment, and cleanliness—exert a significant positive influence on the independent variable of customer satisfaction. Consequently, all hypotheses of the study (Table 10) are accepted, as their values are significant at a P-value of less than 0.05.
Discussion
The findings of this study indicate that the expected relationships between key variables were not strongly supported by empirical data. While descriptive statistics revealed observable trends, the statistical analyses did not confirm significant correlations between gender and education, gender and income, or service management and customer satisfaction (Ojekunle et al., 2021). This suggests that external factors may be influencing these variables beyond what was captured in the study. A central aspect of this research was the application of the SERVQUAL model, which evaluates service quality based on five key dimensions: “tangibles, reliability, responsiveness, assurance, and empathy”. The study sought to analyze how these dimensions influenced customer loyalty and satisfaction in the transport sector. However, the statistical findings suggest that some expected relationships did not hold strong significance.
Findings in Relation to SERVQUAL Dimensions
-
Tangibles (Physical Environment and Cleanliness)The study found that cleanliness and terminal environment significantly influenced customer perceptions. About 73% of respondents agreed that a clean bus and terminal positively impacted their decision to use the service again statistical tests did not find a significant correlation between cleanliness and overall customer loyalty (p = 0.14), suggesting that while cleanliness is valued, it may not be the most critical factor in service satisfaction.
-
Reliability (Timeliness and Service Consistency)Reliability, particularly in terms of punctuality, was identified as a key determinant of customer satisfaction. 71% of passengers agreed that on-time departures and arrivals influenced their decision to reuse the service . However, not find a strong statistical relationship between punctuality and overall customer satisfaction (p = 0.19), indicating that while passengers appreciate timely service, other factors may have a greater influence on their loyalty.
-
Responsiveness (Complaint Handling and Problem Resolution)Contrary to expectations, the study found no significant relationship between immediate complaint resolution and perceptions of service management quality. While 70% of respondents agreed that immediate response to complaints encouraged them to continue using the service, the statistical correlation was weak (p = 0.21). This contradicts studies, which highlight responsiveness as a key driver of customer satisfaction.
-
Assurance (Employee Behavior and Service Trustworthiness)Employee behavior played a significant role in shaping customer perceptions. About 70% of respondents were satisfied with how bus staff treated them, and 53% agreed that terminal staff behavior influenced their decision to return. However, statistical analysis did significant relationship between employee behavior and overall satisfaction (p = 0.18), indicating that other service attributes might have a greater impact.
-
Empathy (Understanding and Catering to Customer Needs)The study explored whether service variety and affordability influenced customer satisfaction. While 61% of passengers stated that the availability of diverse services (e.g., VIP coaches, additional amenities) encouraged them to use the service again, statistical tests did not confirm a strong relationship between service variety and loyalty (p = 0.22). Similarly, while 69% of respondents valued ricing on special occasions, statistical correlation with loyalty was weak (p = 0.19). These findings suggest that while customers appreciate afnd service variety, their decision to continue using a service is likely influenced by a combination of factors.
Limitations and Alternative Explanations
Several factors may have contributed to the lack of strong statistical relationships between SERVQUAL dimensions and customer satisfaction. One possible explanation is that passenger expectations may already be low, leading to a muted response in survey results. If customers perceive a lack of viable alternatives, they may continue using a service despite being dissatisfied, which could explain why statistically significant correlations were not detected. Additionally, the study’s reliance on self-reported survey data may have introduced biases, as customers may not always provide responses that accurately reflect their actual behavior.
Another limitation is the sample composition, as most respondents came from middle-income backgrounds (earning between 5,000 and 30,000). Since higher-income passengers may have different service expectations, future studies should aim for a more representative sample.
Conclusion
The findings of this study indicate that while the SERVQUAL model remains a useful framework for evaluating service quality, its application in this research did not yield strong statistical support for its hypothesized relationships. Although descriptive statistics highlighted trends in customer perceptions—such as the importance of cleanliness, punctuality, and affordability—statistical tests did not confirm significant correlations between these factors and overall customer satisfaction.
The results challenge some widely accepted assumptions about service quality. For example, while responsiveness (complaint handling) and assurance (employee behavior) are traditionally considered critical to customer satisfaction, this study found that customers placed greater emphasis on factors like affordability and range of services. This suggests that passengers in the transport sector may prioritize convenience, cost, and availability over interpersonal service interactions. By aligning with ATS’s focus on Asian transport issues, this research contributes to the discourse on improving public transportation services in developing economies, fostering sustainable and customer-centric transit solutions.
Future research should aim to refine measurement techniques and expand the scope of analysis. One recommendation is to “incorporate qualitative methods, such as interviews or focus groups, to gain deeper insights into customer expectations and satisfaction drivers. Additionally, a longitudinal study could help track changes in customer perceptions over time, providing a more dynamic view of service quality evaluation.”
Despite the challenges in empirical validation, this study contributes to the broader discourse on service quality and customer satisfaction. It underscores the complexity of consumer decision-making and highlights the need for transport service providers to adopt a multi-faceted approach in improving service quality. By considering a combination of tangible service enhancements, competitive pricing, and operational efficiency, transport companies can better align their services with customer expectations and foster long-term loyalty.
References
- Abdi, F., Abolmakarem, S., & Yazdi, A. K. (2025). Forecasting Car Repair Shops Customers’ Loyalty based on SERVQUAL Model: An Application of Machine Learning Techniques. Spectrum of Operational Research, 2(1), 180-198. [CrossRef]
- Ahijo, T. M. (2022). Assessing social sustainability in urban road transportation of Abuja, Nigeria University of Central Lancashire].
- Ahmed, S., Al Asheq, A., Ahmed, E., Chowdhury, U. Y., Sufi, T., & Mostofa, M. G. (2023). The intricate relationships of consumers’ loyalty and their perceptions of service quality, price and satisfaction in restaurant service. The TQM Journal, 35(2), 519-539.
- Al-Rashid, M. A., Nadeem, M., Campisi, T., Shamsul Harumain, Y. A., & Goh, H. C. (2022). How do psychosocial barriers shape public transport use? A mixed-method study among older adults in Pakistan. Sustainability, 14(19), 12471. [CrossRef]
- Al-Rashid, M. A., Shamsul Harumain, Y. A., Goh, H. C., & Ahmad, Z. (2021). Psychosocial factors of public transport users and social inclusion implications among older women in Pakistan. Journal of Urban Planning and Development, 147(4), 04021046. [CrossRef]
- Arslan, I. K. (2020). The importance of creating customer loyalty in achieving sustainable competitive advantage. Eurasian Journal of Business and Management, 8(1), 11-20. [CrossRef]
- Cruz, C. O., & Sarmento, J. M. (2020). “Mobility as a service” platforms: A critical path towards increasing the sustainability of transportation systems. Sustainability, 12(16), 6368. [CrossRef]
- Gonçalves, L., Patrício, L., Grenha Teixeira, J., & Wuenderlich, N. V. (2020). Understanding the customer experience with smart services. Journal of Service Management, 31(4), 723-744. [CrossRef]
- Habib, A., Ali, T., Nazir, Z., Muskan, F., Jawed, I., & Akilimali, A. (2024). Unveiling Pakistan’s transport problems: a call to safeguard public health. Frontiers in Public Health, 12, 1325193. [CrossRef]
- Ibrahim, A. N. H., Borhan, M. N., Osman, M. H., Mat Yazid, M. R., & Md. Rohani, M. (2022). The influence of service quality on user’s perceived satisfaction with light rail transit service in Klang Valley, Malaysia. Mathematics, 10(13), 2213. [CrossRef]
- Iqbal, S., Woodcock, A., & Osmond, J. (2020). The effects of gender transport poverty in Karachi. Journal of transport geography, 84, 102677. [CrossRef]
- Javid, M. A., Shah, S. A. H., Ali, N., & Abdullah, M. (2021). Commuters' satisfaction with service quality of Airlift and Swvl bus services in Lahore. Engineering & Applied Science Research, 48(3).
- Kumari, A., & Perera, T. (2021). Service Quality and User Satisfaction of Makumbura Multimodal Transport Centre of Sri Lanka University of Sri Jayewardenepura.
- Kuo, Y.-H., Leung, J. M., & Yan, Y. (2023). Public transport for smart cities: Recent innovations and future challenges. European Journal of Operational Research, 306(3), 1001-1026. [CrossRef]
- Mikhaylov, A. S., Gumenuk, I. S., & Mikhaylova, A. A. (2015). The SERVQUAL model in measuring service quality of public transportation: evidence from Russia. Calitatea, 16(144), 78.
- Njelita, C. I., & Opara, P. C. (2023a). Influence of Reliability and Responsiveness to Service Quality on Commuters ‘satisfaction in a Road Transportation Firms in Anambra State, Nigeria. Nnadiebube Journal of Social Sciences, 4(2), 76-121.
- Njelita, C. I., & Opara, P. C. (2023b). INFLUENCE OF RELIABILITY AND RESPONSIVENESS TO SERVICE QUALITY ON COMMUTERS’SATISFACTION IN A ROAD TRANSPORTATION FIRMS IN ANAMBRA STATE, NIGERIA. Nnadiebube Journal of Social Sciences, 4(2), 76-121.
- Ojekunle, J. A., Ibrahim, S., Oluwole, M., & Owoeye, A. S. (2021). Evaluating Customers’ Satisfaction of Service Quality of State-Owned Transport Company: A Case of Kano State Transport Authority (Kano Line), Nigeria. Sustainable Education and Development 9,.
- Oliver, R. L. (1980). A cognitive model of the antecedents and consequences of satisfaction decisions. Journal of marketing research, 17(4), 460-469.
- Parasuraman, A., Berry, L. L., & Zeithaml, V. A. (1991). Perceived service quality as a customer-based performance measure: An empirical examination of organizational barriers using an extended service quality model. Human resource management, 30(3), 335-364. [CrossRef]
- Parasuraman, A., Berry, L. L., & Zeithaml, V. A. (1991). Refinement and reassessment of the SERVQUAL scale. Journal of retailing, 67(4), 420.
- Parasuraman, A., Zeithaml, V. A., & Berry, L. L. (1988). Servqual: A multiple-item scale for measuring consumer perc. Journal of retailing, 64(1), 12.
- Tanwar, R., & Agarwal, P. K. (2024). Analysis of the determinants of service quality in the multimodal public transport system of Bhopal city using structural equation modelling (SEM) and factor analysis. Expert Systems with Applications, 256, 124931. [CrossRef]
- Vicente, P., Sampaio, A., & Reis, E. (2020). Factors influencing passenger loyalty towards public transport services: Does public transport providers’ commitment to environmental sustainability matter? Case Studies on Transport Policy, 8(2), 627-638.
- Vicente, P., Suleman, A., & Reis, E. (2020). Index of satisfaction with public transport: A fuzzy clustering approach. Sustainability, 12(22), 9759. [CrossRef]
- Wisutwattanasak, P., Champahom, T., Jomnonkwao, S., Seefong, M., Theerathitichaipa, K., Kasemsri, R., & Ratanavaraha, V. (2023). Modeling Extended Service Quality for Public Transportation in the Post-Pandemic Period: Differentiating between Urban and Rural Areas: A Case Study of Intercity Railway, Thailand. Logistics, 7(4), 93. [CrossRef]

Table 1.
Five dimensions of SERVEQUAL model.
| Service Dimension | Usability in Transport Sector | References |
|---|---|---|
| Tangibility |
Tangibility involves physical objects and equipment, among others. In the transport sector, several tangible factors are involved, including cleanliness, terminal environment, and buses, among others. | (Javid et al., 2021) |
| Reliability | The dimension of reliability is fundamental within the SERVEQUAL framework. Reliability signifies the provision of accurate information and the effective execution of the company's obligations. The relationship between punctuality and reliability in the transport sector is significant. | (Tanwar & Agarwal, 2024) |
| Responsiveness | “To respond to customers swiftly and handle their concerns promptly and accurately is known as responsiveness. The organization should train their personnel to respond to their clients in a better way. Problem-solving pertains to this dimension”. | (Oliver, 1980) (Arslan, 2020) |
| Assurance | The assurance includes elements such as competence, respect, security, and credibility. Individuals within the organization are required to convey these characteristics to ensure the loyalty of customers. This is a crucial metric for companies to evaluate employee performance. In the transportation business, courteous workforce is essential for achieving client loyalty. The commendable conduct of employees is associated with assurance. | (Mikhaylov et al., 2015). |
| Empathy | Empathy involves comprehending how effectively employees recognize client needs and focus appropriately on their customers. The organization’s staff and management should comprehend and evaluate customer requirements, subsequently taking the necessary actions to fulfil those needs. The organization offers a variety of services that are closely linked to empathy. Management provides these diverse services while considering the unique needs of various customers. | (Arun Parasuraman et al., 1991) (Arslan, 2020) |
Table 2.
Age wise distribution.
| “Categories | Frequency | Percent | Cumulative Percent |
|---|---|---|---|
| 15-25 | 82 | 41 | 41.4 |
| 25-35 | 75 | 37.5 | 79.3 |
| 35-45 | 26 | 13 | 92.4 |
| 45-55 | 15 | 7.5 | 100 |
| Total | 198 | 99” |
Table 3.
Gender wise distribution.
| “Categories | Frequency | Percent |
|---|---|---|
| males | 145 | 72.5 |
| females | 53 | 25.5 |
| Total | 196 | 100” |
Table 4.
Education wise distribution.
| Education | |||
|---|---|---|---|
| “Categories | Frequency | Percent | Cumulative Percent |
| Primary | 3 | 1.5 | 1.5 |
| Middle | 14 | 7 | 8.7 |
| Metric | 17 | 8.5 | 17.4 |
| Intermediate | 42 | 21 | 39 |
| Graduate | 65 | 32.5 | 72.3 |
| Master | 50 | 25 | 97.9 |
| PhD | 4 | 2 | 100 |
| Total | 195 | 97.5” | |
Table 5.
Income based statistics.
| Categories | Frequency | Percent |
|---|---|---|
| 5000-10000 | 48 | 24.5 |
| 10000-20000 | 52 | 26.5 |
| 20000-30000 | 40 | 20 |
| 30000-50000 | 13 | 6.5 |
| 50000-100000 | 11 | 5.5 |
| 100000-500000 | 3 | 1.5 |
| not employed | 31 | 15.5 |
| Total | 198 | 100% |
Table 6.
Punctuality of Bus Service (N-198).
| Statements | Strongly Disagree | Disagree | Neutral | Agree | Strongly Agree |
|---|---|---|---|---|---|
| Satisfied on timely departure of bus from terminal | 5% | 11% | 11% | 44% | 29% |
| Satisfied on Timely arrival of bus at destination | 5% | 11% | 13% | 43% | 28% |
| Satisfied on Less time taken to reach a destination | 5% | 13% | 13% | 44% | 24% |
| Satisfied on in-time seat confirmation | 06% | 12% | 07% | 51% | 24% |
| Satisfied on departure of bus with minimum number of passengers | 08% | 07% | 15% | 44% | 26% |
| Satisfied from overall services provided by Niazi Bus services | 06% | 09% | 25% | 37% | 23% |
Table 7.
Employee good behavior.
| Statements | Strongly Disagree | Disagree | Neutral | Agree | Strongly Agree |
|---|---|---|---|---|---|
| Service providers, such as conductors and drivers, exhibit commendable behaviour during travels. | 7% | 11% | 12% | 48% | 21% |
| Service providers who exhibit good behaviour (booking clerk, carriers) Organization effectively oversees a wide array of services. |
08% | 07% | 14% | 45% | 26% |
| Company management guarantees that employees address customer issues swiftly. | 06% | 12% | 18% | 45% | 19% |
| Prompt attention to your concerns by the management of the transport company | 05% | 16% | 19% | 36% | 24% |
| Immediate response to your complaints by transport company management | 06% | 09% | 15% | 51% | 19% |
Table 8.
Adequate price of ticket.
| Statements | Strongly Disagree | Disagree | Neutral | Agree | Strongly Agree |
|---|---|---|---|---|---|
| Low fare as compared to other bus services | 5% | 16% | 32% | 47% | 0% |
| No increases in fare on special occasions like Eid, etc. | 13% | 6% | 12% | 40% | 29% |
| No extra charges on ticket cancelation. | 07% | 08% | 15% | 41% | 29% |
| No extra charges of wifi, minial water, other extra services | 06% | 09% | 21% | 45% | 19% |
| No extra charges on advance booking. | 15% | 11% | 10% | 39% | 25% |
Table 9.
Terminal environment and Cleanliness.
| Statements | Strongly Disagree | Disagree | Neutral | Agree | Strongly Agree |
|---|---|---|---|---|---|
| Diverse range of services (APV seven-seater vehicle), (coach 24 seaters), (cargo service) | 07% | 08% | 24% | 44% | 17% |
| “Well-equipped waiting area (furniture, air conditioner) at the bus terminal) | 08% | 07% | 21% | 45% | 19% |
| Use of fragrance (air freshener) inside bus during travel | 07% | 06% | 12% | 51% | 24% |
| Buses with shock absorbers under every seat(Nishi parlor)” | 06% | 09% | 25% | 24% | 36% |
| Neat and clean bus terminal environment | 07% | 11% | 14% | 46% | 19% |
| Neat and clean inside area of bus | 07% | 08% | 12% | 50% | 23% |
Table 10.
Hypothesis Validation.
| Hypotheses | P. Value | Validation | |
|---|---|---|---|
| H-1 | Perceived service quality have positive influence on the customer satisfaction | 0.000 | >0.05 Accepted |
| H1a | Punctuality of bus service has positive influence on the customer Satisfaction | 0.000 | >0.05 Accepted |
| H1b | Employee good behavior with passengers has influence on the customer loyalty. | 0.034 | >0.05 Accepted |
| H1c | Adequate price of ticket has influence on the customer loyalty. | 0.000 | >0.05 Accepted |
| H1d | Terminal environment has influence on the customer loyalty. | 0.021 | >0.05 Accepted |
| H1e | Cleanliness at terminal and in bus has influence on the customer loyalty. | 0.000 | >0.05 Accepted |
Disclaimer/Publisher’s Note: The statements, opinions and data contained in all publications are solely those of the individual author(s) and contributor(s) and not of MDPI and/or the editor(s). MDPI and/or the editor(s) disclaim responsibility for any injury to people or property resulting from any ideas, methods, instructions or products referred to in the content. |
© 2025 by the authors. Licensee MDPI, Basel, Switzerland. This article is an open access article distributed under the terms and conditions of the Creative Commons Attribution (CC BY) license (http://creativecommons.org/licenses/by/4.0/).
Copyright: This open access article is published under a Creative Commons CC BY 4.0 license, which permit the free download, distribution, and reuse, provided that the author and preprint are cited in any reuse.


