
Submitted:
06 February 2025
Posted:
07 February 2025
You are already at the latest version
Abstract
Fecal microbiota transplantation (FMT) is the most effective therapy for preventing recurrent Clostridioides difficile infection (rCDI). However, the impact of FMT formulations and storage conditions on bacterial viability, community structure, functionality, and clinical efficacy remains under-investigated. We studied the effect of different storage conditions on bacterial viability (live/dead staining and cell sorting), community structure (16S rDNA analysis), and metabolic functionality (fermentation) of frozen and lyophilized FMT formulations. Clinical success rates of rCDI patients were correlated retrospectively with FMT formulations, storage durations, and host factors using the Edmonton FMT program database. Bacterial viability remained at 10%–20% across various storage conditions and formulations and was comparable to that of fresh FMT. Live and dead bacterial fractions in both frozen and lyophilized FMT preparations exhibited distinct community structures. Storage durations, but not temperatures, negatively affected bacterial diversity. More short chain fatty acids were found in metabolomic profiling of in vitro fermentation products using lyophilized than frozen FMT. Clinical success rates in 537 rCDI patients receiving a single dose of FMT were not significantly different among the three formulations. However, longer storage durations and advanced recipient age negatively impacted clinical efficacy. Together, our findings suggest that FMT formulations and storage durations should be considered when establishing guidelines for product shelf life for optimal treatment outcomes.
Keywords:
Fecal microbiota transplantation
; recurrent Clostridioides difficile infection
; bacterial viability and functionality
; FMT formulation and storage conditions
; FMT efficacy
1. Introduction
Clostridioides difficile infection (CDI) usually results from the dysbiosis of gut microbiota, particularly resulting from the use of antibiotics, creating an ecological niche that allows C. difficile to thrive and proliferate [1,2]. Recurrent C. difficile infection (rCDI) presents a challenge for clinicians because few therapeutic options exist. Traditional treatment of CDI includes antibiotics (e.g., metronidazole and vancomycin), which further exacerbate gut dysbiosis and lead to an increased risk of CDI recurrence. Fecal microbiota transplant (FMT) is currently the most effective treatment for CDI, irrespective of the route of administration [3], with clinical efficacies of >80% in randomized controlled trials (RCT) [4,5,6,7], and has been recommended by multiple practice guidelines for managing rCDI [8,9]. FMT formulations such as fresh, frozen, and lyophilized products are suggested to have similar clinical efficacy in preventing CDI recurrence in small studies [7,10,11,12,13]. However, questions remain regarding the superiority of one formulation over others and the appropriate “shelf life” for these products.
The mechanisms underlying FMT efficacy are not yet completely understood, but bacterial engraftment is thought to play a key role [14]. Thus, preserving bacterial viability, particularly anaerobes critical to gut health, is important for FMT manufacturing and storage processes [15,16,17]. Although there are guidelines for manufacturing and storage of donor fecal material products, they are mostly based on expert opinions and not empirical research [18]. FMT manufacturing commonly involves aerobic processing of donor fecal samples, which may significantly compromise the viability of anaerobic bacteria [19,20]. Furthermore, the freezing process, use of cryoprotectants, storage temperatures, and storage durations may differentially affect bacterial viability [21,22]. However, assessing bacterial viability is not straightforward. Traditional culture-based techniques are not always appropriate to evaluate bacterial viability because some bacteria are “unculturable” using existing protocols. Live/dead staining with fluorescence-activated cell sorting (FACS) is a convenient and rapid method to assess bacterial membrane integrity. However, FACS is costly and offers only partial insights, as it cannot evaluate the functional capacity of bacteria, which is crucial for therapeutic efficacy [23]. These considerations highlight the necessity of developing comprehensive methods that assess both bacterial viability and functionality, along with their combined impact on clinical outcomes.
To address these gaps, this study aims to 1) compare the bacterial viability and community structure of donor microbiota among FMT formulations (i.e., fresh, frozen, and lyophilized) stored at different temperatures and durations; 2) assess the metabolic functionality of these FMT products; and 3) correlate FMT formulation and storage durations with clinical outcomes.
2. Materials and Methods
2.1. Sample Information and Storage Conditions
Approximately 100 g of stool was collected from a registered stool donor in the Edmonton FMT program and processed within 4 h of collection. In brief, the stool sample was mixed with 200 mL water in a stomacher bag, homogenized, and divided into two 50 mL aliquots. The first 50 mL aliquot was mixed with trehalose (5% v/v, Swanson) and the second 50 mL with glycerol (10% v/v, Sigma G5516). The fecal slurry with glycerol was further divided into 1 mL aliquots, with 25 aliquots stored at −80 °C and the remaining 25 stored at −20 °C. Similarly, the fecal slurry with trehalose was further divided into 1 mL aliquots, frozen overnight at −80 °C, and lyophilized for 48 h at −45 °C under ~300 mTorr. The lyophilized samples were divided equally into three Ziplock bags with desiccants and stored at −80, −20, and 4 °C, respectively. Samples were retrieved at 1 month, 3 months, 6 months, and 12 months for each experiment described below (Figure 1).
2.2. Sorting of Live and Dead Cells in Stored FMT Samples
2.2.1. Sample Preparation for Live/Dead Staining
Prior to each experiment, lyophilized FMT (LFMT) samples were reconstituted in 1 mL 0.9% saline and incubated at 37 °C for 30 min; frozen FMT (FFMT) samples were incubated at 37 °C for 30 min. The samples were then filtered through a 70-µm strainer and centrifuged at 10,000g for 3 min. After removing the supernatant, the cell pellets were re-suspended in 1 mL 0.9% saline. For live and dead cell controls, the cell pellets were re-suspended in 1 mL PBS (1× phosphate buffered saline) and 1 mL 70% isopropyl alcohol, respectively, incubated at room temperature for 1 h, then centrifuged at 10,000g for 3 min before resuspension.
2.2.2. Live/Dead Staining of Bacteria
The bacterial cells in the FFMT and LFMT samples were stained using Live/Dead ® BacLight® Bacterial Viability and Counting Kit (L34856, Molecular Probes Inc.) following the manufacturer’s protocol, and live and dead cells were sorted with FACS. In brief, 977 µL aliquots of PBS were transferred into 1.5 mL microfuge tubes, to which 1.5 µl SYTO9 stain (Component A), 1.5 µl propidium iodide (Component B), and 10 µL sample were added; the samples were incubated at room temperature in the dark for 15 min. The microsphere standard (Component C) was re-suspended by vortexing and sonication for 5–10 minutes before adding a 10 µL volume of microsphere suspension to each sample and mixing. The live cell control was stained with SYTO9, and the dead cell control was stained with propidium iodide.
2.2.3. Live/Dead Bacterial Cell Sorting
FACS was performed on an LE-MA900 cell sorter (Sony Biotechnology), and a 100,000 event number was used to set up the instrument and gating parameters with the live cell and dead cell control suspensions stained with SYTO9 and propidium iodide, respectively. Data was acquired using log scales for forward scatter and side scatter under green and red channels, and the protocol threshold was adjusted on the forward scatter parameter. Data acquisition and analysis were performed using LE-MA900FCP-Cell Sorter Software. FACS was carried out with a fixed sample volume of 1 mL per stained sample, and the number of collected events was not controlled to maximize the sorted cell recovery from individual samples. Fluorescent beads were used as an internal control and were distinguishable from stained bacteria. The percentages of live and dead bacteria were calculated using the sort-count data.
2.3. 16S rDNA Analysis
2.3.1. DNA Extraction and 16S rDNA Amplicon Library Preparation
DNA was extracted from the live and dead cell fractions using the PowerFecal Pro® DNA Isolation Kit (Qiagen); 16S rDNA amplicon libraries were prepared targeting the V3–V4 variable region as described by Holm and colleagues (Method S1) [24]. The quality of the amplification was evaluated with Invitrogen E-gel electrophoresis. Libraries were normalized and pooled with the SequalPrep™ Normalization Plate Kit. Library fragments of ~620 bp were selected with SPRI beads and the pooled library was sequenced on an Illumina MiSeq 600 cycle cartridge.
2.3.2. Bioinformatics Analysis of 16S rDNA Amplicon Sequences
De-multiplexed raw Illumina MiSeq sequence data were initially assessed for quality using FastQC (version 0.11.9). The primers were removed from the reads using the cutadapt function [25], and quality trimming and filtering of the reads was performed using DADA2 software (Version 1.26) [26]. The PhiX reads were removed from both forward and reverse reads, followed by filtering based on parameter maxEE = c(2,3). The good-quality reads were merged, analyzed, and assigned to taxonomic classification against the Mothur-formatted SILVA database (Release 138.1) using Mothur (version 1.48.1) [27]. Because the samples showed large variations in sequencing depth, rarefaction using minimal reads (4737) per sample together with total sum scaling was performed on Microbiomeanalyst2 [28] to compare the bacterial diversities of the samples. The Shannon index was used to determine differences in α-diversity with a non-parametric Hutcheson t-test. The Bray–Curtis dissimilarity metric was used to determine the differences in community structures between the FMT sample groups (β-diversity) with a 2D principal coordinates analysis (PCoA) plot visualization and to perform Ward linkage-based clustering. The statistical significance of the differences in β-diversity of the FMT sample groups was evaluated using permutation multivariate analysis of variance (PERMANOVA) with 9,999 permutations. Linear discriminant analysis–Effect Size (LEfSe) was carried out using the Kruskal-Wallis sum-rank test with a correlation threshold of 0.3 and an adjusted p-value cutoff at 0.05, and clustering of the FMT samples was performed using Ward’s linkage of the Bray–Curtis distances at the genus level. Univariate (DESeq2) and a multivariable regression analyses (MaAsLin2) were used to evaluate the association between the bacterial community and storage temperature. All statistical analyses were done using Mothur or Microbiomanalyst2, and the data visualizations were done in R (v4.4.1) using the tidyverse packages [29].
2.4. In Vitro Fermentation of Fibers by Stored FFMT and LFMT
In vitro fermentation of fibers was carried out in 2.5% brain heart infusion (BHI) broth supplemented with a fiber nutrient (arabinoxylan or inulin). A 4% (v/v) suspension of each FMT sample was prepared in sterile PBS, and 2.5 mL of the suspension was added to each fermentation tube containing 2.5 mL 5% BHI supplemented with 0.25% arabinoxylan or inulin. Fermentation was performed in triplicate for each FMT sample, with PBS as the fiber-free blank control. The fermentation tubes were incubated anaerobically for 48 h at 37 °C on a shaker at 125 rpm. After fermentation, 1 mL aliquots were taken from each replicate and centrifuged at 20,000g for 20 min. The fermentation supernatants (400 µL) were withdrawn from each of the three replicates, combined to make a composite sample, mixed with 300 µL 25% phosphoric acid, and stored at −80 °C until further analysis.
2.5. Metabolomic Profiling of In Vitro Fermentation Products
2.5.1. SPME-GC×GC-TOFMS Untargeted Metabolomics
The metabolomic profiles, with an emphasis on short chain fatty acids (SCFA), of the composite fermentation products were analyzed by sampling the headspace with solid-phase microextraction (SPME) followed by comprehensive two-dimensional gas chromatography–time-of-flight mass spectrometry (GC×GC-TOFMS) based on untargeted metabolomics (Method S2).
The chromatographic data were processed using LECO ChromaTOF® BT software (v5.55.41). Retention indices were computed based on the elution times of the linear alkanes. All chromatographic peaks were searched against the NISTMS 2020 Libraries, with a minimum mass spectral similarity of 700 to assign a putative ID. All annotated metabolites were putatively identified to the Metabolomics Standards Initiative level 2, unless otherwise mentioned [30]. Mass spectra and retention indices for linear SCFAs of interest (acetic acid to decanoic acid) were tabulated (Table S1). A pooled quality control (QC) sample was included with each batch, and quality checks were manually performed by inspecting QC samples, replicate injections, and blanks. Following quality checks, all sample chromatograms were aligned into one cohesive peak table with annotation using a prototype software package (LECO) with a S/N of 1000.
2.5.2. Data Analysis and Chemometrics
The aligned peak table (N=32) was imported into MATLAB® R2022a (The MathWorks Inc., USA) for statistical analysis. First, the peak table was normalized to total useful peak area (TUPA) [31]. Peak tables were labeled based on fiber, temperature, time, and formulation, and then split into separate peak tables based on the experimental design. Principal component analysis (PCA) models were generated on the auto-scaled peak tables before and after FS using PLS_Toolbox 9.0 (Eigenvector Research, USA) in the MATLAB® environment. Outliers with high Hotelling T2 or Q-residuals were removed. PERMANOVA was performed on the auto-scaled peak tables for each comparison in R (v4.4.1) with the vegan package (v2.6-4), using Euclidean distance and 99,999 permutations and a significance threshold of p < 0.05 [32].
2.6. FMT Formulations, Storage Conditions and Clinical Outcomes in rCDI Patients
To assess the clinical efficacy associated with different FMT formulations and storage durations, a retrospective analysis was conducted on the clinical outcomes of FMT recipients in the Edmonton FMT program between 2013 and 2022 (REB approval Pro00101823) where metadata were available for patient age, sex, and number of CDI episodes; FMT formulation and storage duration; and treatment outcomes. Eligibility for receiving FMT was considered to be 1) at least two CDI recurrences (i.e., a total of three CDI episodes), or 2) at least one CDI recurrence requiring hospitalization. Fresh FMT was used from October 2012 until Feb 2017, FFMT was used from January 2013 until September 2022, and LFMT was subsequently introduced to the FMT program in March 2018. Each FMT dose was manufactured with at least 25 g of donor stool. Frozen and lyophilized FMT products were stored at −80 °C.
Following FMT, patients were followed for at least 8 weeks. Treatment success was defined as no recurrence of CDI 8 weeks following FMT. The clinical outcome data was analyzed in R (v4.4.1) and non-parametric regression was performed to estimate the association of different formulations and storage durations with clinical outcomes. Pearson’s chi-square test was used for categorical variables, and the Wilcoxon rank sum test was used for continuous variables. A logistic regression model was used to determine and compare the association of factors (e.g., FMT formulations and storage conditions; patient age, sex, antibiotic use prior to CDI, and number of CDI episodes) with treatment outcomes.
3. Results
3.1. Viability of Bacterial Populations Stored at Different Temperatures and Durations
After aerobic processing, approximately 20% of the bacterial population in the donor fecal sample remained viable, which was used as the baseline value to compare the effects of formulation (frozen or lyophilized), storage duration (3, 6, 9, or 12 months), and storage temperature (frozen [−20 °C, or −80 °C] or lyophilized [4 °C, −20 °C, or −80 °C]) on bacterial viability. The viable proportions of cells did not decrease over the 12-month study period when frozen and stored at −20 °C or −80 °C when compared with the viability of fresh FMT. In contrast, the viable proportions of bacteria decreased by 13% immediately after lyophilization. After this initial decrease, populations remained fairly stable after 1 month of storage at −80 °C (10%), −20 °C (15%), or 4 °C (13%), and did not diminish further within the 12-month study period (Figure 2).
3.2. Taxonomic Analysis of the Bacterial Communities of Stored FMT Samples
DNA isolated from 34 dead and live cell fractions from the 17 FMT samples generated 1,107,543 reads from Illumina MiSeq sequencing after removing the primers and performing the quality trimming and filtering. Out of 34 cell fraction samples, the dead fraction of the LFMT sample stored at −20 °C for 12 months produced only one read and, therefore, was excluded from further analysis.
3.2.1. Bacterial Communities of Live and Dead Cell Fractions
The bacterial compositions in the live and dead cell fractions, with a minimum relative abundance of 0.2% across phylum to genus levels, exhibited distinct variations in their distributions (Figure 3).
The community-level comparison of bacterial populations found statistically significant differences, indicated by Shannon diversity (α-diversity) indices, between the live and dead cell fractions (p < 0.05) (Figure 3a). The β-diversity index analysis with PCoA plotting of Bray–Curtis distances also demonstrated statistically significant differences between the bacterial communities of these two cell fractions (p < 0.05) (Figure 3b). Moreover, the clustering analysis portrayed a clear separation between live and dead cell fraction clusters (Figure S1). The dendrogram also showed that most of the LFMT and FFMT samples formed their own respective clusters, suggesting that the microbial diversity within LFMT and FFMT samples had distinct community features. Firmicutes and Actinobacteriota were the two most abundant phyla in both cell fractions. However, Actinobacteriota exhibited higher abundance in the live cell fractions than in the dead cell fractions, while the opposite trend was observed for Firmicutes. At the genus level, Blautia, Bifidobacterium, Dorea, and Faecalibacterium were more abundant in the live cell fractions, whereas Fusicatenibacter, Anaerostipes, and members of Lachnospiraceae were more abundant in the dead cell fractions (Figure 3c–g). LEfSe analysis identified all the statistically significant differentially abundant genera in the live versus dead cell fractions (Figure S2
3.2.2. Variations in Live Bacterial Communities Due to Formulations and Storage Conditions
The live cell fractions of the FMT samples were further analyzed to understand the impact of formulation and storage duration on the bacterial community structures. Although statistically significant differences in α-diversity (Shannon) and β-diversity (Bray–Curtis distances) indices were observed (p < 0.05) in the live bacterial communities between the FFMT and LFMT samples, the large differences in Shannon diversity at baseline (M0) and at 3 months (M3) between FFMT and LFMT could have skewed the overall comparison because only single data points were available (Figure 4 a-c).
Shannon diversity indices consistently decreased over time and were the highest at M0 and lowest at 12 months (M12), suggesting that prolonged storage duration negatively affected bacterial diversity. There were no statistically significant differences in bacterial communities resulting from storage temperatures identified by univariate analysis (DEseq2), except for Deinococcus, which exhibited significantly higher abundance in the samples stored at −80 °C than at the other storage temperatures. However, this finding may be influenced by the exceptionally high abundance of this genus in a single sample (FFMT sample stored at −80 °C for 3 months), which may have skewed the results. The multivariable regression analysis (MaAsLin2), when adjusted for storage duration as covariate, did not find statistically significant differences (p < 0.05) in bacterial communities resulting from storage temperature (Figure S3). Although the PCoA plot of β-diversity indices suggested small differences in the live bacterial communities between the FFMT and LFMT samples, PERMANOVA analysis confirmed a statistically significant difference between the sample groups (p < 0.05) (Figure 4 a-c). When the relative abundance data was plotted, minor differences were observed at the phylum level between the FFMT and LFMT samples. However, at the genus level, Blautia was more abundant in FFMT, whereas Bifidobacterium, Fusicatenibacter, Anaerostipes, Dorea, Faecalibacterium, and Romboutsia were found in higher relative abundance in LFMT samples (Figure 4 d, e). The relative abundance of Firmicutes consistently but not significantly decreased over the 12-month study period for both the frozen and lyophilized formulations. Only minor variations were observed in the relative abundances of the most dominant genera over the storage durations (Figure 4 f, g). Notably, the proportion of low-abundance genera decreased and the relative abundance of Bifidobacterium, Fusicatenibacter, Anaerostipes, and Dorea increased with storage duration.
3.2. Metabolic Profiles of Anaerobic In Vitro Fiber Fermentation Products
A total of 361 metabolites were identified in the fermentation supernatants. One outlier sample was identified and removed on the basis of its high Hotelling T2 value (Figure S4). Visual inspection and comparison of media and reagent blanks to pooled QC samples confirmed that the detected metabolites were only present in the samples (Figure S5). Peaks in blanks were caused by siloxanes from the SPME fiber and the internal standard (Figure S6). Blanks had <150 identifiable peaks, whereas the pooled QC samples had >300 identifiable peaks. Normalization by TUPA ensured that the compounds from the SPME fiber did not influence the statistical analysis.
Separation along PC1 was observed between FFMT and LFMT when considering all variables (Figure S7). The comparisons of time and formulations were shown to be statistically significant by PERMANOVA (p < 0.05) when considering all variables (Table S2). When the linear SCFAs (acetic acid to decanoic acid) were considered, only the difference between frozen and lyophilized formulations was statistically significant (PERMANOVA, p < 0.05), with the lyophilized formulations producing more SCFAs. PCA score plots generated using only SCFAs showed clear separation along PC1 between FFMT and LFMT formulations (Figure 5d), and PC2 described changes in SCFA levels resulting from storage duration (Figure 5c).
3.3. Correlation of FMT Formulation and Storage Duration with Clinical Outcomes
The cohort consisted of 537 patients with rCDI who received either fresh, frozen, or lyophilized FMT. The baseline characteristics of these FMT recipients are summarized in Table 1.
Overall, no statistically significant differences in success rates were observed between the patients who received fresh, frozen, or lyophilized FMT. As shown in Table 1 and Table 2, both adjusted odds ratios and p-values of the success rates of FFMT and LFMT were not statistically different from those of fresh FMT.
The only two statistically significant factors contributing to treatment outcomes were patient age and FMT storage duration. Age was negatively correlated with successful outcomes, independent of FMT formulation (Table 1 and Figure 6).
Specifically, success rates decreased with increasing age but plateaued at 75 years. FMT storage duration negatively impacted clinical success rates, with longer storage durations associated with lower treatment success; the rate of decline was more pronounced for the lyophilized formulation than for the frozen formulation (Table 2 and Figure 6).
4. Discussion
FMT is a guideline-recommended therapy to prevent rCDI and a promising investigational treatment in dysbiosis-associated conditions such as ulcerative colitis [3,33,34]. Therapeutic efficacy is thought to be mediated by bacterial engraftment and bacterially derived metabolites [14]. We found that while storage duration and temperature did not affect bacterial viability, a gradual decrease in bacterial diversity was observed over the 12-month study period in both frozen and lyophilized formulations. Although similar levels of highly abundant bacteria were observed, differences in community structure existed between these formulations. Untargeted metabolomics analysis of fiber fermentation products also found significant differences between formulations, including SCFA. These compositional changes over time and functional differences between formulations aligned with the observed decreasing clinical success rate with longer storage duration, especially for lyophilized FMT, in our retrospective rCDI patient cohort. Despite this, treatment with both FFMT and LFMT still achieved over 75% success when stored for up to 250 and 140 days, respectively.
Most FMT manufacturing protocols use aerobic processing, including our own, which likely accounted for the low proportion of viable cells (20%) at the start of our experiments. Papanicolas and colleagues also found that approximately 20% of the bacteria remained viable after aerobic processing of FMT via 16S rDNA qPCR in conjugation with propidium monoazide treatment. They also found that anaerobic processing improved the viability of obligate anaerobes and increased the proportion of total viable cells to approximately 50%; however, a single freeze-thaw cycle at −80 °C for 48 h reduced the viability to 23% despite using 10% glycerol as a cryoprotectant [22]. In contrast, using culturomics, Fouhy and colleagues found no differences in anaerobic bacterial counts between fecal samples that were fresh, snap-frozen, or stored at −80 °C for up to 7 days, even without using a cryoprotectant [35]. Although the use of cryoprotectants is common to minimize the effects of freezing on bacterial membrane integrity, no differences in bacterial functionality (e.g., SCFA production) were reported for fecal samples stored at −80 °C for 106 days with or without cryoprotectants such as 5% DMSO (dimethyl sulfoxide) or DMSO-media mix (DMSO + tryptic soy broth with trehalose) [36]. The vastly different results from various studies highlight the challenges with assessing bacterial viability. It is not known if a higher viable bacterial population resulting from anaerobic processing or the addition of a cryoprotectant to preserve the bacterial membrane integrity would have a significant impact on clinical efficacy, because aerobically processed FMT already has very high cure rates (>80%) for rCDI [3,34,37]. However, these processing strategies could potentially be relevant when FMT is used for other indications beyond rCDI.
To further characterize which bacteria survive FMT manufacturing and storage, we used 16S rDNA analysis to reveal fundamental differences in the bacterial populations between the live and dead cell fractions of the FMT samples. Consistent with our study, Bellali and colleagues also found a higher abundance of Actinobacteriota and a lower abundance of Firmicutes in the live cell fractions than in the dead cell fractions of FMT samples using live/dead staining with FACS [38], although Firmicutes was the most abundant phylum in both fractions. Similar trends in relative abundance of these phyla, as determined by 16S rDNA of live bacteria (i.e., propidium iodide–treated samples), was reported for human fecal samples stored for up to 1 year [39]. In the live cell fractions, we identified high relative abundances of Blautia and Fusicatenibacter (Firmicutes phylum) and Bifidobacteria (Actinobacteriota phylum); these are predominant genera in gut microbiota and are recognized for their roles in maintaining gut mucosal functions and SCFA production [40,41,42]. Additionally, genera such as Agathobacter and Dorea, which are also involved in SCFA production, were present at significantly higher abundances in the live cell fractions than in the dead cell fractions. We further demonstrated that, although the relative abundances of dominant genera remained stable, the relative abundance of SCFA-producers like Faecalibacterium, Agathobacter, and many other low-abundance genera decreased in the live cell fractions over 12 months. This may not be entirely surprising, because non-spore formers may not be as resilient as spore-forming Firmicutes to FMT manufacturing processes and storage conditions. These microbial community changes may contribute to the decreasing clinical efficacy of FMT products after longer storage duration.
The recommended storage durations for FMT products vary, and these recommendations are not necessarily evidence-based. For example, the International Consensus Conference on stool banking had previously recommended storing fecal materials at −80 °C for up to 2 years [18]. More recently, the British Society of Gastroenterology advised limiting the storage duration to no longer than 1 year at −70 °C [43]. A quality assurance study from the United States–based, non-profit public stool bank OpenBiome analyzed data from 257 facilities and 1924 frozen FMTs; they reported a cure rate of 83.8% using products stored for a mean of 139 days, with no statistically significant impact of storage duration on clinical outcomes [44]. In contrast, our results showed diminishing clinical efficacy with longer storage duration, and the rate of decline was relatively slower for frozen FMT than for lyophilized FMT. As such, the optimal “shelf life” of FMT products may be formulation- and indication-dependent and is likely between 6 and 12 months.
Although the ideal FMT formulation has not been determined, results from this and other studies suggest that aerobically processed FMT that is lyophilized and stored at −80 °C or 4 °C would likely have similar efficacy as frozen products and possess similar biologically important functions for preventing CDI recurrence. Indeed, a meta-analysis examining four RCTs and four observational studies reported the efficacy of fresh, frozen, and lyophilized FMT to be 95%, 88%, and 83%, respectively, with no statistically significant differences among groups [45]; these results are congruent with our findings. Lyophilized products are more practical as they can be stored at 4 °C or room temperature and, therefore, require less infrastructure support than frozen FMT.
In addition to the characteristics of FMT, we also found that advanced age negatively impacted clinical outcomes. Rajita and a colleague recently reported that increasing age was associated with higher CDI recurrence rate following treatment with a defined microbial consortium VE303 [46]. In the same study, they further identified lower bacterial engraftment in these older recipients of VE303. Since the diversity and functionality of the gut microbiota may decline with age [47], further consideration may need to be given to this group of patients, such as using multiple FMT doses, or choosing a product with shorter storage durations.
Our study was limited by the lack of replicates for all the experiments, except for the in vitro fermentation experiments. Additionally, only a single stool donation from a single donor was used in this study, and metabolomics analysis was performed only on volatile compounds that could have been affected by the lyophilization process or the preanalytical stage of the metabolomic analysis. Furthermore, the FMT samples used in the in vitro experiments were not used to treat patients, which limits our ability to directly assess clinical efficacy. Our clinical efficacy data was derived from retrospective data, with relatively few data points for the lyophilized FMT cohort with storage durations beyond 150 days, limiting our ability to accurately assess ideal “shelf life” for lyophilized FMT. We did not assess how other key microbial functions (e.g., bile acid conversion and other antibacterial peptide production) are affected by FMT manufacturing, formulation, or storage conditions, or how these functions impact clinical efficacy. Future research should address these shortcomings; preserving bacterial viability and functionality in FMT are not only relevant in the management of rCDI but will likely be even more important in other dysbiosis-associated indications.
Supplementary Materials
The following supporting information can be downloaded at the website of this paper posted on Preprints.org.
Author Contributions
MS, LC, RG, and DK wrote the manuscript; CM, RG, GN, SN, and APdlM performed the experiments; RF, KW, and DK treated rCDI patients; MS, RG, LC, SY and HX performed data analysis. DK conceptualized, obtained funding, and supervised the study. All authors revised and approved the final manuscript.
Data Availability Statement
The raw sequencing data will be deposited into the Sequence Read Archive of NCBI [http://www.ncbi.nlm.nih.gov/sra], and once accepted, the accession number will be provided.
Conflicts of Interest
The authors declare no conflicts of interest.
References
- Hopkins, M.; Macfarlane, G. Changes in predominant bacterial populations in human faeces with age and with Clostridium difficile infection. Journal of medical microbiology 2002, 51, 448–454. [Google Scholar] [CrossRef] [PubMed]
- Goldberg, E.; Amir, I.; Zafran, M.; Gophna, U.; Samra, Z.; Pitlik, S.; Bishara, J. The correlation between Clostridium difficile infection and human gut concentrations of Bacteroidetes phylum and clostridial species. European journal of clinical microbiology & infectious diseases 2014, 33, 377–383. [Google Scholar]
- Fischer, M.; Kao, D.; Kelly, C.; Kuchipudi, A.; Jafri, S.-M.; Blumenkehl, M.; Rex, D.; Mellow, M.; Kaur, N.; Sokol, H. Fecal microbiota transplantation is safe and efficacious for recurrent or refractory Clostridium difficile infection in patients with inflammatory bowel disease. Inflammatory bowel diseases 2016, 22, 2402–2409. [Google Scholar] [CrossRef] [PubMed]
- Kao, D.; Roach, B.; Silva, M.; Beck, P.; Rioux, K.; Kaplan, G.G.; Chang, H.-J.; Coward, S.; Goodman, K.J.; Xu, H. Effect of oral capsule–vs colonoscopy-delivered fecal microbiota transplantation on recurrent Clostridium difficile infection: a randomized clinical trial. Jama 2017, 318, 1985–1993. [Google Scholar] [CrossRef]
- Jiang, Z.; Ajami, N.; Petrosino, J.; Jun, G.; Hanis, C.; Shah, M.; Hochman, L.; Ankoma-Sey, V.; DuPont, A.; Wong, M. Randomised clinical trial: faecal microbiota transplantation for recurrent Clostridum difficile infection–fresh, or frozen, or lyophilised microbiota from a small pool of healthy donors delivered by colonoscopy. Alimentary Pharmacology & Therapeutics 2017, 45, 899–908. [Google Scholar]
- Kelly, C.R.; Khoruts, A.; Staley, C.; Sadowsky, M.J.; Abd, M.; Alani, M.; Bakow, B.; Curran, P.; McKenney, J.; Tisch, A. Effect of fecal microbiota transplantation on recurrence in multiply recurrent Clostridium difficile infection: a randomized trial. Annals of internal medicine 2016, 165, 609–616. [Google Scholar] [CrossRef]
- Youngster, I.; Sauk, J.; Pindar, C.; Wilson, R.G.; Kaplan, J.L.; Smith, M.B.; Alm, E.J.; Gevers, D.; Russell, G.H.; Hohmann, E.L. Fecal microbiota transplant for relapsing Clostridium difficile infection using a frozen inoculum from unrelated donors: a randomized, open-label, controlled pilot study. Clinical Infectious Diseases 2014, 58, 1515–1522. [Google Scholar] [CrossRef]
- Peery, A.F.; Kelly, C.R.; Kao, D.; Vaughn, B.P.; Lebwohl, B.; Singh, S.; Imdad, A.; Altayar, O.; Committee, A.C.G. AGA Clinical Practice Guideline on Fecal Microbiota–Based Therapies for Select Gastrointestinal Diseases. Gastroenterology 2024, 166, 409–434. [Google Scholar] [CrossRef]
- Cammarota, G.; Ianiro, G.; Tilg, H.; Rajilić-Stojanović, M.; Kump, P.; Satokari, R.; Sokol, H.; Arkkila, P.; Pintus, C.; Hart, A. European consensus conference on faecal microbiota transplantation in clinical practice. Gut 2017, 66, 569–580. [Google Scholar] [CrossRef]
- Hamilton, M.J.; Weingarden, A.R.; Sadowsky, M.J.; Khoruts, A. Standardized frozen preparation for transplantation of fecal microbiota for Recurrent Clostridium difficile infection. Official journal of the American College of Gastroenterology| ACG 2012, 107, 761–767. [Google Scholar] [CrossRef]
- Satokari, R.; Mattila, E.; Kainulainen, V.; Arkkila, P. Simple faecal preparation and efficacy of frozen inoculum in faecal microbiota transplantation for recurrent Clostridium difficile infection–an observational cohort study. Alimentary pharmacology & therapeutics 2015, 41, 46–53. [Google Scholar]
- Cammarota, G.; Masucci, L.; Ianiro, G.; Bibbò, S.; Dinoi, G.; Costamagna, G.; Sanguinetti, M.; Gasbarrini, A. Randomised clinical trial: faecal microbiota transplantation by colonoscopy vs. vancomycin for the treatment of recurrent Clostridium difficile infection. Alimentary pharmacology & therapeutics 2015, 41, 835–843. [Google Scholar]
- Lee, C.H.; Steiner, T.; Petrof, E.O.; Smieja, M.; Roscoe, D.; Nematallah, A.; Weese, J.S.; Collins, S.; Moayyedi, P.; Crowther, M. Frozen vs fresh fecal microbiota transplantation and clinical resolution of diarrhea in patients with recurrent Clostridium difficile infection: a randomized clinical trial. Jama 2016, 315, 142–149. [Google Scholar] [CrossRef] [PubMed]
- Yang, R.; Chen, Z.; Cai, J. Fecal microbiota transplantation: Emerging applications in autoimmune diseases. Journal of Autoimmunity 2023, 141, 103038. [Google Scholar] [CrossRef]
- Hocquart, M.; Lagier, J.-C.; Cassir, N.; Saidani, N.; Eldin, C.; Kerbaj, J.; Delord, M.; Valles, C.; Brouqui, P.; Raoult, D. Early fecal microbiota transplantation improves survival in severe Clostridium difficile infections. Clinical Infectious Diseases 2018, 66, 645–650. [Google Scholar] [CrossRef]
- Debast, S.B.; Bauer, M.P.; Kuijper, E.J.; Committee. European Society of Clinical Microbiology and Infectious Diseases: update of the treatment guidance document for Clostridium difficile infection. Clinical microbiology and infection 2014, 20, 1–26. [Google Scholar] [CrossRef]
- McDonald, L.C.; Gerding, D.N.; Johnson, S.; Bakken, J.S.; Carroll, K.C.; Coffin, S.E.; Dubberke, E.R.; Garey, K.W.; Gould, C.V.; Kelly, C. Clinical practice guidelines for Clostridium difficile infection in adults and children: 2017 update by the Infectious Diseases Society of America (IDSA) and Society for Healthcare Epidemiology of America (SHEA). Clinical infectious diseases 2018, 66, e1–e48. [Google Scholar] [CrossRef]
- Keller, J.J.; Ooijevaar, R.E.; Hvas, C.L.; Terveer, E.M.; Lieberknecht, S.C.; Högenauer, C.; Arkkila, P.; Sokol, H.; Gridnyev, O.; Mégraud, F. A standardised model for stool banking for faecal microbiota transplantation: a consensus report from a multidisciplinary UEG working group. United European gastroenterology journal 2021, 9, 229–247. [Google Scholar] [CrossRef]
- Lu, Z.; Imlay, J.A. When anaerobes encounter oxygen: mechanisms of oxygen toxicity, tolerance and defence. Nature reviews microbiology 2021, 19, 774–785. [Google Scholar] [CrossRef]
- Bénard, M.V.; Arretxe, I.; Wortelboer, K.; Harmsen, H.J.; Davids, M.; de Bruijn, C.M.; Benninga, M.A.; Hugenholtz, F.; Herrema, H.; Ponsioen, C.Y. Anaerobic feces processing for fecal microbiota transplantation improves viability of obligate anaerobes. Microorganisms 2023, 11, 2238. [Google Scholar] [CrossRef]
- Soukupova, H.; Rehorova, V.; Cibulkova, I.; Duska, F. Assessment of Faecal Microbiota Transplant Stability in Deep Freeze Conditions: A 12-month Ex Vivo Viability Analysis. Journal of Clinical Laboratory Analysis 2023, 38, e25023. [Google Scholar] [CrossRef] [PubMed]
- Papanicolas, L.E.; Choo, J.M.; Wang, Y.; Leong, L.E.; Costello, S.P.; Gordon, D.L.; Wesselingh, S.L.; Rogers, G.B. Bacterial viability in faecal transplants: which bacteria survive? EBioMedicine 2019, 41, 509–516. [Google Scholar] [CrossRef] [PubMed]
- Cibulková, I.; Řehořová, V.; Wilhelm, M.; Soukupová, H.; Hajer, J.; Duška, F.; Daňková, H.; Cahová, M. Evaluating Bacterial Viability in Faecal Microbiota Transplantation: A Comparative Analysis of In Vitro Cultivation and Membrane Integrity Methods. Journal of Clinical Laboratory Analysis 2024, 38, e25105. [Google Scholar] [CrossRef] [PubMed]
- Holm, J.B.; Humphrys, M.S.; Robinson, C.K.; Settles, M.L.; Ott, S.; Fu, L.; Yang, H.; Gajer, P.; He, X.; McComb, E. Ultrahigh-throughput multiplexing and sequencing of> 500-base-pair amplicon regions on the Illumina HiSeq 2500 platform. MSystems 2019, 4, 10-1128. [Google Scholar] [CrossRef]
- Martin, M. Cutadapt removes adapter sequences from high-throughput sequencing reads. EMBnet. journal 2011, 17, 10–12. [Google Scholar] [CrossRef]
- Callahan, B.J.; McMurdie, P.J.; Rosen, M.J.; Han, A.W.; Johnson, A.J.A.; Holmes, S.P. DADA2: High-resolution sample inference from Illumina amplicon data. Nature methods 2016, 13, 581–583. [Google Scholar] [CrossRef]
- Schloss, P.D.; Westcott, S.L.; Ryabin, T.; Hall, J.R.; Hartmann, M.; Hollister, E.B.; Lesniewski, R.A.; Oakley, B.B.; Parks, D.H.; Robinson, C.J. Introducing mothur: open-source, platform-independent, community-supported software for describing and comparing microbial communities. Applied and environmental microbiology 2009, 75, 7537–7541. [Google Scholar] [CrossRef]
- Lu, Y.; Zhou, G.; Ewald, J.; Pang, Z.; Shiri, T.; Xia, J. MicrobiomeAnalyst 2.0: comprehensive statistical, functional and integrative analysis of microbiome data. Nucleic Acids Research 2023, 51, W310–W318. [Google Scholar] [CrossRef]
- Wickham, H.; Averick, M.; Bryan, J.; Chang, W.; McGowan, L.D.A.; François, R.; Grolemund, G.; Hayes, A.; Henry, L.; Hester, J. Welcome to the Tidyverse. Journal of open source software 2019, 4, 1686. [Google Scholar] [CrossRef]
- Sumner, L.W.; Amberg, A.; Barrett, D.; Beale, M.H.; Beger, R.; Daykin, C.A.; Fan, T.W.-M.; Fiehn, O.; Goodacre, R.; Griffin, J.L. Proposed minimum reporting standards for chemical analysis: chemical analysis working group (CAWG) metabolomics standards initiative (MSI). Metabolomics 2007, 3, 211–221. [Google Scholar] [CrossRef]
- Nam, S.L.; Giebelhaus, R.T.; Tarazona Carrillo, K.S.; de la Mata, A.P.; Harynuk, J.J. Evaluation of normalization strategies for GC-based metabolomics. Metabolomics 2024, 20, 22. [Google Scholar] [CrossRef]
- Oksanen, J.; Blanchet, F.G.; Kindt, R.; Legendre, P.; Minchin, P.R.; O’hara, R.; Simpson, G.L.; Solymos, P.; Stevens, M.H.H.; Wagner, H. Package ‘vegan’. Community ecology package, version 2013, 2, 1–295. [Google Scholar]
- Hvas, C.L.; Jørgensen, S.M.D.; Jørgensen, S.P.; Storgaard, M.; Lemming, L.; Hansen, M.M.; Erikstrup, C.; Dahlerup, J.F. Fecal microbiota transplantation is superior to fidaxomicin for treatment of recurrent Clostridium difficile infection. Gastroenterology 2019, 156, 1324–1332.e1323. [Google Scholar] [CrossRef] [PubMed]
- Costello, S.; Soo, W.; Bryant, R.; Jairath, V.; Hart, A.; Andrews, J. Systematic review with meta-analysis: faecal microbiota transplantation for the induction of remission for active ulcerative colitis. Alimentary pharmacology & therapeutics 2017, 46, 213–224. [Google Scholar]
- Fouhy, F.; Deane, J.; Rea, M.C.; O’Sullivan, Ó.; Ross, R.P.; O’Callaghan, G.; Plant, B.J.; Stanton, C. The effects of freezing on faecal microbiota as determined using MiSeq sequencing and culture-based investigations. PloS one 2015, 10, e0119355. [Google Scholar] [CrossRef]
- Kerckhof, F.-M.; Courtens, E.N.; Geirnaert, A.; Hoefman, S.; Ho, A.; Vilchez-Vargas, R.; Pieper, D.H.; Jauregui, R.; Vlaeminck, S.E.; Van de Wiele, T. Optimized cryopreservation of mixed microbial communities for conserved functionality and diversity. PloS one 2014, 9, e99517. [Google Scholar] [CrossRef]
- Kelly, C.R.; Yen, E.F.; Grinspan, A.M.; Kahn, S.A.; Atreja, A.; Lewis, J.D.; Moore, T.A.; Rubin, D.T.; Kim, A.M.; Serra, S. Fecal microbiota transplantation is highly effective in real-world practice: initial results from the FMT national registry. Gastroenterology 2021, 160, 183–192.e183. [Google Scholar] [CrossRef]
- Bellali, S.; Lagier, J.-C.; Million, M.; Anani, H.; Haddad, G.; Francis, R.; Kuete Yimagou, E.; Khelaifia, S.; Levasseur, A.; Raoult, D. Running after ghosts: are dead bacteria the dark matter of the human gut microbiota? Gut microbes 2021, 13, 1897208. [Google Scholar] [CrossRef]
- Dorsaz, S.; Charretier, Y.; Girard, M.; Gaïa, N.; Leo, S.; Schrenzel, J.; Harbarth, S.; Huttner, B.; Lazarevic, V. Changes in microbiota profiles after prolonged frozen storage of stool suspensions. Frontiers in cellular and infection microbiology 2020, 10, 77. [Google Scholar] [CrossRef]
- Rivière, A.; Selak, M.; Lantin, D.; Leroy, F.; De Vuyst, L. Bifidobacteria and butyrate-producing colon bacteria: importance and strategies for their stimulation in the human gut. Frontiers in microbiology 2016, 7, 979. [Google Scholar] [CrossRef]
- Schwiertz, A.; Hold, G.L.; Duncan, S.H.; Gruhl, B.; Collins, M.D.; Lawson, P.A.; Flint, H.J.; Blaut, M. Anaerostipes caccae gen. nov., sp. nov., a new saccharolytic, acetate-utilising, butyrate-producing bacterium from human faeces. Systematic and applied microbiology 2002, 25, 46–51. [Google Scholar] [CrossRef] [PubMed]
- Andriantsoanirina, V.; Allano, S.; Butel, M.J.; Aires, J. Tolerance of Bifidobacterium human isolates to bile, acid and oxygen. Anaerobe 2013, 21, 39–42. [Google Scholar] [CrossRef] [PubMed]
- Mullish, B.H.; Merrick, B.; Quraishi, M.N.; Bak, A.; Green, C.A.; Moore, D.J.; Porter, R.J.; Elumogo, N.T.; Segal, J.P.; Sharma, N. The use of faecal microbiota transplant as treatment for recurrent or refractory Clostridioides difficile infection and other potential indications: of joint British Society of Gastroenterology (BSG) and Healthcare Infection Society (HIS) guidelines. Journal of Hospital Infection 2024, 148, 189–219. [Google Scholar] [CrossRef] [PubMed]
- Allegretti, J.R.; Elliott, R.J.; Ladha, A.; Njenga, M.; Warren, K.; O’Brien, K.; Budree, S.; Osman, M.; Fischer, M.; Kelly, C.R. Stool processing speed and storage duration do not impact the clinical effectiveness of fecal microbiota transplantation. Gut microbes 2020, 11, 1806–1808. [Google Scholar] [CrossRef]
- Gangwani, M.K.; Aziz, M.; Aziz, A.; Priyanka, F.; Weissman, S.; Phan, K.; Dahiya, D.S.; Ahmed, Z.; Sohail, A.H.; Lee-Smith, W. Fresh versus frozen versus lyophilized fecal microbiota transplant for recurrent Clostridium difficile infection: a systematic review and network meta-analysis. Journal of Clinical Gastroenterology 2023, 57, 239–245. [Google Scholar] [CrossRef]
- Menon, R.; Bhattarai, S.K.; Crossette, E.; Prince, A.L.; Olle, B.; Silber, J.L.; Bucci, V.; Faith, J.; Norman, J.M. Multi-omic profiling a defined bacterial consortium for treatment of recurrent Clostridioides difficile infection. Nature Medicine 2025, 31, 223–234. [Google Scholar] [CrossRef]
- Maffei, V.J.; Kim, S.; Blanchard IV, E.; Luo, M.; Jazwinski, S.M.; Taylor, C.M.; Welsh, D.A. Biological aging and the human gut microbiota. Journals of Gerontology Series A: Biomedical Sciences and Medical Sciences 2017, 72, 1474–1482. [Google Scholar] [CrossRef]
Figure 1.
Schematic diagram of the study design: A single fecal donation was processed aerobically and preserved using two methods: freezing and lyophilization. The samples were then stored under various temperatures for up to one year and evaluated at three-month intervals. Analyses included bacterial viability using live/dead staining and fluorescence-activated cell sorting (FACS); bacterial community structure by 16S rRNA gene amplicon sequence analysis; and microbial functionality through in vitro fermentation of fiber products followed by GC-MS analysis of volatile metabolites, with a particular focus on short chain fatty acids.
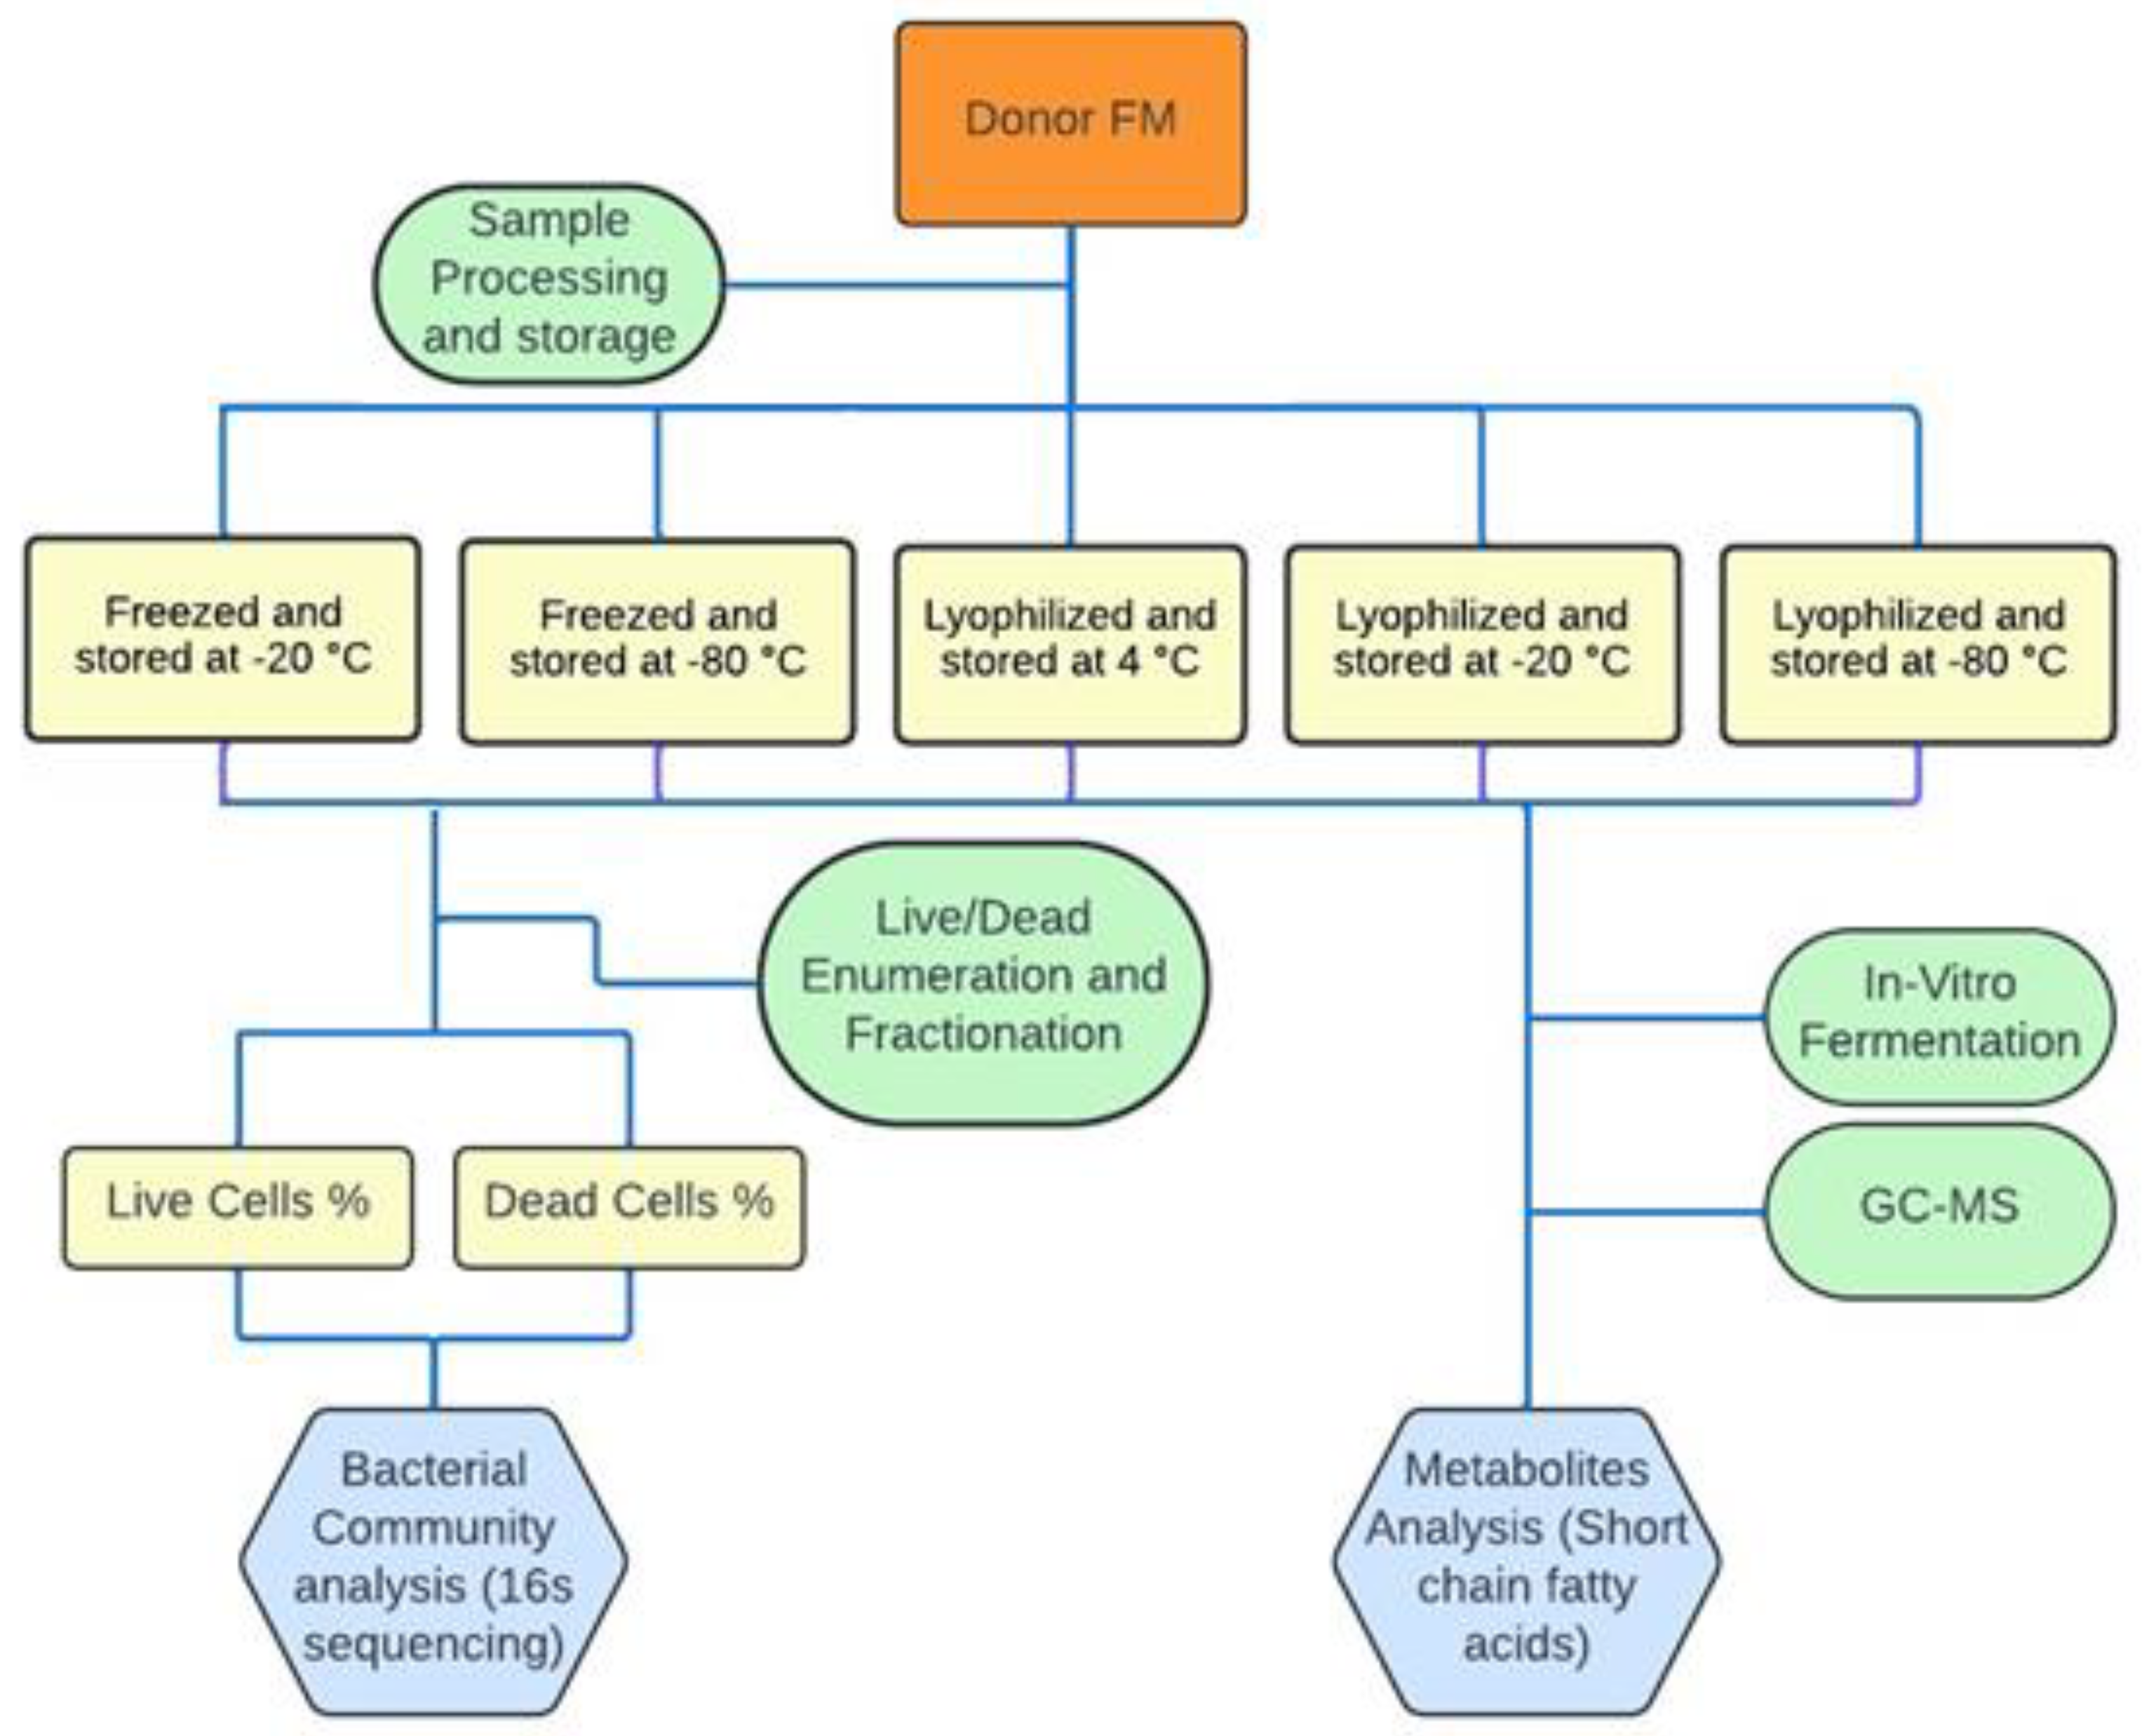
Figure 2.
Proportion of viable bacteria in frozen fecal microbiota transplantation (FFMT) and lyophilized FMT (LFMT) samples stored at different temperatures and storage durations (M = month) determined by live/dead straining coupled with fluorescence-activated cell sorting.
Figure 2.
Proportion of viable bacteria in frozen fecal microbiota transplantation (FFMT) and lyophilized FMT (LFMT) samples stored at different temperatures and storage durations (M = month) determined by live/dead straining coupled with fluorescence-activated cell sorting.
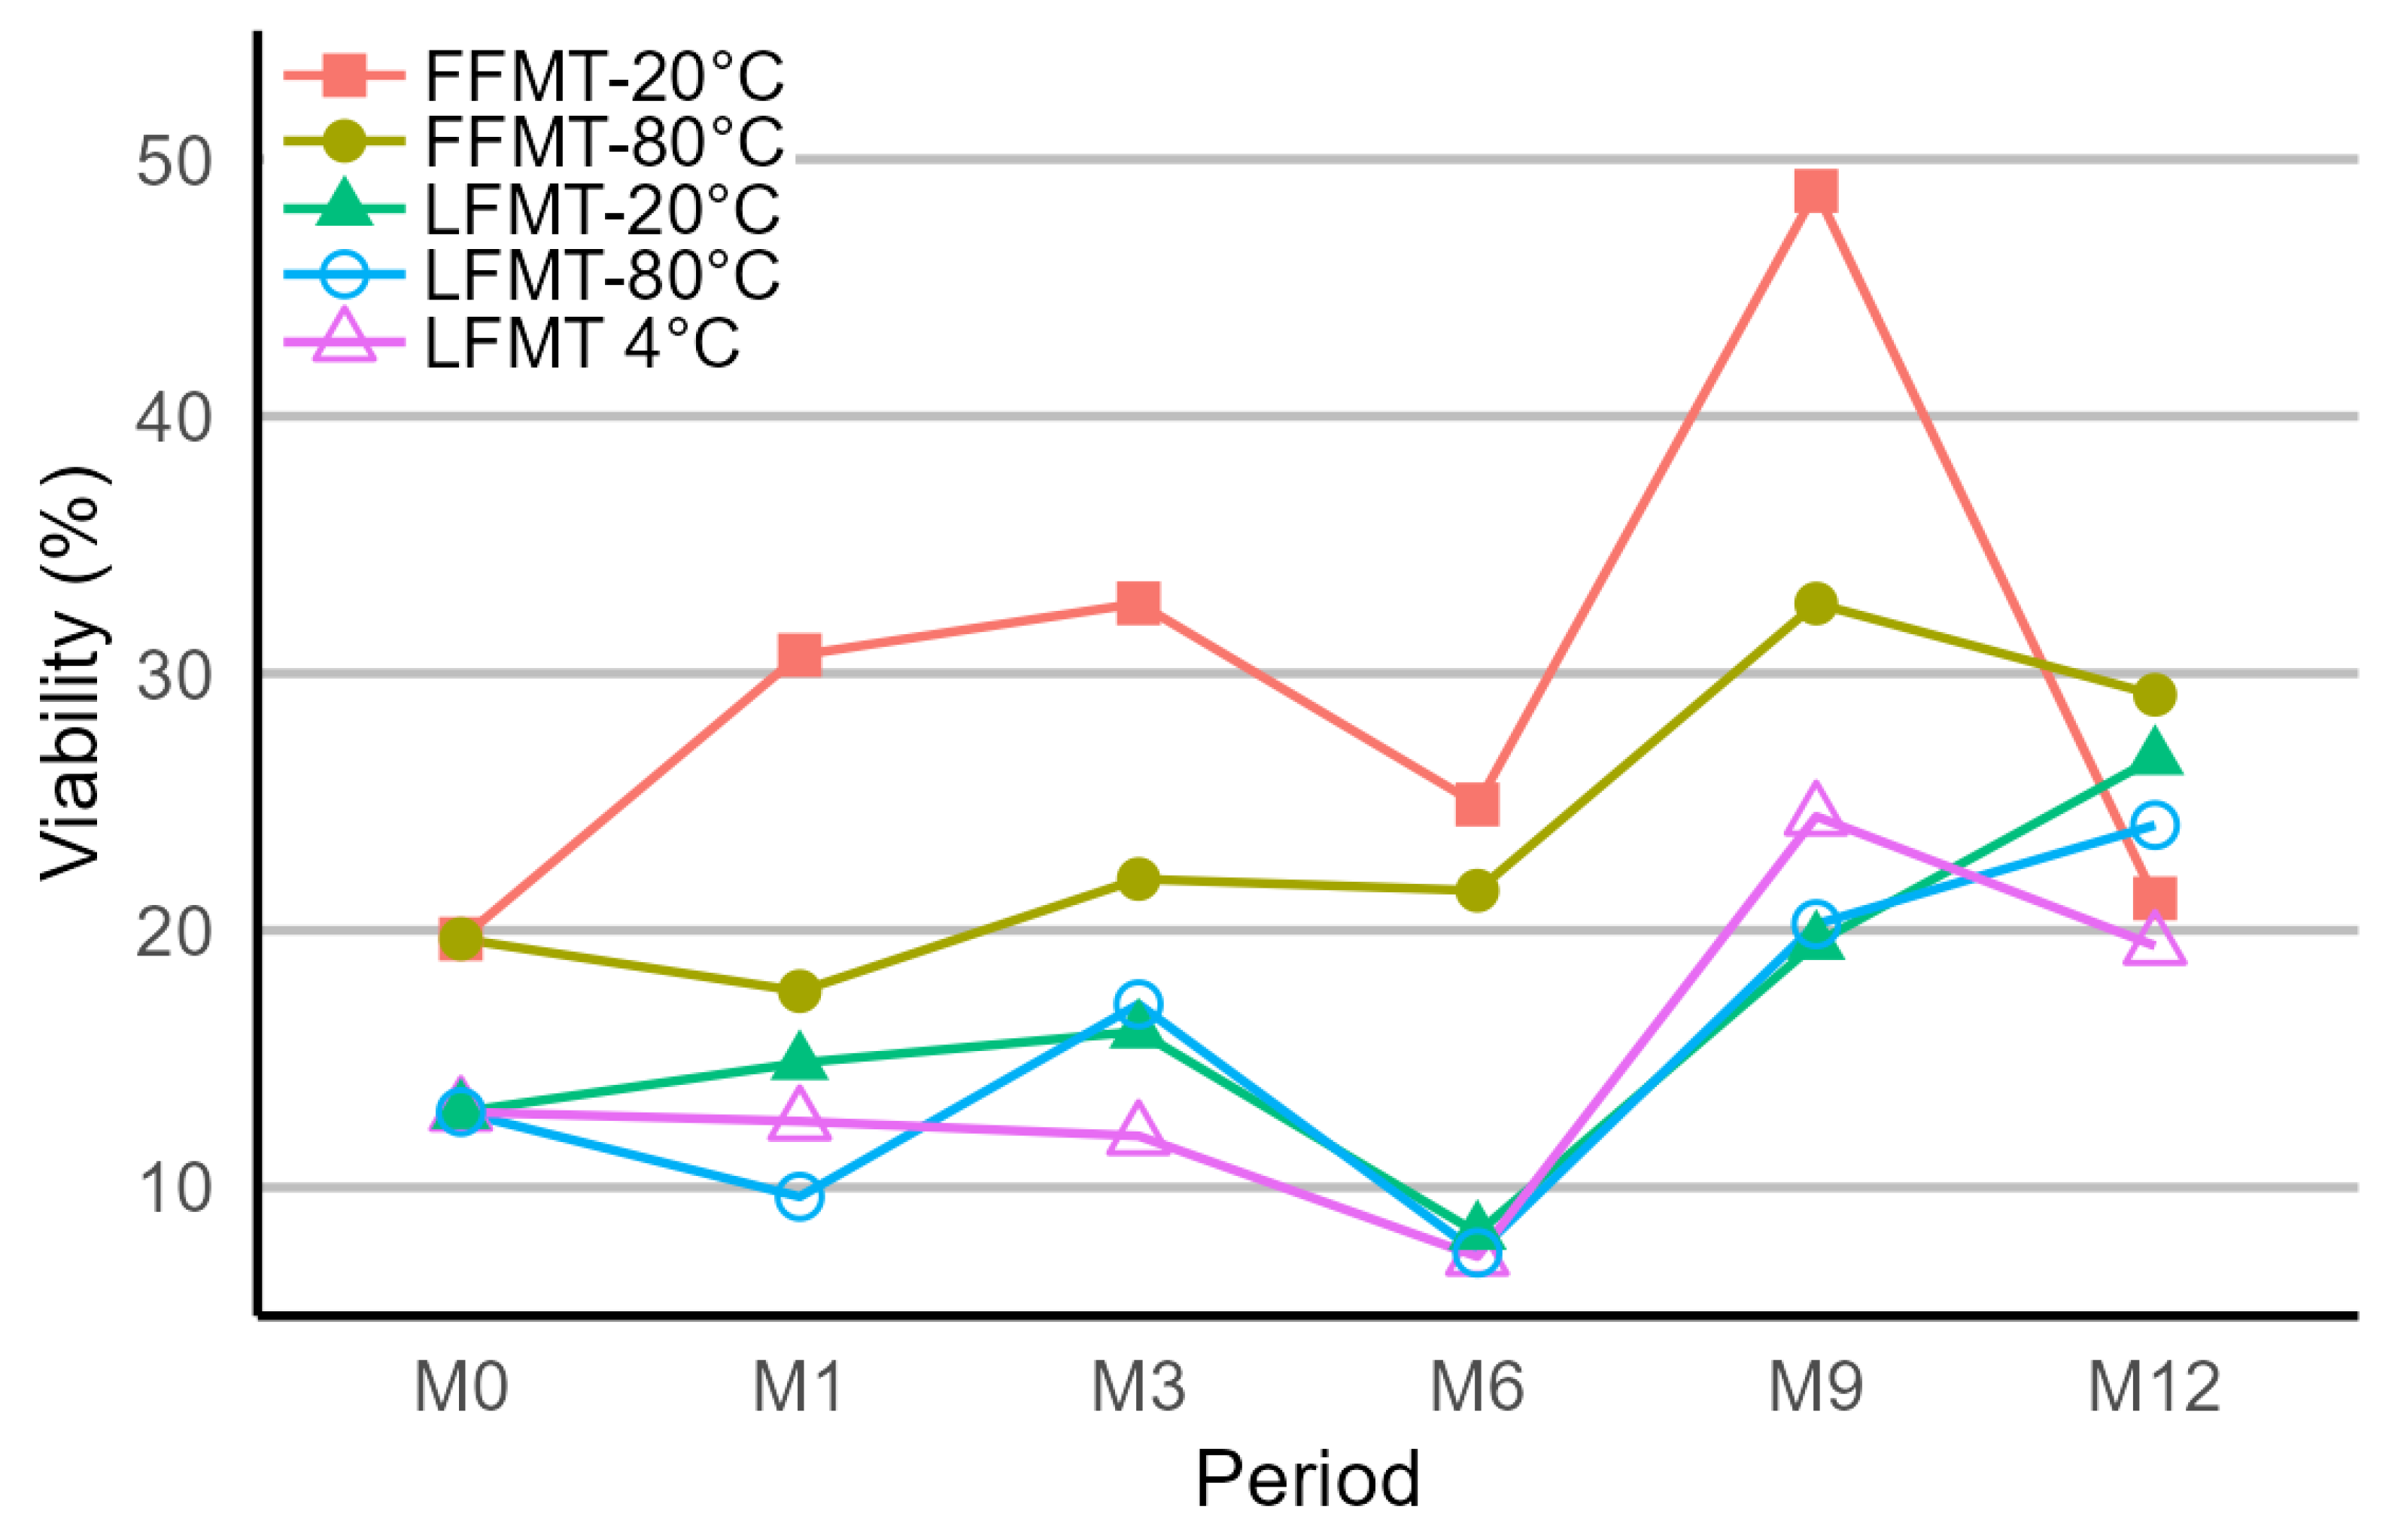
Figure 3.
Bacterial community structures and diversity indices in live and dead cell fractions of fecal microbiota transplantation (FMT) samples stored under different conditions. a) The α-diversity (Shannon) indices of live and dead fractions of the FMT samples (frozen [FFMT] + lyophilized [LFMT]) were statistically significantly different between groups (p-value < 0.05). b) The principal coordinates analysis (PCoA) plot of the β-diversity indices (Bray–Curtis dissimilarity indices) of live and dead cell fractions of FMT samples exhibited significant differences in the bacterial communities between these groups (p-value < 0.05). The FFMT and LFMT samples are shown in different colors in the α-diversity and β-diversity plots. Mean relative abundance of bacteria in all FMT samples (FFMT + LFMT) at c) phylum level, d) class level, e) order level, f) family level, and g) genus level.
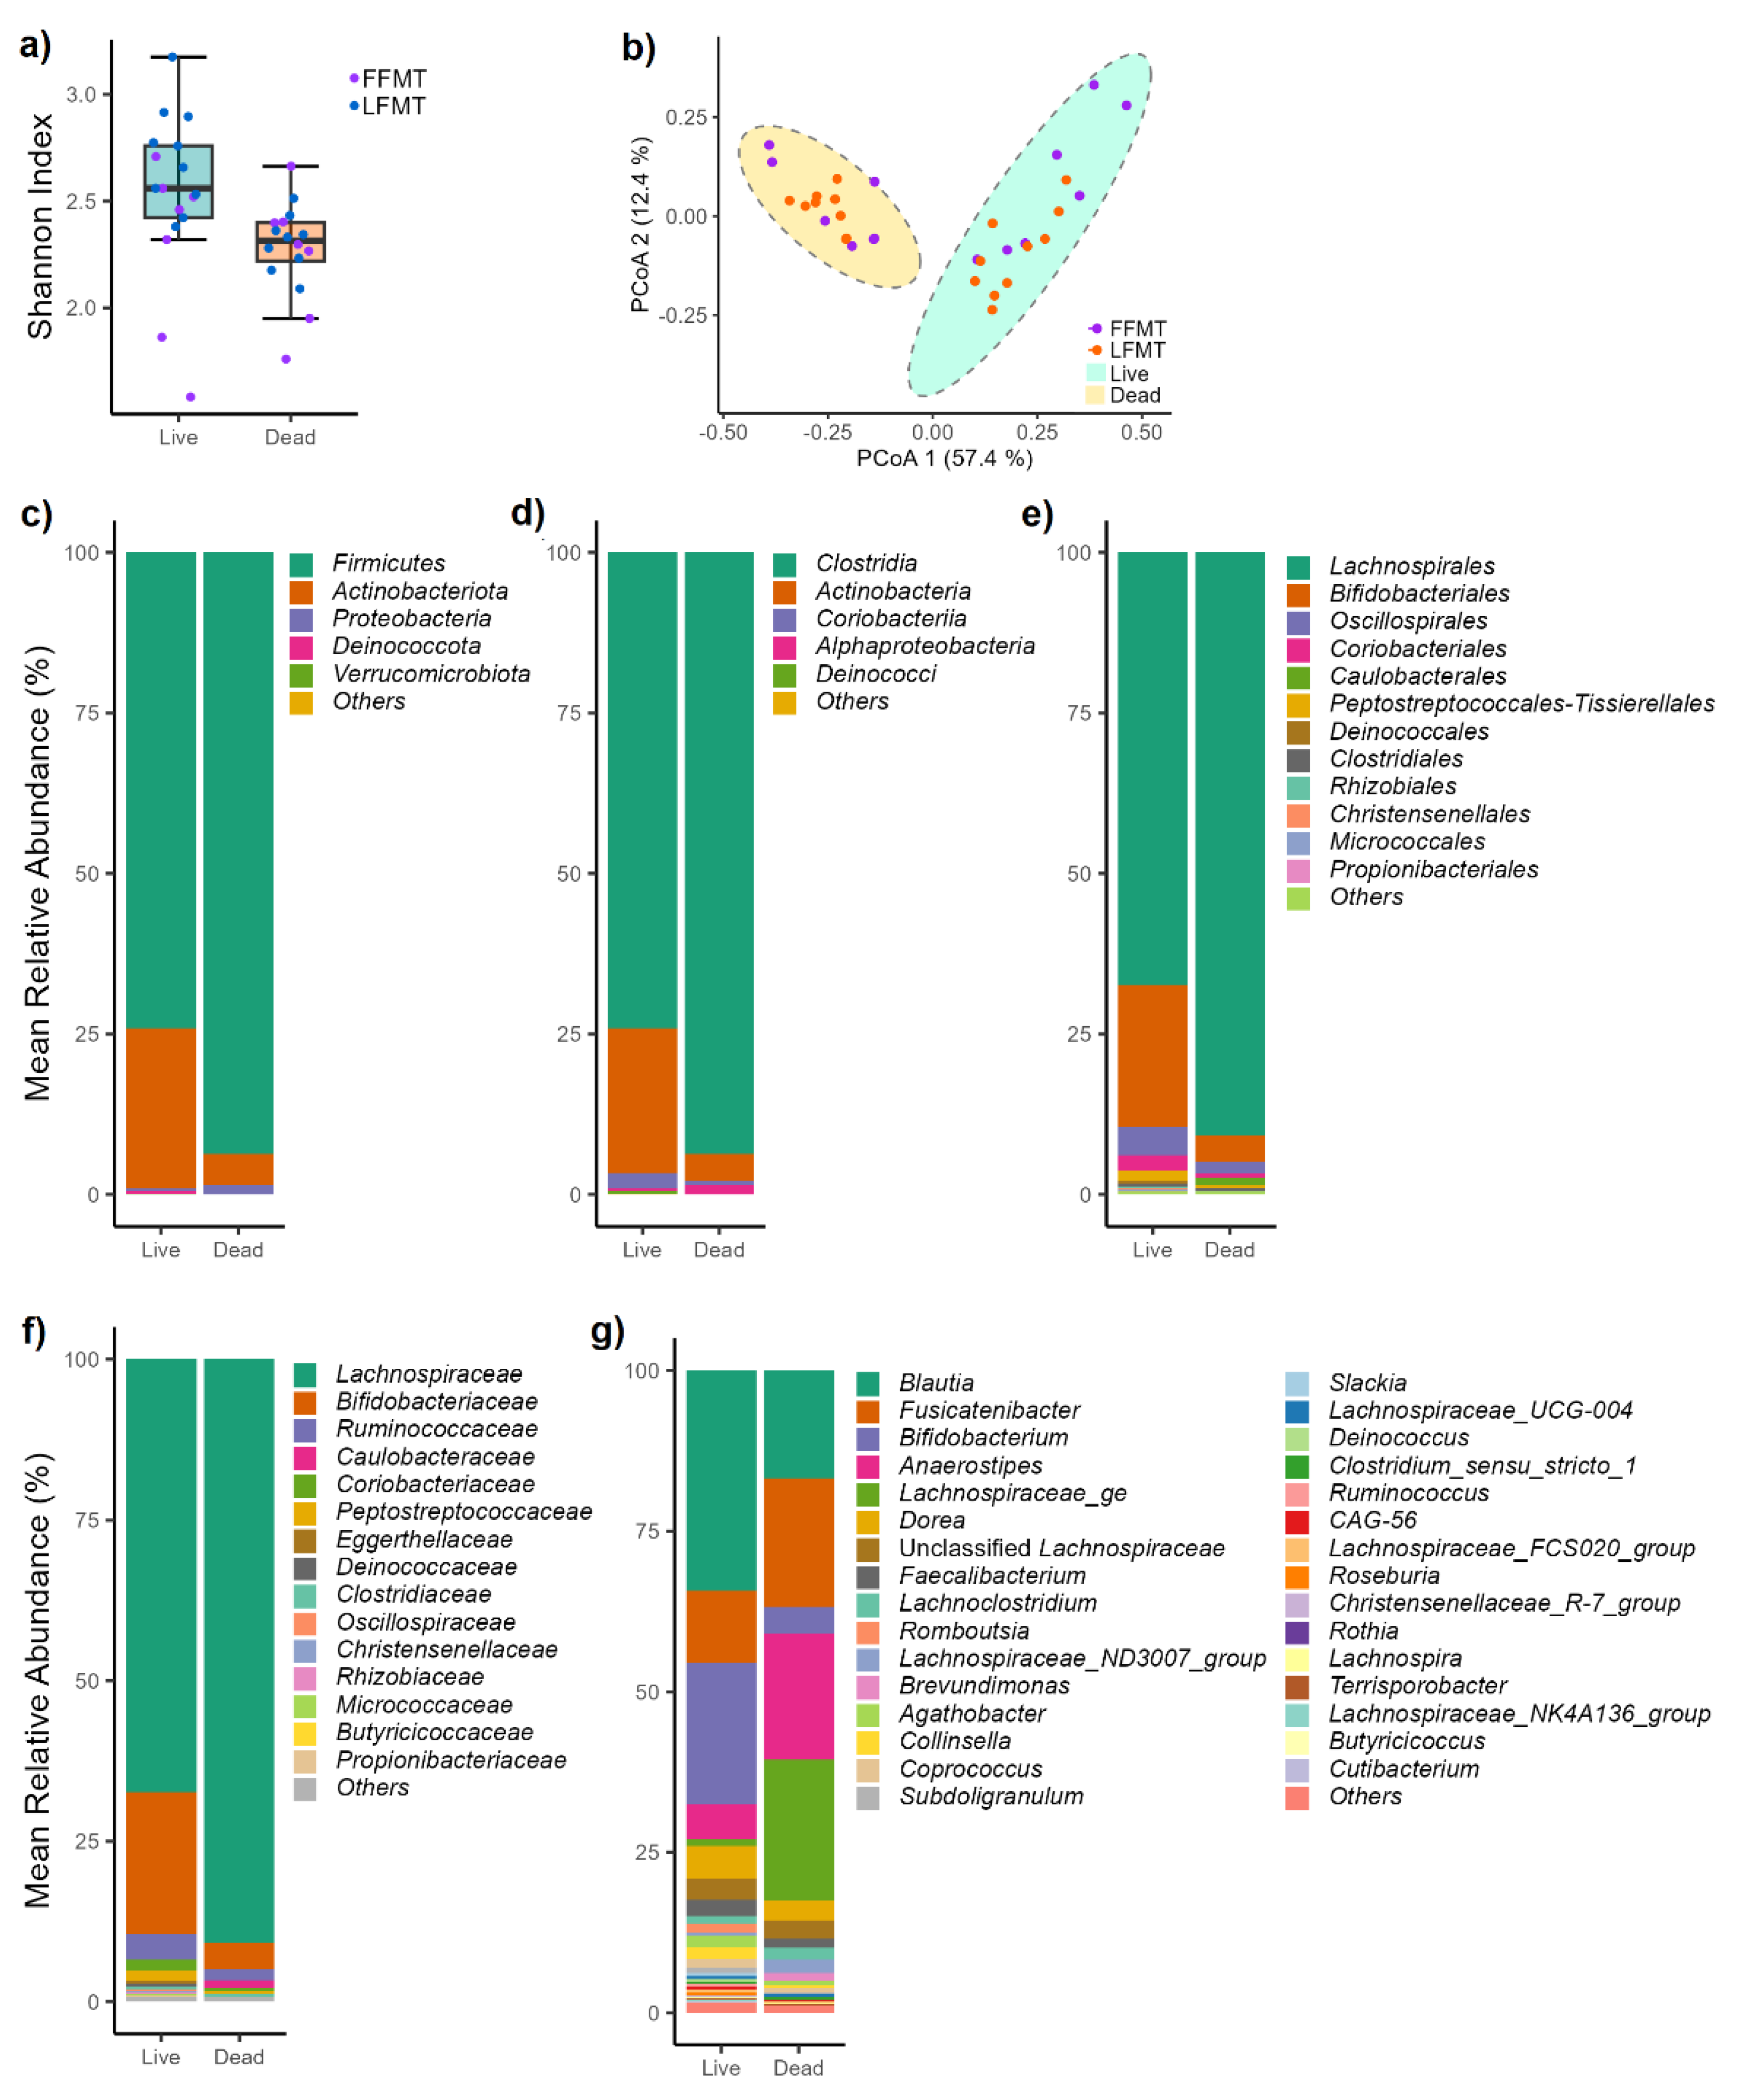
Figure 4.
Bacterial community structures and diversity indices in live cell fractions of fecal microbiota transplantation (FMT) samples stored under different conditions. a) Shannon indices of live cell fractions in frozen (FFMT) + lyophilized (LFMT) samples were significantly different between groups (p-value < 0.05). b) Shannon indices of live cell fractions at different time points were not significantly different between the groups (p-value > 0.05). c) The principal coordinates analysis plot of the β-diversity indices (Bray–Curtis dissimilarity indices) of live cell fractions of FFMT (F) and LFMT (L) samples had significantly different bacterial communities (p-value < 0.05). Mean relative abundance of bacteria in frozen FFMT and LFMT at d) phylum level and e) genus level. Mean relative abundance of bacteria at different time points at f) phylum level and g) genus level.
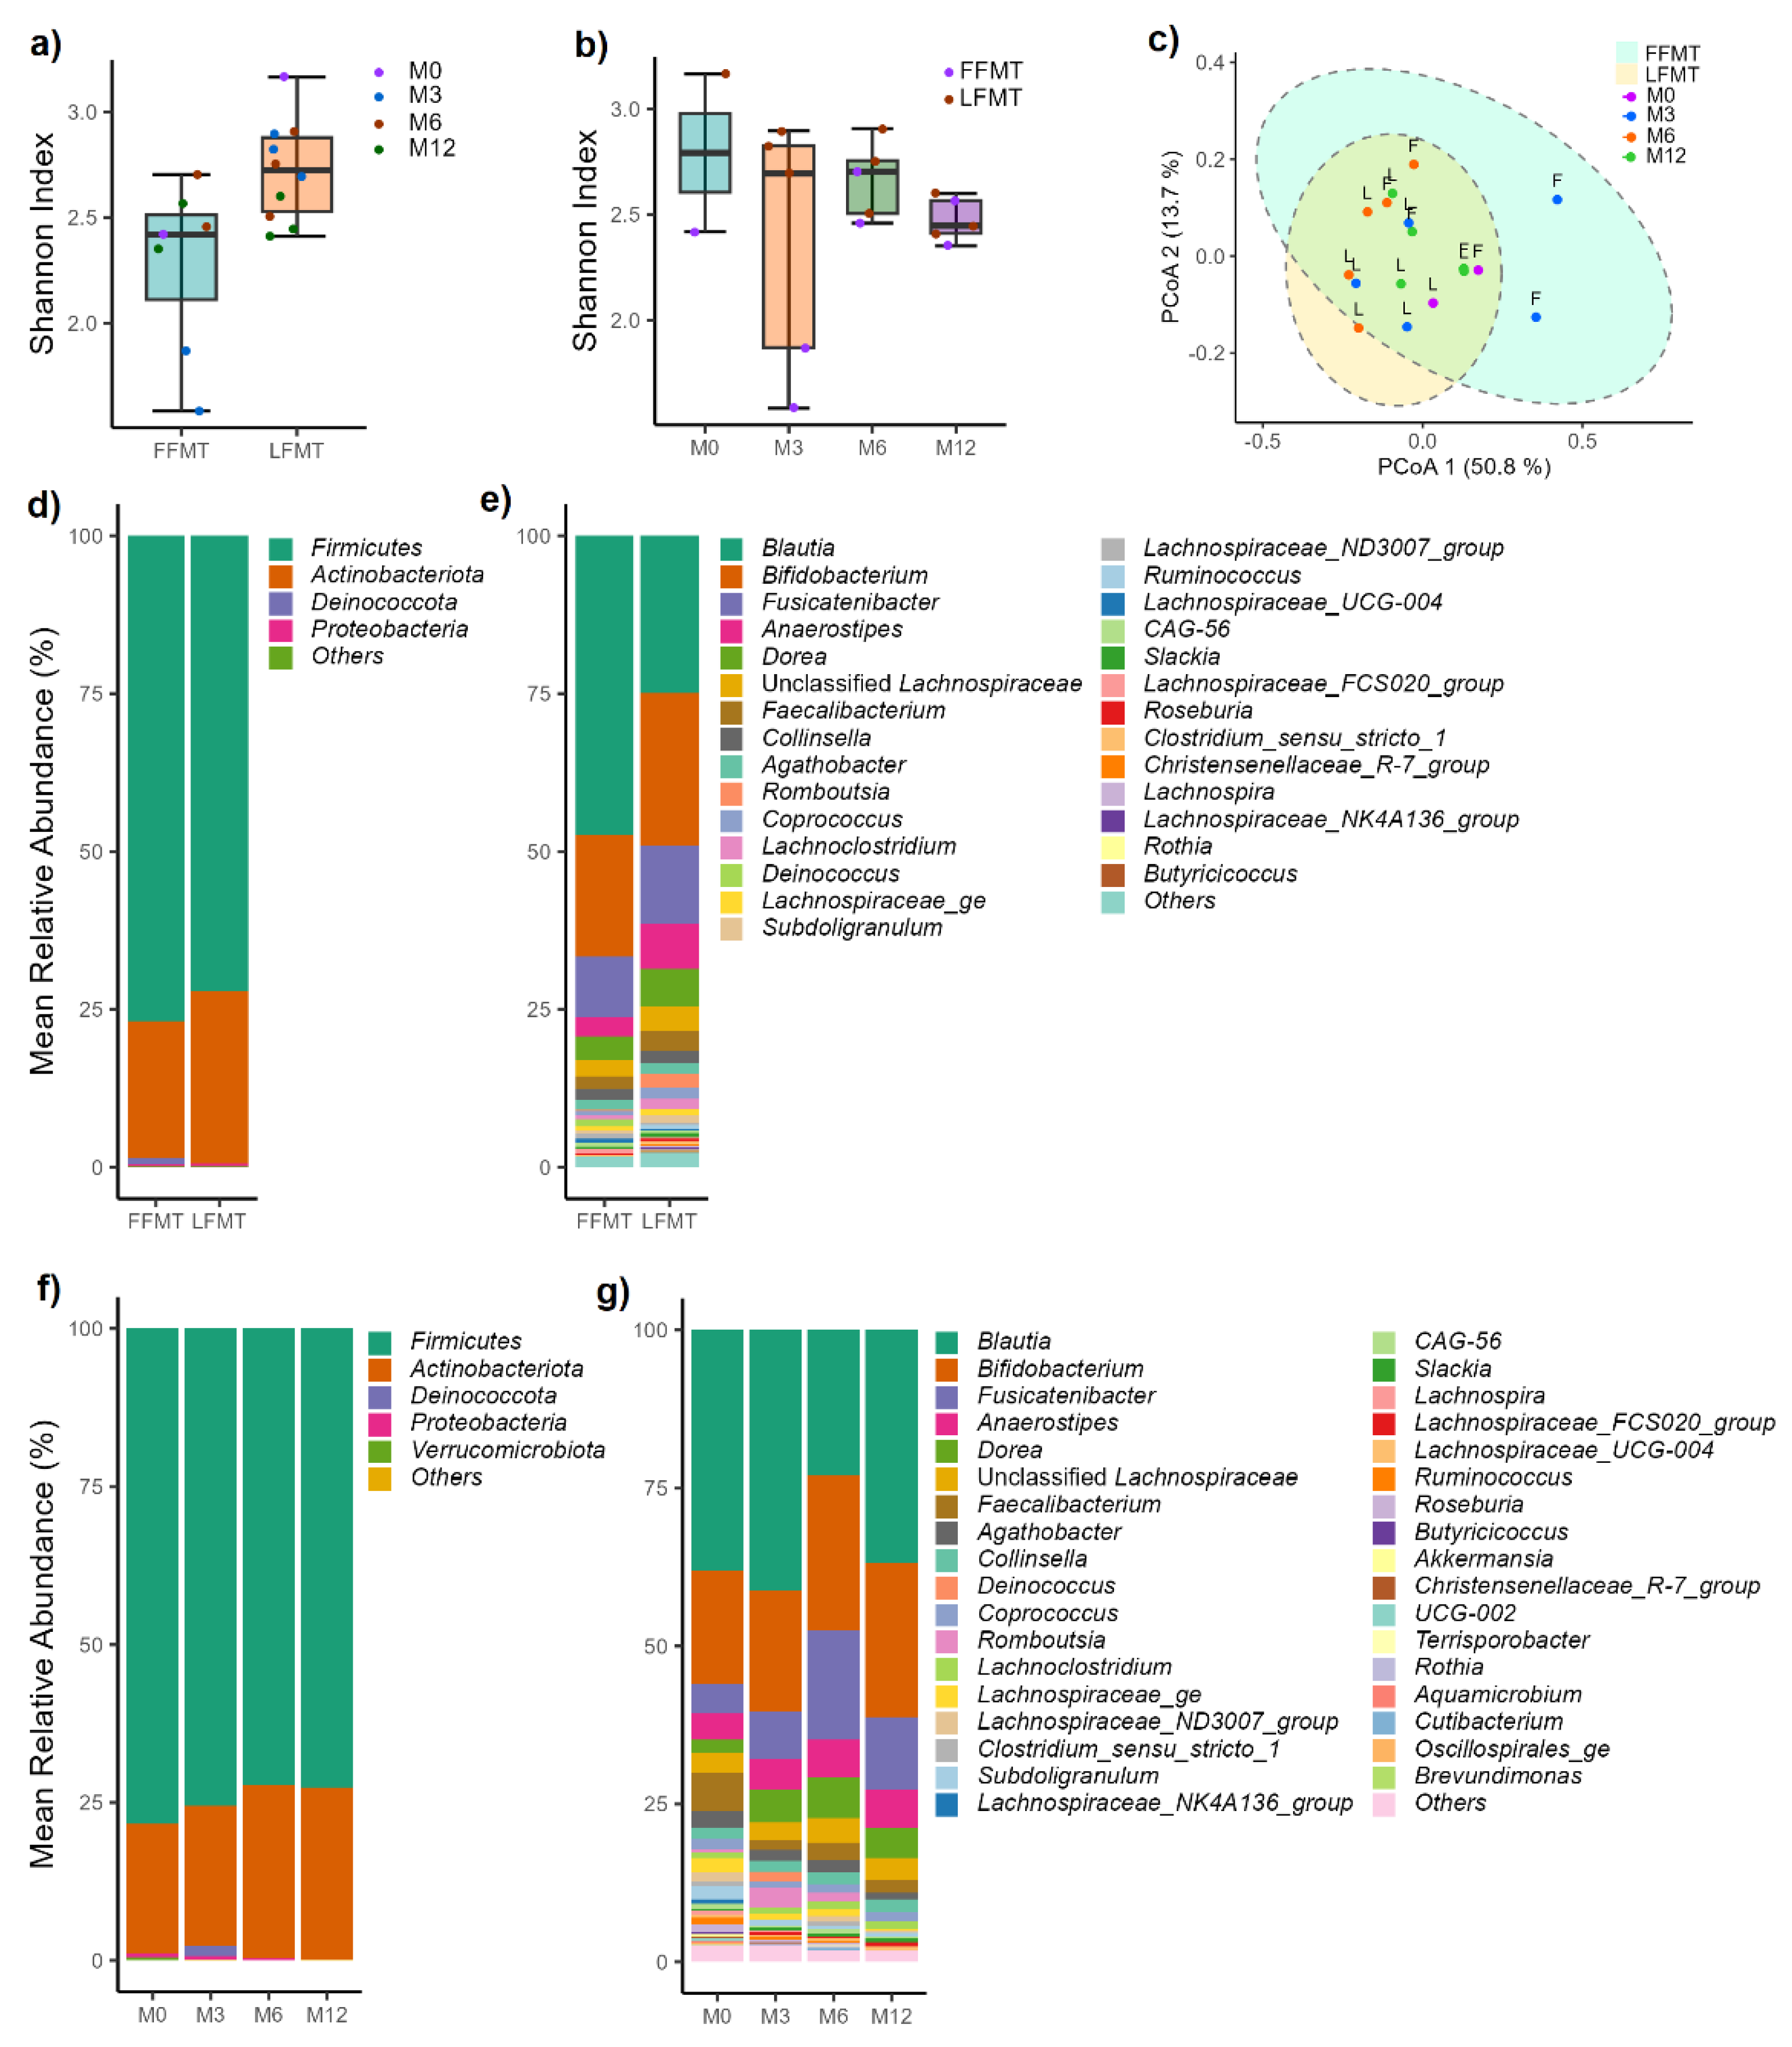
Figure 5.
Principal component analysis (PCA) scores generated using just short chain fatty acids (SCFAs): a) arabinoxylan vs. inulin; b) temperature; c) time (Month 0, 3, and 12); d) frozen fecal microbiota transplantation material (FFMT) vs. lyophilized FMT material (LFMT); and e) biplot showing scores (red diamonds) and loadings (blue triangles). Scores represent individual samples, and loadings represent individual variables and how they contribute to the principal components. * denotes statistical significance (p < 0.05). Summary statistics cannot be computed for (b) due to low statistical power.
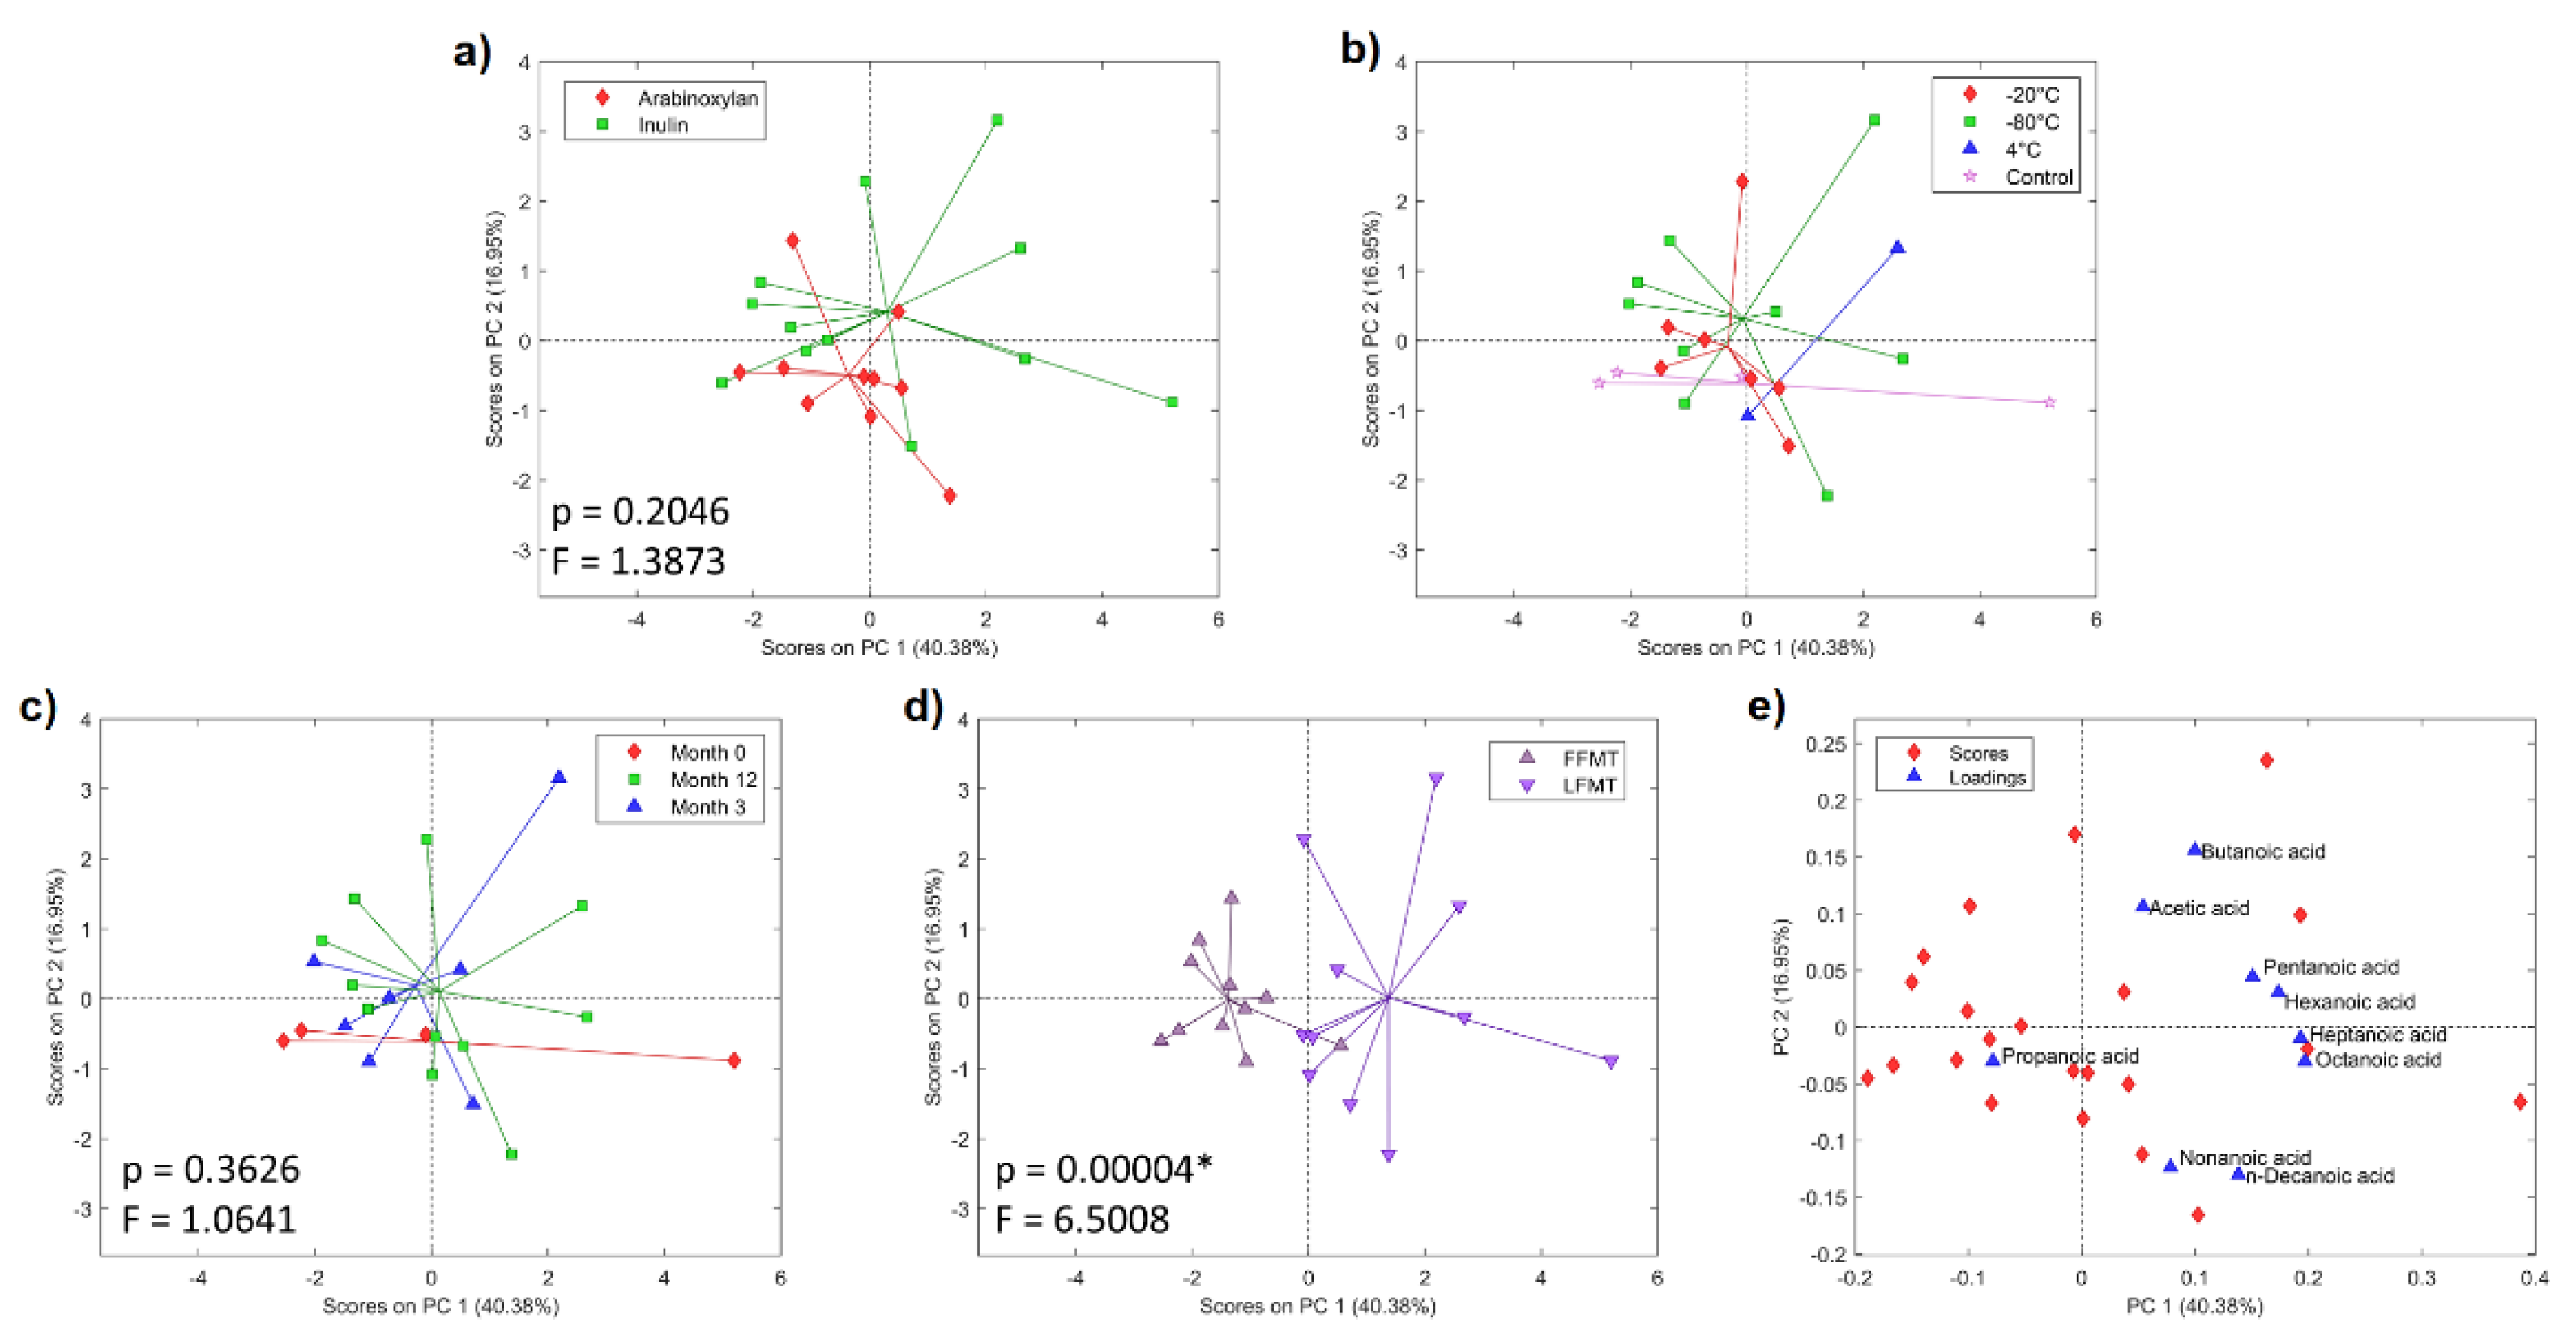
Figure 6.
Clinical success rate of fecal microbiota transplantation (FMT). a) The age of patients negatively affected FMT efficacy. The efficacy of frozen FMT (FFMT) and lyophilized FMT (LFMT) materials gradually decreased with increasing storage durations. Greater than 75% success rates were observed with b) LFMT stored for up to 140 days and c) FFMT stored for up to 250 days. d) The multivariate analysis also showed that the age of the patient and FMT storage duration had the greatest negative impacts on clinical success rates.
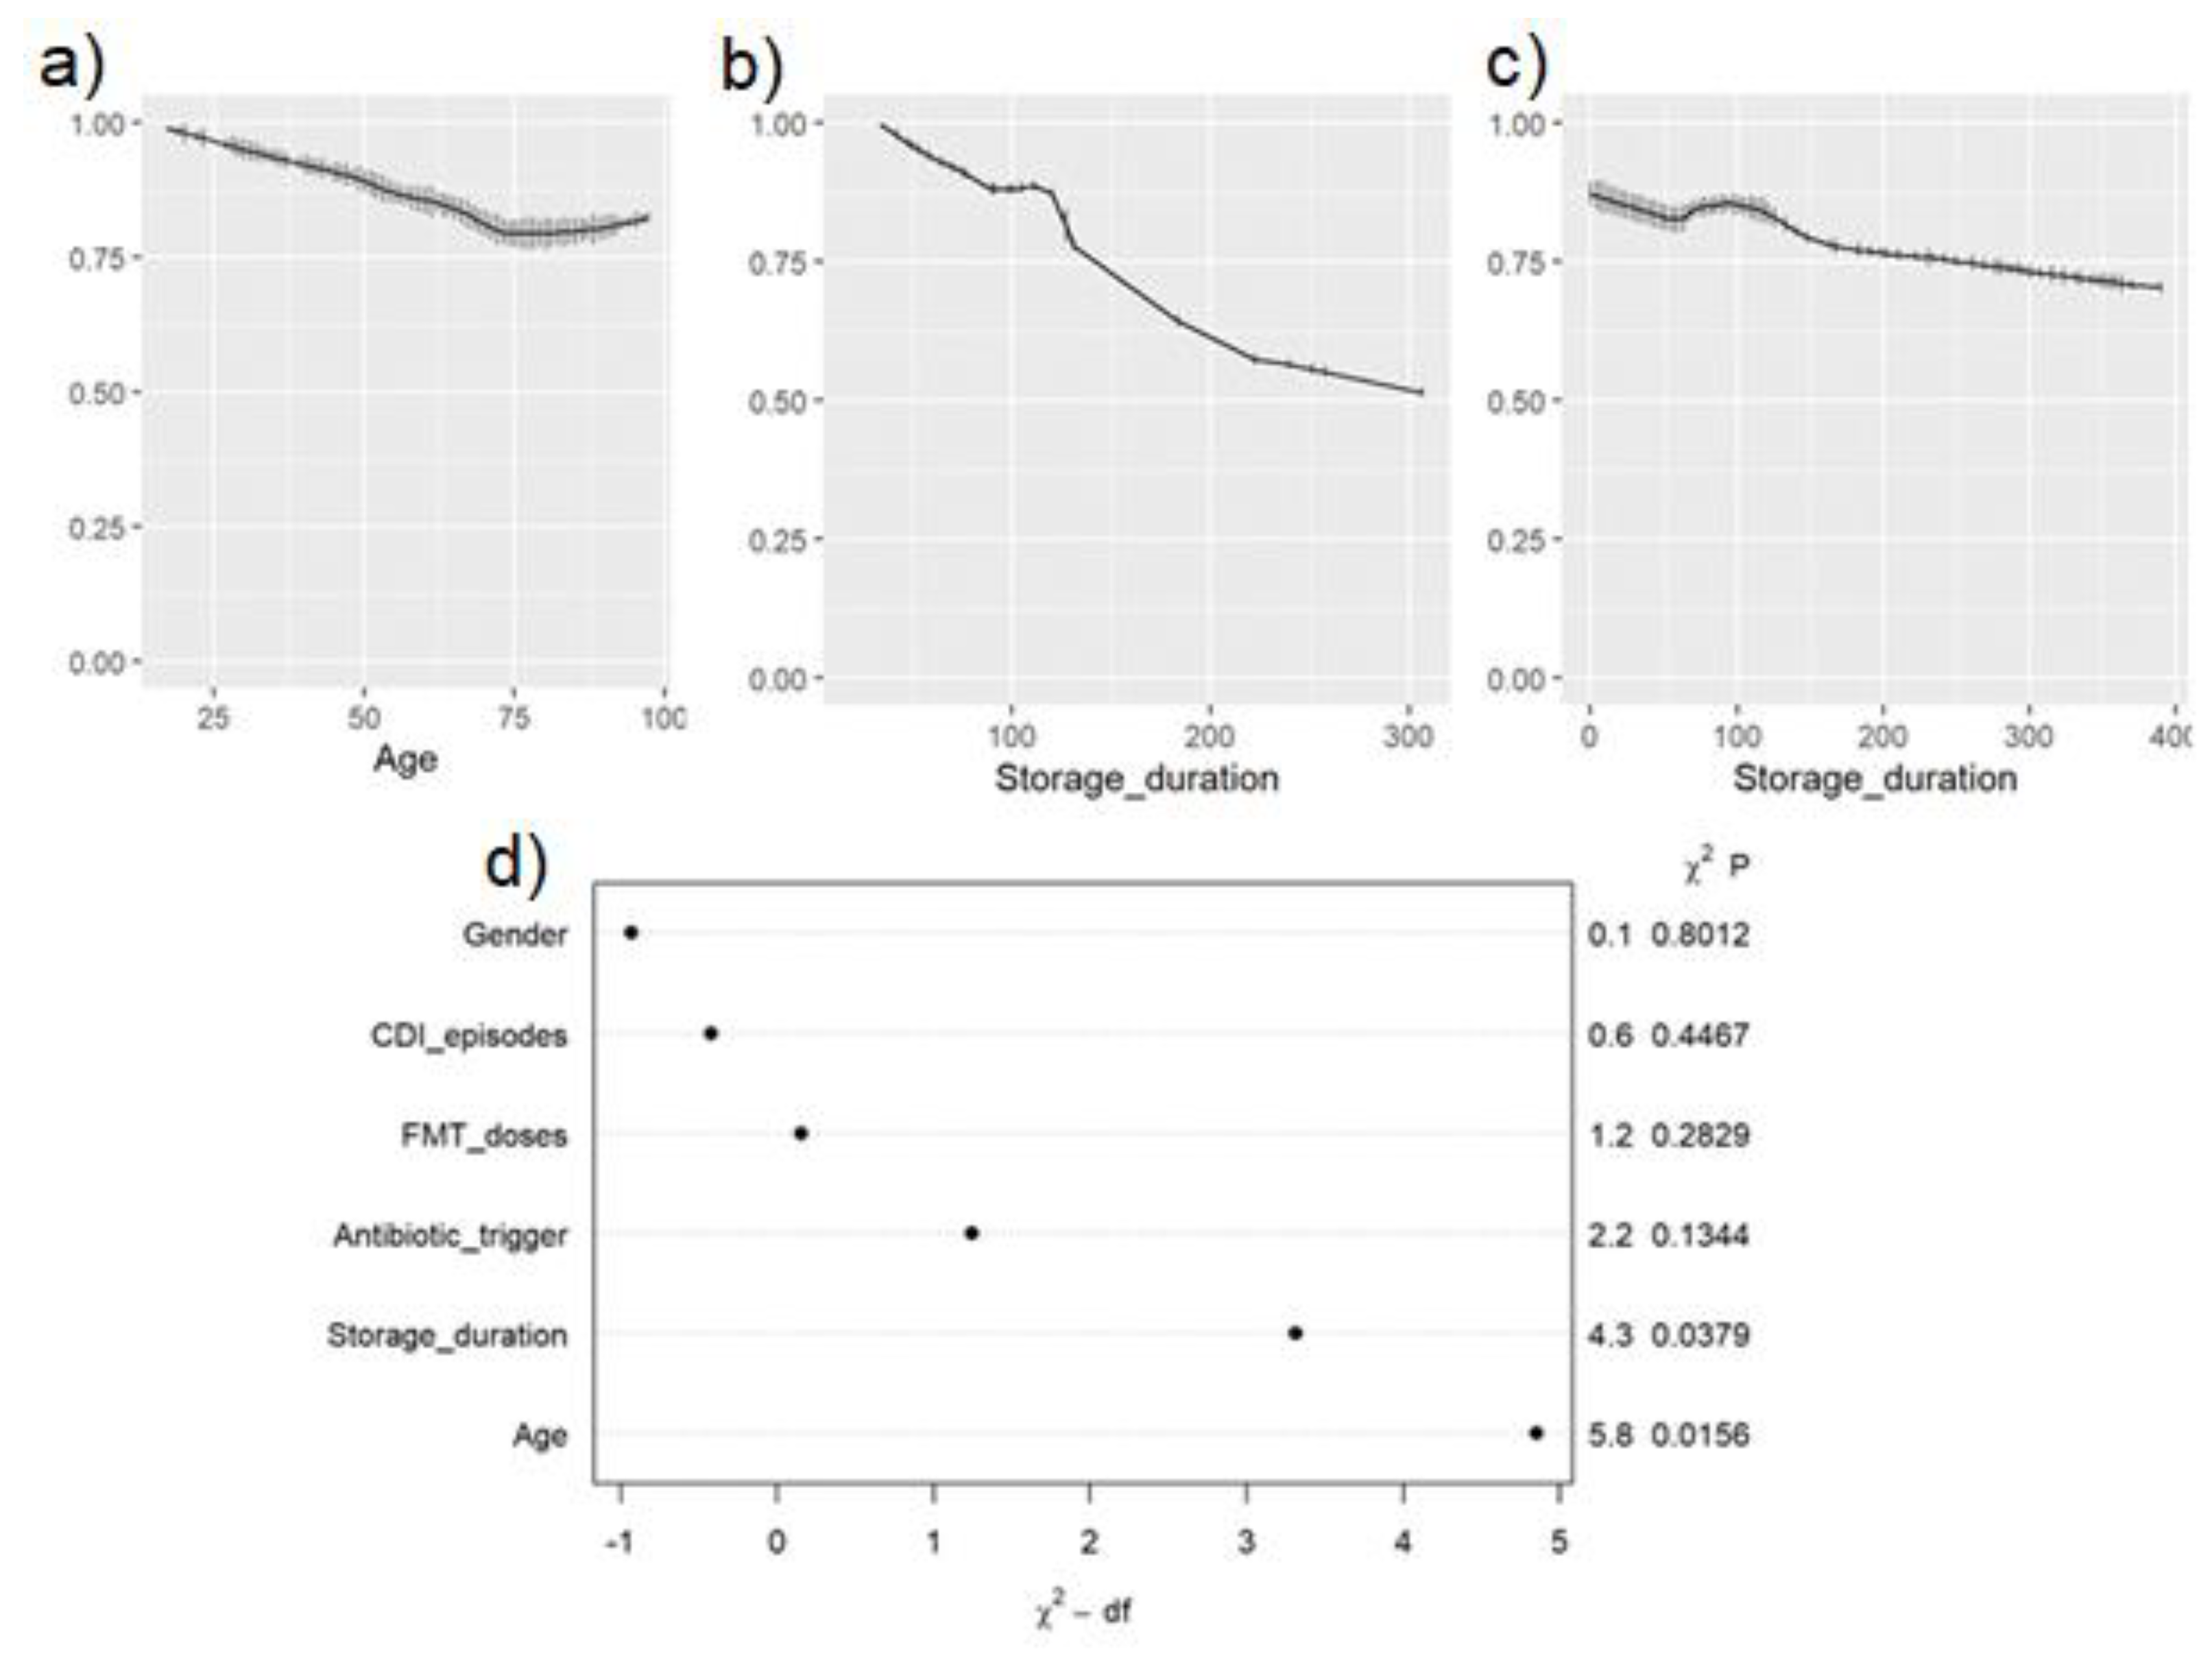

Table 1.
Fecal microbiota transplantation (FMT) recipient characteristics and clinical success rates.
Table 1.
Fecal microbiota transplantation (FMT) recipient characteristics and clinical success rates.
| Fresh FMT (N = 33) |
Frozen FMT (N = 406) |
Lyophilized FMT (N = 98) | p-Value | ||
|---|---|---|---|---|---|
| Age in years, mean (SD) | 61.2 (20.5) | 66.5 (17.5) | 62.2 (17.5) | 0.036* | |
| Sex | Female | 18 (54.5%) | 241 (59.4%) | 62 (63.3%) |
0.64 |
| Male | 15 (45.5%) | 165 (40.6%) | 36 (36.7%) | ||
| # of CDI episodes prior to FMT, median (IQR) | 3 (3–3) | 3 (3–4) | 3 (3–4) | 0.14 | |
| Antibiotic trigger prior to CDI | 32 (97.0%) | 356 (87.7%) | 89 (90.8%) | 0.21 | |
| Storage Duration in days, median (IQR) | 46.5 (21–107) | 100 (69–127) | <0.001* | ||
| Success rate, mean % | 83.0 | 90.9 | 85.7 | 0.36 | |
| Success rate, above 75% | NA | 250 days | 140 days | ||
p-Values were calculated based on Pearson’s chi-square test for categorical variables and Wilcoxon rank sum test for continuous variables. * denotes statistical significance (p<0.05). SD = Standard deviation, IQR = Interquartile range and NA = Not applicable.
Table 2.
Adjusted odds ratios for the success of lyophilized (LFMT) and frozen (FFMT) fecal microbiota transplantation material using a multivariable logistic regression model.
Table 2.
Adjusted odds ratios for the success of lyophilized (LFMT) and frozen (FFMT) fecal microbiota transplantation material using a multivariable logistic regression model.
| Odds Ratio (95% CI) | p-Value | ||||
| FFMT | LFMT | FFMT | LFMT | ||
| Age in years | 0.979 (0.962, 0.996) | 1.004 (0.972, 1.038) | 0.017 | 0.8 | |
| Sex | Female | 1.135 (0.667, 1.931) | 2.230 (0.688, 7.231) | 0.64 | 0.18 |
| Male | Reference | Reference | |||
| # of C. difficile infection (CDI) episodes prior to FMT | 1.123 (0.891, 1.415) | 1.141 (0.590, 2.206) | 0.33 | 0.7 | |
| Antibiotic trigger prior to CDI | 0.448 (0.143, 1.400) | 2.508 (0.418, 15.052) | 0.17 | 0.31 | |
| Storage duration | 0.997 (0.994, 0.9998) | 0.990 (0.981, 0.999) | 0.033* | 0.038* | |
* denotes statistical significance (p<0.05). CI= Confidence interval.
Disclaimer/Publisher’s Note: The statements, opinions and data contained in all publications are solely those of the individual author(s) and contributor(s) and not of MDPI and/or the editor(s). MDPI and/or the editor(s) disclaim responsibility for any injury to people or property resulting from any ideas, methods, instructions or products referred to in the content. |
© 2025 by the authors. Licensee MDPI, Basel, Switzerland. This article is an open access article distributed under the terms and conditions of the Creative Commons Attribution (CC BY) license (http://creativecommons.org/licenses/by/4.0/).
Copyright: This open access article is published under a Creative Commons CC BY 4.0 license, which permit the free download, distribution, and reuse, provided that the author and preprint are cited in any reuse.


