1. Introduction
One of the problems that concerns our society today is the pollution of our rivers by the presence of plastics. The most significant contributions of this pollutant are through plastics deposited in urban watersheds that are dragged along during flooding events caused by intense storms. The urban basins that make the greatest contribution are those located in the most vulnerable areas of the cities precisely because, due to their characteristics, they have a lower rate of waste collection by the municipalities, a higher population density, a population with lower purchasing power, among other characteristics.
The most vulnerable areas are the result of rapid urbanization that has led to an increasing number of inhabitants of marginal neighborhoods and to inadequate and overloaded infrastructure and services, such as waste collection, water and sanitation systems, roads and transportation.
One of the problems of large cities is the generation of different types of waste. High population density and inadequate waste management cause damage to the environment and people's health.
This shows the importance of carrying out integral and multidisciplinary analyses of solid waste management that include community participation, strengthening of urban infrastructure and public policies aimed at reducing the generation of plastics, promoting their recycling and preventing them from reaching bodies of water, also considering studies from the hydrology that is responsible for the dragging, thus contributing to sustainable development.
Surface hydrology is an important driver of floating plastic mobilization, transport, and retention dynamics. Especially during peak discharge events, a strong response in plastic flux is observed in cities with high litter burdens. However, the exact relationships between surface hydrology and plastic transport are non-trivial and vary greatly between and among different channels [
1]
van Emmerik indicates that fundamental work is needed to arrive at a more general understanding of plastic transport mechanisms. Estimates of mass plastic transport remain highly uncertain, in most cases larger than an order of magnitude [
1]
Furthermore, most existing models attempt to predict variations in plastic flux solely from river discharge, precipitation, and wind speed. Overall, the relationship between pollution, environmental conditions, and riverine plastic transport is very complex and is only just beginning to be understood [
2]
Lebreton et al., 2017 in their article “River plastic emission to the world's oceans” propose a global model of plastic input from rivers. The global model uses data on individual watershed characteristics such as population density (inhabitants per km2), poorly managed plastic waste production per country (kg/inhabitants*day) and average monthly runoff (mm/day). The model is calibrated with measurements of plastic concentration in rivers in Europe, Asia, North and South America.
They estimated that between 1.15 and 2.14 million tons of plastic reach the ocean from rivers each year, with more than 74% of the emissions occurring between May and October. Most of the most polluted rivers are in Asia [
3]
The study also found that there is a substantial variation in the amount of plastic throughout the year, which is concordant with drought and wetness events; floods play an important role in the transport of plastic in the system. Plastic concentrations showed a statistically significant correlation with population density and the proportion of urban development in the watersheds.
C. Roebroek et al. (2022) for the first time perform a global analysis of the impact of floods on plastic mobilization. They use global flood maps and global data on mismanaged plastic waste (MPW). They superimpose both data and from this they approximate the plastic potential that is possible to be mobilized during events with different return periods.
From this study, Roebroek et al. showed that floods increased the plastic mobilization potential. Plastic mobilization during floods with a relatively low severity (10-year return period) increases by more than 10 times. Also, a large spatial variation between and within countries will be observed.
During non-flood conditions, 0.8 million tonnes (Mt) of plastic are mobilized per year worldwide, while during an undefended flood with a 10-year return period, an estimated 7.3 Mt per year is mobilized (almost 10 times more). Floods with longer return periods mobilize even more plastic, but the relative increase is not as large because extreme floods increase flood depth rather than extent, thus resulting in less newly deposited plastics [
4]
When floods are taken into account, the expected global annual mobilization of plastic shows a net increase of 140% [
2].
In conclusion, this work shows that mass transport estimates for specific rivers remain highly uncertain, even when relatively large and detailed data sets are available. As established by Roebroek et al. (2022), the greatest uncertainty in mass transport estimates is found within the highly variable mass statistics of garbage items (plastics).
At the national level, Penza, T. analyzed the transport of plastics from the Dupuy basin to the Riachuelo-Matanza, Buenos Aires Argentina. The work was carried out based on the Comprehensive Environmental Sanitation Plan (PISA), which is the document that guides the work of the Matanza Riachuelo Basin Authority (ACUMAR), allowing coordinated action between the different actors working to solve the problems of the region. To do this, Penza created the EPASWMM model of the basin considering solid waste. The program allows to simulate both the quantity and quality of the evacuated water, especially in urban sewers. In addition to modeling the generation and transport of surface runoff, SWMM can also estimate the production and evolution of pollutant loads associated with said runoff [
4].
Particularly in the Province of Cordoba there are no studies on the transport of plastic waste from urban basins to rivers. Current pollution works on the river do not address this problem. There are various and varied pollution studies on the Suquia River, but they are linked to the quality of the river water.
This work seeks to advance plastic pollution studies of the main water courses in the city of Córdoba, Argentina
Cities have historically developed around rivers and the city of Cordoba is not exempt from this characteristic. Córdoba was founded on July 6, 1573 on the banks of the Suquia River by Jeronimo Luis de Cabrera. The Suquia River is a historical heritage that permeates our identity. It runs through the city and is crossed by several bridges along the urban area, which earned the city the nickname of the city of bridges.
The Suquia River is the main water course in the City of Cordoba and is being greatly damaged by human action. Currently, it presents high levels of contamination, affecting not only its water condition but also the populations that are supplied by it and in the localities that have their boundaries crossed by the river, which instead of generating a valuable lung and longitudinal park, shows a vision of socio-environmental degradation in long sectors. Proof of its contamination is the fact that there are signs that prohibit its use as bathing water within the city of Cordoba.
One of the main pollutants of the river is plastics due to various causes of anthropic origin, on the one hand, the incorrect disposal of these in the basin, in some cases they are thrown directly into the channel and in other cases the incorrect disposal and inadequate management causes them to be transported to the river during runoff events. This situation is worrying for society, which in 2020, faced with this situation, a group of young people came together to clean, sanitize and recover the river.
The Suquia River represents a gigantic green lung and a linear park that citizens use for outdoor activities. In recent years, citizens have increased their interest in preserving and revaluing the river and governments have listened to this interest and developed various proposals to incorporate it into the dynamics of the city.
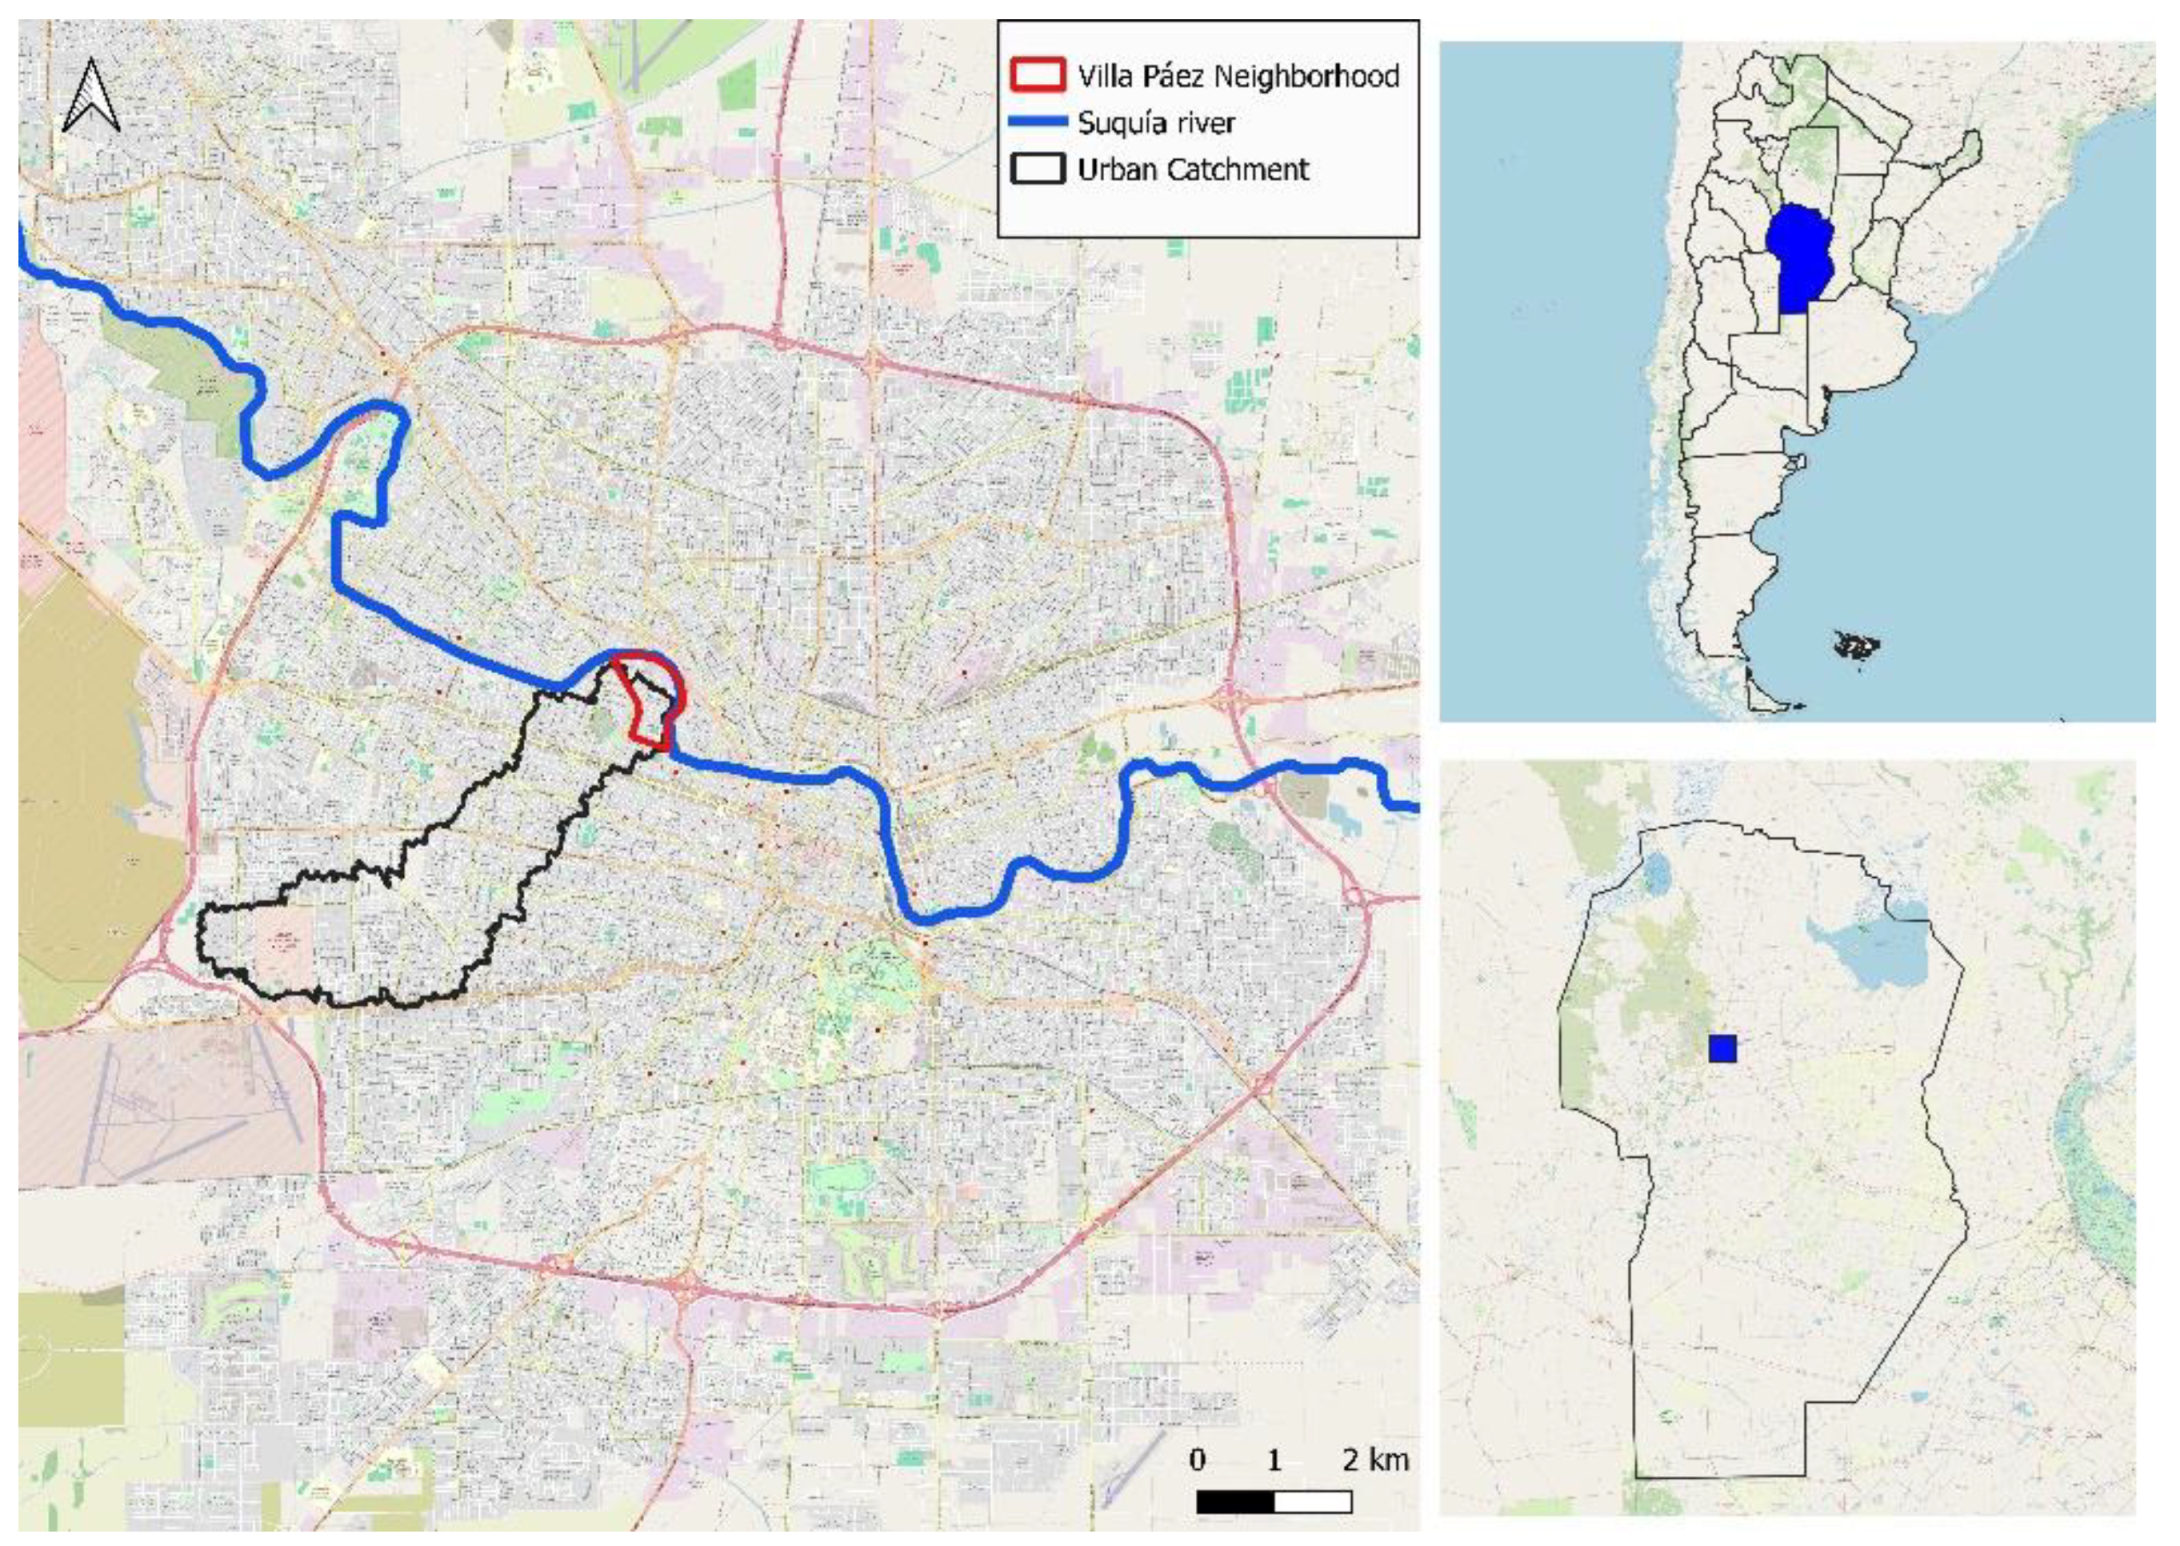
The study area of the work is the Villa Paez neighborhood, which is located at the end of a basin located in the city of Cordoba Capital, the second most populated city in the Argentine Republic. The basin has a contribution surface of 5 km2 draining in a northeasterly direction towards the Suquia River, which runs through the city in an easterly direction.
This neighborhood is located west of the center of the city of Cordoba. It is a neighborhood with a significant population density, inhabited mainly by the working class.
Villa Paez has faced various environmental problems that have affected its inhabitants for years. Problems of flooding, sewage overflows, noise pollution and poor management of urban solid waste.
This work sought to contribute to the expansion of studies on the problem of urban solid waste using direct and indirect methods to define the effects of garbage in urban watersheds and its effect not only on runoff but also on environmental degradation. Due to the transversal nature of the problem, an integral and multidisciplinary analysis is proposed, involving socioenvironmental studies, citizen participation, images and hydrological models of contaminant transport.
2. Materials and Methods
The problem of characterizing and addressing the social situation of neighborhoods and urban settlements, especially those located on the banks of rivers, is essential to be able to link the type of plastic waste that is thrown into the streets or deposited there and that, due to inadequate management by the organizations that must collect and dispose of it properly, ends up dragged along the waterways and finally ends up in lakes or the sea.
A comprehensive approach to plastics transported by waterways and riverside populations allows for better-planned management decisions to be made that comprehensively consider the problem to provide sustainable environmental responses.
The work was carried out, in the area of the city of Cordoba, in Villa Paez sector where citizen science projects are being developed. [
5]. It is located at the end of a basin located in the city of Córdoba Capital, the second most populated city in the Argentine Republic. (
Figure 1) The basin has a contribution surface of 5 km
2 draining in a northeasterly direction towards the Suquia River, which runs through the city in an easterly direction.
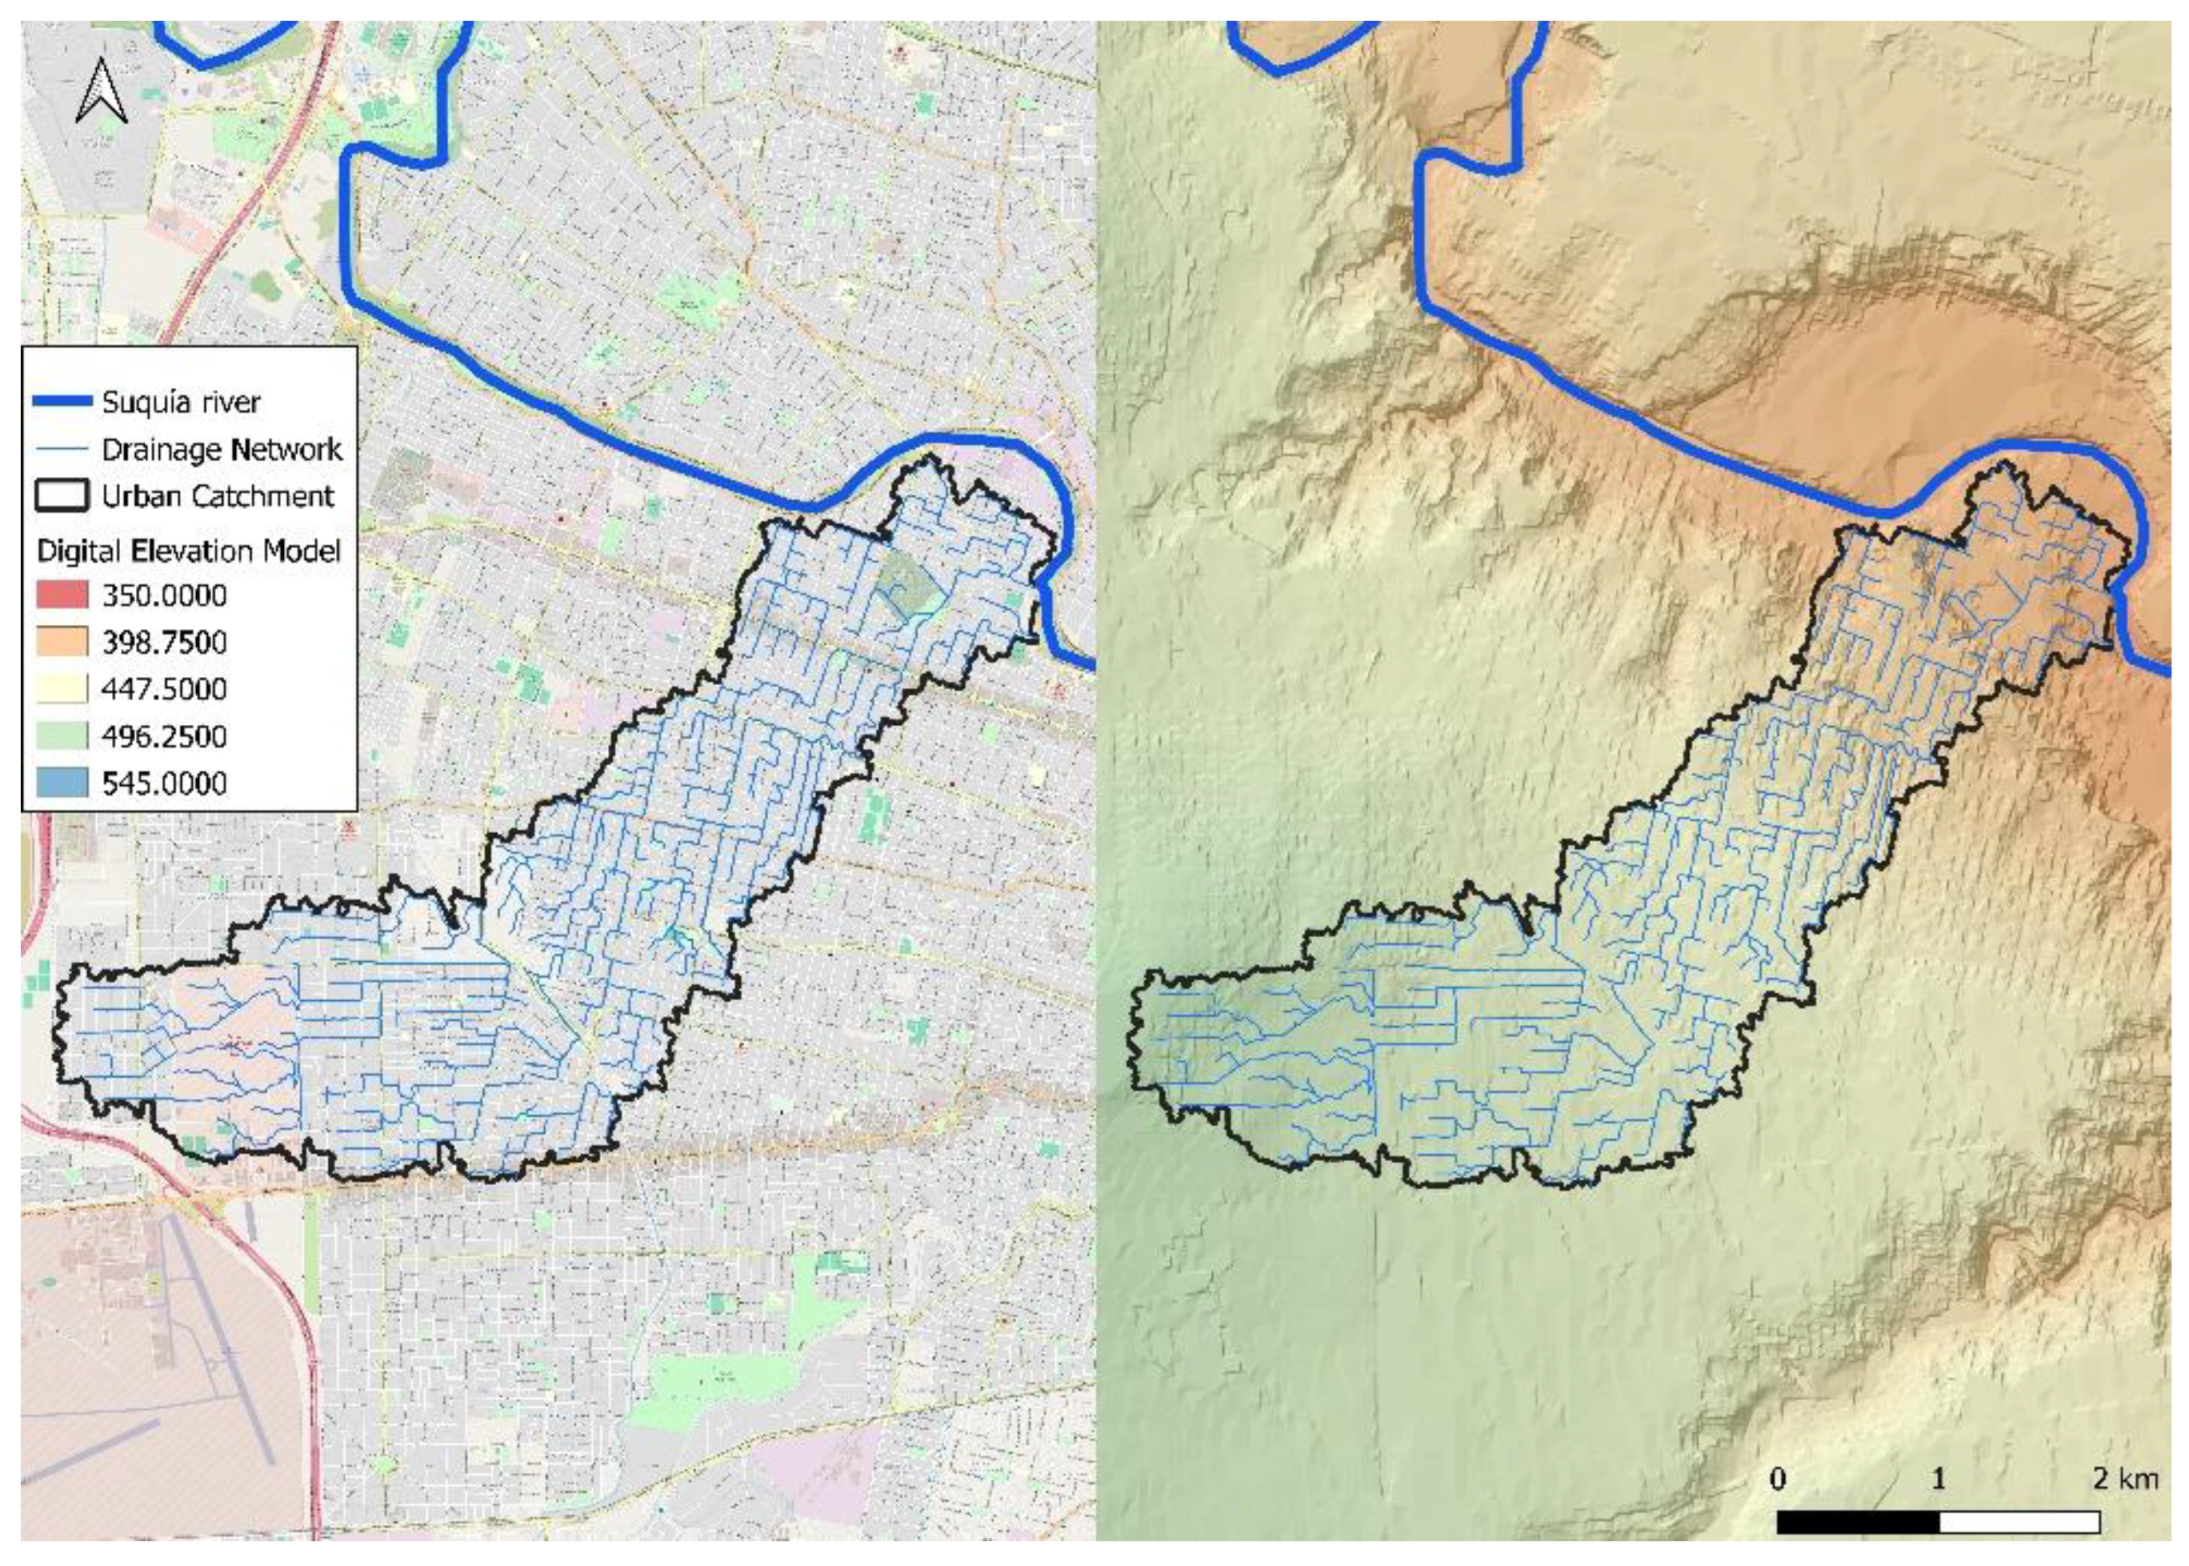
The Villa Páez neighborhood, located in the northwest of the pericentral area of the city of Córdoba, with an area of 0.57 km². It is located south of a bend in the Suquia River, a flood zone due to the overflow of the Suquia River in the city (
Figure 1) and in turn, the runoff from other neighborhoods cross the Villa Páez neighborhood to drain towards the Suquia River (
Figure 2). The density of the neighborhood is high, with an average of 9,469.61 inhabitants per km
2.
The Villa Paez neighborhood in Cordoba faces persistent flooding challenges, experiencing both pluvial flooding from local urban rainfall and fluvial flooding from the Suquia River. Residents with over five decades of experience report recurrent flood events of varying magnitudes. The neighborhood's flood risks are classified across multiple hazard levels, ranging from partial inundation during ordinary river rises to potential complete flooding during exceptional events. This vulnerability is exacerbated by urban infrastructure limitations, high population density, and problematic waste management, making the area particularly susceptible to hydrological risks.
The challenges of quantifying urban flooding in Villa Paez stem from multiple methodological obstacles. Urban catchments lack comprehensive historical hydrological data, making precise flood characterization difficult. The heterogeneous nature of flooding processes complicates consistent measurement, while precipitation records remain incomplete. Additionally, significant land use changes over decades alter runoff dynamics, further compromising the reliability of traditional hydrological modeling approaches. These limitations necessitate innovative research methodologies, such as integrating citizen science, satellite imagery, and field observations to develop more comprehensive urban flood understanding.[
6]
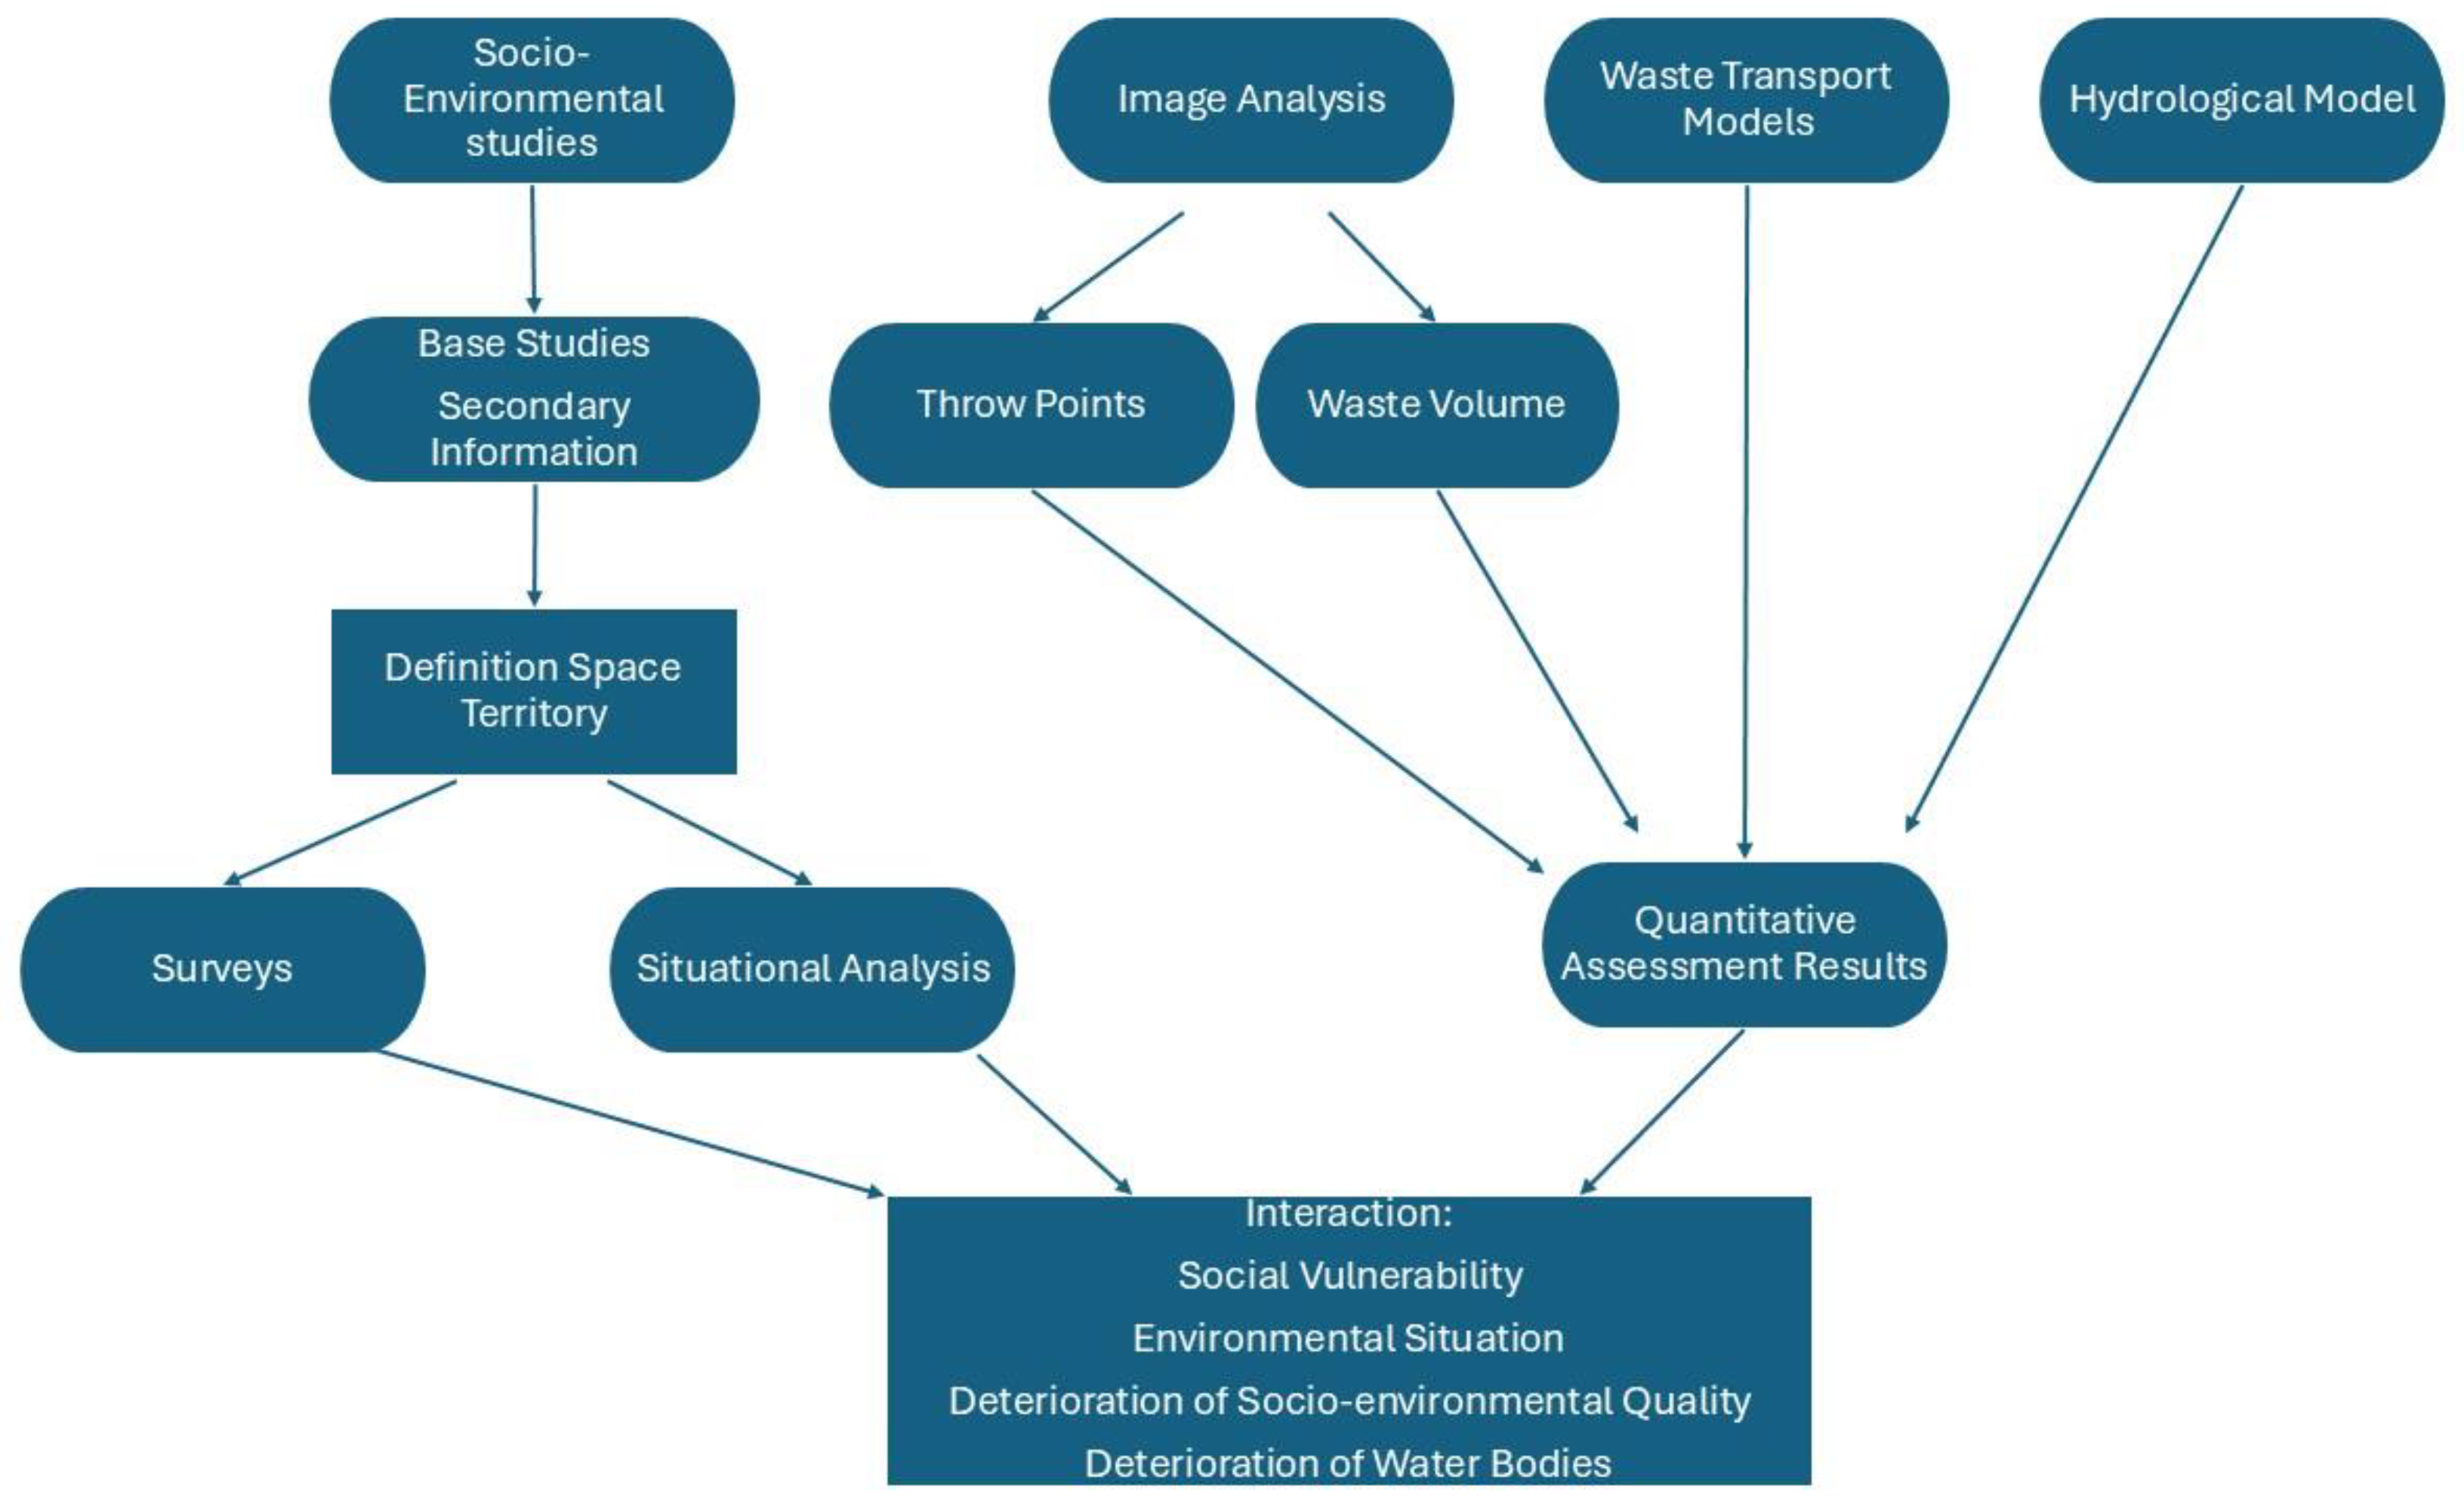
Faced with the challenge of the integrity of the problem, a multidisciplinary study was carried out consisting of socio-environmental studies, image analysis, waste transport models and hydrological models.
The socio-environmental studies were taken as a base, secondary studies, and the territory was defined based on these studies. Once the territory was defined, in order to go deeper into the waste situation in the neighborhood, surveys were made to the neighbors and field visits were made.
From the images it was possible to determine the garbage deposited in the streets, the points of accumulation, characterize the type of waste and the volume.
Together with the results of the analysis of the images, the waste transport model and the hydrological model, a quantitative assessment of the problem could be made, being the first study in the area to address the problem and approach it in an integrated manner.
Based on this methodology, the interaction between social vulnerability, the environmental situation, the deterioration of socio-environmental quality and the deterioration of water bodies was made evident.
Figure 3 shows an outline of the methodology used.
2.1. Socio-Environmental Studies
In 2018, within the framework of the work between the UNC and the Alberdi people network, the Faculty of Social Sciences carried out a study entitled "Socio-environmental diagnosis of Barrio Villa Paez" carried out in the chair of Theory, spaces and intervention strategies [
7]. In this work, a map was presented with a zoning of the environmental problems in the neighborhood. According to their complaints, neighbors were able to sectorize the problems in the neighborhood, mainly problems of urban solid waste, noise and flooding.
Faced with the situation that the neighborhood presented with environmental problems that were identified by the diagnosis made in 2018, in 2021 within the framework of the University Extension and Student Social Commitment (CSE) activity “Impact on Health of Climate Change and Water Pollution in Neighborhoods Adjacent to the Suquia River”, organized by the Semiology Chair of the Internal Medicine Hospital Unit No. 2, San Roque Hospital of the Faculty of Medical Sciences (already submitted for approval to the Secretariat of University Extension of the National University of Cordoba) and the Chairs of Fluid Mechanics and Sanitary Engineering of the Faculty of Exact Physical and Natural Sciences and the Chairs of Epistemology of Social Sciences and Social Work and Theory, Spaces and Intervention Strategies IV of the Faculty of Social Sciences, an observational, prospective, cross-sectional and descriptive study was developed. The sampling was random multi-stage of homes in which approximately N = 2000 families were considered according to the 2010 Census. [
8]
Survey and Data Collection
The survey considered globally accepted indicators of the impact of climate change, exposure to meteorological events and vulnerabilities [
9]. It was validated in a pilot test according to a qualitative approach and considering internal reliability, apparent validity of content and construct, as well as the feasibility of the instrument by nine professionals from different disciplines. The time required, simplicity, pleasantness of the format, brevity and clarity of the questions, recording, coding and interpretation of the results were also evaluated. [
8]
The survey was conducted by student assistants and trained students from the participating faculties to standardize the way of addressing the respondent, requesting informed consent and detailing how to complete the open questions. The survey consisted mostly of closed and short-answer questions, except for those related to expanding on some specific information. It was organized into 4 domains: 1) Identification data and comorbidities, 2) Home-climate and Suquia River relationship, 3) Health and meteorological phenomena, 4) Waterborne diseases or similar. It was completed on paper or digital forms. The data collected were included anonymized for processing in a database and strict confidentiality will be maintained. [
8]
The survey was conducted in September 2022. Students were divided into groups to tour the different areas within the study area.
Regarding the management of urban solid waste, four questions were asked.
Whether or not they had municipal waste collection at their home, 222 respondents, 203 answered yes and 18 said no. That is, 92% answered yes and 8% answered no; This is consistent with what was expressed in the 2010 census results, which stated that more than 90% of households have regular garbage collection.
Whether or not they had differentiated collection at their home: 86% of those surveyed responded that they did not have differentiated collection, 8% that they did have it and 6% that they did not know.
Frequency of municipal waste collection: 80% responded that the frequency is 6 days a week, 15% responded that less than 6 days a week.
Have they ever stopped collecting garbage for more than a week due to a flood, storm, or heat or cold wave: 63% of respondents said no, 24% said yes, and 14% said they did not know.
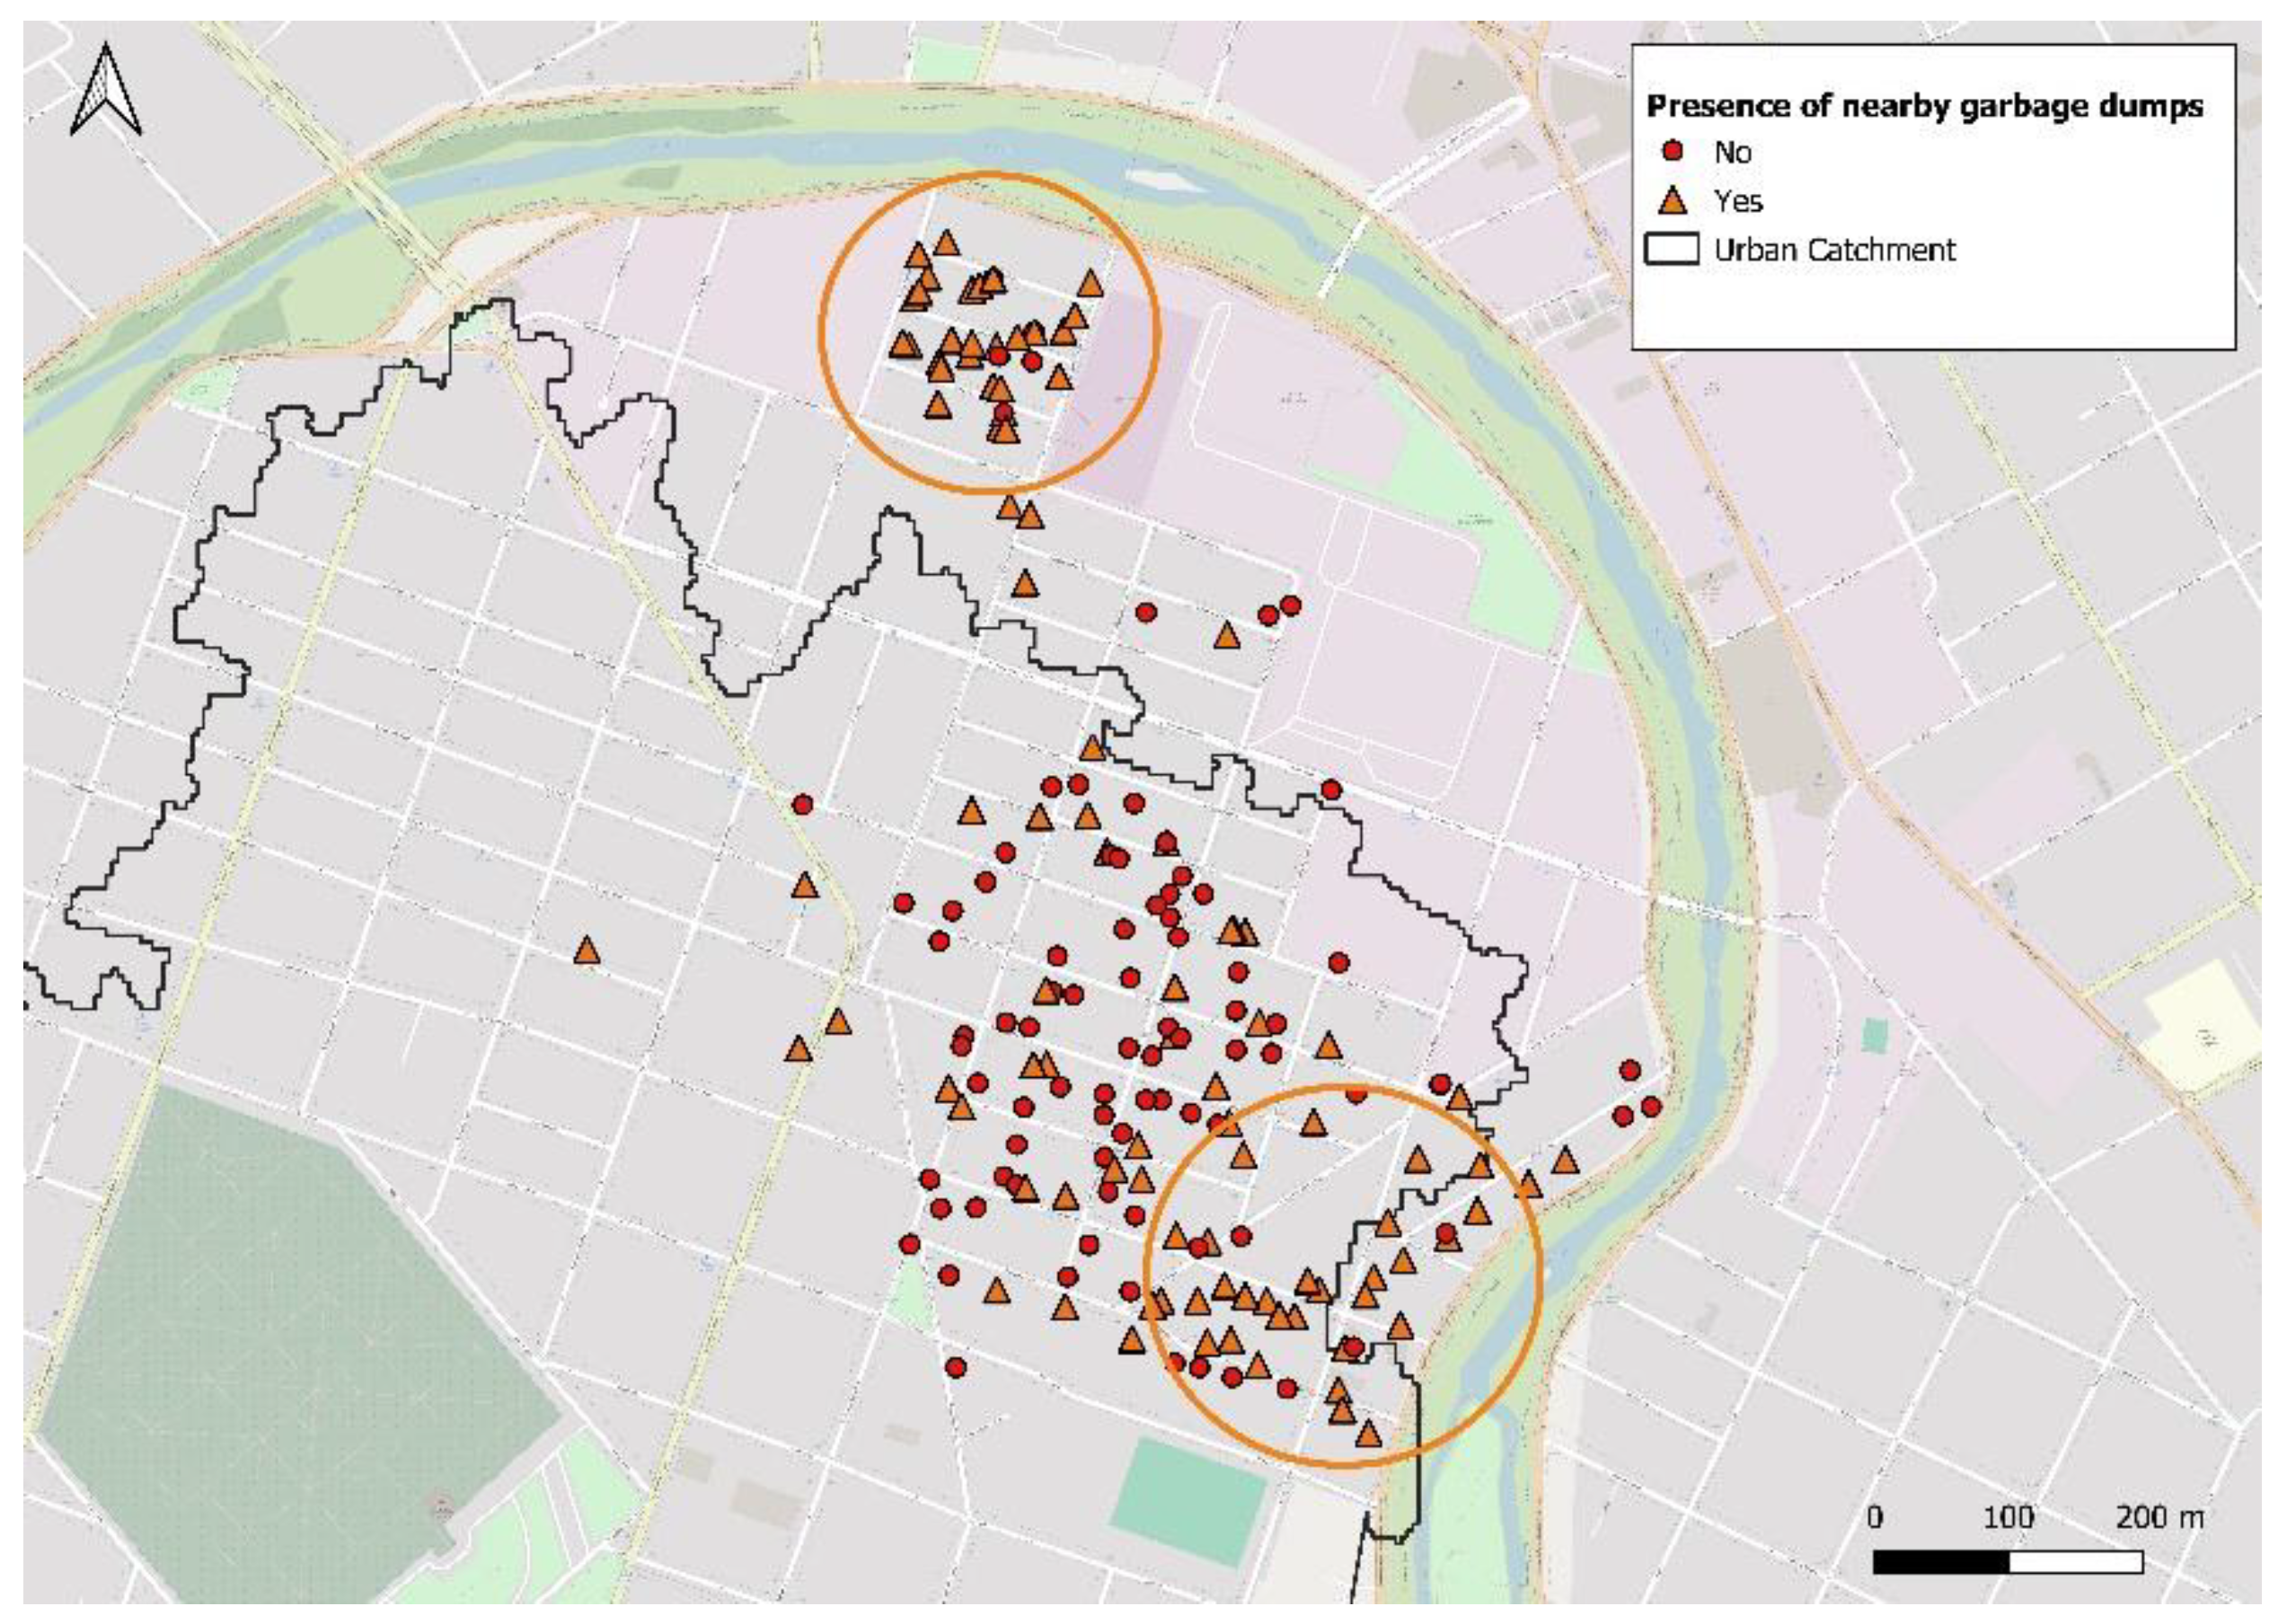
There are garbage dumps or places where garbage accumulates near their home: 51% answered yes, 45% answered no and 4% said they did not know. Half of the neighborhood identifies garbage dumps and dumping points.
The last question was georeferenced, and it was observed that the neighbors accuse there two garbage dumps, one to the north and one to the south (
Figure 4).
The surveys provided an overview of the urban solid waste situation.
The inadequate management of urban solid waste causes two different situations: on the one hand, garbage that is disposed of in the streets and, on the other hand, places where garbage accumulates on the streets, in green areas or in vacant lots.
2.2. Image Analysis
Garbage in the Streets
Although waste collection coverage is more than 90% throughout the neighborhood, neighbors reflect a different reality.
Through images obtained from Google Street View in 2023, it was possible to show what the neighbors reported about the presence of garbage in the streets. The disposed materials observed were wrappers, plastic bottles, garbage bags, cardboard, debris, among others.
This information has also been corroborated with the visits to the neighborhood with the citizen science projects carried out by the faculty. It could also be evidenced that approximately 1 consortium bag of 90x60x20 cm per block is found.
Landfills and Dumping Points
On the other hand, there are open-air dumps or dump sites, which are places where urban waste is disposed of without any type of treatment or safety measures. The final disposal of waste under this modality was a common practice for many years throughout the country, resulting in all cases in different environmental problems. This situation of social complexity brought about by the waste problem in the metropolitan areas of our country is due to the existence of an informal circuit of recovered materials. This circuit, which ends in the industries, begins with a pre-selection on public roads carried out by informal waste collectors who find in waste their means of subsistence, followed by a second selection, normally carried out in their own homes, in areas close to them or from the “depositeros”, with the consequent dumping of non-usable materials in places not suitable for such purposes, creating the conditions for the formation of new landfills.
Based on the survey conducted in the neighborhood, site visits and the analysis of satellite images and images of Google Street View application, 2 open dumps and 8 dumping points were determined.
2.3. EPA SWMM Model
The EPA SWMM model that was implemented was developed by Lopez, S. (2022) and was composed of 2,422 sub-basins, 134 junction nodes, 2,433 storage nodes, 3,204 pipelines, 190 holes and 10 outlet nodes.
The geometry of the sub-basins was defined using Conupy, which generates Thiessen polygons centered on the surface nodes of the model (corners and mid-block). The average area of the sub-basins is 0.31 ha.
To simulate the infiltration processes in the permeable subarea of the basin, the SCS-CN model was used, due to the simplicity of its parameters, since it depends mainly on the value of the curve number.
The average values of the CN-SCS parameter for the City of Cordoba are of the order of 82 for streets, 74 for parks and 79 for residences [
10].Therefore, it was decided to use these values according to land use, distinguishing between park (CN=74) and residential sub-basins (CN=80) [
6]
The sections of the surface conduits contain elevation information, which was sampled from the digital terrain model using the canopy tool, length, location, section and dimensions (information incorporated in the files uploaded to canopy). The manning values for the streets are 0.020 and for the conducts 0.015.
The holes connect the surface runoff (from streets) with the storm drain network. López used a hole-type section 2 meters long by 15 cm high (average height of the sidewalk curb). These dimensions are used by default for the model configuration and were modified by storm drains surveyed in-situ, mainly the storm drains within the Villa Paez neighborhood [
6].Regarding the discharge coefficient, the value of 0.66 suggested in the bibliography was adopted [
11]
Storage nodes are nodes with the capacity to retain water in them, so that they contain a curve that relates the flooded area with the height of the water. These nodes are located at the corners or in the middle of the block and represent the way in which water accumulates in those sectors. To do this, they analyzed the basin where there are sectors with different behavior. In the lower basin there are houses without a garden in the front (in general) and with walls or gates that do not allow water to enter the houses until the level at the corner takes values on average of 1 meter. In the upper part of the basin, a large part of the houses has gardens in front of the house, so from 20 cm the water enters the houses and therefore these nodes can store a greater amount of water for lower heights. Due to the interest focused on the behavior of the basin in the Villa Paez neighborhood, it was decided to use storage nodes with characteristic curves of the lower basin [
6].
2.4. Design Storm
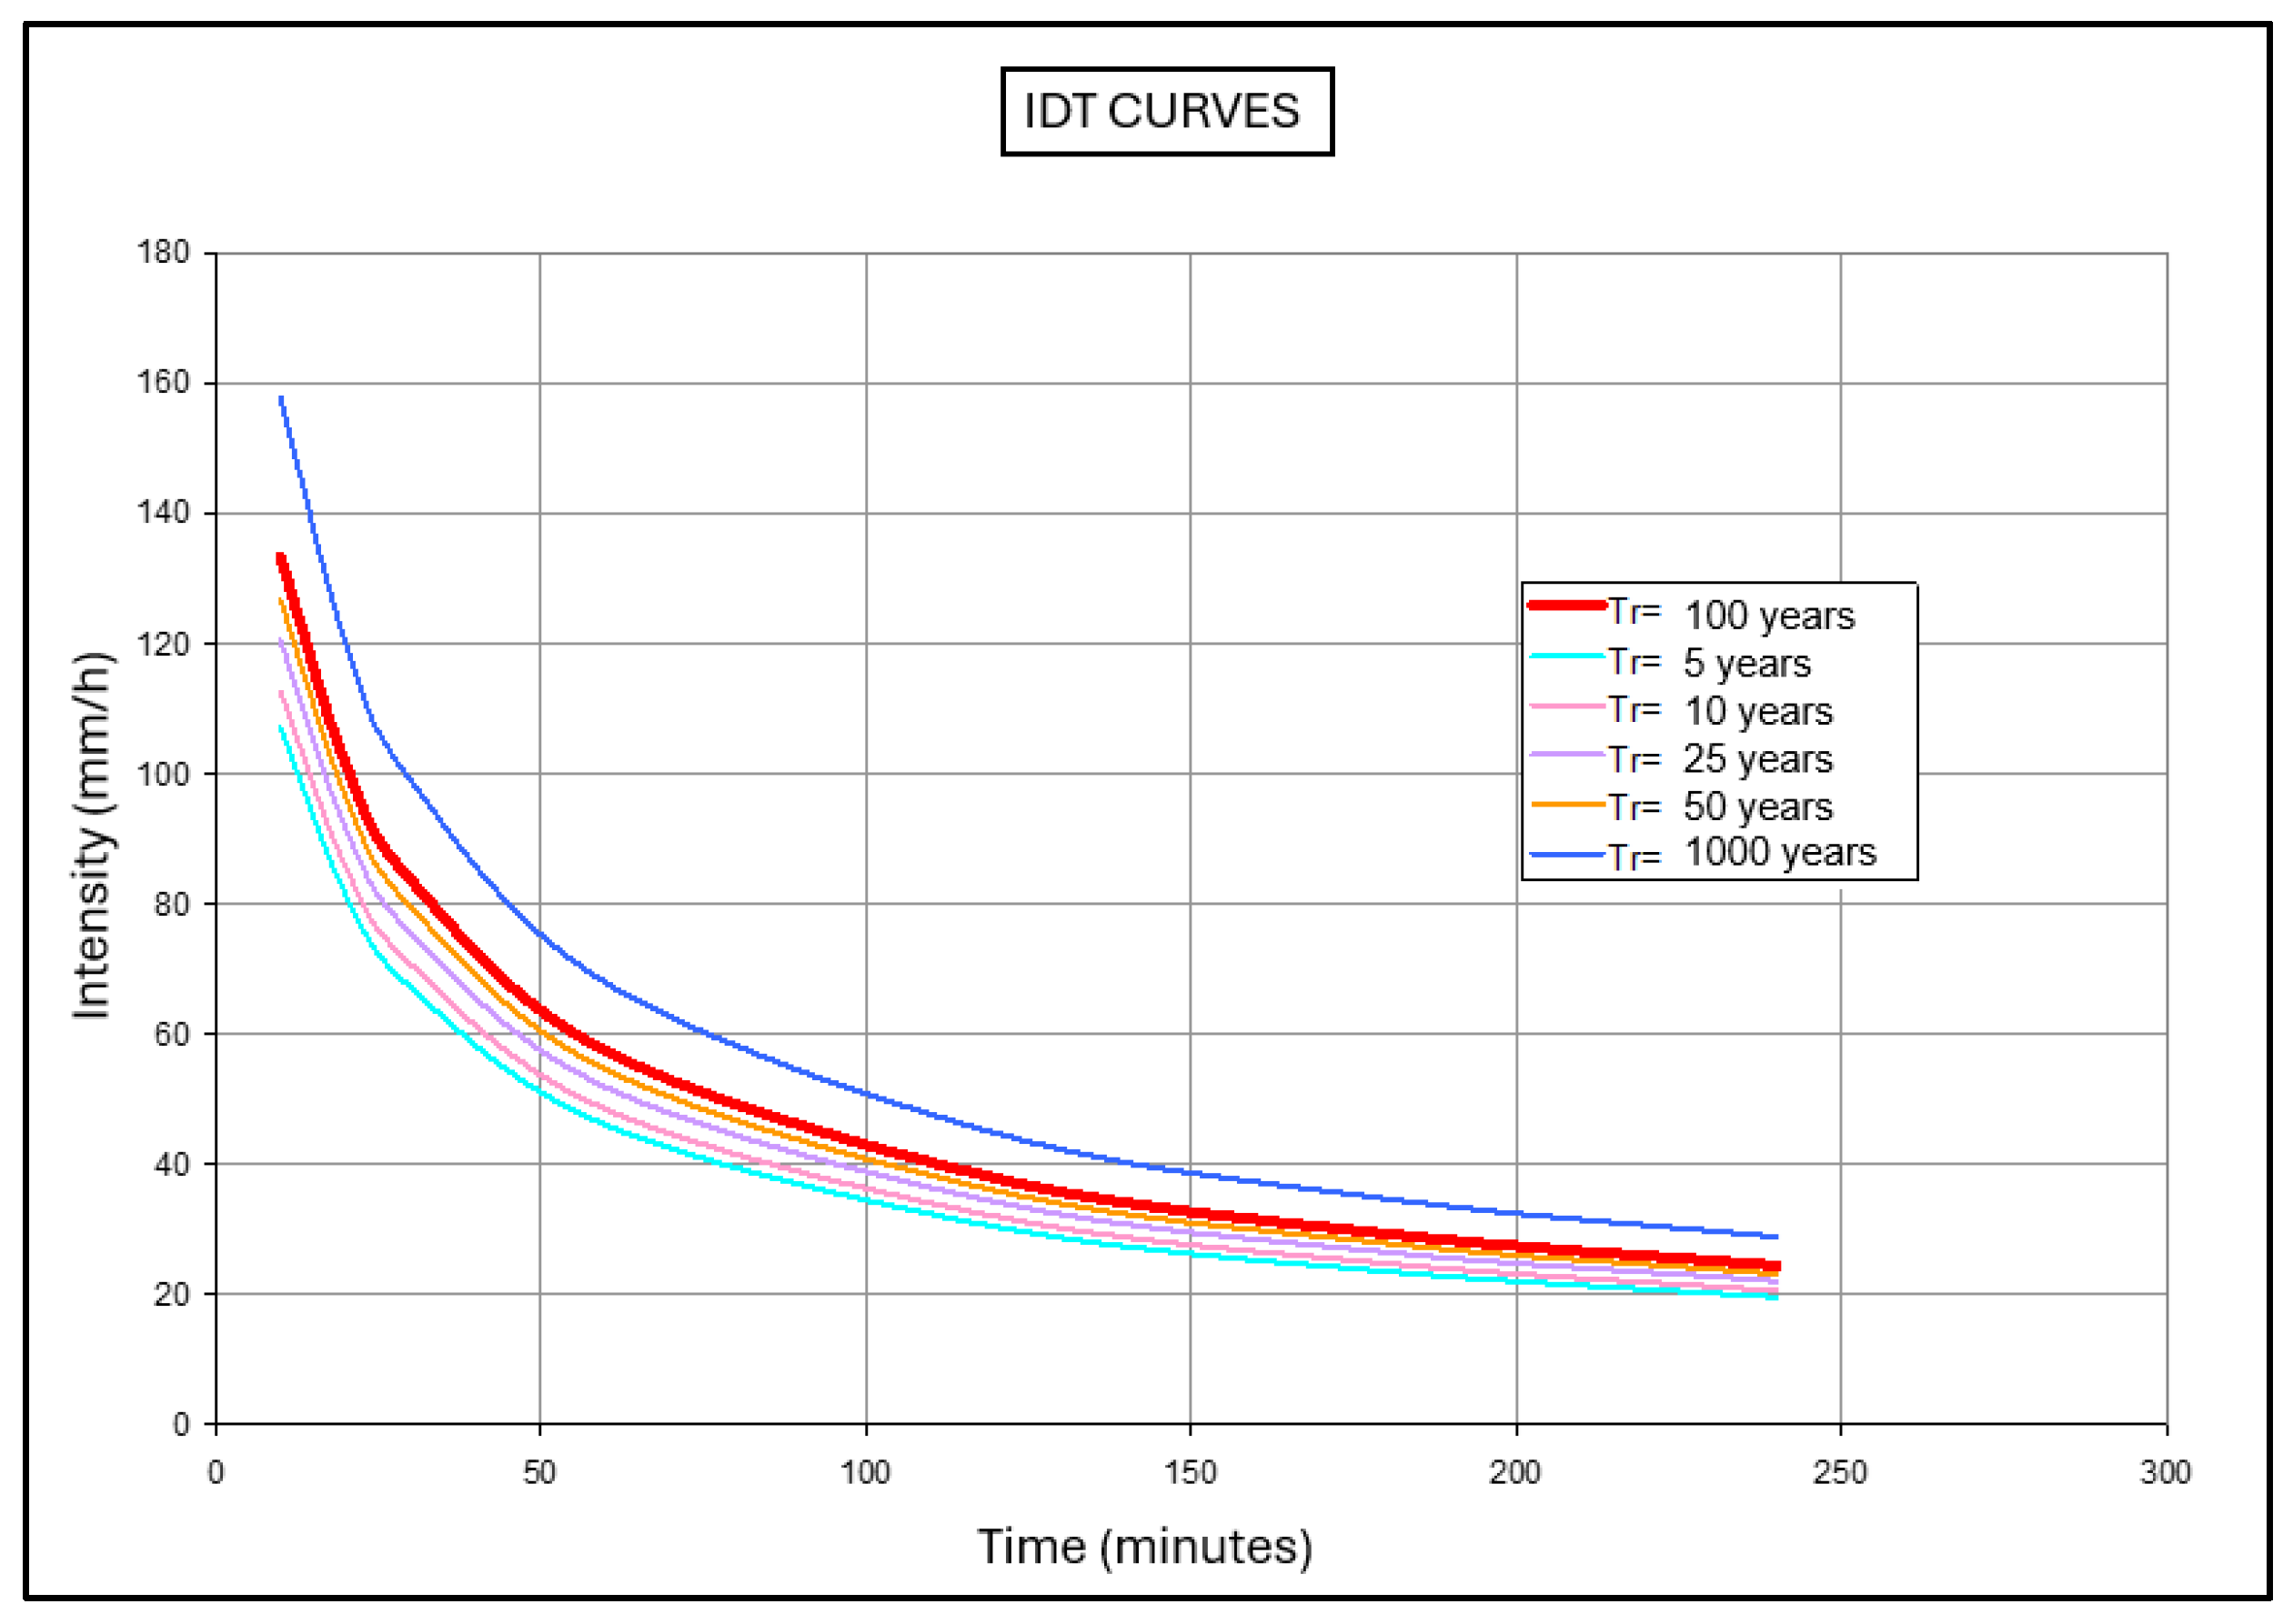
The study basin does not have historical rainfall information. For this reason and given that there is a meteorological station belonging to the National Meteorological Service, “Cordoba Observatory” (31º25'15" S; 64°11'54" O; 425 msnm) at a distant of 3 km to the neighborhood, which presents historical rainfall records which were used to determine the IDF within the agreement developed by CIRSA (for its acronym in Spanish Sub-management Center of the Semiarid Region) - DIPAS (for its acronym in Spanish Provincial Directorate of Water and Sanitation) (1994), as shown in the
Figure 5, it is used to determine the rainfall for different recurrences [
12]
Below, the IDF curves presented by CIRSA - DIPAS (1994) [
12] are transcribed to obtain the rainfall intensity:
where:
i= Precipitation intensity in mm/h
T= recurrence period in years
d= duration of the storm in minutes
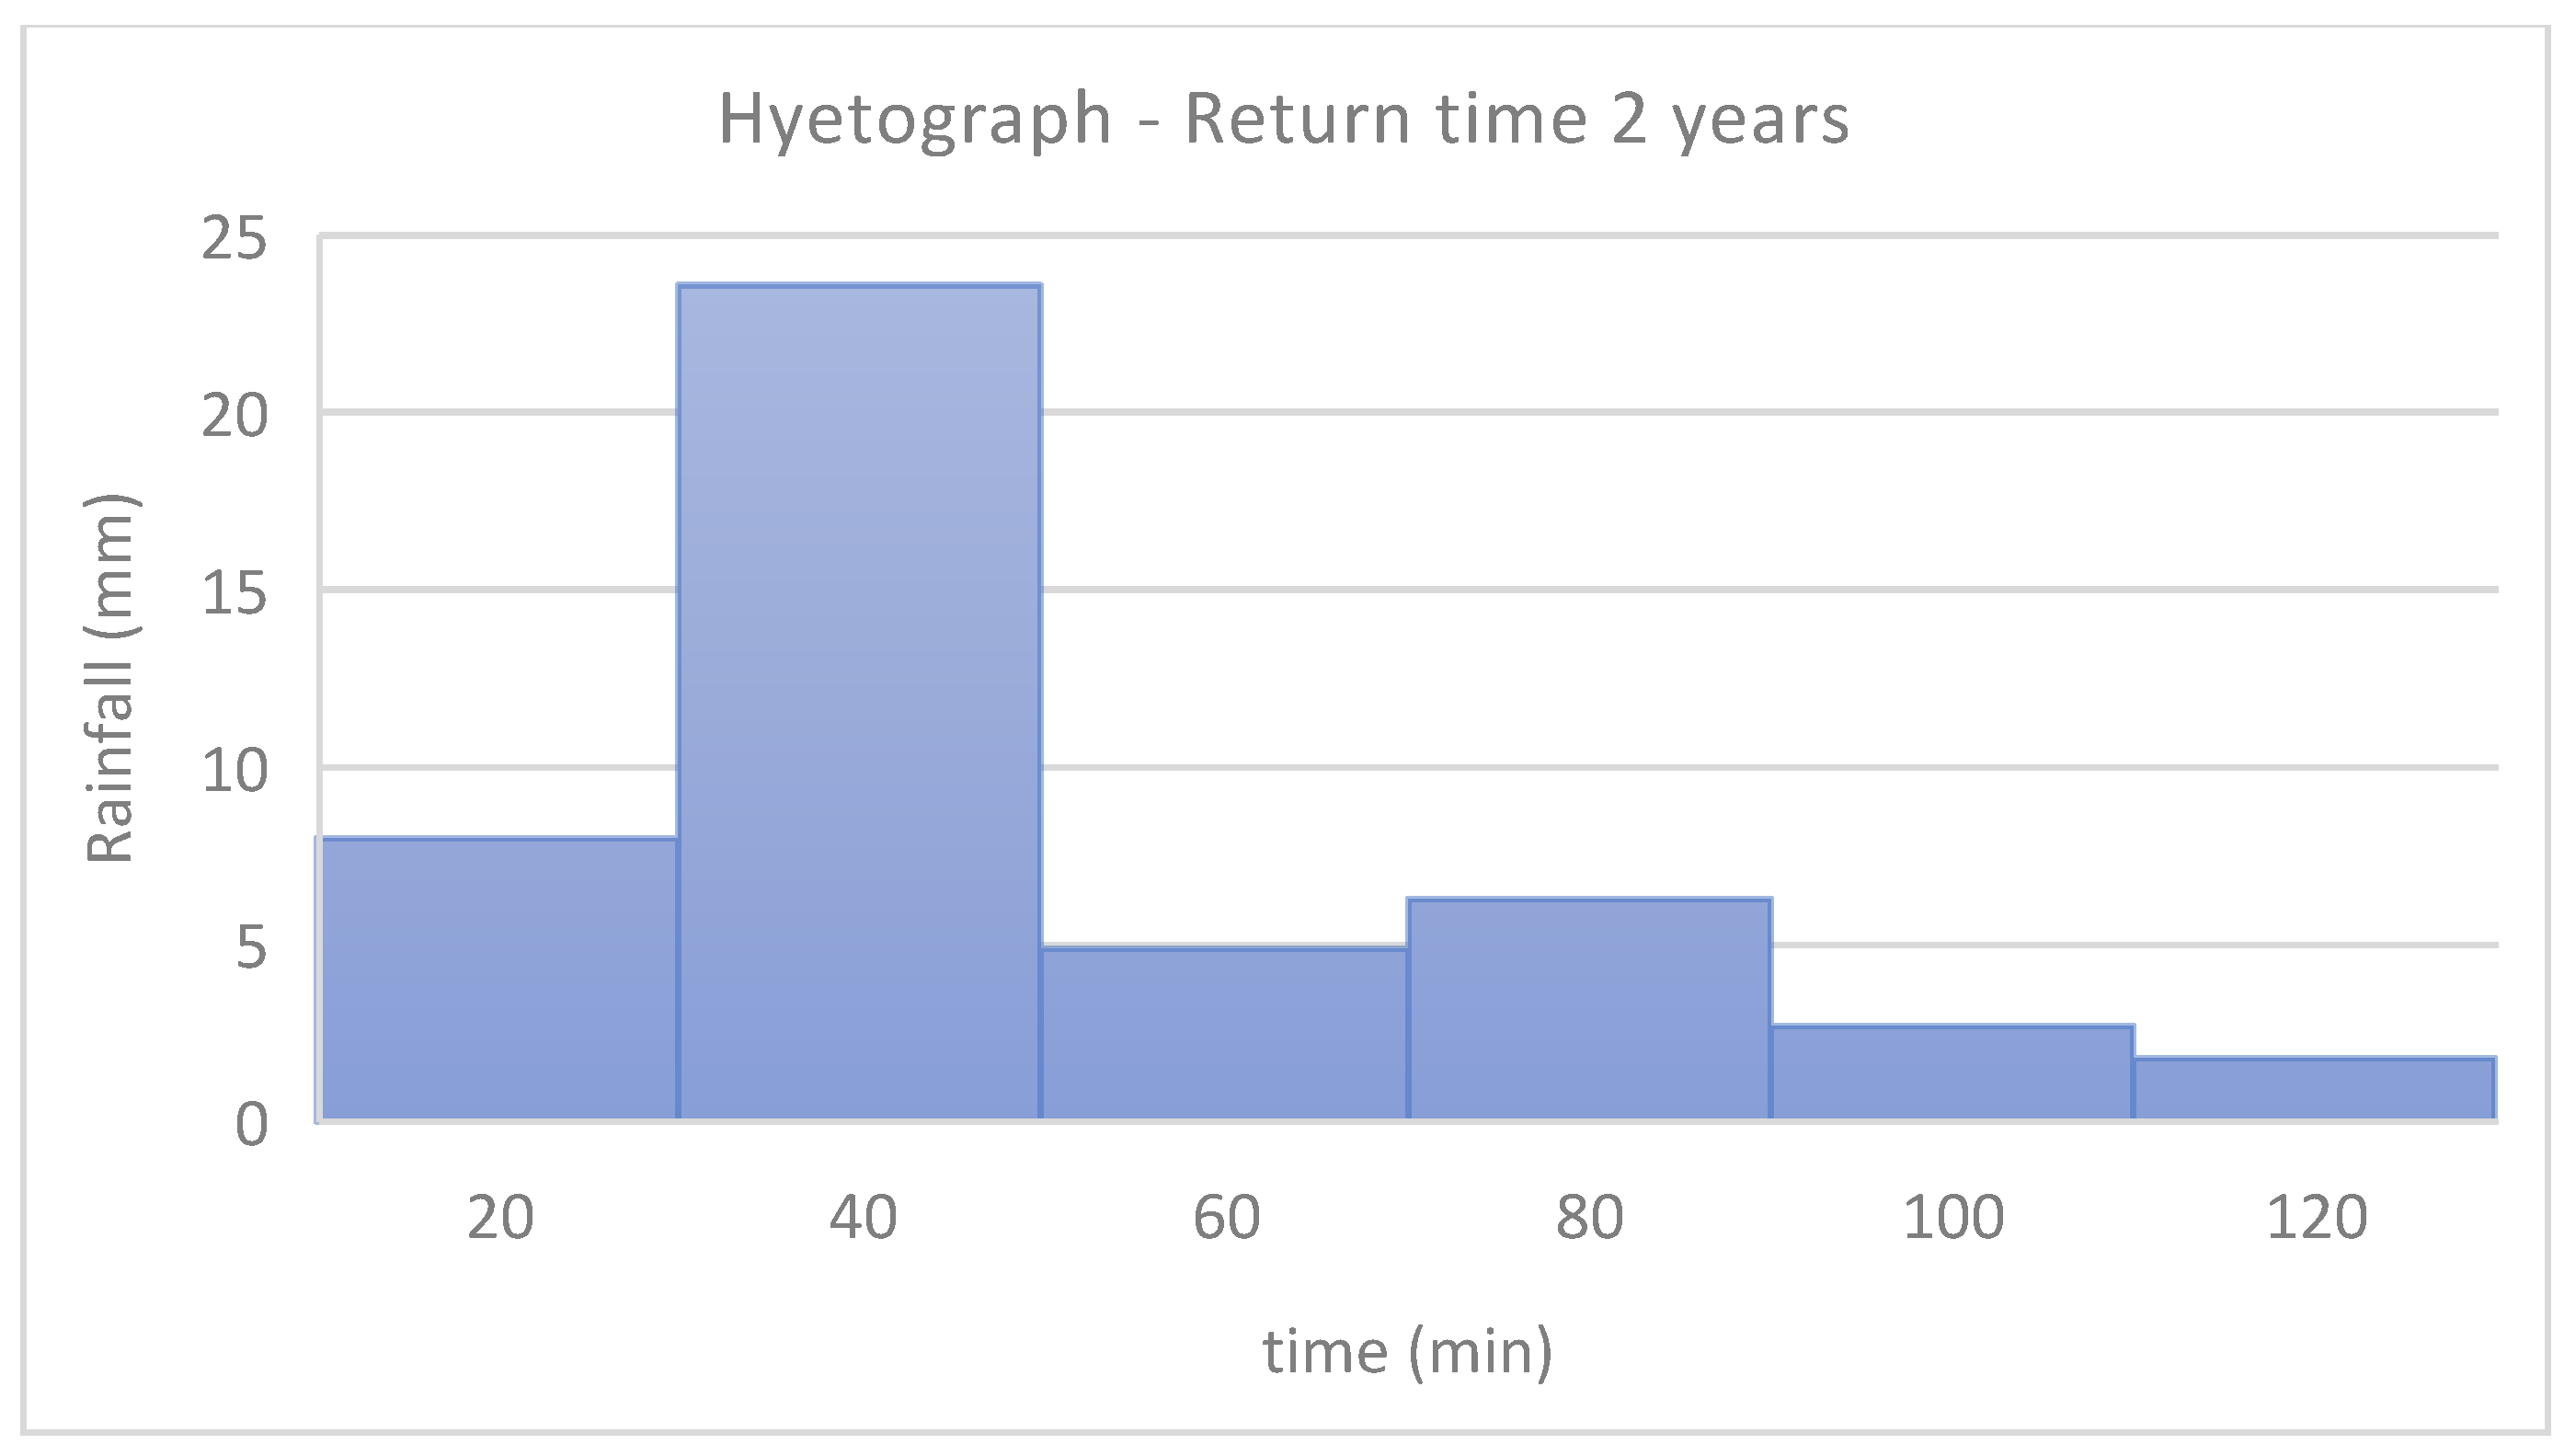
For the modeling, a rainfall duration of 120 min was used. The percentage and adopted hyetograph are presented in
Table 1 where the alternating block method and a 25% advance coefficient are considered. The same criterion was demonstrated for the alternating block method as that used by [
6]
Table 2 shows the hyetographs for different return times, and
Figure 6 shows the hyetograph for a return time of 2 years.
2.5. EPA SWMM – Transports of Contaminants
The EPA SWMM software uses tools that allow for modeling accumulation and entrainment processes, but they must be supported by calibration data to generate realistic results.
Pollutants are user-defined substances that accumulate on the catchment surface and are entrained and transported downstream during runoff events. The tool allows for simulating the generation, entrainment, and transport of any number of user-defined pollutants.
Land uses characterize activities within a subwatershed that affect pollutant generation differently. The pollutant accumulation and entrainment function for each soil type can be defined independently. Two procedures for reducing surface pollutant loads within subwatersheds available in EPA SWMM are street zoning and BMP treatment (Best Management Practices, refers to the implementation of management practices that reduce the amount of pollutants that are entrained by water in rainfall events).
Based on the information collected, visits to the neighborhood with the citizen science projects carried out by the faculty evidenced that approximately 1 consortium bag of 90x60x20 cm for every 100 m found. Two scenarios were modeled with different recurrence times. The first one considers that 7 days go by without collecting the garbage and that there is an accumulation of 1 garbage bag for every 100 m.
The other scenario is that the garbage is not collected for 30 days with an accumulation of 4 garbage bags for every 100 m. In both scenarios, it was assumed that 11% of the waste is plastic. This percentage of plastic was taken from an analysis of urban solid waste carried out by the company CORMECOR S.A. (for its acronym in Spanish Intercom Corporation for the sustainable management of urban solid waste of the Metropolitan Area of Cordoba)
The land use for this modeling was considered the same for all the sub-basins of the Villa Paez neighborhood.
Accumulation of Pollutants
The accumulation of pollutants within land uses is described as the mass per unit area of the basin. The mass is expressed in kilograms. The amount of accumulated pollutant is a function of the number of days of dry weather prior to rain and was calculated using the following expression:
Potential Function: The accumulation of pollutants (B) is proportional to time (t) raised to a certain power, until a certain maximum value is reached
where C
1 is the maximum possible accumulation (mass per unit area), C
2 is the growth constant of the accumulated pollutant and C
3 is the time exponent.
The values of the coefficients C
1 and C
2 were calculated according to the different scenarios that were modeled, this is found in the next section. The value of C
3 was considered equal to 1 [
4].
Drag of Pollutants
The drag of pollutants can be described by the following equation.
Exponential Washoff: The washoff load (W) in units of mass per hour is proportional to the product of runoff raised to a certain potential and the amount of accumulated pollutant.
where C
1 is the washoff coefficient, C
2 the washoff exponent, q the runoff per unit area (mm/hour), and B is the accumulation of pollutant (kg) per unit area. The washoff mass units are the same as those used to express pollutant concentrations (milligrams).
According to sediment transport theory, values of the C
2 exponent should range from 1.1 to 2.6, with most values close to 2 [
10]. It can be assumed that high-density commercial and residential areas, due to their greater impermeability, tend to release pollutants faster than areas with individual lots.
The values of the washout coefficient (C
1) are much more difficult to infer because their nature can vary by 3 or 4 orders of magnitude. Monitoring data should be used to help estimate a value for this constant [
13]
A value of 2 was considered for the C2 coefficient, based on the information obtained from the page cited above. However, the value of the C1 coefficient presented a greater challenge since there is no monitoring data in the basin to estimate it accurately.
To address this limitation, the assumption was made that, in extreme rainfall due to the vulnerability of the basin under study, the drag of plastics in the urban basin is of the order of 95%. It is important to clarify that not all the plastic dragged by the runoff in the basin reaches the stream and/or river.
The value of C
1 was estimated at 0.001 [
4].
Street sweeping and BMP treatment (Best Management Practices)
Were not considered in this analysis.
3. Results
3.1. Scenary 1
In this way, results were obtained for each of the simulated scenarios, allowing the response of the basin to different conditions to be analyzed and the accumulation and drag of plastics in the area to be estimated based on these conditions.
Table 3 shows the accumulation and transport of plastics for different return times for 7 days without garbage collection
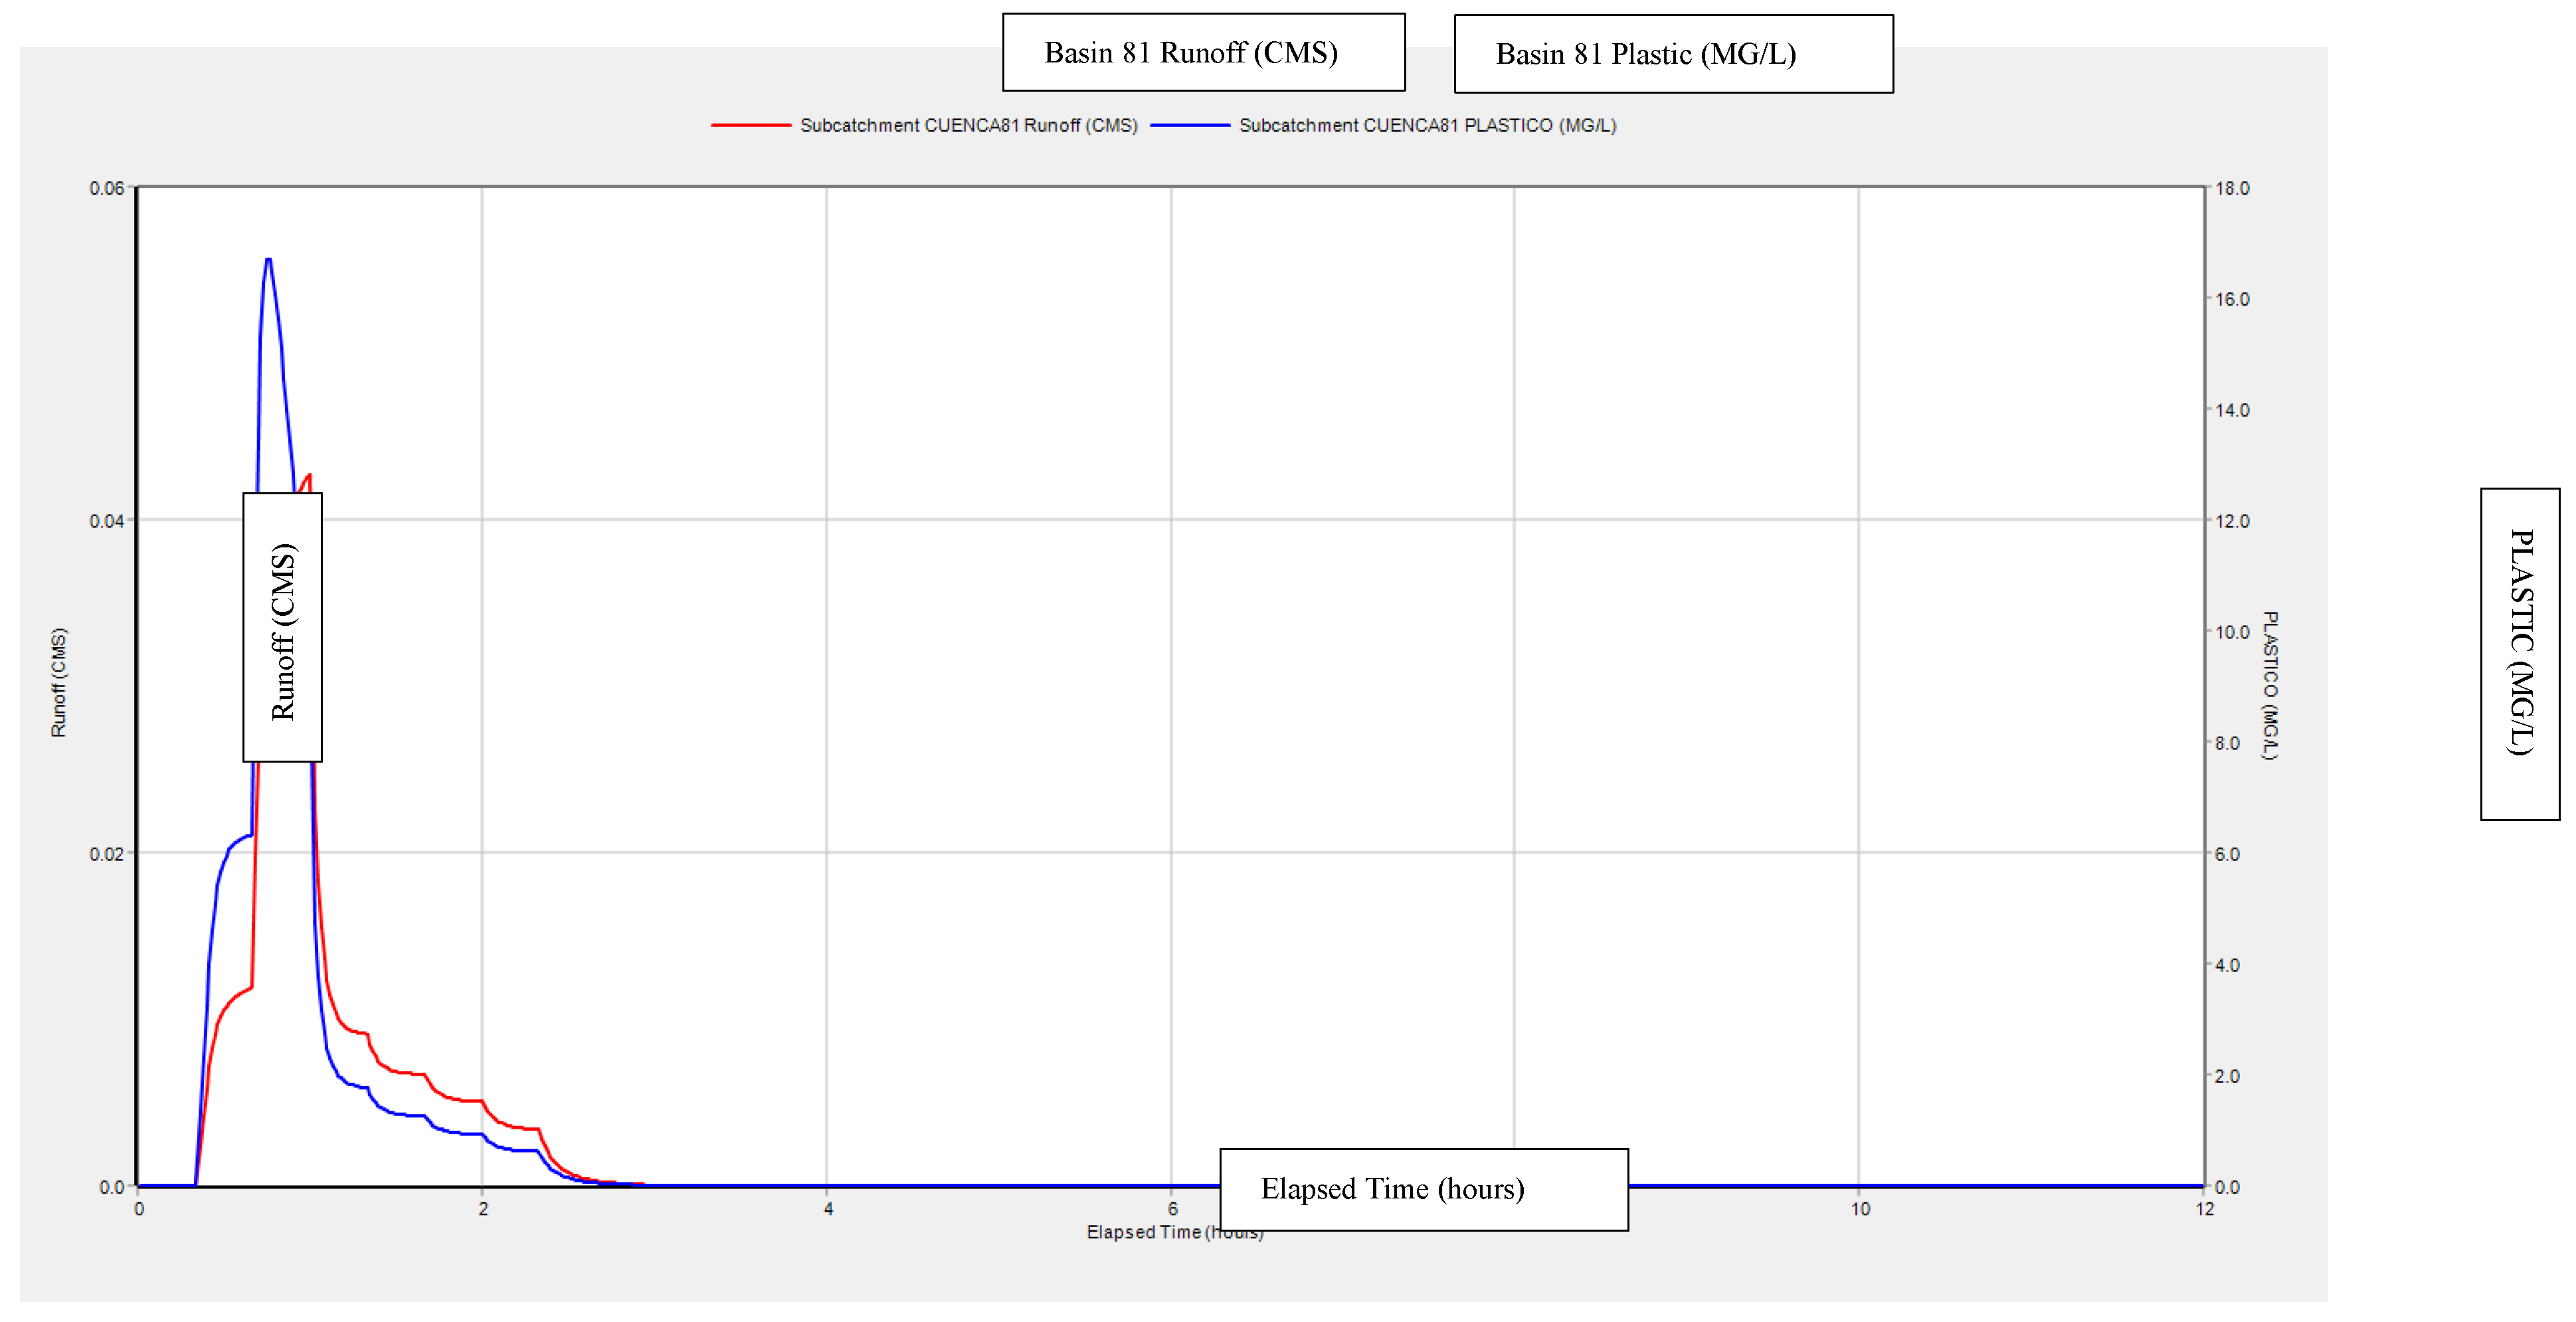
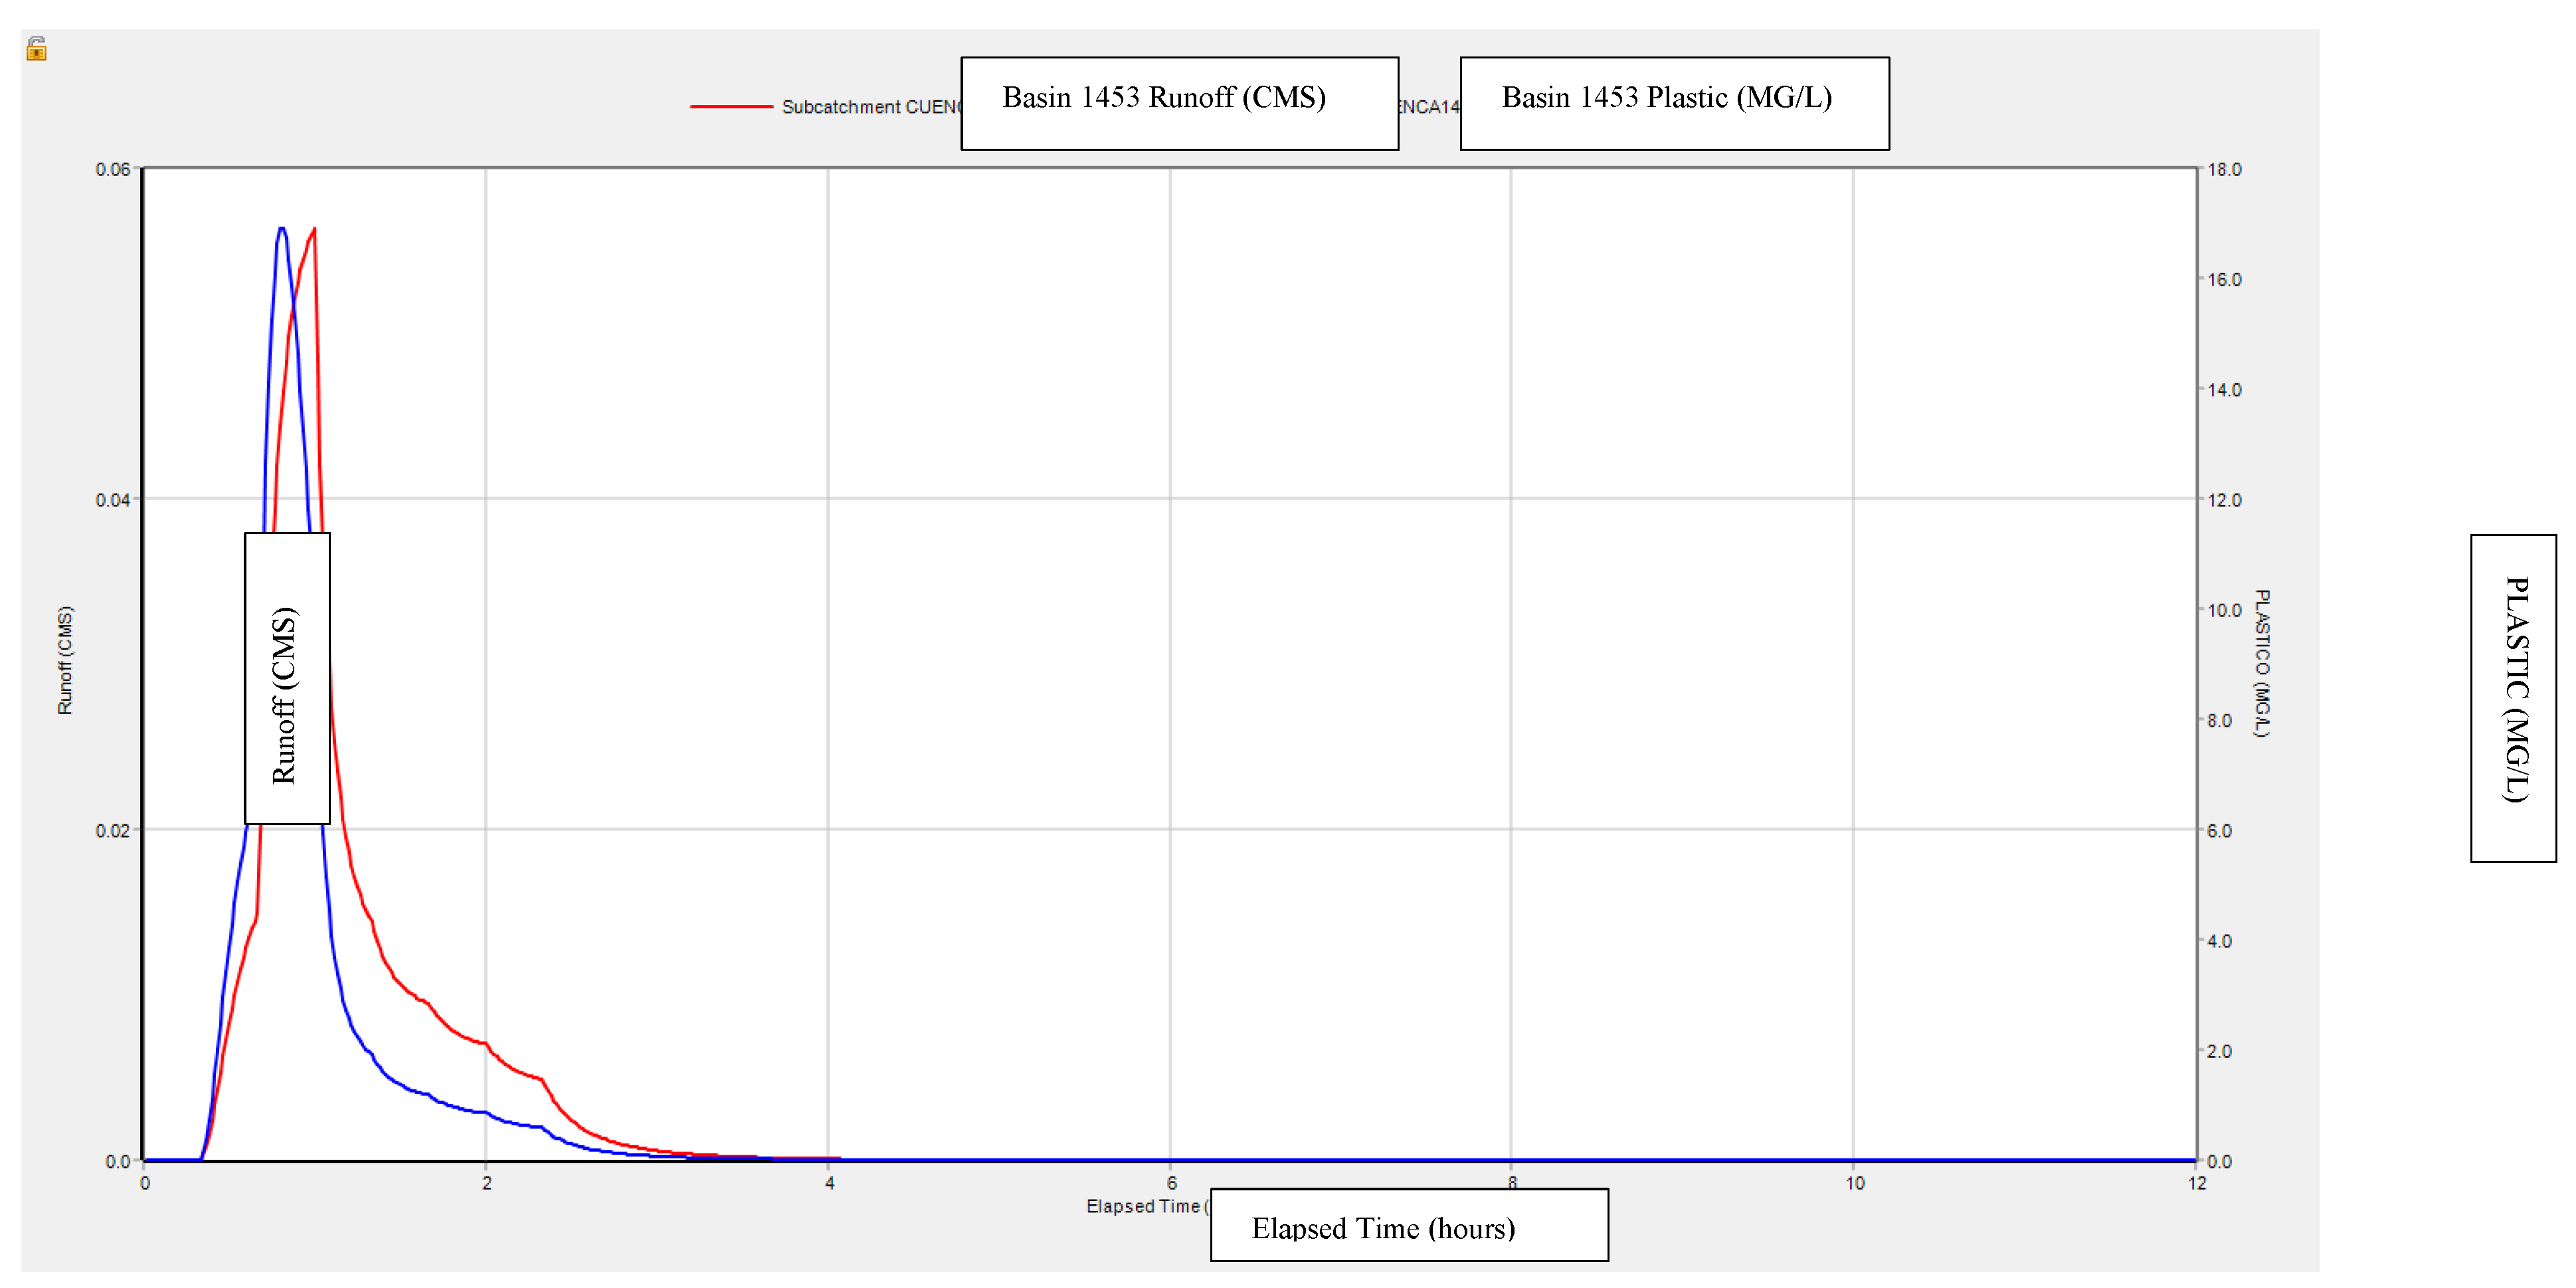
Below are the results for two basins in particular, a lower basin, 81, and an upper basin, 1453. Both basins for return times of 2 years.
Figure 7 and
Figure 8, show the flow rates in m
3/s and the transport of plastic associated with this flow in mg/l, and the time in hours on the horizontal axis.
The maximum amount of plastic transported in basins 81 and 1453 for the return time of 2 years are respectively 16.68 mg/l and 16.9 mg/l.
For basin 1453, the upper basin, the peak of plastic transport occurs at 48 min for a return time of 2 years. While the peak of the flow occurs at 57 min there is a difference between the peaks, first the peak of plastic transport occurs and then the peak of the flow. Because the mobilization of plastic occurs even for low flows.
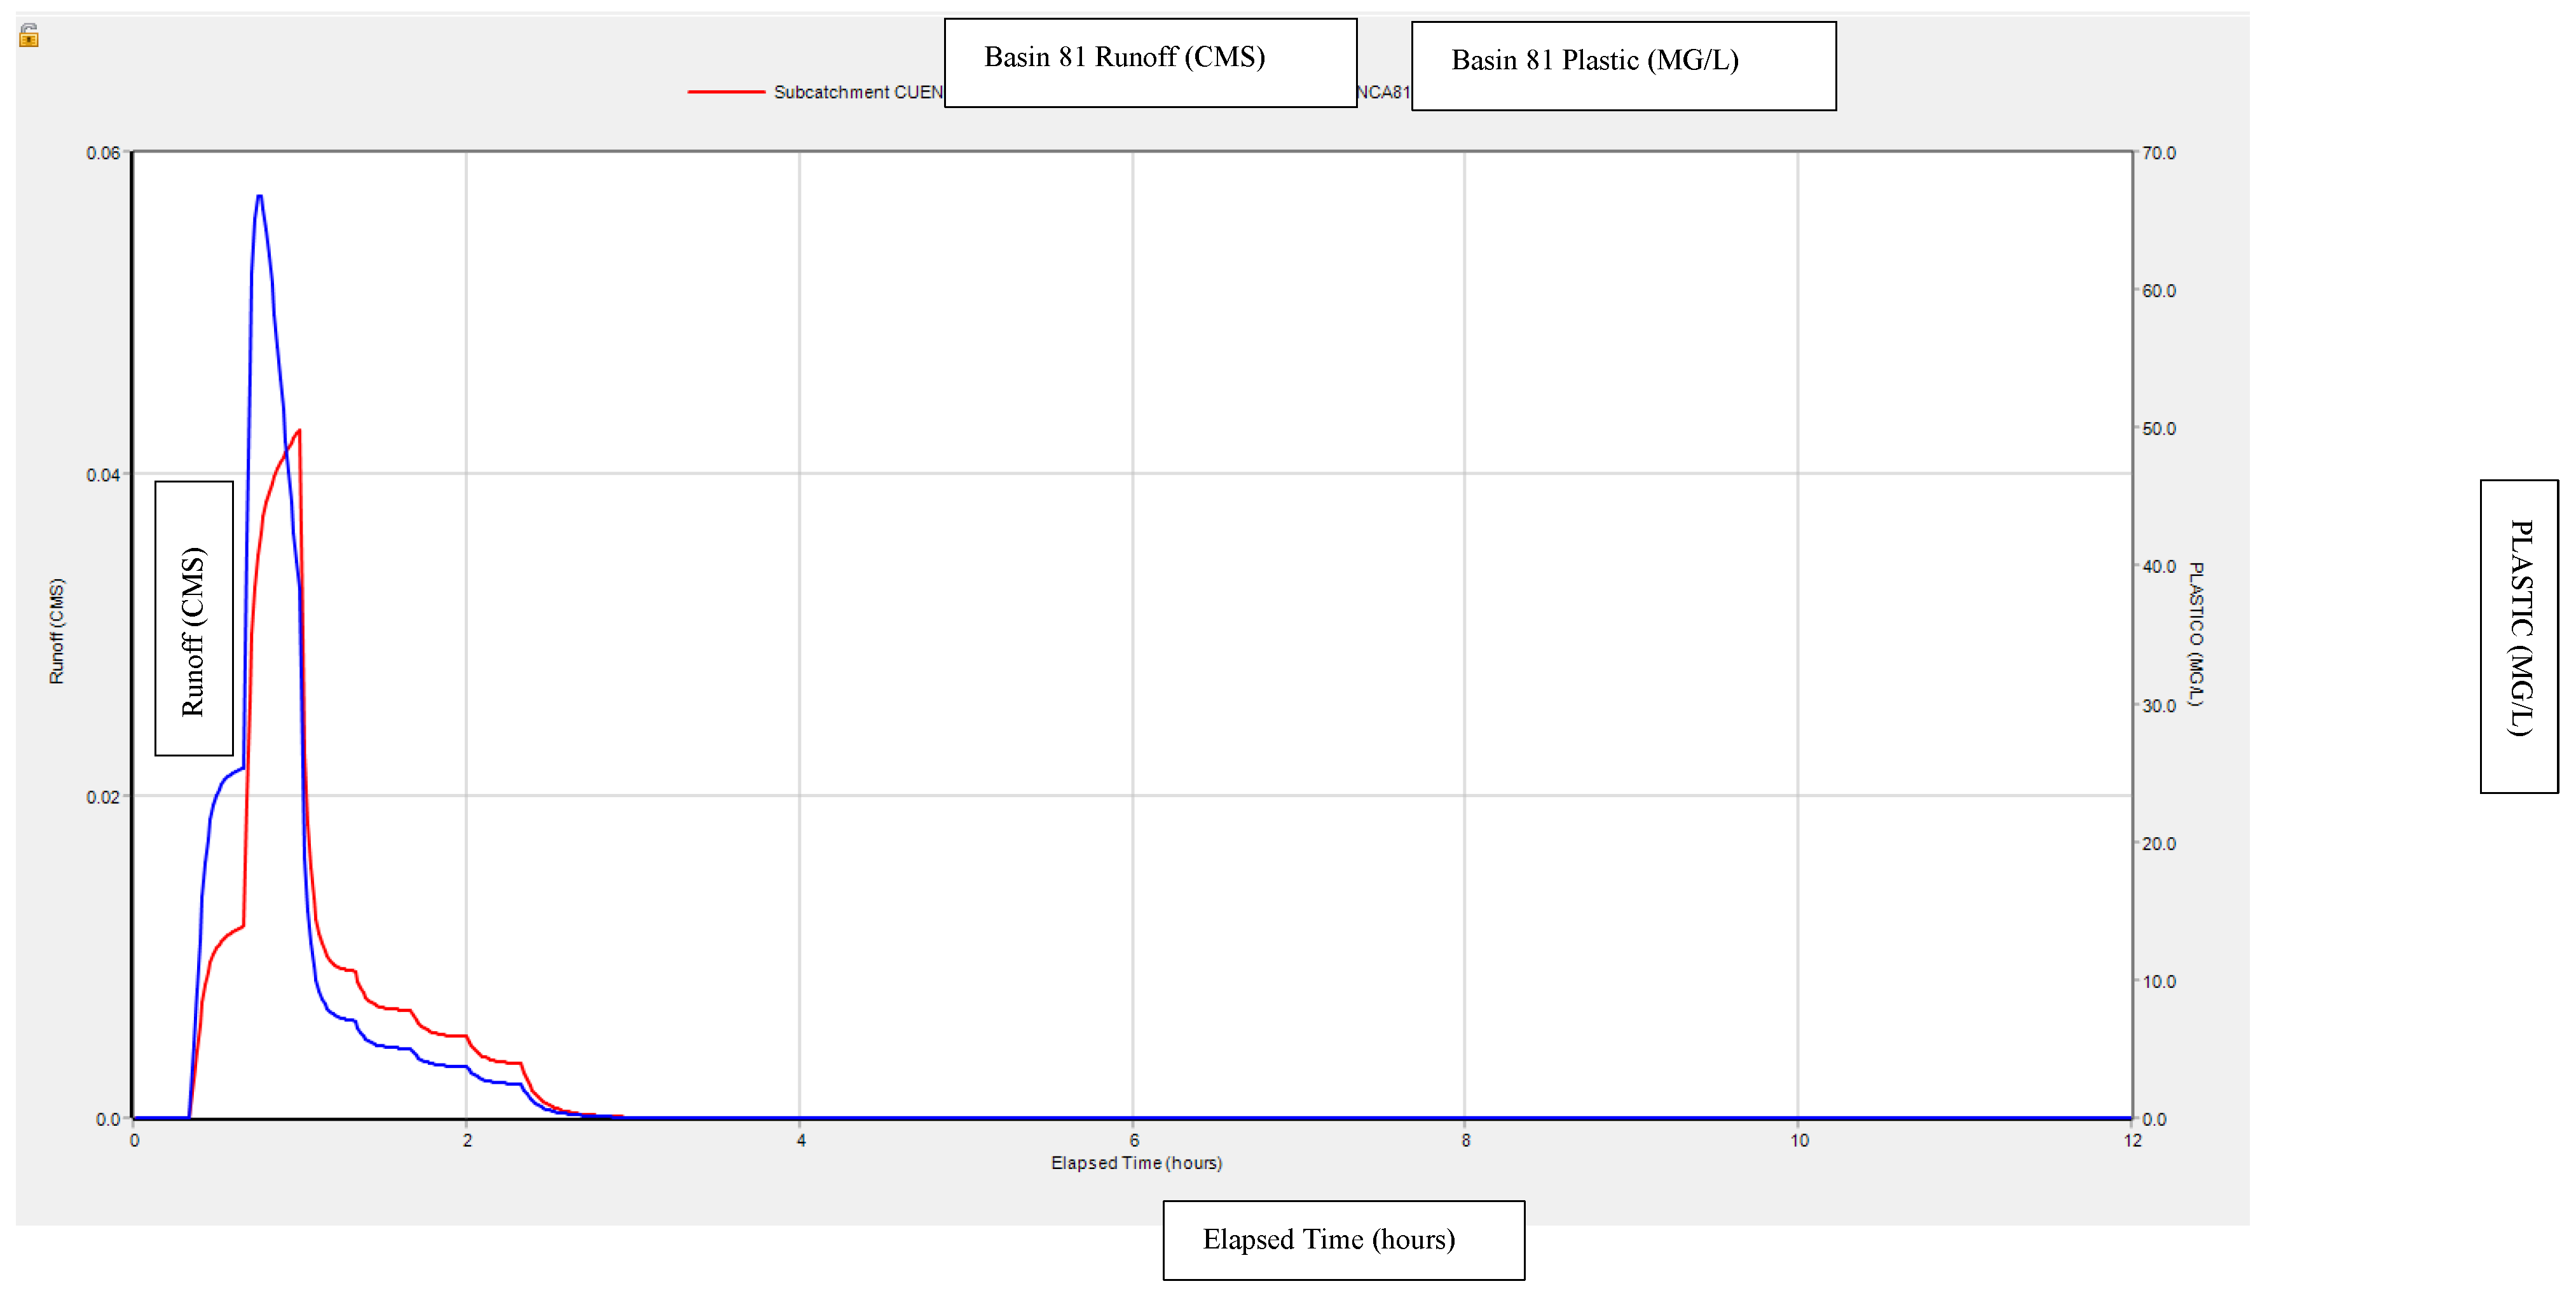
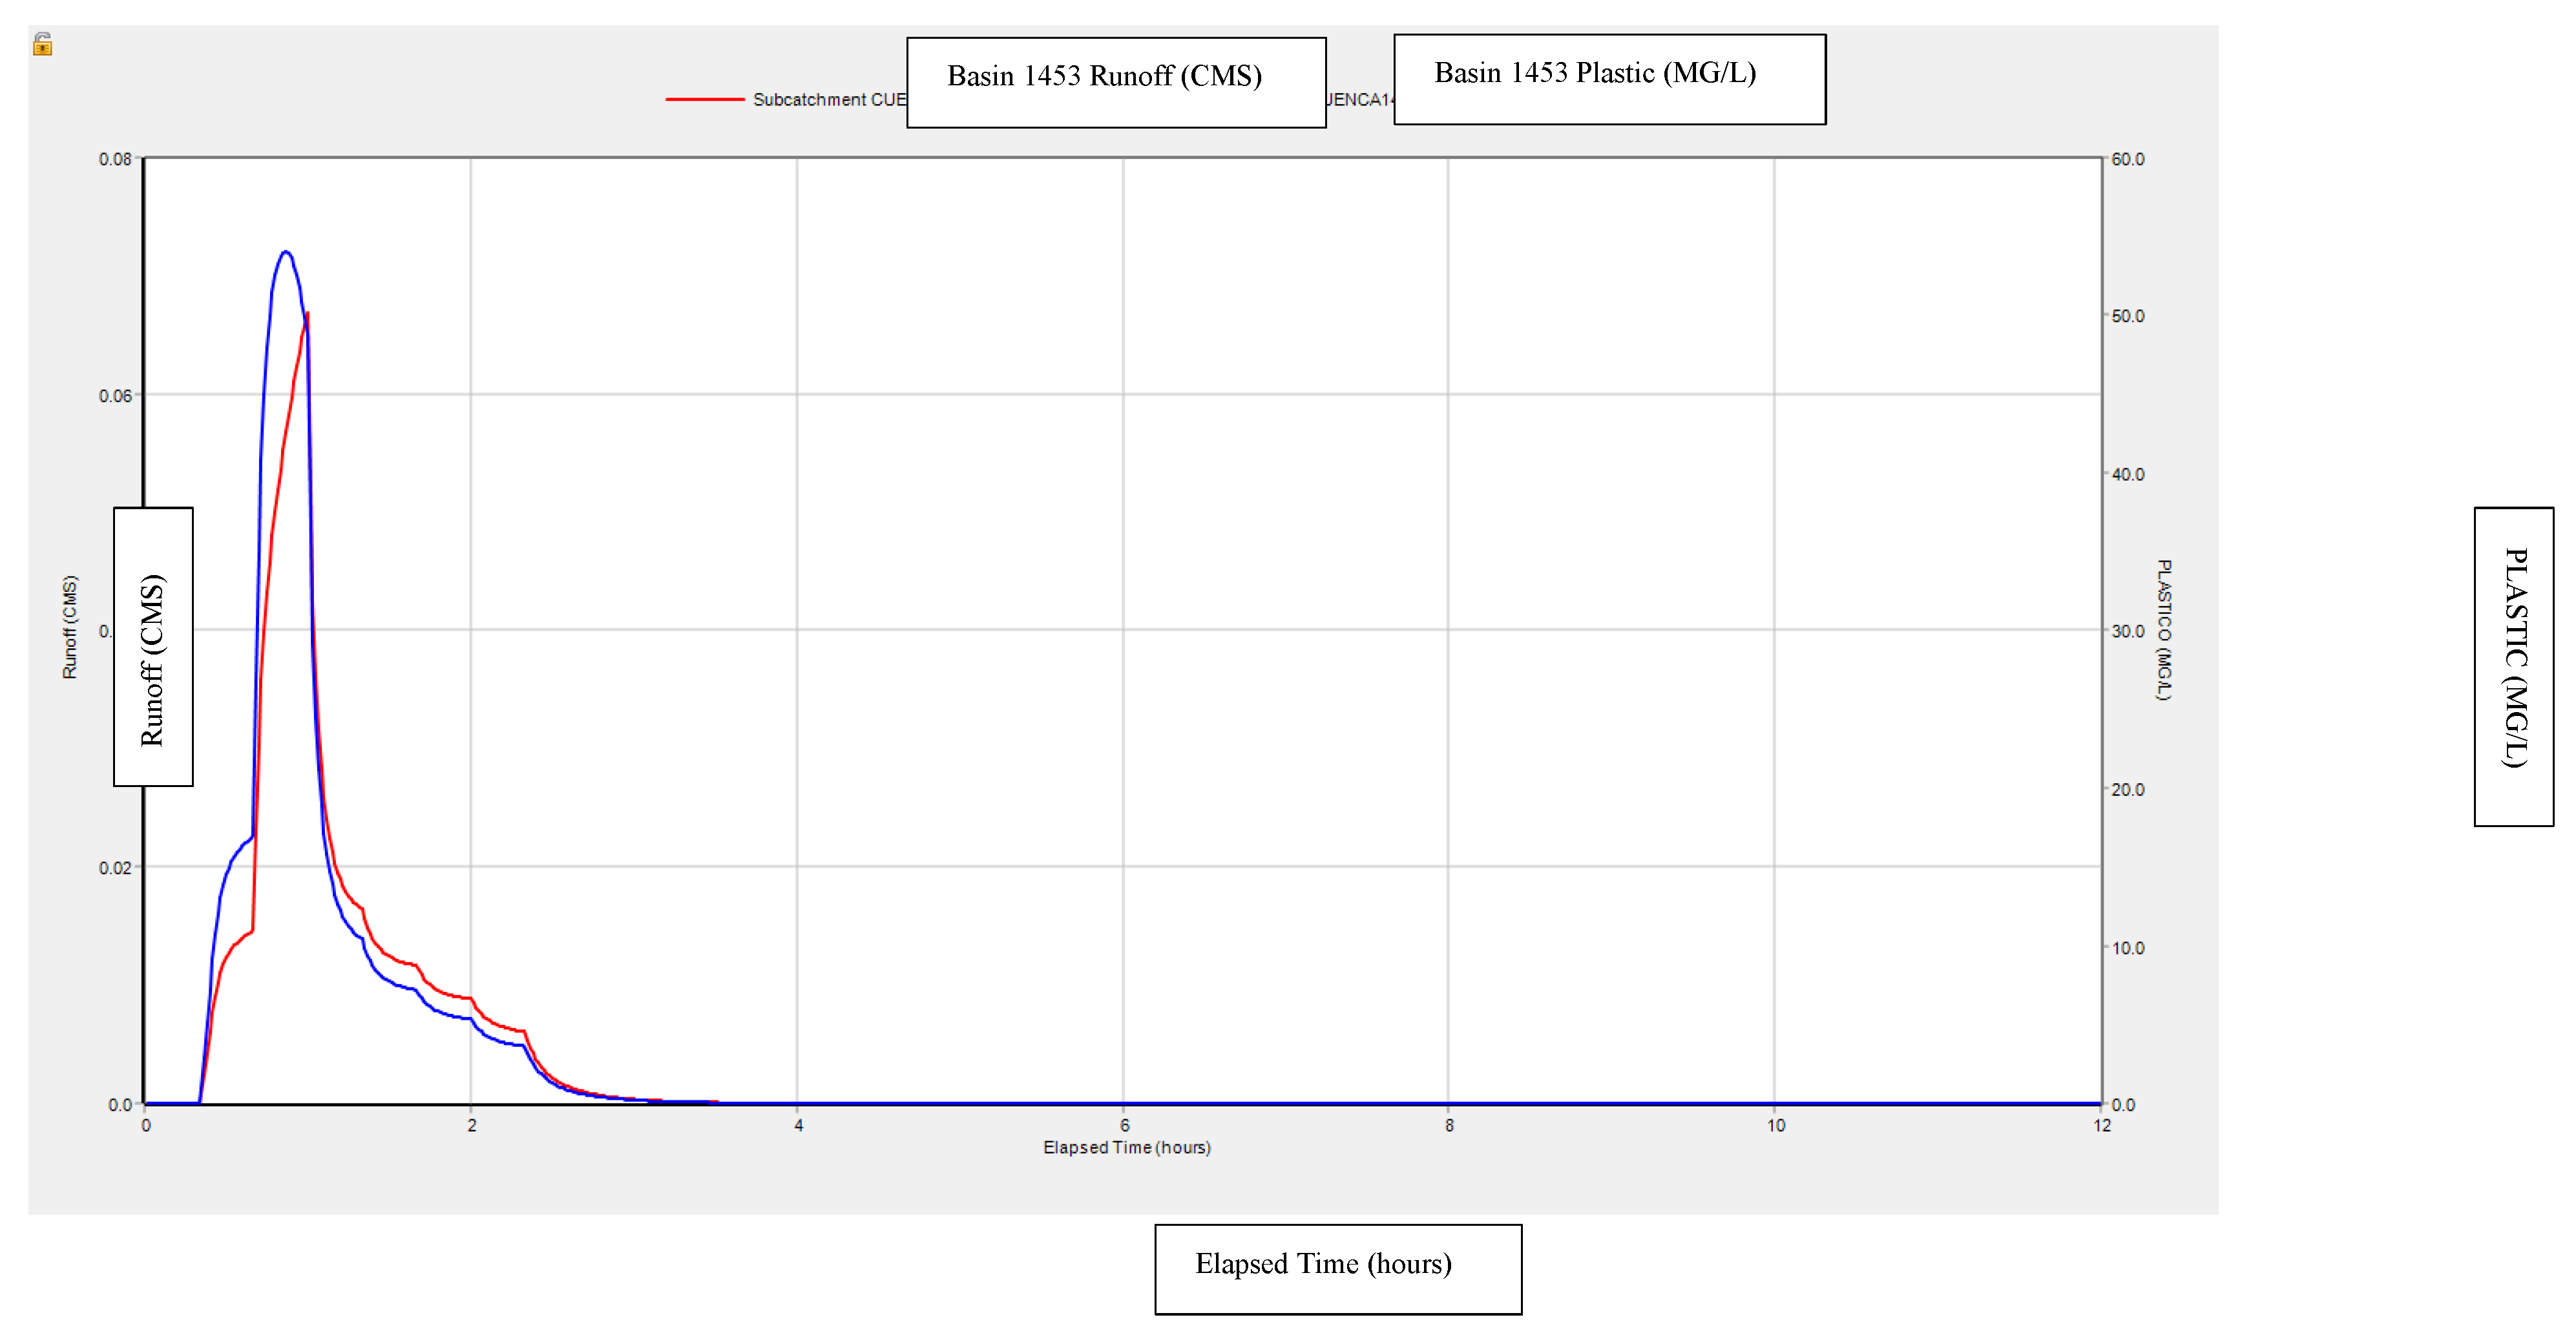
3.2. Scenary 2
Table 4 shows the accumulation and transport of plastics for different return times for 30 days without garbage collection.
Below are the results for two basins, a lower basin, 81, and an upper basin, 1453. Both basins were returned for 2 years.
Figure 9 and
Figure 10 show the flow rates in m
3/s and the plastic transport associated with flow in mg/l, and the time in hours on the horizontal axis.
The maximum amount of plastic transported in basins 81 and 1453 for a return time of 2 years is 66.72 mg/l and 54.02 mg/l, respectively.
For basin 1453 the peak of plastic transport occurs at 48 min for a 2-year return time. While the peak of the flow occurs at 57 min, that is, there is a difference between the peaks, First the peak of plastic transport occurs and then the peak of the flow. Because the mobilization of plastic occurs even for low flows.
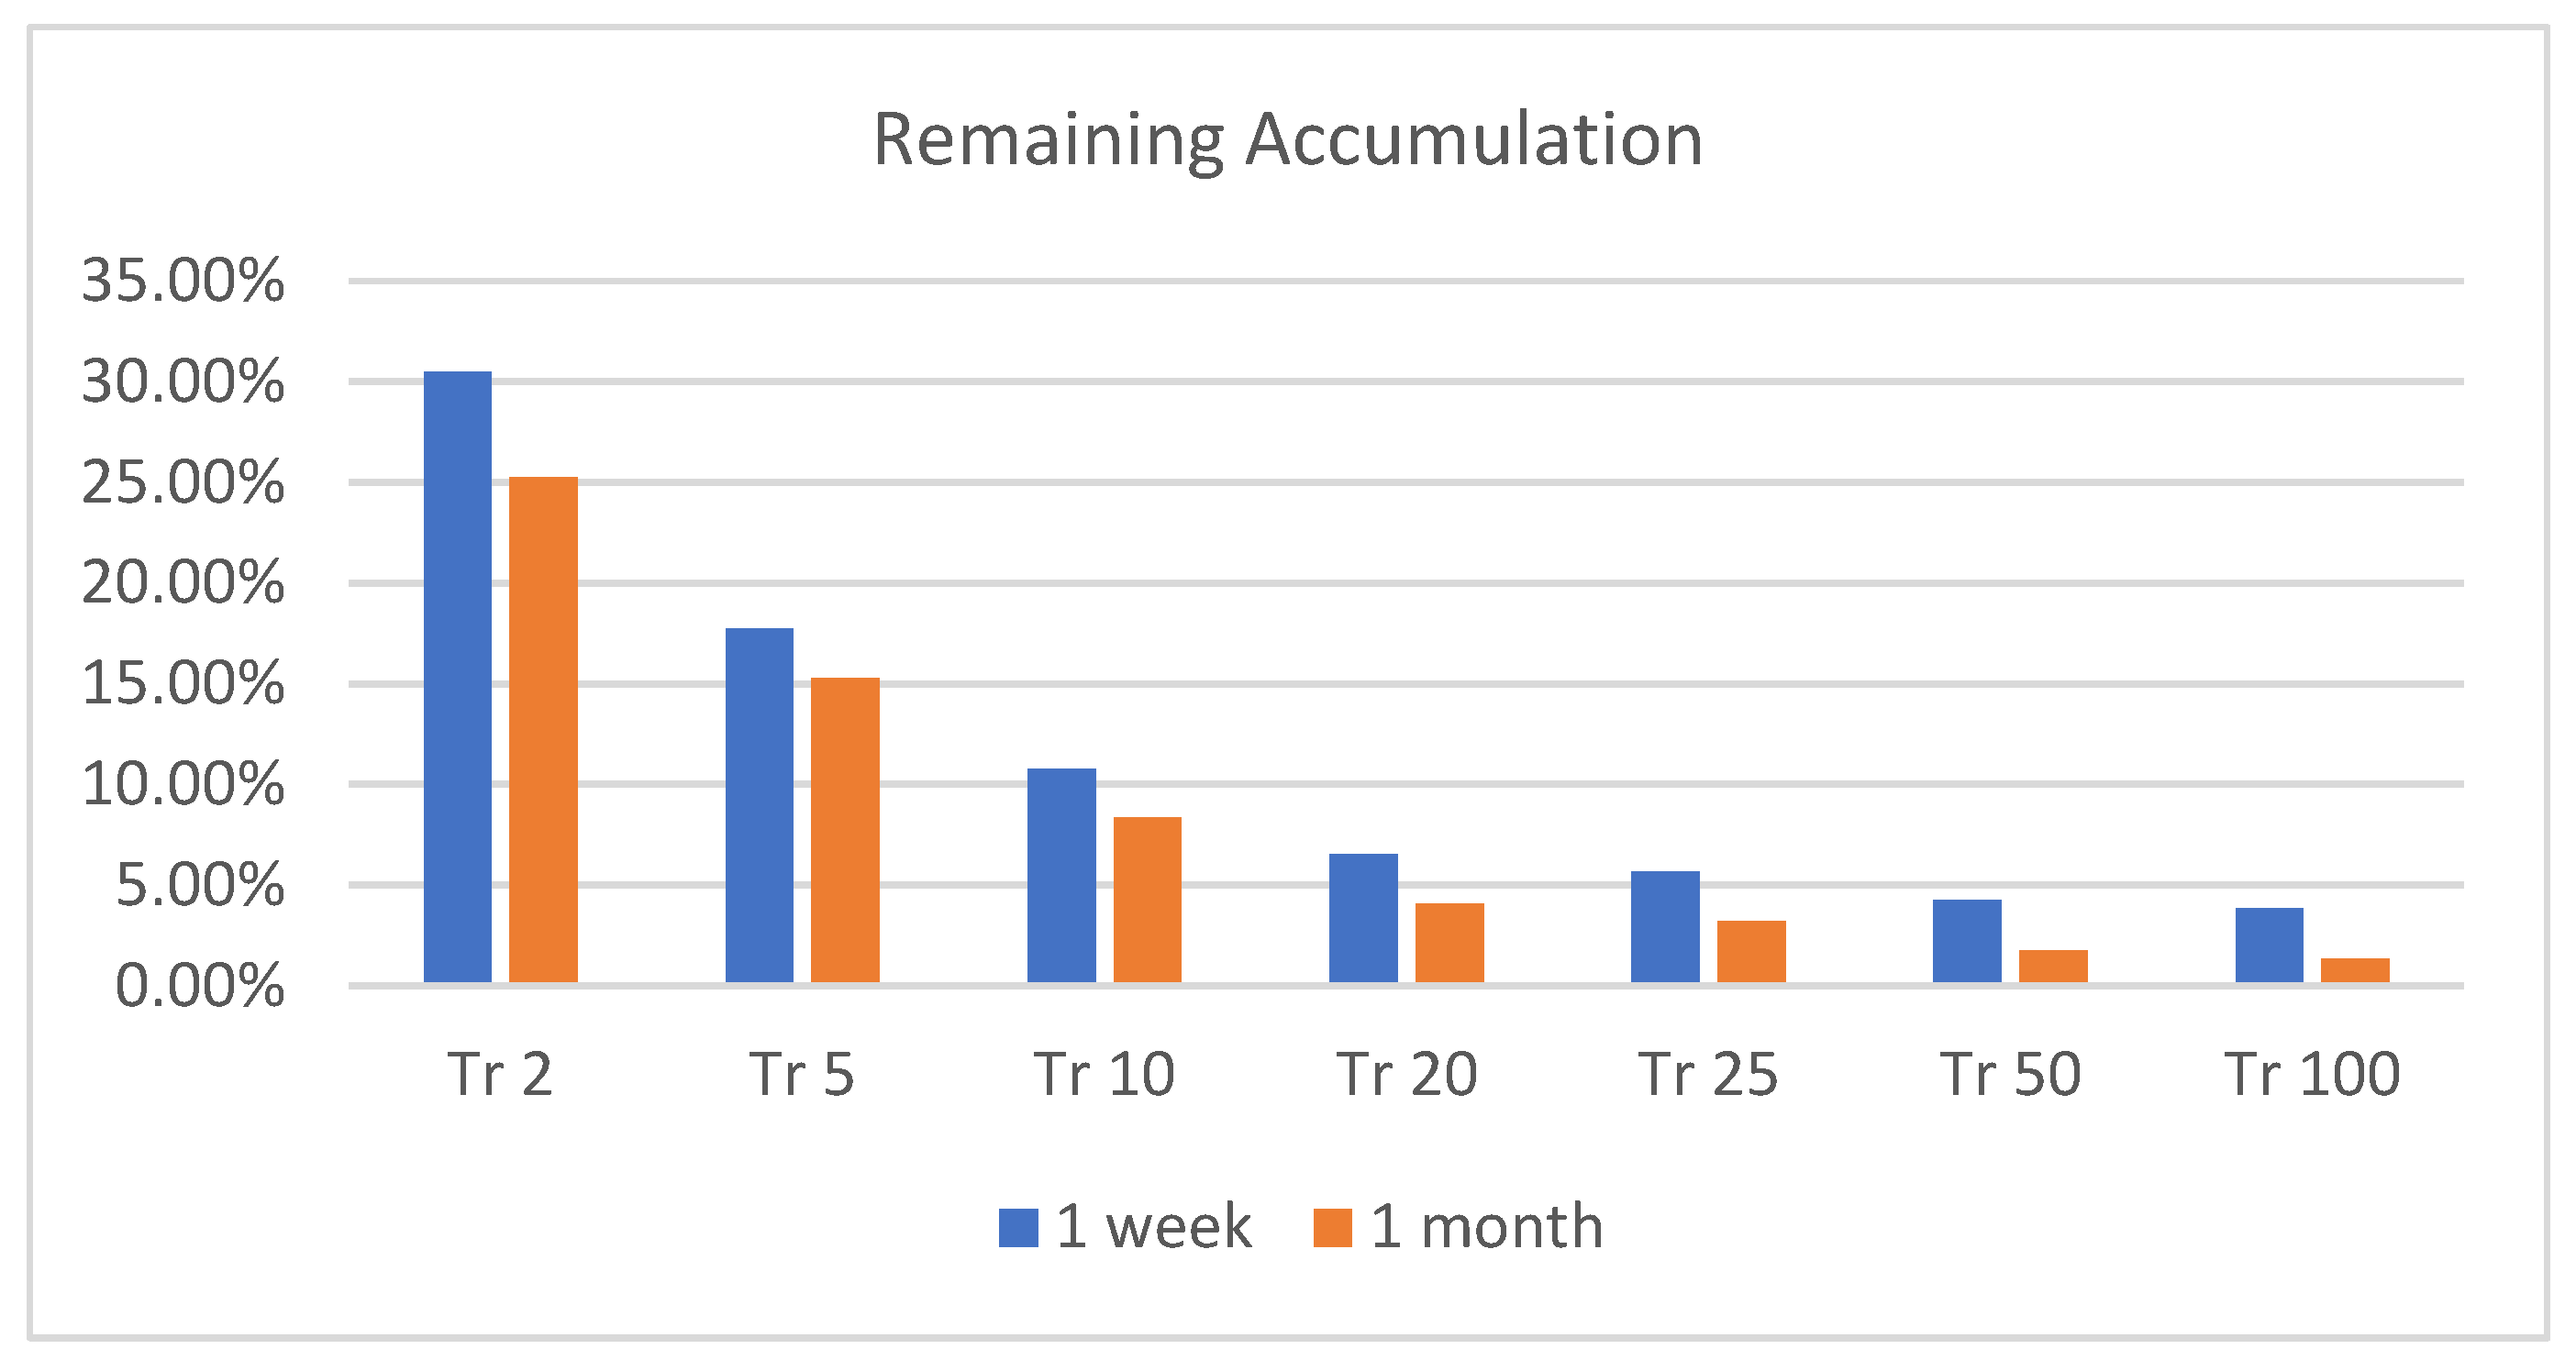
Figure 11 shows the results for different scenarios for different return times.
It is observed that plastic runoff increases considerably when going from a return time of 1 year to 10 years, while the increase is smaller for extreme return times, such as 50 and 100 years, is observed in both scenarios.
4. Discussion
The Villa Paez neighborhood in the city of Cordoba is a lower-middle-class neighborhood that is vulnerable to flooding and has garbage present in the streets, garbage dumps and dumping points throughout the basin.
The problem initially raised can be understood as a technical problem of the relationship between hydrology and the transport of pollutants. By investigating in depth, it was possible to establish that the problem involves environmental, socioenvironmental and technical aspects. Therefore, to address it, a methodology that integrates all these aspects is necessary. Based on the socio-environmental studies of the area, we were able to inquire about waste management in the neighborhood, which gave us a panorama of the reality. There is waste collection in the neighborhood and the frequency is 6 days. The neighbors say that sometimes the collection does not happen due to storms and floods. The neighborhood does not have differentiated waste collection. Although the neighborhood has waste collection, there are garbage accumulation points in it, these could be georeferenced from the surveys and with the images and visits to the place it was possible to contrast.
Satellite images and Google Street View allowed us not only to compare with the results of the surveys but also to determine the volumes of waste deposited in the streets. The hydrological model allowed the modelling of the currents in the basin. Finally, from all this comprehensive analysis, it was possible to propose different scenarios and carry out models of the transport of the pollutant in the urban basin.
The modeling results indicate that contaminant drag increases considerably when passing from a recurrence time of 1 to 10 years, while runoff for longer recurrence times, 50 to 100 years, mobilizes more plastic, but the relative increase is smaller.
These results allow us to make decisions regarding the management of urban solid waste. Since most waste is transported during rainy seasons with low recurrence times and Cordoba has a marked wet season, street and garbage dump cleaning should be intensified before the season to reduce the amount of pollutants that end up in our river and affect the environment.
Once plastic enters a channel, its transport is influenced by hydrological factors such as water level, flow velocity and discharge [
14]. Several studies found a positive correlation between river discharge and plastic transport [
15]. Plastic transport occurs in horizontal and vertical transport. Future research could focus on the transport of the contaminant in the river. For horizontal transport within freshwater systems, flow velocity is the main environmental parameter that affects the speed and distance at which plastic moves. Data could be obtained from camera videos and with LSPIV (Large Scale Particle Image Velocimetry) techniques. These can be used to observe plastic transport in floods, which is very difficult with other tools, and horizontal transport of plastic can be analyzed. The other dimension of transport is vertical transport. Plastics can move from the surface to the sediments or rise back to the surface. Turbulence that can be generated through storms or rough terrain is a strong environmental variable that results in the vertical mixing of plastics [
16]. This can be studied using hydroacoustic techniques using the ADCP (acoustic Doppler profiler) instrument. The ADCP is an instrument that has great potential for the detection of submerged plastics because the backscattering of the signal depends on the shape and material of the object. ADCPs have been used for decades, and historical data is available. They have the advantage of being a non-invasive instrument and applicable on a large scale.
5. Conclusions
Surface hydrology is an important driver of the dynamics of mobilization, transport and retention of floating plastic. Especially during peak discharge events, a strong response in plastic flow is observed in cities with a large waste problem. In turn, the regions most vulnerable to flooding have a greater potential for plastic transport in peak runoff events.
The scarcity of data in urban areas linked to urban solid waste is a very frequent problem. The methodology proposed for the analysis of the situation of plastic waste transport linked to an urban basin was the collection of based information on the problem at the site, surveys and visits to the site to learn about the problem, and the use of satellite images and Google Street View to determinate the garbage deposit on the neighborhood. This methodology was an adequate approach to the problem that allowed modeling plastic transport using EPA SWMM.
The results are consistent with the results obtained in the basin study of global analysis by Roebroek et al. (2022). Roebroek et al. analyses the interaction between mismanaged plastic waste data and flooded areas of rivers worldwide to estimate plastic mobilization caused by floods of different magnitudes. The results indicate that floods have a significant impact on plastic mobilization, increasing the global mobilization potential by tenfold (in the case of floods with a 10-year return period), compared to non-flood conditions. Floods with larger return periods mobilize even more plastic, but the relative increase is smaller as extreme floods increase flood depth, resulting in less new plastics being deposited.
It is observed that for the recurrences of 2 the peak flow of plastic transport does not occur simultaneously with the peak flow of runoff. This is because the mobilization of plastic occurs even for low flows.
Flood defenses significantly reduce the mobilization of plastics. However, it is important to highlight that the region’s most vulnerable to flooding also has a high potential for plastic mobilization during these events.
Little is known about this transport, and it involves and requires all actors in society, to reverse the environmental problems linked to plastic pollution.
Our rivers are a fundamental part of our environmental and social heritage; therefore, their protection and knowledge are necessary to be able to protect and manage them properly. A river not only conducts the flow of water, but it also conducts the life that develops in it and in its environment in that paradigm the Suquia River is the creator of life throughout its course and its protection must be a priority for the people of Cordoba.
6. Recommendations
The proposed methodology allowed for a comprehensive study to be carried out. As a result, an analysis was carried out taking into account the pillars of sustainable development and a study where social vulnerability, the environmental situation, the deterioration of socio-environmental quality and the deterioration of water bodies interact.
To refine the results obtained in this work, the drag coefficients should be adjusted using an approach based on observations or measurements to estimate the constants and thus generate the drag equation that resembles reality for the model.
One important aspect to continue working on is the generation of a georeferenced database of citizen contributions. The scarcity of data in urban areas linked to urban solid waste is a problem frequently faced by professionals when conducting studies. In this sense, a database containing information collected by citizens would be of great help to achieve studies that are more representative of reality. For this database to be useful for any professional, it must be easy to use, freely available and easily accessible, and also have constant maintenance and updating.
Acknowledgments
We would like to thank the chairs of the Faculty of Medical Sciences and Social Sciences of the UNC and the Secretary of Extension for their collaboration in carrying out this work.
References
- Van Emmerik, T.; De Lange, S.; Frings, R.; Schreyers, L.; Aalderink, H.; Leusink, J.; Begemann, F.; Hamers, E.; Hauk, R.; Janssens, N.; et al. Hydrology as a Driver of Floating River Plastic Transport. Earth’s Future 2022, 10, e2022EF002811. [Google Scholar] [CrossRef]
- Roebroek, C.; Laufkötter, C.; González Fernández, D.; van Emmerik, T. The Quest for the Missing Plastics: Large Uncertainties in River Plastic Export into the Sea. Environmental Pollution 2022, 312, 119948. [Google Scholar] [CrossRef] [PubMed]
- Lebreton, L.C.M.; Van Der Zwet, J.; Damsteeg, J.-W.; Slat, B.; Andrady, A.; Reisser, J. River Plastic Emissions to the World’s Oceans. Nat Commun 2017, 8, 15611. [Google Scholar] [CrossRef] [PubMed]
- Penza, T. Determinación de la capacidad de transporte de residuos plásticos en la Cuenca Dupuy. Integrative final work. Hydraulic Specialty, National University of Cordoba: Cordoba, Argentine, 2023.
- Funes, M.F. Caracterización del Transporte de Residuos Sólidos en el Río Suquía - Ciudad de Córdoba. Master Thesis, National University of Cordoba, Cordoba, Argentine, 2023. [Google Scholar]
- López, S. Diseño e implementación de un proyecto participativo para evaluar el riesgo de inundaciones y anegamientos urbanos : caso de aplicación: barrio Villa Páez, Córdoba, Argentina. Master Thesis, National University of Cordoba, Cordoba, Argentine, 2022. [Google Scholar]
- Barbagallo, F.; Leonhardt, L.; Molina, R. Diagnóstico socio-ambiental del Barrio Villa Páez 2018.
- Strusberg, I. Situación sanitaria y su entorno en un barrio aledaño al río Suquía de Córdoba, Argentina, en el contexto actual de cambio climático y contaminación hídrica.
- Romanello, M.; McGushin, A.; Di Napoli, C.; Drummond, P.; Hughes, N.; Jamart, L.; Kennard, H.; Lampard, P.; Solano Rodriguez, B.; Arnell, N.; et al. The 2021 Report of the Lancet Countdown on Health and Climate Change: Code Red for a Healthy Future. The Lancet 2021, 398, 1619–1662. [Google Scholar] [CrossRef] [PubMed]
- Weber, J. Parámetros Del Modelo de Pérdidas CN-SCS Para Áreas Permeables de La Ciudad de Córdoba, Argentina.; Cordoba, Argentine, 2014; p. 12.
- Dalmati, D. Manual de Hidráulica; Centro de Estudiantes de Ingeniería: La Plata, 1976. [Google Scholar]
- Caamaño Nelli, G. Informe Final: Regionalización de Precipitaciones Parala Provincia de Córdoba CIRSA-DIPAS; CIRSA-DIPAS: Córdoba, Argentina, 1994. [Google Scholar]
- Example 5. Runoff Water Quality for #SWMM5 and #InfoSWMM from the EPA Applications Manual. Available online: https://swmm5.org/2017/10/12/example-5-runoff-water-quality-for-swmm5-and-infoswmm-from-the-epa-applications-manual/ (accessed on 15 October 2024).
- Van Emmerik, T.; Kieu-Le, T.-C.; Loozen, M.; Van Oeveren, K.; Strady, E.; Bui, X.-T.; Egger, M.; Gasperi, J.; Lebreton, L.; Nguyen, P.-D.; et al. A Methodology to Characterize Riverine Macroplastic Emission Into the Ocean. Front. Mar. Sci. 2018, 5, 372. [Google Scholar] [CrossRef]
- Castro-Jiménez, J.; González-Fernández, D.; Fornier, M.; Schmidt, N.; Sempéré, R. Macro-Litter in Surface Waters from the Rhone River: Plastic Pollution and Loading to the NW Mediterranean Sea. Marine Pollution Bulletin 2019, 146, 60–66. [Google Scholar] [CrossRef] [PubMed]
- Lebreton, L.; Slat, B.; Ferrari, F.; Sainte-Rose, B.; Aitken, J.; Marthouse, R.; Hajbane, S.; Cunsolo, S.; Schwarz, A.; Levivier, A.; et al. Evidence That the Great Pacific Garbage Patch Is Rapidly Accumulating Plastic. Sci Rep 2018, 8, 4666. [Google Scholar] [CrossRef] [PubMed]
|
Disclaimer/Publisher’s Note: The statements, opinions and data contained in all publications are solely those of the individual author(s) and contributor(s) and not of MDPI and/or the editor(s). MDPI and/or the editor(s) disclaim responsibility for any injury to people or property resulting from any ideas, methods, instructions or products referred to in the content. |
© 2025 by the authors. Licensee MDPI, Basel, Switzerland. This article is an open access article distributed under the terms and conditions of the Creative Commons Attribution (CC BY) license (http://creativecommons.org/licenses/by/4.0/).