
Submitted:
06 February 2025
Posted:
07 February 2025
You are already at the latest version
Abstract
The on-going changing climate and its impacts are affecting our environment and most of the people who live in coastal areas. Seventy per cent of our home planet Earth is covered with oceans and they are accumulating more than 90% of the additional heat due to greenhouse gas emissions. That heat increases ocean volume through thermal expansion, and results in sea-level rise. To determine the consequences of climate change on the coastline of Casablanca, we used remote sensing technical approach combining the analysis processes of radar satellite altimetry images, Landsat satellite images, Google earth image, DEM image and geological and topographic maps of Casablanca. The creation of a database and its analysis show that the major parts of the coastline, especially on the sand beaches, situated at elevation less than 12 m are threatened by the sea rising at the rate of 2.6 mm/year and are under pressure of erosion possesses at a rate of -3 m/year. Fifty per cent of the study regions have a high coastal vulnerability index and are vulnerable to natural phenomena such as inundation, high tides, and coastal erosion.
Keywords:
Climate change
; coastal vulnerability index
; remote sensing
; Casablanca coastline
1. Introduction
Coastal areas hold an important role in economic development of coastal countries and coastal cities in general [1]. While the impacts of climate change have been evaluated for inland water reservoirs [2], research in coastal areas still lacking and need to be conducted using moder technologies. For the UK and Ireland, Maselink, et al. [3] indicates that the changes into the climate system will continue to increase the coastal erosion and affect the coastal geomorphology in general. In Mediterranean areas, Hughes et al. [4] analyzed the water flow exchange between Mediterranean and North Atlantic Ocean and noticed that such water flow leads to the change into sea level and could be increased by the change into the climate system. With its 3500 km of coastlines [5], Morocco is threatened by sea level rise as consequence of climate change and the regions like Nador and Al Hoceima are more vulnerable [6] due to the rise of Mediterranean Sea.
According to the World Meteorological Organization [7], in many regions of Morocco, in February 2013 the instruments recorded the temperature below the mean value and the wave of cold; on 17 September 2013, the rain was recorded for more than 3 hours in Marrakech city and has killed 2 persons and destroyed 10 buildings. These meteorological changes affect the sustainable development of our society and are more likely related to the climate change. At the European level, Athanasiou et al. [8] evaluated the projection of the sandy beach erosion due to sea level rise, and indicated how sea level rise will affect tourist and ecological values while Anfuso et al. [9] discussed the solutions and interventions adopted for coastal erosion and indicated that bad practices have consequences in coastal erosion management.
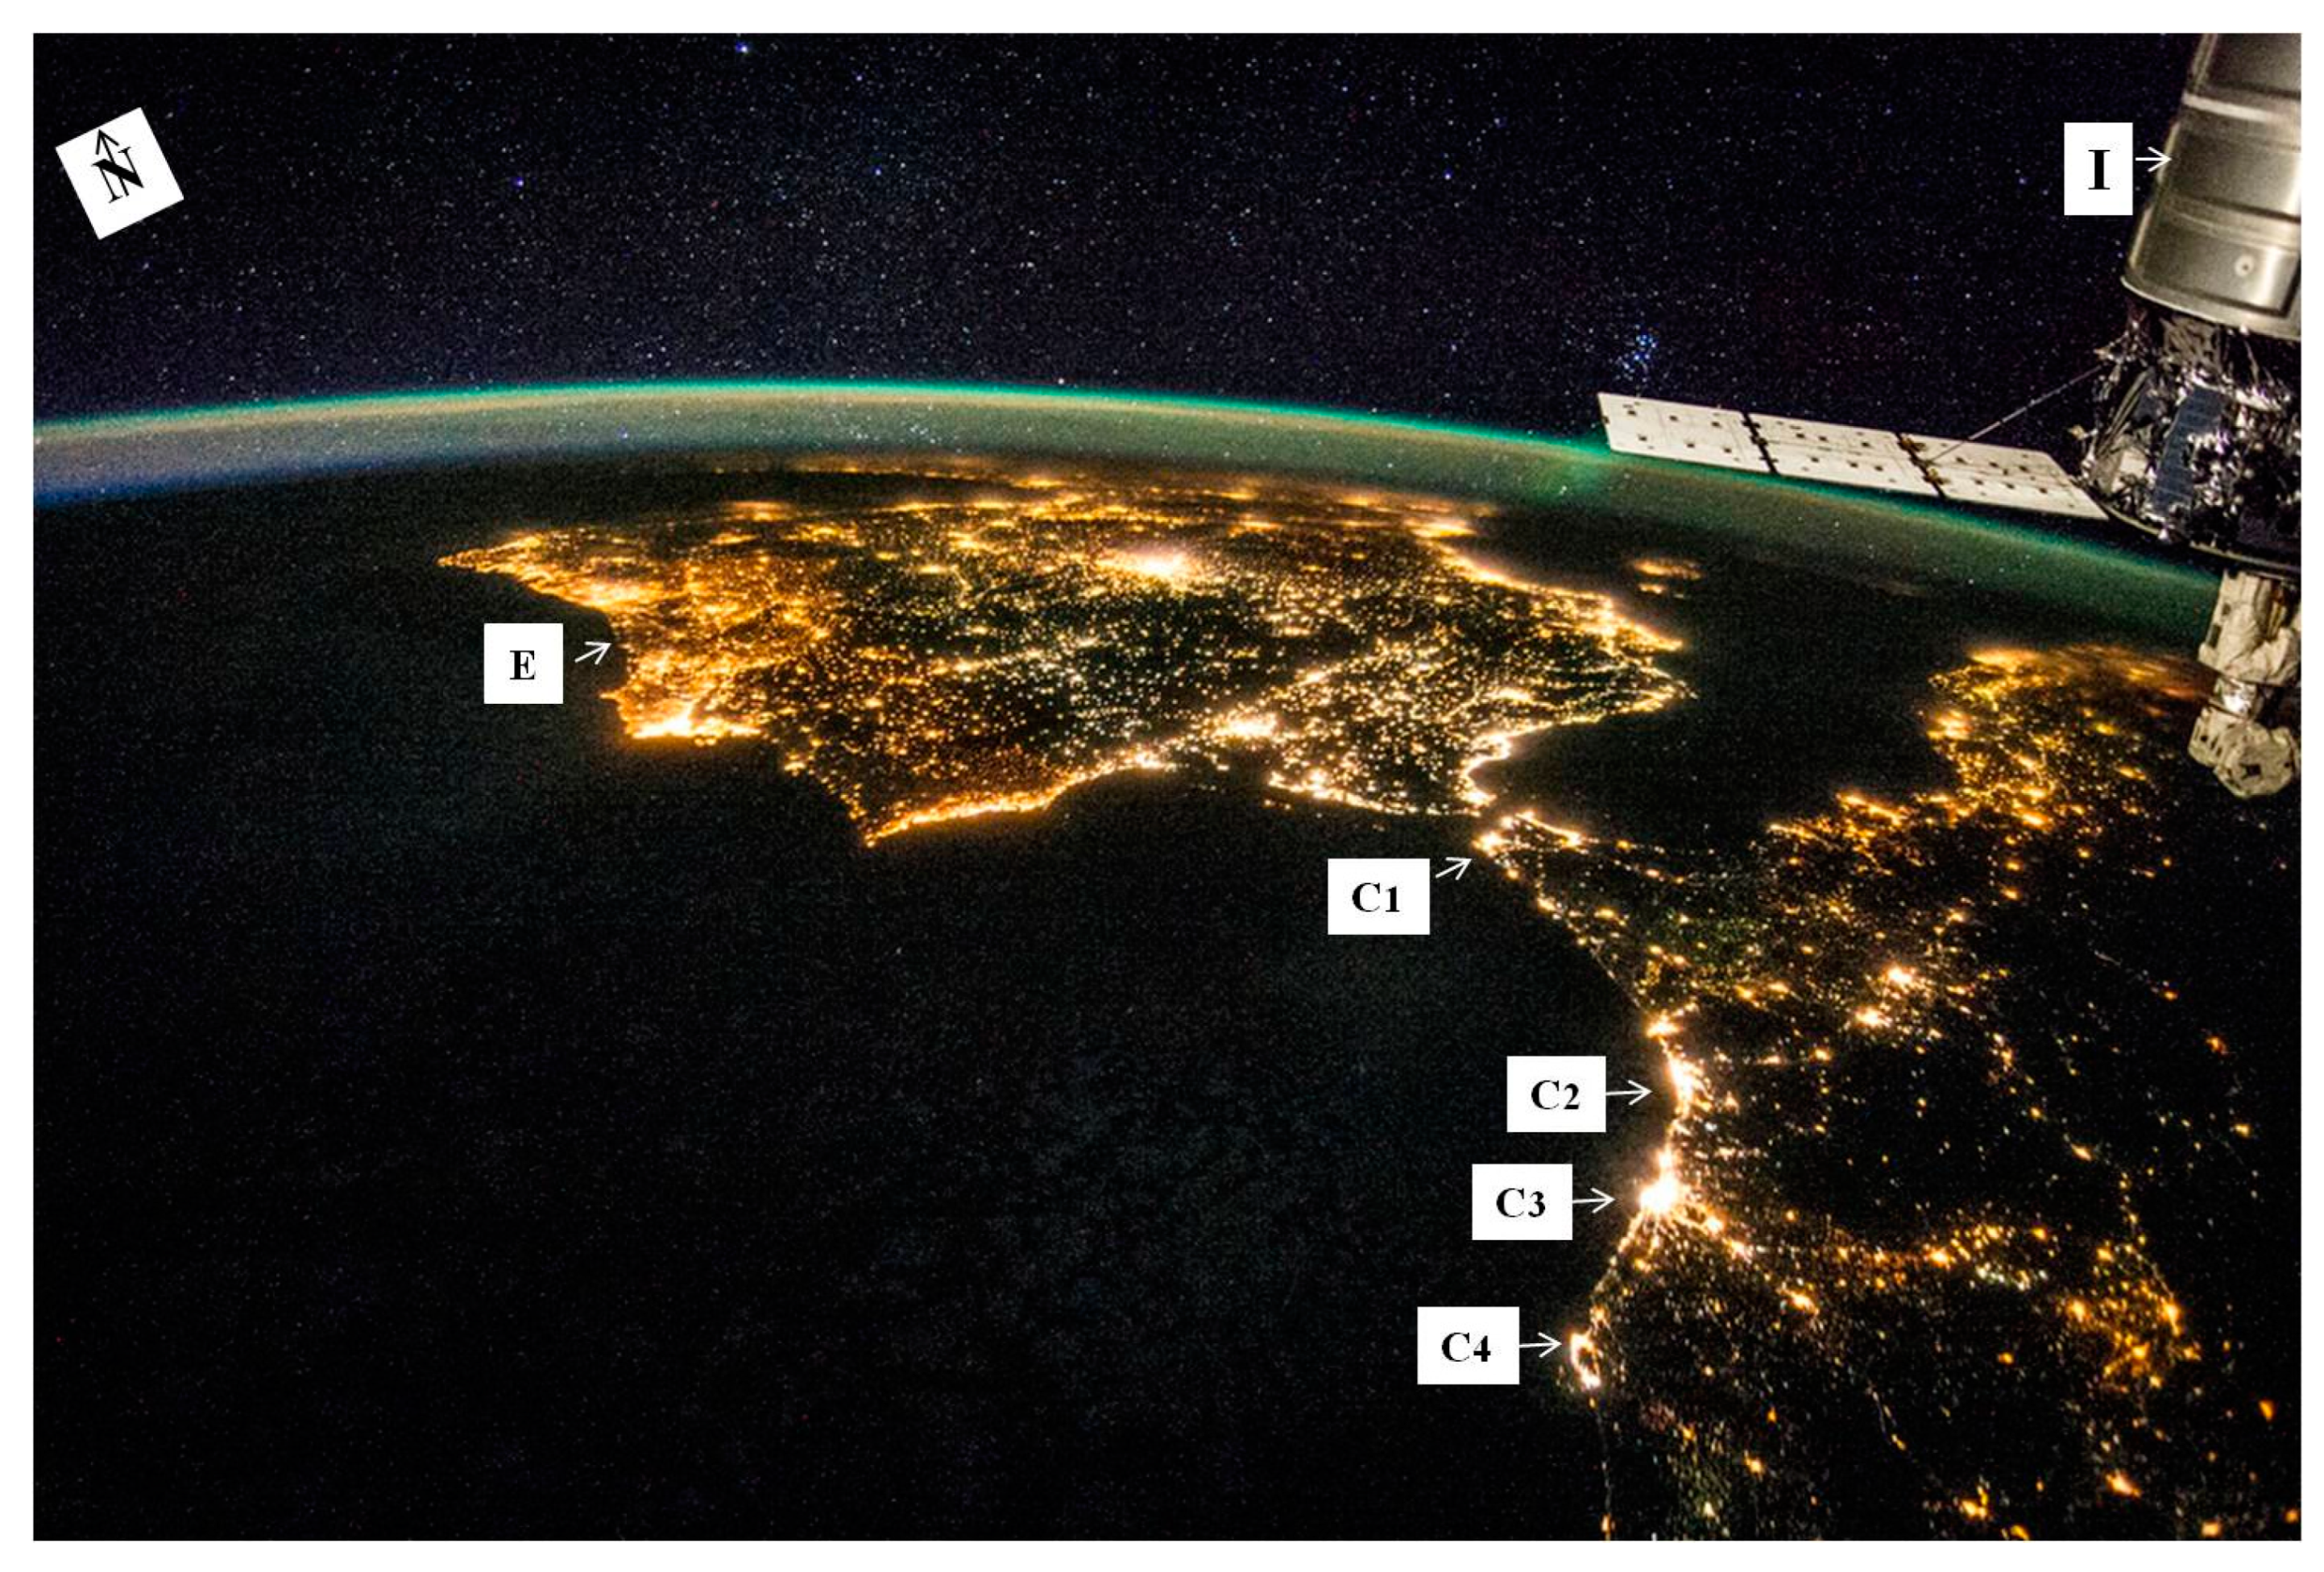
According to the World Bank, in 1990 the population living in the areas with altitude less than 5 m was 3.17 % and in 2000 it was 3.75 %. More than 60 % of the population and 90 % of Moroccan industries are in the coastal cities [10]. This population is going to face the consequences of climate change such as intense flooding, increased storm events, variations of precipitation, and tides with higher values than usual and intense erosion of the coast. Figure (1) shows that many people and more infrastructures are in the coastal cities meaning that their activities (agriculture, transport, and energy), their health, their infrastructures and their industries will be affected by the changes in climate system.
Pantusa et al. [11] and Manno et al. [12] Indicated that coastal vulnerability can between evaluated by applying a Coastal Vulnerability index (CVI); such process involves the study of coastal dynamics by analyzing the shoreline movement. Borzi et al. [13] and Foti et al. [14] analyzed the shoreline evolution and environmental changes by studying the shoreline dynamics. In addition, Castelle et al. [15] and Konstantinou et al. [16] used satellite imageries to explore the potential of Earth observation (EO) data in the study of coastal area vulnerability, at the national scale Luijendijk et al. [17]. Darwish et al. [18] analyzed the morphological changes by using remotely sensed imageries], at country-level this has been conducted by Bishop-Taylor et al. [19] and Nanson et al. [20] as well. EO imagery can be used to obtain information on shallow water, [21,22,23,24] and its morphology. In addition, marine and land morphology features [25,26,27,28,29] of coastal area [30] can be obtained by using UAVs [31]as well. While Pramanik et al. [32] used 5 parameters and Thieler et al. [33] used 6 parameters.
This current study was conducted on the coast of Casablanca with the aim of evaluating and demonstrating the potential of EO imageries in the assessment of CVI in the Mediterranean area by using 7 parameters. The current study focuses on the City of Casablanca in order to evaluate how climate change has been affecting the sea level of the Atlantic Ocean and the consequences of those variations to the people, their activities, and the landscape. By identifying the regions that are more vulnerable, this study could help the decision makers to take measures that reduce the effects and the consequences of climate change to the people living in those areas.
Figure 1.
Aerial picture taken on the night of 26 July 2014 by one crew member of the expedition 40 aboard the international space station. It shows the main Moroccan coastal cities and the part of Europe. I: instruments of the international space station, E: Europe, The major Moroccan coast cities, C1: Tanger and Sebta, C2: Rabat and Salé, C3: Casablanca (study area) and Mohammedia, C4: Essaouira. N: North.
2. Materials and Methods
2.1. Area of Study
The city of Casablanca is one of the Moroccan coastal cities. It is economic capital which is located on the north-west of the country on the Atlantic Ocean (Figure 2). Casablanca has many districts like Anfa, Sidi Belyout, Ain Sebba, Sidi Bernoussi, etc. It has 3.7 million of people and holds the most important port of the country and many industries. This area is the ideal place to study the effect of climate change because it is at the junction of three environments namely ocean, lands, and atmosphere where we can observe the role played by every unit in the climate system.
Because of its position and its relationship with the Atlantic Ocean, Casablanca has winter precipitations influenced by several factors such as North Atlantic Oscillation and the atmospheric dampness of the west. The annual average temperature varies from one season to another with 12.7°C in winter to 21°C in the summer and the annual average precipitation of 427 mm with some variabilities like a minimum value below 200 mm and a maximum value that can reach 800 mm.
In the last 47 years from 1961 to 2008, the annual accumulated precipitation dropped to a rate of -2.8 mm per year, these tendencies observed at Casablanca meteorological stations show that its climate is changing; it tends to become hotter and drier all through the past decades. The drought seems to last even in winter and in the spring. During the autumn we notice the short period with consecutive days with rain [34]. Among some exceptional meteorological events observed at Anfa/Casablanca station, we can quote three of them with high daily values of precipitations 75 mm, 74 mm, and 75.2 mm in 1995, 1996 and 2002 respectively. In the last 70 years, Morocco experienced some drought conditions that reduced significant amount of surface and groundwater, for example in 1944-1945, 1980-1985, 1990-1995 and 1998-2000.
The wind which takes place in areas with modification in atmospheric pressure has an impact on the ocean, in times of currants and oceanic temperatures. In the current area of study, the wind has S and SW directions in November till February and NNE and NW direction in April till September with 1.3 to 4.9 m/sec monthly average speed, but it can reach 43 m/s maximum value for violent instantaneous wind in winter at frequency of 10.2 days/year [35].
The sea surface temperature data taken by the station located in Atlantic Ocean on the coast of Casablanca city shows that their temperature has increased to 1°C for the period of 1924 to 2014 (Figure 3).
Rivers and water courses play an important role in the carbon cycle. When they flow, they can erode the soil and some rocks and therefore take with them the carbon they contain into the ocean, where they can be transformed into carbonate rocks. These drainage lines (Figure 4) can also be the source of carbon which can be introduced into the atmosphere where it can become a greenhouse gas. A large part of Casablanca is urbanized with low slopes and geological formations resistant to erosion; in this area drainage lines do not play a huge role as a source of greenhouse gas.
2.2. Methodology
2.2.1. Dataset and Software
In this study topographic and geological maps and Radar and optic satellite images were used. We choose the satellite sensors that study the properties of rocks and soil (Landsat satellite, (Table 1), Department of the Interior [36], to distinguish the limit of the ocean and land (shoreline). To locate the position of the shoreline on Casablanca we choose the Landsat images from 1973 to 2015. To compute the height of the Ocean, we used the satellites that measure mean sea level (satellite altimetry, Topex/ Poseidon and Jason 1-2,). We also used Advanced Space borne thermal Emission and Reflection Radiometer (ASTER) Global Digital Elevation Model (GDEM) version 2, ASTER GDEM is a product of METI and NASA, with a space resolution of 30 m, to compute elevation and extract the drainage lines and geomorphology of study area. We used sea level essential climate variable data which contains information on mean sea level and sea level anomalies. ENVI 5.00 software was used to process Landsat images; and later their results (Shoreline position shapefiles) were introduced in ArcGIS 10.0 with DSAS 4.3 extension to compute the statistics of the position of shoreline. Basic Radar altimetry Toolbox 3.1.0 graphic user interface [37] was used to process radar satellite altimetry images. Methodological approach adopted is presented on the Figure 5.
2.2.2. Data Processing
2.2.2.1. Landsat Images Processing
Landsat satellite images have been used to extract the shoreline position all along the coast of Casablanca City. After downloading the data on earthexploer.org website, we start their process in ENVI 5.0 software by doing atmospheric and geometrical corrections. At the next step, we continue the processing of the data by identifying and separating some objects using spectral indices by combining surface reflectance at two wavelengths.
For each Landsat image we extract and digitize the shoreline position from 1973 to 2015 We created a database of those multi temporal shoreline positions in ArcGIS and the DSAS 4.3 (digital shoreline analysis system), software extension [38]; was used to compute the rate change statistics, for 50 m spacing, of those series of shorelines (Figure 6).
2.2.2.2. Fundamental Climate Data Record (FCDR) Processing
These are mono-mission products generated from altimeter products; Fundamental climate data record (FCDR) data were provided by European space agency-sea level climate change initiative [39]. They contain the long-trace sea level height estimated over the ocean with a high precision; they also contain the altimeter standards applied in the estimation of sea level height calculation as the mean sea surface and geophysical corrections. These data have been processed by ESA through their program of CCI, they have the parameters we used to determine the sea surface height on the coast of Casablanca; to do so we used Basic Radar altimetry Toolbox 3.1.0 graphic user interface [37] to visualize and extract that information.
2.2.2.3. Sea Level Essential Variable Processing
These are gridded Network Common Data Form (NetCDF); they contain monthly sea level anomalies and global mean sea level change. We used NetCDF file Browser software to extract the level of the ocean in the region of study.
2.2.3. Coastal Vulnerability Index Estimation
The information extracted from different maps (geological, topographic), shoreline positions, sea level rise, erosion/accretion process, mean tide range and mean wave height were used to compute the CVI using the equation integrating all these variables (Table 2). There is no conventional equation to the estimation of the coastal vulnerability index Pramanik MK et al. [32] used five parameters, while Thieler et al. [33] used six parameters; in this study seven parameters were used so that we can get more information related to the variability in the climate. Equation (1) was used to estimate the coastal vulnerability index on the Coast of Casablanca; the results are ranked from very high to low.
3. Results and Discussions
The city of Casablanca situated at the west limit of Moroccan coastalline, it has two main rivers namely Beth and Bourgreg. It aslso has big watershed and many dams. In addition, the coastal region is drained by small rivers such as Oued Mellah, Oued Lakhdar, Oued Dir, Oued Merzeg, Oued Arrimena and Oued Bouskoura. Each of these rivers has its own watershed with variable shapes and different characteristics. The geological formations dominating the coast of Casablanca are shale, sandstone, and quartzite; these formations constitute the folded Hercynian bedrock which is affected by a network of fault dominating the NE-SW direction. This bedrock is visible in some regions of the coast, but the rest is covered by secondary (Triassic and Cretaceous) formation and Tertiary formations dominated by limestone, conglomerate and quaternary formation dominated by sand (Figure 7). The geomorphology of Casablanca coast is characterized by sand beaches, rocky beaches, and man-made structures.
The slope is an important parameter in the study of the impact of sea level rise, it not only makes it possible to estimate the relative risks of flooding of the shore. it also has influance the speed of change of the coastline in shrinkage for regions with low slopes. Most of Casablanca coastline has the slope ranging from 0 to 4% (Figure 8) with areas likely to be affected by the rise in sea level which is accompanied by surges, storms and the action of waves. The eastern coastline near Zenata is the most exposed and vulnerable.
The analysis of altimetry data shows that from January 15, 1993, to December 15, 2014, the sea level at the coast of Casablanca increased at the rate of 2.6 mm/year (Figure 9). This sea level rise is partially the response of global melting of glacier and ice sheets, continental water exchange with the ocean and the Gibraltar Strait, the rise of ocean temperature and glacial isostatic adjustment.
In terms of coastal erosion, the coast of Casablanca, from 1973 to 2015, has high rate of erosion process of about -5 to -3 m/year. This phenomenon affected the regions occupied by the sand beaches with low protection against the tides and human activities. Almost the entire coastline of Casablanca is affected by erosion with high rate observed in the regions occupied by quaternary formations and low rate at the areas occupied by hard rocks and manmade structures. At the North-East of Casablanca, on the beaches of Zenata, Anfa and Ain Diab the shoreline variation is continuous in times which means only erosion persists in these areas. On the Port and Marina of Casablanca and its western part the position of the shoreline is irregular in times with alternation of erosion and accretion processes (Figure 10). There is no progradation process observed, the positive numbers represent areas with development activities.
Coastal area elevation is the important factor in analyzing the behavior of the coastline in the face of sea level rise. Land elevation was extracted from ASTER GDEM version 2 with a spatial resolution of 30 m shows that most of the Casablanca coastline is located below 9 m altitude (Figure 11) which constitutes a part that is very vulnerable to rising sea levels. The latter will amplify the erosion of beaches and very high altitude areas and accentuates the submersion of land by wave action.
Studies carried out on the coastline of Casablanca-Mohammedia show evidence of ancient land movements and block falls generally located at the level of the coastal Corniche and places. The geological context of Morocco and other countries of the Gulf of Cadiz (Spain, Portugal) is the source of tsunami which can destroy a large part of their coastlines (Figure 12) Omira et al. [40]. Concerning seismic risks, the PGA maps calculated for a return period of 475 years show values between 0.04g and 0.08g indicating that the Casablanca site would have an intensity of the order of V corresponding to a moderate level of damage.This allowed us to envisage an intensity on the order lower than V for a period of 50 years. However, such intensity estimated for PGA values do not take into account local geological or topographical conditions that can amplify seismic movements [34]. Regarding tsunami risks, historical events and seismotectonic contexts indicate that the Moroccan west coast is exposed to relatively significant tsunami risks with wave heights of 2 m and 1 m compared respectively to the events of the first of November 1755 and 28th February 1969. In the next 20 years, it has been estimated an indication of about 10% probability of having a wave of 1m height on the coastline of Casablanca [34].
The estimation of Coastal Vulnerability index (CVI) (Figure 13) indicates that the Eastern and Western coastline of Casablanca are more vulnerable due to the lack of protection on many places occupied by the sandy beaches, while the areas occupied by hard rocks or cliffs are less vulnerable. However, in the central part of the harbor of Casablanca where they are the development activities is well protected.
The analysis of the Landsat satellite images shows how the city of Casablanca has changed over the years in land cover and land use. Its shoreline has changed at the average rate of -2.5 m/year, this number seems to be higher compared to -0.9 and -1.1 m/ year found by previous study, however such difference is due to the type of data, the period studied, and the spatial resolution of data used as well as the method used to compute that rate. Landsat images was used due to their open and freely availability policy makes the identification of shoreline variations ideal and cost effective. DSAS 4.3 software extension in ArcGIS used was identified as suitable for climate change studies involving computing of statistical rate changes of the position limits such as lake, river, glacial, ice sheets and shorelines. We used the constant values of sea level rise, mean wave height and mean tide range for all the study area because we noted that there is no significant change of these variables on every point of this area of study. The sea level rise value used, 2.6 mm/yr, is computed from altimetry satellite data for a period of 1993-2014. It is less significant than 5-10 mm/yr found in the regions alongside Mediterranean Sea [9] and more significant than 2.5 mm/year found at Mohammedia [41]. This sea level rise is related to climate change and seems to have influence on the dynamism of the shoreline of Casablanca coastline. The combination of these variables with geomorphology-lithology, coastal slope, mean tide range, mean wave height and altitude helped to estimate the coastal vulnerability index; and its values indicate that 50% of Casablanca is vulnerable and some parts of its coastline needs changes in practice and protection (Figure 14) against effects of extreme weather and human activities, the Easter part at Zenata where the city reaches the vulnerable coastline, the city is at risks and needs more protection.
4. Conclusions
The present study has been undertaken to evaluate the coastal vulnerability of Casablanca coastline due to climate change using remote sensing and geographic information system (GIS). The coastal area of Casablanca is one of the main cities of the country with the highest population density with more than 3.7 million people. It is the economic capital with many activities carried out essentially through its Port and numerous industries, its infrastructures, and communication network. This area is drained by the hydrographic network consists of some rivers, locally called Oued, on which they build dams that contain water used in agricultural, everyday life and in irrigation activities.
To estimate the CVI, we used seven variables that can be affected by consequences of the changing climate. The results found indicate that remote sensing techniques are the suitable tool to monitor the consequences of climate change for a large area and for different periods. The Landsat satellite imagery and radar satellite altimetry data combined with other sources of information on the land and on the ocean helped us to study the impact of climate change on the City of Casablanca. The benefits that Casablanca takes from its coastline position can be disabled by the risks of sea level which increases at a rate of 2.6 mm/ year resulting from climate change. The risk of submersion is also observed in the lower and unprotected parts of the study area, the erosion of sandy beaches, the intrusion of sea water into aquifers and more floods will be the consequences of our changing climate.
Funding
This research received no external funding.
Conflicts of Interest
The authors declare no conflicts of interest.
References
- Petrişor, A.-I.; Hamma, W.; Nguyen, H.D.; Randazzo, G.; Muzirafuti, A.; Stan, M.-I.; Tran, V.T.; Aştefănoaiei, R.; Bui, Q.-T.; Vintilă, D.-F.; et al. Degradation of Coastlines under the Pressure of Urbanization and Tourism: Evidence on the Change of Land Systems from Europe, Asia and Africa. Land 2020, 9, 275. [Google Scholar] [CrossRef]
- El Ouali, A.; El Hafyani, M.; Roubil, A.; Lahrach, A.; Essahlaoui, A.; Hamid, F.E.; Muzirafuti, A.; Paraforos, D.S.; Lanza, S.; Randazzo, G. Modeling and Spatiotemporal Mapping of Water Quality through Remote Sensing Techniques: A Case Study of the Hassan Addakhil Dam. Appl. Sci. 2021, 11, 9297. [Google Scholar] [CrossRef]
- Masselink, G.; Russell, P. Impacts of Climate Change on Coastal Erosion. MCCIP Sci. Rev. 2013, 2013, 71–86. [Google Scholar]
- Hughes, C. W. J. Bingham, V. Roussenov, J. Williams, and P. L. Woodworth, 2015, The effect of Mediterranean exchange flow on European time mean sea level, Geophys. Res. Lett. 42, 466–474.
- Niazi, S. 2007, Evaluation des impacts des changements climatiques et de l’élévation du niveau de la mer sur le littoral de Tétouan (Méditerranée occidentale du Maroc): Vulnerability et Adaptation. « Indice (CVI) a publication paper. P194-207, P7-16.
- Khouakhi A., Snoussi M., Niazi S., Raji O, 2013, Vulnerability assessment of Al Hoceima bay (Moroccan Mediterranean coast): a coastal management tool to reduce potential impacts of sea‐level rise and storm surges Proceedings 12th International Coastal Symposium (Plymouth, England), Journal of Coastal Research, Special Issue No. 65, pp. 968‐973. ISSN 0749-0208.
- World Meteorological Organization, 2014, Statement on the status of the global climate in 2014, Annual report. P4-16.
- Athanasiou, P.; van Dongeren, A.; Giardino, A.; Vousdoukas, M.I.; Ranasinghe, R.; Kwadijk, J. Uncertainties in projections of sandy beach erosion due to sea level rise: An analysis at the European scale. Sci. Rep. 2020, 10, 11895. [Google Scholar] [CrossRef] [PubMed]
- Anfuso, G.; Martínez del Pozo, J.Á.; Rangel-Buitrago, N. Bad practice in erosion management: The southern Sicily case study. In Pitfalls of Shoreline Stabilization: Selected Case Studies; Cooper, J.A.G., Pilkey, O.H., Eds.; Springer: Berlin/Heidelberg, Germany, 2012; Volume 3, pp. 215–233. [Google Scholar]
- Maria, S. , Tachfine O., Khouakhi A., and Isabelle N., 2006, Impacts of sea-level rise on the Moroccan coastal zone: Quantifying coastal erosion and flooding in the Tangier Bay_ publication paper on academia.edu. P1.
- Pantusa, D.; D’Alessandro, F.; Frega, F.; Francone, A.; Tomasicchio, G.R. Improvement of a Coastal Vulnerability Index and Its Application along the Calabria Coastline, Italy. Sci. Rep. 2022, 12, 21959. [Google Scholar] [CrossRef] [PubMed]
- Manno, G.; Azzara, G.; Lo Re, C.; Martinello, C.; Basile, M.; Rotigliano, E.; Ciraolo, G. An Approach for the Validation of a Coastal Erosion Vulnerability Index: An Application in Sicily. J. Mar. Sci. Eng. 2023, 11, 23. [Google Scholar] [CrossRef]
- Borzì, L.; Anfuso, G.; Manno, G.; Distefano, S.; Urso, S.; Chiarella, D.; Di Stefano, A. Shoreline Evolution and Environmental Changes at the NW Area of the Gulf of Gela (Sicily, Italy). Land 2021, 10, 1034. [Google Scholar] [CrossRef]
- Foti, G.; Barbaro, G.; Barillà, G.C.; Mancuso, P.; Puntorieri, P. Shoreline Evolutionary Trends Along Calabrian Coasts: Causes and Classification. Front. Mar. Sci. 2022, 9, 846914. [Google Scholar] [CrossRef]
- Castelle, B.; Masselink, G.; Scott, T.; Stokes, C.; Konstantinou, A.; Marieu, V.; Bujan, S. Satellite-derived shoreline detection at a high-energy meso-macrotidal beach. Geomorphology 2021, 383, 107707. [Google Scholar] [CrossRef]
- Konstantinou, A.; Scott, T.; Masselink, G.; Stokes, K.; Conley, D.; Castelle, B. Satellite-based shoreline detection along high-energy macrotidal coasts and influence of beach state. Mar. Geol. 2023, 462, 107082. [Google Scholar] [CrossRef]
- Luijendijk, A.P.; Kras, E.; Dagalaki, V.; Morelissen, R.; Hoteit, I.; Ranasinghe, R. Regime Shifts in Future Shoreline Dynamics of Saudi Arabia. Front. Mar. Sci. 2022, 8, 798657. [Google Scholar] [CrossRef]
- Darwish, K.; Smith, S. Landsat-Based Assessment of Morphological Changes along the Sinai Mediterranean Coast between 1990 and 2020. Remote Sens. 2023, 15, 1392. [Google Scholar] [CrossRef]
- Bishop-Taylor, R.; Nanson, R.; Sagar, S.; Lymburner, L. Mapping Australia’s Dynamic Coastline at Mean Sea Level Using Three Decades of Landsat Imagery. Remote Sens. Environ. 2021, 267, 112734. [Google Scholar] [CrossRef]
- Nanson, R.; Bishop-Taylor, R.; Sagar, S.; Lymburner, L. Geomorphic insights into Australia’s coastal change using a national dataset derived from the multi-decadal Landsat archive. Estuar. Coast. Shelf Sci. 2022, 265, 107712. [Google Scholar] [CrossRef]
- Danielson, J.J.; Poppenga, S.K.; Brock, J.C.; Evans, G.A.; Tyler, D.J.; Gesch, D.B.; Thatcher, C.A.; Barras, J.A. Topobathymetric Elevation Model Development using a New Methodology: Coastal National Elevation Database. J. Coast. Res. 2016, 76, 75–89. [Google Scholar] [CrossRef]
- Muzirafuti, A.; Crupi, A.; Lanza, S.; Barreca, G.; Randazzo, G. Shallow water bathymetry by satellite image: A case study on the coast of San Vito Lo Capo Peninsula, Northwestern Sicily, Italy. In Proceedings of the 2019 IMEKO TC19 International Workshop on Metrology for the Sea: Learning to Measure Sea Health Parameters, MetroSea 2019, Genoa, Italy, 3–5 October 2019; pp. 129–134. [Google Scholar]
- Misra, A.; Ramakrishnan, B. Assessment of coastal geomorphological changes using multi-temporal Satellite-Derived Bathymetry. Cont. Shelf Res. 2020, 207, 104213. [Google Scholar]
- Randazzo, G.; Barreca, G.; Cascio, M.; Crupi, A.; Fontana, M.; Gregorio, F.; Lanza, S.; Muzirafuti, A. Analysis of Very High Spatial Resolution Images for Automatic Shoreline Extraction and Satellite-Derived Bathymetry Mapping. Geosciences 2020, 10, 172. [Google Scholar] [CrossRef]
- Harishidayat, D.; Al-Shuhail, A.; Randazzo, G.; Lanza, S.; Muzirafuti, A. Reconstruction of Land and Marine Features by Seismic and Surface Geomorphology Techniques. Appl. Sci. 2022, 12, 9611. [Google Scholar] [CrossRef]
- Muzirafuti, A.; Lanza, S.; Paltrinieri, D.; Faina, G.; El Hafyani, M.; Randazzo, G. Geomorphology in the Digital Age: A Case Study Project of Quantitative Geomorphology from Images. In Proceedings of the 2023 International Workshop on Metrology for the Sea; Learning to Measure Sea Health Parameters (MetroSea), La Valletta, Malta, 4–6 October 2023; pp. 513–518. [Google Scholar]
- Muzirafuti, A.; Cascio, M.; Lanza, S. UAV Photogrammetry-Based Mapping of Sicilian Pocket Beaches: First Approach. In Planet Care from Space; Dessena, M.A., Melis, M.T., Eds.; AIT Series, Trends in Earth Observation; Italian Society of Remote Sensing: Cagliari, Italy, 2021. [Google Scholar]
- Muzirafuti, A.; Randazzo, G.; Lanza, S. UAV Application for Coastal Area Monitoring: A Case Study of Sant’Alessio Siculo, Sicily. In Proceedings of the MetroSea 2022, 2022 IEEE International Workshop on Metrology for the Sea—Learning to Measure Sea Health Parameters, Messina, Italy, 3–5 October 2022; Institute of Electrical and Electronics Engineers Inc.: Piscataway, NJ, USA, 2022; pp. 143–147. [Google Scholar]
- Muzirafuti, A.; Cascio, M.; Lanza, S.; Randazzo, G. UAV Photogrammetry-based Mapping of the Pocket Beaches of Isola Bella Bay, Taormina (Eastern Sicily). In Proceedings of the 2021 International Workshop on Metrology for the Sea; Learning to Measure Sea Health Parameters (MetroSea), Reggio Calabria, Italy, 4–6 October 2021; pp. 418–422. [Google Scholar]
- Faelga, R. A. Cantelli, L., Silvestri, S., and Giambastiani, B. M. S.: Dune belt restoration effectiveness assessed by UAV topographic surveys (Northern Adriatic coast, Italy), EGUsphere [preprint], https://doi.org/10.5194/egusphere-2023-474, 2023. [CrossRef]
- Tomasello, A.; Cassetti, F.P.; Savona, A.; Pampalone, V.; Pirrotta, M.; Calvo, S.; Signa, G.; Andolina, C.; Mazzola, A.; Vizzini, S.; et al. The use of very high-resolution images for studying Posidonia oceanica reefs. Vie Milieu 2020, 70, 25–35. [Google Scholar]
- Pramanik MK, Biswas SS, Mukherjee T, Roy AK, Pal R, et al.,2015, Sea Level Rise and Coastal Vulnerability along the Eastern Coast of India through Geo-spatial Technologies. J Remote Sensing & GIS 4: 145.
- Thieler, E. Robert, and Erika S. Hammar-Klose, 1999, National Assessment of Coastal Vulnerability to Sea-Level Rise: Preliminary Results for the U.S. Atlantic Coast. U.S. Geological Survey Woods Hole, Massachusetts.
- Egis bceom international / iau-idf / brgm, 2011, Adaptation au changement climatique et aux désastres naturels des villes côtières d’Afrique du Nord, phase 1: Évaluation des risques en situation actuelle et à l’horizon 2030 pour la ville de Casablanca Version finale. P17-25, p33-52, P70-80.
- Oussama, L. , 2013, Approche multidisciplinaire de suivi de la dynamique marine du littoral de Mohammedia. Mémoires de MASTER “Eau et Environnement” Faculté des sciences et technique de Marrakech/Maroc. p24-25.
- Department of the Interior, U.S. Geological Survey, 2015, Landsat 8 (L8) data users Handbook, LSDS-1574 Version 1.0. P3-5, p45-67.
- Basic Radar Altimetry Toolbox v3.1, 2012, User Manual.
- Thieler, E.R. , Himmelstoss, E.A., Zichichi, J.L., and Ergul, Ayhan, 2009, Digital Shoreline Analysis System (DSAS) version 4.0 — An ArcGIS extension for calculating shoreline changes: U.S. Geological Survey Open-File Report 2008-1278. *Current version 4.3.
- ESA Sea Level CCI, 2014, CLS-DOS-NT-12-183 SLCCI-PUG-029 V 1.8 Dec. 17, 2014: D3.4 Product User Guide. P1-9.
- Omira, R.; Baptista, M.A.; Matias, L.; Miranda, J.M.; Catita, C.; Carrilho, F.; Toto, E. Design of a Sea-level Tsunami Detection Network for the Gulf of Cadiz. Nat. Hazards Earth Syst. Sci. 2009, 9, 1327–1338. [Google Scholar] [CrossRef]
- Khouakhi, A. , Maria S., Niazi S., and Raji O., 2010, Le Système d’Information Géographique (SIG): un outil pour l’évaluation des terres à risque d’inondation côtière liée aux changements climatiques. Cas du littoral de Mohammedia.
Figure 2.
The coastal city of Casablanca.
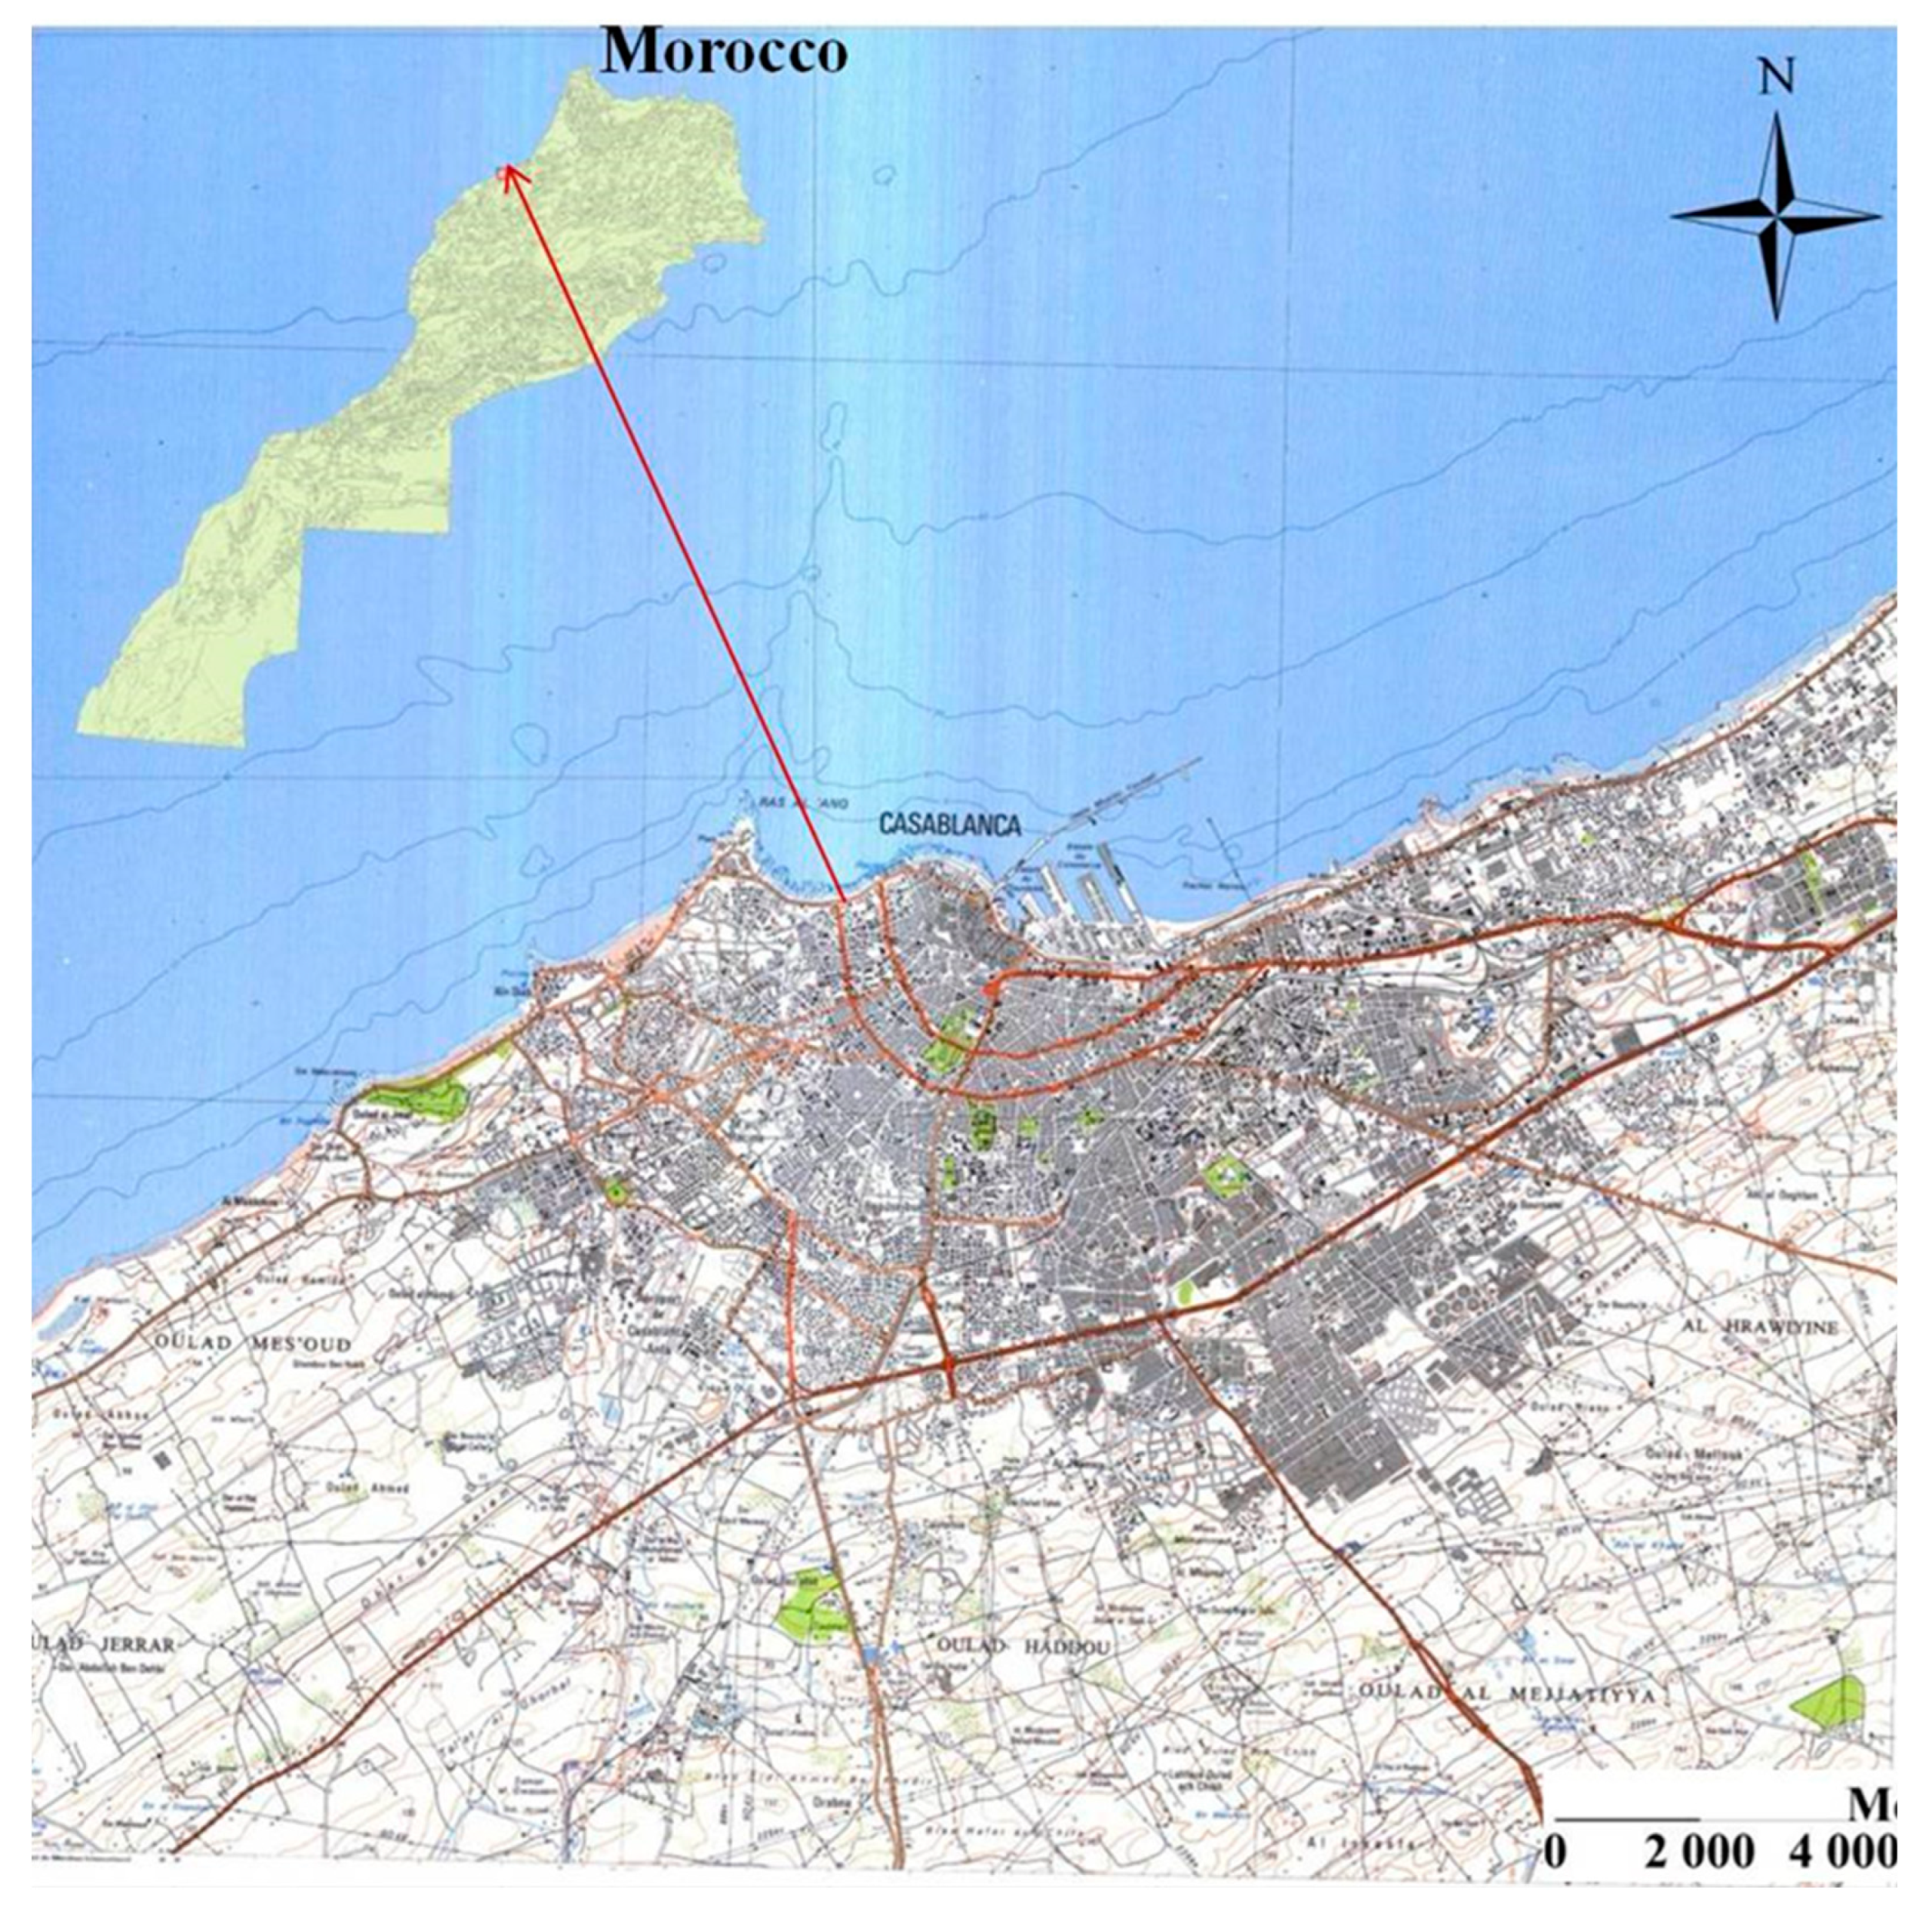
Figure 3.
Sea surface temperature of Atlantic Ocean obtained from the station located on the coast of Casablanca (coordinates of station :33.6 N, 7.7 W) a tendency of 0.011°C/yr for a period of (1924-2014) was observed.
Figure 3.
Sea surface temperature of Atlantic Ocean obtained from the station located on the coast of Casablanca (coordinates of station :33.6 N, 7.7 W) a tendency of 0.011°C/yr for a period of (1924-2014) was observed.
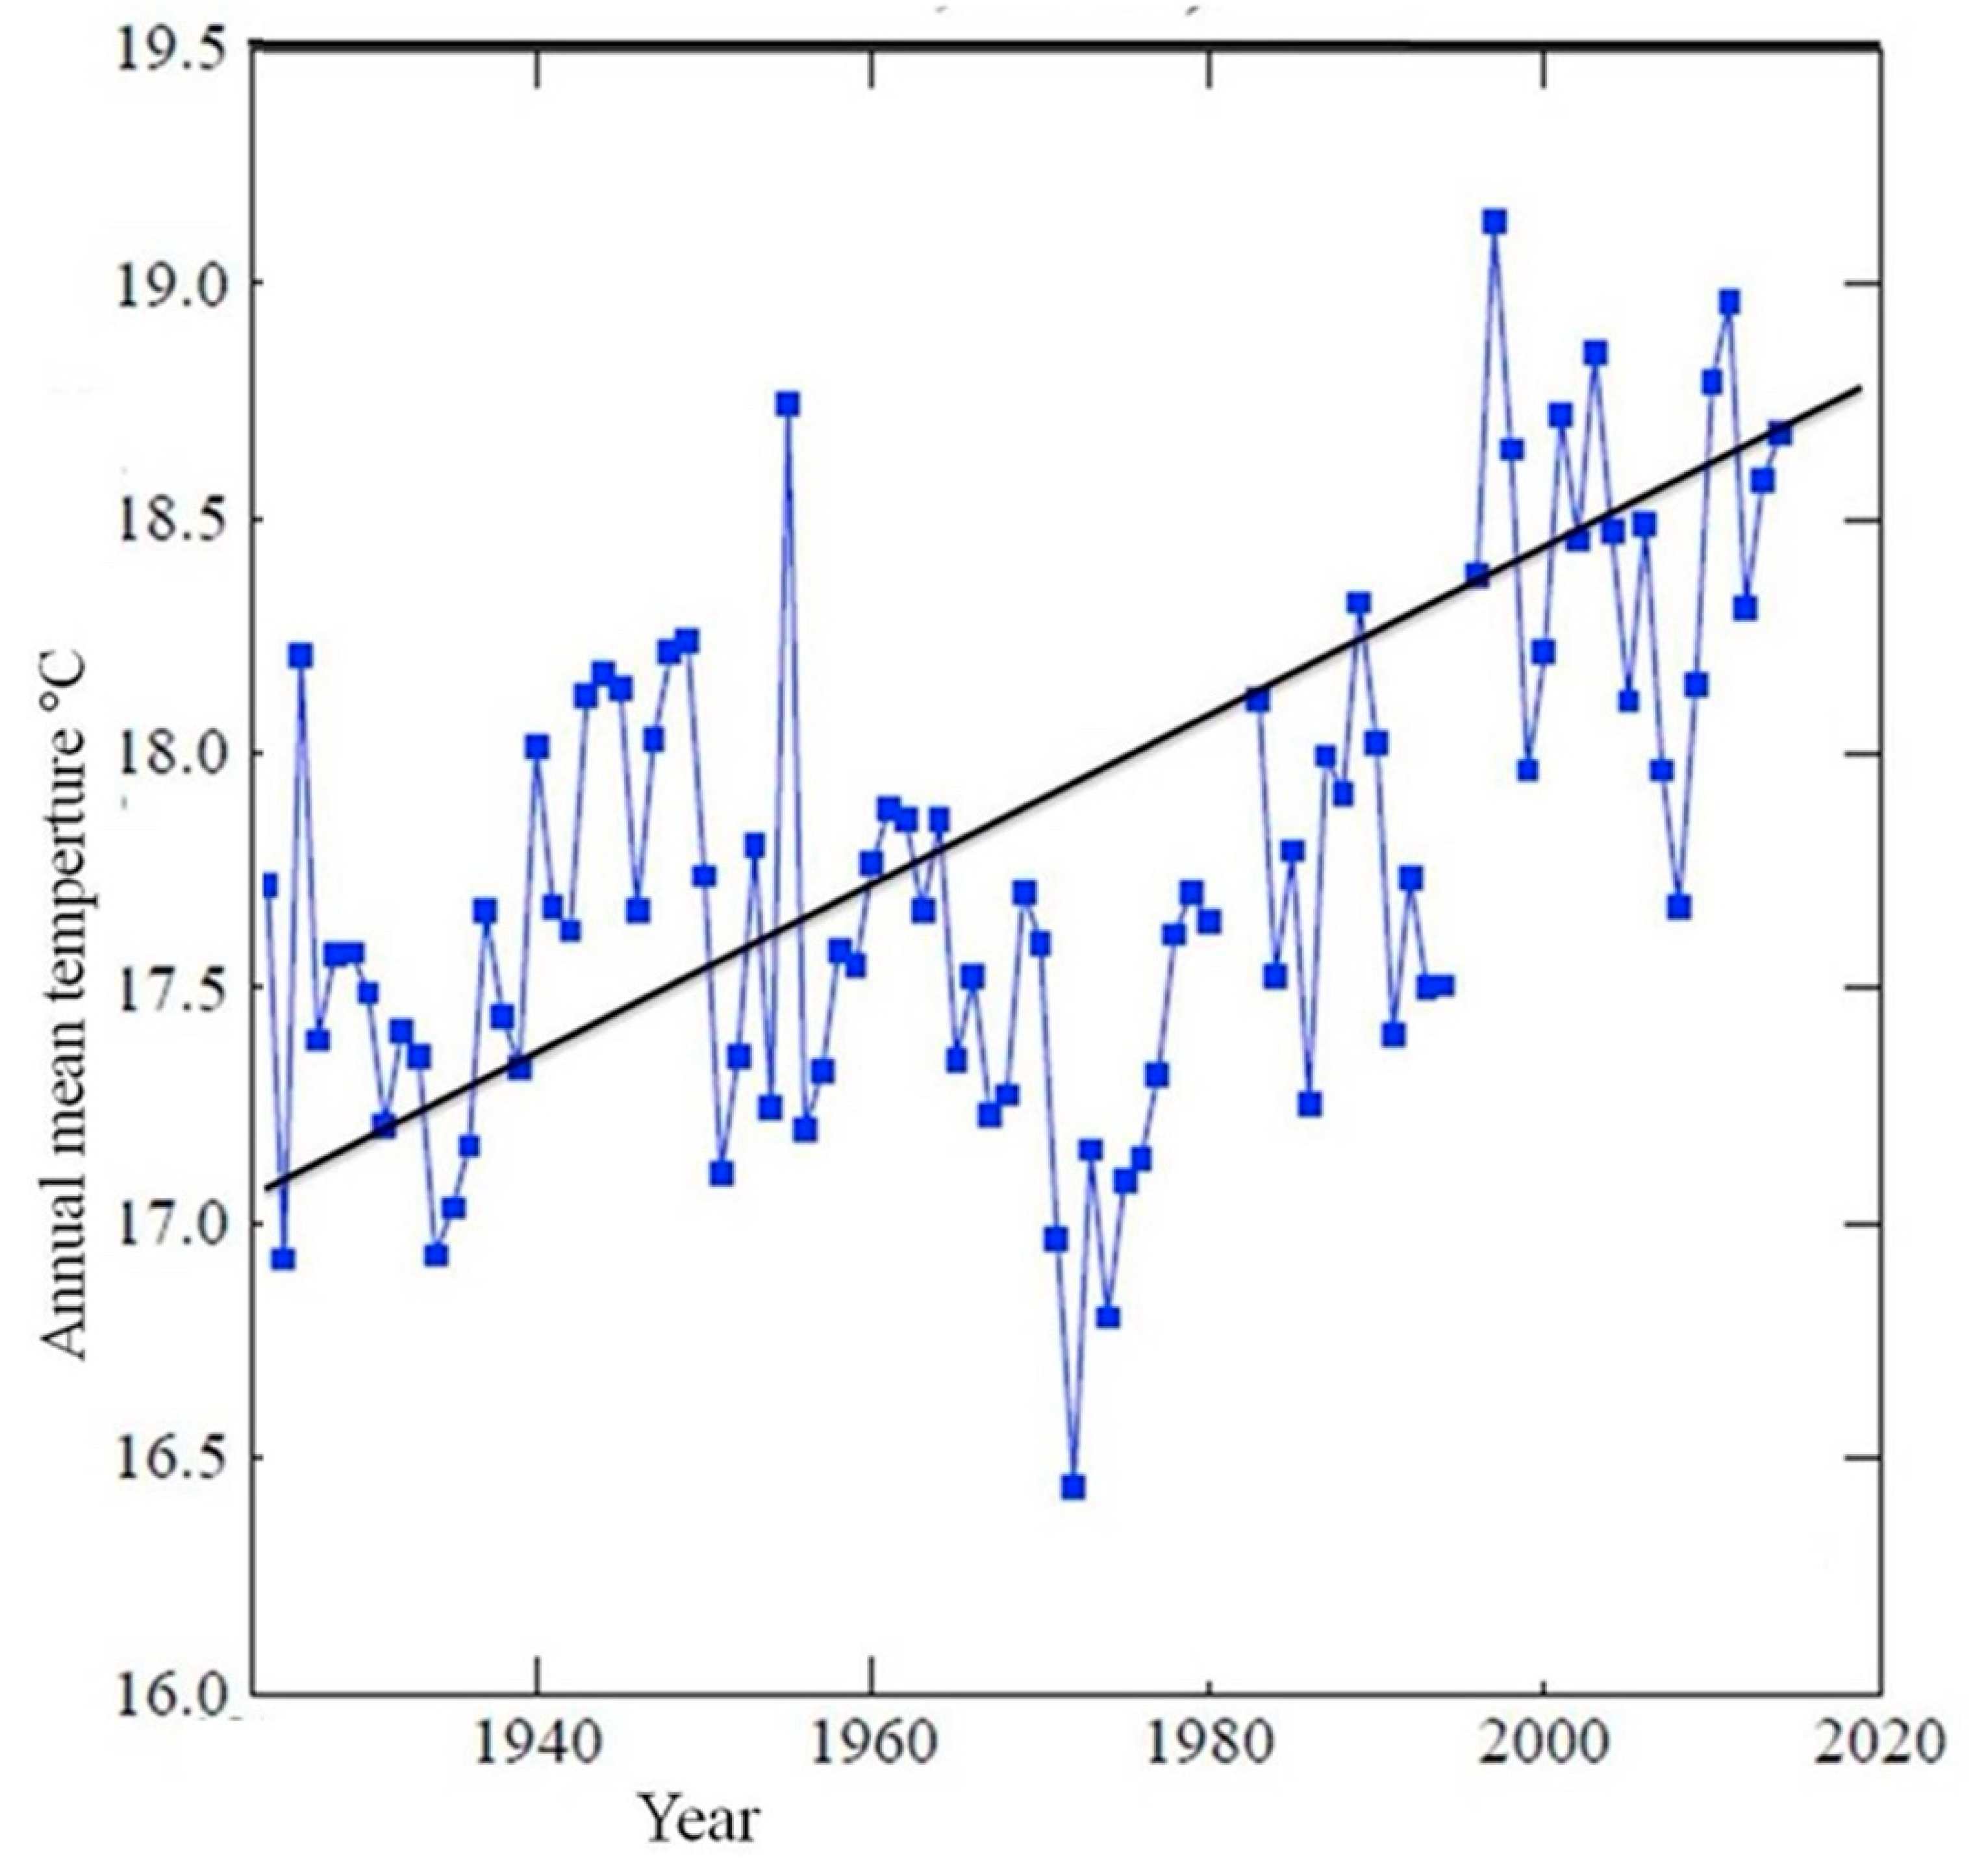
Figure 4.
Drainage lines of surface water extracted from ASTER GDEM; O: Atlantic Ocean, D: drainage lines (also known as Oued) extracted on ASTER DEM.
Figure 4.
Drainage lines of surface water extracted from ASTER GDEM; O: Atlantic Ocean, D: drainage lines (also known as Oued) extracted on ASTER DEM.
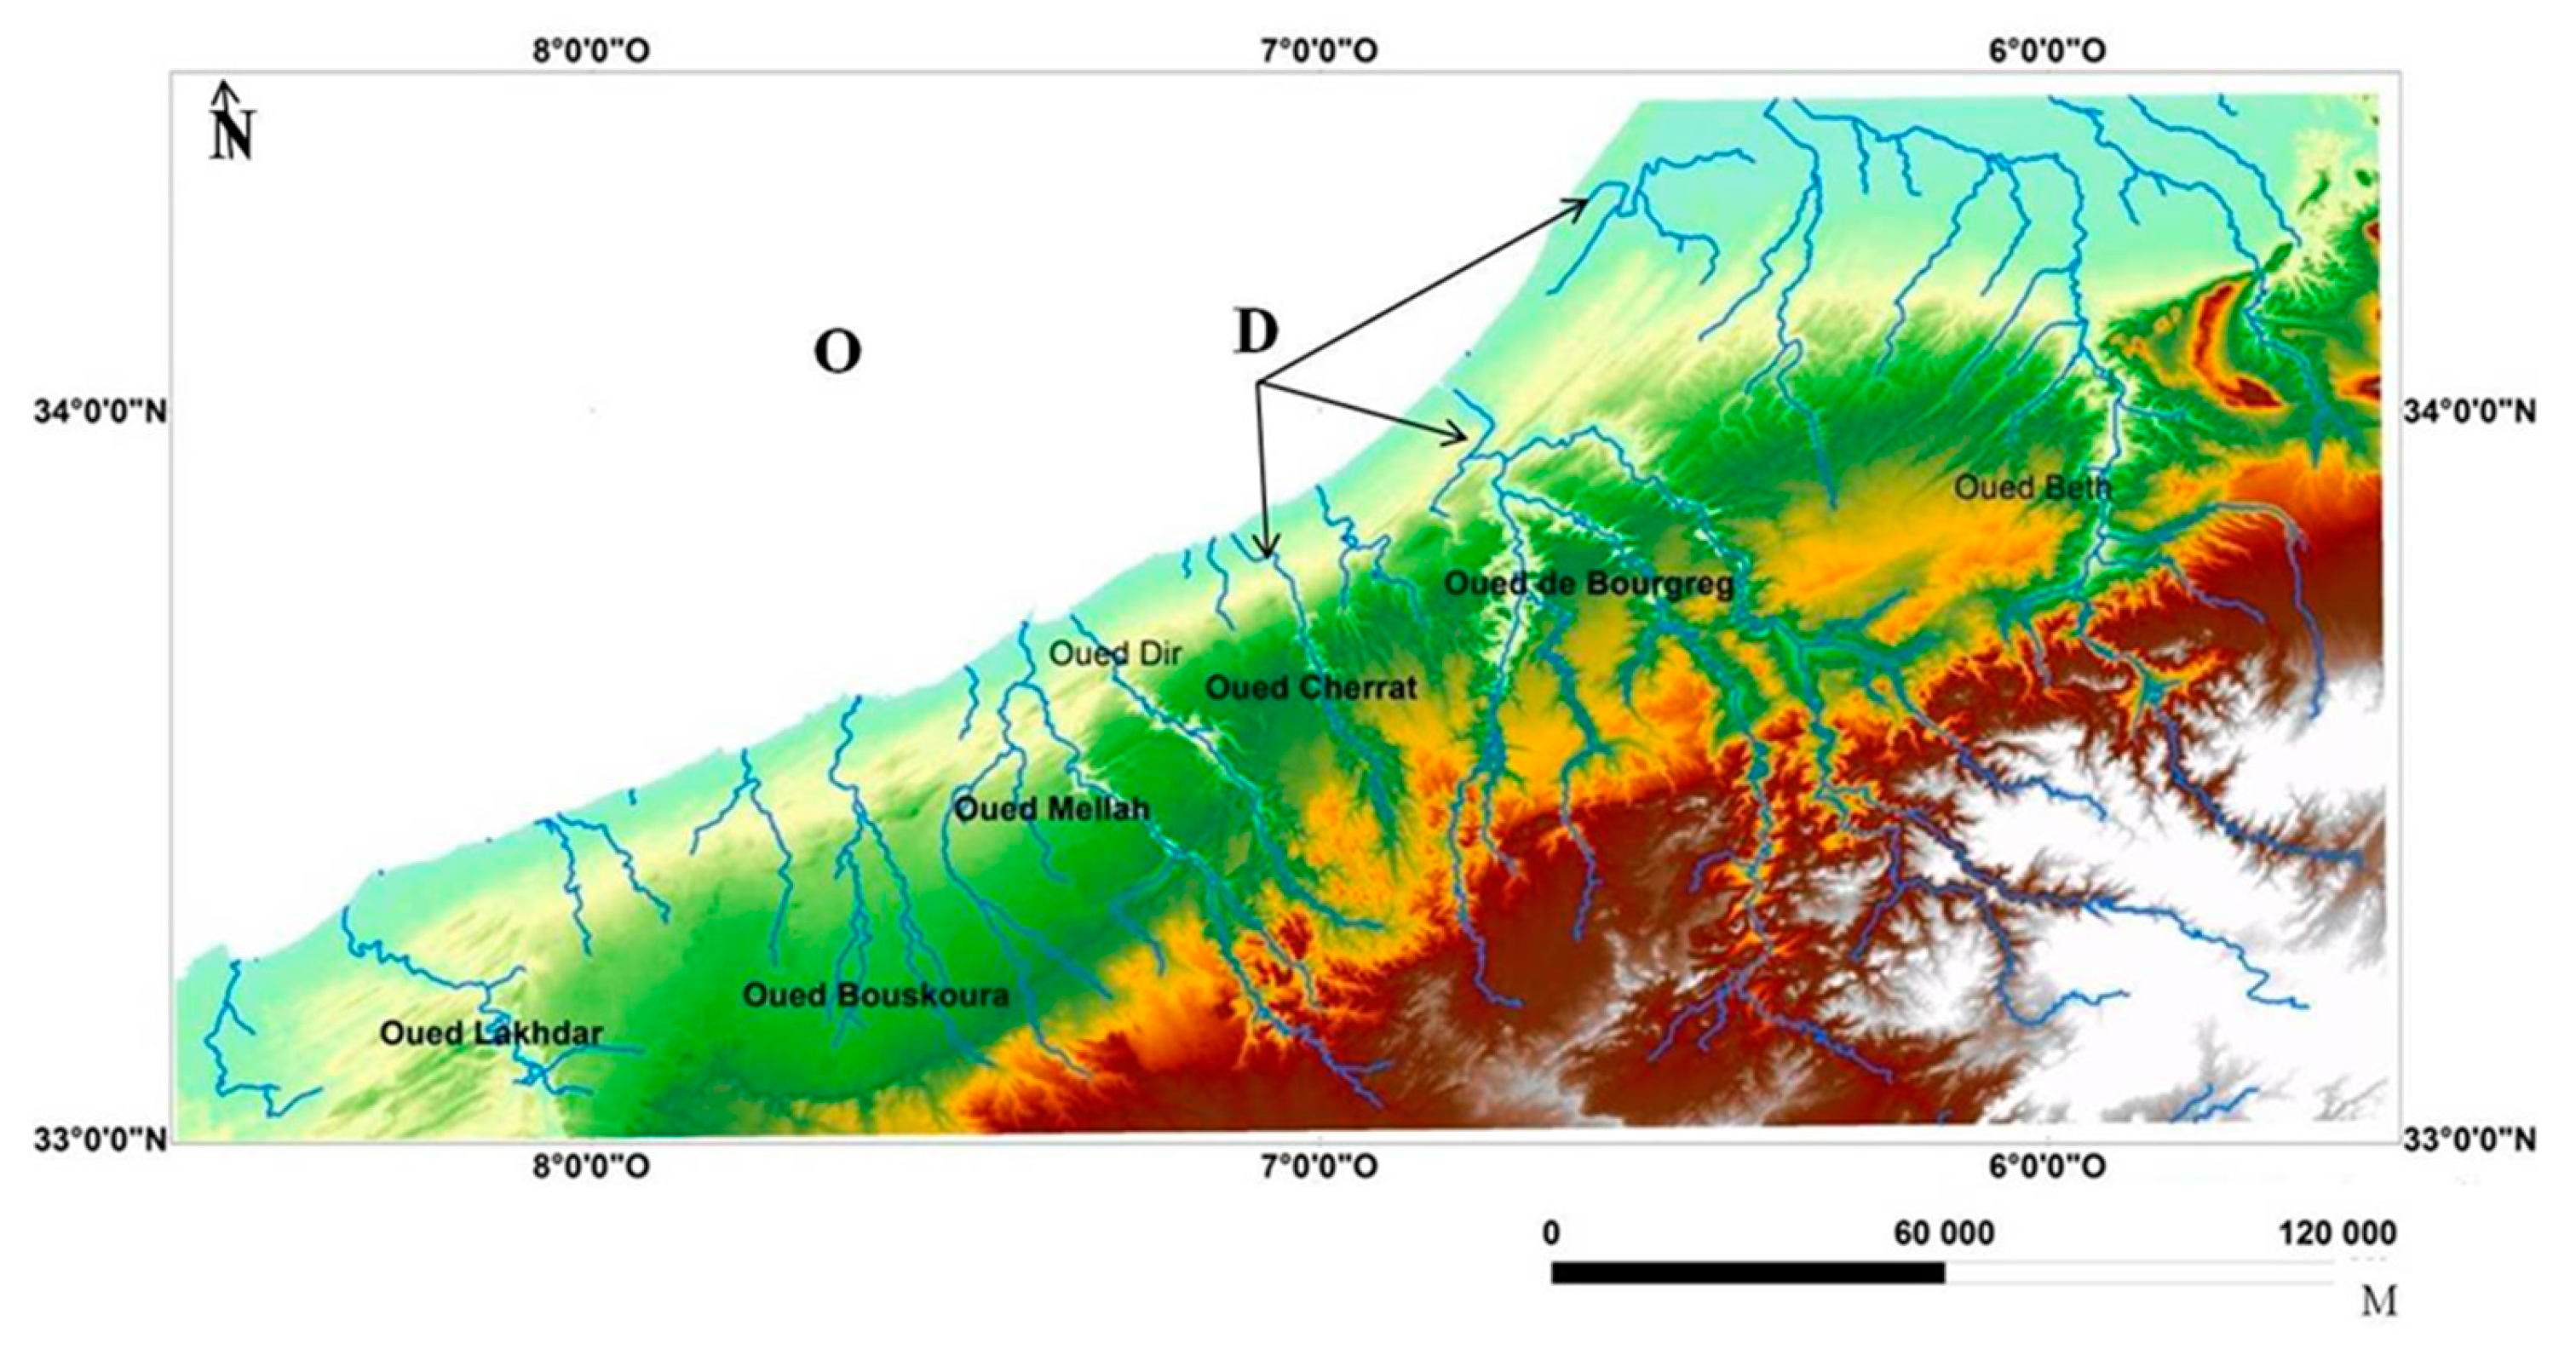
Figure 5.
Methodology workflow adopted in the current study.
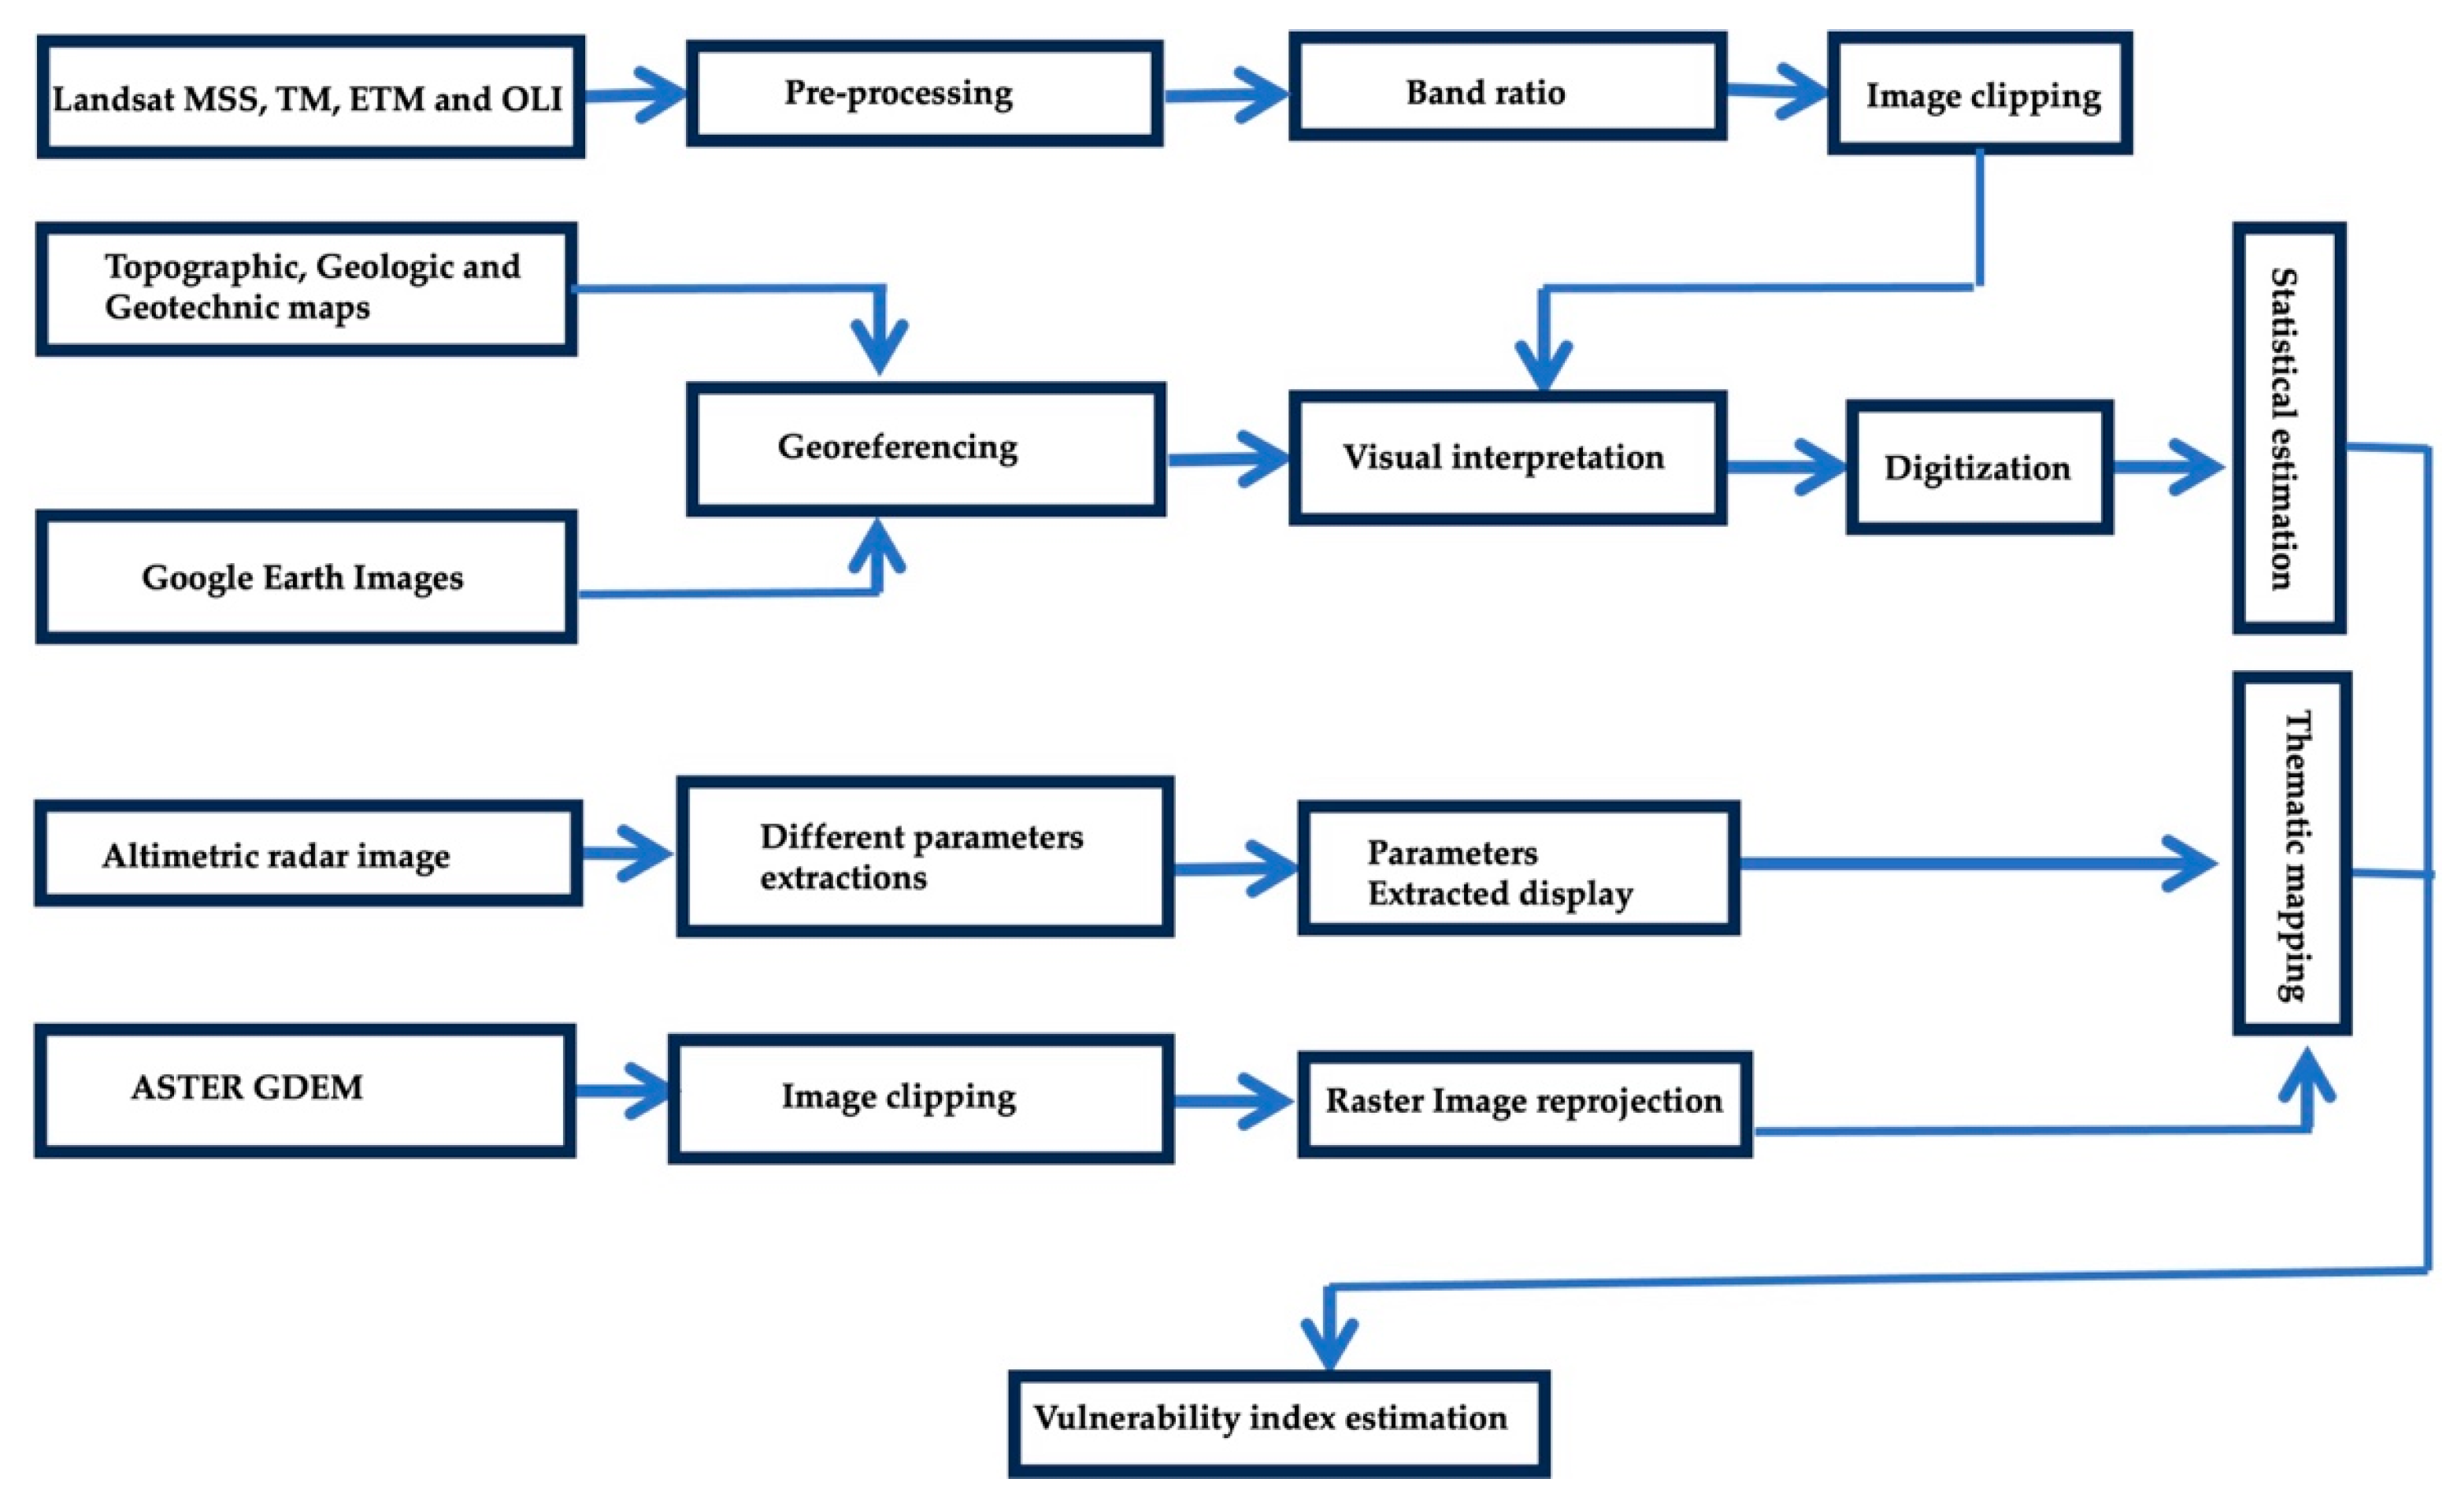
Figure 6.
(a) Average spectral signature for objects extracted on Landsat 8 image as indicated by profiles B: built-up areas, S: sand, V: vegetation, W: water; (b) DSAS extension representing the analysis shoreline position on the coast of Casablanca. The extension considers several shorelines on which the measurements are conducted on each transect.
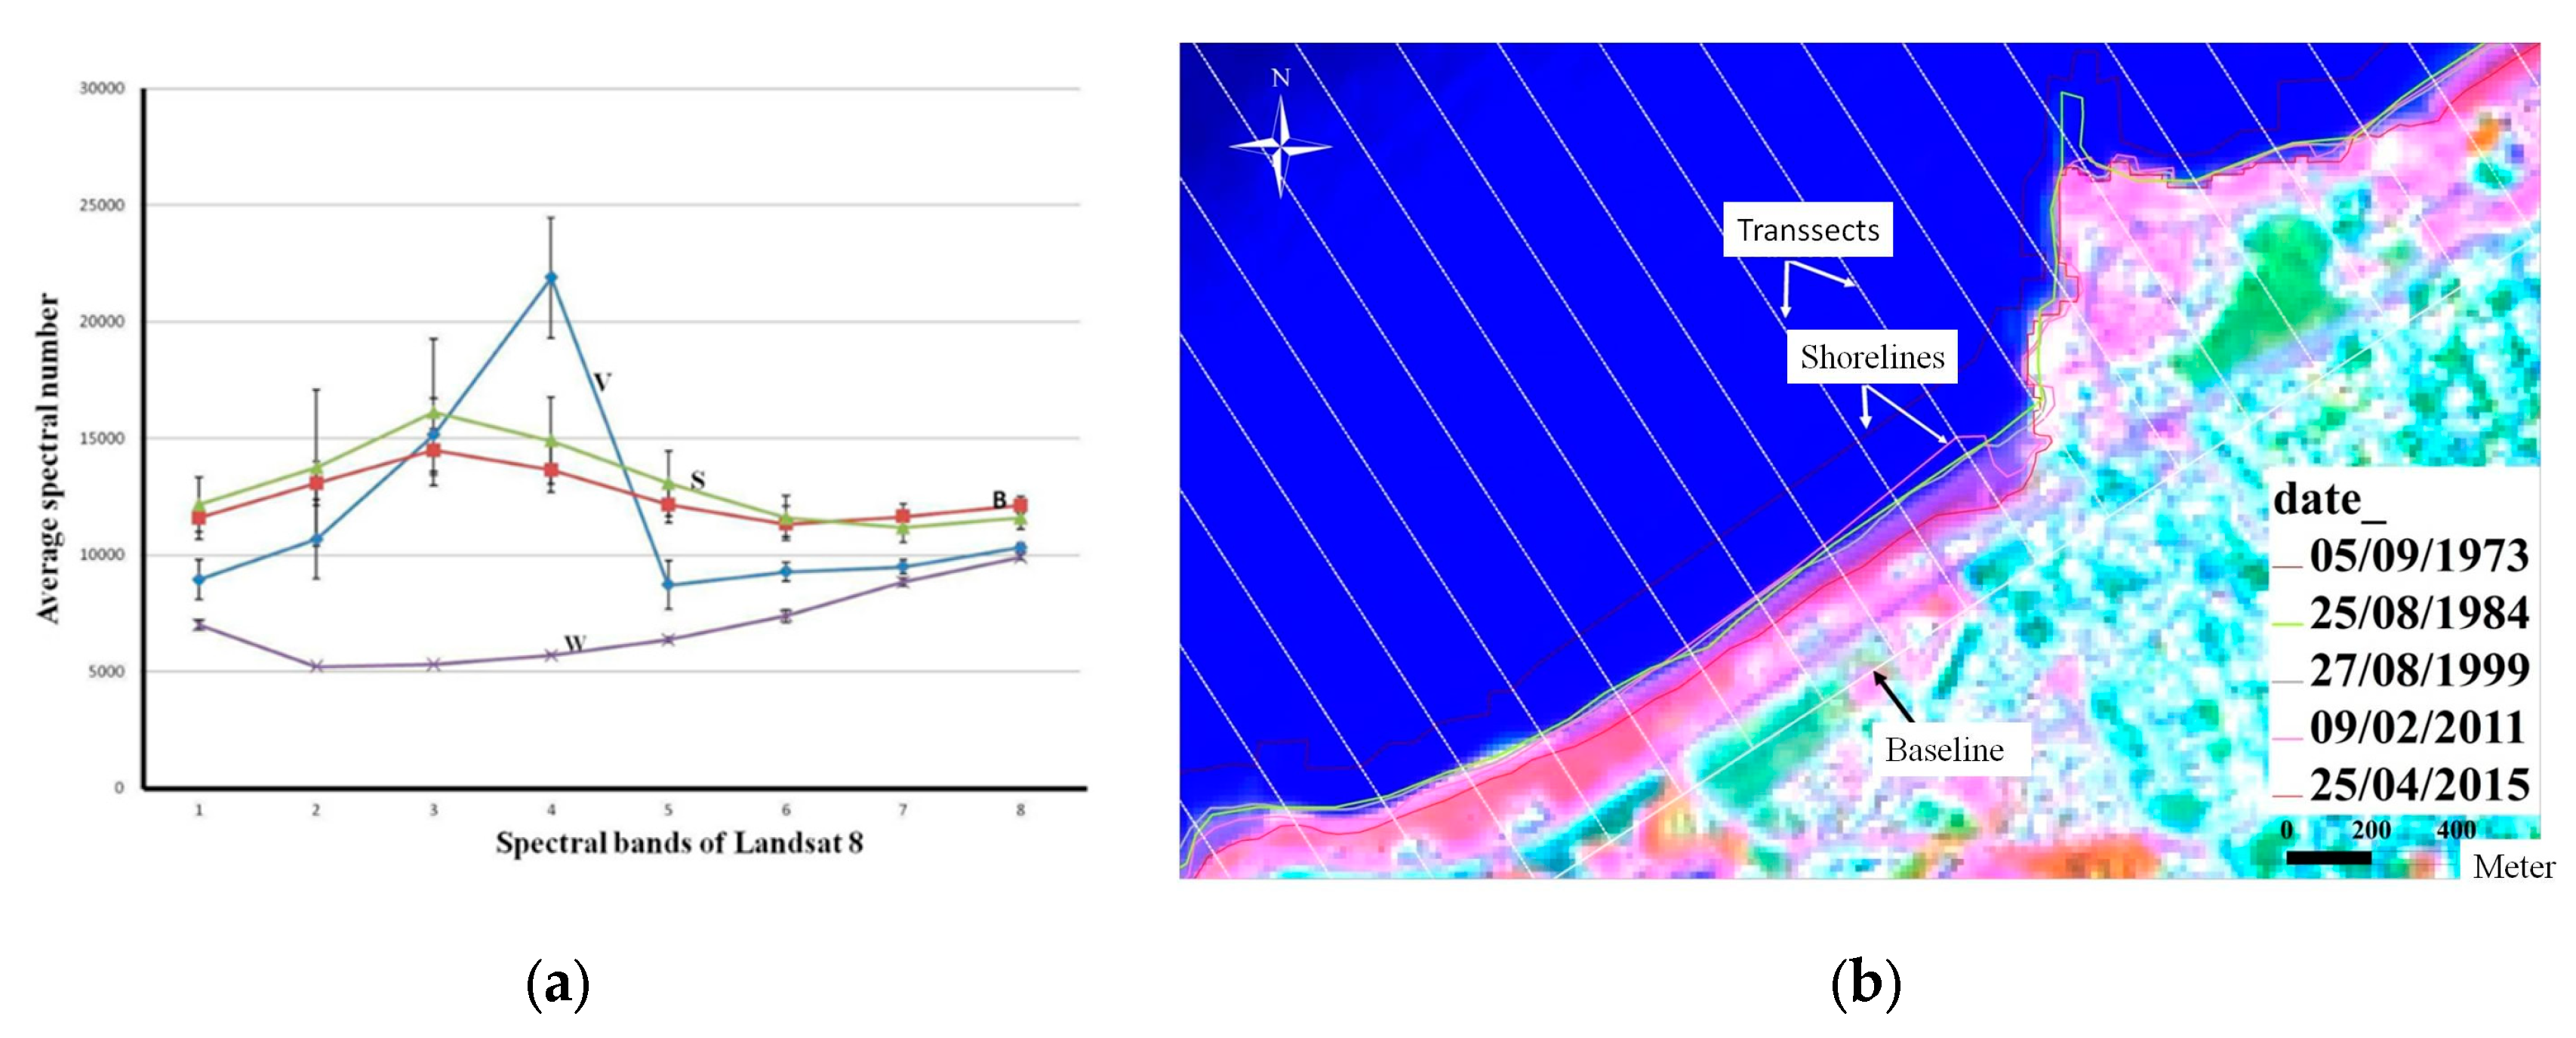
Figure 7.
Geologic map of Casablanca (modified from geologic map of 1946).
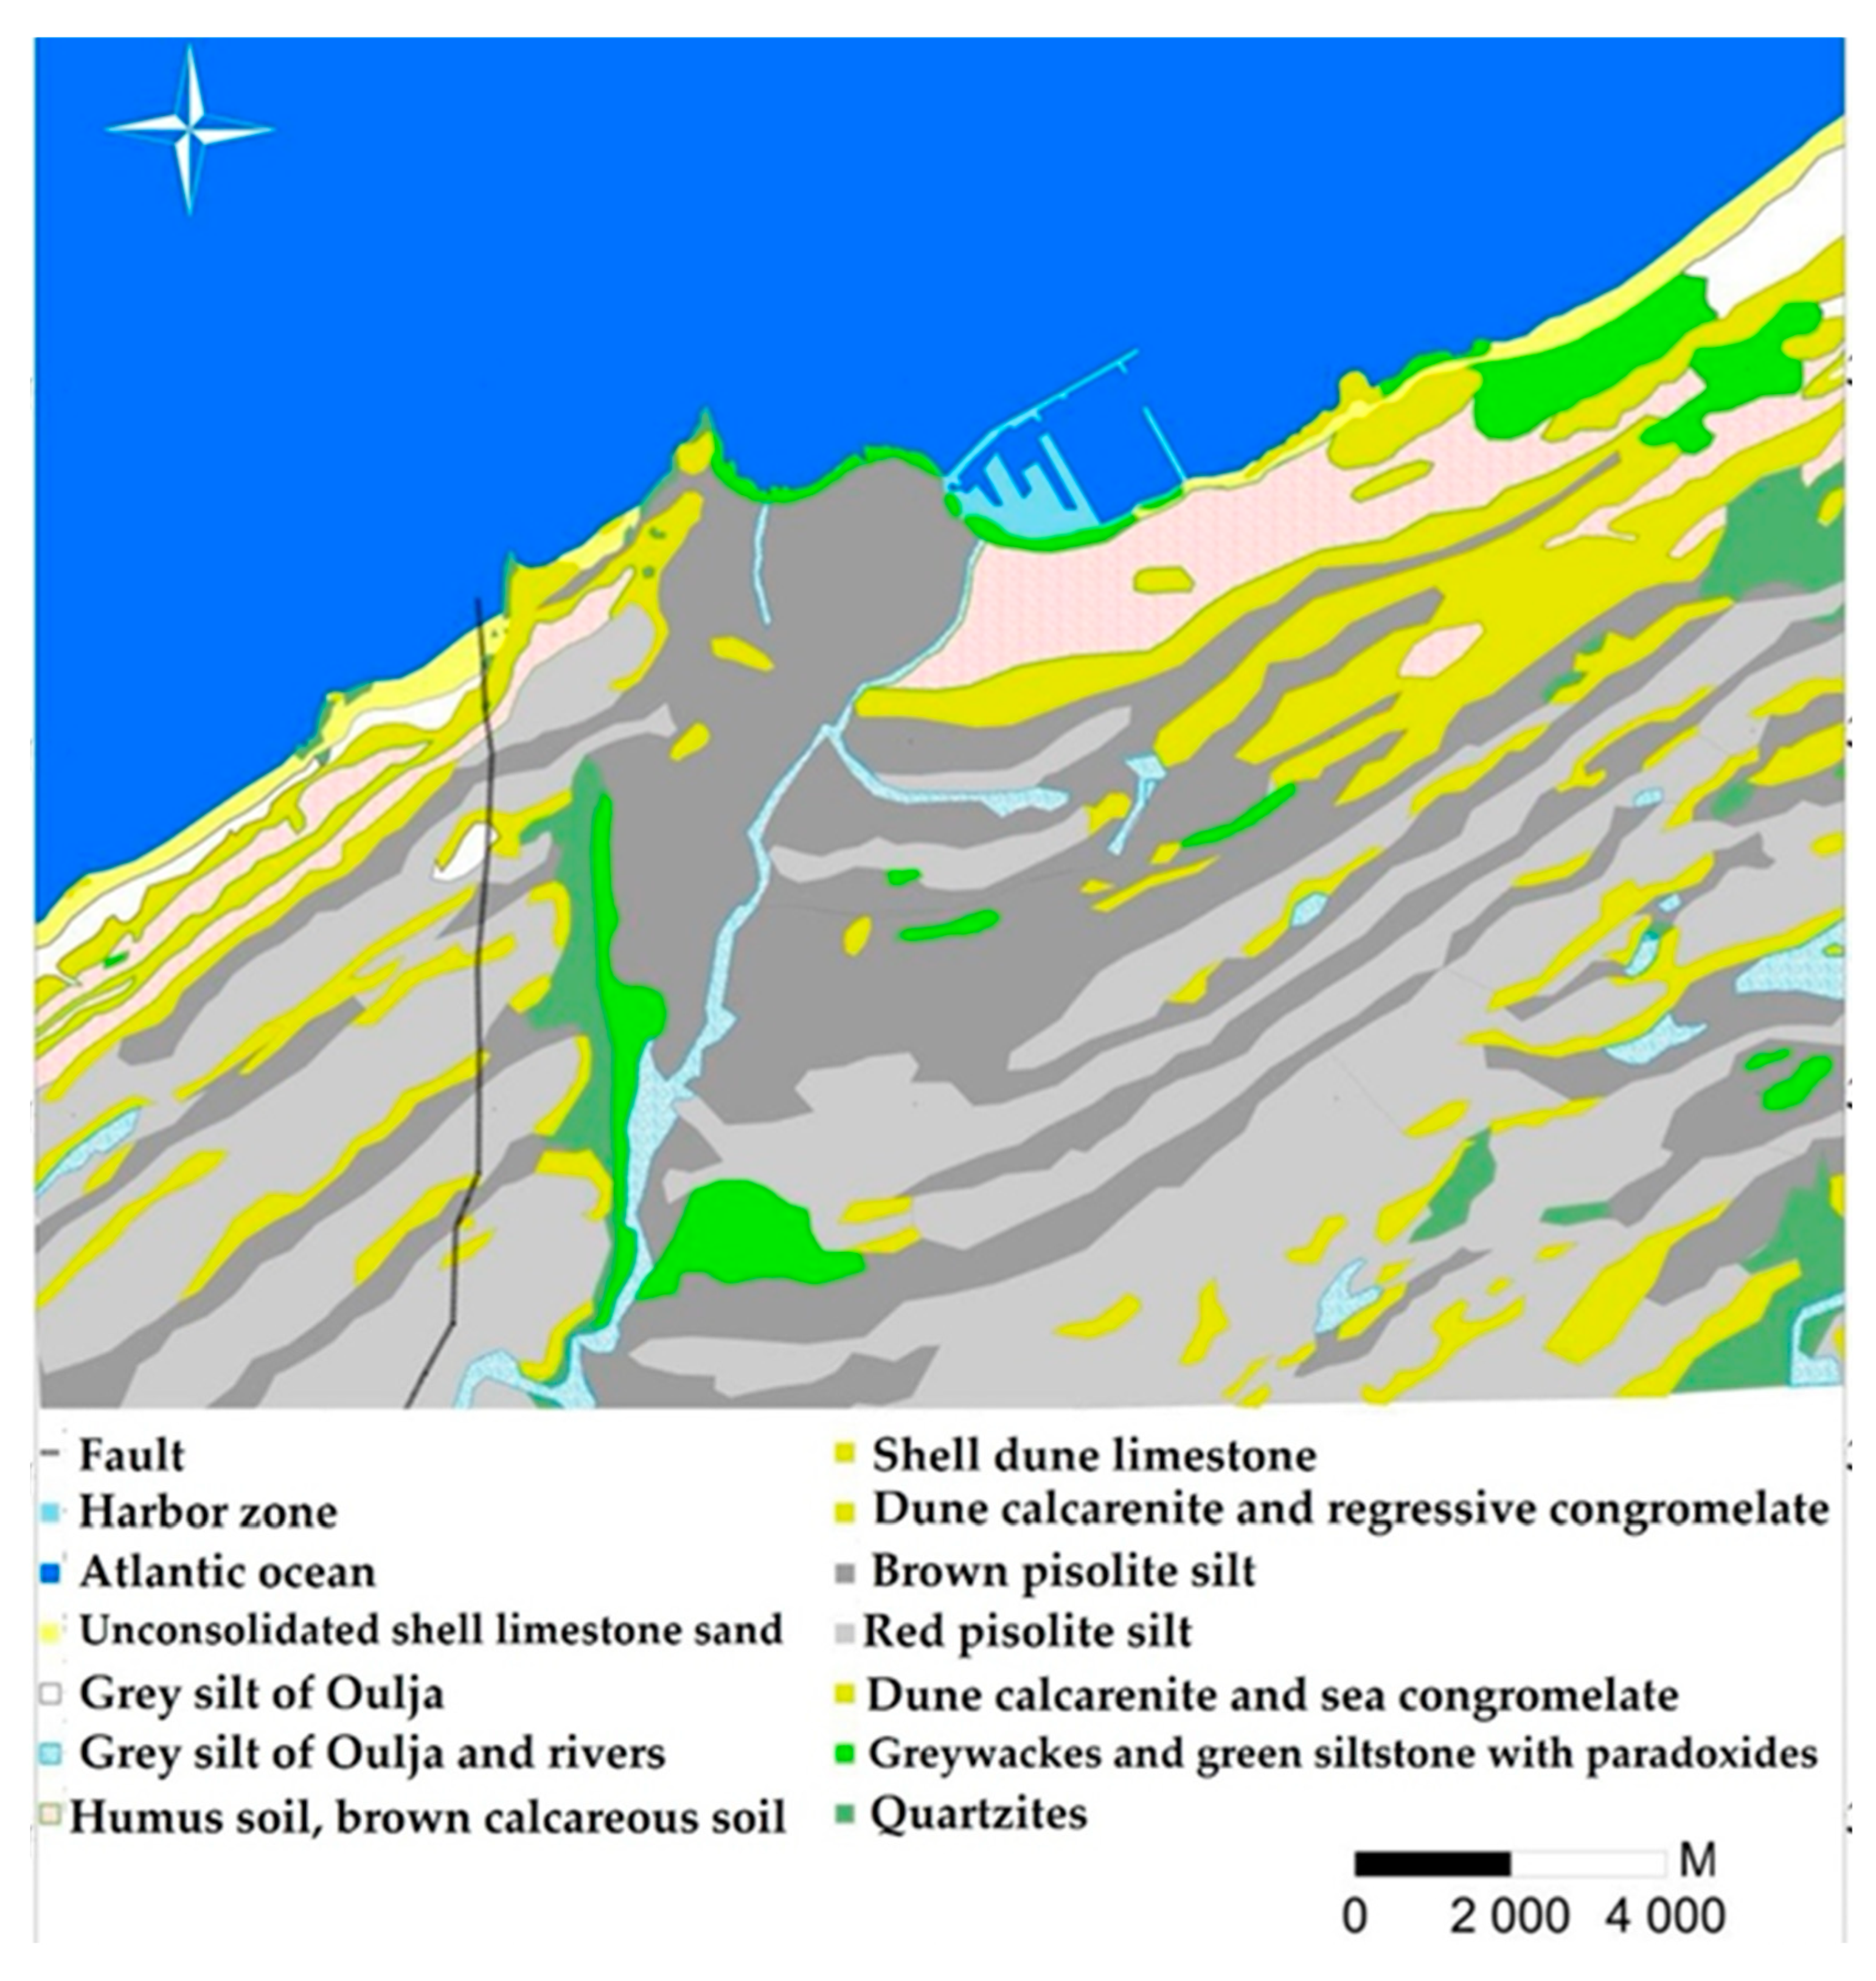
Figure 8.
Coastal slope on the coast of Casablanca.
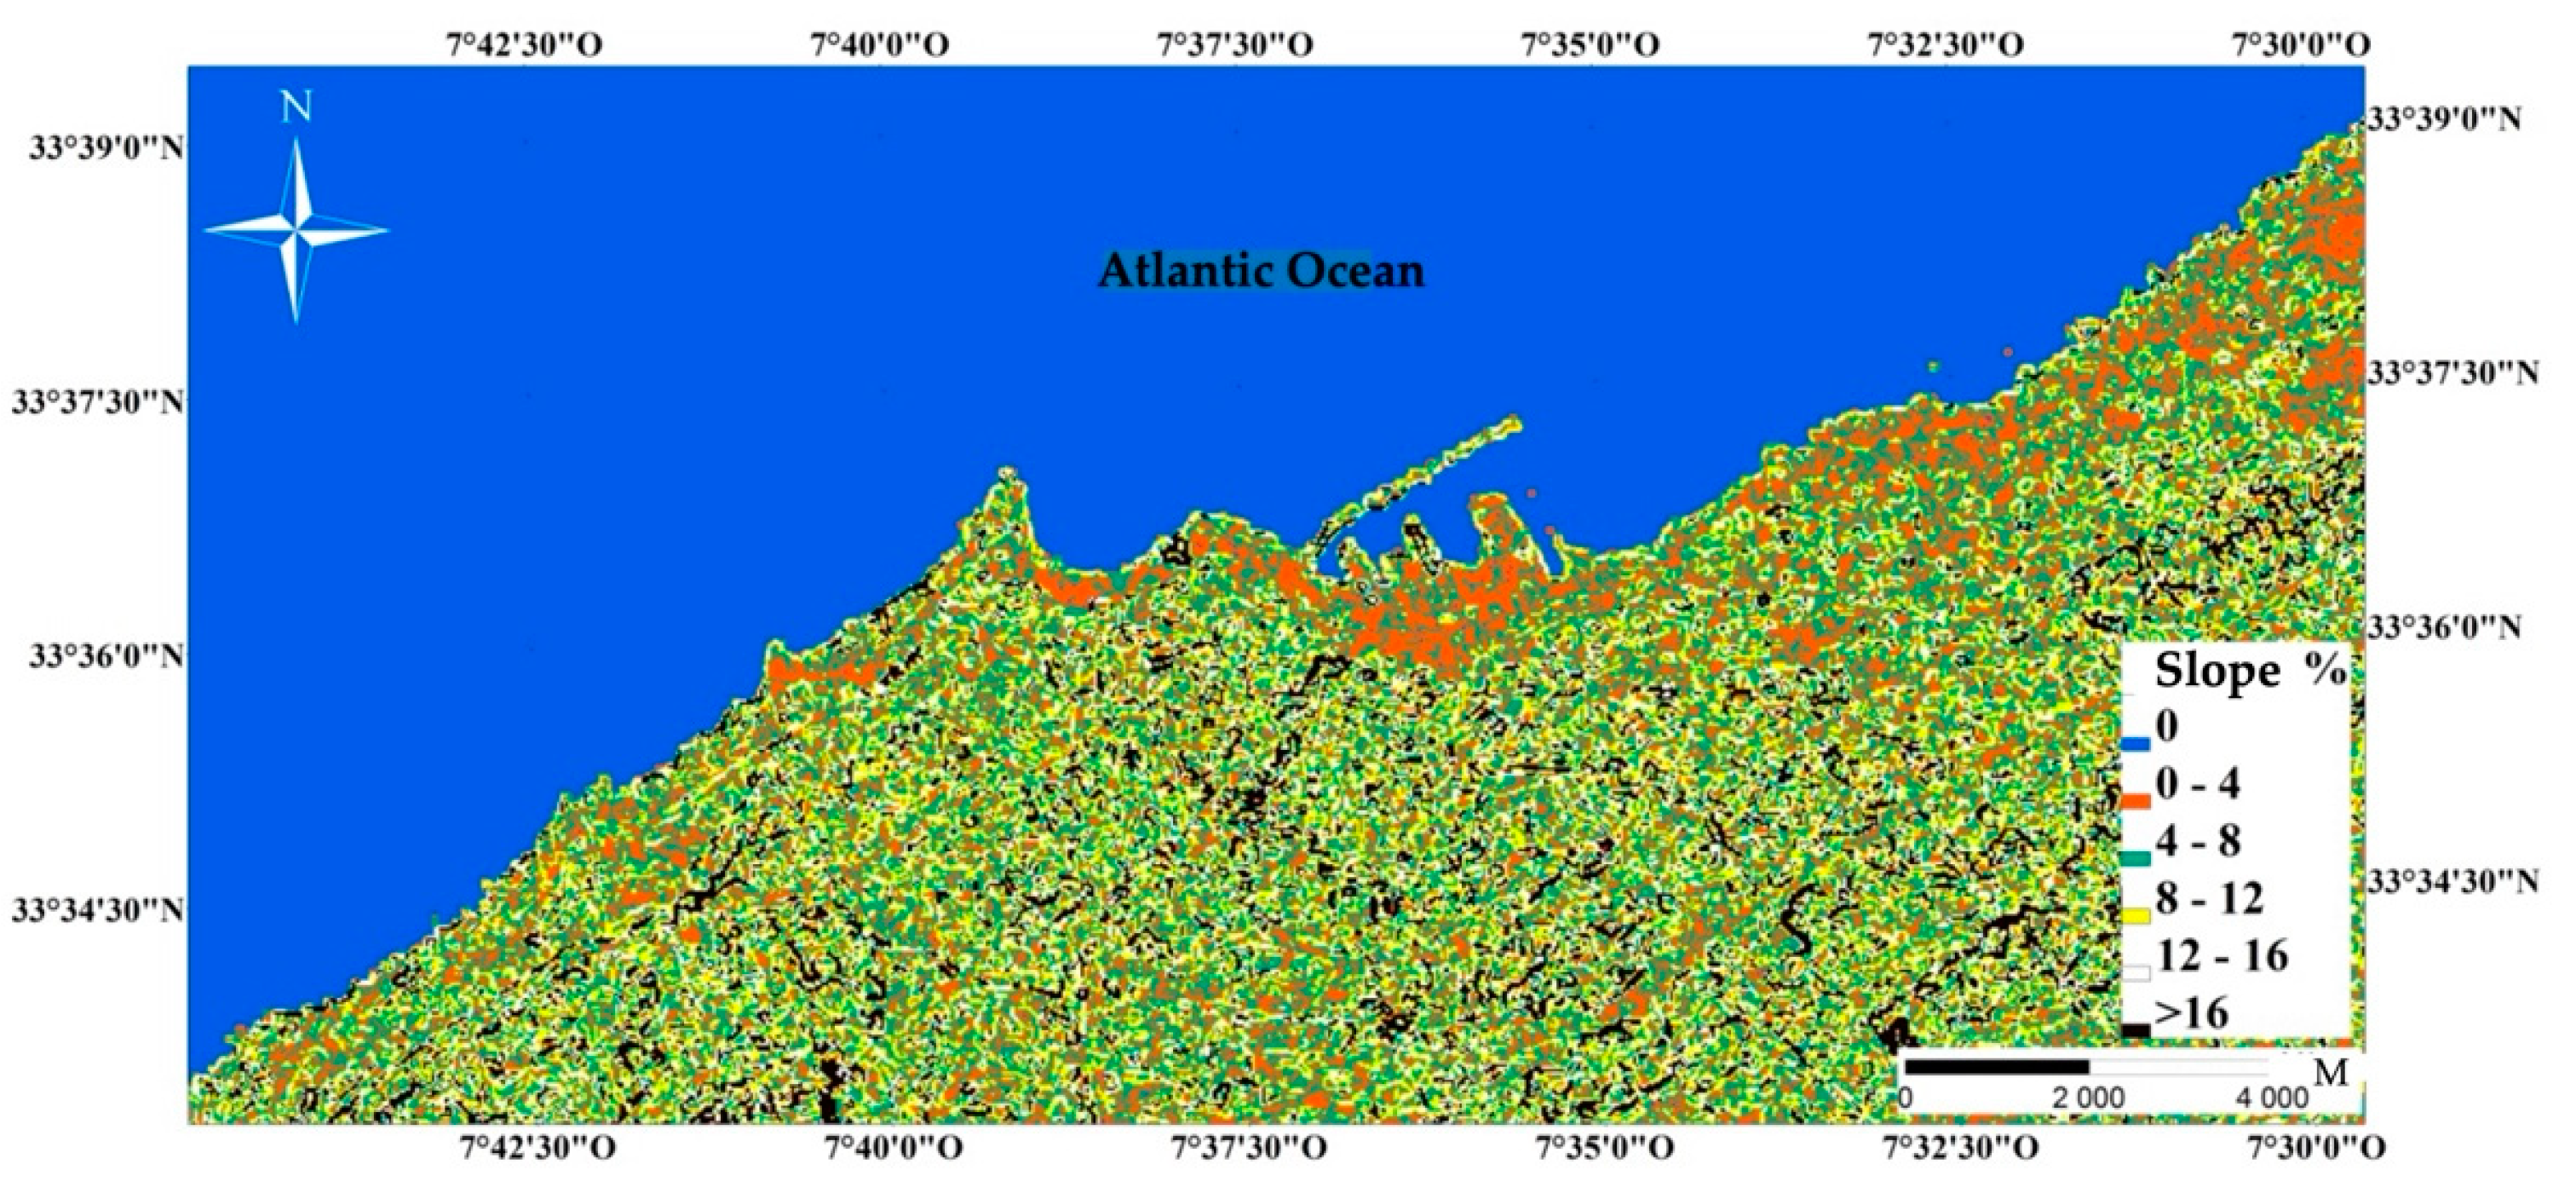
Figure 9.
Relative sea level (mm/year) between 15 January 1993 and 15 December 2014 recorded on the coast of Casablanca.
Figure 9.
Relative sea level (mm/year) between 15 January 1993 and 15 December 2014 recorded on the coast of Casablanca.
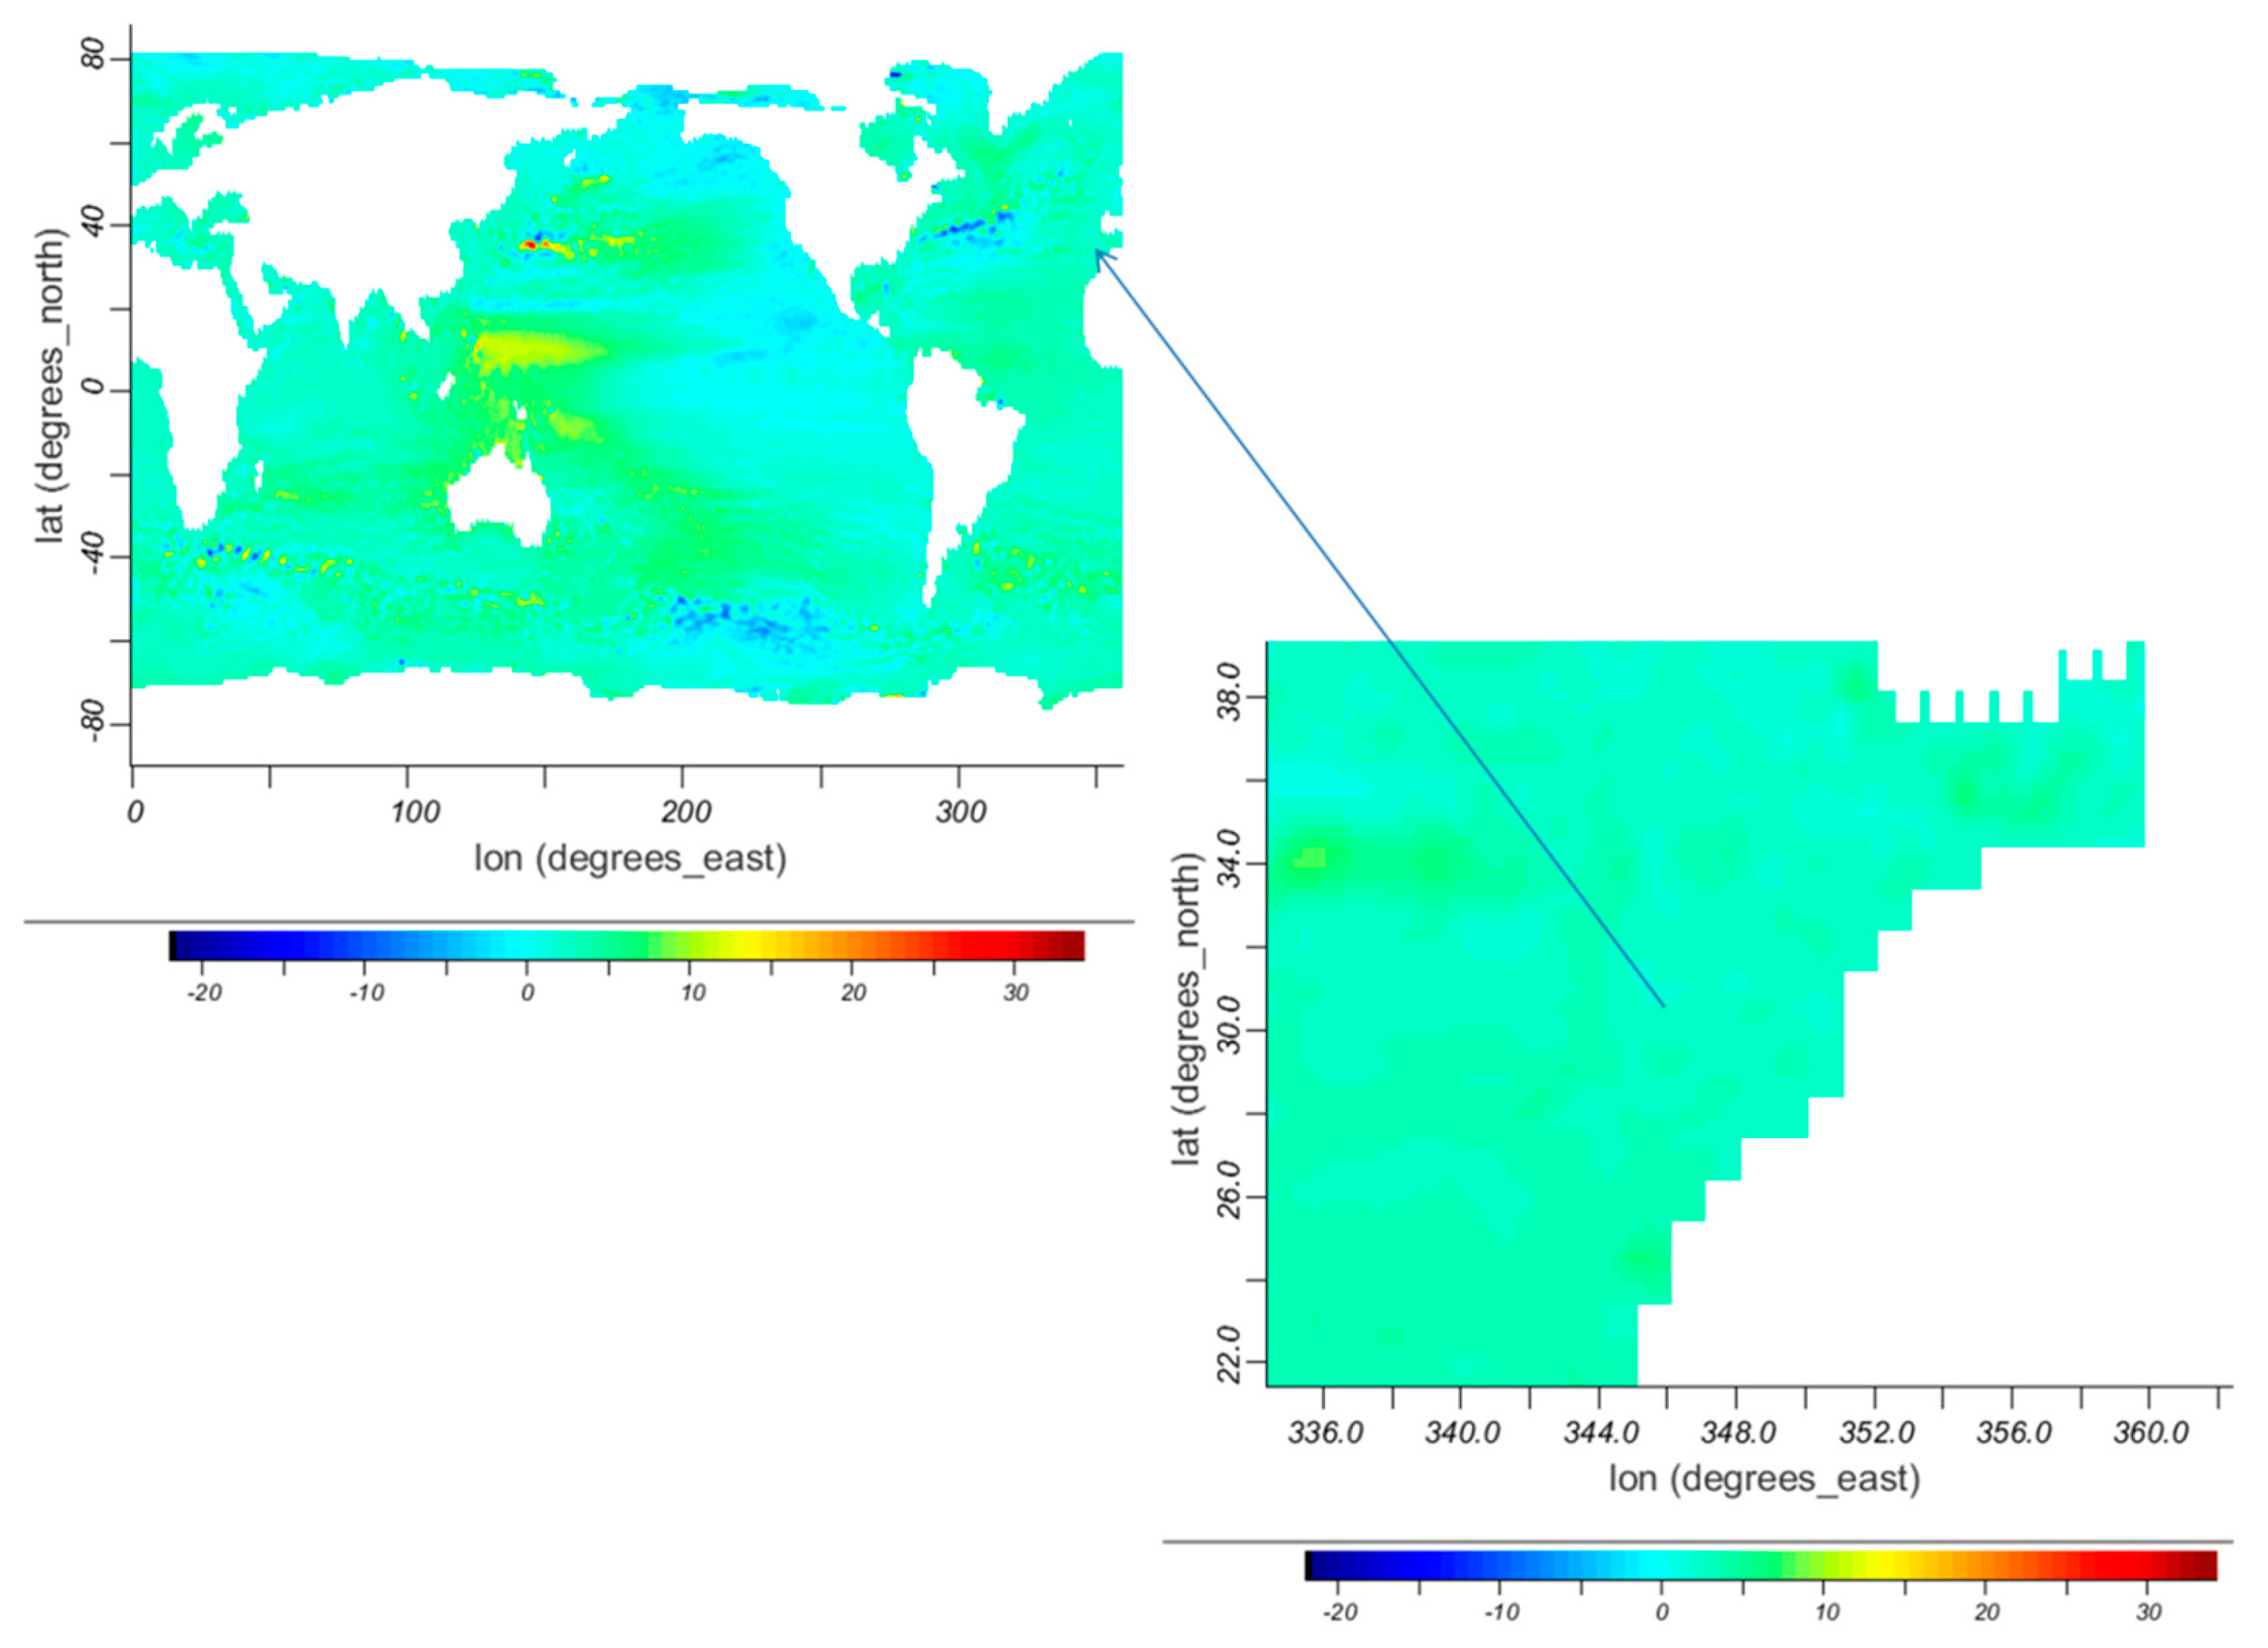
Figure 10.
Linearity of the coastline on the coast of Casablanca over the period 1973-2015 superimposed on the Google Earth image 2015.
Figure 10.
Linearity of the coastline on the coast of Casablanca over the period 1973-2015 superimposed on the Google Earth image 2015.
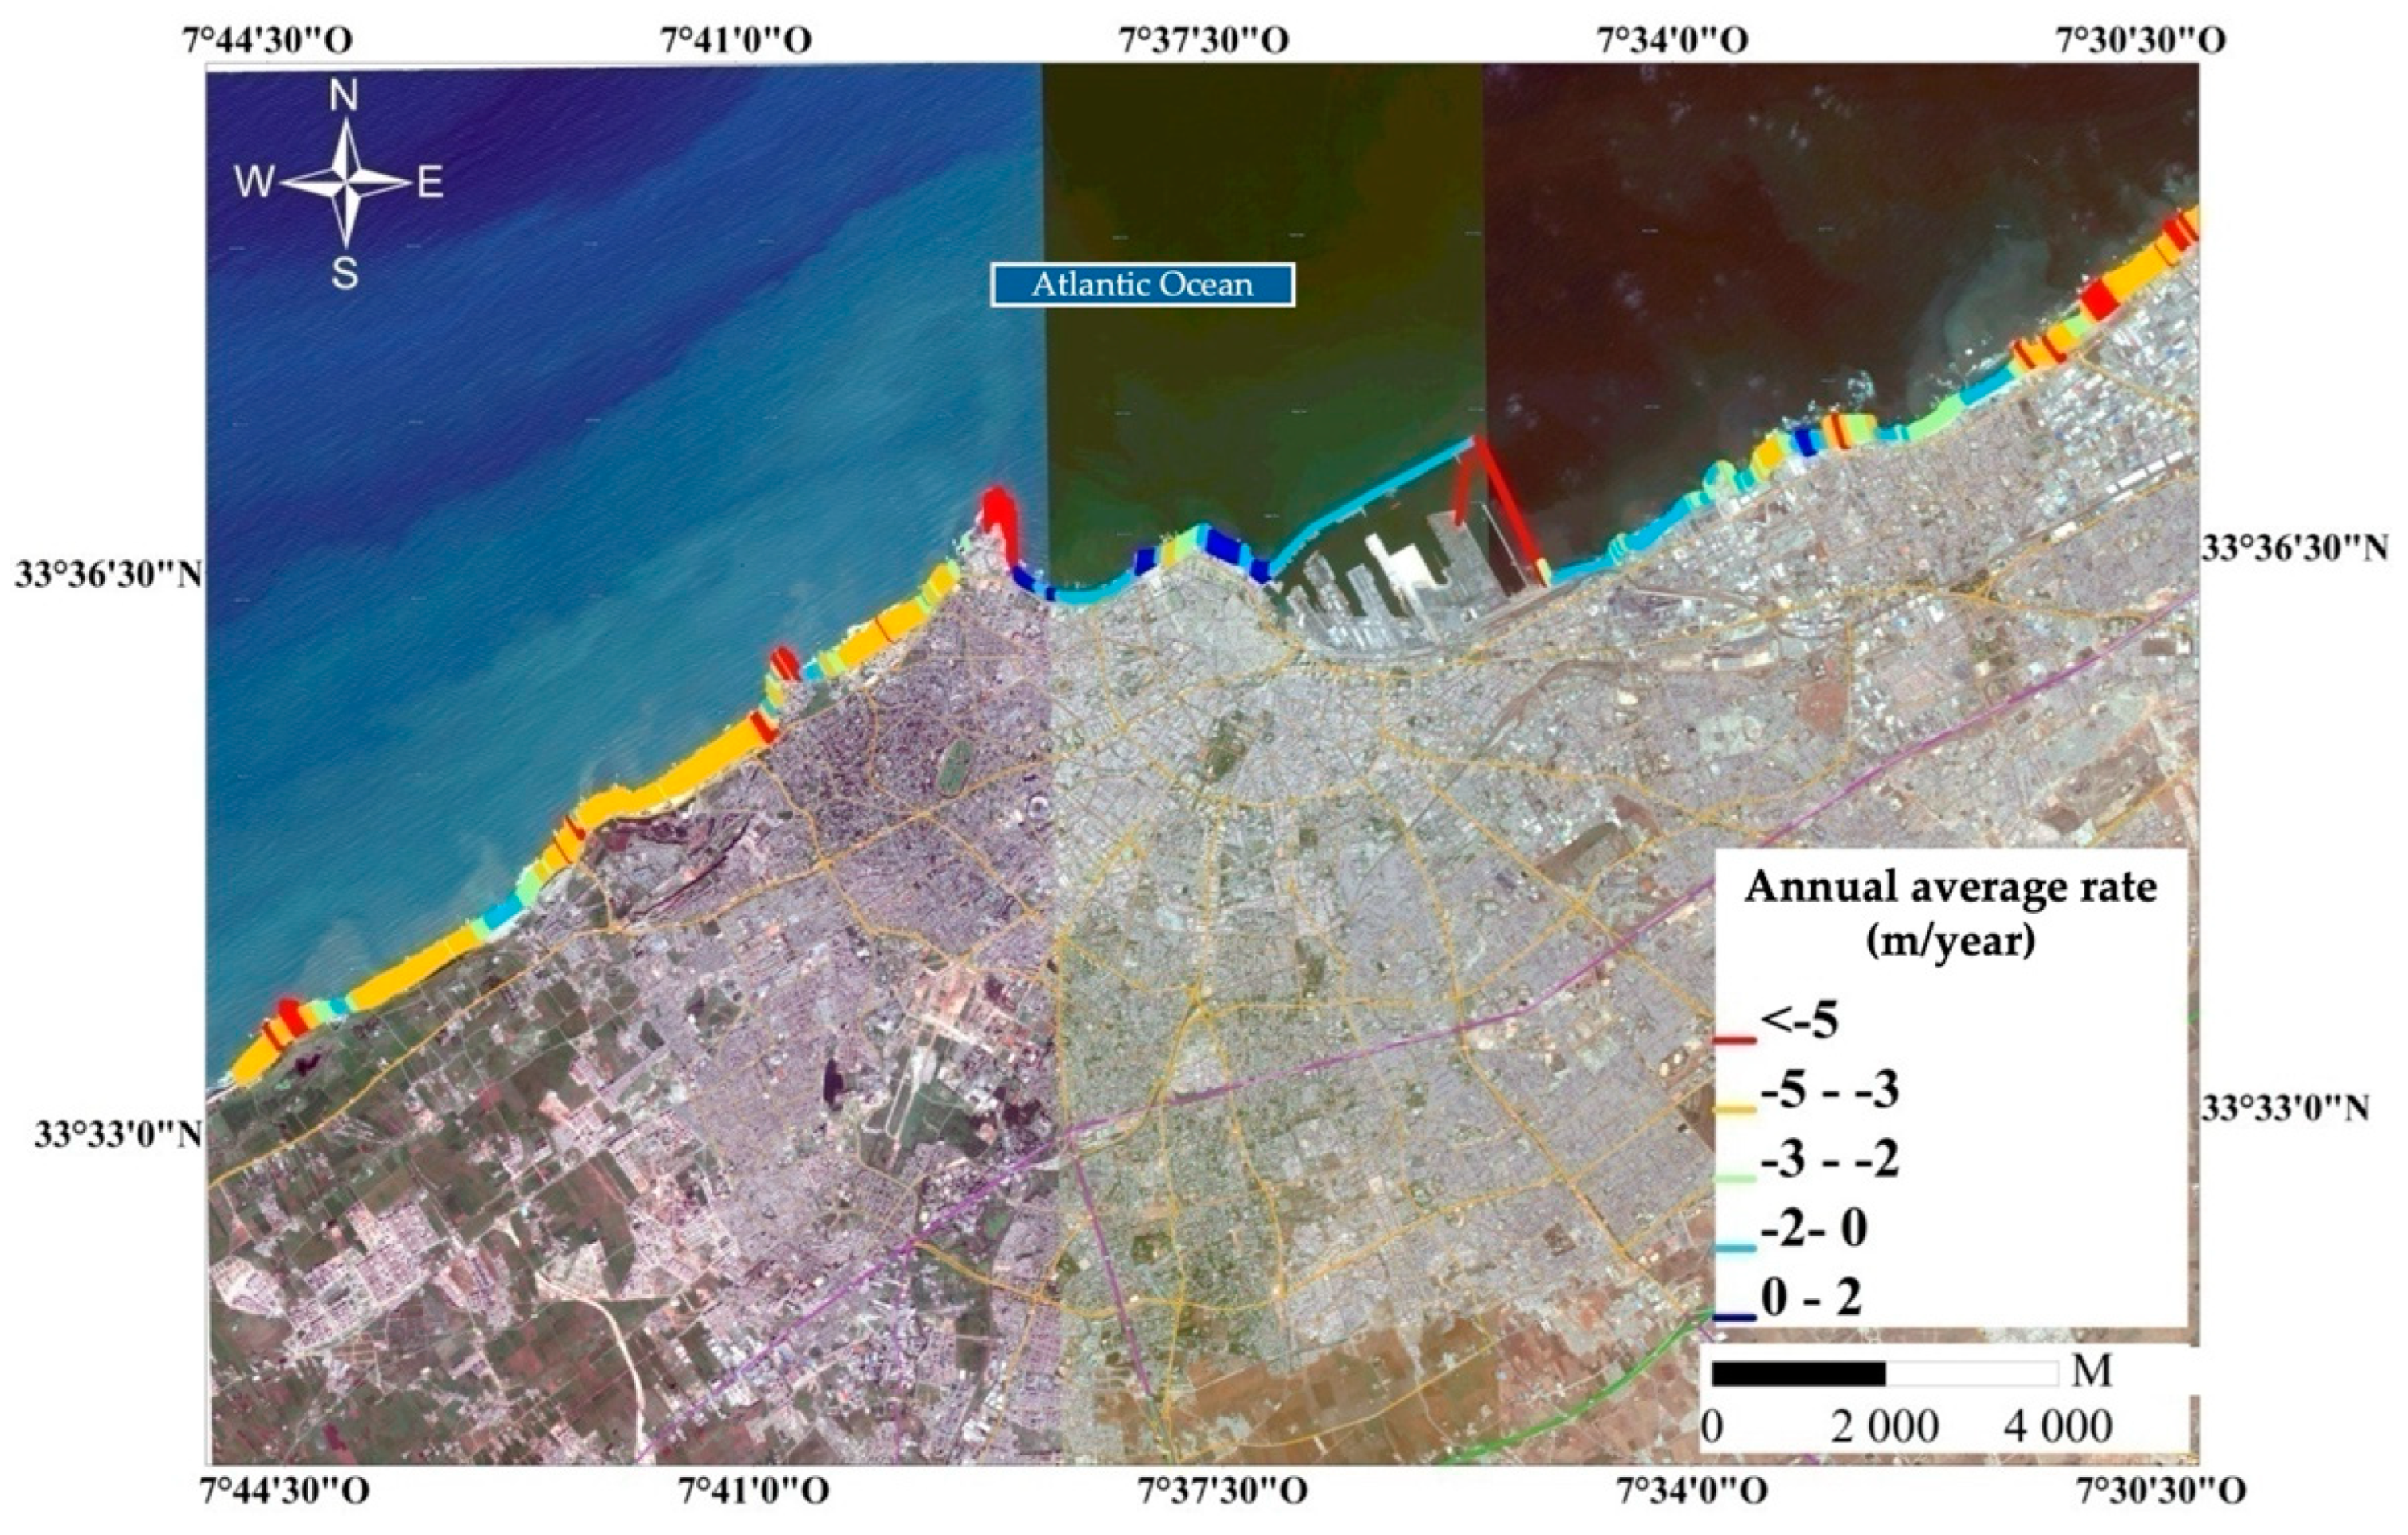
Figure 11.
Digital Elevation Model indicating the variation of elevation on different areas of the coastline of Casablanca.
Figure 11.
Digital Elevation Model indicating the variation of elevation on different areas of the coastline of Casablanca.
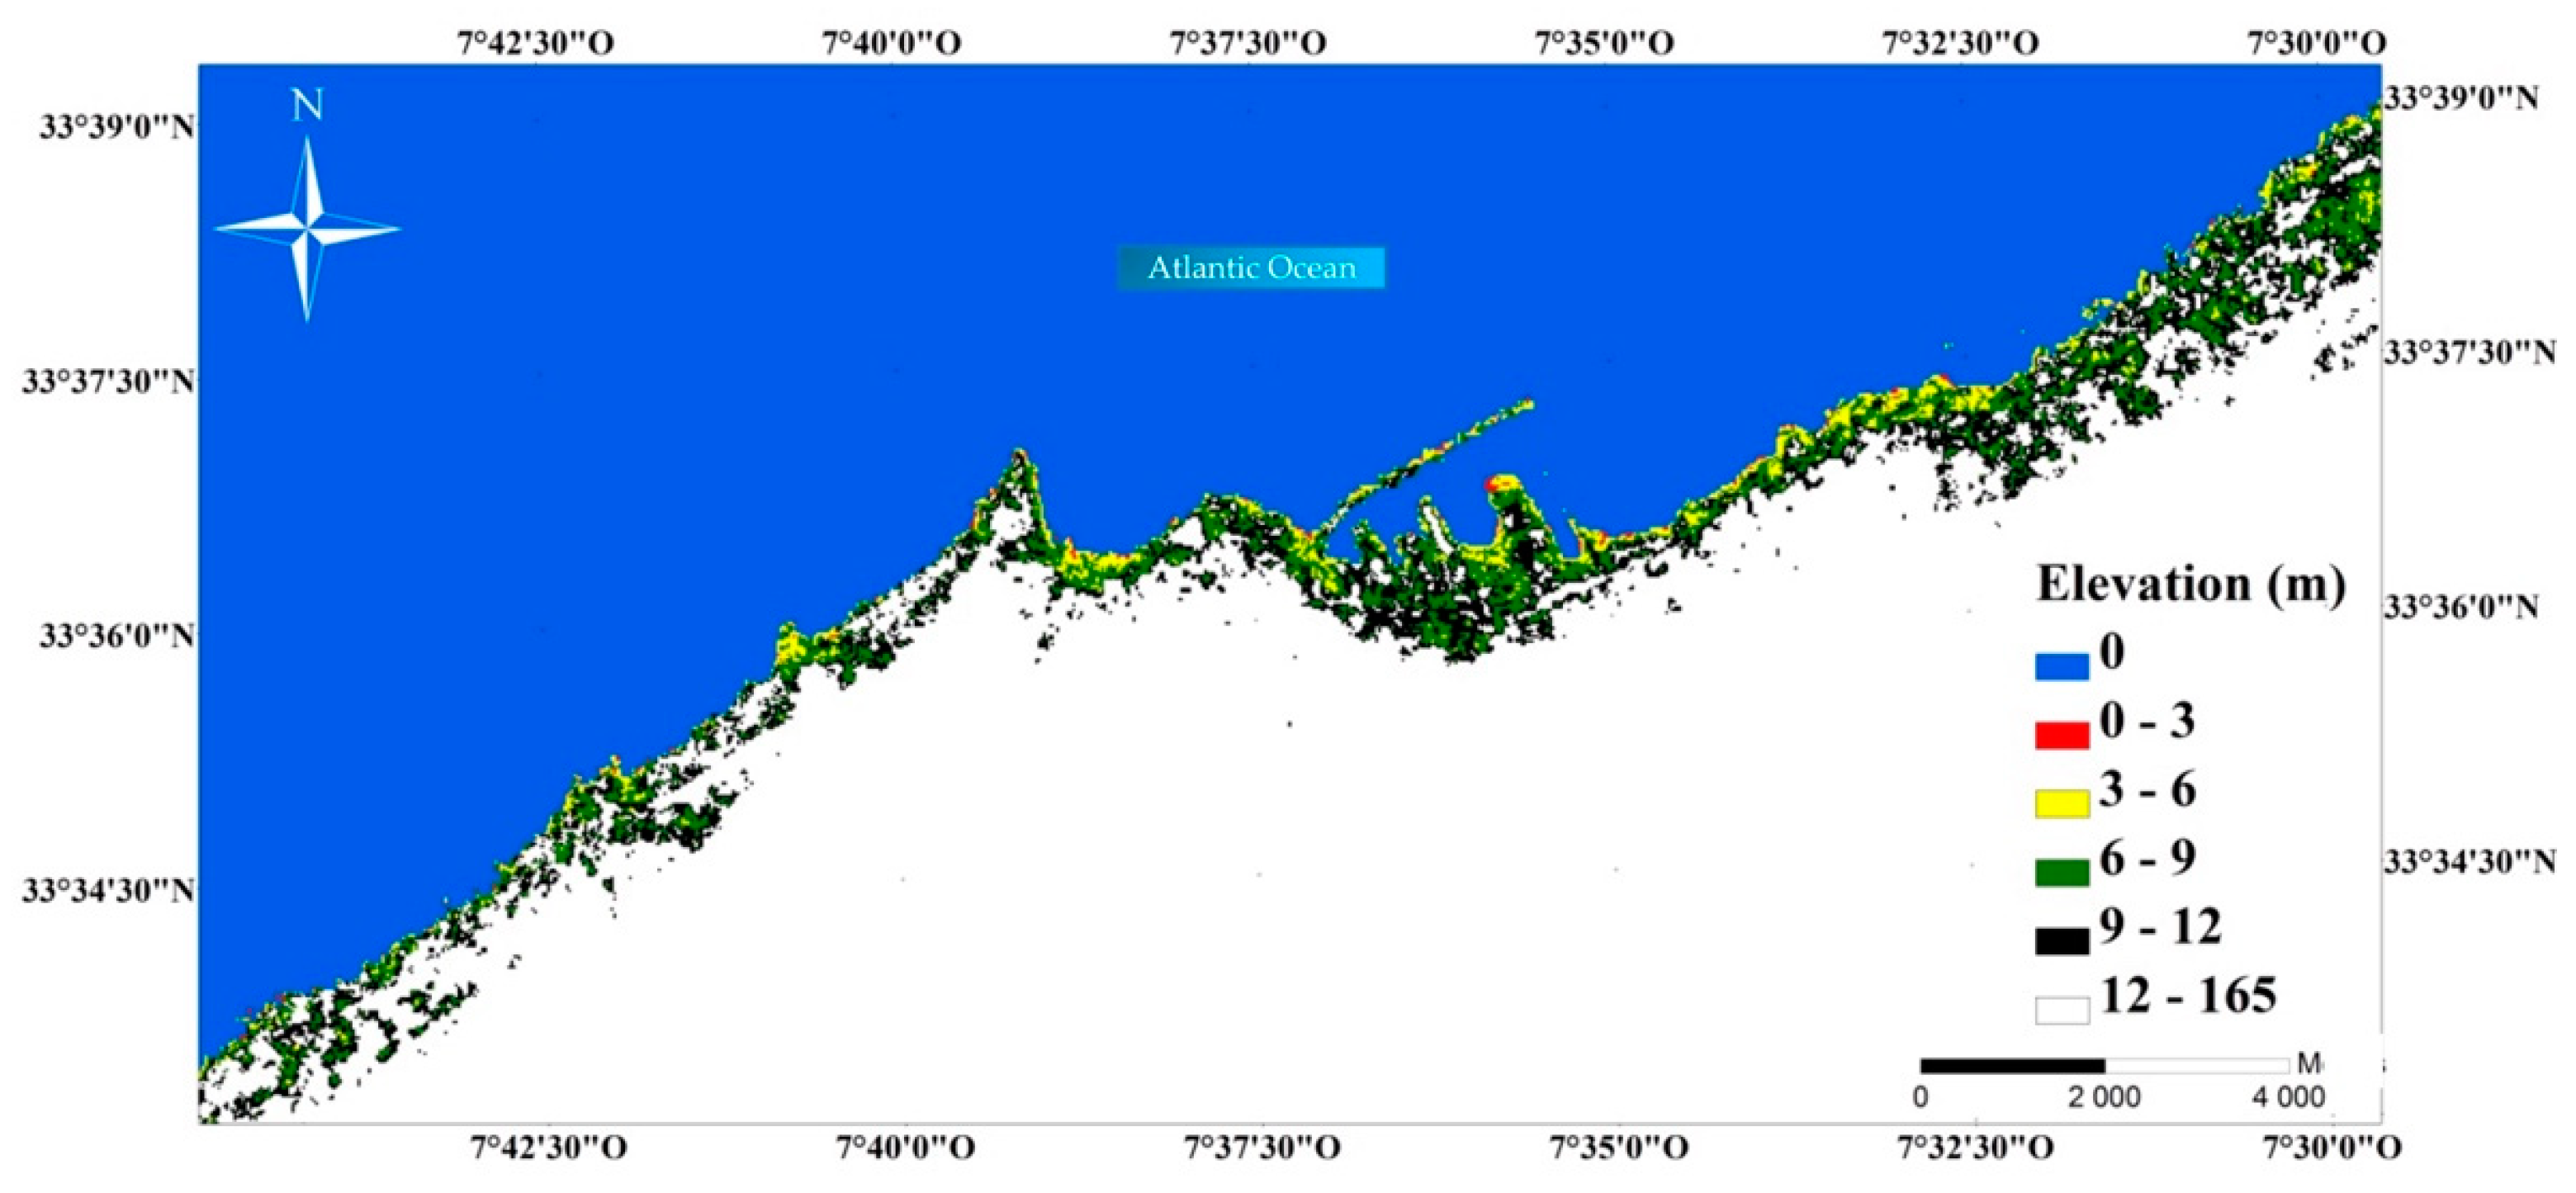
Figure 12.
Digital Maps showing (a) minimum travel time to arrive at the shore estimated for 5 sources (GB, MPF, HSF, PBF, CWF); (b) the maximum wave height for the 5 Tsunami sources of the coastline of Casablanca adapted from Omira et al. [40].
Figure 12.
Digital Maps showing (a) minimum travel time to arrive at the shore estimated for 5 sources (GB, MPF, HSF, PBF, CWF); (b) the maximum wave height for the 5 Tsunami sources of the coastline of Casablanca adapted from Omira et al. [40].
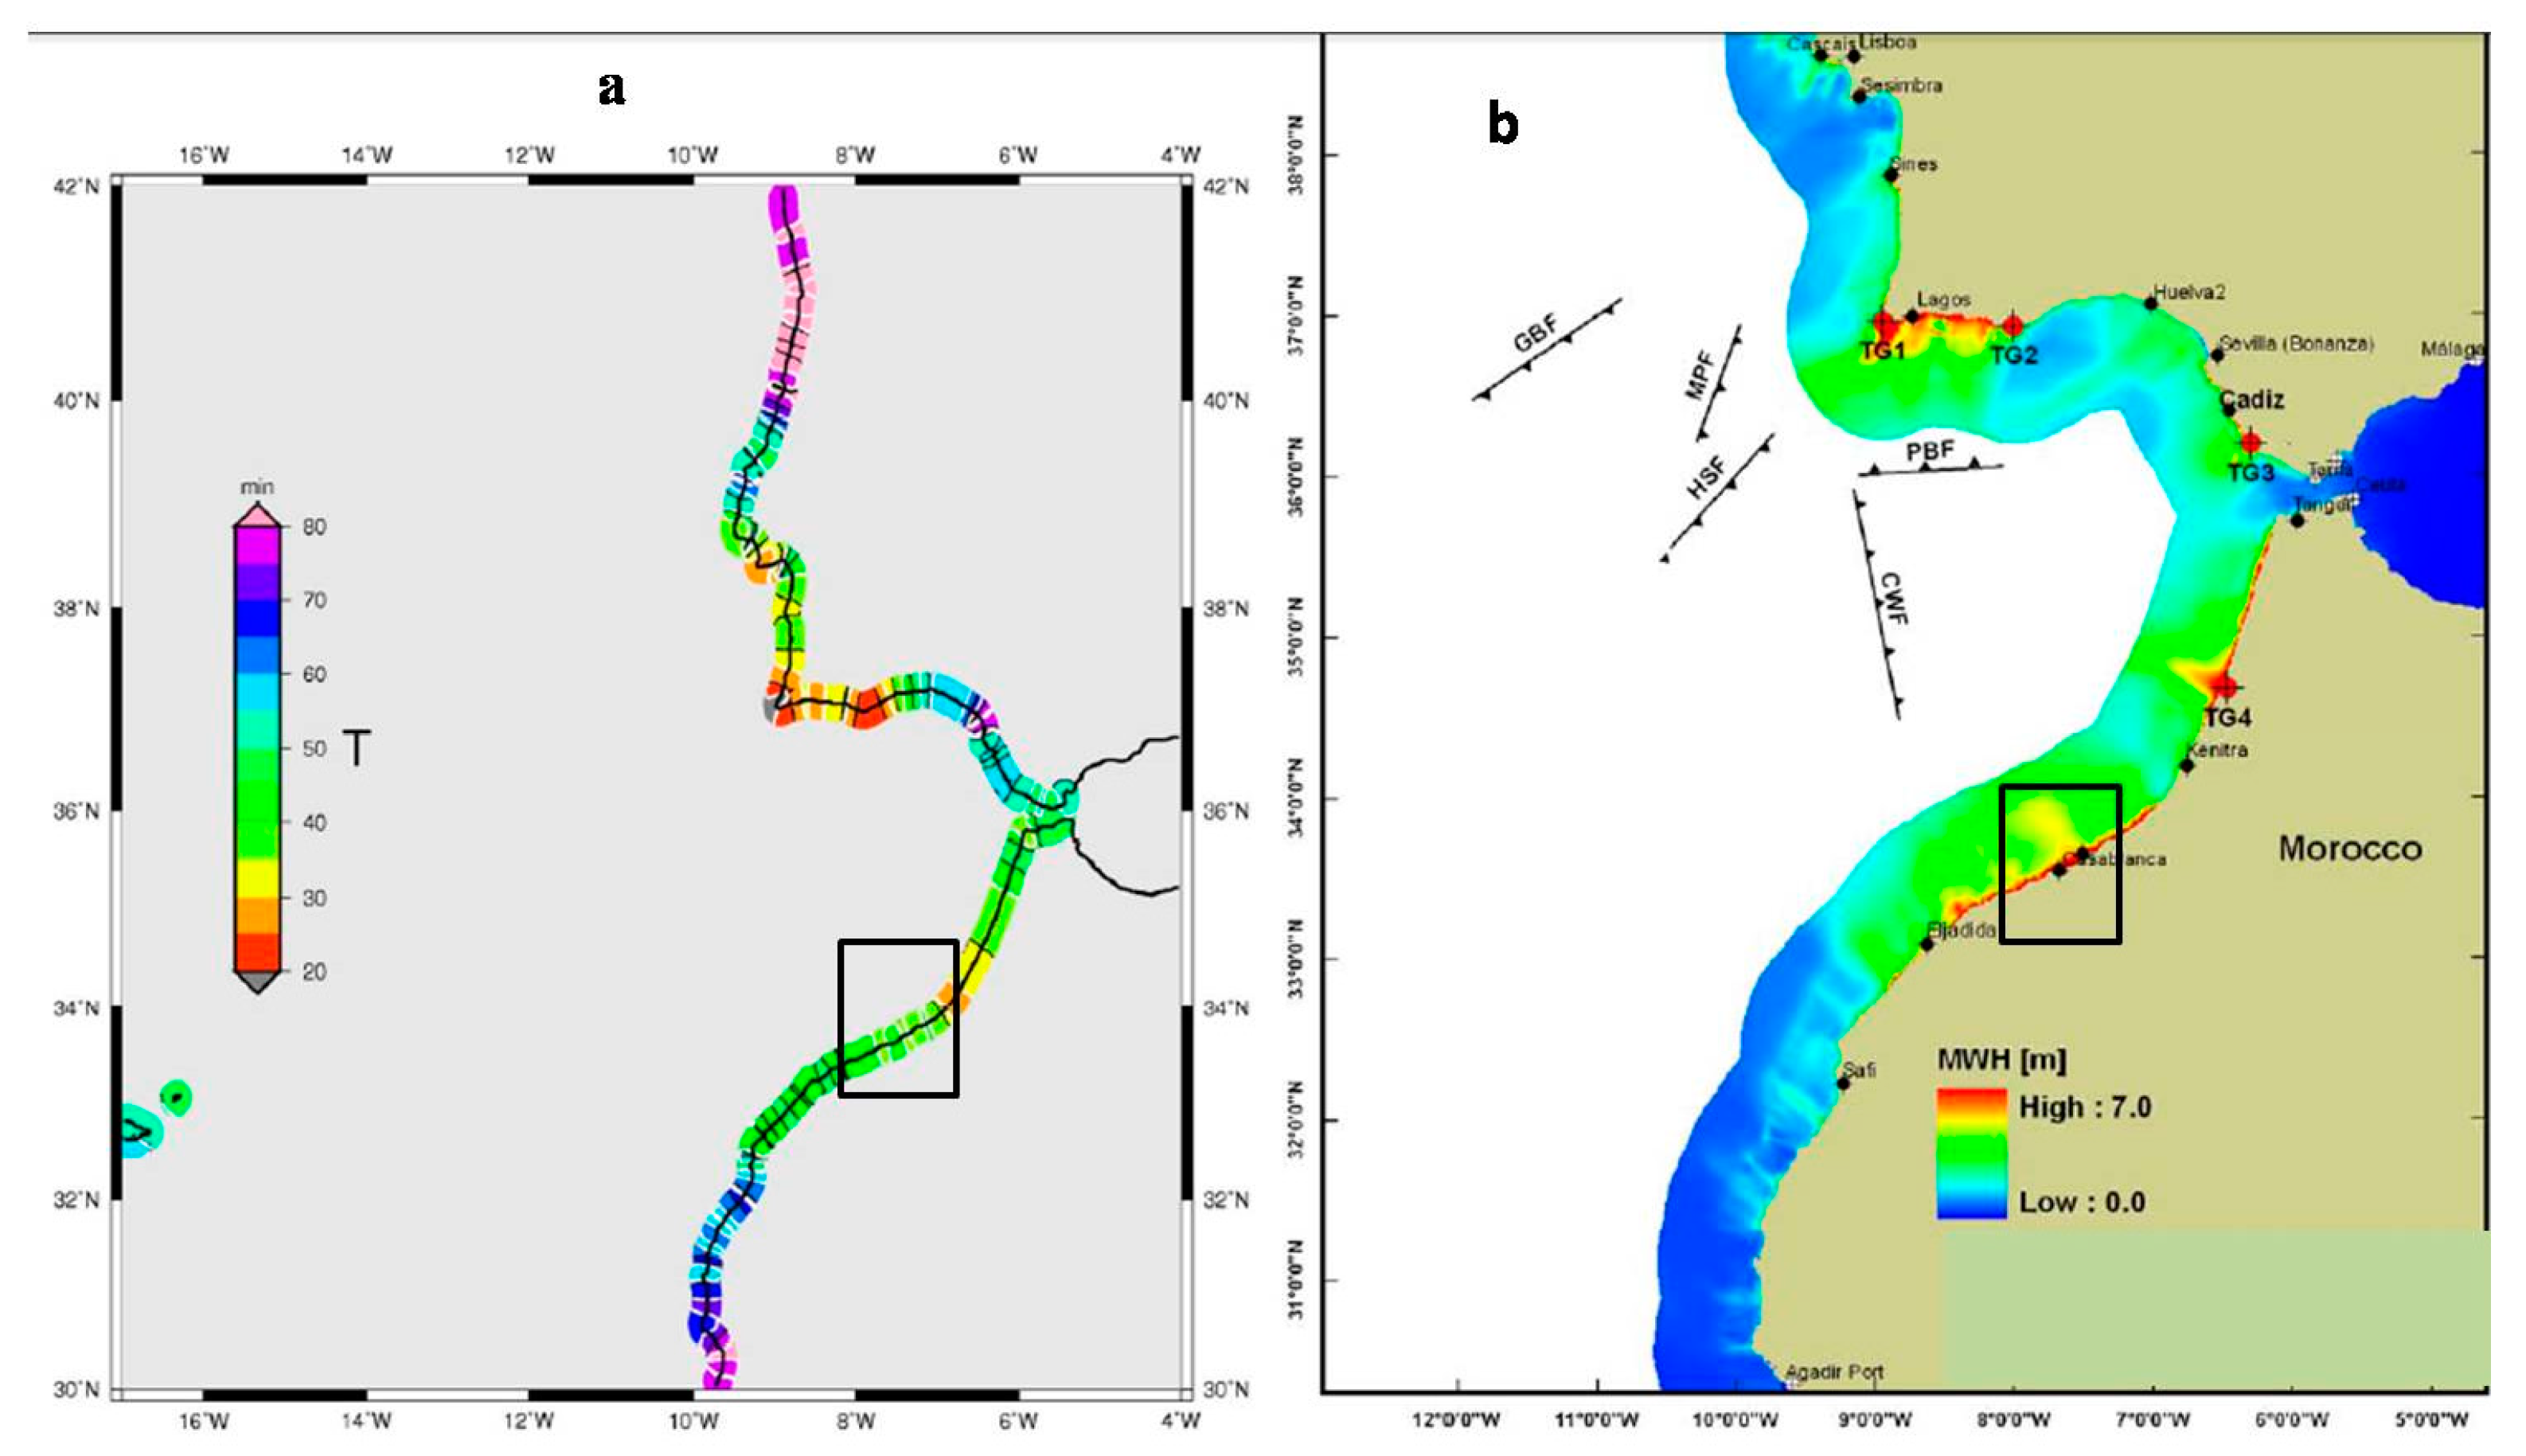
Figure 13.
Map of Coastal Vulnerability index, with main areas of Casablanca Coastline such as Z: Zenata Sand Beach, P: Port area, O: Atlantic Ocean, M: Grande Mosquée, EL: El Hank, A: Anfa Sand Beach, AD, Ain Diab Sand Beach, SA: Sidi Abderrahman. Estimations of coastal vulnerability index indicate I: Very high vulnerability was observed on beaches as it is represented in yellow; II: High vulnerability was observed on semi-rocky areas as it represented in green; III: Moderate vulnerability was observed on rocky areas as it represented blue; and IV: Low vulnerability was observed on artificial areas as it represented in grey. Please note the extension of the City of Casablanca highlighted in red and brown with some areas occupied by vegetation as represented in green on land.
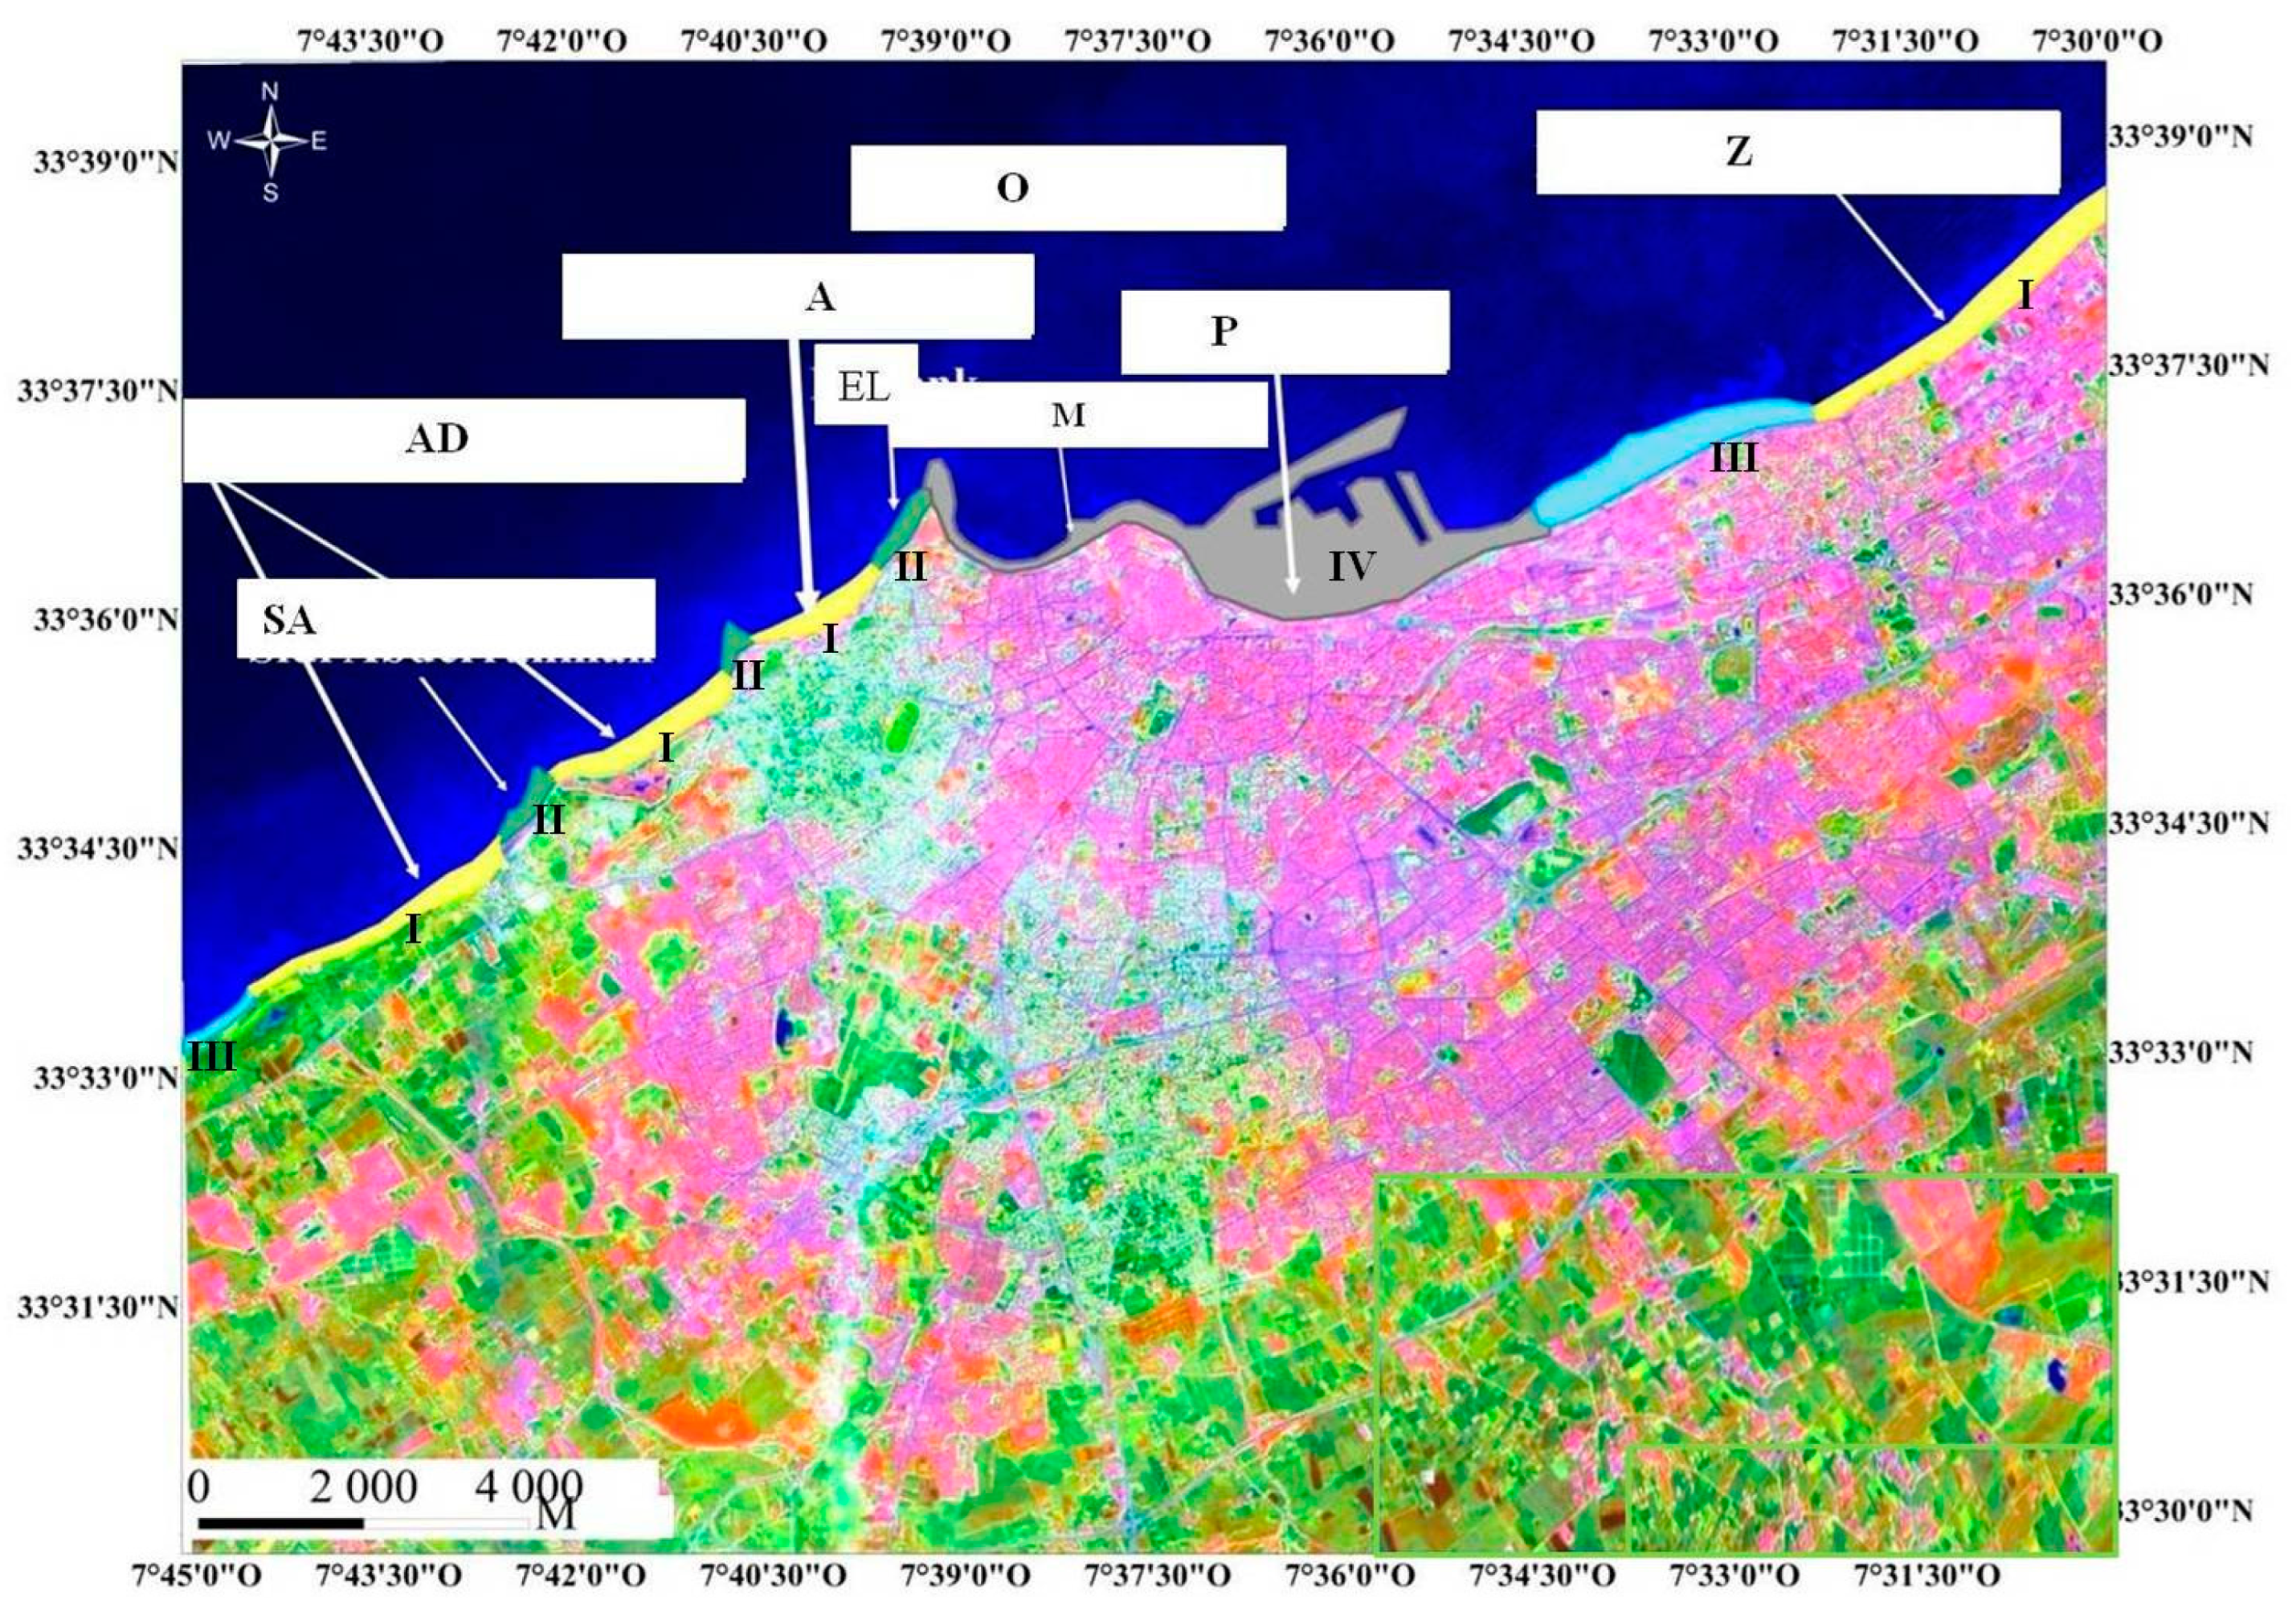
Figure 14.
Traditional protection measures with little protection adopted against coastal erosion on the coastline of Casablanca for the sandy beach of Ain Diab (a) and(b); on the beach of Al Makhzene; (c) and (d); and on the beach of Anfa (E) and (F).
Figure 14.
Traditional protection measures with little protection adopted against coastal erosion on the coastline of Casablanca for the sandy beach of Ain Diab (a) and(b); on the beach of Al Makhzene; (c) and (d); and on the beach of Anfa (E) and (F).
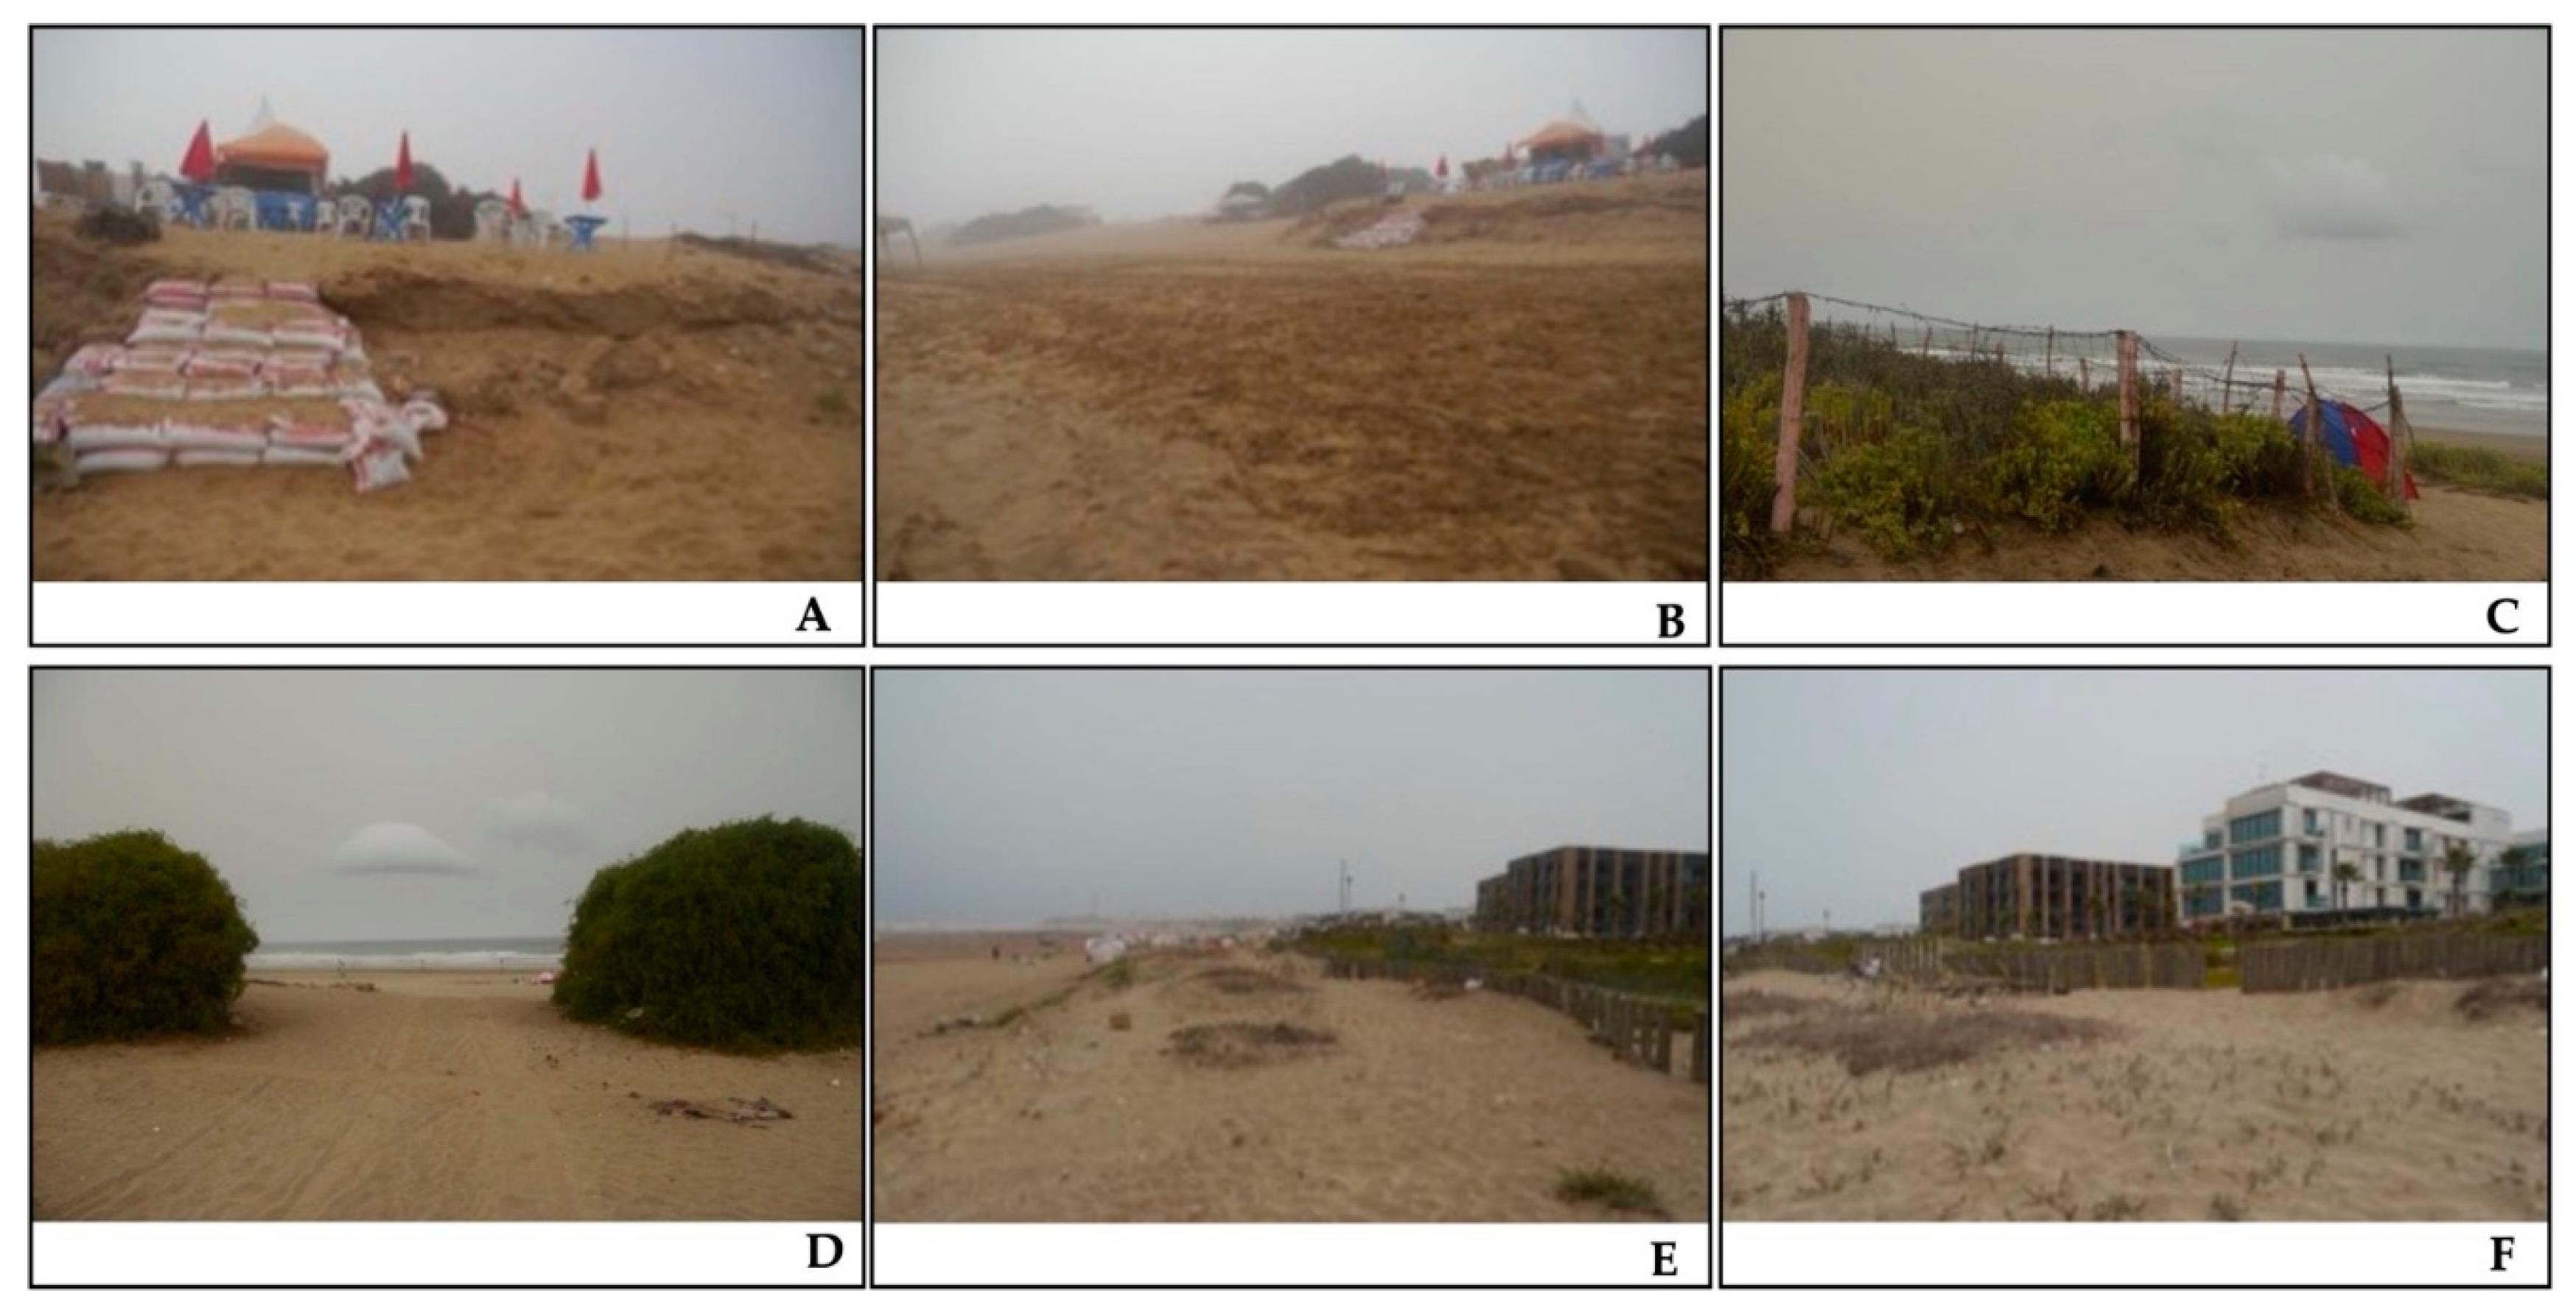

Table 1.
Landsat satellite data used.
| Acquisition date | Sensors | Path/Row | Sun_Elevation (°) | Scene_Center_Time |
|---|---|---|---|---|
| 1973-09-05 | L1 (MSS) | 218/037 | 52.70121774 | 10 :39 :08 |
| 1984-08-25 | L5 (TM) | 202/037 | 54.60314524 | 10 :33 :46 |
| 1999-08-27 | L7(ETM) | 202/037 | 58.26356957 | 10 :56 :41 |
| 2011-02-09 | L5 (TM) | 202/037 | 35.34462586 | 10 :53 :42 |
| 2015-04-25 | L8 (OLI) | 202/037 | 52.15074859 | 11 :03 :04 |
Table 2.
Variables used to estimate Coastal vulnerability index.
| ID | Variable | Ranking of coastal vulnerability index | |||
|---|---|---|---|---|---|
| Low | Moderate | High | Very High | ||
| 1 | 2 | 3 | 4 | ||
| V1 | Geomorphology-lithology | Rocky areas: quartzites, Greywackes and shales | Calcarenite dunes, protected sand beaches | Sand beach | |
| V2 | Coastal slope (%) | >12 | 8-12 | 4-8 | 0-4 |
| V3 | Mean tide range (m) | 2.19 | |||
| V4 | mean wave height (m) | 2.5 | |||
| V5 | Relative sea-level (mm/year) | 2.6 | |||
| V6 | Annual average rate (shoreline erosion/accretion) | 2 m/year | -2 m/year | -3 m/year to -2 m/year | -5 m/year to -3 m/year |
| Accretion | Erosion | ||||
| V7 | Altitude (m) | >9 | 6-9 | 3-6 | 0-3 |
Disclaimer/Publisher’s Note: The statements, opinions and data contained in all publications are solely those of the individual author(s) and contributor(s) and not of MDPI and/or the editor(s). MDPI and/or the editor(s) disclaim responsibility for any injury to people or property resulting from any ideas, methods, instructions, or products referred to in the content. |
© 2025 by the authors. Licensee MDPI, Basel, Switzerland. This article is an open access article distributed under the terms and conditions of the Creative Commons Attribution (CC BY) license (http://creativecommons.org/licenses/by/4.0/).
Copyright: This open access article is published under a Creative Commons CC BY 4.0 license, which permit the free download, distribution, and reuse, provided that the author and preprint are cited in any reuse.


