Submitted:
04 February 2025
Posted:
07 February 2025
You are already at the latest version
Abstract
Arid and semiarid ecosystems are characterized by substantial water loss through evaporation, exceeding precipitation, which makes water scarcity a critical challenge for plant survival. This study examined temporal variations in water relations parameters in two woody species, Acacia schaffneri and Prosopis laevigata, and one epiphytic species, Tillandsia recurvata. The aim was to explore the relationships between hydraulic traits conferring drought tolerance and water storage capacity, as well as to derive the live fuel moisture content at the turgor loss point. Predawn and midday water potentials (Ψpd, Ψmd) were measured in the field, while pressure-volume (P-V) curves were used to derive parameters such as saturated water content (SWC), osmotic potential (Πo), turgor loss point (ΨTLP), relative water content at ΨTLP (RWCTLP), bulk modulus of elasticity (ε), and full turgor capacitance (CFT). Significant correlations were found between CFT and ΨTLP (positive), Πo (positive), and ε (negative). P. laevigata and T. recurvata exhibited higher water storage capacities (41.46 and 26.45 MPa⁻¹, respectively) but had a lower ability to maintain cell turgor under drought conditions. In contrast, A. schaffneri exhibited the lowest water storage capacity (11.88 MPa⁻¹) but demonstrated the highest ability to maintain cell turgor (ΨTLP = -1.31 MPa) and superior osmotic adjustments (Πo = -0.59 MPa). Both A. schaffneri and P. laevigata exhibited rigid cell walls, whereas T. recurvata displayed greater elasticity in its cell structures. The lowest moisture content was observed in A. schaffneri, suggesting higher fire ignition risk. These findings enhance understanding of drought tolerance mechanisms and fire susceptibility in arid regions, offering insights into species-specific adaptations to water stress.
Keywords:
water potential
; water stress
; capacitance
; moisture content
1. Introduction
We live in a changing world; plants, like all living beings, must adapt to their environment in order to survive. One of the most challenging ecosystems is arid and semiarid regions, characterized by substantial water loss through evaporation, surpassing that received from precipitation [1]. Moreover, in such ecosystems, water input through precipitation is not only scarce but also highly variable across both time and space [2]. Consequently, water availability stands as the principal limiting factor for primary productivity and numerous physiological processes within these ecosystems [3]. The anticipated impact of climate change is expected to exacerbate these conditions, leading to heightened incidence and intensity of droughts [4], which is a key factor in determining the performance of plants and is one of the main sources of variation in traits associated with plant function and structure [5].
Plants have developed diverse adaptations and mechanisms to prevent dehydration and turgor loss, in order to face water deficits, such as undergo osmotic adjustments and changes in cell wall elasticity [6]. However, not all species employ the same mechanisms or strategies, as they operate under varying degrees of stress [7,8]. If water deficit persists over an extended period, plants deploy mechanisms that safeguard against cellular damage, such as protein synthesis and the production of protective molecules (proline, glycine betaine, late embryogenesis abundant proteins). These mechanisms help mitigate damage caused by reactive oxygen species [9]. Osmotic adjustment is one of the most important physiological processes for plants in adapting to water and salt stress [10,11]. Adjustment involves the gradual accumulation of compatible osmotic compounds in the cytoplasm, reducing osmotic potential and maintaining high water potential pressure, turgor pressure, water potential gradients, and water flow [12]. While osmotic adjustment is vital for plant survival during drought conditions, it may not necessarily enhance plant growth or crop yield [13]. Decreases in leaf water potential (Ψ) due to reduced solute potential (Ψπ) are associated with osmotic adjustment in various plant species. Some studies suggest that these tolerance indicators can be used to select suitable species for planting in water-scarce areas [14]. More cell walls that are elastic may also contribute to maintaining cell turgor, and this parameter is measured as the elasticity modulus (ε) of the tissue, can help maintain cell turgor the introduction should briefly place the study in a broad context and highlight why it is important [15]. An increase in the fraction of apoplastic water, which induces osmotic adjustment, is a common response of plants to drought, improving their tolerance to water deficit.
One of the most widely employed techniques for assessing plant water status is the pressure chamber [16]. This method facilitates the generation and analysis of pressure-volume (P-V) curves to estimate plant water-related parameters [14,17,18,19]. The analysis of P-V curves enables the determination of leaf traits like water potential at the turgor loss point, and relative water content at the turgor loss point, capacitance, and elasticity of cell wall, which are associated with water stress tolerance. For instance, the turgor loss point (ΨTLP) represents the critical water potential level at which plant cells lose their turgidity. Cell turgor, widely acknowledged as the most prominent indicator of plant drought stress, holds significant importance as a key physiological trait due to its strong correlation with factors such as stomatal conductance and susceptibility to embolism [14,15,20]. On the other hand, the relative water content at the turgor loss point (RWCTLP) and the capacitance (C) measure the effects of water stress on tissue water volume. RWCTLP indicates the percentage of saturated volume remaining at ΨTLP and C indicates the ability to store and release water within their cells and tissues. Finally, elasticity modulus of cell walls (ε) is considered an important physiological trait to depict the acclimation of plants to water stress. A large value for the ε is related to rigid cell walls with less elasticity [21].
P-V curves are commonly employed to determine leaf moisture content in terms of relative water content. However, they can also be utilized to estimate leaf moisture content as Leaf Fuel Moisture Content (LFMC). Humidity in plants is a crucial trait that influences combustion and fire spread [22,23]. Typically, forest fires align with periods of drought, characterized by high soil and atmospheric water deficit. During these times, fuel moisture content decreases, leading to heightened flammability and an increased risk of forest fires [24]. The amount of moisture in the fuels is called the fuel moisture content (FMC), which is defined as the mass of water per unit mass of dry material and is often expressed as a percent [25]. The distribution of both dead and live Fuel Moisture Contents (FMCs) exhibits complexity due to the diverse spatial variations in biophysical factors influencing FMC dynamics. These factors encompass interactions with plant water status, necromass, weather conditions, and topographical features. Ecophysiological processes, transpiration and soil water dynamics intricately regulate live fuel moisture content, while the physical process of evaporation [26] predominantly determines dead fuel moisture content. However, both live and dead fuel moisture dynamics are ultimately driven by the gradient of vapor pressure (humidity) from the particle to the atmosphere [27].
Although there is a clear physiological basis for access to water resources, water potential, stomatal regulation, and osmotic and elastic adjustments in controlling LFMC dynamics, there has been little research explicitly examining these relationships. On the other hand, plant physiologists have more often focused on water potential and variations in moisture content have been explored to a lesser extent. This study examined temporal variations in water relations parameters in two woody species, Vachelia schaffneri (V. Schaffneri) and Prosopis laevigata (P. leavigata), and one epiphytic species, Tillandsia recurvate (T. recurvata). The aim was to explore the relationships between hydraulic traits conferring drought tolerance and water storage capacity and the species’ efficacy in water storage. Additionally, we calculated the moisture content of live fuel based on the parameters of the pressure-volume curves. We hypothesized that species with a higher water storage capacity and cell walls that are more flexible will be better at retaining water, and therefore, they will exhibit a higher moisture content in live fuel.
2. Materials and Methods
2.1. Study Site
The study was conducted from May to August 2020 at a site located on a semiarid grassland, in Santo Domingo ranch, a research station belonging to the National Livestock Organization. The site is located in the geographic subprovince Llanos de Ojuelos, Jalisco (21° 46’ 52.25” N and 101° 36’ 29.56” W) at 2240 m above sea level (Figure 1). The vegetation is a continental tropical semiarid grassland, located approximately 464 Km from the Pacific Ocean and 344 Km from the Gulf of Mexico. The site is a paddock of induced grassland, which was recovered from rainfed agriculture 35 years ago and was kept without grazing for the last 15 years. The dominant grass species is the weeping lovegrass (Eragrostis curvula) with some shrubs of different heights of Mimosa monancistra, Prosopis laevigata, and Acacia shaffneri. Grass basal cover varies between 5% and 40%, reaching 60 cm height and a canopy cover of 81.46% (i.e. including shrubs and other non-grass species) with leaf area index (LAI) of 0.58 m2m-2 [28,29].
The region has a mean annual rainfall of 424 ± 11 mm, of which~95% falls between June and September with a low fraction (~5%) during winter and exhibiting from 6 to 9 months period of low rain [30]. Potential evaporation exceeds precipitation by ~950 mm (aridity index = 0.31). The monthly average of potential evaporation is 687 mm, with the maximum levels observed in May (928 mm), and the minimum in November (471 mm). The mean annual temperature is 17.5 ± 0.5 °C, with mean extreme temperatures ranging from 26.8 °C for the warmest month to 2.6 °C for the coldest month. The topography consists of Valleys with gentle rolling hills and soils classified as Haplic xerosol and Haplic phaeozem, with textures dominated by silty clay, sandy loam textures. The soil is shallow, with an average depth of 0.3-0.4m and cemented layer underneath. In this study, we measured several water-related physiological parameters on two common woody species in the semiarid grassland (P. laevigata and V. Schaffneri) and one atmospheric epiphyte (T. recurvata) that occupies tree canopies of woody species in dry ecosystems.
2.2. Precipitarion and Soil Measurements
Precipitation data were collected using rain gauges located near the study site, recording event precipitation throughout the sampling period. These data were obtained from rain gauges situated at various points within the Centro Nacional de Investigación Disciplinaria en Agricultura Familiar (CENID AF). Daily Soil moisture data were retrieved from the National Aeronautics and Space Administration’s POWER database (NASA, https://power.larc.nasa.gov/data-access-viewer/), produced by the NASA Langley Research Center POWER Project, funded through the NASA Earth Science Directorate Applied Science Program. We downloaded surface soil wetness, which represents the amount of water and water vapor in the upper 5 cm of soil, and root zone soil wetness, which reflects the water and vapor available to plants in the root zone (typically the upper 200 cm of soil). Both metrics are expressed as the proportion of water present in a given soil volume.
Meteorological data, including daily air temperature and vapor pressure, were obtained from the closest meteorological station available from the Red Nacional de Estaciones Agrometeorológicas Automatizadas (RNEAA), a component of the Laboratorio Nacional de Modelaje y Sensores Remotos (LNMYSR).
2.3. Plant Selection
For the plant selection, a preliminary survey was conducted on-site, and four V. Schaffneri trees, three P. laevigata trees, and eight T. recurvata samples were randomly chosen. To distinguish them, each tree was labeled using aluminum foil. Subsequently, four samples were collected from each of the chosen trees. Selection criteria prioritized branches displaying vitality with straight stems measuring 3 to 5 cm in length to ensure proper handling of the specimens. In the case of epiphytic samples, their size was considered, leading to the selection of larger samples of approximately 8-10 cm in length.
2.4. Plant Water Potential
Simultaneously, using the same leaves and twigs selected from the sample collection, the water potential was measured employing the Scholander pressure chamber. (PSM Instrument Corp., Corvalis, Oregon). Predawn water potential (Ψpd; 06:00 to 07:00) was measured, for at least four individuals per species before the sunrise. In addition to predawn water potentials, midday water pottentials (Ψmd; 14:00 to 15:00) were measured (Figure 2). These measurements were carried out during each field visit throughout the study period, using the same leaves or twigs selected from the individuals.
2.5. Pressure-Volume Curves
Pressure-volume curves (P-V curves) were determined on eight leaves and twigs per species using the bench-dehydration method [31], during May and June, which is the end of the dry season. Samples were collected from the field, shoots were cut under water, sealed in Ziploc plastic bags with water, and placed inside a cooler for transporting back to the lab of Centro Nacional de Investigación Disciplinaria en Agricultura Familiar (CENID AF) (Figure 2). In the lab, the entire sample was rehydrated overnight. The next day, samples were weighed and measured for water potential using a Scholander-type pressure chamber and then dried on the bench. Weighing, measuring water potential, and drying samples were repeated until achieving -2 to -4 MPa, depending on the species. Leaves were scanned to calculate the leaf area using ImageJ (Bethesda, MD, USA) and afterwards leaves were dried out for at least 48 hours at 60 °C to obtain the leaf dry mass. Pressure-volume curve parameters were estimated from the curves for each species, including saturated water content (SWC; %), relative water content at turgor loss point (RWCTLP; %), osmotic potential (π0; MPa), water potential at turgor loss point (ΨTLP; MPa), bulk modulus of elasticity (ε;MPa), capacitance at full turgor (CFT; MPa-1), capacitance at turgor loss point (CTLP; MPa-1) and relative capacitance [31].
2.6. Live Fuel Moisture Content
Moisture content at turgor loss point was determined following the methodology of Scarff [32]. Which links the hydraulic traits and the fuel moisture content, to calculate how those parameters vary across species and how strongly that variation drives differences in fuel moisture content under typical fire weather when plants are wilting.
We used the two classical equations relating turgor pressure to water content, to partition the effect of these traits on fuel moisture during fire weather (MCTLP). Equation 1 governs water content in leaves and fine distal shoots.
Where MCTLP is the moisture content at turgor loss point (g H2O/g dry mass), MC100 saturated moisture content (g H2O/g dry mass), SP0 leaf cell solute potential (MPa), Ws leaf symplastic water fraction (%) and ε bulk modulus of elasticity.
Equation 2 governs water content in twigs.
where ΨTLP is the water potential at turgor loss point (MPa); CFT capacitance at full turgor (MPa-1).
2.7. Data Analysis
All statistical tests were performed in Rstudio v.2023.06.2 [33]. Variation in PV curves traits among species was assembled using a mixed-model ANOVA. Data were checked for normality and homogeneity of variance through visual inspection of diagnostic plot. Where ANOVAs were significant, differences among species were tested for using Tukey’s HSD post-hoc test. All results given in the text are mean values ± SE, or, mean values and upper and lower confidence limits at 95%.
3. Results
3.1. Environmental Variables and Leaf Water Potentials
The highest temperatures were observed in May and remained relatively constant throughout the experimental period (Figure 3a). However, larger differences were observed in the vapor pressure deficit (VPD), with maximum values of 2.5 kPa occurring in May and early June, and the lowest values occurring in August and September (VPD ~ 1.0). Soil temperature varied largely through time and depth. The soil moisture content at 0-10 cm and 10-20 cm depths showed greater variation, as these layers are more directly influenced by surface climate conditions. Consequently, light rainfall events were reflected in an increase in soil moisture percentages at these upper layers (Fig. S1). During the dry season (May), the average soil moisture content was recorded as less than 11%. Notably, in the first (May 13, 2021) and fourth (June 17, 2021) weeks of sampling, significant reductions in soil moisture was observed, with the lowest values recorded during the study period (7.8 ± 2.44% and 8.34 ± 0.76%, respectively). In contrast, during the rainy season, the average monthly soil moisture content increased to approximately 17%. This period coincided with three major rainfall events, and the third, fifth, and sixth weeks of sampling showed the highest soil moisture percentages (Fig. S1).
There was a large variation in rainfall events during the period of measurements, with a low rainfall at the end of dry period (may; 1.6–6 mm) and high events of rainfall during wet period (34.2-39.4 mm; Figure 4a). The accumulated daily precipitation for the study period was 129.4 mm. June received 53.6 mm, the wettest month, representing 42% of the total precipitation during our study.
3.1. Leaf Water Potentials
The most negative Ψleaf was observed during the warmer dry month where rainfall was minimum except for T. recurvata (Figure 4b). The lowest variation in Ψleaf was observed in T. recurvata, where Ψleaf ranged from -0.2 to -0.0.5 Mpa, in contrast Ψleaf in V. Schaffneri ranged from -0.2 to -1.2 MPa. The predawn water potential was lower at the end of the dry period in association with reduction in soil moisture and the lowest precipitation (Figure 2c), but it remained relatively constant for the rest of the study period.
3.1. Relationship Between Leaf Water Potentials and Environmental Variables
In the analysis of the correlation matrix between Ψpredawn (Pd) and Ψmidday (Md) water potentials and environmental variables for the three studied species, distinct response patterns were observed for each species. Vachellia schaffneri showed a negative correlation between predawn water potential and vapor pressure deficit (VPD), and positive relationship with relative humidity (RH; Figure 5). During the midday period, V. schaffneri also exhibited a negative correlation with VPD and Tair, and a positive correlation with soil moisture at 20-30 cm (Figure 5).
Prosopis laevigata, on the other hand, did not exhibit correlations between predawn water potential nor midday water potential and the variables VPD, RH, Tair, and soil moisture. Similarly, both predawn and midday water potential of T. recurvata did not show correlations with environmental and soil moisture variables. This suggests that these environmental variables do not have a clear impact on the water potential of this species.
3.2. Pressure-Volume Curves
There were significant differences among species in the P-V curve parameters such as SWC, π0, ΨTLP, RWC, and CTLP (p<0.05). Across all sampling dates, the species with the lowest π0 was V. Schaffneri (-0.59 ±0.06 MPa), while the species with the highest π0 were P. leavigata (-0.32 ± 0.04 MPa) and T. recurvata (-0.33 ± 0.05 MPa; Figure 6a). Similarly, the species with the highest values of ΨTLP were P. leavigata (-0.6 ± 0.4 MPa) and T. recurvata (-0.66 ± 0.06 MPa). The lowest ΨTLP was observed in V. Schaffneri (-1.31 ± 0.08 MPa; Figure 5b). Highest values of RWC were measured in P. leavigata (90.5 ±1.27 %), followed by T. recurvata (84.72 ± 1.88%), while V. Schaffneri was the species with the lowest values (79.37 ± 1.3 %).
There were no significant differences in ε among species at any sampling time. The largest ε was observed in P. leavigata (3.27 ± 0.67 MPa), intermediate values in V. Schaffneri (2.72 ± 0.56 MPa), and lowest in T. recurvata (2.04 ± 0.61 MPa), indicating cell walls with moderate elasticity (Figure 5c). In correspondence, the capacitance at full turgor (CTLP) for V. Schaffneri ranged between 0.08 to 0.4 MPa, the highest values occured in P. leavigata (0.14-0.65 MPa) with its more elastic leaves and T. recurvata showed relatively high values (0.23-0.38 MPa) with its much more elastic leaves (Figure 6d).
3.3. Correlation P-V Parameters
The regressions between the parameters of the P-V curves and CFT mostly exhibited a nonlinear relationship. Data was fitted with an exponential decay equation (Figure 7a-c; f= y0 + a*exp(-b*x)). However, the relationship between π0 and ε fitted perfectly to a linear function (Figure 7d). Correlation between CFT vs. ΨTLP for V. Schaffneri, P. leavigata and T. recurvata was not statistically significant (p>0.01; Figure 7a). Rather, increase CFT was associated with less negative π0; reducing π0 make that CFT decrease more rapidly (Figure 6b). The osmotic potential explained 40%–49% of variability of CFT for the two woody and the epiphyte.
A highly significant negative correlation was observed between CFT and ε (Figure 7c), where more elastic leaves present, in turn, higher CFT. The variation in ε explained up to 85% of the variation in CFT. for P. leavigata, which decreases to 65% for T. recurvata. The changes in the osmotic potential (π0) were negatively related to cell wall bulk elastic modulus (ε) between species (Figure 6d); indicating that osmotic and elastic adjustment of leaf water relations may proceed in a coordinate manner. Species with more rigid cell walls (higher elastic modulus) were associated with more negative osmotic potential (P. leavigata and T. recurvata).
3.4. Fuel Moisture Content
At the study site, the moisture content at the point of turgor loss (MCTLP) estimated for leaves and branches varied among species. T. recurvata showed the highest MCTLP values (5.199 ± 1.269 g/g); on average, individuals of this species presented an MCTLP value of 3.843 ± 0.714 g/g (Table 1). P. laevigata had a similar trend in its data, with the highest MCTLP value being 3.738 ± 0.551 g/g, and on average this species contained 1.998 ± 0.292 g/g. In contrast, Acacia schaffneri had the lowest MCTLP value (1.294 ± 0.932 g/g), with average values ranging between 0.892 ± 0.351 g/g. Overall, it is possible to observe that P. laevigata and T. recurvata were the species that recorded the highest MCTLP, reaching values close to 7 g/g (Figure 8), while V. Schaffneri maintained its values below 2 g/g.
4. Discussion
4.1. Seasonal Patterns in Leaf Water Potentials
In semiarid ecosystems, the soil water availability is the main determinant of plant functioning. The results of this study demonstrate a clear pattern of water stress in the sampled tree species at the end of the dry season, with most species exhibiting their lowest Ψleaf values during this period. The small precipitation event observed at the beginning of the sampling period recovered water potential at all species, and the variations in Ψpd and Ψmd during the sampling period indicate that the soil water available for plants increased over time accordingly to seasonality of rainfall. This suggests that plants which can maintain their biological functions despite very negative Ψmd values or may respond with small precipitation events may have specific adaptations to efficiently rehydrate plant cells or minimize transpiration rates conserving the soil water at the time [34]. Frequent and large precipitation events (>30 mm) increased water potential at maximum levels and maintained it stable, especially predawn water potentials (Figure 4a, b).
Numerous studies have shown that Ψmd exhibits significant variation due to increased exposure of leaves to solar radiation, air temperature, and low relative humidity, which leads to increased dehydration or water loss, reflected in the plant’s water status [35,36]. At night, transpiration ceases, water diffuses passively by capillarity along the water column, and the Ψ gradient disappears by dawn.
The results showed that T. recurvata maintained water potential values closer to zero (-0.23 MPa), which is consistent with previous studies that have shown that this species responds to variations in air humidity conditions and can increase or decrease gas exchange during the night [37] and does not depend on variations in soil moisture. The values obtained in this study are comparable with other results from epiphytes where physiological responses to drought are evaluated, for example, Tillandsia ionantha (-0.40 MPa) presented relatively more negative values [38]. In general, these species have demonstrated high drought resistance due to their ability to absorb water through their leaves.
In contrast, V. Schaffneri showed more marked variations in Ψmd due to its dependence on water availability in the soil and the length of roots to absorb water from the subsoil, which is immediately transpired by the leaves. This is suggested by the more negative values of Ψmd during the dry season, which possibly indicate limitations in its vertical root exploration. The data obtained for V. Schaffneri in this study (-1.16 ± 0.11 MPa) are comparable to results obtained for species of the same genus during rainy seasons, where Acacia berlandieri reached Ψmd values of -2.79 MPa [39]. Leaf water potentials (both predawn and midday) of V. schaffneri were more coupled to atmospheric and soil moisture variables than the other species (Figure 5). The negative correlations between VPD and water potential indicate that as VPD increases, the water potential becomes more negative. This reflects a relationship in which higher vapor pressure deficits are associated with greater water loss in the species, ultimately affecting their water potential. This pattern highlights how dry environmental conditions, represented by high VPD values, lead to increased transpiration and water stress in plants. This supports the idea that V. schaffneri depends strongly on water availability in the soil and their capacity to absorb water through roots and exhibit different adaptive responses to drought [40]. There is evidence indicating that this species, developing naturally in areas with low precipitation, modifies its resource allocation patterns and prioritizes resources to roots, allowing it to maximize resource acquisition [41,42].
Similarly, P. laevigata also showed more pronounced variations in its Ψmd, although potentials were less negative. Considering that this species exclusively depends on the moisture available in the soil, the response of the mesquite seems to be more pronounced than that of V. Schaffneri, as it has been reported that the dispersion of P. laevigata occurs along a gradient of water availability in the same site with other species. The Ψmd data obtained (-0.8 ± 0.16 MPa) are less negative than the results obtained in Prosopis argentina and Prosopis alpataco (-2.5 MPa), species adapted to more extreme conditions with annual precipitation ranging from 80 to 200 mm [43]. The results suggest that despite water being a limiting factor in these areas, P. laevigata can tolerate water deficits by maintaining its foliar water potential. No relationship of both predawn and midday leaf water potential with environmental variables confirms the decoupling of leaf water status with atmospheric temperature and humidity (Figure 5). According to reports, the mesquite has shown to be a drought-resistant species during the seedling stage, unlike other shrub species, it is able to develop longer root lengths, which allows it to increase its tolerance to water deficits and, therefore, increase its survival. We expected a strong relationship of leaf water potential with soil moisture at 30 cm depth; however, this was not the case, likely due to dependence of P. laevigata on water at deeper soil profiles.
Predawn water potentials of P. laevigata were less variable than the midday water potentials (Figure 4b). Since this species depends more on deep soil water, we would expect more stable predawn and midday water potential values along time than V. Schaffneri. It is likely that P. laevigata has lower stomatal control (anisohydric species) than V. shaffneri. This could explain more variability of midday water potentials of P. laevigata. In contrast, V. shaffneri and T. recurvata without access to more stable water reservoirs have more efficient stomatic control depending on weather conditions for avoiding water loss (isohydric species) [44]. This coincides with the much higher capacity of P. laevigata to storage water, which ensures water availability even in weather stressful conditions.
4.2. Hydraulic Traits
Parameters varied among species. The greatest differences were found for ΨTLP, which differed mainly between V. Schaffneri and P. laevigata (-1.31 MPa to -0.35 MPa), differences that were closely related to πo since V. Schaffneri presented the most negative values during the sampling period, while P. laevigata presented the least negative πo, suggesting that huisache presented greater water restrictions. According to the literature, decreases in ΨTLP are associated with decreases in πo, which generate a significant improvement in water absorption in the soil under stress conditions [7,14]. This adjustment represents an alternative strategy to water deficit conditions. The results obtained for both parameters in V. Schaffneri are comparable to those reported in Acacia xanthophloea and Acacia tortilis [45]; however, these decreases do not limit the growth of the species since they continue to grow with lower foliar water potential. On the other hand, it is also known that the osmotic potential of the cell can decrease due to the accumulation of compatible osmolytes in the cytoplasm (proline and betaine), which prevent the decrease in water potential without interfering with cellular functioning, acting as osmotic agents to protect the plant from dehydration [46]. This behavior has been reported for P. laevigata, which could explain why ΨTLP and πo only decreased slightly. This also suggests that species can show alternative strategies to maintain turgor and avoid plant desiccation.
Significant differences in RWCTLP were found in V. Schaffneri (79.37%), indicating that drought conditions had a greater impact on the huisache’s cellular water content. This may be due to its low ability to retain and absorb water molecules. This suggests that plants can reduce the solute potential of the symplast by pumping water from the symplast to the apoplast, thereby reducing RWC [7]. This is also reflected in the negative values obtained for this species in πo. In the case of P. laevigata and T. recurvata, the RWCTLP decreased to a lesser extent (90.55%, 84.72%, respectively). In the case of mesquite, for example, hydrated cells are maintained by reducing the cellular water potential through the synthesis of compatible solutes (e.g., proline, glycine betaine, and soluble sugars), which is consistent with the mechanisms reported in existing literature for this species [47]. These results may reflect differences in the leaf anatomical and morphological characteristics of these species, such as stomatal density and size, which affect transpiration rates and water loss.
Interestingly, there were no significant differences in ε among species at any sampling time, indicating that all species have similar cell wall elasticity. This may suggest that cell wall elasticity is not a major factor in determining the species’ water stress response. According to the literature, one of the mechanisms used by CAM plants in response to water deficit is the adjustment of the elasticity module of the cell wall [48]. This could be one of the strategies utilized by T. recurvata, as the observed values of the elasticity module close to zero (2.04 MPa), consistent with previous report, where reported similar results (3.3 MPa) [48]. These low values may indicate highly elastic cell walls [49], allowing the epiphytes to lose significant amounts of water without significant decreases in cell turgor pressure [38].
P. laevigata and V. Schaffneri presented higher values of the elasticity modulus (ε) during the study period (3.27 MPa, 2.72 MPa); indicating a trend towards stiffer cell walls. Elastic and osmotic adjustments in woody species have been reported as crucial parameters for maintaining turgor, since they significantly correlate with RWC [50]. However, the literature on ε as an adaptation to drought is ambiguous, as both an increase and a decrease in ε can be interpreted as a response to drought stress [7]. Previous report indicated that ε does not play a direct role in drought tolerance, and that its physiological function is probably more related to preventing dehydration below a critical RWCTLP threshold than to promoting soil water uptake [14].
Finally, the CFT revealed significant differences among the three species, with P. laevigata exhibiting the highest water storage capacity (41.46 MPa-1). According to literature, the Prosopis genus prioritizes its reproductive functions, but during non-flowering and non-fruiting periods, the plant stores water reserves in its trunks and roots, providing structural support and ensuring an efficient root system that can penetrate depths of up to 50 meters. This adaptation confers an advantage for the plant to thrive in extreme environmental conditions [51]. T. recurvata ranked second in CFT performance (26.45 MPa-1). Thanks to the CAM metabolism and specialized non-collenchymatous succulent tissues for water storage, this species can rely on stored water to survive extended drought periods [52]. Studies have reported that this mechanism can sustain the plant for up to six months without water [53].
In V. Schaffneri, the lowest CFT data was recorded (18.39 MPa-1), which may indicate that the water transport pathways also function as water storage compartments. However, they do not have a high capacity to store water and therefore cannot buffer the fluctuations induced by water stress [54]. Some authors suggest that certain species can maintain high stomatal conductance under hydraulic stress conditions, subjecting themselves to low water potentials and high losses of hydraulic conductance, but still maintaining gas exchange at relatively high rates. This enables the species to invest in hydraulic safety by constructing a xylem that is resistant to hydraulic failure through a more resistant conducting tissue that is less capable of water transport [34,55].
4.3. Moisture Content
We expected that species with a higher water storage capacity and cell walls that are more flexible would be better at retaining water, and therefore, they would exhibit a higher moisture content in live fuel. P. laevigata showed the largest capacitance and the largest moisture content; moreover, T. recurvata showed high elasticity, moderate capacitance and a high moisture content. Thus, we confirm our hypothesis.
The MCTLP is a parameter that estimates the moisture content of live fuel at the point of turgor loss, where leaves have lost enough water to become flaccid, making fuel highly flammable and more available for ignition [32]. Among the three species studied, T. recurvata exhibited the highest MCTLP (3.84 g/g). This indicates that even under extreme conditions such as drought, minimal precipitation, extreme temperatures, high radiation, etc., it would still have a considerable amount of water in its cells, making it less likely to initiate ignition [56,57,58]. The moisture content data in this species appear to be related to its strategies for maintaining hydration under water-deficit conditions, which could explain its higher MCTLP [33]. Finally, woody species recorded the lowest MCTLP values, with P. laevigata showing slightly higher values than V. Schaffneri (1.99 g/g, 0.89 g/g), which is consistent with the species’ ability to maintain hydrated cells under stressful conditions and its good water storage capacity (Table 1), unlike V. Schaffneri, which showed lower water storage capacity and higher water stress. This is evidence that moisture content strongly affects fire activity at the landscape scale [59]. Traits associated with water access and regulation are critical in determining the moisture content of species, especially as fires become more frequent and coincide with drought periods [24,57,59].
5. Conclusions
The three plant species studied showed different patterns and likely different strategies for dealing with drought. More variable midday, but more stable predawn water potentials were observed in P. laevigata in comparison with V. shaffneri and T. recurvata. The last showed the lowest temporal variability, likely due to the more exposed conditions.
Less capacity to store water, rigid cells and less saturated water content in V. shaffneri made it the plant with the highest risk of fire. In contrast, T. recurvata, even though its cespitose morphology and dry appearance, under extreme conditions of drought, has the capacity to store a considerable amount of water in its cells, making it less prone to initiate ignition.
Our study is a step forward in understanding how hydraulic parameters relate to water access and regulation in plants, which plays a critical role in the moisture content of live fuels. This is relevant due to the impact that wildfires are having worldwide. This type of research is crucial given the increase in forest fires in the country, especially since fires coincide with droughts, but further physiological studies of tree species in arid and semi-arid regions, as well as the determination of live fuel moisture content, are needed.
Supplementary Materials
The following supporting information can be downloaded at the website of this paper posted on Preprints.org, Figure S1: Soil moisture (%) at three depths (0-10, 10-20, and 20-30 cm) throughout the study period. Measurements were taken on the same dates as leaf water potentials.
Author Contributions
Conceptualization, C.A.A.G. and F.G.F.; methodology, C.A.A.G., F.G.F. and T.A.R.; software, C.A.A.G., J.D.B. and F.C.A.; validation, C.A.A.G., F.G.F. and J.D.B.; formal analysis, C.A.A.G.; investigation, C.A.A.G. and F.G.F.; resources, C.A.A.G.; data curation, J.D.B.; writing—original draft preparation, F.G.F., T.A.R. and C.A.AG.; writing—review and editing, F.G.F., C.A.A.C., T.A.R., D.J.B. and F.C.A.; visualization, F.C.A.; project administration, C.A.A.G. All authors have read and agreed to the published version of the manuscript.
Funding
This research received no external funding.
Institutional Review Board Statement
Not applicable.
Informed Consent Statement
Not applicable.
Data Availability Statement
We The data supporting the reported results can be obtained from the corresponding author upon reasonable request.
Acknowledgments
We extend our gratitude to Dr. Tulio Arredondo for providing the Scholander pressure chamber; this article is dedicated to his memory. We also acknowledge Dr. Miguel Luna for his invaluable support during the student’s research stay.
Conflicts of Interest
The authors declare no conflicts of interest.
References
- Reynolds, J.F. , Kemp, P.R. & Tenhunen, J.D. Effects of long-term rainfall variability on evapotranspiration and soil water distribution in the Chihuahuan Desert: A modeling analysis. Plant Ecology 150, 145–159 (2000). [CrossRef]
- Schwinning, S. , Sala, O.E., Loik, M.E. et al. Thresholds, memory, and seasonality: understanding pulse dynamics in arid/semi-arid ecosystems. Oecologia 141, 191–193 (2004). [CrossRef]
- Noy-Meir, I. (1973). Desert Ecosystems: Environment and Producers. Annual Review of Ecology and Systematics, 4, 25–51. http://www.jstor.org/stable/2096803.
- Armenteras, D. , Dávalos, L. M., Barreto, J. S., Miranda, A., Hernández-Moreno, A., Zamorano-Elgueta, C.,... & Retana, J. (2021). Fire-induced loss of the world’s most biodiverse forests in Latin America. Science Advances, 7(33), eabd3357. [CrossRef]
- Loram-Lourenco, L. , Farnese, F. D. S., Sousa, L. F. D., Alves, R. D. F. B., Andrade, M. C. P. D., Almeida, S. E. D. S.,... & Menezes-Silva, P. E. (2020). A structure shaped by fire, but also water: Ecological consequences of the variability in bark properties across 31 species from the Brazilian Cerrado. Frontiers in plant science, 10, 1718. [CrossRef]
- Medrano, H. , Bota, J., Cifre, J., Flexas, J., Ribas-Carbó, M., & Gulías, J. (2007). Eficiencia en el uso del agua por las plantas. Investigaciones geográficas (Esp), (43), 63-84.
- Lenz, T. I. , Wright, I. J., & Westoby, M. (2006). Interrelations among pressure–volume curve traits across species and water availability gradients. Physiologia Plantarum, 127(3), 423-433. [CrossRef]
- Fernández, M. E. , Caballé, G., Curetti, M., Dalla Salda, G., Fernández, R. J., Graciano, C.,... & Gyenge, J. E. (2010). Técnicas en medición en ecofisiología vegetal: conceptos y procedimientos.
- Verslues, P.E. , Agarwal, M., Katiyar-Agarwal, S., Zhu, J. and Zhu, J.-K. (2006), Methods and concepts in quantifying resistance to drought, salt and freezing, abiotic stresses that affect plant water status. The Plant Journal, 45: 523-539. [CrossRef]
- Blum, A. (2017) Osmotic adjustment is a prime drought stress adaptive engine in support of plant production. Plant, Cell & Environment. [CrossRef]
- Turner, N. C. (2017) Turgor maintenance by osmotic adjustment, an adaptive mechanism for coping with plant water deficits. Plant, Cell & Environment. [CrossRef]
- Sanders, G.J. , Arndt, S.K. (2012). Osmotic Adjustment Under Drought Conditions. In: Aroca, R. (eds) Plant Responses to Drought Stress. Springer, Berlin, Heidelberg. [CrossRef]
- Li Ximeng, Blackman Chris J., Choat Brendan, Rymer Paul D., Medlyn Belinda E., Tissue David T. (2019) Drought tolerance traits do not vary across sites differing in water availability in Banksia serrata (Proteaceae). Functional Plant Biology 46, 624-633. [CrossRef]
- Bartlett, M.K. , Scoffoni, C., Ardy, R., Zhang, Y., Sun, S., Cao, K. and Sack, L. (2012), Rapid determination of comparative drought tolerance traits: using an osmometer to predict turgor loss point. Methods in Ecology and Evolution, 3: 880-888. [CrossRef]
- Leuschner, C. , Wedde, P. & Lübbe, T. The relation between pressure–volume curve traits and stomatal regulation of water potential in five temperate broadleaf tree species. Annals of Forest Science 76, 60 (2019). [CrossRef]
- Scholander, P. F. , Bradstreet, E. D., Hemmingsen, E. A., & Hammel, H. T. (1965). Sap Pressure in Vascular Plants: Negative hydrostatic pressure can be measured in plants. Science. [CrossRef]
- M. T. TYREE, H. T. M. T. TYREE, H. T. HAMMEL, The Measurement of the Turgor Pressure and the Water Relations of Plants by the Pressure-bomb Technique, Journal of Experimental Botany, Volume 23, Issue 1, 72, Pages 267–282. 19 February. [CrossRef]
- Mart, K.B. , Veneklaas, E.J. and Bramley, H. (2016), Osmotic potential at full turgor: an easily measurable trait to help breeders select for drought tolerance in wheat. Plant Breed, 135: 279-285. [CrossRef]
- Shi-Dan Zhu, Ya-Jun Chen, Qing Ye, Peng-Cheng He, Hui Liu, Rong-Hua Li, Pei-Li Fu, Guo-Feng Jiang, Kun-Fang Cao, Leaf turgor loss point is correlated with drought tolerance and leaf carbon economics traits, Tree Physiology, Volume 38, Issue 5, 18, Pages 658–663. 20 May. [CrossRef]
- Tim, J. Brodribb, N. Michele Holbrook, Stomatal Closure during Leaf Dehydration, Correlation with Other Leaf Physiological Traits, Plant Physiology, Volume 132, Issue 4, 03, Pages 2166–2173. 20 August. [CrossRef]
- M K Bartlett, G Sinclair, G Fontanesi, T Knipfer, M A Walker, A J McElrone, Root pressure–volume curve traits capture rootstock drought tolerance, Annals of Botany, Volume 129, Issue 4, , Pages 389–402. 1 April. [CrossRef]
- Nolan, R. H. , Blackman, C. J., de Dios, V. R., Choat, B., Medlyn, B. E., Li, X., Bradstock, R. A., & Boer, M. M. (2020). Linking Forest Flammability and Plant Vulnerability to Drought. M. ( 11(7), 779. [CrossRef]
- Nolan, R. H. , Foster, B., Griebel, A., Choat, B., Medlyn, B. E., Yebra, M.,... & Boer, M. M. (2022). Drought-related leaf functional traits control spatial and temporal dynamics of live fuel moisture content. Agricultural and Forest Meteorology. [CrossRef]
- Pivovaroff, A. L. , Emery, N., Sharifi, M. R., Witter, M., Keeley, J. E., & Rundel, P. W. (2019). The Effect of Ecophysiological Traits on Live Fuel Moisture Content. W. ( 2(2), 28. [CrossRef]
- Yebra, M. , Dennison, P. E., Chuvieco, E., Riaño, D., Zylstra, P., Hunt Jr, E. R.,... & Jurdao, S. (2013). A global review of remote sensing of live fuel moisture content for fire danger assessment: Moving towards operational products. Remote Sensing of Environment. [CrossRef]
- Manzello, S. L. (Ed.) . (2020). Encyclopedia of wildfires and wildland-urban interface (WUI) fires. [CrossRef]
- Griebel, A. , Boer, M. M., Blackman, C., Choat, B., Ellsworth, D. S., Madden, P., Medlyn, B., Resco de Dios, V., Wujeska-Klause, A., Yebra, M., Younes Cardenas, N., & Nolan, R. H. (2023). Specific leaf area and vapour pressure deficit control live fuel moisture content. Functional Ecology. [CrossRef]
- Delgado-Balbuena, J. , Arredondo, J. T., Loescher, H. W., Huber-Sannwald, E., Chavez-Aguilar, G., Luna-Luna, M., and Barretero-Hernandez, R.: Differences in plant cover and species composition of semiarid grassland communities of central Mexico and its effects on net ecosystem exchange, Biogeosciences, 10, 4673–4690, 2013. [CrossRef]
- Aguirre-Gutiérrez, C. A. , Holwerda, F., Goldsmith, G. R., Delgado, J., Yepez, E., Carbajal, N.,... & Arredondo, J. T. (2019). The importance of dew in the water balance of a continental semiarid grassland. T. ( 168, 26–35. [CrossRef]
- Delgado-Balbuena, J. , Arredondo, J. T., Loescher, H. W., Pineda-Martínez, L. F., Carbajal, J. N., & Vargas, R. (2019). Seasonal precipitation legacy effects determine the carbon balance of a semiarid grassland. Journal of Geophysical Research: Biogeosciences, 124, 987–1000. [CrossRef]
- SACK, L. , COWAN, P.D., JAIKUMAR, N. and HOLBROOK, N.M. (2003), The ‘hydrology’ of leaves: co-ordination of structure and function in temperate woody species. Plant, Cell & Environment, 26: 1343-1356. [CrossRef]
- Scarff FR, Lenz T, Richards AE, Zanne AE, Wright IJ, Westoby M. Effects of plant hydraulic traits on the flammability of live fine canopy fuels. Funct Ecol, 8: 35. [CrossRef]
- R Core Team (2020). A: A language and environment for statistical computing. R Foundation for Statistical Computing, Vienna, 444. Austria. URL https://www.R-project.
- Garrido, S. M. (2018). Estudio de la arquitectura hidráulica y estrategia hidráulica de Prosopis tamarugo como mecanismo de aclimatación bajo condiones de descenso de nivel freático. Tesis de Doctorado. Universidad de chile. Santiago, Chile. Author 1, A.; Author 2, B. Book Title, 3rd ed.; Publisher: Publisher Location, Country, 2008; pp. 154–196. [Google Scholar]
- Donovan, L.A. , Richards, J.H. and Linton, M.J. (2003), MAGNITUDE AND MECHANISMS OF DISEQUILIBRIUM BETWEEN PREDAWN PLANT AND SOIL WATER POTENTIALS. Ecology, 84: 463-470. [CrossRef]
- García López, Aymara, Cun González, Reinaldo, & Montero San José, Lorenzo. (2010). Effect of day time on leaf water potential in sorghum and their relationship with soil humidity. Revista Ciencias Técnicas Agropecuarias, /: Recuperado en 04 de diciembre de 2024, de http, 2024.
- Lange, O.L. , Medina, E. Stomata of the CAM plant Tillandsia recurvata respond directly to humidity. Oecologia. [CrossRef]
- Nowak, E. J. , & Martin, C. E. (1997). Physiological and anatomical responses to water deficits in the CAM epiphyte Tillandsia ionantha (Bromeliaceae). E. ( 158(6), 818–826. [CrossRef]
- RodrÍguez, H. G. , Silva, I. C., Meza, M. V. G., & Jordan, W. R. (2000). Seasonal Plant Water Relationships in Acacia berlandieri. R. ( 14(4), 343–357. [CrossRef]
- Merine, A.K. , Rodríguez-García, E., Alía, R. et al. Effects of water stress and substrate fertility on the early growth of Acacia senegal and Acacia seyal from Ethiopian Savanna woodlands. Trees. [CrossRef]
- Richards, J.H. Root growth response to defoliation in two Agropyron bunchgrasses: field observations with an improved root periscope. Oecologia. [CrossRef]
- Perkins, S.R. , Keith Owens, M. Growth and biomass allocation of shrub and grass seedlings in response to predicted changes in precipitation seasonality. Plant Ecology, 2003. [Google Scholar] [CrossRef]
- Villagra, P. E. , & Cavagnaro, J. B. (2006). Water stress effects on the seedling growth of Prosopis argentina and Prosopis alpataco. B. ( 64(3), 390–400. [CrossRef]
- Johnson, D. M. , Domec, J.-C., Carter Berry, Z., Schwantes, A. M., McCulloh, K. A., Woodruff, D. R., Wayne Polley, H., Wortemann, R., Swenson, J. J., Scott Mackay, D., McDowell, N. G., and Jackson, R. B.: Co-occurring woody species have diverse hydraulic strategies and mortality rates during an extreme drought, Plant, Cell & Environment, 41, 576–588, 2018. [CrossRef]
- D. O. Otieno, M. W. T. D. O. Otieno, M. W. T. Schmidt, S. Adiku, J. Tenhunen, Physiological and morphological responses to water stress in two Acacia species from contrasting habitats, Tree Physiology, Volume 25, Issue 3, 05, Pages 361–371. 20 March. [CrossRef]
- Ghosh, U. K. , Islam, Md. N., Siddiqui, Md. N., and Khan, Md. A. R.: Understanding the roles of osmolytes for acclimatizing plants to changing environment: a review of potential mechanism, Plant Signaling & Behavior, 16, 1913306, 2021. [CrossRef]
- Sharma, P. , & Dubey, R. S. (2019). Protein synthesis by plants under stressful conditions. In Handbook of Plant and Crop Stress, Fourth Edition (pp. 405-449). CRC Press. [CrossRef]
- Stiles, K. C. , & Martin, C. E. (1996). Effects of drought stress on CO2 exchange and water relations in the CAM epiphyte Tillandsia utriculata (Bromeliaceae). E. ( 149(6), 721–728. [CrossRef]
- Takami Saito, Kouichi Soga, Takayuki Hoson, Ichiro Terashima, The Bulk Elastic Modulus and the Reversible Properties of Cell Walls in Developing Quercus Leaves, Plant and Cell Physiology, Volume 47, Issue 6, JUne 2006, Pages 715–725. [CrossRef]
- Fan, S. , Blake, T.J. and Blumwald, E. (1994), The relative contribution of elastic and osmotic adjustments to turgor maintenance of woody species.. Physiologia Plantarum, 90: 408-413. [CrossRef]
- Passera, C. B. (2000). Fisiología de Prosopis spp. Multequina.
- GEYDAN, THOMAS DAVID, & MELGAREJO, LUZ MARINA. (2005). METABOLISMO ÁCIDO DE LAS CRASULÁCEAS. Acta Biológica Colombiana, /: Retrieved , 2024, from http, 04 December 2024.
- Zavala Alcaña, J. C. (2019). Manejo integral del heno motita (Tillandsia recurvata L.).
- Scholz, F.G. , Phillips, N.G., Bucci, S.J., Meinzer, F.C., Goldstein, G. (2011). Hydraulic Capacitance: Biophysics and Functional Significance of Internal Water Sources in Relation to Tree Size. In: Meinzer, F., Lachenbruch, B., Dawson, T. (eds) Size- and Age-Related Changes in Tree Structure and Function. Tree Physiology, vol 4. Springer, Dordrecht. [CrossRef]
- McDowell, N. , Pockman, W.T., Allen, C.D., Breshears, D.D., Cobb, N., Kolb, T., Plaut, J., Sperry, J., West, A., Williams, D.G. and Yepez, E.A. (2008), Mechanisms of plant survival and mortality during drought: why do some plants survive while others succumb to drought?. New Phytologist, 178: 719-739. [CrossRef]
- Cary, G. J. , Bradstock, R. A., Gill, A. M., & Williams, R. J. (2012). Global change and fire regimes in Australia. Flammable Australia: fire regimes, biodiversity and ecosystems in a changing world.
- Flannigan, M.D. , Wotton, B.M., Marshall, G.A. et al. Fuel moisture sensitivity to temperature and precipitation: climate change implications. Climatic Change. [CrossRef]
- Trenberth, K. , Dai, A., van der Schrier, G. et al. Global warming and changes in drought. Nature Clim Change. [CrossRef]
- Pimont, F. , Ruffault, J., Martin-StPaul, N. K., & Dupuy, J. L. (2019). Why is the effect of live fuel moisture content on fire rate of spread underestimated in field experiments in shrublands? International Journal of Wildland Fire. [CrossRef]
Figure 1.
Location of the sampling site location at the Santo Domingo Ranch in Ojuelos de Jalisco, Jalisco, Mexico.
Figure 1.
Location of the sampling site location at the Santo Domingo Ranch in Ojuelos de Jalisco, Jalisco, Mexico.
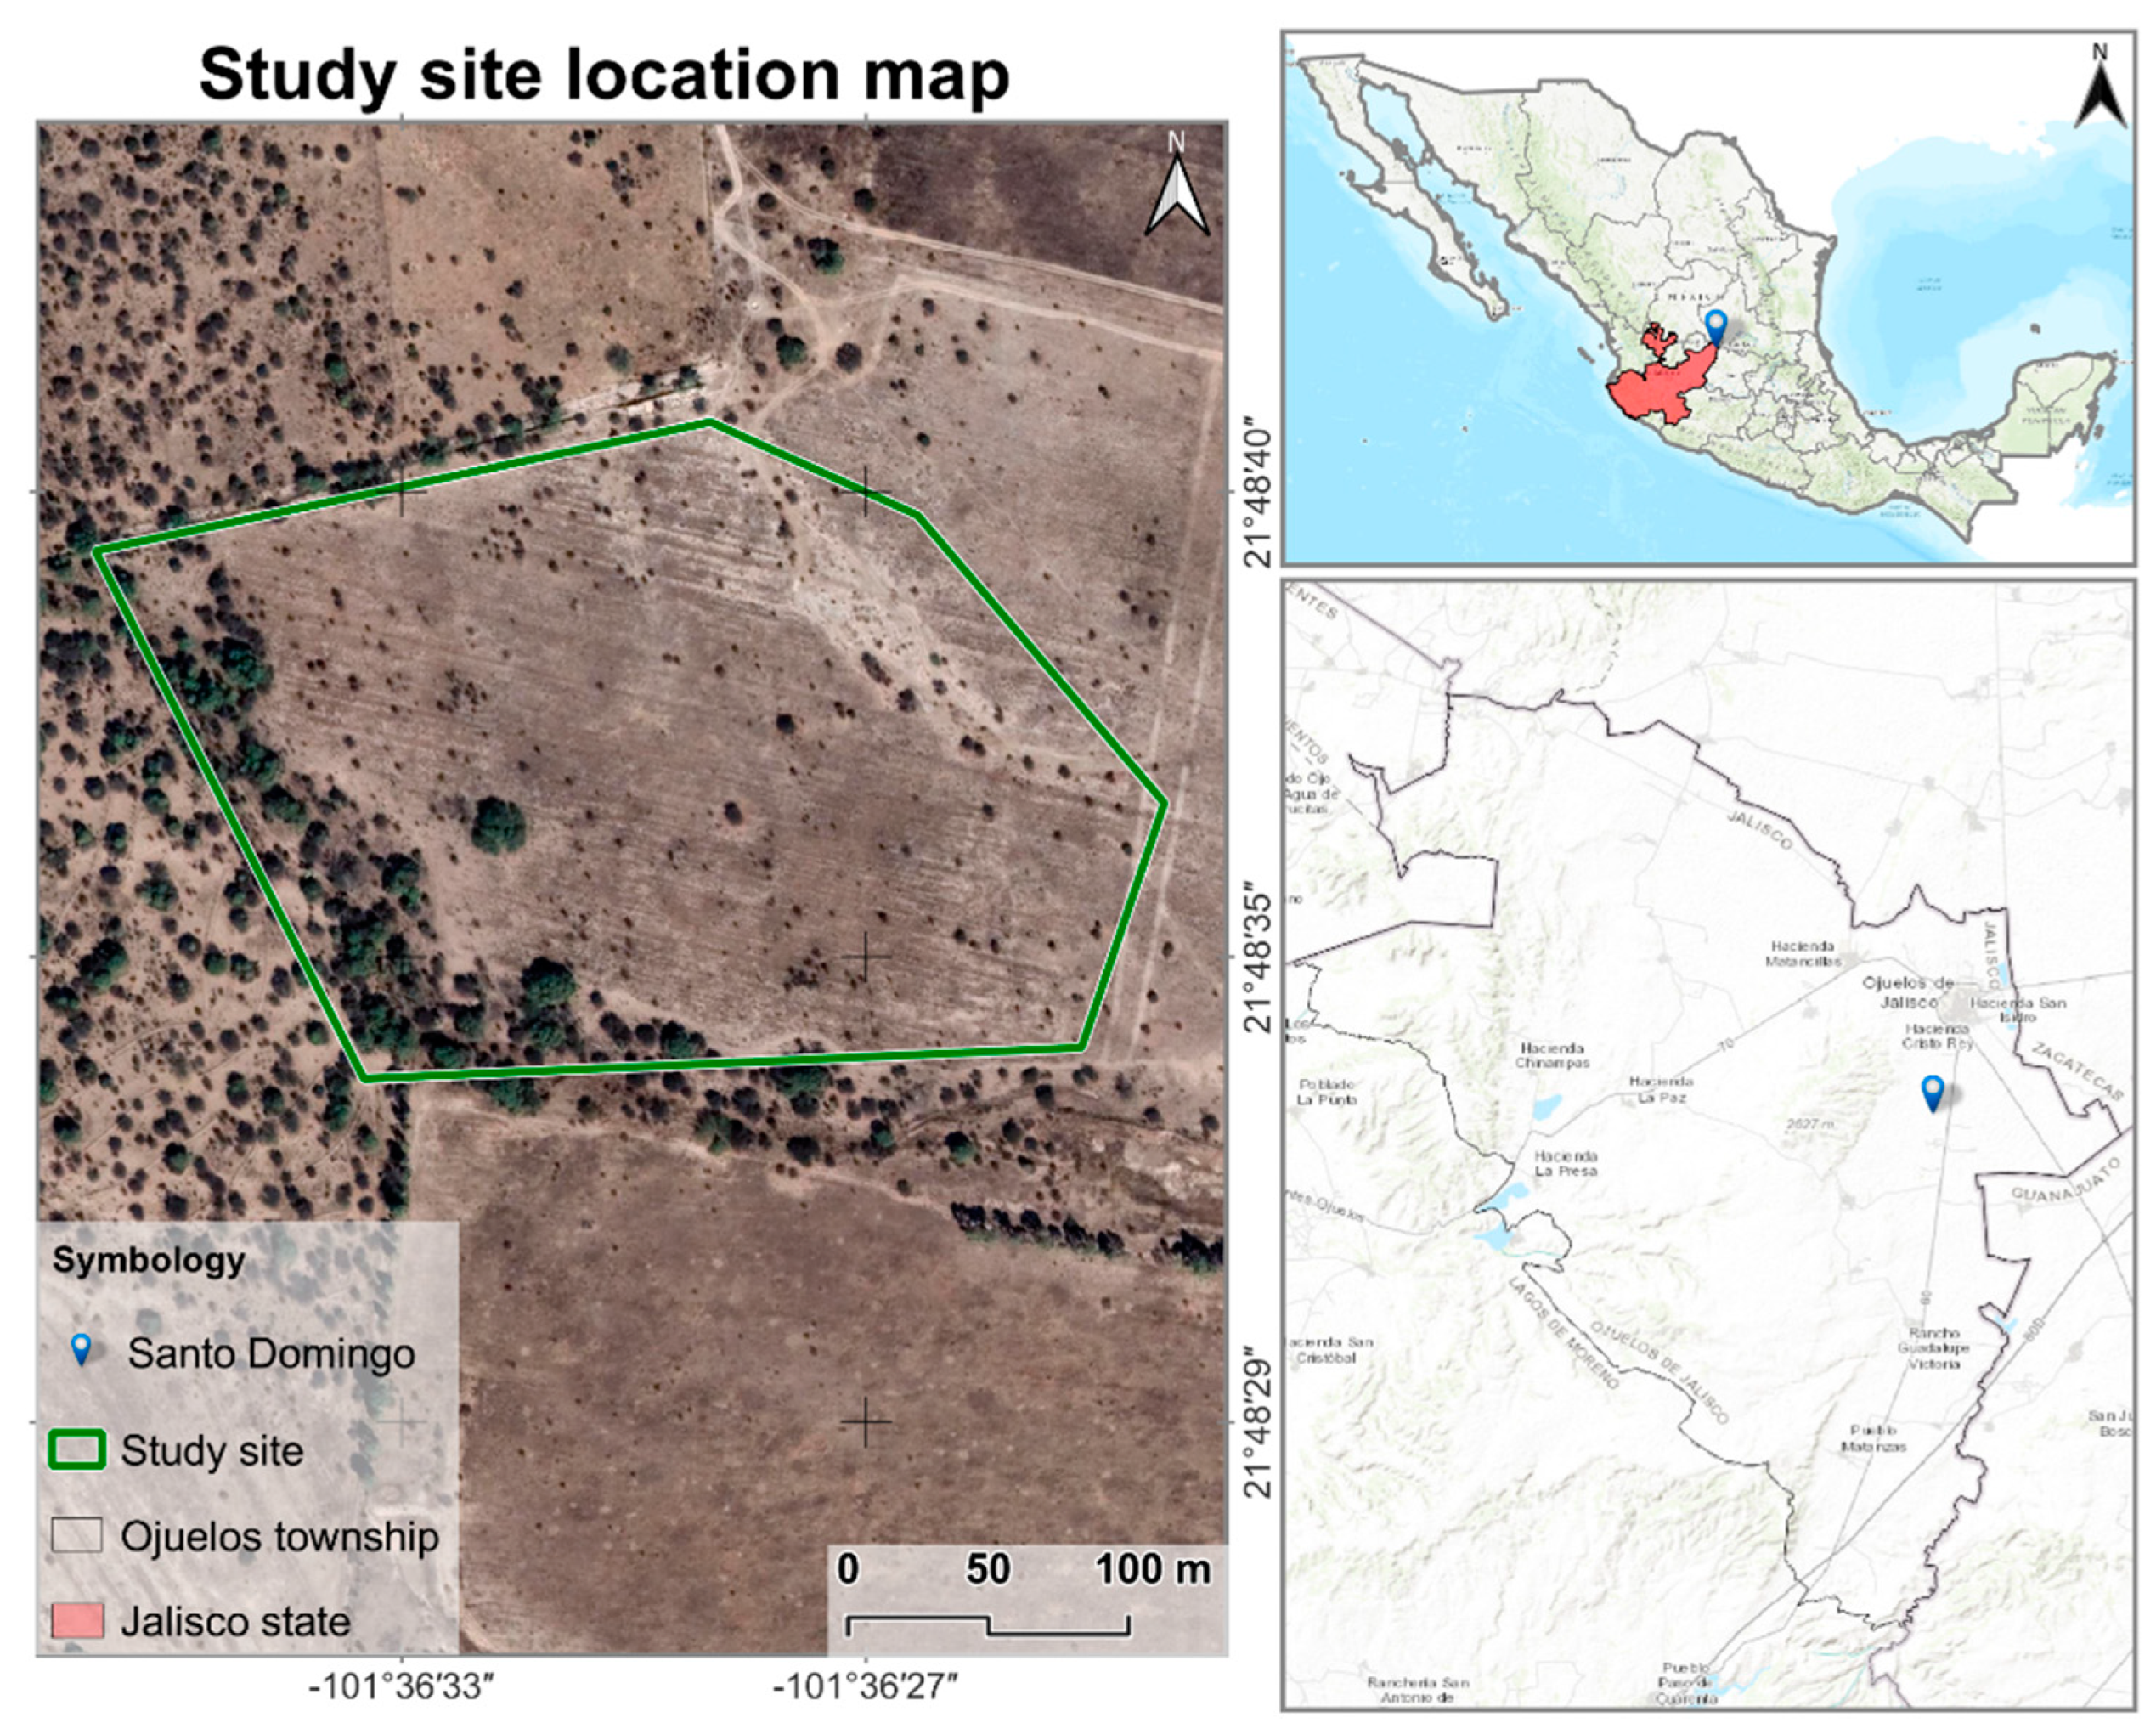
Figure 2.
Water potential measurements in field, and sampling of leaves and twigs for making pressure-volume curves in lab.
Figure 2.
Water potential measurements in field, and sampling of leaves and twigs for making pressure-volume curves in lab.
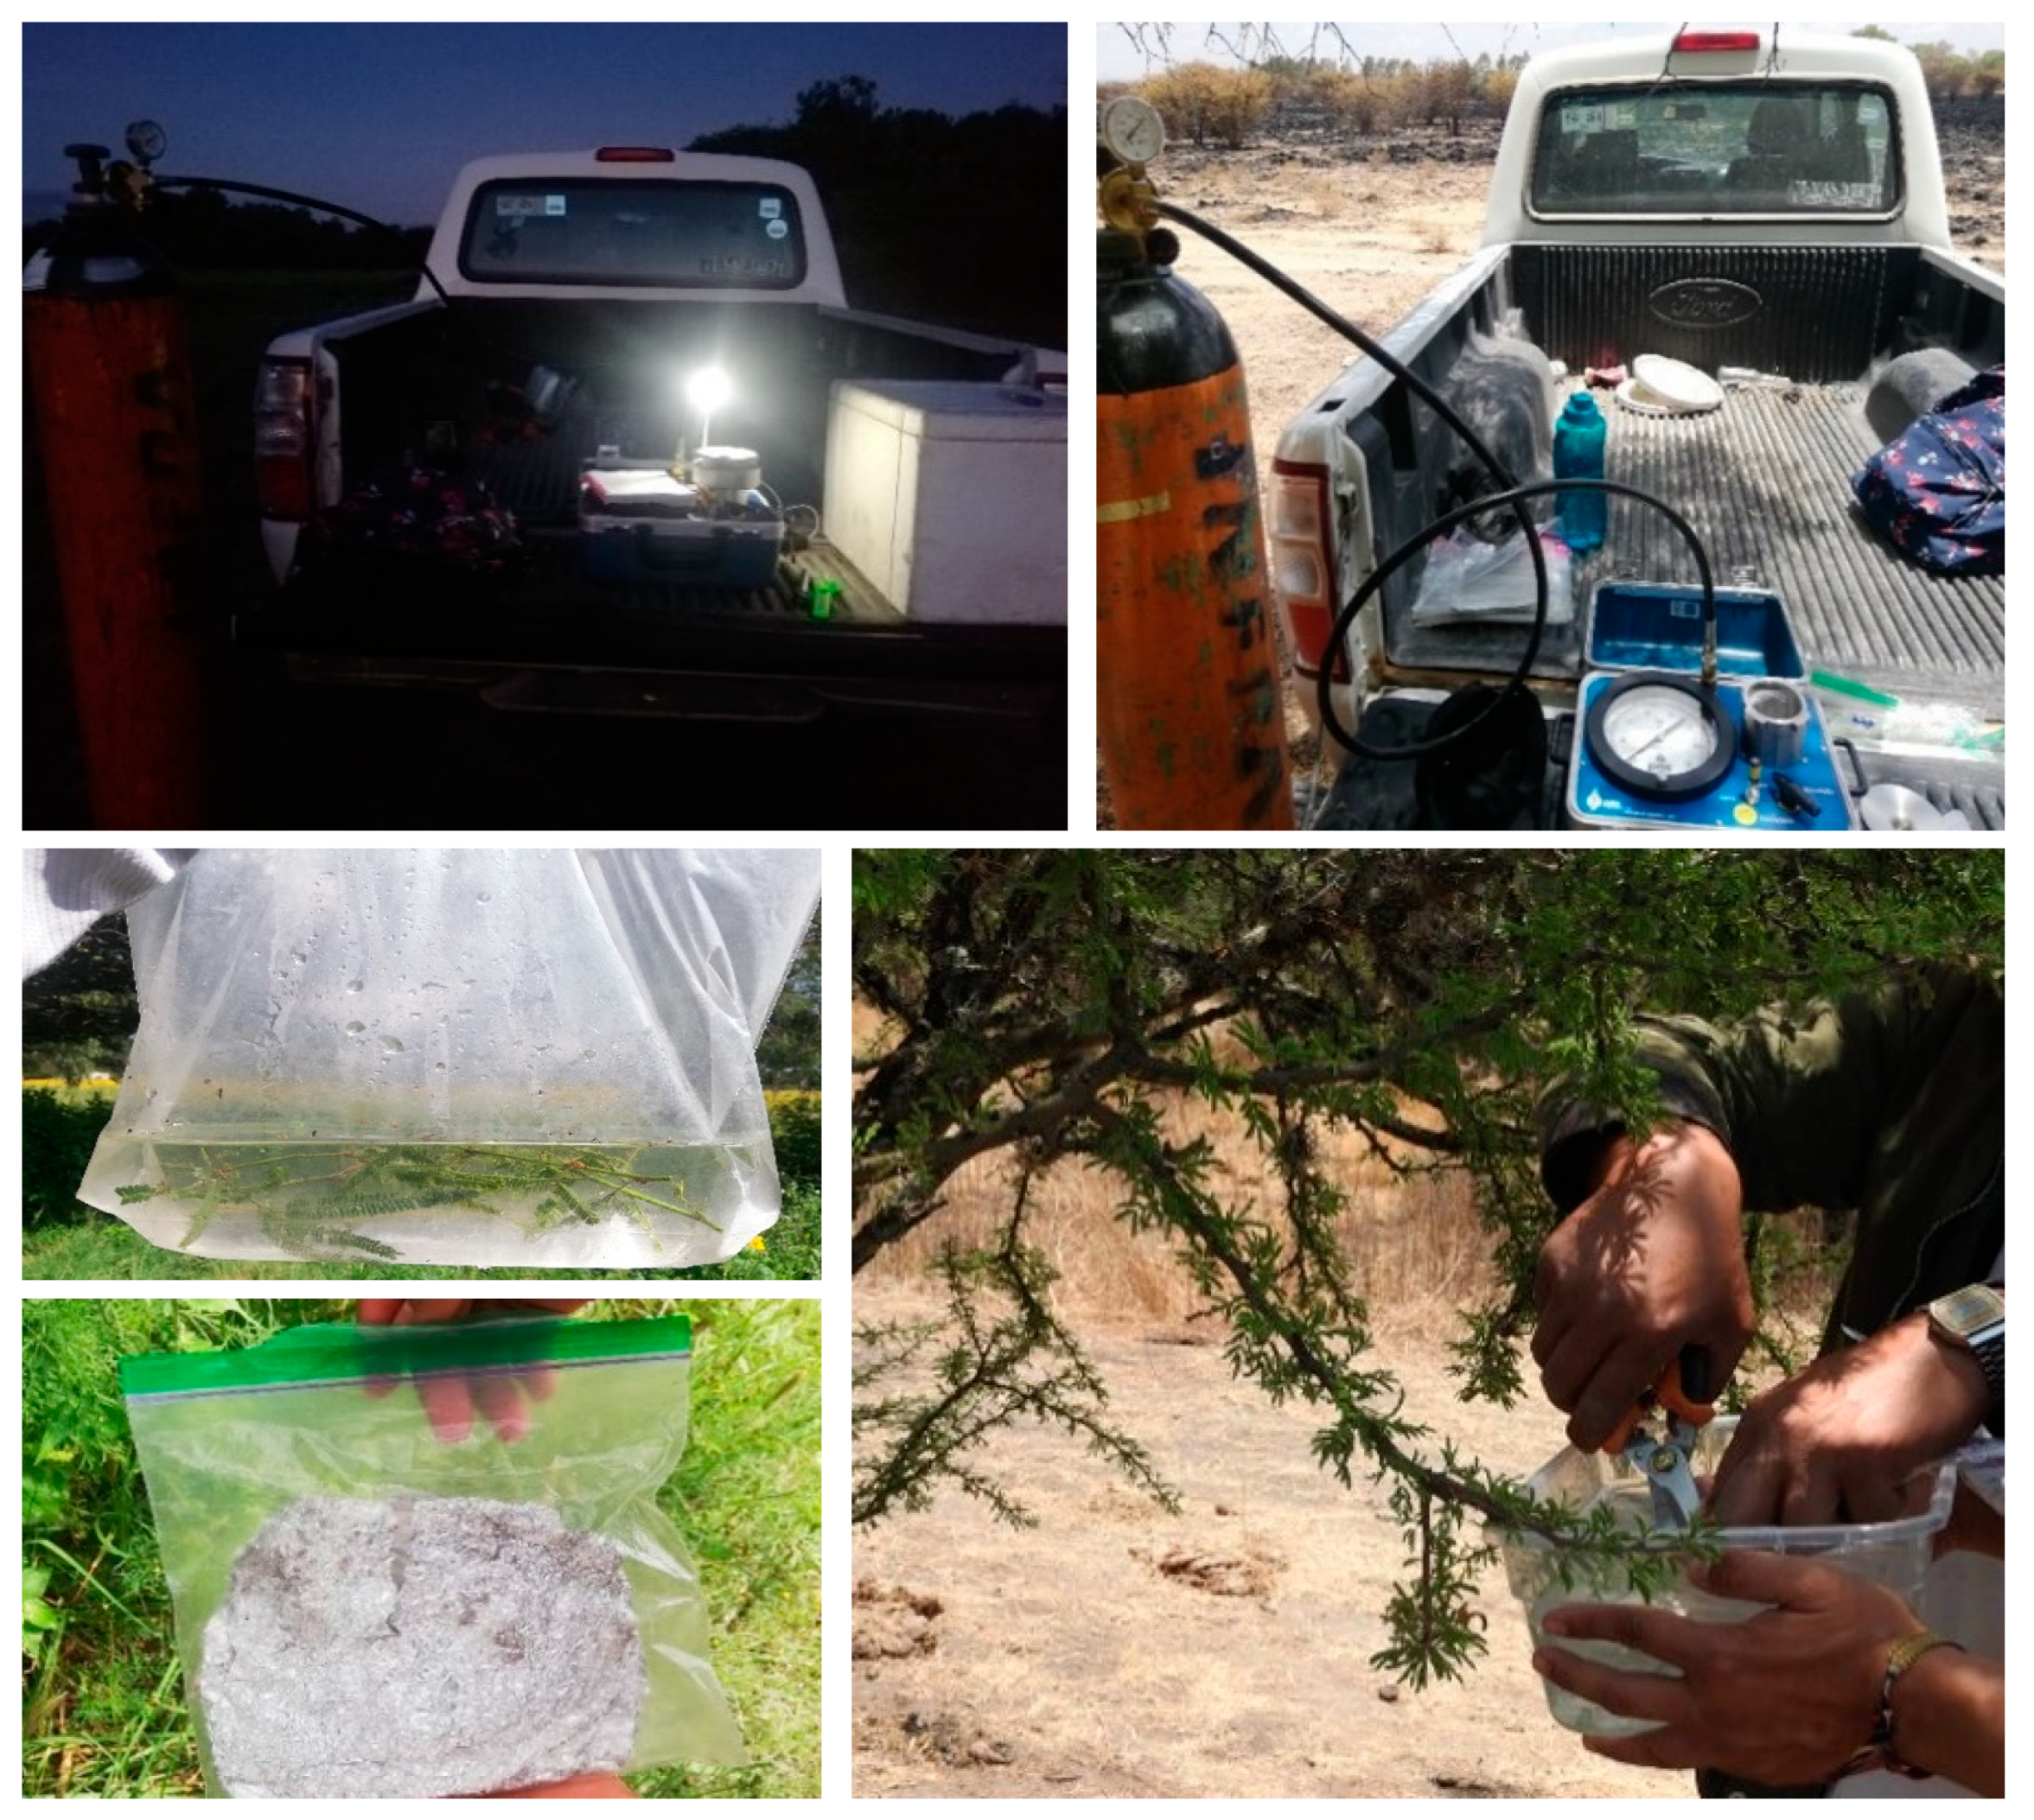
Figure 3.
(a) Daily vapor pressure deficit (VPD), air temperature, and rainfall, and (b) surface soil moisture (SM) in the upper 5 cm of soil, and root zone soil moisture (SMr), representing water and vapor availability to plants within the root zone (typically the upper 200 cm of soil) during the sampling year. The gray-shaded area indicates the study period.
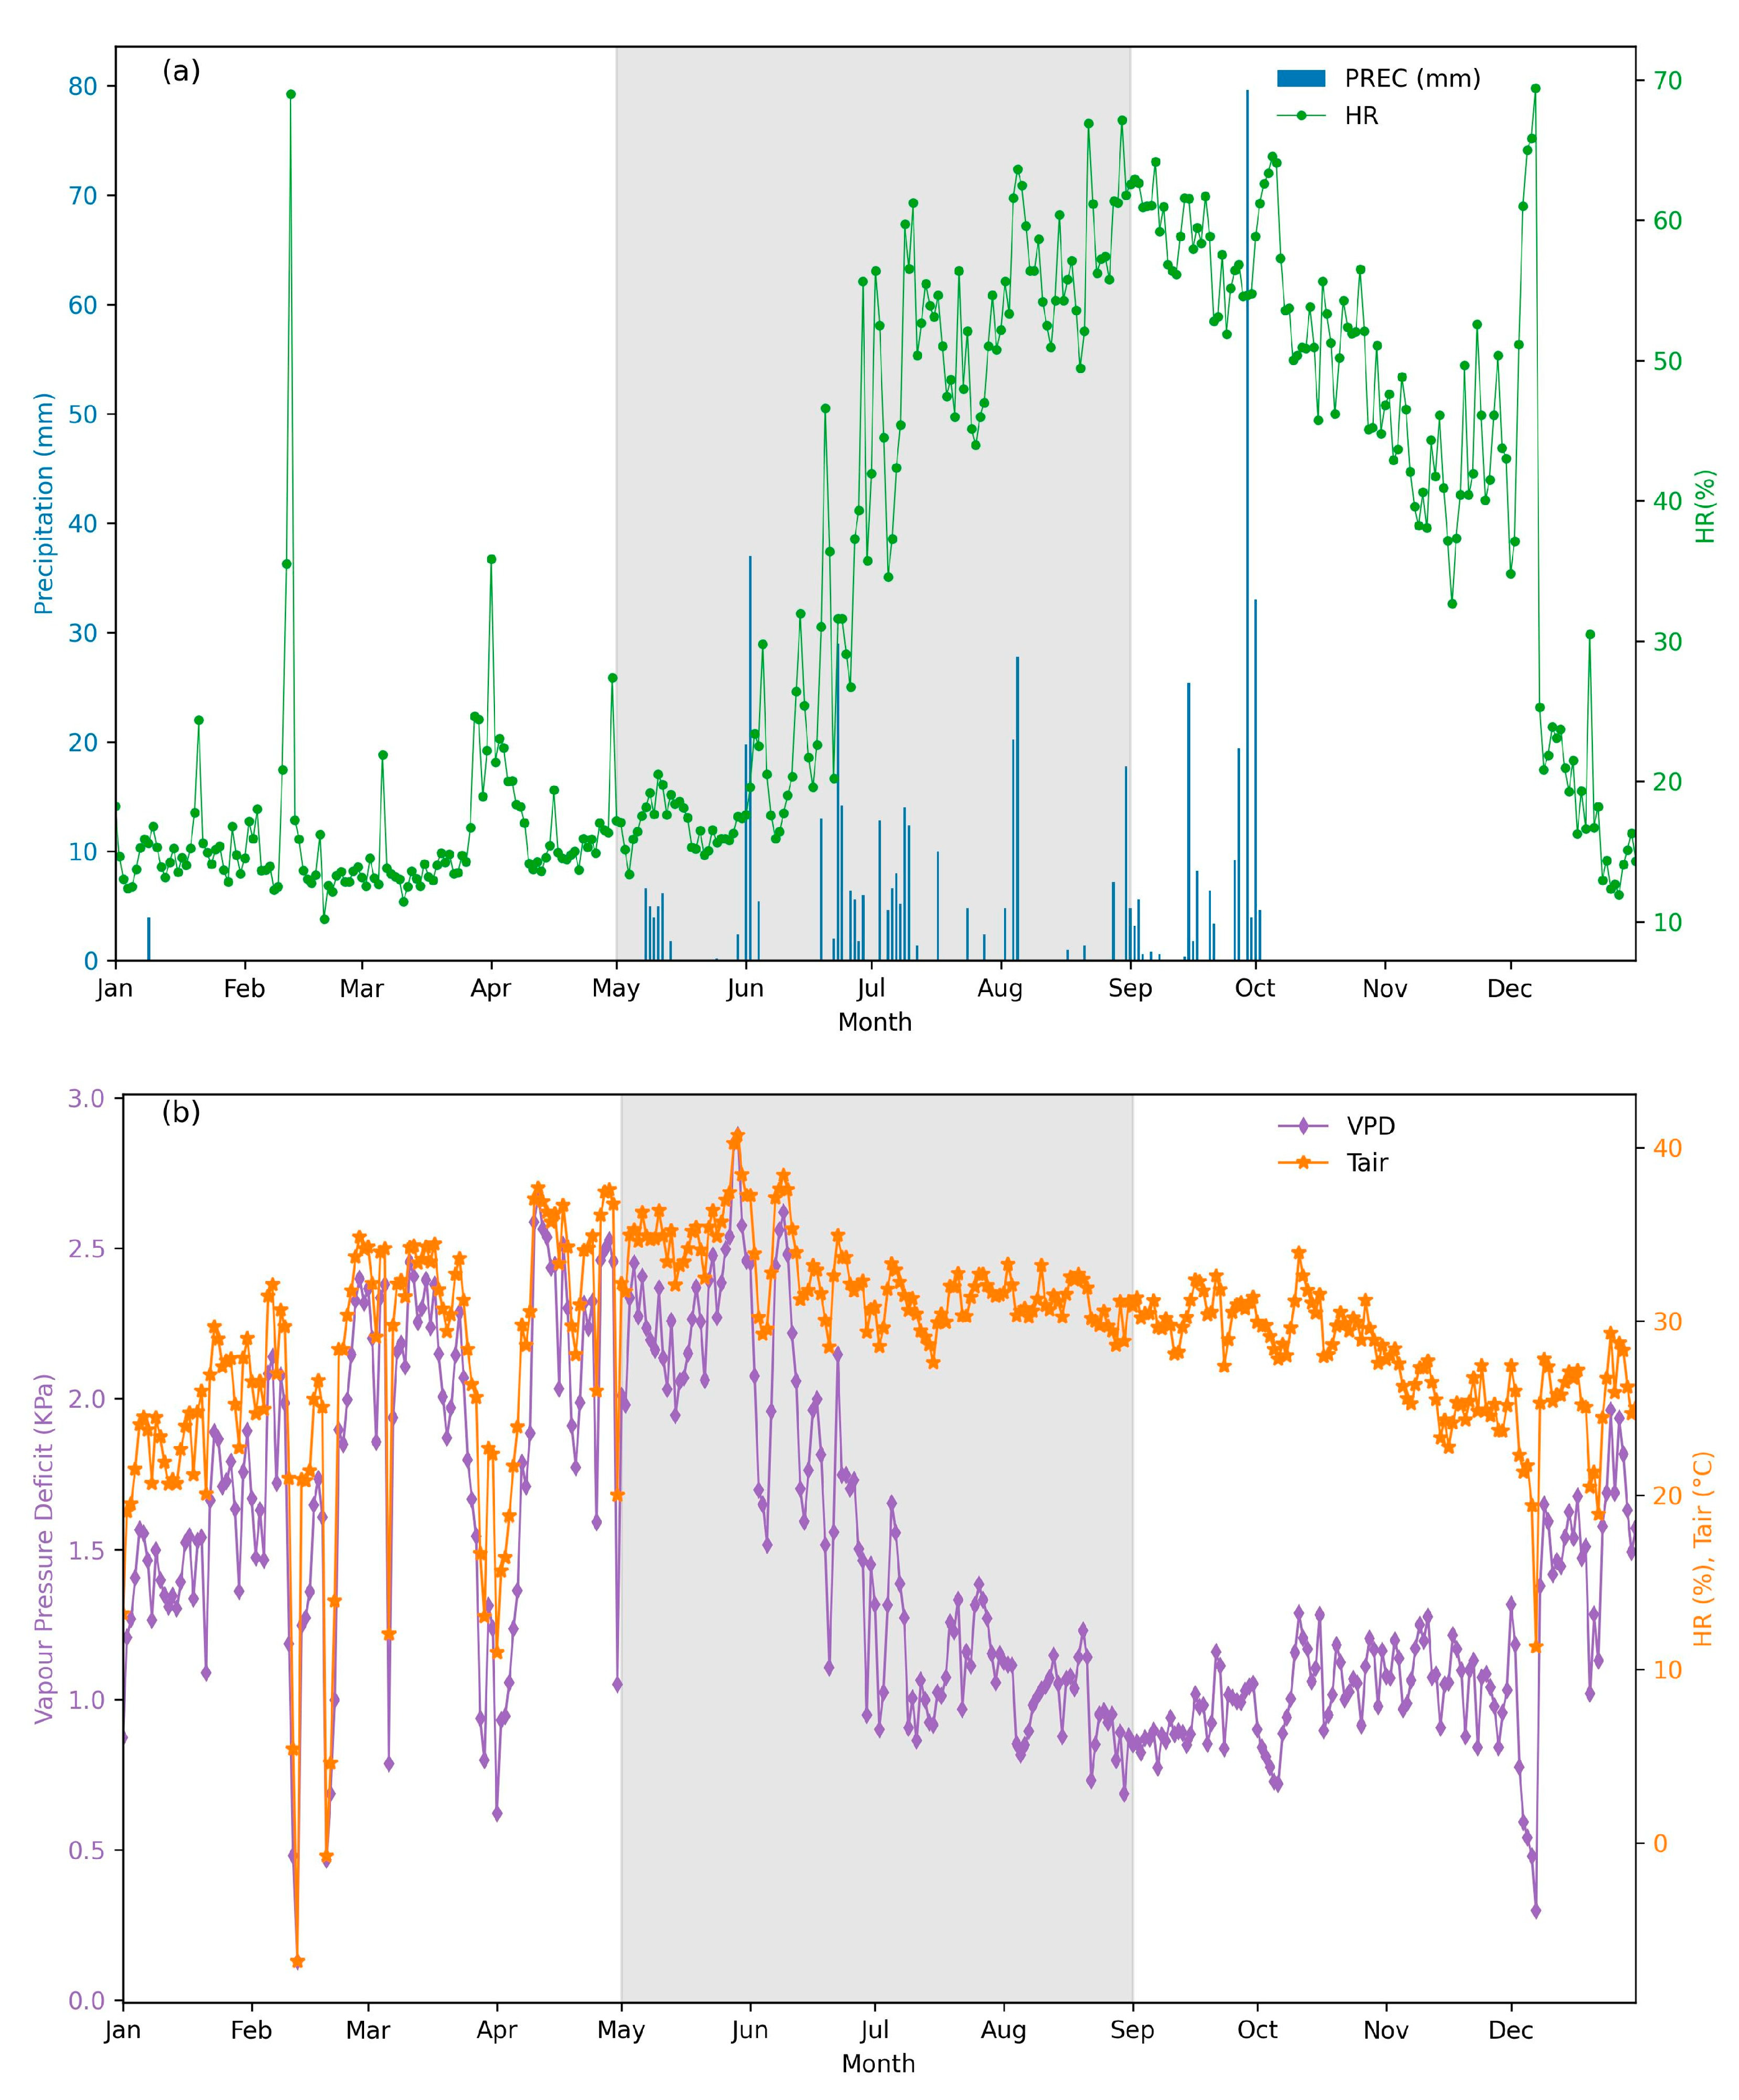
Figure 4.
Variation during the period of measurements in, (a) midday leaf water potential (Ψmd) and (b) predawn leaf water potential (Ψmd) for 3 species, with ± 1 SE shown. Measurements made at Santo Domingo Ranch site during the period May 2021 – Aug 2021.
Figure 4.
Variation during the period of measurements in, (a) midday leaf water potential (Ψmd) and (b) predawn leaf water potential (Ψmd) for 3 species, with ± 1 SE shown. Measurements made at Santo Domingo Ranch site during the period May 2021 – Aug 2021.
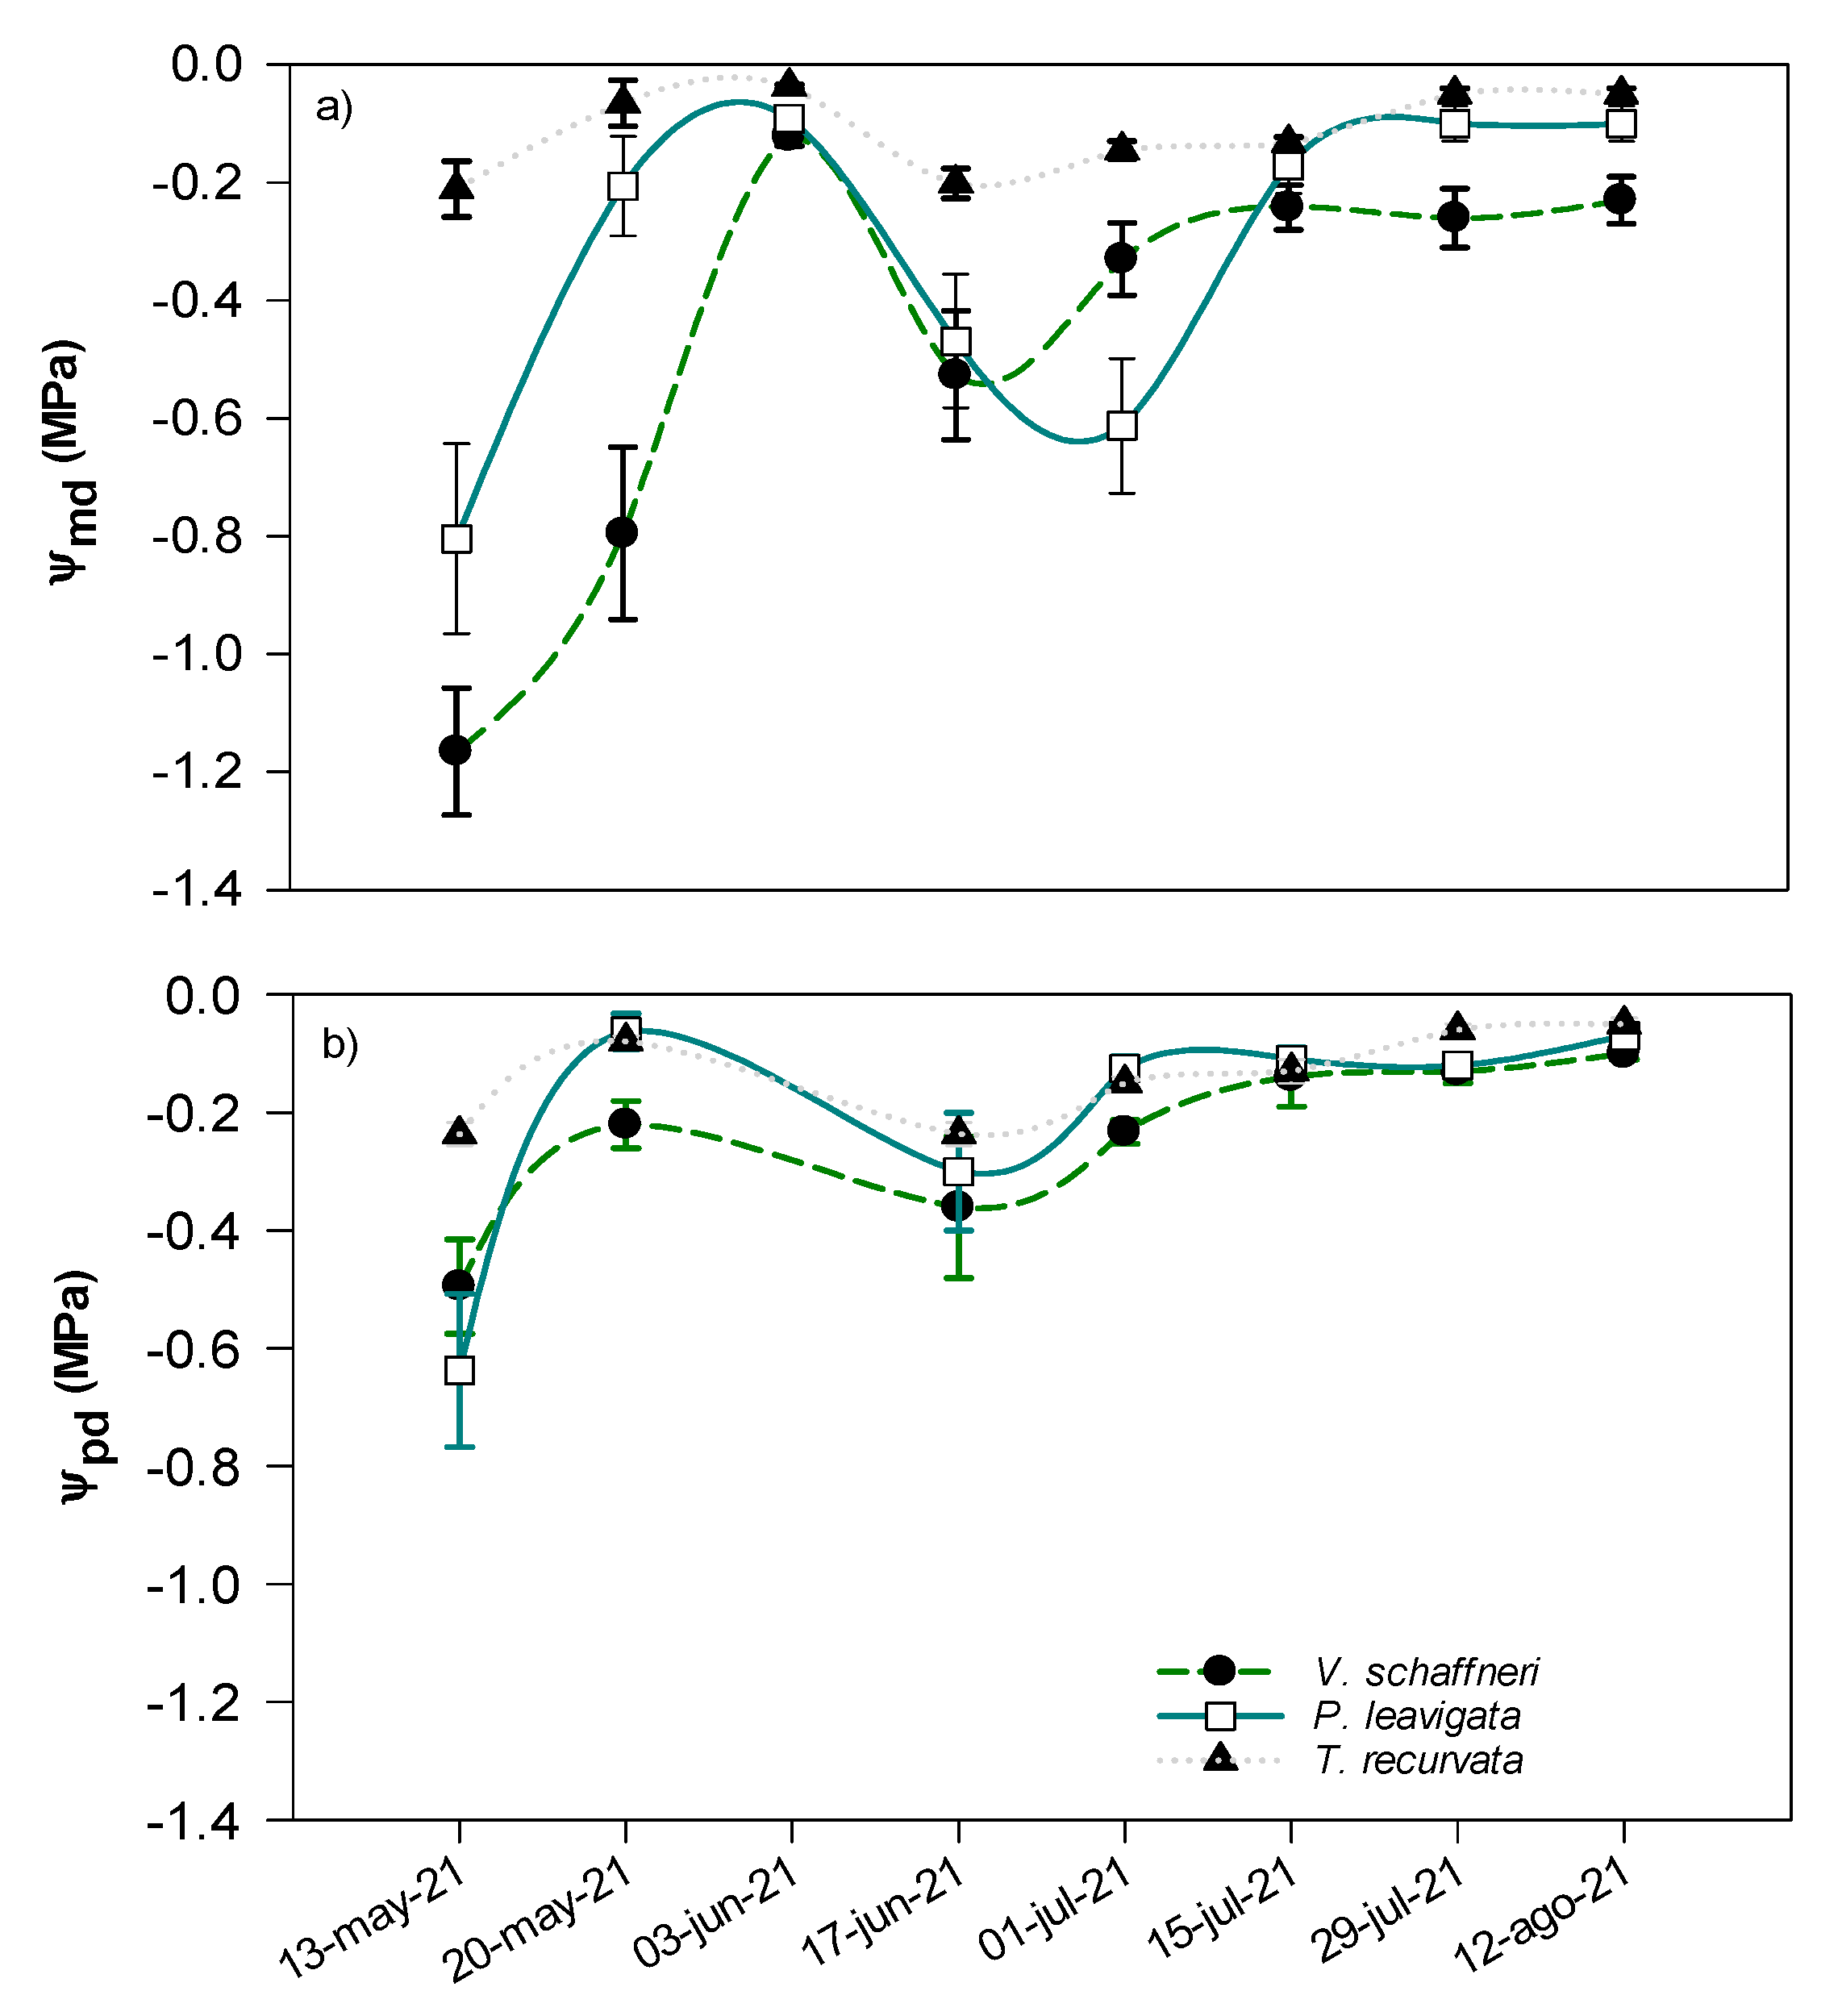
Figure 5.
Correlation matrix of predawn (Pd) and midday (Md) water potentials and environmental variables: vapor pressure deficit (VPD), relative humidity (HR), mean air temperature (Tair), and soil water content at three depths (0-10, 10-20, and 20-30 cm), in three plant species of a semiarid grassland, Vachellia schaffneri (Vs), Prosopis laevigata (Pl), and Tillandsia recurvata (Tr). ** stads for statistical significance (α = 0.05).
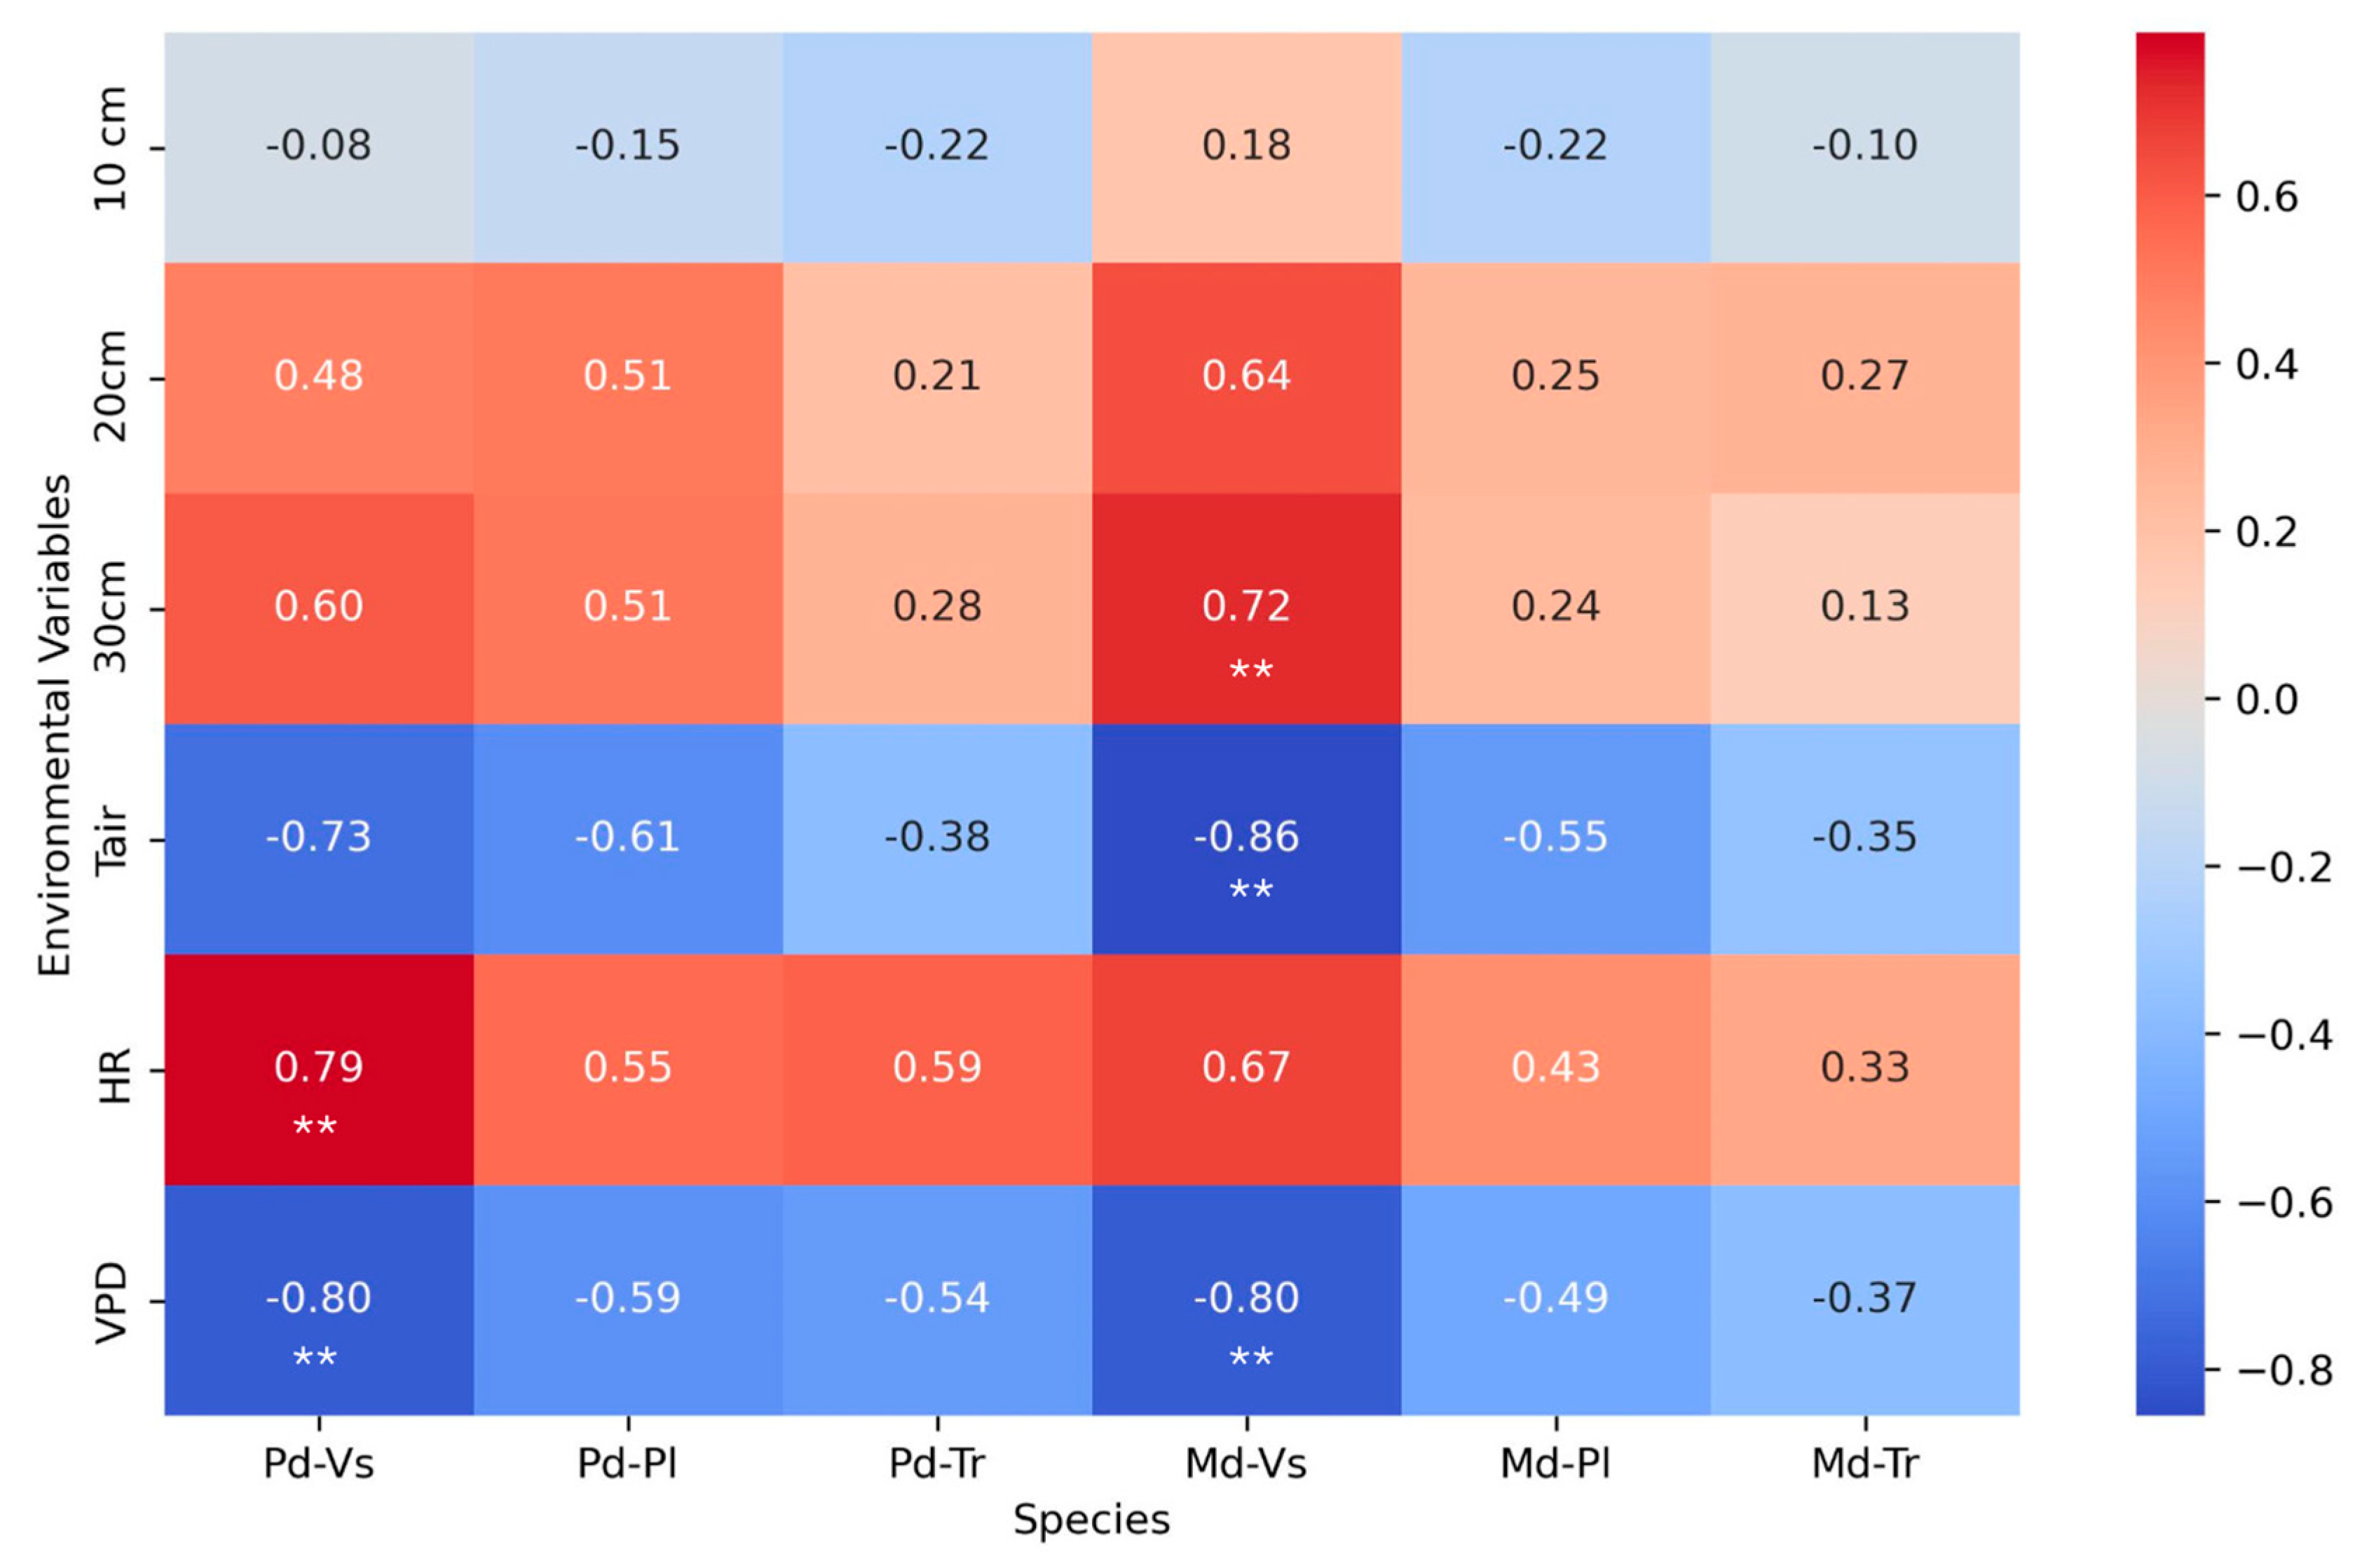
Figure 6.
(a) osmotic potential at full turgor (π0); (b) turgor loss point (ΨTLP); bulk modulus of elasticity (ε); and capacitance at turgor loss (CTLP) for the two woody and one epiphyte. Each bar represents a measurement time for the study period and the mean value, with ± 1 SE shown.
Figure 6.
(a) osmotic potential at full turgor (π0); (b) turgor loss point (ΨTLP); bulk modulus of elasticity (ε); and capacitance at turgor loss (CTLP) for the two woody and one epiphyte. Each bar represents a measurement time for the study period and the mean value, with ± 1 SE shown.
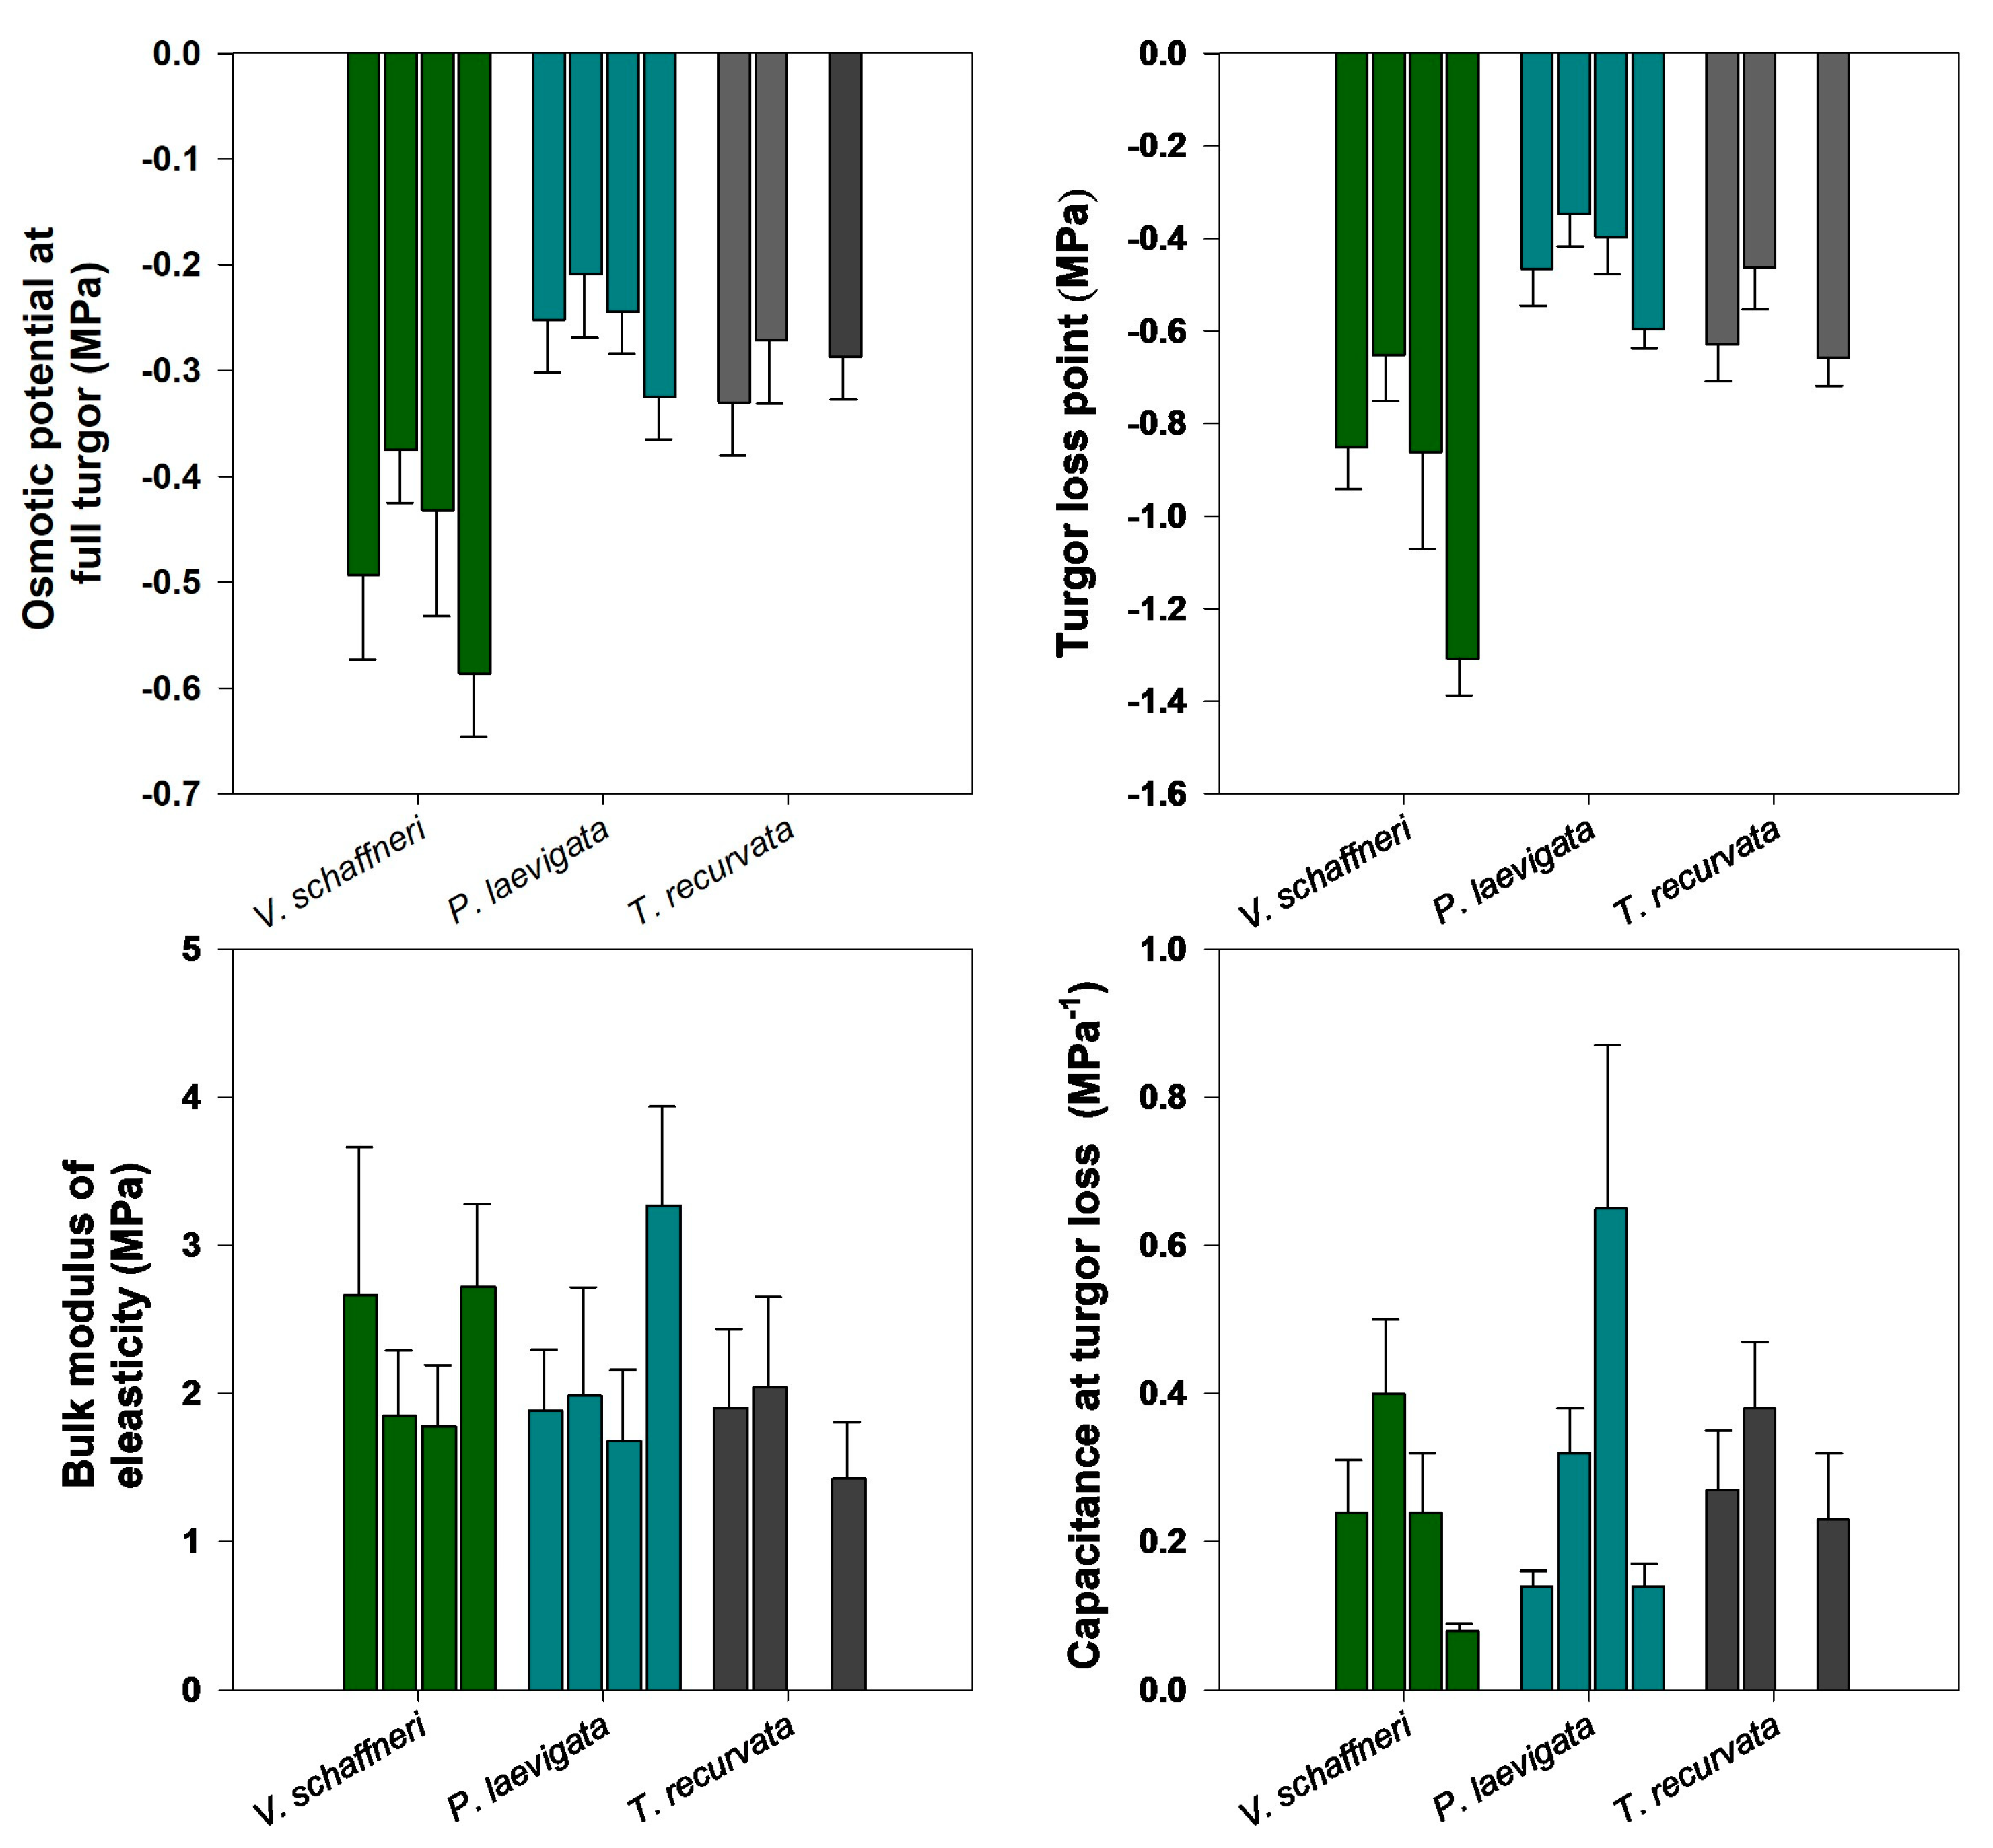
Figure 7.
Relationships between capacitance at full turgor (CFT) to other pressure volume parameters (a) water potential at turgor loss (CTLP); (b) osmotic potential at full turgor (π0); (c) bulk modulus of elasticity (ε); and (d) relationships between osmotic potential at full turgor (π0) and bulk modulus of elasticity (ε) for the two woody and one epiphyte.
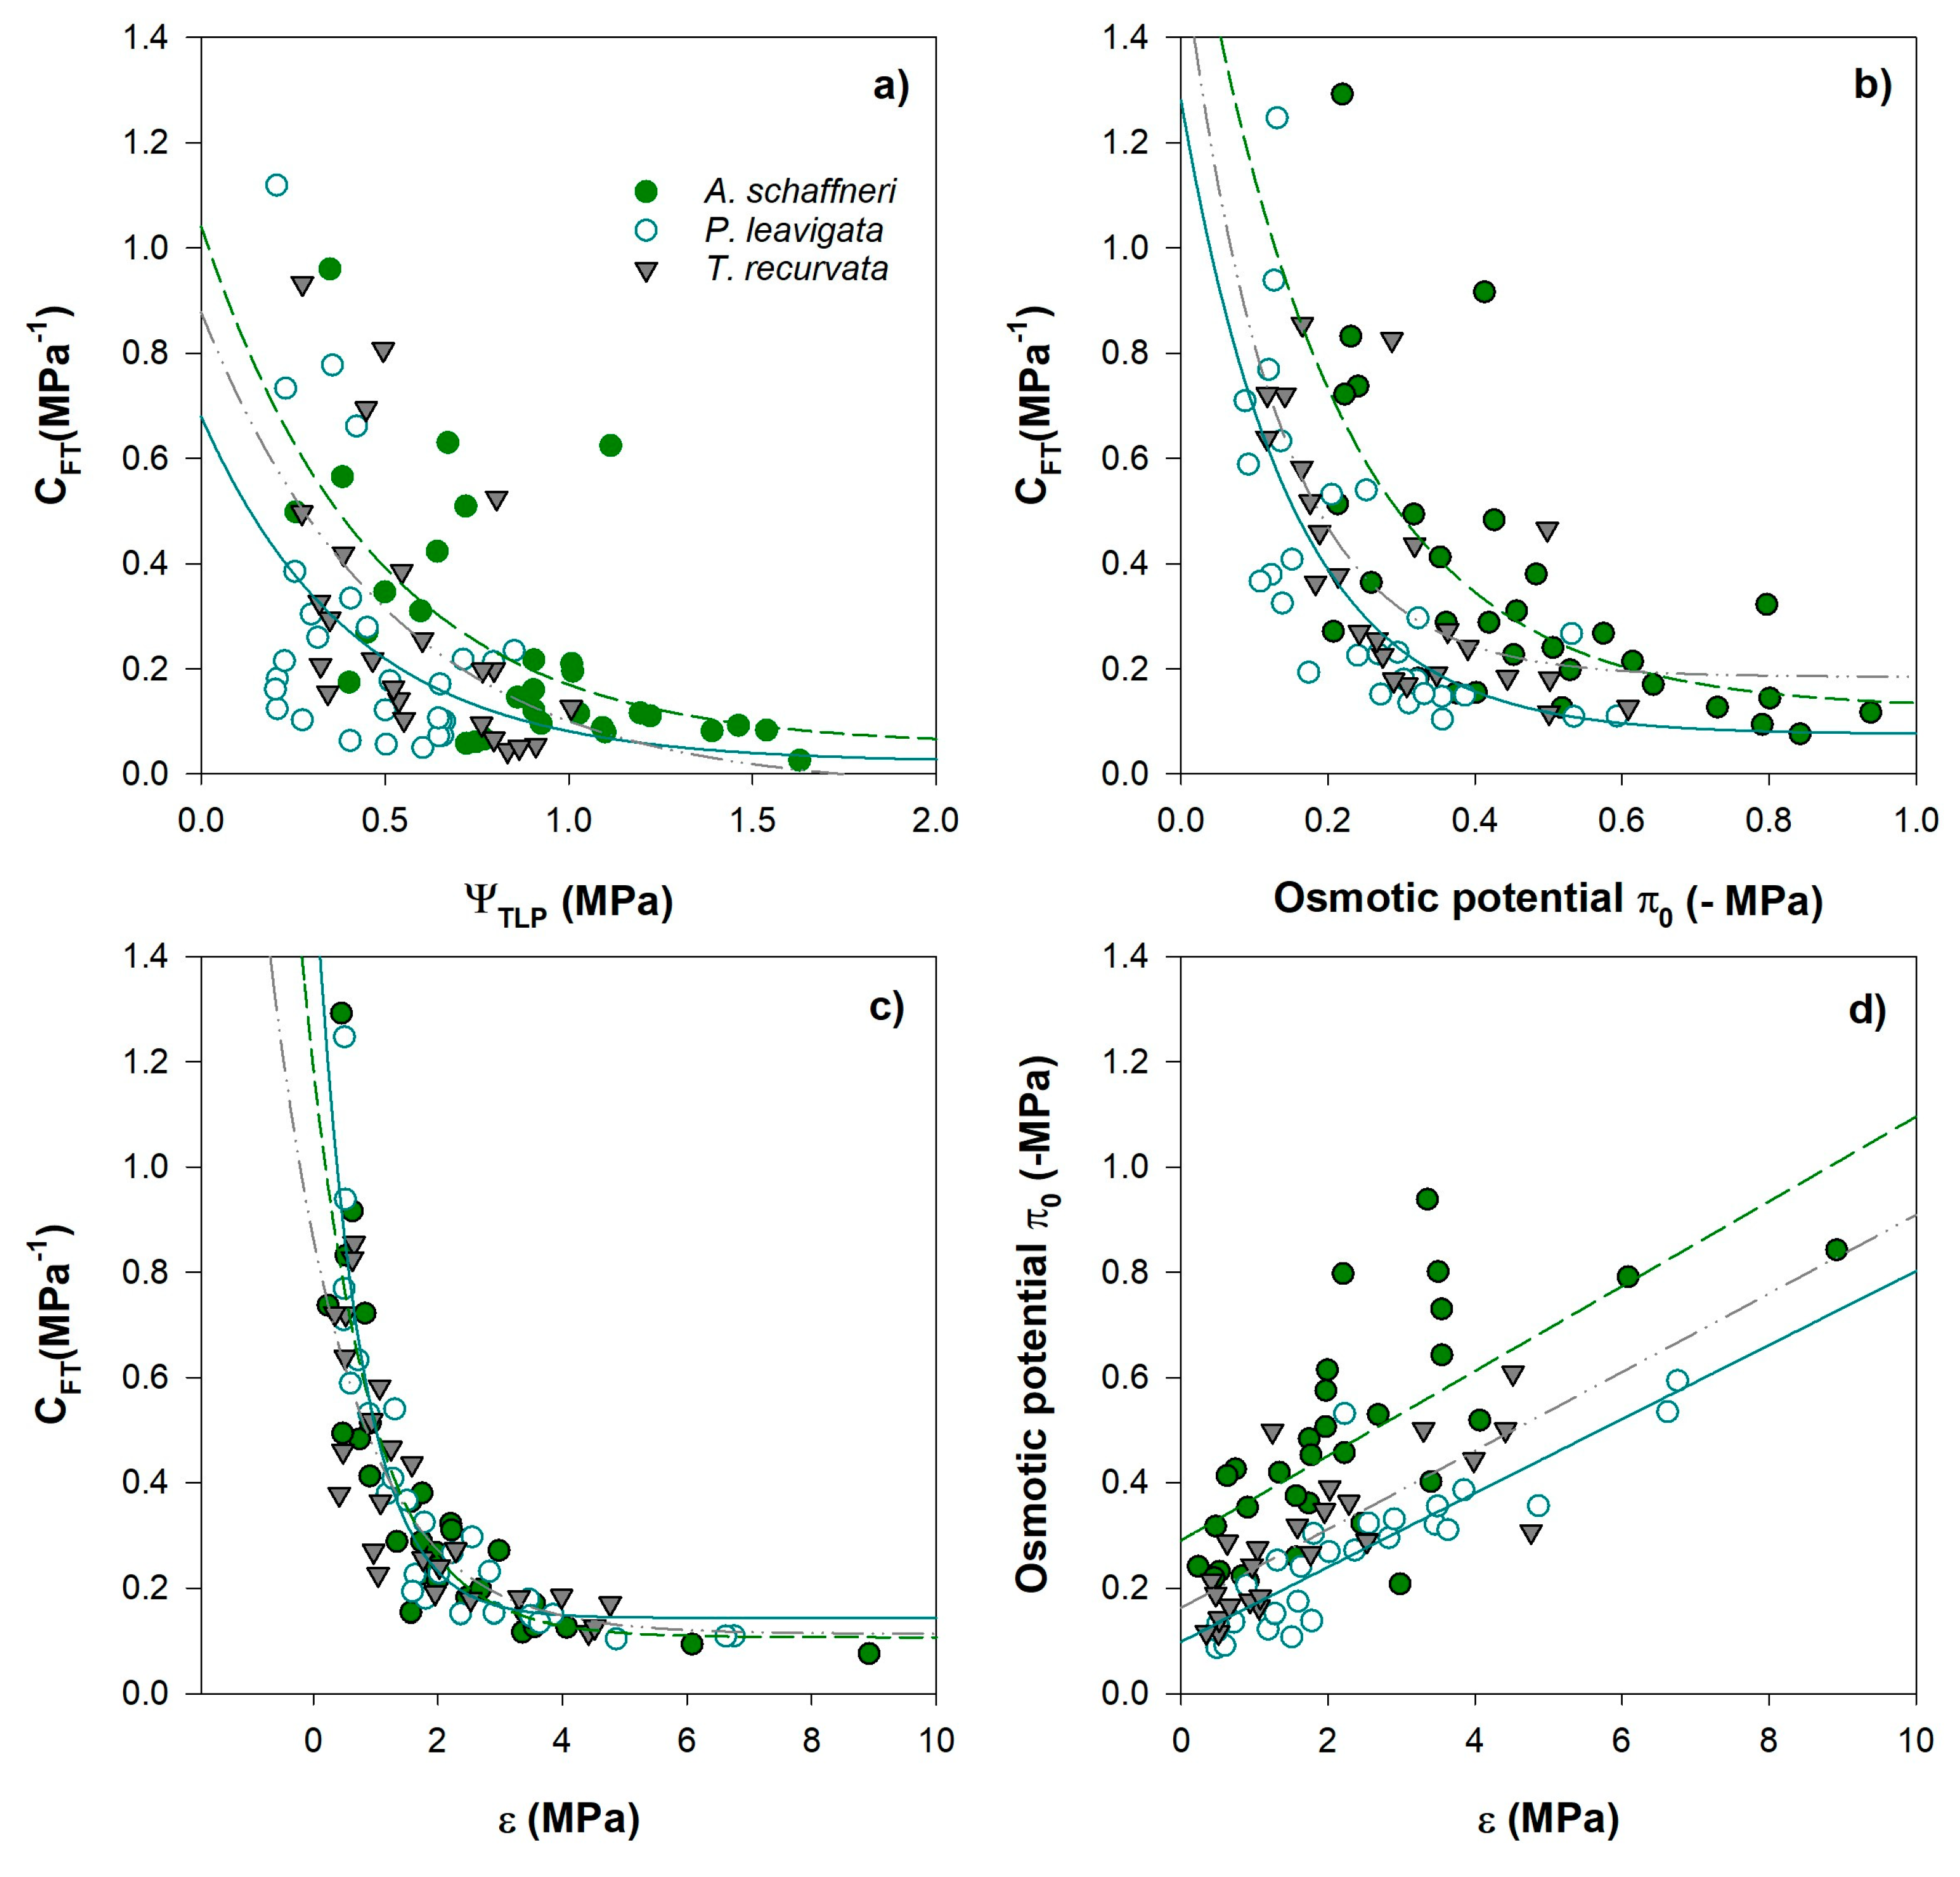
Figure 8.
Modelled moisture content of live fine fuels during fire weather. Moisture content was calculated at wilting point (Turgor Loss Point) for the three species. The MCTLP indicates how variation in hydraulic traits would influence moisture content under typical conditions of fires.
Figure 8.
Modelled moisture content of live fine fuels during fire weather. Moisture content was calculated at wilting point (Turgor Loss Point) for the three species. The MCTLP indicates how variation in hydraulic traits would influence moisture content under typical conditions of fires.
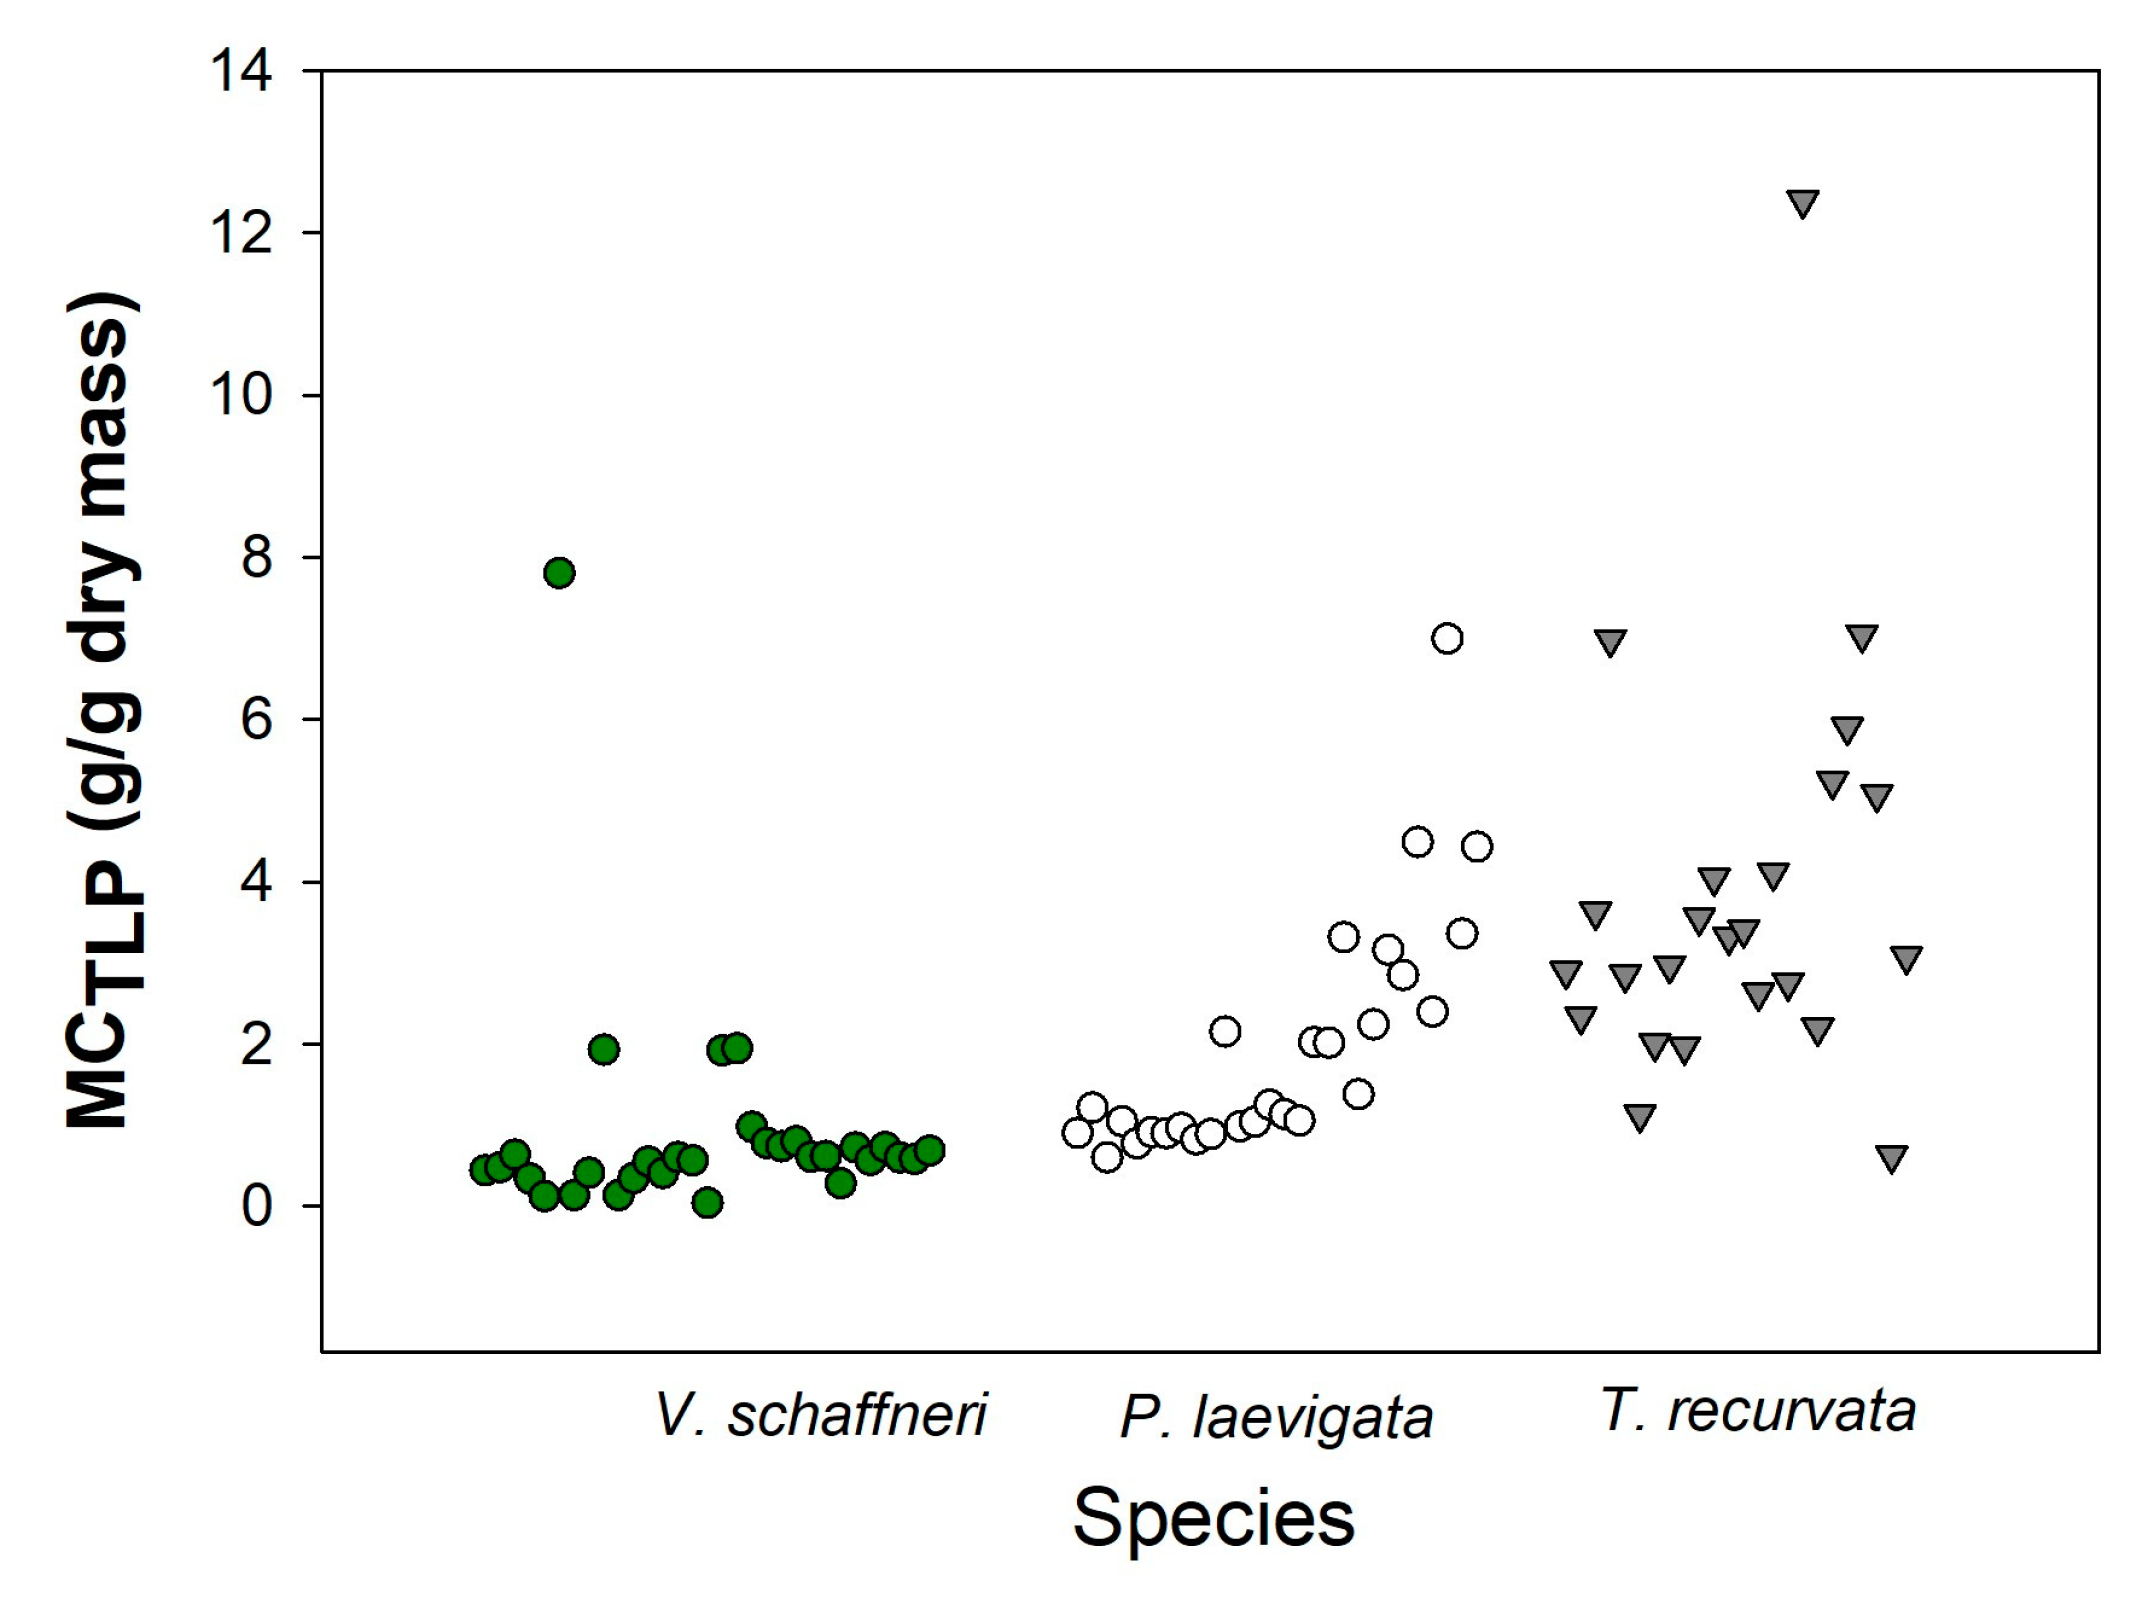

Table 1.
Mean values results ± SE from pressure-volume curves traits (SWC, saturated water content; RWCTLP, relative water content at turgor loss point; π0, osmotic potential; ΨTLP, water potential at turgor loss point; ε, bulk modulus of elasticity; CFT, capacitance at full turgor; CTLP, capacitance at turgor loss point) and moisture content at turgor loss point for the three species. Superscripts indicate results of 2x2 ANOVA: ns not significant, *p<0.05.
| Hydraulic Trait | ||||||||
|---|---|---|---|---|---|---|---|---|
| Specie |
MCTLP (g/g) |
SWC (%) |
IIo (MPa) |
ѰTLP (MPa) |
RWCTLP (%) |
ε* (MPa) |
CFT* (MPa-1) |
CTLP (MPa-1) |
|
V. schaffneri |
0.89 ± 0.35 | 1.12 ± 0.39 | -0.47 ± 0.07 | -0.91 ± 0.12 | 76.17 ± 3.87 | 2.25 ± 0.60 | 12.94 ± 0.08 | 0.24 ± 0.06 |
|
P. laevigata |
1.99 ± 0.29 | 2.28 ± 0.31 | -0.25 ± 0.04 | -0.45 ± 0.06 | 87.63 ± 2.11 | 2.20 ± 0.57 | 28.03 ± 0.11 | 0.31 ± 0.08 |
|
T. recurvata |
3.84 ± 0.71 | 3.67 ±0.82 | -0.33 ± 0.05 | -0.63 ± 0.08 | 81.53 ± 2.41 | 1.91 ± 0.51 | 21.48 ± 0.08 | 0.27 ± 0.08 |
Disclaimer/Publisher’s Note: The statements, opinions and data contained in all publications are solely those of the individual author(s) and contributor(s) and not of MDPI and/or the editor(s). MDPI and/or the editor(s) disclaim responsibility for any injury to people or property resulting from any ideas, methods, instructions or products referred to in the content. |
© 2025 by the authors. Licensee MDPI, Basel, Switzerland. This article is an open access article distributed under the terms and conditions of the Creative Commons Attribution (CC BY) license (http://creativecommons.org/licenses/by/4.0/).
Copyright: This open access article is published under a Creative Commons CC BY 4.0 license, which permit the free download, distribution, and reuse, provided that the author and preprint are cited in any reuse.


