Preprint
Article

This version is not peer-reviewed.

Contrast Volume Reduction in Oncologic Body Imaging Using Dual-Energy CT: A Comparison with Single-Energy CT

A peer-reviewed article of this preprint also exists.

Submitted:

06 February 2025

Posted:

06 February 2025

You are already at the latest version

Abstract

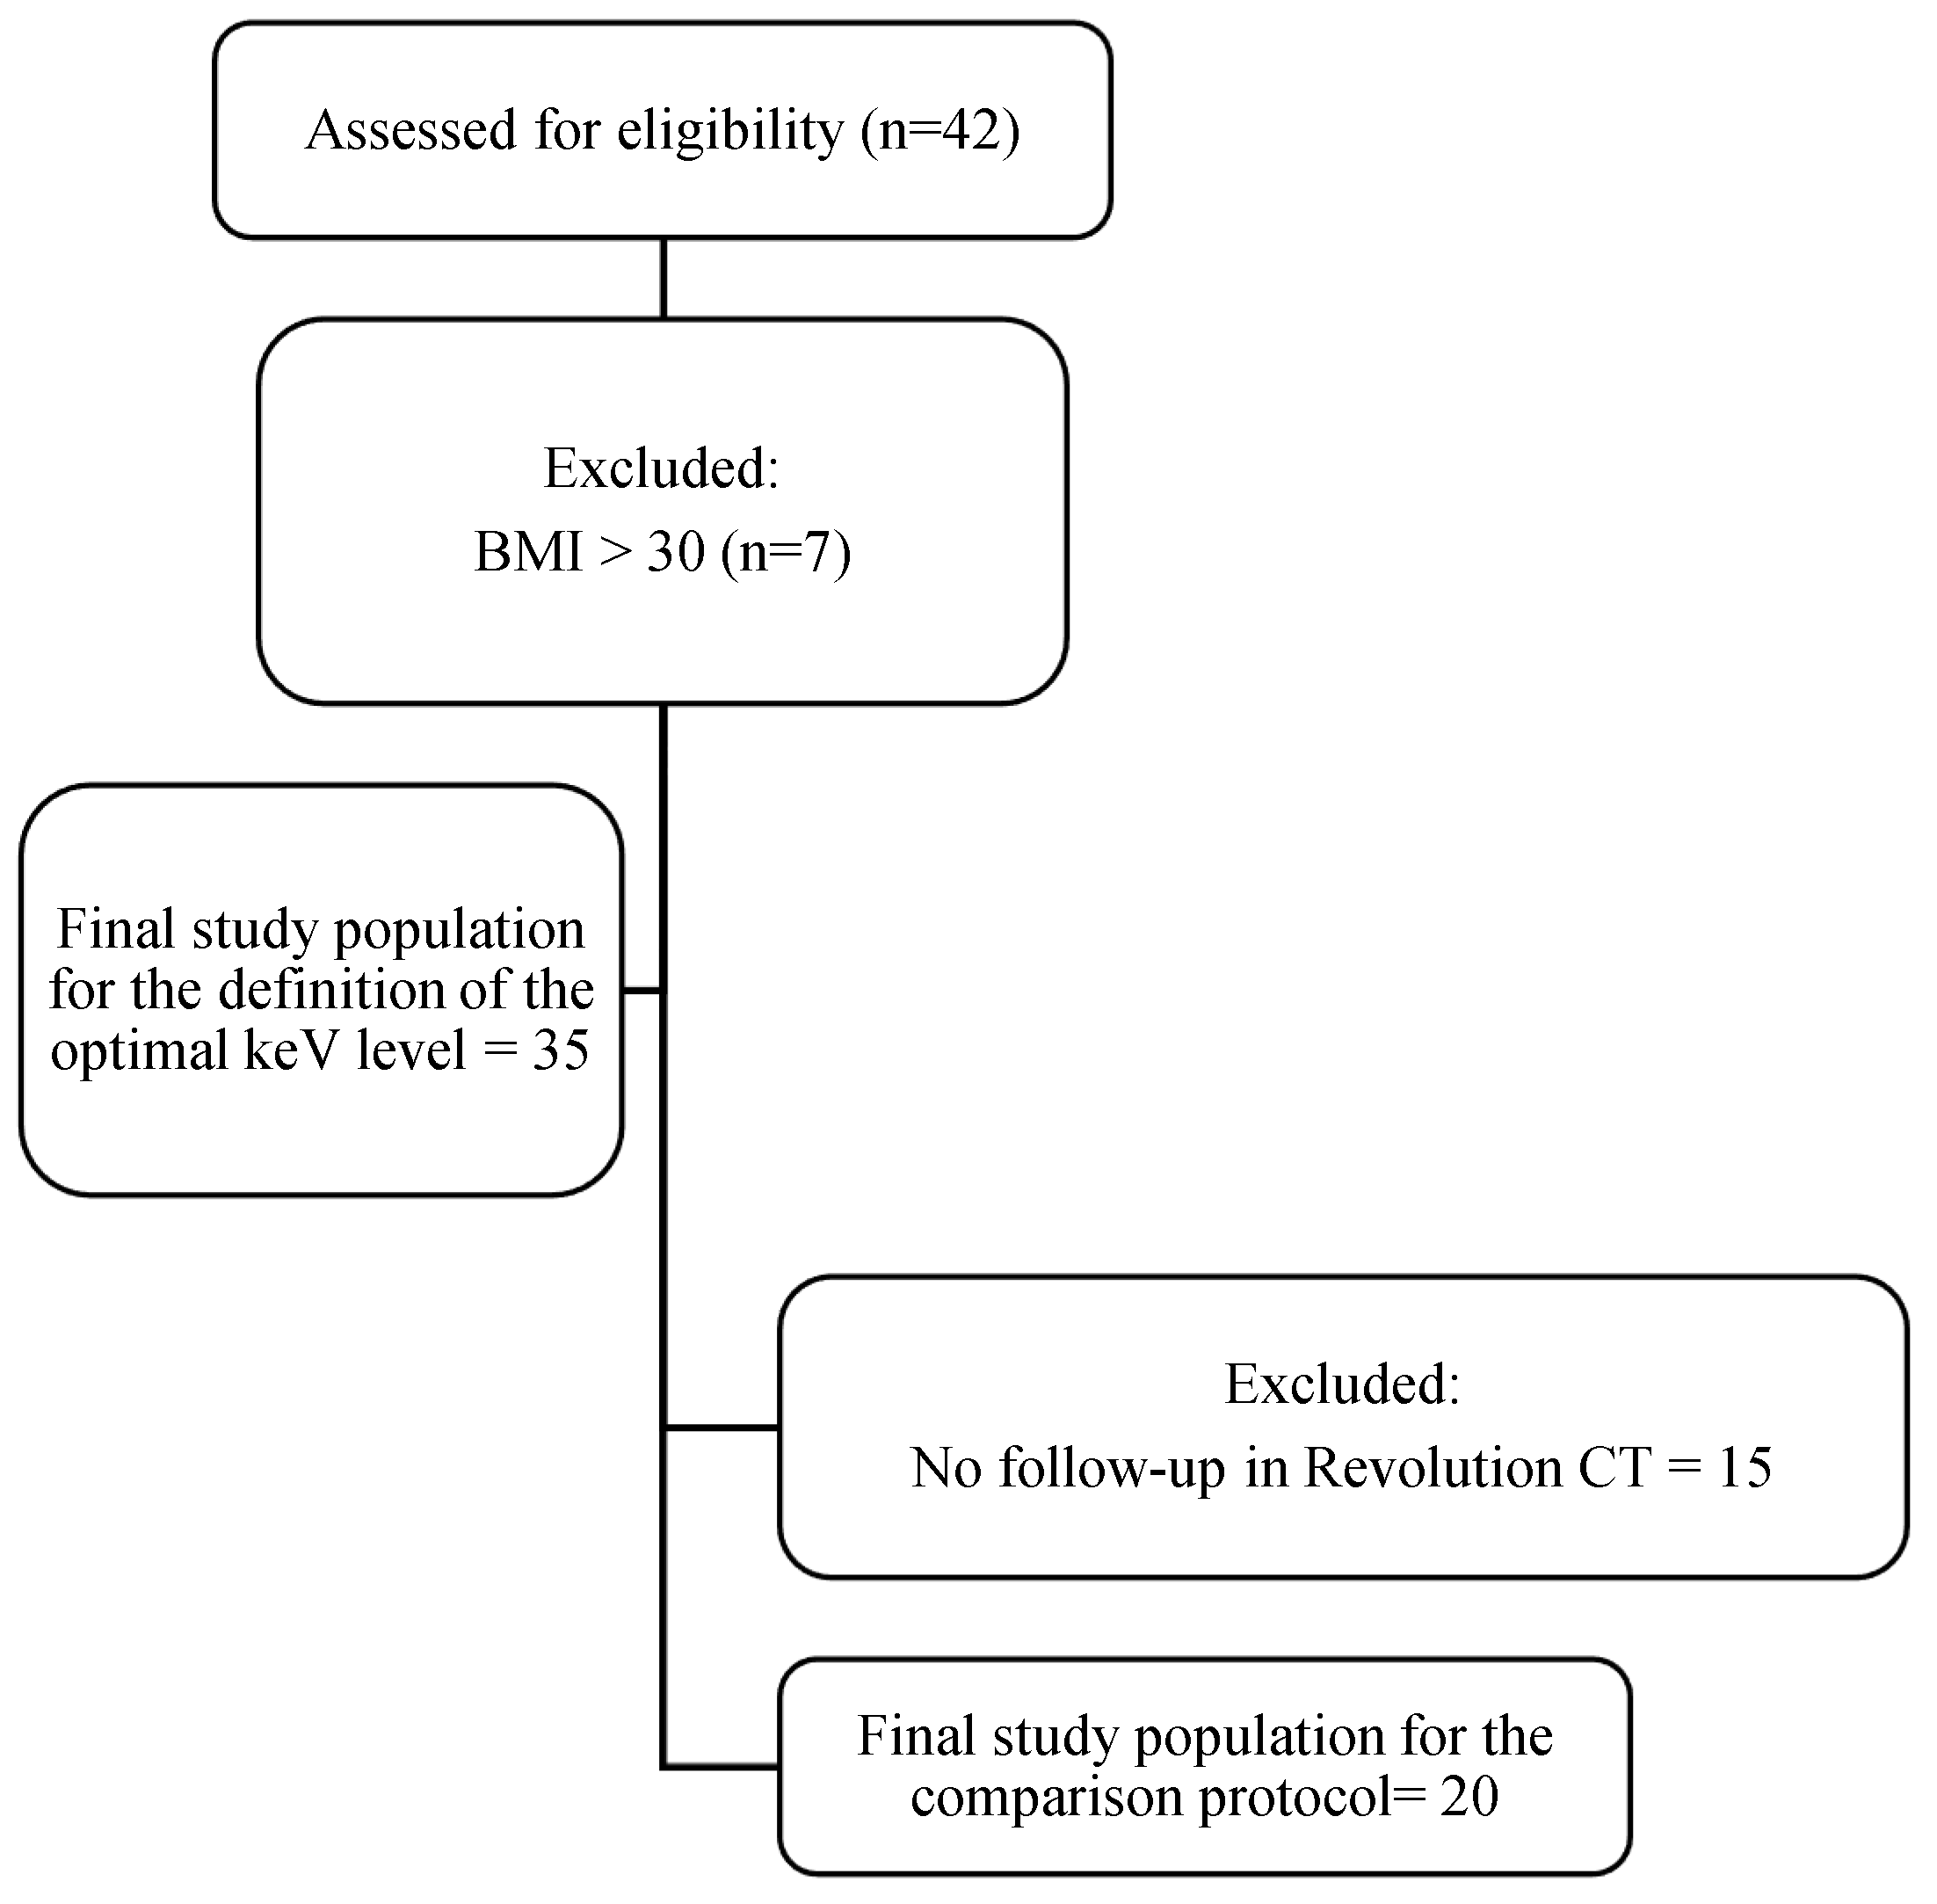
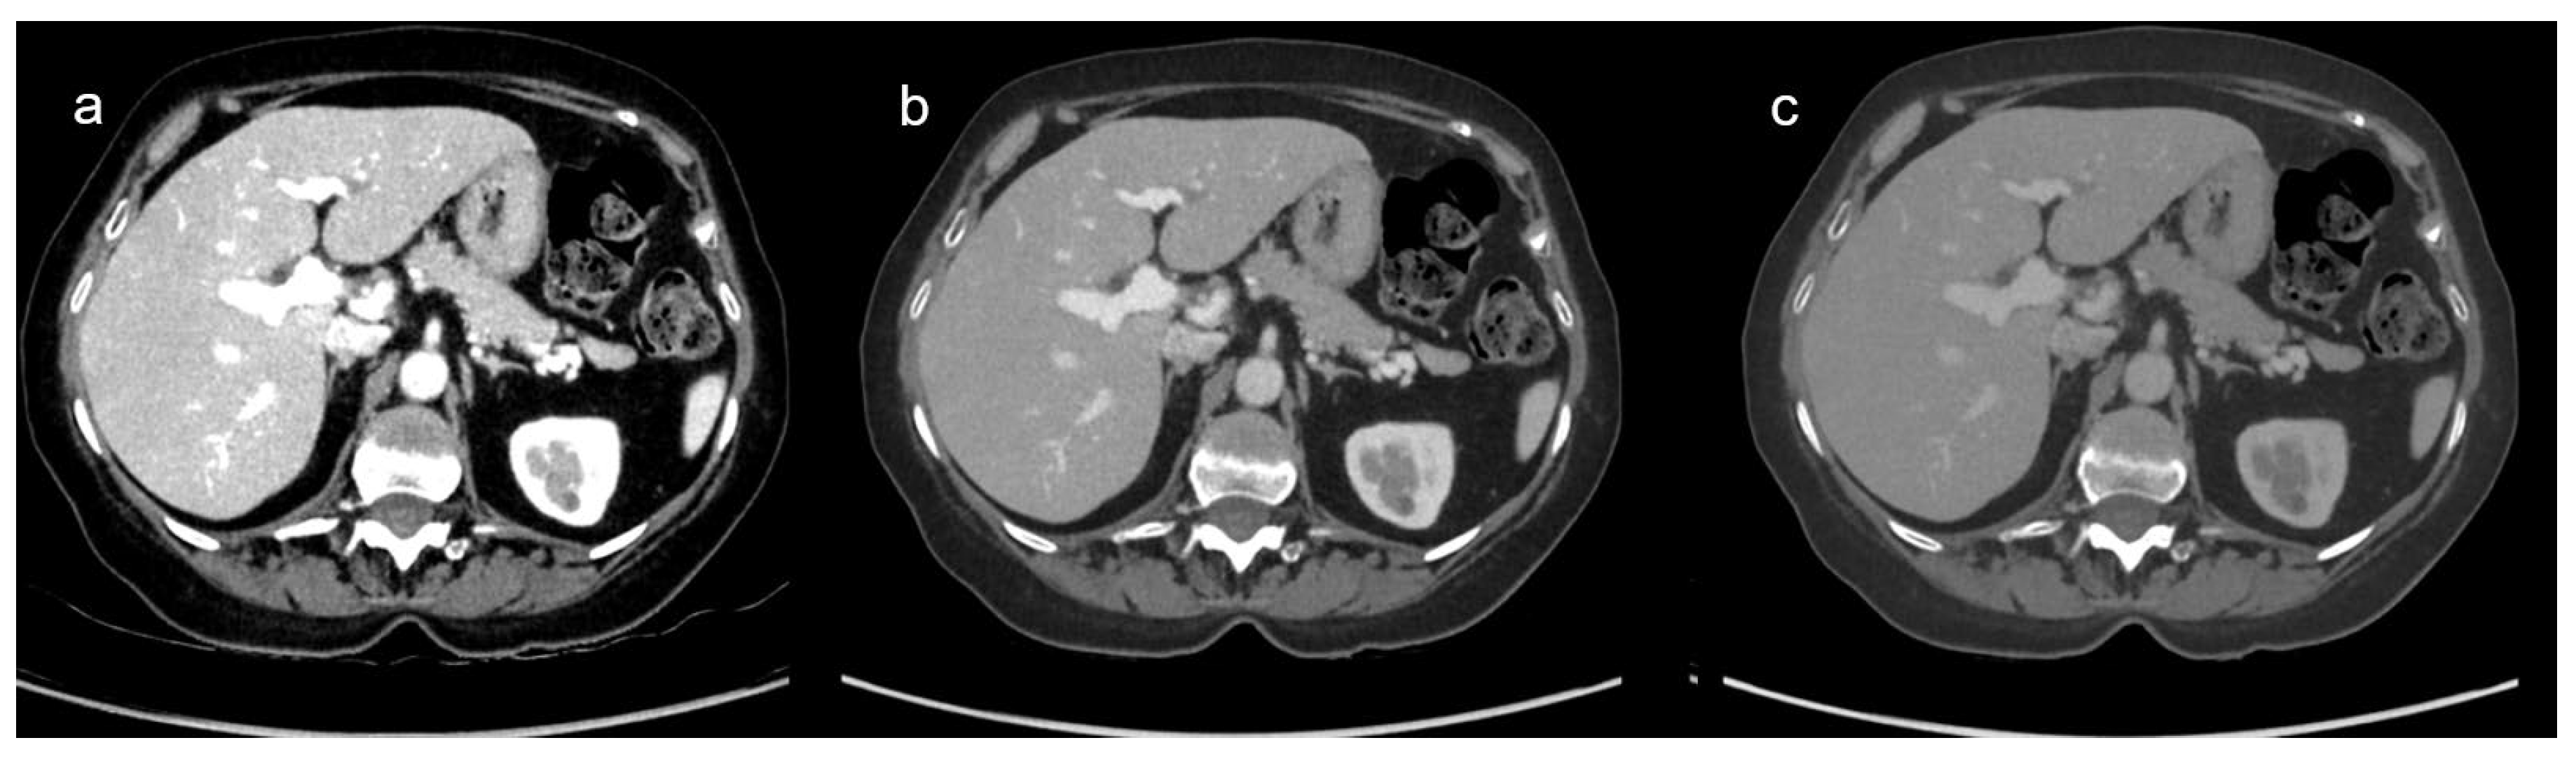
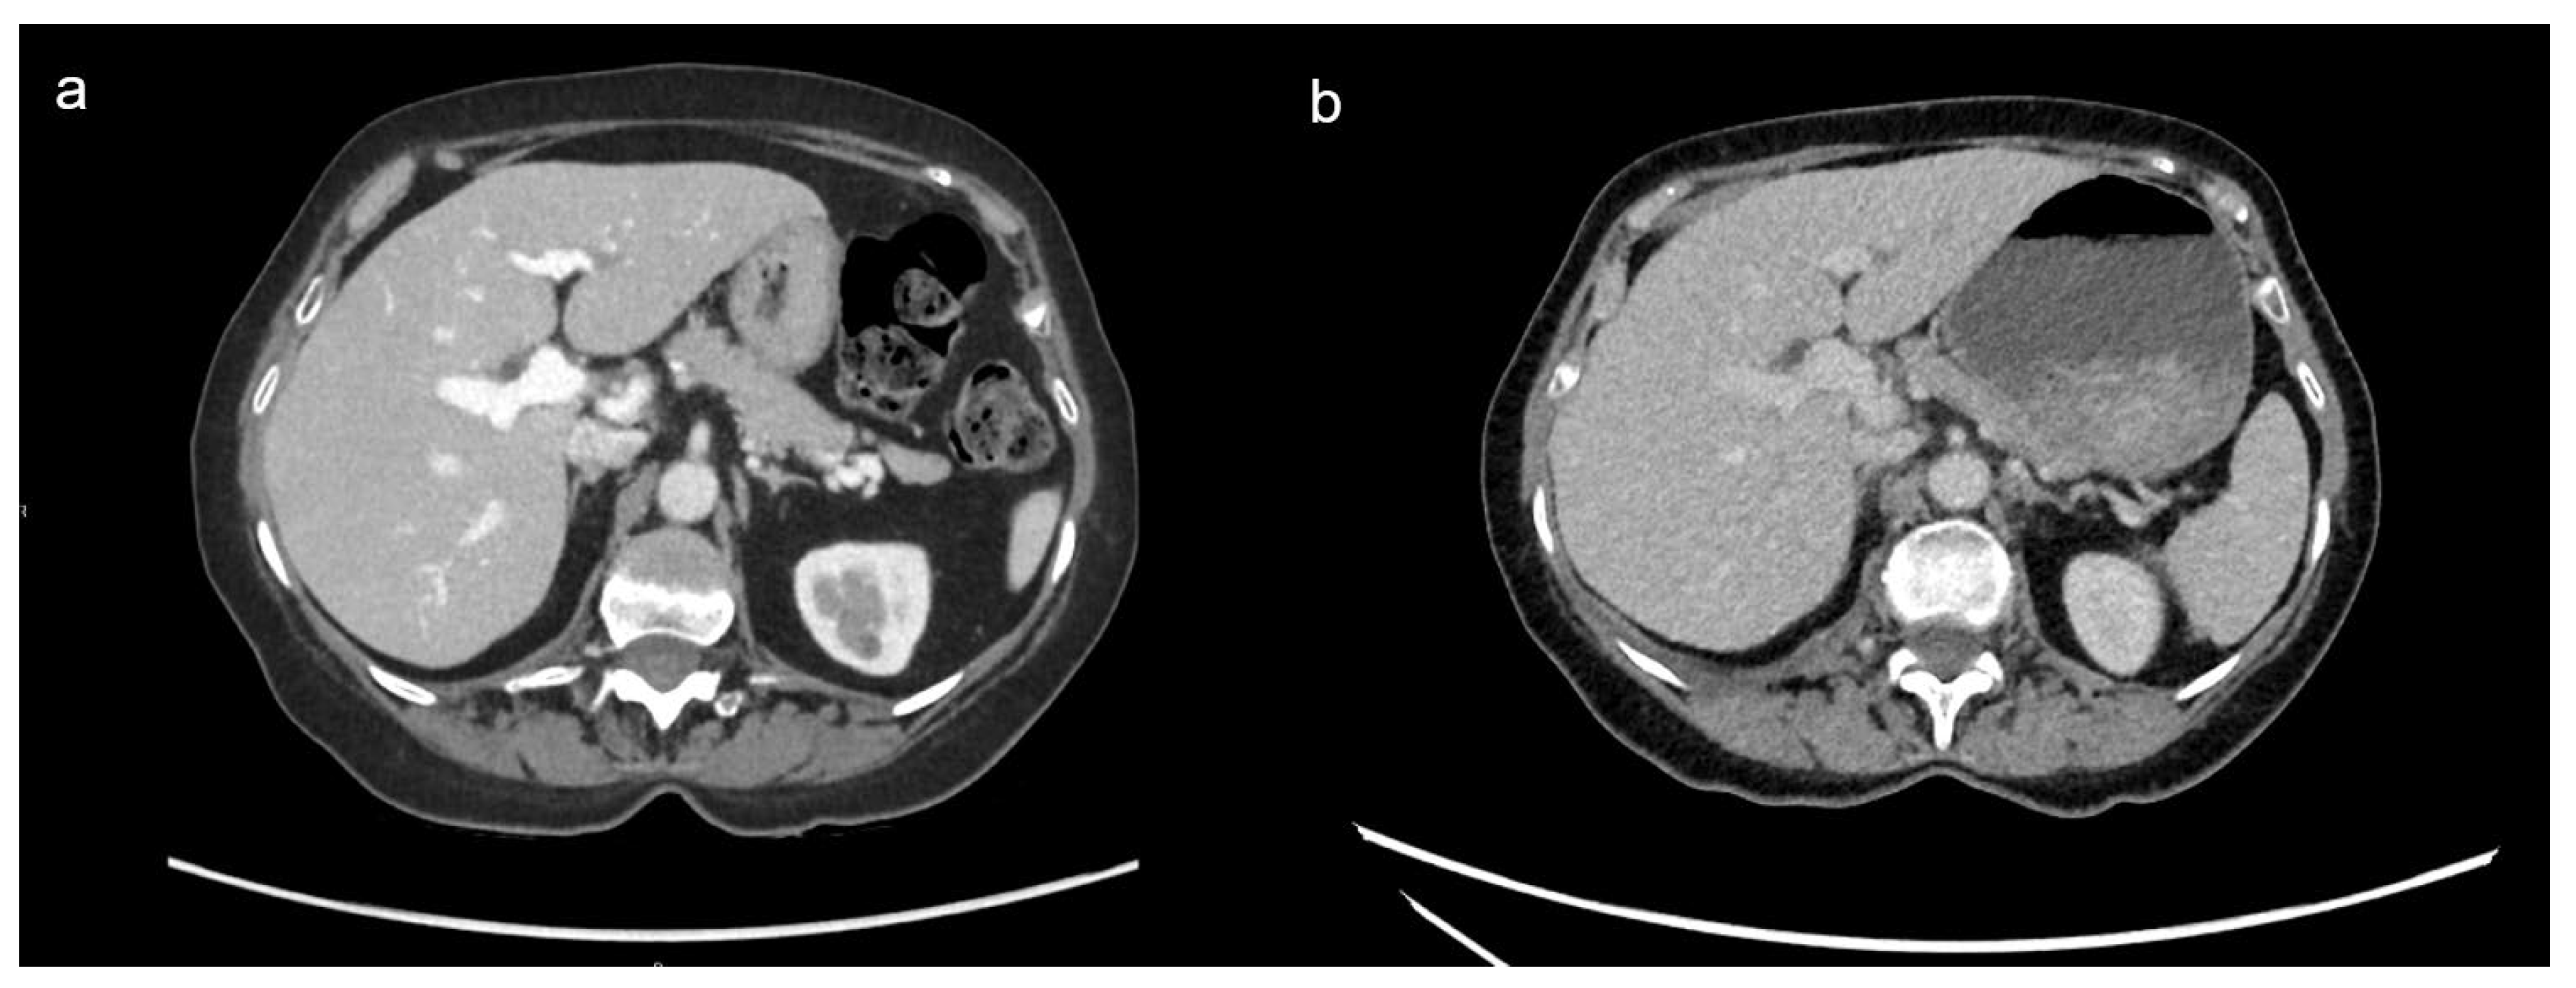
Background/Objectives: To evaluate the feasibility of reducing contrast volume in oncologic body imaging using dual-energy CT (DECT) by (1) identifying the optimal virtual monochromatic imaging (VMI) reconstruction with DECT and (2) comparing DECT with reduced iodinated contrast media (ICM) volume to single-energy CT (SECT) with standard ICM volume. Methods: In this retrospective study, we quantitatively and qualitatively compared the image quality of 35 thoraco-abdominopelvic DECT across 9 different virtual monoenergetic image (VMI) levels (from 40 to 80 keV) using reduced volume of ICM (0.3gI/kg of body weight) to determine the optimal keV reconstruction level. Out of these 35 patients, 20 had previously performed SECT with standard ICM volume (0.3gI/kg of body weight + 9gI), enabling protocol comparison. Qualitative analysis included overall image quality, noise, and contrast enhancement by two radiologists. Quantitative analysis included contrast enhancement measurements, contrast-to-noise ratio and signal-to-noise ratio on liver parenchyma and portal vein. ANOVA identified the optimal VMI reconstruction, while t-tests and paired t-tests were used to compare both protocols. Results: VMI60keV provided the highest overall image quality score. DECT with reduced ICM volume demonstrated higher contrast enhancement and lower noise than SECT with standard ICM volume (p <0.001). No statistical difference was found in overall image quality between the two protocols (p = 0.290). Conclusions: VMI60keV with reduced contrast volume provides higher contrast and lower noise compared to SECT at standard contrast volume. DECT using reduced ICM volume is the technique of choice for oncologic body CT.

Keywords: 
;  ;  ;  ;  

1. Introduction

Imaging is a cornerstone of cancer diagnosis and treatment response assessment [1,2]. Contrast-enhanced thoraco-abdominopelvic (TAP) computed tomography (CT) is the most commonly used imaging modality in oncology due to its speed, wide availability, and ability to cover the entire body for follow-up [3,4]. Given the risk of cancer recurrence even years after diagnosis, patients typically undergo repeated CT scans depending on the type and stage of cancer [1]. However, repeated contrast-enhanced CT scans carry risks for the patient. Indeed, iodinated contrast medium (ICM) used for TAP CT is a nephrotoxic agent that can impair renal function in patients with risk factors such as kidney diseases or diabetes mellitus [5,6,7]. Patients with cancer are more likely to experience acute renal adverse events following CT with ICM compared to those without cancer [8]. According to the European Society of Urogenital Radiology’s recommendations, there is no consensus on the exact volume of contrast to be injected; however, the lowest volume of contrast medium consistent with a diagnostic result should be used [9]. Additionally, reducing the volume of ICM could benefit the environment by minimizing the impact associated with the production and disposal of iodine-based agents. This is particularly important given the widespread use of ICM in diagnostics, which involves high injection volumes and the agent’s low biodegradability, contributing to contamination of drinking water sources in many regions [10,11].
Dual-energy CT (DECT) is an emerging technique that provides advantages in the oncology. By enabling the simultaneous acquisition of high and low kilovoltage datasets, DECT produces low virtual monoenergetic images (VMI) that enhance attenuation values, particularly for iodine attenuation [12,13]. This technique has been shown to improve lesion detection by increasing the conspicuity of iodine and enhancing lesion-to-background contrast [14,15,16]. Additionally, DECT allows for a reduction in the volume of ICM compared to single-energy CT (SECT), while maintaining similar image quality. Two studies in oncology imaging have demonstrated the potential to reduce ICM volume by 40 to 50% using DECT [17,18]. The first study showed that using VMI50keV reconstruction with a lean-body-weight based ICM volume calculation in liver CT provided comparable detection of hepatocellular carcinoma to the standard body-weight-based contrast volume approach [17]. In the second study, Saleh et al. assessed the quality of abdominal DECT using 50% of the weight-based ICM volume compared to single-source CT scan with the full recommended volume. This study found that DECT with reduced contrast volume provided image quality comparable to SECT [18]. Both studies had limitations in evaluating specific keV levels: the first study examined only VMI50keV, and the second focused on VMI60-70 keV. While it is recognized that radiologists assess multiple VMI keV levels to optimize contrast or reduce noise, determining the most effective single keV level could streamline processing and interpretation, thereby improving clinical efficiency.
This study aimed to identify the keV level reconstructions that provide the highest overall image quality and to assess the feasibility of reducing ICM volume in oncologic body imaging using DECT with the optimal keV level, in comparison to SECT with a standard ICM volume.

2. Materials and Methods

2.1. Study Design

This retrospective single-center study was approved by the local ethics committee (CER-VD n°2022-00564), which waived the requirement for informed consent. Eligible patients were identified through our electronic imaging database, which was queried for adult patients who underwent contrast-enhanced TAP DECT for oncology treatment response assessment between February and March 2021. The limited timeframe for patient recruitment is explained by the introduction of the new DECT protocol in February and the machine upgrade in March. If a prior SECT TAP was performed within one year, it was included in the comparative analysis. The exclusion criterion was a body mass index ≥ 30 (kg/m2).

2.2. Imaging Acquisition

All exams were performed using a 256-detector row scanner, Revolution™ CT (GE Healthcare, Milwaukee, WI, USA). DECT was conducted with Gemstone Spectral Imaging, using ultra-fast kV switching between 80 kVp and 140 kVp. The detailed scanning parameters for SECT and DECT are described in Table 1.
The TAP CT protocol used for oncology imaging at our institution includes only the portal venous phase, acquired 75 seconds after intravenous contrast injection, without bolus tracking. The injection was performed using an automatic power injector (CT Exprès® 3D Contrast Media Delivery System, Bracco, United States) with iohexol 300 mg/mL (Accupaque 300, GE Healthcare, Nycomed, Ireland), injected in an antecubital vein at a rate of 3.0 mL/s. Two different injection protocols were used: (1) SECT with a standard ICM volume [1 mL/kg (0.3 g I/kg) + 30 mL] and (2) DECT with a 30 mL reduction in ICM volume, arbitrarily defined as [1mL/kg (0.3 g I/kg) of total body weight].

2.3. Definition of the Optimal VMI Reconstruction

Qualitative and quantitative analyses were performed (1) to identify the VMI that provides the highest image quality based on the different keV reconstructions in DECT, and (2) to compare image quality between SECT with the standard ICM volume and DECT protocols with reduced ICM volume (using the most accurate VMI identified in step (1)). All image analyses were conducted on the different keV levels and on SECT images using a dedicated workstation (AW Server 3.4; General Electric Healthcare, United States).

2.3.1. Qualitative Image Analysis

Two radiologists, each with 9 years of experience in oncology imaging, independently performed a blinded qualitative analysis of global contrast enhancement, noise level, and overall image quality across the five keV level reconstructions (ranging from 40 to 80 keV, at 10 keV intervals). Contrast enhancement was rated from 1 (very poor) to 5 (very good). Noise was graded from 1 (excessive noise) to 5 (limited perceptual image noise). For overall image quality, 1 represented “no definition between anatomical structures” and 5 represented “complete definition between anatomical structures”. A score of 3 was considered the threshold for diagnostic image quality in all three outcomes. Interreader agreement was then assessed.

2.3.2. Quantitative Image Analysis

Quantitative analysis was performed by a radiographer with five years of experience. Contrast enhancement was measured in Hounsfield units (HU) across the different keV level reconstructions by placing a 1 cm diameter region of interest (ROI) in the left and right liver lobes, the portal vein (PV) and the right erector muscle. Contrast enhancement in the liver parenchyma (LP) was expressed as the average HU value between the left and right liver lobes. The standard deviation of the erector muscle was used to define the image noise.
The contrast-to-noise ratio (CNR) and signal-to-noise ratio (SNR) of the hepatic parenchyma and PV were calculated using Equations 1 for CNR:
CNR = c o n t r a s t m e a n n o i s e = H U L P H U m u s c l e s d m u s c l e and H U P V H U m u s c l e s d m u s c l e [Equation 1]
And Equation 2 for SNR:
SNR = H U L P s d L P and H U P V s d P V [Equation 2]
To define the optimal VMI level, DECT was reconstructed at nine different VMI levels, ranging from 40 keV to 80 keV in 10 keV intervals.

2.4. Comparison of DECT and SECT

Identical qualitative and quantitative image analysis conducted to compare SECT and DECT at the optimal VMI reconstruction, as determined in the first objective of the study.

2.5. Radiation Dose Analysis

The volumetric CT dose index (CTDIvol, mGy), dose length product (DLP, mGy * cm), and effective dose (mSv) were recorded. The effective dose was estimated using the conversion factor for the adult abdomen at 120 kV (0.0153 mSv.mGy-1.cm-1) as defined by Deak et al. [20].

2.6. Statistical Analysis

Inter-reader reliability was evaluated using Gwet’s agreement coefficient (AC). The level of agreement was categorized as follows: poor (AC<0.40), fair (0.4≤AC<0.6), substantial (0.6≤AC≤0.8), and almost perfect (0.8≤AC<1.00) [19]. Continuous data are presented as mean ± standard deviation. To define the optimal VMI level, one-way analysis of variance (ANOVA) was performed to compare differences in SNR, CNR, and noise in the liver parenchyma between the VMI. Repeated ANOVA was used for the qualitative analysis comparing rates of contrast enhancement, noise, and overall image quality between VMI. Paired t-test or Wilcoxon signed-rank test was used to compare image quality between SECT and DECT protocols, depending on the distribution of the data. All statistical tests were conducted at the two-sided 1% significance level. All analyses were performed using STATA 16.0 software.

3. Results

3.1. Patient Population

The final population included 35 patients [mean age 64.6 ± 9.5 y.o], with 20 patients having a comparative SECT. Mean time between SECT and DECT examinations was 92 ± 58.5 days. The flowchart of the patient population is shown in Figure 1. Patient population characteristics are described in Table 2.

3.2. Definition of the Optimal VMI Reconstruction

3.2.1. Qualitative Image Analysis

The inter-reader agreement for overall image quality and contrast enhancement was almost perfect (AC = 0.86, AC = 0.94, respectively), while it was substantial for image noise (AC=0.63). The mean scores for all three outcomes (contrast, noise, and overall image quality) were above 3, indicating diagnostic image quality (Table 3). Contrast enhancement was higher in the low-keV images, but these images also exhibited higher noise levels (Table 3). The highest score for overall image quality was observed with VMI60keV (Table 4). Therefore, VMI60keV was selected as the optimal compromise between achieving higher contrast at lower keV levels and reducing noise at higher keV levels.

3.2.2. Quantitative Image Analysis

Compared to VMI40keV, the contrast enhancement in the liver parenchyma decreased by 56.5% and the CNR decreased by 22.9% at VMI80keV (Figure 2). No statistically significant difference in contrast enhancement was observed between VMI60keV and VMI65keV; however, a significant difference was found between VMI60keV and VMI55keV. No statistical differences were observed in CNRLP and SNRLP and PV between VMI55keV, VMI60keV, VMI65eV (p > 0.05), nor between VMI60keV and VMI65keV (p = 0.996). SNR and image noise did not show any statistical differences among all VMI (all p > 0.05).
Based on both quantitative and qualitative results, VMI60keV was identified as the most accurate VMI reconstruction, providing the highest overall image quality and an adequate compromise between contrast and noise (Figure 2).

3.3. Comparison of DECT and SECT

3.3.1. Qualitative Image Analysis

Gwet’s agreement coefficients indicated substantial inter-observer reliability for overall image quality (AC = 0.769) and contrast enhancement (AC = 0.83), with image noise also showing substantial agreement (AC = 0.83) in DECT. In contrast, SECT exhibited lower agreement values (AC = 0.54 for overall quality, 0.23 for contrast enhancement, and 0.40 for image noise). Overall image quality was not significantly different between DECT with a reduced ICM volume of 30 mL and SECT with standard ICM volume (p = 0.287) (Table 5). Contrast enhancement was higher with DECT compared to SECT (p <0.001), while image noise was lower with DECT (p <0.001) (Figure 3). The mean scores for the three outcomes of both protocols were ≥ 3, meeting the diagnostic requirements (Table 5). However, both readers showed mean scores for each outcome corresponding to a diagnostic quality level in both protocols (greater than 3).

3.3.2. Quantitative Image Analysis

In terms of contrast volume, DECT group received a mean contrast volume of 71.4 ± 12.7 mL, while the SECT group received 102.7 ± 14.9 mL (p <0.001), representing a 43.8% reduction in contrast volume with DECT.
Contrast enhancement, CNR and SNR in the LP and PV were all higher in DECT compared to SECT (p < 0.001), while noise was significantly lower in DECT (p <0.001). The detailed results are presented in Table 6.

3.4. Radiation Dose Analysis

The mean CTDI, DLP, and effective dose in DECT were 9.7± 3.5, 678.1 ± 259.2 and 10.4 ± 4.0, respectively. In the SECT group, the mean CTDI, DLP, and effective dose were 7.2 ± 1.6, 502.7 ± 116.4 and 7.7 ± 1.8, respectively. The differences between both protocols were statistically significant (p < 0.001).

4. Discussion

In this study, we aimed to evaluate the feasibility of reducing the volume of contrast medium in TAP CT for oncologic body imaging using DECT. We compared SECT with a standard ICM volume to DECT with a reduced contrast volume (30 mL reduction per patient) and demonstrated a similar image quality, confirming the feasibility of ICM volume reduction with DECT.
The quantitative and qualitative comparison of the different VMI reconstructions with DECT showed that the optimal VMI reconstruction was VMI60keV. DECT with a reduced ICM volume provided similar overall image quality to SECT with a standard ICM volume. Notably, DECT with reduced ICM volume offered higher contrast enhancement and lower noise compared to SECT with standard ICM volume. However, DECT resulted in a 34.72% increase in radiation dose compared to SECT.
The optimal VMI reconstruction level for the highest overall image quality was VMI60keV, based on a balance between contrast enhancement and noise reduction. This finding is consistent with the studies by Gao et al. and Lv et al. [20,21]. In contrast, two other studies identified the lowest keV level, typically VMI40keV, as optimal for enhancing disease depiction, such as liver metastasis or hypervascularization in hepatocellular carcinoma [22], as well as for detection performances in phantom studies [23]. However, as the keV value decreases, image noise increases which can negatively impact overall image quality. Therefore, it is essential to optimize the VMI to achieve the optimal contrast of the liver parenchyma and surrounding tissues while controlling image noise [24,25]. Our findings align with those of a multi-institutional consensus working to standardize DECT workflows, which recommended VMI50keV for improved contrast and VMI70keV for reduced noise in abdominal exams [26]. These results are also supported by Lv et al., who defined an optimal range of 40-70 keV for enhancing the detectability in small HCC without degrading image quality [27]. While we acknowledge that radiologists often evaluate multiple VMI levels at different keV values to optimize contrast or reduce noise, our study focused on determining the most effective single keV level for overall image quality. Additionally, using a single optimal keV level helps streamline computational processing and interpretation time, which is crucial in clinical settings where efficiency is important. In fact, the environmental impact of radiology often overlooks the role of data storage, which globally accounts for approximately 2% of total electricity consumption and generates CO2 emissions comparable to those of the aviation sector [28]. As data generation continues to grow exponentially in the digital age, we should adopt a mindset of “digital moderation,” focusing on limiting the production, use, and dissemination of digital technologies when possible, ensuring that their benefits outweigh both their financial and environmental costs [29].
This study demonstrated the feasibility of performing oncological CT TAP with a reduction of 44% reduction in the total contrast volume injected compared to the SECT protocol in our cohort, while maintaining similar interpretability to conventional SECT acquisition. Our findings are consistent with those of Bae et al., who reported a 40% reduction in contrast volume for liver CT [17]. Additionally, Saleh et al. reported a 50% reduction in the volume of intravenous ICM injected in oncology patients, though with a higher concentration of 350 mgI/mL [18]. In our study, this reduction was achievable due to the comparable image quality between DECT and SECT, which allowed for clear delineation of anatomical structures as assessed both qualitatively and quantitatively. The mean contrast enhancement measured in the liver parenchyma showed diagnostic image quality exceeding 50 HU in both groups and across all monoenergetic images, consistent with the recommendations of Heiken et al. [30]. Moreover, compared to SECT, VMI60keV exhibited statistically significant higher contrast enhancement and reduced noise in qualitative image analysis, while also showing significantly improved CNR and SNR, along with decreased noise in quantitative analysis. The increased contrast enhancement observed with DECT, which leads to higher detectability, has been objectively demonstrated in multiple phantom studies [23,24,31] and clinical studies [22,32]. These results highlight the potential for further ICM volume reduction using DECT, allowing for a lower contrast volume while still achieving sufficient image quality.
Regarding radiation doses, the mean CTDI and mean DLP (9.7 mGy, 678.1 mGy*cm, respectively) in the DECT group remained below the American and Swiss diagnostic reference levels (12 mGy, 774 mGy*cm and 11 mGy, 740 mGy*cm, respectively) [33,34]. Our mean CTDI values are approximately 50% lower than those reported in similar studies [17,35]. Moreover, in the oncologic population, preserving renal function—crucial for most cancer treatments and follow-up imaging—takes priority over concerns about radiation dose, which becomes a secondary consideration.
This study has several limitations. The first limitation is the small sample size, which introduces heterogeneity due to variations in patient body composition, clinical context, and indications. A randomized controlled trial with larger sample could improve the generalizability of the results. Another limitation is the comparison between SECT and DECT, rather than focusing solely on the volume reduction of DECT. Nonetheless, our results demonstrated statistically equivalent image quality between the two protocols.
Further studies are needed to explore the potential of low keV reconstruction to reduce ICM usage. To leverage the high contrast of lower keV images, deep learning-based denoising could help reduce noise that affects image quality, as demonstrated in various phantom studies [36,37]. Another alternative to reducing ICM in body imaging with DECT would be the lean-body-weight strategy for calculating the ICM volume, particularly when using low keV VMI. A meta-analysis highlighted that the lean-body-weight strategy results in lower volumes compared to the total-body-weight strategy [38].

5. Conclusions

In conclusion, VMI60keV provided higher contrast enhancement and reduced image noise compared to SECT. DECT allows for a 30 mL reduction in ICM volume per patient compared to SECT while maintaining similar image quality.

Author Contributions

Conceptualization, M.G., N.VV. C. D.; methodology, M.G, N.VV, A.V, M.J, C.D.; software, M.G.; validation, N.VV. and A.V.; formal analysis, Y.M., G.M. and G.F.; investigation, M.G.; resources, C.C.; data curation, M.G. and Y.M.; writing—original draft preparation, M.G.; writing—review and editing, N.VV., A.V, C.D.; visualization, M.G.; supervision, N.VV.; project administration, M.G. All authors have read and agreed to the published version of the manuscript.

Funding

This research received no external funding.

Institutional Review Board Statement

The study was conducted in accordance with the Declaration of Helsinki and approved by the Ethics Commission of the Canton of Vaud (2022-00564).

Informed Consent Statement

Informed consent was obtained from all subjects involved in the study.

Data Availability Statement

Not applicable.

Acknowledgments

Not applicable.

Conflicts of Interest

The authors declare no conflicts of interest.

Abbreviations

The following abbreviations are used in this manuscript:
CT Computed Tomography
DECT Dual-Energy Computed Tomography
keV Kiloelectronvolts
kV Kilovolts
ICM Iodinated Contrast Medium
LP Liver Parenchyma
PV Portal Vein
SD Standard Deviation
SECT Single Energy Computed Tomography
VMI Virtual Monochromatic Image

References

  1. Pomerantz BJ. Imaging and Interventional Radiology for Cancer Management. Surg Clin North Am. 2020;100(3):499-506. [CrossRef]
  2. Fass L. Imaging and cancer: a review. Mol Oncol. 2008;2(2):115-152. [CrossRef]
  3. Lencioni R, Fanni SC, Morganti R, et al. Looking for appropriateness in follow-up CT of oncologic patients: Results from a cross-sectional study. Eur J Radiol. 2023;167:111080. [CrossRef]
  4. Park C, Gruber-Rouh T, Leithner D, et al. Single-source chest-abdomen-pelvis cancer staging on a third generation dual-source CT system: comparison of automated tube potential selection to second generation dual-source CT. Cancer Imaging. 2016;16(1):33. [CrossRef]
  5. Davenport MS, Khalatbari S, Cohan RH, Ellis JH. Contrast medium-induced nephrotoxicity risk assessment in adult inpatients: a comparison of serum creatinine level- and estimated glomerular filtration rate-based screening methods. Radiology. 2013;269(1):92-100. [CrossRef]
  6. McGillicuddy EA, Schuster KM, Kaplan LJ, et al. Contrast-induced nephropathy in elderly trauma patients. J Trauma. 2010;68(2):294-297. [CrossRef]
  7. Weisbord SD, Mor MK, Resnick AL, Hartwig KC, Palevsky PM, Fine MJ. Incidence and outcomes of contrast-induced AKI following computed tomography. Clin J Am Soc Nephrol. 2008;3(5):1274-1281. [CrossRef]
  8. Ng CS, Kalva SP, Gunnarsson C, Ryan MP, Baker ER, Mehta RL. Risk of renal events following intravenous iodinated contrast material administration among inpatients admitted with cancer a retrospective hospital claims analysis. Cancer Imaging. 2018;18(1):30. [CrossRef]
  9. Radiology ES of U. ESUR Guidelines on Contrast Agents. Published online March 2018. https://www.esur.org/wp-content/uploads/2022/03/ESUR-Guidelines-10_0-Final-Version.pdf.
  10. Beer M, Schuler J, Kraus E, et al. Discharge of iodine-containing contrast media into the environment - problem analysis and implementation of measures to reduce discharge by means of separation toilets - experience from a pilot project. Rofo. 2023;195(12):1122-1127. [CrossRef]
  11. Dekker HM, Stroomberg GJ, Prokop M. Tackling the increasing contamination of the water supply by iodinated contrast media. Insights Imaging. 2022;13(1):30. [CrossRef]
  12. Goo HW, Goo JM. Dual-Energy CT: New Horizon in Medical Imaging. Korean J Radiol. 2017;18(4):555-569. [CrossRef]
  13. Tatsugami F, Higaki T, Nakamura Y, Honda Y, Awai K. Dual-energy CT: minimal essentials for radiologists. Jpn J Radiol. 2022;40(6):547-559. [CrossRef]
  14. McCollough CH, Leng S, Yu L, Fletcher JG. Dual- and Multi-Energy CT: Principles, Technical Approaches, and Clinical Applications. Radiology. 2015;276(3):637-653. [CrossRef]
  15. Fox B. GE Healthcare’s Gemstone Spectral Imaging Emerging as a “Must Have” Diagnostic Tool. June 13, 2011. https://www.ge.com/news/press-releases/ge-healthcares-gemstone-spectral-imaging-emerging-must-have-diagnostic-tool.
  16. Hickethier T, Kroeger JR, Lennartz S, Doerner J, Maintz D, Chang DH. Venous-phase chest CT with reduced contrast medium dose: Utilization of spectral low keV monoenergetic images improves image quality. Eur J Radiol. 2020;122:108756. [CrossRef]
  17. Bae JS, Lee JM, Kim SW, et al. Low-contrast-dose liver CT using low monoenergetic images with deep learning–based denoising for assessing hepatocellular carcinoma: a randomized controlled noninferiority trial. Eur Radiol. 2022;33(6):4344-4354. [CrossRef]
  18. Saleh M, Mujtaba B, Jensen C, et al. Feasibility of half the recommended dose of IV contrast in DECT: image quality evaluation and diagnostic acceptability in cancer patients. Clin Imaging. 2022;88:59-65. [CrossRef]
  19. Gwet KL. Handbook of Inter-Rater Reliability: The Definitive Guide to Measuring the Extent of Agreement among Raters. Fourth edition. Advances Analytics, LLC; 2014.
  20. Gao K, Ma ZP, Zhang TL, Liu YW, Zhao YX. Comparative study of abdominal CT enhancement in overweight and obese patients based on different scanning modes combined with different contrast medium concentrations. J X-Ray Sci Technol. Published online January 12, 2024:1-13. [CrossRef]
  21. Lv P, Zhou Z, Liu J, et al. Can virtual monochromatic images from dual-energy CT replace low-kVp images for abdominal contrast-enhanced CT in small- and medium-sized patients? Eur Radiol. 2019;29(6):2878-2889. [CrossRef]
  22. Yamaguchi H, Ichikawa T, Morisaka H, et al. Early detection of hypervascularization in hepatocellular carcinoma (≤2 cm) on hepatic arterial phase with virtual monochromatic imaging: Comparison with low-tube voltage CT. Medicine (Baltimore). 2023;102(39):e34774. [CrossRef]
  23. Greffier J, Si-Mohamed S, Dabli D, et al. Performance of four dual-energy CT platforms for abdominal imaging: a task-based image quality assessment based on phantom data. Eur Radiol. 2021;31(7):5324-5334. [CrossRef]
  24. Cester D, Eberhard M, Alkadhi H, Euler A. Virtual monoenergetic images from dual-energy CT: systematic assessment of task-based image quality performance. Quant Imaging Med Surg. 2022;12(1):726-741. [CrossRef]
  25. Zhao S, Liu ZC, Zhao YX, Zhang TL, Zuo ZW. A feasibility study of different GSI noise indexes and concentrations of contrast medium in hepatic CT angiography of overweight patients: image quality, radiation dose, and iodine intake. Jpn J Radiol. 2023;41(6):669-679. [CrossRef]
  26. Patel BN, Alexander L, Allen B, et al. Dual-energy CT workflow: multi-institutional consensus on standardization of abdominopelvic MDCT protocols. Abdom Radiol. 2017;42(3):676-687. [CrossRef]
  27. Lv P, Lin XZ, Chen K, Gao J. Spectral CT in patients with small HCC: investigation of image quality and diagnostic accuracy. Eur Radiol. 2012;22(10):2117-2124. [CrossRef]
  28. Pearce F. Energy Hogs: Can World’s Huge Data Centers Be Made More Efficient? YaleEnvironment360. Published online 2018. https://e360.yale.edu/features/energy-hogs-can-huge-data-centers-be-made-more-efficient#:~:text=by%20Matt%20Rota-,Energy%20Hogs%3A%20Can%20World%27s%20Huge%20Data%20Centers%20Be%20Made%20More,and%20dramatically%20improve%20energy%20efficiency.
  29. Mariampillai J, Rockall A, Manuellian C, et al. The green and sustainable radiology department. Radiol. 2023;63(S2):21-26. [CrossRef]
  30. Heiken JP, Brink JA, McClennan BL, Sagel SS, Crowe TM, Gaines MV. Dynamic incremental CT: effect of volume and concentration of contrast material and patient weight on hepatic enhancement. Radiology. 1995;195(2):353-357. [CrossRef]
  31. Tsang DS, Merchant TE, Merchant SE, Smith H, Yagil Y, Hua CH. Quantifying potential reduction in contrast dose with monoenergetic images synthesized from dual-layer detector spectral CT. Br J Radiol. 2017;90(1078):20170290. [CrossRef]
  32. Nagayama Y, Nakaura T, Oda S, et al. Dual-layer DECT for multiphasic hepatic CT with 50 percent iodine load: a matched-pair comparison with a 120 kVp protocol. Eur Radiol. 2018;28(4):1719-1730. [CrossRef]
  33. Office fédéral de la santé publique OFSP. Niveaux de Référence Diagnostiques En Tomodensitométrie. https://www.bag.admin.ch/dam/bag/fr/dokumente/str/str-wegleitungen/drw/2018-06-15-r-06-06.pdf.download.pdf/R-06-06df.pdf.
  34. Kanal KM, Butler PF, Sengupta D, Bhargavan-Chatfield M, Coombs LP, Morin RL. U.S. Diagnostic Reference Levels and Achievable Doses for 10 Adult CT Examinations. Radiology. 2017;284(1):120-133. [CrossRef]
  35. Nakaura T, Awai K, Maruyama N, et al. Abdominal Dynamic CT in Patients with Renal Dysfunction: Contrast Agent Dose Reduction with Low Tube Voltage and High Tube Current–Time Product Settings at 256–Detector Row CT. Radiology. 2011;261(2):467-476. [CrossRef]
  36. Lee T, Lee JM, Yoon JH, et al. Deep learning–based image reconstruction of 40-keV virtual monoenergetic images of dual-energy CT for the assessment of hypoenhancing hepatic metastasis. Eur Radiol. 2022;32(9):6407-6417. [CrossRef]
  37. Katsuyama Y, Kojima T, Shirasaka T, Kondo M, Kato T. Characteristics of the deep learning-based virtual monochromatic image with fast kilovolt-switching CT: a phantom study. Radiol Phys Technol. 2023;16(1):77-84. [CrossRef]
  38. Gulizia M, Ding S, Sá Dos Reis C, Jaques C, Dromain C. Adjustments of iodinated contrast media using lean body weight for abdominopelvic computed tomography: A systematic review and meta-analysis. Eur J Radiol. 2024;178:111631. [CrossRef]
Figure 1. Study flowchart.
Preprints 148485 g001
Figure 2. Iodine attenuation DECT images reconstructed at three different keV levels: (a) 80 keV, (b) 60 keV, and (c) 40 keV. VMI60keV showed the highest score for overall image quality with a rating of 5, while VMI40keV was rated 4 and VMI80keV was rated as 3.
Preprints 148485 g002
Figure 3. Example of DECT at 60keV (a) and SECT (b) axial contrast-enhanced CT images of the same patient during the portal venous phase, presented with identical window widths (350 HU) and window levels (50 HU). VMI60keV image (left) was rated 5 for both image quality and contrast, whereas SECT image (right) were rated 3 for both characteristics.
Preprints 148485 g003
Table 1. TAP CT parameters.
CT Parameters DECT SECT
Tube voltage 80-140 kVp 120 kVp
Automatic tube current modulation (mA) 145-515 130-400
Pitch 0.992 1.2
Collimation (mm) 80 x 0.625 80 x 0.625
SFOV (mm) 500 500
Matrix size (pixels) 512 x 512 512 x 512
Gantry rotation time (s/rot) 0.6 0.28
Slice thickness (mm) 2.5 2.5
Slice increment (mm) 2 2
Kernel Standard Standard
Reconstruction method ASIR-V 50% ASIR-V 50%
Abbreviations: DECT, dual-energy computed tomography; SECT, single-energy computed tomography.
Table 2. Patient demographics.
Patients (n=35)
Sex M/F 21/14
Age (years) 64.6 ± 9.5
Body weight (kg) 71.4 ± 12.7
Body Height (cm) 169 ± 9.0
BMI 25.0 ± 3.7
Clinical indication 16/35 Lung cancers
9/35 Urological cancers
6/35 Gynaecological cancers
4/35 Digestive cancers
3/35 Skin cancers
2/35 Haematological cancers
1/35 Brain cancer
1/35 Breast cancer
Note 2 Data are presented as means with standard deviations. Abbreviation: BMI, body mass index.
Table 3. Qualitative assessment for all VMI reconstruction.
Energy Image overall quality (range) Contrast enhancement (range) Image noise (range)
40 3.22 (3-5) 4.91 (4-5) 3.24 (3-5)
45 3.37 (3-5) 4.87 (4-5) 3.23 (3-5)
50 3.87 (3-5) 4.57 (4-5) 3.44 (3-5)
55 4.36 (3-5) 4.31 (3-5) 3.76 (3-5)
60 4.61 (3-5) 4.06 (3-5) 4.00 (3-5)
65 4.51 (3-5) 3.86 (3-5) 4.40 (3-5)
70 3.99 (2-5) 3.51 (2-5) 4.76 (4-5)
75 3.41 (2-5) 3.10 (2-5) 4.96 (4-5)
80

Gwet’s AC
3.03 (2-4)

AC = 0.864
2.94 (2-4)

AC = 0.94
4.96 (4-5)

AC = 0.63
Note 3 Data are presented as mean and range.
Table 4. Quantitative assessment for all VMI reconstructions.
HULP CNRLP SNRLP HUPV CNRPV SNRPV Image Noise
40 199.74 ± 24.67 6.90 ± 2.18 11.49 ± 2.04 379.13 ± 29.15 17.59 ± 5.36 13.53 ± 3.61 17.21 ± 4.01
45 174.01 ± 17.98 6.79 ± 1.96 11.80 ± 1.90 312.89 ± 24.29 16.40 ± 4.70 13.36 ± 3.44 14.75 ± 3.35
50 150.86 ± 14.84 6.53 ± 1.83 11.95 ± 1.94 260.55 ± 43.08 15.28 ± 4.33 13.22 ± 3.23 12.76 ± 2.89
55 133.15 ± 12.62 6.34 ± 1.70 12.06 ± 1.86 220.24 ± 34.94 14.27 ± 3.96 13.04 ± 3.01 11.14 ± 2.42
60 119.30 ± 11.08 6.09 ± 1.65 12.27 ± 1.92 190.85 ± 33.73 13.38 ± 4.14 13.01 ± 3.21 9.96 ± 2.17
65 108.1 ± 10.01 5.75 ± 1.57 12.35 ± 1.93 163.33 ± 23.61 11.86 ± 3.40 12.67 ± 2.70 9.15 ± 2.01
70 99.50 ± 9.20 5.55 ± 1.49 12.61 ± 1.94 143.58 ± 19.63 10.87 ± 3.06 12.40 ± 2.46 8.33 ± 1.78
75 92.42 ± 8.76 5.32 ± 1.46 12.29 ± 2.69 127.69 ± 16.70 9.90 ± 2.87 12.20 ± 2.31 7.73 ± 1.67
80 86.93 ± 8.49 5.17 ± 1.44 12.80 ± 2.05 114.78 ± 14.19 9.02 ± 2.66 11.96 ± 2.18 7.22 ± 1.59
Data are presented as mean (HU) ± SD. Attenuation, SNR and CNR are reported for LP and PV Abbreviations: HU, Hounsfield Unit; LP, liver parenchyma; PV, portal vein; CNR, contrast-to-noise ratio; SNR, signal-to-noise ratio.
Table 5. Qualitative assessment of image quality.
DECT at 60 keV SECT p value
Image overall quality (range) 3.95 (3-5)
AC=0.769
3.83 ± 0.7 (2-5)
AC= 0.54
0.287
Contrast enhancement (range) 4.08 (3-5)
AC=0.83
3.35 ± 0.7 (2-5)
AC=0.23
<0.001
Image noise (range) 4.55 ± 0.6 (3-5)
AC=0.83
3.58 ± 0.8 (2-5)
AC=0.40
<0.001
Note 5 Data are presented as the mean ± standard deviation. Abbreviations: SECT, single-energy computed tomography; DECT, dual-energy computed tomography, AC; agreement coefficient.
Table 6. Quantitative assessment of image quality.
DECT at 60 keV SECT p value
aHULP 119.30 ± 11.1 109.8 ± 9.0 <0.001
CNRLP 6.59 ± 1.5 4.04 ± 1.5 <0.001
SNRLP 12.95 ± 1.8 7.64 ± 1.7 <0.001
HUPV 200.01 ± 37.0 149.6 ± 16.6 <0.001
CNRPV 14.47 ± 4.3 6.9 ± 2.2 <0.001
SNRPV 13.44 ± 3.6 10.43 ± 2.6 <0.001
Image Noise 9.93 ± 1.7 13.98 ± 2.5 <0.001
Note 6 Data are presented as the mean ± standard deviation. Abbreviations: SECT, single-energy computed tomography; DECT, dual-energy computed tomography; LP, live; PV, portal vein; parenchyma HU, Hounsfield Unit; aHU, average Housnfield Unit (mean between left and right lobe); CNR, contrast-to-noise ratio; SNR, signal-to-noise ratio.
Disclaimer/Publisher’s Note: The statements, opinions and data contained in all publications are solely those of the individual author(s) and contributor(s) and not of MDPI and/or the editor(s). MDPI and/or the editor(s) disclaim responsibility for any injury to people or property resulting from any ideas, methods, instructions or products referred to in the content.
Copyright: This open access article is published under a Creative Commons CC BY 4.0 license, which permit the free download, distribution, and reuse, provided that the author and preprint are cited in any reuse.
Prerpints.org logo

Preprints.org is a free preprint server supported by MDPI in Basel, Switzerland.

Subscribe

Disclaimer

Terms of Use

Privacy Policy

Privacy Settings

© 2025 MDPI (Basel, Switzerland) unless otherwise stated