
Submitted:
05 February 2025
Posted:
06 February 2025
You are already at the latest version
Abstract
The cultivation of Soledad pepper (Capsicum annuum L.) is essential in Oaxaca and Veracruz, but it faces issues with pests and diseases, which affect yield and cause economic losses. To mitigate these impacts, farmers have started using biostimulants such as chitosan and plant growth-promoting bacteria instead of agrochemicals due to their environmental and health benefits. This study evaluated the effect of Bacillus subtilis and chitosan, both individually and combined, on the growth, yield, and fruit quality of Soledad pepper under greenhouse conditions. Four treatments were applied at different stages of the crop cycle: Q (Chitosan), BS (Bacillus subtilis), Q+BS (Chitosan + Bacillus subtilis), and T (Control). The results showed that the combination of chitosan and Bacillus subtilis significantly improved plant growth, especially in height and stem diameter. The chitosan treatment produced the highest number of fruits and plant weight, while the combination of chitosan and Bacillus subtilis enhanced fruit quality, increasing characteristics such as size, weight, pericarp thickness, and physicochemical parameters, notably in brix degrees, citric acid percentage, and pH, outperforming the individual treatments and the control.
Keywords:
soledad chile pepper
; chitosan
; Bacillus subtilis
; fruit quality
; yield
; agrochemicals
; plant growth
1. Introduction
The cultivation of green chili (Capsicum annuum L.) plays a significant role in the agri-food sector, being an important source of income and food worldwide. According to data from the Food and Agriculture Organization of the United Nations [1]. The area planted with green chili covers 2,055,311 hectares globally, with a total production nearing 37 million tons. In the fertile region of Papaloapan, located in the state of Oaxaca, the cultivation of Soledad chili (Capsicum annuum L.) covers more than 358 hectares, with an annual production of 2,305 tons, according to the Agricultural and Fisheries Information Service [2]. This crop not only represents a source of economic livelihood for local farmers but also a vital component of the region’s agricultural identity.
Despite its promising productivity, soledad chili is threatened by various biotic factors, such as pests and diseases, which can affect any stage of its growth cycle. These phytosanitary problems not only reduce the quality and quantity of the harvest but also cause significant economic losses for local farmers. Many of them resort to the use of agrochemicals to protect their crops; however, the indiscriminate and excessive use of these products entails risks and consequences, such as air contamination, pollution of groundwater, soil erosion, and the accumulation of toxic leachates. Therefore, it is essential to find sustainable solutions that minimize these negative impacts and ensure the long-term viability of agricultural activities [3].
One such alternative is the use of chitosan, which has been shown to stimulate the growth and yield of vegetables by acting as an inducer in the synthesis of key phytohormones, such as indoleacetic acid, indole-3-butyric acid, and gibberellins [4]. Chitosan has shown benefits in germination, yields, and the absorption of micronutrients in crops such as wheat, corn, strawberries, tobacco, and rice [5].
Additionally, Bacillus subtilis is a beneficial bacterium widely used as a biofertilizer and biocontrol agent in agriculture. One of its most remarkable abilities is the promotion of plant growth through the synthesis and regulation of phytohormones such as auxins, gibberellins, abscisic acid, and ethylene. These phytohormones play a crucial role in plant growth, development, and stress response. The use of Bacillus subtilis in sustainable agriculture has gained relevance due to its ability to enhance crop growth, increase disease resistance, and reduce dependence on chemical fertilizers and pesticides. These advances in knowledge and technology promote the search for agricultural management strategies that reduce economic costs and environmental damage while increasing productivity. Given the need to implement more sustainable production techniques, this research focuses on evaluating the effect of microbial inoculants and biofertilizers on the growth, yield, and fruit quality of Soledad chili (Capsicum annuum L.) under controlled greenhouse conditions. This approach aims to generate valuable information that contributes to the adoption of more environmentally friendly and sustainability-promoting agricultural practices.
Therefore, the objective of this research was to evaluate the individual and combined effects of Bacillus subtilis and chitosan on the growth, yield, and fruit quality of Soledad chili (Capsicum annuum L.) under greenhouse conditions.
2. Materials and Methods
2.1. Establishment of the Experiment
The first part of this research was conducted in the chemistry and biology laboratory of the Agroengineering Institute. Subsequently, for agronomic management, a "vulture wing" type greenhouse was used. Both are located at the facilities of the Universidad del Papaloapan, Loma Bonita Campus, in the municipality of Loma Bonita, Oaxaca, Mexico, with coordinates 18°05'56.5" N and 95°53'48.0" W, at an altitude of 38 meters above sea level.
2.2. Experimental Design
A randomized block experimental design was conducted with four treatments, each with 20 repetitions, equivalent to 20 plants per treatment. The treatments included were: Q (UNPA Chitosan + Nutrient Solution), BS (Bacillus subtilis), Q+BS (UNPA Chitosan + Bacillus subtilis), and T (Nutrient Solution), as detailed in Table 1.
The treatments were applied at the time of sowing and then at 15, 30, and 45 days after sowing, as well as at 15, 30, 45, 60, 75, 90, 105, and 120 days after transplanting (dat). It is important to mention that the transplanting was done when the plants were 45 days from sowing. The bioproducts were applied at a dose of 15 mL per plant using the drench technique
2.3. Purification and Characterization of Chitosan
2.3.1. Obtaining and Preparation of Chitinous Samples
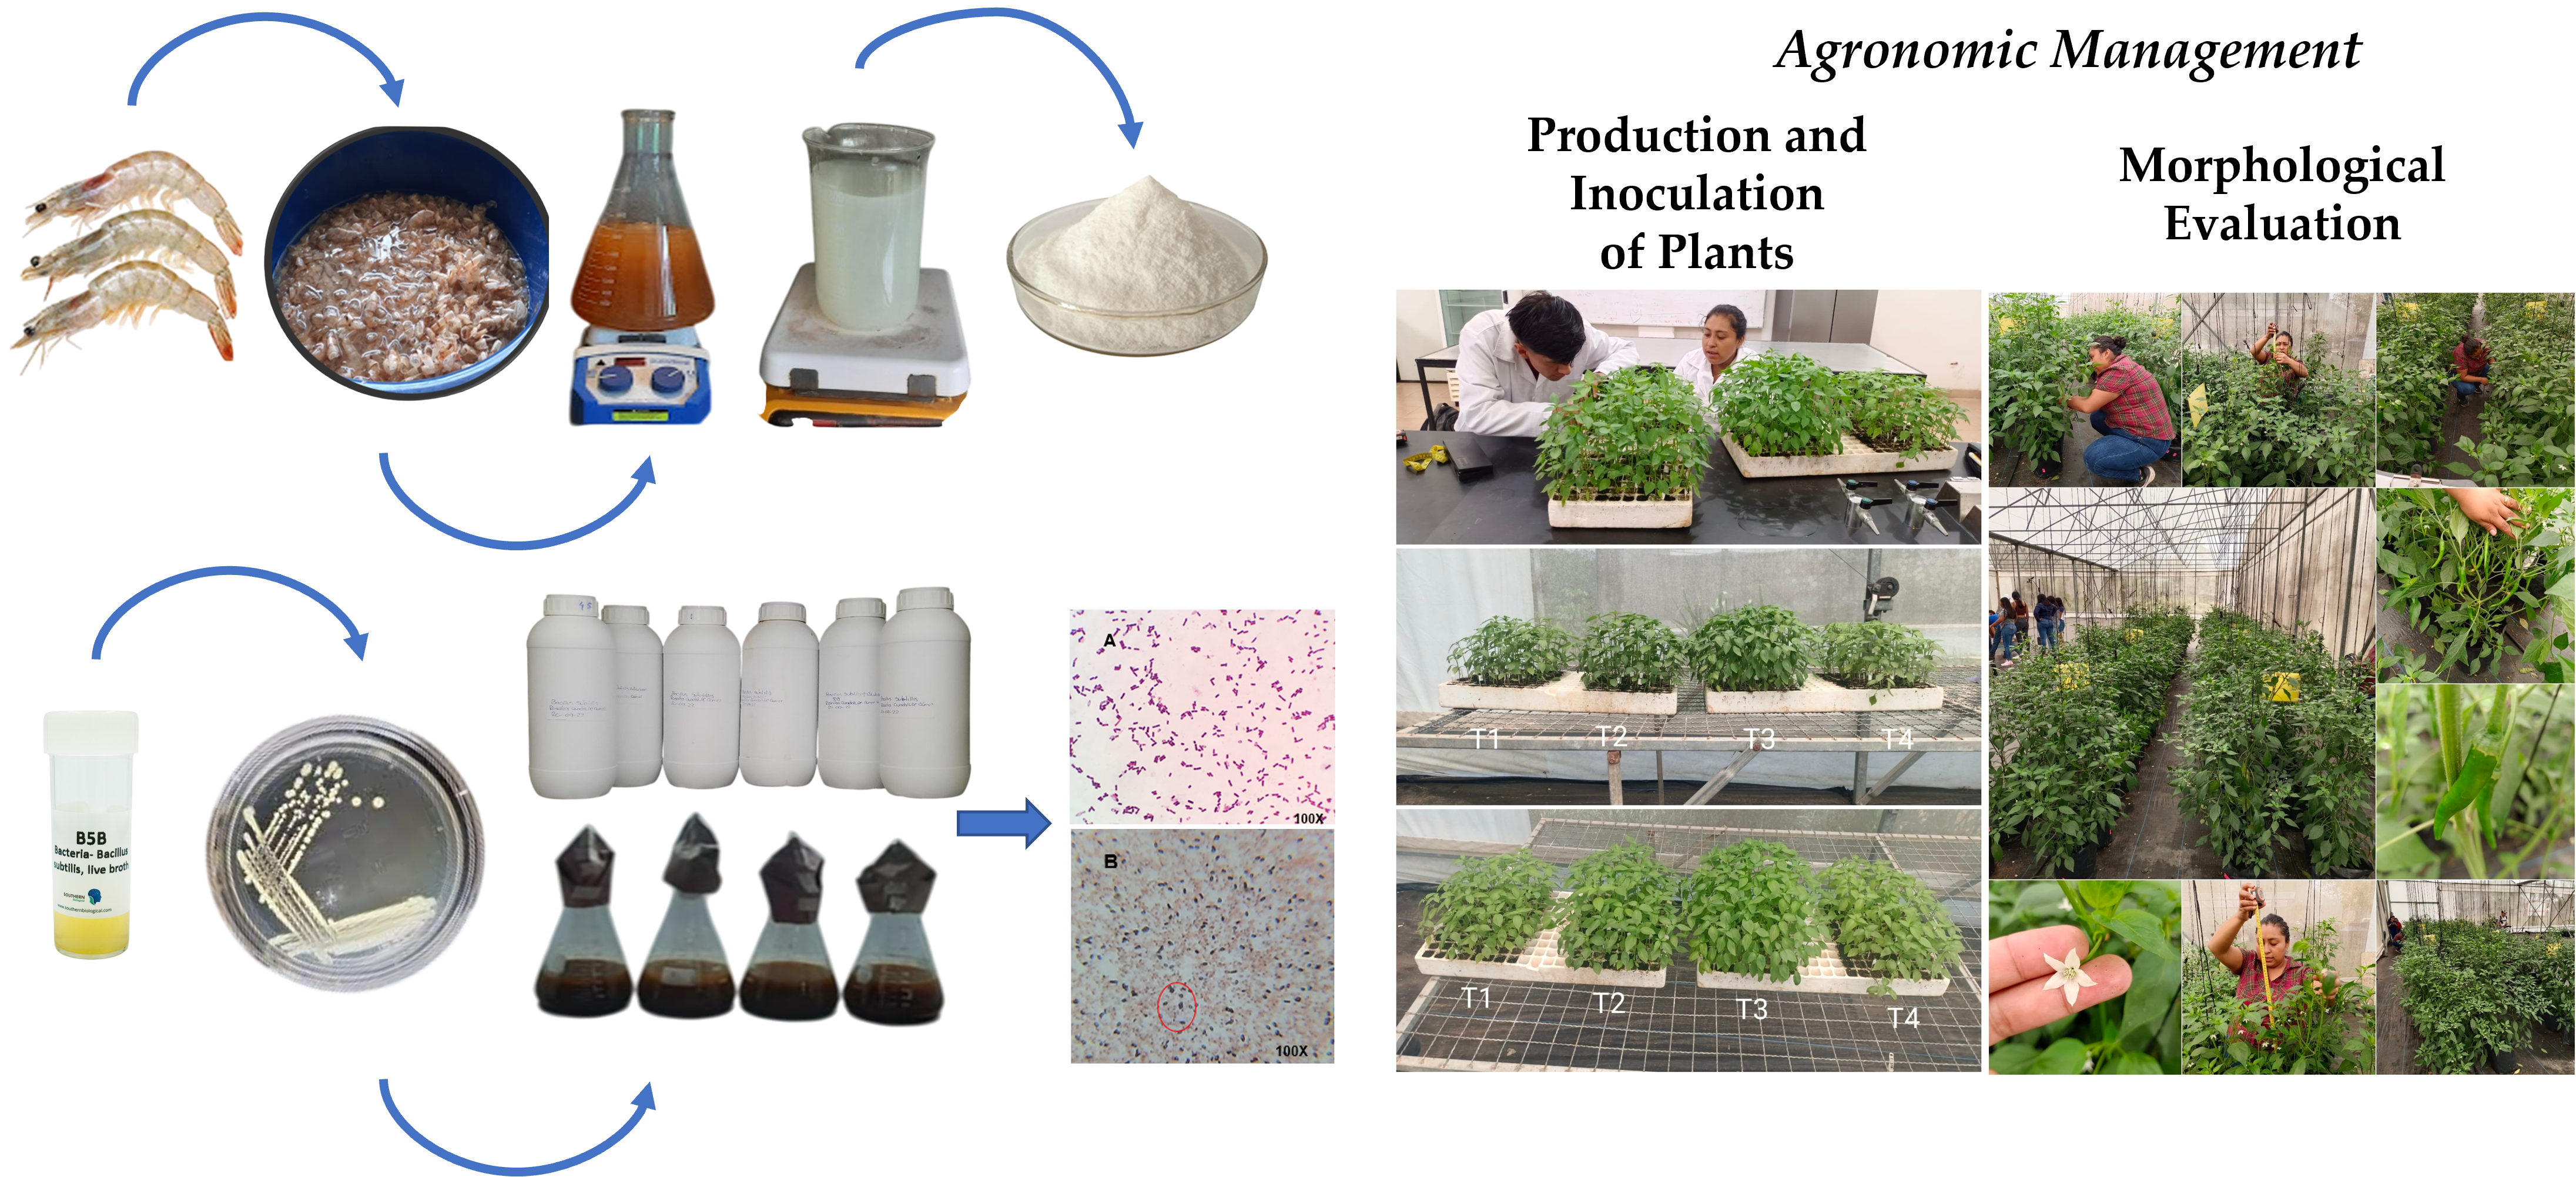
Shrimp exoskeleton residues were obtained from the dock of the industrial zone at the fishing port of Alvarado, Veracruz. Initially, they were washed with water and 10% sodium hypochlorite (NaClO) in a 10:1 ratio. Once cleaned, they were ultra-frozen at -65 °C and then lyophilized at -40 °C under a vacuum of -133 mBar using a freeze dryer (Labconco 77540-00, MO, USA). Once lyophilized, the samples were ground (Proctor Silex® Grinder 72500RY, Japan) and sieved (No. 60 Test Sieve® 090233332, Germany) to a particle size of 250 μm [6]. Finally, the flour was stored in medium-sized airtight bags (18 × 20 cm) (Ziploc, Johnson & Sons, Inc., Racine, WI, USA), protecting it from moisture and light until further use.
2.3.2. Alkaline Hydrolysis
The reaction was carried out in a 2.0 L Erlenmeyer flask using a 0.4 M aqueous sodium hydroxide (NaOH) solution, with a ratio of 1/15 (w/v) and constant stirring at 1000 rpm for 1 hour at a temperature of 25 °C. After the reaction, the solid sample was repeatedly washed with running water until neutrality was reached [6].
2.3.3. Acid Hydrolysis
The reaction was conducted in a 2.0 L Erlenmeyer flask with a 0.6 N hydrochloric acid (HCl) solution at a ratio of 1/15 (w/v) and constant stirring at 1000 rpm for 3 hours. Once completed, the solid sample was repeatedly washed with running water until neutrality was reached [6].
2.3.4. Deacetylation
Finally, a reaction was carried out in a 2.0 L Erlenmeyer flask with a 0.4 M aqueous sodium hydroxide (NaOH) solution, using a ratio of 1/15 (w/v) and constant stirring at 1000 rpm for 1 hour at a temperature of 25 °C. Upon completion, the solid sample was repeatedly washed with running water until neutrality was reached [6].
2.3.5. Chemical Depigmentation
A double bleaching process was performed, which involved resuspending the deproteinized and demineralized residues in 2.0 L flasks using a 38% sodium hypochlorite (NaClO) solution, with constant stirring at 1000 rpm and room temperature for 20 minutes each time. After the first bleaching, the samples were filtered and subjected to a second bleaching under the same conditions. Subsequently, the resulting samples were repeatedly washed until neutrality was reached and dried in an oven at 70 °C for 36 hours [6].
2.3.6. Characterization of Chitosan
The characterization of the shrimp exoskeleton (chitin source), the obtained chitosan, and commercial Sigma chitosan was performed. The moisture percentage was determined according to the methodology [7] and the ash content [8] This allowed the calculation of the demineralization percentage (% DM) and deproteinization percentage (% DP). The pH was determined using a HORIBA pH meter (LAQUAtwin pH11). In addition, an instrumental color analysis was conducted using a spectrophotometer (ColorFlex HunterLab®) to obtain the °A, B*, and L* values of the HSL (Hue, Saturation, and Lightness) color model. The obtained data were processed using the "Easy RGB-PC" conversion program to create color charts [9]. Furthermore, the protein content was determined using the Kjeldahl method [7,8]. Finally, the characterization of the samples was performed using a PerkinElmer FT-IR Spectrum 100 infrared spectrophotometer (IR) in the range of 400-4000 cm⁻¹, with a total of 16 scans [10].
2.4. Bacterial Concentration
The Bacillus subtilis strain was provided by the Bioprocess Laboratory of the University of Papaloapan (UNPA) at the Loma Bonita campus. The lactic acid strain was reactivated in Man Rogosa Sharpe (MRS) medium, incubating at 38 °C for 48 hours in an incubator (Felisa®, FE132AD, Mexico). The resulting bacterial suspension was adjusted to a concentration of 1x10⁹ CFU*mL⁻¹ [11].
2.5. Preparation of the Bioinoculant
Two grams of chitosan were dissolved in one liter of water and left under constant agitation for 15 minutes for complete dissolution. For Bacillus subtilis, 15 mL of the previously prepared concentrate was added to one liter of water and maintained under constant agitation for 15 minutes. Finally, for the combined product, two grams of chitosan were added to one liter of water along with 15 mL of the Bacillus subtilis concentrate, and constant agitation was carried out for 15 minutes.
2.6. Agronomic Management
2.6.1. Production and Inoculation of Plants
Seeds of the Soledad chili variety CHISER-522 were used, donated by the Huastecas Experimental Field of the National Institute of Forestry, Agricultural and Livestock Research [12]. Sowing was carried out on November 29, 2022, following the methodology of [13], using polystyrene trays with 200 cavities and employing Peat Moss as a substrate, which was moistened to field capacity. A 1 cm hole was made in each cavity, where one seed was placed. The seed was then covered with a light layer of moist Peat Moss substrate. After 15 days of sowing, the evaluated bioproducts (Bacillus subtilis, chitosan, and chitosan + Bacillus subtilis) were applied, along with a nutrient solution Steiner [14] at a concentration of 25% for the first two weeks. The concentration was then increased to 50% until the time of transplanting. After 45 days, the seedlings were transplanted into bags containing 8 kg of worm compost, placing the plant with the root ball directly in the center of the bag.
2.6.2. Transplanting, Irrigation, and Fertilization.
After 45 days, the seedlings were transplanted into bags containing 8 kg of vermicompost, placing the plant with the root ball directly in the center of the bag. Subsequently, for the irrigation and fertilization of the crop, the hydroponic irrigation system available in the greenhouse was used. For conducting the experiment, daily irrigation was applied, or as needed by the plant, for a duration of 20 minutes at the following times: 8:00 AM and 6:00 PM. The nutrient solution and dosage used were based on Steiner (1984). The pH of the solution was adjusted to 6, and the electrical conductivity (EC) was set between 2.5 and 3.5 mS cm⁻¹. It is important to mention that the nutrient solutions varied according to the phenological stage of the crop. From 4 days after sowing until 25 days after sowing, the solution was applied at a concentration of 25%. Then, from day 26 to 45 days after sowing, the solution was used at a concentration of 50%. The same concentration was maintained after transplanting until 75 days post-transplant. Finally, from 76 days after transplanting until 120 days after transplanting, the nutrient solution was applied at 75% concentration until the end of the crop's vegetative cycle.
2.6.3. Morphological Evaluation
Three harvests were conducted: the first at 69 days after transplanting (dat), the second at 89 dat, and the third at 105 dat. The morphological evaluation began 15 days after sowing and continued every 15 days, specifically at 30 and 45 days after sowing, and then at 15, 30, 45, 60, 75, 90, and 105 days after transplanting (dat).
2.6.4. Number of Leaves
It was measured in seedlings at 14, 30, and 45 days after sowing (dds) [15].
2.6.5. Stem Diameter (cm)
The stem diameter was measured using a digital caliper (Truper®), which involved placing the caliper 5 cm above the base of the plant stem. Measurements were taken every 15 days during the vegetative, flowering, and fruiting stages [16].
2.6.6. Plant Height
To measure the height, a measuring tape was used from the ground level to the apical meristem of the plant's primary stem [16].
2.6.7. Leaf Area
The leaf area was determined using the method described by Swart [17]. The measurement was performed on a fully expanded true leaf of more than 2 cm. The length in cm (L), width in cm (W), and area in cm² (A) were measured for individual leaves.
Where: L is the distance from the tip of the leaf to the branching point of the main vein, and W is the widest region across the lamina perpendicular to the length.
2.6.8. Number of Fruits and Yield per Plant
The total number of fruits per plant was counted starting from the setting of each plant; fruits that reached their commercial size with bright green coloration were selected. They were then weighed with an electronic scale (Rhino®) to obtain the total yield of fruit per plant [18].
2.7. Physicochemical Determination
2.7.1. Number of Fruits and Yield per Plant
The chlorophyll content was determined according to the methodology of Porra [19]. A mature leaf was collected from the middle part of the plant for each treatment, and these were stored in a cooler during transport from the greenhouse to the laboratory for processing. The leaves were washed with deionized water, and pieces of approximately 2 cm² were cut. For the extraction of photosynthetic pigments, 3 g of leaves for each treatment were weighed in triplicate and placed in a mortar with 6 mL of 80% acetone, and ground until a homogeneous sample was obtained. Subsequently, 4 mL of the supernatant from the pigmented sample was placed in 15 mL conical tubes and centrifuged at 10,000 rpm for 20 minutes, avoiding direct light exposure. Finally, 0.25 mL of the supernatant from each extract was taken and diluted to 10 mL with 80% acetone. Measurements were performed using a VELAB™ UV-Visible spectrophotometer, model VE-5100UV, by placing 1 mL of each obtained sample in 10 mm quartz cuvettes. Absorbance readings were taken at three wavelengths (470, 647, and 664 nm) established for each pigment.
2.7.2. Cellular Extract of Petiole, Electrical Conductivity, and pH
To determine the nutrients present in the plant, an extract obtained from the petiole was used. This involved selecting a mature leaf taken from the middle part of the plant for the four treatments, which were then stored in Ziploc bags inside a cooler at 5 °C. It is important to mention that the leaves were collected at 8 in the morning. The processing consisted of extracting the sap with a press, obtaining 2 mL for analysis in multiparametric photometers for nitrogen (HORIBA LAQUAtwin NO311), phosphates (HANNA Checker® HI706), potassium (HORIBA LAQUAtwin K11), electrical conductivity (HANNA® LAQUAtwin EC11), and pH (HORIBA LAQUAtwin pH11). For the determination of Brix degrees, a digital refractometer (HANNA® HI96801) was used [20] the determination of phosphate, 1 mL of HI717-25-phosphate (reagent A) was added to a cuvette and brought up to 10 mL with HI717-25-phosphate (reagent B). This mixture was then introduced into the spectrophotometer as a blank. The cuvette was removed, and finally, 0.5 mL of the sample was added for reading in the multiparametric photometer (HANNA® HI83399) [21].
2.7.3. Quality Parameters in Fruits
It is important to mention that for these variables, they were classified into three groups (small, medium, and large) according to the Mexican Standard for non-industrialized food products for human consumption—fresh chili (Capsicum spp.) [22]. This involved selecting 10 fruits from each group and treatment.
2.7.4. Length and Diameter
Two cuts were taken from the fruits of small, medium, and large sizes, with 10 repetitions per treatment. A measuring tape was used to measure the length, and a digital caliper (Truper®) was used for the diameter.
2.7.5. Individual Weight
This was calculated as the average of 10 fruits of three sizes: small, medium, and large for each treatment from two harvests, using a digital scale (Rhino®) model BAPRE-3 with a precision of 0.2 g and a compact design [23].
2.7.6. Pericarp Thickness and Number of Locules
To determine these variables, 10 fruits of three different sizes: small, medium, and large were used for each treatment. The fruits were cut in half, and the thickness of the pericarp was measured for each fruit using a digital caliper (Truper®). The number of cavities present in each fruit was then counted.
2.7.7. Brix Degrees and Total Titratable Acidity
Ten chilies of small, medium, and large sizes were selected for each treatment. Three grams of each sample were weighed and homogenized in a blender with 20 mL of deionized water for 2 minutes. For the determination of Brix degrees, two drops of the mixture were placed on a digital refractometer (HANNA® HI96801). For total titratable acidity (TTA), the obtained sample was placed in a 125 mL Erlenmeyer flask, and 3 drops of 1% phenolphthalein reagent were added. The sample was titrated with standardized 0.1 N NaOH until the endpoint color (very pale pink) was reached. The reference color solution was prepared by mixing 1 g of phenolphthalein and diluting it to 100 mL with ethanol. The percentage of acid present in the sample was reported by applying the following formula:
Where: A is the volume of NaOH used; B is the normality of NaOH (0.097 meq mL⁻¹); C is the equivalent mass expressed in grams of citric acid (0.064 g meq⁻¹); D is the mass in grams of the sample used (10 g).
2.7.8. Conductivity and pH
Electrical conductivity was determined using the HANNA® (LAQUAtwin EC11) equipment, and for pH, the HORIBA (LAQUAtwin pH11) was used. Ten grams of fruits of small, medium, and large chili peppers from each treatment were homogenized in a blender with 20 mL of deionized water for 2 minutes. Subsequently, 2 drops of the mixture were taken and placed in the equipment.
2.7.9. Capsaicin Content
This was carried out following the methodology of Maurya [24], with some modifications. Ten fruits of small, medium, and large sizes were selected for each treatment (control, chitosan, Bacillus subtilis, and chitosan + Bacillus subtilis). First, they were cut into slices and placed on a stainless steel tray to be dried in an oven at 60 °C for 48 hours. After this process, 0.2 g of each sample was placed in a test tube, and 16 mL of ethanol was added, then heated to 80 °C for 4 hours, shaking every 30 minutes. The mixture was allowed to cool and settle for approximately 1 hour, and the supernatant was filtered using Whatman filter paper. The determination of capsaicin was carried out using a spectrophotometric method. Absorbance readings at 280 nm were taken using a UV-Vis spectrometer (Thermo Scientific). Finally, the calibration curve was prepared with pure capsaicin (Sigma-Aldrich) dissolved in ethanol in a concentration range of 10 - 200 mg L⁻¹ [25].
3. Results
3.1. Characterization of Chitosan
The results of the analysis of shrimp exoskeleton samples, UNPA chitosan, and Sigma chitosan are presented in Table 2, showing the contents of minerals (% M), Demineralization (% DM), Deproteinization (% DP), proteins (% P), moisture (% H), and pH (hydrogen potential) in each sample.
From the analyses performed, differences were found between the samples in terms of their chemical composition and physical properties. The shrimp exoskeleton shows a high content of minerals (24.6%) and proteins (44.62%), making it a rich source of these components. This composition is expected, considering the structural and protective function of the exoskeleton in shrimp. Additionally, the low moisture level (6.5%) and slightly alkaline pH (8.8) are consistent with the typical characteristics of marine biological materials. On the other hand, both UNPA chitosan and SIGMA chitosan show much lower contents of minerals and proteins, indicating a process of demineralization and deproteinization during their production. These results suggest efficient removal of impurities and undesirable components to obtain high-purity chitosan. However, a notable increase in moisture content is observed in the chitosans (11.5% and 11.33%, respectively), which can be attributed to the extraction and purification process. Furthermore, both chitosans exhibit an acidic pH (3.4), probably due to the acidic nature of the deproteinization processes. The differences in chemical composition and physical properties between the shrimp exoskeleton and the derived chitosans have important implications for their industrial applicability. While the shrimp exoskeleton can be valued as a natural source of minerals and proteins in the food and supplement industries, UNPA and SIGMA chitosans are more suitable for agricultural applications due to their purity and specific physicochemical properties. Finally, these results highlight the importance of understanding the chemical composition and properties of biological materials and their derivatives for effective use in various industrial and nutritional applications. The results of the colorimetric analysis for the shrimp exoskeleton, UNPA chitosan, and SIGMA chitosan are presented in table 3. The color coordinates L* (luminance), A* (red/green axis), and B* (yellow/blue axis) are shown, along with the color description and corresponding color chart.
These results reveal significant differences in color profiles among the analyzed samples. The shrimp exoskeleton exhibits a "pale grayish medium tone" with L* (luminance), A* (red/green axis), and B* (yellow/blue axis) values of 62.23, 1.17, and 16.3, respectively. This color may be characteristic of the chemical composition and structure of the exoskeleton, with the presence of natural pigments that give it this specific hue. On the other hand, both UNPA chitosan and SIGMA chitosan show lighter and less saturated colors compared to the shrimp exoskeleton. UNPA chitosan presents a "grayish medium white tone," with L*, A*, and B* values of 75.63, 0.56, and 3.46, respectively. Meanwhile, SIGMA chitosan exhibits a "medium brown tone," with L*, A*, and B* values of 65.56, 4.8, and 12.1. These colors may be influenced by the extraction and purification process of chitosan, as well as by the chemical composition of the starting materials.
The difference in color profiles between shrimp exoskeleton and derived chitosans may be important in terms of their application in various industries. For example, the lighter and neutral color of chitosans may make them more suitable for use in applications where the color of the material is an important factor, such as in the food or pharmaceutical industries. Meanwhile, the characteristic color of shrimp exoskeleton may be useful in applications where the aim is to harness its natural and authentic properties, such as in the manufacturing of cosmetic products or dietary supplements. These results highlight the importance of considering the color profile along with other physical and chemical properties when selecting and using biological materials and their derivatives in various industrial and research applications.
3.2. Infrared Spectroscopy (FT-IR)
An FT-IR analysis was performed to confirm the structure of UNPA chitosan, comparing it with Sigma chitosan by identifying the characteristic bands of this polymer. Figure 1 shows the obtained FT-IR spectra, where the O-H and N-H groups are observed at 3445 and 3280 cm⁻¹, respectively. The band corresponding to the C-N group is found at 1554 cm⁻¹, while the amide III band is located at 1377 cm⁻¹. The bands for the C=O linkages of amide I are identified at 1630 cm⁻¹, and the stretching bands N-H for amide I are found at 3260 cm⁻¹. For Sigma chitosan, the most representative bands of the biopolymer are found at 3438 cm⁻¹, corresponding to the N-H stretching for amide I and the broad vibration of the hydroxyl groups. Another characteristic band of the carbonyl group is observed at 1633 cm⁻¹. It is important to note that these bands are presented with lower intensity compared to UNPA chitosan.
3.3. Growth Response in Seedlings
In Figure 2, the results of the morphological parameters in seedlings are presented, evaluated at 15, 30, and 45 days after sowing (DAS), aiming to measure plant height (A), stem diameter (B), and number of leaves (C). The results revealed that at 15, 30, and 45 DAS, the combined treatment of Q + BS showed greater height, with means of 6.88 ± 0.10, 10.82 ± 0.26, and 17.54 ± 0.46 cm, respectively. However, at 15 DAS, no significant differences were observed among the treatments T, Q, and BS. Similarly, at 30 and 45 DAS, there were no significant differences between treatments Q and T, but significant differences were detected in the treatment with BS, which presented the lowest height, with means of 8.67 ± 0.21 and 14.22 ± 0.40 cm, respectively.
Regarding stem diameter, the most effective treatment at 15, 30, and 45 DAS was the combination of Q + BS, with means of 1.49 ± 0.10, 1.55 ± 0.10, and 2.20 ± 0.10 mm, respectively. However, at 15 DAS, no significant differences were found between treatments Q and BS, with treatment BS presenting a lower diameter, showing no significant differences with treatment T. At 30 DAS, no significant differences were found between treatments Q and T either. Similarly, at 45 DAS, no significant differences were found among all treatments.
In relation to the number of leaves, no significant differences were observed among the four treatments at 15, 30, and 45 DAS. This phenomenon suggests that while the combination of Q + BS showed advantages in height and stem diameter at certain time points, it did not significantly influence the number of leaves. These results highlight the importance of considering the combination of different treatments to maximize growth and development in seedlings under specific conditions.
3.4. Plant Development
In Figure 3, the morphological growth parameters of Soledad chili plants are presented, evaluated at 15, 30, 45, 60, 75, 90, and 105 days after transplanting (DAT). These parameters include plant height (A), stem diameter (B), leaf area (C), and the number of shoots (D). It was observed that for the height variable, no significant differences were found between treatments at 15, 30, 45, 90, and 105 DAT. However, at 60 DAT, the treatment with BS showed a greater height (120.19 ± 2.68 cm), distinguishing itself from the control and the combination of Q + BS, although it did not show significant differences with the application of Q, which reached a height of (114.8 ± 2.33 cm). Similarly, at 75 DAT, the combination of Q + BS presented the greatest height (137.50 ± 3.65 cm), with no significant differences with the BS treatment (133.60 ± 3.19 cm), but significant differences compared to the other treatments. Regarding stem diameter, the control showed significant differences compared to the other treatments (Q, BS, and Q + BS), with the combination of Q + BS exhibiting the greatest diameter (0.307 ± 0.006 cm). Furthermore, no significant differences were observed between treatments and the control at 30, 45, 60, 75, 90, and 105 DAT. In relation to leaf area, the best treatments at 15 DAT were Q and Q + BS (33.65 ± 1.77 and 32.16 ± 2.01 cm² respectively), with no significant differences between them, but significant differences when compared to the control and BS. At 30 DAT, the greatest leaf area was obtained with the application of Q (59.57 ± 3.49 cm²), followed by the control, with no significant differences between these two treatments. However, the control did not show significant differences concerning the other treatments (BS and Q + BS).
In the following time intervals, significant differences between treatments varied, highlighting the superiority of the combined treatment Q + BS at 75 DAT. Regarding the number of shoots, at 15 DAT, the application of Q and Q + BS showed better results (7.05 ± 0.29 and 6.25 ± 0.29 shoots, respectively), with no significant differences between them, but significant differences compared to the other treatments. In summary, variability was observed in the performance of the treatments throughout the study period, emphasizing the effectiveness of the combination of Q + BS in various aspects of the growth of Soledad chili plants. These results may be useful for optimizing cultivation practices and improving the yield of this particular crop.
3.5. Determination of Photosynthetic Pigments (Chlorophyll a and b)
In Figure 4, the results obtained for photosynthetic pigments at 30, 60, 90, and 105 days after transplanting (DAT) are shown for chlorophyll A (A), B (B), and the sum of both (C). It was observed that for chlorophyll A at 30 DAT, no significant differences were found between the treatments compared to the control treatment (T). However, at 60, 90, and 105 DAT, the treatment with Q showed higher concentrations of chlorophyll A (5.97 ± 0.35, 2.41 ± 0.03, and 2.14 ± 0.07 μg mL⁻¹, respectively). At 60 DAT, the control (T) did not show a significant difference compared to the application of Q, nor did the application of BS and the combination of Q + BS compared to the control, with the BS application presenting the lowest levels of chlorophyll A at a concentration of 2.15 ± 0.85 μg mL⁻¹. At 90 DAT, the application with BS showed no significant differences compared to T, with the combination of Q + BS presenting the lowest concentration of chlorophyll A (1.10 ± 0.17 μg mL⁻¹). At 105 DAT, no significant differences were found between the treatment with Q and the control; however, Q showed higher chlorophyll values but did present differences compared to the treatments with BS and the combination Q + BS.
Regarding chlorophyll B, the best results at 30 and 60 DAT were obtained with the application of Q, showing concentrations of (4.13 ± 0.42 and 6.74 ± 0.55 μg mL⁻¹, respectively). For 90 and 105 DAT, the highest concentration was observed in the combination of Q + BS (0.73 ± 0.08 and 13.87 ± 0.82 μg mL⁻¹, respectively), followed by the application of BS with 3.34 ± 0.20 μg mL⁻¹, which showed no significant differences. The application of BS showed no differences compared to T at 60 and 90 DAT, with a concentration of 2.69 ± 0.03 μg mL⁻¹, nor with the combination of Q + BS, which presented the lowest concentration of chlorophyll B (1.96 ± 0.33 μg mL⁻¹). It was observed that the combination of Q + BS and the individual application of Q showed promising results in the concentrations of chlorophyll A and B at different evaluation times. These findings suggest the potential of these treatments to enhance photosynthesis and, consequently, the growth and development of Chile Soledad plants under specific conditions.
3.6. Cellular Extract Content of Petiole
The analysis of sap in the petiole allowed establishing the relationship between the application of chitosan, Bacillus subtilis, and the combination of UNPA chitosan with Bacillus subtilis in the variables of electrical conductivity (μs cm-1) (A), pH (B), and Brix degrees (C) at 30, 60, 90, and 105 days after transplanting (DAT), as shown in Figure 5. It was determined that at 30, 60, and 105 DAT, there were no significant differences in electrical conductivity among the treatments compared to the control (T); however, at 90 DAT, the treatment that presented the highest electrical conductivity was T (600 μs cm-1), which showed a significant difference compared to the other treatments, followed by the application of Q (453 ± 17.55 μs cm-1). Regarding the treatment with BS, it presented a conductivity of (364.66 ± 2.90 μs cm-1), while the combined treatment Q+BS had the lowest electrical conductivity (246.33 ± 11.34 μs cm-1). Concerning the pH values recorded (B), from 30 DAT, the pH of the crop did not show significant differences among the treatments, remaining above 5 ± 0.40; at 60 DAT, the treatments with the highest pH were BS (6 ± 0.40) and T (6.1 ± 0.05), with no significant differences between them. At 90 DAT, the BS and T treatments presented a pH of 6.1 ± 0.03, with no significant differences between them, while Q had a pH of (4.7 ± 0.05) and Q+BS (3.06 ± 0.03). Finally, at 105 DAT, the treatments with the highest pH were Q+BS and T (5.5 ± 0.05), with no significant differences between them, nor between Q and BS (4.76 ± 0.12) and (5.03 ± 0.03), respectively. Lastly, regarding the concentration of Brix degrees (Figure 6C), at 30, 60, 90, and 105 DAT, the treatment with the highest concentration was observed with the application of Q, with values exceeding 3 ± 0.03. However, at 30 DAT, there were no significant differences compared to the combined treatment Q+BS, which showed a value of 2.53 ± 0.06. At 60 DAT, significant differences were observed among all treatments, where BS, T, and Q+BS had values of 3.76 ± 0.06, 3 ± 0.05, and 2.26 ± 0.03, respectively. At 90 DAT, the combined application Q+BS presented values of 3.1 ± 0.01, followed by the control with values of 2.7 ± 0.0, while BS had the lowest values of 2.1 ± 0.0. Similarly, at 105 DAT, it was determined that the highest value, followed by Q, was T with values of 3.76 ± 0.0; however, for the combined application Q+BS and BS, no significant differences were observed (2.16 ± 0.12 and 1.8 ± 0.05).
The results of the concentration of nitrates, phosphates, and potassium in sap (mg L-1) evaluated at 30, 60, 90, and 105 DAT for each treatment are shown in Figure 6D. At the end of the evaluation, it was determined that the highest concentration of nitrates at 30, 60, 90, and 105 DAT was found in the treatment with Q, showing values exceeding (1000 ± 33.33 mg L-1); however, at 30, 60, and 90 DAT, no significant differences were observed with the treatment with BS, which showed values exceeding (900 ± 33.33 mg L-1). However, at 60 and 90 DAT, no significant differences were shown between treatments compared to the control, but differences were noted at 105 DAT. Regarding the concentration of phosphates present in the sap, it was determined that the highest concentration at 30, 60, 90, and 105 DAT was found with the application of BS, showing values of (820 ± 20.81, 430 ± 51.96, 992.66 ± 3.17, and 490 ± 40.41 mg L-1) respectively; however, at 60 DAT, no significant difference was shown compared to the application with Q and the combination of Q + BS. Regarding the concentration of potassium, it was determined that at 30, 60, and 90 DAT, no significant differences were observed concerning the treatments, but at 90 DAT, the combination of Q + BS showed a higher concentration (1566.66 ± 33.33 mg L-1); however, it did not present differences compared to treatments Q and BS.
3.7. Number of Fruits and Yield per Plant
The following presents the results obtained from the number of fruits per treatment for each cut made in the experiment. The first cut was made 69 days after transplanting (DAT), the second at 85 DAT, and the third and final cut at 106 DAT. The results are detailed in Table 4. In the first cut, the combination of Q + BS showed the highest number of fruits (22.0 ± 3.08 fruits), while the Q treatment presented the lowest number (16.0 ± 3.47). However, no significant differences were found between the treatments. In the second harvest, the highest number of fruits was recorded with the application of BS (49.80 ± 5.78 fruits), but no significant differences were observed between the Q and Q + BS treatments, although there were differences compared to the control (T), which had the lowest number of fruits. For the last harvest, the highest number of fruits was observed in the Q application (41.55 ± 4.11 fruits). Similarly, no significant differences were found between the Q + BS and BS treatments, but differences were noted compared to the control, which showed the lowest number of fruits per plant. The application of the biofertilizers did not show significant differences in the total weight of the fruit in cuts 1 and 3. In contrast, in cut 2, significant differences were observed between treatments compared to the control, with the Q application showing the highest fruit weight at 110.74 ± 11.07. These results are shown in Table 5.
3.8. Overall Yield
The analysis of the effect of biofertilizers on the accumulated yield per plant from the three cuts performed is presented in Figure 7. In the representation of the number of fruits by treatment (A), it is highlighted that the highest number of fruits was obtained with the application of Q (104.4 ± 6.02 fruits). However, no significant differences were found compared to the treatments with BS and Q + BS, which presented averages of (101.75 ± 7.56 and 91.89 ± 5.19 fruits) respectively.
Significant differences were observed regarding the treatment T, which showed the lowest number of fruits (57.75 ± 4.65). As for the accumulated weight per plant in grams (B), the highest amount was evidenced with the application of Q (246.86 ± 10.66 grams). However, no significant differences were found compared to the application with Q + BS (228.04 ± 41.76 grams). In contrast, the application with BS yielded (201.37 ± 15.39 grams) per plant, with no significant differences compared to the control, which showed the lowest fruit weight. In summary, the results show that the application of Q led to a higher number and weight of fruits per plant compared to the treatments with BS and Q + BS. Additionally, a significant difference in fruit yield was observed between the treatments and the control, highlighting the positive impact of the application of biofertilizers, particularly Q, on the yield of Soledad chile.
3.9. Fruit Quality
Next, Figure 8 presents the data obtained on the morphology for fruit quality from the first harvest. Variables such as fruit length (cm) (A), fruit diameter (cm) (B), fruit weight (g) (C), pericarp thickness (cm) (D), and number of locules (E) in three different sizes (small, medium, and large) were analyzed. It was determined that the fruit length in all three sizes was greater when the combined treatment Q + BS was applied, with averages of (5.32 ± 0.1, 6.29 ± 0.2, and 7.72 ± 0.2 cm) for the small, medium, and large sizes, respectively.
However, in the small size, there were no differences compared to the treatment with BS, and in the medium size, no significant differences were observed among the other treatments. Regarding fruit diameter, the largest diameter was shown in the application with Q + BS, with values of (8.17 ± 0.3, 8.36 ± 0.3, and 9.56 ± 0.3) respectively for small, medium, and large sizes. In terms of fruit weight, in the small size classification, the heaviest fruits were found in the application with Q, followed by BS (2.15 ± 0.1 and 1.87 ± 0.1 g), respectively, with no significant differences between both treatments. In the large size classification, the combination of Q + BS showed the greatest fruit weight, followed by the application with Q. Regarding pericarp thickness, in the small, medium, and large classifications, a greater thickness was observed with the combined treatment Q + BS; however, in the small size, no significant differences were found compared to the treatment with Q, but there were differences compared to the BS treatment and the control. In summary, the results indicate that the application of the combined treatment Q + BS showed significant improvements in various aspects of fruit morphology and quality, such as length, diameter, weight, and pericarp thickness, compared to the individual treatments and the control.
Figure 9 presents the data obtained on the number of locules (E1) and the physicochemical quality variables in the fruits from the first harvest: degrees Brix (F1), percentage of citric acid (G1), and pH (H1). Regarding the number of locules, no significant differences were observed in the small and medium classifications, but significant differences were noted in the large category. The treatment with Q showed the highest number of locules, exceeding 5; however, it did not differ significantly from the treatments with BS and Q + BS, but did differ from the control treatment, which had an average of 4 locules.
In the physicochemical determinations of the fruit, it was observed that for the small size classification, the highest concentration of degrees Brix was found in the control (3.15), while Q and the combined treatment Q + BS showed lower concentrations (1.2 and 1.3, respectively), with no significant differences between both treatments. In the medium size, the highest concentration of degrees Brix was observed in the treatment with Q (3.8), showing significant differences compared to the other treatments, while BS and Q + BS had the lowest concentrations (1.9 and 2, respectively), with no significant differences between them. In the large classification, the highest concentration of degrees Brix was observed in Q and the control (2 and 2.3 ± 0.1, respectively), with no significant differences between them, but significant differences were observed compared to BS and the combined Q + BS.
Regarding the percentage of citric acid, in the small classification, treatment T showed the highest concentration (0.05%), with significant differences compared to the other treatments, while Q and Q + BS had the lowest concentration (0.01%), with no differences between them. For the medium size, the highest concentration was found in the combination Q + BS (0.04%), showing significant differences compared to the other treatments, but no differences between Q and BS (0.01 and 0.02%, respectively). In the large classification, the highest concentration of citric acid was observed with Q (0.049%), showing significant differences compared to the other treatments. When determining the pH, it was observed that in the small size classification, the treatment with Q presented a higher pH (5.9), with significant differences compared to the other treatments.
However, no differences were found among BS, Q + BS, and T. For the medium size, the highest pH was found in the treatments BS and Q (5.9), with no significant differences between them, but significant differences were noted compared to the other treatments, where Q + BS and T showed lower pH (5.7). In the large classification, the highest pH was presented in the combined treatment Q + BS (5.9); however, it did not differ significantly from the treatments with Q and BS (5.8), respectively, but it did differ from the T, which showed a pH of 5.6. The results indicate that the combined treatment Q + BS shows significant improvements in several physicochemical quality aspects compared to the individual treatments and the control, particularly highlighting the number of locules, degrees Brix concentration, percentage of citric acid, and pH, underscoring its effectiveness in improving fruit quality.
Figure 10 presents morphological data on fruit quality from the second harvest. Variables analyzed include fruit length (cm) (A2), fruit diameter (cm) (B2), fruit weight (g) (C2), pericarp thickness (cm) (D2), and the number of locules (E) across three size classifications (small, medium, and large). For the fruit length variable, no differences were observed among treatments in the small and medium classifications. In the large classification, the combined treatment of Q + BS showed the greatest length (7.3 ± 0.2 cm), but no significant difference compared to the Q and BS treatments, which measured 6.9 and 6.7 ± 0.2 cm, respectively. However, both treatments differed from the control treatment (T), which had the shortest length (6.47 ± 0.2 cm).
Regarding fruit diameter, the highest diameter in the small classification was found in the Q treatment (0.802 ± 0.02 cm). There were no differences compared to the combined treatment Q + BS (0.692 ± 0.04 cm), but differences were noted between these and the BS and T treatments, although there were no significant differences between T and BS. In the medium size classification, no significant differences were found among the four treatments. Finally, in the large classification, the largest fruit diameter was in the combined treatment Q + BS (0.916 ± 0.03 cm), although it did not differ significantly from Q and BS treatments, but did differ from the control.
For fruit weight in the small classification, the BS treatment recorded the highest weight (2.02 ± 0.2 g), followed by the Q treatment (1.91 ± 0.1 g), with no significant differences between these treatments. In the medium classification, there were no significant differences among all treatments. In the large classification, the greatest fruit weight was noted in the Q + BS, Q, and BS treatments (4.11 ± 0.2, 4.02 ± 0.2, and 3.78 ± 0.1 g, respectively), showing no differences among these treatments but differing significantly from the control.
Regarding pericarp thickness, no differences were found among treatments in the small and medium classifications. However, in the large classification, the BS treatment showed the greatest pericarp thickness, although it did not differ from the combined Q + BS and T treatments but did differ from the Q treatment.
Figure 11 presents data on the number of locules (E2) and physicochemical quality variables from the second harvest: Brix degrees (F2), citric acid percentage (G2), and pH (H2). In the small and medium classifications, no significant differences in the number of locules were found among treatments. However, in the large classification, the combined Q + BS treatment exhibited the highest number of locules, followed by BS and Q, with no significant differences among these treatments but differing from T, which had the fewest locules.
The concentration of Brix degrees in the three classifications (small, medium, and large) was highest in the control treatment, showing concentrations of (3.43, 3.66, and 2.33, respectively), with significant differences in the small and medium sizes compared to other treatments. In the medium size classification, the lowest concentration was observed in the BS treatment (1.3), while the large classification showed no significant differences among treatments.
Regarding citric acid concentration in the small size classification, the highest concentration was found in the Q treatment, causing differences compared to other treatments. However, BS and T showed no differences, while the combined Q + BS treatment had the lowest concentration (0.03%). In the medium classification, the highest citric acid concentration was found in the Q treatment (0.115%), differing from the other treatments, while the BS and T treatments did not show differences, both having concentrations of (0.44%). In the large classification, the control treatment had the highest citric acid concentration (0.05%), showing differences from the other treatments, but Q and the combination with Q + BS showed no significant differences (both at 0.040%), while the lowest concentration was in the BS treatment (0.032%).
Finally, the pH concentration in the small classification was highest in the Q and BS treatments (5.8 and 5.9, respectively), with no significant differences between these treatments. Similarly, Q + BS and T treatments did not show significant differences, with pH values of (5.6 and 5.7, respectively). In the medium classification, the highest pH was found in the combined treatment (5.9), with no significant differences from T and Q treatments (both at 5.8). However, T and Q differed from the BS treatment, which had a pH of (5.7). In the large classification, no significant differences were found among treatments, with pH values ranging from (5.7 to 5.9).
4. Discussion
4.1. Characterization of Chitosan
A comparison of yields was made with various authors based on the results obtained in our procedure. As a result, a yield of 25.19% in UNPA chitosan was achieved, which was compared with the results obtained by [26,27,28], who achieved lower yields of 74%, 61%, and 53.75%, respectively. This was attributed to the increase in temperature during the deproteinization and demineralization process, as well as the higher concentration of the solvents used. On the other hand, Luo [29] presented a yield of 14.5% because the extraction was performed using different solvents and concentrations. These differences can be explained by various factors, including sample processing, treatment type, solvent concentration, sample type, and origin. According to De Castro [30], possible causes for obtaining a low yield in chitosan are that the treated sample contains a higher amount of proteins and fats, as the composition of chitosan from different sources (crustaceans, insects, and fungi) varies not only with the species in question but also with the characteristics used for chitosan extraction, which complicates the comparison among various authors.
Similarly, a comparison was made between commercial SIGMA chitosan and UNPA chitosan based on the percentage of minerals. The result was 2.71% for UNPA chitosan, which, when compared to the results obtained by Luo and Hernández-Cocoletzi [30,31], who obtained chitosan from shrimp exoskeleton with 0.95% and 1.40% minerals, is superior. Conversely, when comparing our results with those presented by Martínez-Díaz [32], who evaluated chitosan from exoskeletons of estuarine and offshore shrimp, using the same methodology, which resulted in 14% and 24% final minerals; Torres [33] evaluated chitosan from shrimp of different origins, finding 29% and 18% minerals. Additionally, Castro and Vidal found mineral values of 29.0% in chitosan from Emerita analoga exoskeletons [34]. The results obtained for each author differ because Martínez-Díaz and Ramírez state that the physicochemical properties of chitosan depend on both the sources and the production conditions of the shrimp [32].
Regarding SIGMA chitosan, its percentage of minerals was 4.5%. Based on these results, it has been confirmed that UNPA chitosan presents superior quality compared to commercial SIGMA chitosan, according to the parameters established by Kumar [35]. These same authors mention that for high-quality chitosan, the mineral percentage should be less than 1%, and a low ash content can be an essential factor for better solubility. Therefore, the percentage of ash is influenced by the presence of mineral impurities, such as calcium, CaCO3 salt content, or even by metal contaminants. This result is largely subject to the origin, properties, and extraction conditions [31].
In relation to the percentage of demineralization, values of 97.28% and 95.46% were obtained for UNPA and SIGMA chitosan, respectively. These values contrast with the 98% obtained by [36]. The percentage of protein obtained from the exoskeleton is identical to that reported by Suárez-Villa [37], at 44.7%, and lower than that obtained by Cisneros-Pérez [38], at 42.33%, and higher than that reported by Luna [39] at 36.2%. A final protein percentage of 7.43% was obtained for chitosan, which is higher than the 2.83% achieved by Álvarez and Gómez [40]. On the other hand, Castro and Vidal [41] achieved a protein percentage of 0.83%, although it exceeds that achieved by Martínez-Díaz and Ramírez [32] in high-seas and estuarine shrimp chitosan, which were 34.67% and 37.16%, respectively. The 7.43% of protein in UNPA chitosan is very low compared to the protein content in the shrimp exoskeleton we obtained, which is 44.62%. This confirms that the deproteinization process was effective, as a significant number of proteins were eliminated.
According to the results obtained for the percentage of deproteinization, percentages of 83.34% and 80.01% were achieved for UNPA and SIGMA chitosan, respectively. Compared to the 87.5% deproteinization obtained by Pérez [36], the values obtained were lower. On the other hand, Castro and Vidal [41] obtained a percentage exceeding 89%. Regarding the moisture percentage, values of 11.5% and 11.3% were obtained for UNPA and SIGMA chitosan, showing a contrast with the 14% obtained by Martínez-Díaz and Ramírez [32], presenting lower results. In contrast to the results obtained by Torres [33] at 0.96% and Luo [29] at 2.7%, higher results were evidenced, while Velasco [42] analyzed two exoskeleton samples, obtaining values below 6.6% and 6.5%. The value obtained from UNPA chitosan is estimated to be equivalent to that of commercial chitosan at 11%, according to the findings of Barra-Romero and Beltramino [43].
With these results, it is confirmed what Martínez-Díaz and Ramírez [32] reported, indicating higher moisture in shrimp chitosan, evidencing a decrease in the molecular mass of the polymer, given that a greater amount of free hydrophilic groups, such as hydroxyls, amines, and aldehydes, at the end of the polymer chain increases the hygroscopicity of the polymers after deacetylation. These results explain the increase in water absorption capacity as humidity following dehydration. Additionally, it is noted that moisture content is one of the fundamental factors for evaluating chitosan. Molecular water is adsorbed onto the polymer chains, exerting a plasticizing effect on thermal stability and structure. Likewise, the moisture percentage is related to the removal of acetyl groups as a consequence of the thermo-alkaline deacetylation of chitin, which generates free amino groups in the polymer chain. This site is sensitive to the formation of hydrogen bonds with the oxygen of free radical -OH [44].
Finally, the pH obtained in the shrimp exoskeleton was 8.8, while that of UNPA chitosan and SIGMA chitosan is 3.4, values higher than 4 and 4.5 in high-seas and estuarine shrimp [32]. The pH of chitosan is a quality parameter, as it constitutes a component of its chemical characteristics. It should be noted that there have been no studies conducted to evaluate the level of depigmentation in chitosan using the Hunter Lab method, which prevents comparisons from being made. However, it is maintained that this depigmentation is associated with the oxidative effect of sodium hypochlorite, and that the color obtained from chitosan depends on its commercial value, as established by Romero-Serrano and Pereira [45]. The chitosan that exhibits the highest commercial value is beige, obtained from fungi, followed by white to grayish chitosan, obtained from squid and shrimp. This is related to our results for UNPA chitosan, which has a whitish-gray color with color number #BEBAB4. The price of chitosan ranges between $700,000 and $800,000 pesos per ton, depending on its purity [46].
The levels of deacetylation, deproteinization, demineralization, moisture percentage, pH, and color are considered, along with the factors influencing its commercial value [45]. It is required to point out that particle size has an effect on the processes of deproteinization and demineralization [47].
4.2. Infrared Spectroscopy of Chitosan
For UNPA chitosan, the O-H and N-H groups were reported at bands of 3440 and 3280 cm⁻¹, respectively, which fall within the range identified by Gallardo [48]., who recognized these groups at bands of 3300 to 3500 cm⁻¹. Similarly, these findings align with those obtained by González and Silva [49], at 3430 cm⁻¹, while Martínez-Robinson [49] reported a band at 3363 cm⁻¹. The C-N group was found in the band located at 1380 cm⁻¹ according to González and Silva [50], who also detected it at bands of 1581 cm⁻¹. Furthermore, the amide III band was located in the range obtained by González and Silva [50] at 1376 cm⁻¹.
The C=O bonds of amide I were found at bands of 1660 cm⁻¹, which are higher than those reported by González and Silva [50] at 1646 cm⁻¹. They mentioned that the most representative bands of chitosan correspond to the N-H stretching for amide I, which were found at bands of 3289 cm⁻¹, while UNPA chitosan was found at bands of 3260 cm⁻¹. In fact, the broad O-H stretching vibration band was located at 3440 cm⁻¹, lower than the 3471 cm⁻¹ reported by González and Silva [50]. Martínez-Robinson [49] also showed strong typical bands at 1644 cm⁻¹ (amide I, C=O group, stretching vibration). It was confirmed that the N-H stretching bands belonging to amide I were found at 3260 cm⁻¹, while González and Silva [50] found them at 3289 cm⁻¹, reaffirming that these are the most representative bands of chitosan.
4.3. Seedling Growth
In the variable seedling height, it was demonstrated that the combination of Q + BS resulted in greater height, differing from the other evaluated treatments. Similarly, in stem diameter at different stages, Q and the combination of Q + BS showed positive effects. The results obtained can be explained based on the findings of Chávez [51], who argue that various biological microorganisms used as plant growth promoters utilize chitosan as a carbon source, thereby increasing their populations in response to its application. Consequently, the combination of chitosan with Bacillus subtilis led to an increase in its population, which improved its metabolic functions; these mechanisms have been corroborated by Dircio [52] who mention improvements in crop growth and yield. Finally, Luna Martínez [53] confirmed in their research that these mechanisms employed by the bacteria increase the availability of micronutrients, such as iron (Fe), in the rhizosphere. Iron can be captured by siderophores, organic molecules secreted by these bacteria, forming chelates that can be assimilated by plants for better development. Likewise, González-Peña [54] demonstrated that chitosan promotes the development of the root system (roots) and strengthens the vigor and degree of lignification of tomato plants through Acquired Systemic Resistance (SAR).
The bio-stimulant effect shown in this study could be attributed to its chemical composition, consisting of linear polymers with structural units of 2-amino-2-deoxy-D-glucopyranose linked by 1,4 glycosidic bonds [55]. Once the plant comes into contact with this biopolymer, a cascade of signaling is triggered, stimulating defense mechanisms mediated by SAR, which, in turn, produces a significant increase in the roots, allowing for greater nutrient absorption, thereby strengthening and enhancing their vigor [56].
When comparing height with the results obtained by Izquierdo-Oviedo [57], who reported a height of 3.99 cm after applying chitosan to the roots and foliage of Capsicum annuum L. (bell pepper) at a dose of 1 mg L⁻¹ 15 days post-transplant, our results were superior at 6.88 cm. Similarly, a comparison was made with the results obtained by Martínez-Robinson [58], who evaluated Lombrihumus + Kuntan + Lidavital® at 35 days after planting, obtaining a height of 8.75 cm, while our results reached 10.82 cm. Furthermore, when comparing our results with those reported by Álvarez-Pinedo [59], at 45 DAT, who evaluated the application of chitosan combined with ecomic in Capsicum annuum L. (bell pepper), it was found that their results showed significant differences compared to the control at 13.75 ± 0.24 cm; however, our results remained superior at 17.54 ± 0.46 cm.
Regarding stem diameter, it can be inferred that the most suitable treatment at 15 and 45 DDS was Q + BS. According to Dircio [60], who evaluated Bacillus licheniformis M2-7 in poblano pepper (Capsicum annuum L.) at 15 DDS, a diameter of 0.102 cm was presented, while our results were superior with Q + BS at 0.149 ± 0.004 cm. Additionally, a comparison was made with the results obtained by Martínez-Robinson [58], who applied Lombrihumus + Lidavital® foliarly, evaluating at 35 DDS, which showed a diameter of 0.285 cm, whereas our result was lower at 0.155 cm. Similarly, the results obtained resemble those shown by Lara-Capistrán [61], who evaluated the application of Bacillus subtilis in sweet pepper (Capsicum annuum L.) and determined that it differed positively from the control.
Lastly, for the number of leaves, no significant differences were found between treatments, which aligns with the results reported by Gustavo-González [62], who evaluated QuiToMax® at a concentration of 1 g L⁻¹ on tomato seedlings of two varieties, ESEN and L-43, where no significant differences were observed for this variable. On the other hand, Terry-Alfonso [63], evaluated the effect of HMA-chitosan and HMA-bionutrient in foliar application at 35 days after emergence and showed a result exceeding 6 leaves compared to our results.
4.4. Growth After Transplanting
The results show an effect of the application of biofertilizers on plant growth involving height, leaf area, and number of shoots. Among the four treatments evaluated, Bacillus subtilis significantly promoted plant height at 60 DAT (120.19 cm) (P ≤ 0.05). Regarding the stem diameter variable, no differences were found among the treatments. The Capsicum annuum L. plants treated with Q, BS, and their combination experienced a significant increase in leaf area and number of shoots at different growth stages, confirming that the use of biofertilizers such as Bacillus subtilis is a viable alternative for plant growth, as it has the ability to produce low molecular weight organic acids that facilitate the release of soluble phosphorus from the soil. This macronutrient is utilized by plants for photosynthesis, energy, carbon source synthesis and degradation, enabling them to achieve greater growth.
Additionally, they can produce indole-3-acetic acid (IAA), a plant hormone that contributes to cell elongation and division, tissue differentiation, and responses to light and gravity [66]. Furthermore, they provide protection to plants against phytopathogens, positively influencing plant growth [67]. Ultimately, bacteria of the Bacillus genus have a high ability to adhere to and colonize plant roots, which can significantly impact their growth [67].
On the other hand, regarding the application of chitosan, various authors have attributed that chitosan stimulates chlorophyll production and photosynthesis in plants, leading to increased development [68]. Chitosan is also used as a bio-stimulant, not only to promote plant growth but also to induce tolerance to abiotic stress or resistance to pathogens. Among other functions, it stimulates the activity of enzymes essential for nitrogen metabolism and optimizes its transfer in the leaves, enhancing foliar function in growth and development [69]. Bark [70] mentions that chitosan also increases photosynthesis and that the action of the chitosan molecule varies from one cell to another, determined by its specific physiological chemistry, resulting in an increase in roots, flowering, and potential yield in crops [71].
In relation to our research, it has been reported that the application of chitosan in peppers has improved vegetative growth in both height and stem diameter. Similarly, in tomato cultivation, it has been shown to increase growth and the number of flowers [72]. The findings of this study align with those obtained in our research, demonstrating that chitosan has advantages in the morphological characteristics of Capsicum annuum L. plants. Additionally, another study revealed that foliar application of chitosan increased vegetative growth and yield in cucumbers [73].
Furthermore, Gamboa-Angulo [74] evaluated the application of Bacillus subtilis in Capsicum annuum L. at a concentration of 1 × 10¹² CFU mL⁻¹, and their results were superior to those presented in our study. When comparing our results with those reported by Reyes-Pérez [75], who examined the application of chitosan in tomato cultivation, it was found that applying doses of 150, 200, 250, and 300 mg L⁻¹ had a significant impact on height, significantly increasing values (P ≤ 0.05) compared to the control.
Several authors have demonstrated growth stimulation and yield increases through the use of chitosan in various crops, including tobacco, beans, and maize [76,77]. It has been noted that microbial biofertilizers are a feasible option for integrating into production systems to reduce the use of chemical fertilizers, produce food without harming the environment, humans, or animals, and positively affect growth [74]. In the combination of chitosan and a bacterial consortium, which includes Bacillus subtilis, it has been reported that they are an alternative for grain sorghum production [78]. There is also reference to the use of Bacillus subtilis to evaluate the agronomic response of sweet peppers under greenhouse conditions, indicating it as an alternative for production [79].
4.5. Determination of Photosynthetic Pigments
According to the results obtained, the highest concentration of chlorophyll A was observed in the plants treated with chitosan, while for chlorophyll B and A + B, the highest concentration was observed with the combined treatment of Q + BS. The results can be justified by the findings of Limpanavech [80]. who explained that chitosan increases the diameter of chloroplasts in the orchid Dendrobium at concentrations of 10-50 ppm in leaves, as well as impacting the gene expression of chloroplasts, potentially leading to higher chlorophyll concentrations. On the other hand, Sharp [81] and Katiyar [82] confirmed that chitosan increases photosynthesis (gas exchange and photochemical reactions) in maize crops. This factor may be due to the action of chitosan molecules at the physiological and molecular levels in leaves, such as enhancing defense mechanisms against reactive oxygen species (ROS) or acting on nuclear and chloroplast genes involved in the photosynthetic process [83].
Other studies indicate that establishing a response model to the effects of chitosan on photosynthetic pigments is complex, as the impact depends on the species and concentration [84]. Additionally, a study conducted by Zhang [85] demonstrated that Bacillus subtilis increases photosynthetic capacity, enhancing photosynthetic efficiency and chlorophyll content in Arabidopsis, attributed to an increase in the number of chloroplasts. Similarly, Mardani-Talaee [86] stated that Bacillus subtilis delays leaf senescence, keeping them green for longer, which may explain the higher chlorophyll concentration in our treatments.
A comparison was made with the findings of Mardani-Talaee [86], who evaluated the application of biofertilizers, including Bacillus subtilis, in Capsicum annuum L. (bell pepper) cultivation. They demonstrated that the highest chlorophyll concentration was observed with Bacillus subtilis inoculation, which resembles our results. Similarly, our results align with those reported by Cárdenas-Flores [87], who inoculated the LPM1 strain of Bacillus subtilis in the VLK and SVN varieties of bell pepper, finding a higher amount of chlorophyll in the plants inoculated with Bacillus subtilis compared to their control. Conversely, Hahm [88] found no significant differences in the application of Bacillus subtilis in Capsicum annuum L. plants.
There are studies in white clover and maize crops that have shown an increase in chlorophyll content with the inoculation of Bacillus subtilis [89,90]. Among the existing studies demonstrating increased chlorophyll content in various crops, Ramírez-Rodríguez [91] evaluated chitosan nanoparticles in triticale seedlings at a dose of 0.2 mg mL⁻¹, finding that the highest chlorophyll concentration was observed with chitosan application. Likewise, our results are similar to those reported by Dzung [92], who evaluated the application of chitosan oligomers in coffee plants at various concentrations, finding that increasing the dose also increased chlorophyll A and B concentrations, with the most effective application being at a dose of 60 mg L⁻¹.
However, the results shown in our research differ from those presented by Chatelain [93], who demonstrated that the application of chitosan oligosaccharides did not alter the concentrations of chlorophyll A and B in bean plants. Similarly, Martínez-González [77] employed Quitomax® in bean plants at a dose of 500 mg L⁻¹, but no significant differences were found compared to their control.
4.6. Determination of Nutrients
For the variable electrical conductivity (EC) of the petiole sap, a difference was observed only in treatment T at 105 DAT, which exhibited the highest electrical conductivity. However, it is difficult to make various comparisons with other authors since there are no similar studies; nonetheless, the results may be attributed to the nutrients present in the substrate (vermicompost) being in a saturated or assimilable form, leading to greater absorption by the plants, as well as the content of humic acids in the vermicompost providing greater availability of magnesium (Mg), which interferes with protein transport, thereby improving electrical conductivity that indicates the concentration of dissolved salts [94].
In a study to determine the quality and yield of bell pepper fruits (Capsicum annuum L.) in response to the conductivity of the nutrient solution, the results showed that an electrical conductivity of 2.0 dS m⁻¹ or higher increased bioactive compounds but decreased fruit yield and firmness [95]. In this study, it was found that at 90 DAT, the treatment with the highest electrical conductivity was T, with (600 μs cm⁻¹), presenting significant differences compared to the other treatments.
It is also mentioned that electrical conductivity is a good indicator of the amount of fertilizer available to the plant. Martínez [96] states that a greater exploration area for the roots provides an adequate electrical conductivity and facilitates nutrient absorption. It is important to note that this will depend on the edaphic conditions of the soil where the crop is established [97].
pH is an important factor that influences the growth of microorganisms. Some bacteria generally grow at low pH (3.0); the optimal pH range for bacteria is from 6.0 to 8.5, and only a few prefer pH 8.5 or higher [98]. This is consistent with the data obtained in the treatments of this research. It was generally observed that the concentration of N-NO₃⁻ in the cellular extract of the petiole (ECP) varied. The maximum concentration was presented in the application with chitosan at 1203 mg L⁻¹. These results are higher than those reported by Pérez [99], who evaluated nutrient solutions; however, they are superior compared to our control treatment, which averaged 500.
On the other hand, He [100] mention that the concentration of nitrates in tomato plants varies according to the amounts of nitrates added to the nutrient solution. These variations were detected during the vegetative stages and at the beginning of flowering. It should be kept in mind that when fertilizers with different elements are applied, compatibility between them must be considered. Additionally, the ionic interactions between different ions in the soil must be taken into account. It has been observed that an increase in potassium in soils reduces the absorption of calcium and magnesium. Excess calcium also insolubilizes soil phosphates, and excess chloride reduces the absorption of NO₃⁻. Conversely, an increase in nitrogen in soils improves potassium absorption [101].
4.7. Yield and Quality of Fruit
When analyzing the effect of chitosan on biochemical indicators of fruit quality in tomato cultivation, the concentration of Brix degrees depending on the chitosan dose was found to range from 5.25 to 3.35 [102]. In the present study, the highest value was 105 DAT in the treatment with Q, presenting values higher than (3 ± 0.03), so there are no studies to compare regarding the fruits of Chile Soledad with the application of chitosan and Bacillus subtilis, making comparisons with various authors difficult. In a study on peppers grown in greenhouses, bio-stimulated plants based on algae showed a higher number of commercial fruits, along with a higher leaf area index compared to the non-bio-stimulated control [103]. This coincides with the results obtained from the application of Q, Q+BS, and T. A significant increase in growth and yield of the crop was reported, with no statistically significant differences between the treatments compared to the control (P ≤ 0.000).
Bacillus subtilis applied to the root and salicylic acid applied to the foliage of A. solani in tomato plants showed similar outcomes [104]. On the other hand, results from another investigation indicated that in the yield of sorghum and protein quality of the grain, the most efficient treatment (with P < 0.05) was with QUI 100% + microbial consortium using 50% regional fertilization [105], consistent with the results obtained.
In a study on strawberry cultivation, the application of chitosan resulted in a significant increase in yield regarding fruit weight, as well as early and total yield. This was accompanied by vegetative growth (plant length, number of leaves/plant, leaf area, root growth, fresh and dry weight) [105,106].
Furthermore, an analysis on the application of chitosan and a microbial consortium in sorghum showed that in treatments with chitosan, plant length increased as the concentration increased by 50% and 100%, reaching a maximum length of 22.4 cm. Regarding grain yield (kg ha⁻¹), this occurred with 100% chitosan + BAC microbial consortium + 50% fertilization [106]. This indicates that the application of chitosan contributes to length and yield similar to what was obtained in our research.
Regarding fruit weight, it was determined that the application of Q resulted in a higher weight compared to the application of BS, which was somewhat similar to what was obtained in a study where chitosan was the second most important biostimulant for Capsicum annuum L., after humic acid, showing better results in fruit weight, as well as in the number of fruits per plant, fruit length, and fruit diameter [107].
Additionally, it has been found that chitosan exerts a stimulating effect on the following variables: plant height, clusters with fruits, fruits per plant, equatorial and polar diameter of the fruit, pericarp diameter, and fruit mass [107].
5. Conclusions
In conclusion, chitosan was successfully synthesized from shrimp exoskeletons with a purity greater than 80%, as confirmed by FTIR spectroscopy analyses. This pure chitosan proved effective in enhancing both the growth and yield of Chile Soledad plants. The combination of chitosan and Bacillus subtilis resulted in a significant increase in the morphological parameters of the seedlings, such as height, stem diameter, and number of leaves. Furthermore, in terms of fruit quality, the joint application of both treatments surpassed the individual treatments regarding physicochemical parameters, although no significant differences were detected in the morphological parameters. These findings suggest that the combination of chitosan and Bacillus subtilis can be an effective strategy for optimizing the growth and quality of Chile Soledad, highlighting the importance of chitosan purity and its synergy with Bacillus subtilis in crop improvement.
Author Contributions
Conceptualization, H.H.-H. and R.E.P.-T.; methodology, H.O.-O.; formal analysis, J.A.Y.-T. and A.A.-M.; investigation, A.S.-C. and A.R.R.-S.; resources, H.O.-O.; synthesis of the complexes, H.H.-H. and J.A.Y.-T.; writing—original draft preparation, R.E.P.-T.; visualization, H.H.-H.; writing—review and editing, H.H.-H. and A.J.-M.; supervision, H.H.-H.; funding acquisition, M.R.-O., J.A.Y.-T., A.A.-M. and A.J.-M. All authors have read and agreed to the published version of the manuscript.
Funding
This research received no external funding.
Institutional Review Board Statement
Not applicable.
Informed Consent Statement
Not applicable.
Data Availability Statement
The data presented in this study are available on request from the corresponding author.
Acknowledgments
All of the authors thank the researcher Moisés Ramírez Meraz from INIFAP for the donation of seeds of the Jaguar variety of habanero peppers.
Conflicts of Interest
The authors declare no conflict of interest.
References
- FAO (2021) Cultivos y productos de ganadería. Organización de las Naciones Unidas para la Alimentación y la Agricultura.https://www.fao.org/faostat/es/#data/QCL.
- Food and Agriculture Information Service (SIAP). Statistical Yearbook of Agricultural Production. 2020, https://nube.siap.gob.mx/cierreagricola/.
- Moreno, R. A. Características de la agricultura protegida y su entorno en México. Revista Mexicana de Agronegocios; 2011, 15(29), 23-36. [CrossRef]
- Silva-Garza, M. H.; Gámez-González, H.; Zavala-García, F.; Cuevas-Hernández, B.; Rojas-Garcidueñas, M. Efecto de cuatro fitorreguladores comerciales en el desarrollo y rendimiento del girasol. Departamento de Botánica F. Ciencias Biológicas UANL; 2001, 4, 69-75. http://eprints.uanl.mx/id/eprint/1066.
- Jiménez, N. I.; Guevara-González, R. G.; Rico-García, E. El ADN extracelular: un elicitor novedoso en la agricultura. Perspectivas de la Ciencia y la Tecnología. 2024, 7(12), 26-39. https://revistas.uaq.mx/index.php/perspectivas/article/view/1116.
- Amador-Mendoza, A.; Huerta-Ochoa, S.; Herman-Lara, E.; Membrillo-Venegas, L.; Aguirre-Cruz, A.; Vivar-Vera, M. A.; Romírez-Coutiño, L. Efecto de la purificación química, biológica y física en la recuperación de quitina de exoesqueletos de camarón (Penaeus sp) y chapulín (Sphenarium purpurascens). Revista Mexicana de Ingeniería Química. 2016, 15, 711–725. [Google Scholar]
- AOAC. (2005). Official methods of analysis of AOAC (18th ed.). Gaithersburg, MD: Association of Official Analytical.
- AOAC. Official Methods of Analysis of the AOAC, Methods 932.06, 925.09, 985.29, 923.03; Association of Official Analytical Chemists: Arlington, VA, USA, 1990. [Google Scholar]
- Porras-Barrientos, L. D.; González-Hurtado, M. I.; Ochoa-González, O. A.; Sotelo-Díaz, L. I.; Camelo-Méndez, G. A.; Quintanilla-Carvajal, M. X. Colorimetric image analysis as a factor in assessing the quality of pork ham slices during storage. Revista Mexicana de Ingeniería Química; 2015, 14, 243–252, https://www.scielo.org.mx/pdf/rmiq/v14n2/v14n2a2.pdf. [Google Scholar]
- Amador-Mendoza, A.; Huerta-Ochoa, S.; Herman-Lara, E.; Membrillo-Venegas, L.; Aguirre-Cruz, A.; Vivar-Vera, M. A.; Romírez-Coutiño, L. Evaluación de procesos combinados: purificación de quitina de exoesqueletos de camarón (Penaeus sp) y chapulín (Sphenarium purpurascens). Tropical and Subtropical Agroecosystems. 2022, 25(3). [CrossRef]
- Lara-Capistrán, L.; Zulueta-Rodríguez, R.; Murillo-Amador, B.; Romero-Bastidas, M.; Rivas-García, T.; Hernández-Montiel, L. G. Respuesta agronómica del chile dulce (Capsicum annuum L.) a la aplicación de Bacillus subtilis y lombricomposta en invernadero. Terra Latinoamericana; 2020, 38, 693–704. [Google Scholar] [CrossRef]
- INIFAP. Instituto Nacional de Investigaciones Forestales, Agrícolas y Pesqueras; 2019. Variedad de chile serrano delgado o soledad. http://www.inifapcirne.gob.mx/Eventos/2018/NOTA_93.pdf.
- Castillo-Aguilar, C. D. Producción de planta de chile habanero (Capsicum chinense Jacq.). Agro Productividad; 2015, 8. https://revista-agroproductividad.org/index.php/agroproductividad/article/view/676.
- Steiner, A. A. The Universal Nutrient Solution. Proc 6th Int. Cong. Soilless Cult.; 1984, 633-649. [CrossRef]
- Alemán-Pérez, R. D.; Domínguez-Brito, J.; Rodríguez-Guerra, S.; Soria-Re, S.; Torres-Gutiérrez, R.; Vargas-Burgos, J. C.; Bravo-Medina, C.; Alba-Rojas, J. L. Indicadores morfofisiológicos y productivos del pimiento sembrado en invernadero y a campo abierto en las condiciones de la Amazonía ecuatoriana. Centro Agrícola; 2018, 45, 14–23, http://scielo.sld.cu/pdf/cag/v45n1/cag02118.pdf. [Google Scholar]
- Tucuch-Haas, C. J.; Alcántar-González, G.; Ordaz-Chaparro, V. M.; Santizo-Rincón, J. A.; Larqué-Saavedra, A. Production and quality of habanero pepper (Capsicum chinense Jacq.) with different NH4+/NO3- ratios and size of substrate particles. Terra Latinoamericana; 2012, 30, 9–15, https://www.scielo.org.mx/pdf/tl/v30n1/2395-8030-tl-30-01-00009.pdf. [Google Scholar]
- Swart, E. D. Estimación no destructiva del área foliar para plantas de diferentes edades y accesiones de Capsicum annuum L. The Journal of Horticultural Science and Biotechnology; 2004. [CrossRef]
- Cruz-Crespo, E.; Can-Chulim, A.; Bugarín-Montoya, R.; Pineda-Pineda, J.; Flores-Canales, R.; Juárez-López, P.; Alejo-Santiago, G. Concentración nutrimental foliar y crecimiento de chile serrano en función de la solución nutritiva y el sustrato. Revista Fitotecnia Mexicana; 2014, 37, 289–295. [Google Scholar] [CrossRef]
- Porra, R. J. La accidentada historia del desarrollo y uso de ecuaciones simultáneas para la determinación precisa de las clorofilas a y b. Investigación de la Fotosíntesis; 2002, 73, 149–156, https://digital.csic.es/bitstream/10261/13836/1/ANALES_17_3-4-Nuevas%20ecuaciones.pdf. [Google Scholar]
- Álvarez-Herrera, J. G.; Vélez, J. E.; Jaime-Guerrero, M. Characterization of cape gooseberry (Physalis peruviana L.) fruits from plants irrigated with different regimens and calcium doses. Revista Colombiana de Ciencias Hortícolas; 2022. [CrossRef]
- Roacho-Cortés, E.; Castellanos-Ramos, J. Z.; Etchevers-Barra, J. D. Field diagnostic techniques to determine nitrogen in maize. Revista Terra Latinoamericana; 2021, 39. [CrossRef]
- NMX-FF-025-2015. (2015). Norma Oficial Mexicana NMX-FF-025-2015, Productos alimenticios no industrializados para uso humano. Fruta fresca. Chile (Capsicum spp.) especificaciones. (cancela a la NMX-FF-025-SCFI-2007). Secretaría de Economía. Diario Oficial de la Federación. http://www.dof.gob.mx/nota_detalle.php?codigo=5379404&fecha=23/01/20 15.
- Valadez-Sánchez, Y. M.; Olivares-Sáenz, E.; Vázquez-Alvarado, R. E.; Esparza-Rivera, J. R.; Preciado-Rangel, P.; Valdez-Cepeda, R. D.; García-Hernández, J. L. Calidad y concentración de capsaicinoides en genotipos de chile Serrano (Capsicum annuum L.) producidos bajo fertilización orgánica. Phyton (Buenos Aires); 2016, 85, 21–26. [Google Scholar] [CrossRef]
- Maurya, V. K.; Gothandam, K. M.; Ranjan, V.; Shakya, A.; Pareek, S. Effect of drying methods (microwave vacuum, freeze, hot air and sun drying) on physical, chemical and nutritional attributes of five pepper (Capsicum annuum var. annuum) cultivars. Journal of the Science of Food and Agriculture 2018, 98(9), 3492-3500. [CrossRef]
- González-Zamora, A.; Sierra-Campos, E.; Pérez-Morales, R.; Vázquez-Vázquez, C.; Gallegos-Robles, M. A.; López-Martínez, J. D.; García-Hernández, J. L. Measurement of capsaicinoids in chiltepin hot pepper: A comparison study between spectrophotometric method and high performance liquid chromatography analysis. Journal of Chemistry 2015. [CrossRef]
- González, M.; Silva, J. Síntesis de nanopartículas de magnetita recubiertas de quitosano para la adsorción de cromo hexavalente. Perfiles 2023, 1, 78–89. [Google Scholar] [CrossRef]
- Martínez, A. G.; Díaz, G. C.; Ramírez, R. L. Estudio comparativo de obtención, caracterización y actividad antioxidante de quitosano a partir de exoesqueletos de camarón estero y camarón de altamar. Investigación y Desarrollo en Ciencia y Tecnología de Alimentos 2019, 4, 1002–1013. [Google Scholar]
- Castillo, I. E. P.; Narváez, G. E. C.; Morillo, M. D. J. L.; Márquez, A. C. L.; Cantillo, L. C. M.; Bonilla, A. L. V.; Salas, N. M. Influencia de tratamientos químicos sobre el rendimiento y calidad del quitosano de exoesqueletos de cangrejos. Revista de la Facultad de Agronomía 2020, 37, 100–106, https://www.produccioncientificaluz.org/index.php/agronomia/article/view/32998. [Google Scholar]
- Luo, Q. W. Comparison of the physicochemical, rheological, and morphologic properties of chitosan from four insects. Carbohydrate Polymers 2019, 209, 266–275. [Google Scholar] [CrossRef]
- De Castro, R. J.; Ohara, A.; Aguilar, J. G.; Domingues, M. A. Nutritional, functional and biological properties of insect proteins: Processes for obtaining, consumption and future challenges. Trends in Food Science and Technology 2018. [CrossRef]
- Hernández-Cocoletzi, H.; Águila-Almanza, E.; Flores-Agustín, O.; Viveros-Nava, E. L.; Ramos-Cassellis, E. Obtención y caracterización de quitosano a partir de exoesqueletos de camarón. Superficies y Vacío 2009, 22, 57–60. [Google Scholar]
- Martínez, A. G.; Díaz, G. C.; Ramírez, R. L. Estudio comparativo de obtención, caracterización y actividad antioxidante de quitosano a partir de exoesqueletos de camarón estero y camarón de altamar. Investigación y Desarrollo en Ciencia y Tecnología de Alimentos 2019, 4(1), 1002-1013. http://www.fcb.uanl.mx/IDCyTA/files/volume4/4/10/143.pdf.
- Torres, B. S. O.; Torres, O. B.; López, J. A. H.; Esteban, P. P. Obtención de quitosano a partir de residuos pesqueros y su valoración potenciométrica. Brazilian Journal of Science 2023, 2, 32–38. [Google Scholar] [CrossRef]
- Castro, M. N.; Vidal, C. C. Obtención y caracterización de quitina y quitosano del Emerita analoga a escala piloto. Tzhoecoen. 2015, 7(2), 182–197, https://revistas.uss.edu.pe/index.php/tzh/article/view/280. [Google Scholar]
- Kumar, R.; Xavier, K. M.; Lekshmi, M.; Balange, A.; Gudipati, V. Fortificación de bocadillos extruidos con quitosano: efectos en la calidad tecno-funcional y sensorial. Carbohydrate Polymers. 2018, 194, 273. [Google Scholar] [CrossRef]
- Pérez, W. A.; Marín, J. A.; López, J. N.; Burgos, M. A.; Ríos, L. A. Desarrollo de un proceso piloto eco-amigable para la producción de quitosano a partir de desechos de conchas de camarón. Environmental Processes. 2022, 9(3), 55. [Google Scholar] [CrossRef]
- Suárez-Villa, A. J.; Cuenca-Nevárez, G. J.; Macias, R. R.; Falcones-Molina, E. L. Caracterización de la harina de exoesqueleto de camarón (Litopenaeus sp). MQRInvestigar. 2023, 7(2), 1408–1432. [Google Scholar] [CrossRef]
- Cisneros-Pérez, I.; Curbelo-Hernández, C.; Andrade-Díaz, C.; Giler-Molina, J. M. Evaluación de la extracción enzimática de quitina a partir del exoesqueleto de camarón. Centro Azúcar. 2019, 46(1), 51-63. http://scielo.sld.cu/scielo.php?script=sci_arttext&pid=S222348612019000100051&lng=es&nrm=iso.
- Luna, M. Obtención de quitosano a partir de quitina para su empleo en conservación de frutillas y moras. Tesis de Ingeniero Químico, Universidad Central del Ecuador. 2012. https://api.semanticscholar.org/CorpusID:190602456.
- Álvarez, J.; Castro, O. N.; Gómez, O. T. Adsorción de azul de metileno con biopolímeros (quitosano calcáreo y quitosano) obtenidos de las cabezas de langostinos a nivel piloto. Revista Iberoamericana de Polímeros. 2019. https://reviberpol.org/wp-content/uploads/2019/06/2019-20-3-90-104-alvarez-y-col.pdf.
- Castro, M. N.; Vidal, C. C. Obtención y caracterización de quitina y quitosano del Emerita analoga a escala piloto. Tzhoecoen. 2015, 7(2), 182-197. https://revistas.uss.edu.pe/index.php/tzh/article/view/280.
- Velasco, J. D. Producción de quitosano a partir de desechos de camarón generados del procesamiento industrial. Investigación y Desarrollo en Ciencia y Tecnología de Alimentos 2019, 4, 897–901. [Google Scholar]
- Barra, A.; Romero, A.; Beltramino, J. Obtención de quitosano. Sitio Argentino de Producción Animal 2012. https://www.produccion-animal.com.ar/produccion_peces/piscicultura/173-Quitosano.pdf.
- Hernández-Cocoletzi, H.; Águila Almanza, E.; Flores Agustín, O.; Viveros Nava, E. L.; Ramos Cassellis, E. Obtención y caracterización de quitosano a partir de exoesqueletos de camarón. Superficies y vacío 2009, 22, 57–60, https://www.redalyc.org/articulo.oa?id=94216153012. [Google Scholar]
- Romero–Serrano, A.; Pereira, J. Estado del arte: Quitosano, un biomaterial versátil. Estado del Arte desde su obtención a sus múltiples aplicaciones. Revista INGENIERÍA UC 2020, 27(2). https://www.redalyc.org/articulo.oa?id=70764230002.
- Dupont. Plásticos, polímeros y resinas. http://www.dupont.mx/. Página consultada: 5 de junio de 2023.
- Colina, M. A. Evaluación de los procesos para la obtención química de quitina y quitosano a partir de desechos de cangrejos. Escala piloto e industrial. Revista Iberoamericana de Polímeros 2014. https://reviberpol.org/wp-content/uploads/2019/07/2014-colina.pdf.
- Gallardo, M. G.; Barbosa, R. C.; Fook, M. V.; Sabino, M. A. Síntesis y caracterización de un novedoso biomaterial a base de quitosano modificado con aminoácidos. 2019. [CrossRef]
- Martínez-Robinson, K.; Martínez-Inzunza, A.; Rochín-Wong, S.; Rodríguez-Córdova, R. J.; Vásquez-García, S. R.; Fernández-Quiroz, D. Physicochemical study of chitin and chitosan obtained from California brown shrimp (Farfantepenaeus californiensis) exoskeleton. Biotecnia 2022, 24, 28–35. [Google Scholar]
- González, M.; Silva, J. Síntesis de nanopartículas de magnetita recubiertas de quitosano para la adsorción de cromo hexavalente. Perfiles 2023, 1, 78–89. [Google Scholar] [CrossRef]
- Chávez, E. S.; Monreal, L. R.; Rangel, P. P.; Parra, J. M. S.; Álvarez, S. P.; Córdova, M. A. F.; Figueroa, K. I. H. (Eds.) . de la obra. de la obra. Soil Sci 2018, 3(6), 192–199. [Google Scholar]
- Dircio, A. B.; Jiménez, J. T.; Barrera, M. Á. R.; Flores, G. H.; Hernández, E. T.; Alberto, F. P.; Ramírez, Y. R. Bacillus licheniformis M2-7 improves growth, development and yield of Capsicum annuum L. Agrociencia 2021, 55, 227–242. [Google Scholar] [CrossRef]
- Luna-Martínez, L.; Martínez-Peniche, R. A.; Hernández-Iturriaga, M.; Arvizu-Medrano, S. M.; Pacheco-Aguilar, J. R. Caracterización de rizobacterias aisladas de tomate y su efecto en el crecimiento de tomate y pimiento. Revista Fitotecnia Mexicana 2017, 36, 63–69. [Google Scholar] [CrossRef]
- González-Peña, D. D.; Costales, A. B.; Falcón. Influencia de un polímero de quitosana en el crecimiento y la actividad de enzimas defensivas en tomate (Solanum lycopersicum L.). Cult. Trop 2014, 35, 35–42, http://scielo.sld.cu/scielo.php?script=sci_arttext&pid=S0258-59362014000100005&lng=es&nrm=iso. [Google Scholar]
- Antony, R. T. A review on applications of chitosan-based Schiff bases. Int. J. Biol. 2019. [CrossRef]
- Molina, J. M. Efecto del uso de quitosano en el mejoramiento del cultivo del arroz (Oryza sativa L. variedad sd20a). Rev. Invest. Agr. Amb. 2017, 8, 151–165. [Google Scholar] [CrossRef]
- Izquierdo-Oviedo, H.; Calaña-Janeiro, V. M.; Lluvia de Abril, A.; Rodríguez-Hernández, M.; Rodríguez-Llanes, Y.; Guillama-Alonso, R.; Urra-Zayas, I. Utilización de bioestimulador del crecimiento QuitoMax® en la aclimatización de plántulas de pimiento. Cultivos Tropicales 2022, 43, 5. [Google Scholar]
- Martínez, A. G., Díaz, G. C., y y Ramírez, R. L. (2019). Estudio comparativo de obtención, caracterización y actividad antioxidante de quitosano a partir de exoesqueletos de camarón estero y camarón de altamar. Investigación y Desarrollo en Ciencia y Tecnología de Alimentos, 4(1), 1002-1013. http://www.fcb.uanl.mx/IDCyTA/files/volume4/4/10/143.pdf.
- Álvarez-Pinedo, A.; Calderón-Puig, A. A.; Fundora-Sánchez, L. R.; Rodríguez Fajardo, A. Manejo de bioproductos en el cultivo del pimiento (Capsicum annuum L.) en condiciones de organopónico. Agroecosistemas 2018, 6, 121–127. [Google Scholar]
- Dircio, A. B., Jiménez, J. T., Barrera, M. Á. R., Flores, G. H., Hernández, E. T., Alberto, F. P., y Ramírez, Y. R. (2021). Bacillus licheniformis M2-7 improves growth, development and yieldd of Capsicum annuum L. Agrociencia, 55(3), 227-242. [CrossRef]
- Lara-Capistrán, L.; Zulueta-Rodríguez, B.; Murillo-Amador, M.; Romero-Bastidas, T.; Rivas-García, T. Respuesta agronómica del chile dulce (Capsicum annuum L.) a la aplicación de Bacillus subtilis y lombricomposta en invernadero. Terra Latinoamericana 2020, 38, 693–704. [Google Scholar] [CrossRef]
- Gustavo-González, L.; Paz-Martínez, I.; Boicet-Fabré, T.; Jiménez-Arteaga, M. C.; Falcón-Rodríguez, A.; Rivas-García, T. Efecto del tratamiento de semillas con QuitoMax® en el rendimiento y calidad de plántulas de tomate variedades ESEN y L-43. Terra Latinoamericana 2021, 39. [Google Scholar] [CrossRef]
- Terry-Alfonso, E.; Ruiz-Padrón, J.; Rivera-Espinosa, R.; Falcón-Rodríguez, A.; Carrillo Sosa, Y. Bioproductos como sustitutos parciales de la nutrición mineral del cultivo de pimiento (Capsicum annuum L.). Acta Agronómica 2021, 70, 266–273. [Google Scholar] [CrossRef]
- Sosa, M. R. Germinación, crecimiento y producción de glucanasas en Capsicum chinense Jacq. inoculadas con Bacillus spp. Ecosistemas y Recursos Agropecuarios 2019, 6, 137–143. [Google Scholar] [CrossRef]
- Mejía, M. C. Bacillus spp. en el crecimiento y rendimiento de Capsicum chinense Jacq. Revista Mexicana de Investigaciones Forestales, Agrícolas y Pecuarias 2022, 13.
- Wagi, S. A. Bacillus spp.: potent microfactories of bacterial IAA. PeerJ 2019, 7, 7258. [Google Scholar] [CrossRef]
- Allard-Massicotte, R. L. Bacillus subtilis early colonization of Arabidopsis thaliana roots involves multiple chemotaxis receptors. MBio 2016, 7, 1–10. [Google Scholar] [CrossRef]
- Pichyangkura, R. Biostimulant activity of chitosan in horticulture. Scientia Horticulturae 2015, 196, 49–65. [Google Scholar] [CrossRef]
- Chibuet, H. S. Effects of chitosan application on growth and chitinase activity in several crops. Marine & Highland Bioscience Center Report 2000, 12, 27–35, https://api.semanticscholar.org/CorpusID:85697560. [Google Scholar]
- Barka, A. P. Chitosan improves development, and protects Vitis vinifera L. against Botrytis cinerea. Plant Cell Reports 2004, 22, 608–614. [Google Scholar] [CrossRef]
- Chandrkrachang, S.; Sompongchaiyakul, P.; Sangtain, S. Profitable spin-off from using chitosan in orchid farming in Thailand. Journal of Metals, Materials and Minerals 2005, 15, 45–48, https://jmmm.material.chula.ac.th/index.php/jmmm/article/view/1350. [Google Scholar]
- Monirul, I. H. Estudios sobre rendimiento y atributos de rendimiento en tomate y chile mediante aplicación foliar de oligoquitosano. Biological and Pharmaceutical Sciences 2018, 3, 20–28. [Google Scholar] [CrossRef]
- Shehata, S.; Fawzy, Z.; El-Ramady, H. Respuesta de las plantas de pepino a la aplicación foliar de quitosano y levadura en condiciones de invernadero. Revista Australiana de Ciencias Básicas y Aplicadas 2012, 4, 63–71, http://scielo.sld.cu/pdf/cag/v45n3/0253-5785-cag-45-03-27.pdf. [Google Scholar]
- Gamboa-Angulo, J.; Ruíz-Sanchez, E.; Alvarado-López, C.; Guitiérrez-Miceli, F.; Ruíz-Valviviezo, V. M.; Medina-Dzul, K. Efecto de biofertilizantes microbianos en las características agronómicas de la planta y calidad del fruto del chile xcat' ik (Capsicum annuum L.). Terra Latinoamericana 2020, 38, 817–826. [Google Scholar] [CrossRef]
- Reyes-Pérez, J. J.; Rivero-Herrada, M.; García-Bustamante, E. L.; Beltran-Morales, F. A.; Ruiz-Espinoza, F. H. Aplicación de quitosano incrementa la emergencia, crecimiento y rendimiento del cultivo de tomate (Solanum lycopersicum L.) en condiciones de invernadero. Biotecnia 2020, 22, 156–163. [Google Scholar] [CrossRef]
- Torres-Rodríguez, J. A.; Reyes-Pérez, J. J.; González-Gómez, L. G.; Jiménez-Pizarro, M.; BoicetFabre, T.; Enríquez-Acosta, E. A.; Rodríguez-Pedroso, A. T.; Ramírez-Arrebato, M. A.; González-Rodríguez, J. C. Respuesta agronómica de dos variedades de maíz blanco (Zea mays L.) a la aplicación de Quitosano, Azofert y Ecomic. Biotecnia 2018, 20, 1–7. [Google Scholar] [CrossRef]
- Martínez-González, L.; Reyes-Guerrero, Y.; Pérez-Domínguez, G.; García, M. C. N.; Núñez-Vázquez, M. D. L. C. Influencia del Biobras-16® y el QuitoMax® en aspectos de la biología de plantas de frijol. Cultivos Tropicales 2018, 39, 108–112, https://ediciones.inca.edu.cu/index.php/ediciones/article/view/1434. [Google Scholar]
- Holguin, R. V. (2020). Efecto de quitosano y consorcio simbiótico benéfico en el rendimiento de sorgo en la zona indígena “Mayos” en Sonora. Terra Latinoamericana. [CrossRef]
- Lara, L.; Zulueta, R.; Murillo, B.; Romero, M.; Rivas, T. Respuesta agronómica del chile dulce (Capsicum annuum L.) a la aplicación de Bacillus subtilis y lombricomposta en invernadero. Terra Latinoamericana 2021, 38, 693–704. [Google Scholar] [CrossRef]
- Limpanavech, P.; Chaiyasuta, S.; Vongpromek, R.; Pichayangkura, R.; Khunwasi, C.; Chadchawan, S.; Bangyeekhun, T. Chitosan effects on floral production, gene expression, and anatomical changes in the Dendrobium orchid. Scientia Horticulturae 2008, 116, 65–72. [Google Scholar] [CrossRef]
- Sharp, R. A review of the applications of chitin and its derivatives in agriculture to modify plant-microbial interactions and improve crop yields. Agronomy 2013, 3, 757–793. [Google Scholar] [CrossRef]
- Katiyar, D. H. Chitosan as a promising natural compound to enhance potential physiological responses in plant: a review. Indian J Plant Physiology 2015, 20(1), 1–9. [Google Scholar] [CrossRef]
- Chamnanmanoontham, N.; Pongprayoon, W.; Pichayangkura, R.; Roytrakul, S.; Chadchawan, S. Chitosan enhances rice seedling growth via gene expression network between nucleus and chloroplast. Plant Growth Regulation 2015, 75, 101–114. [Google Scholar] [CrossRef]
- Arruda, S. C. C.; Silva, A. L. D.; Galazzi, R. M.; Azevedo, R. A.; Arruda, M. A. Z. Nanoparticles applied to plant science: a review. Talanta 2015, 131, 693–705. [Google Scholar] [CrossRef] [PubMed]
- Zhang, H.; Xie, X.; Kim, M. S.; Kornyeyev, D. A.; Holaday, S.; Paré, P. W. Soil bacteria augment Arabidopsis photosynthesis by decreasing glucose sensing and abscisic acid levels in planta. The Plant Journal 2008, 56, 264–273. [Google Scholar] [CrossRef] [PubMed]
- Mardani-Talaee, M.; Razmjou, J.; Nouri-Ganbalani, G.; Hassanpour, M.; Naseri, B. Impact of chemical, organic and bio-fertilizers application on bell pepper, Capsicum annuum L. and biological parameters of Myzus persicae (Sulzer)(Hem.: Aphididae). Neotropical Entomology 2017, 46, 578–586. [Google Scholar] [CrossRef]
- Cárdenas-Flores, A.; Ruíz-Salas, C. E.; Vázquez-Lee, J.; Baylón-Palomino, A.; Mounzer, O.; Flores-Olivas, A.; Valenzuela-Soto, J. H. Bacillus subtilis LPM1 differentially promotes the growth of bell pepper (Capsicum annuum L.) varieties under shade house. Cogent Food & Agriculture 2023, 9, 2232165. [Google Scholar] [CrossRef]
- Hahm, M. S. Alleviation of salt stress in pepper (Capsicum annuum L.) plants by plant growth-promoting rhizobacteria. Journal of Microbiology and Biotechnology 2017, 27, 1790–1797. [Google Scholar] [CrossRef]
- Han, Q. Q.; Lü, X. P.; Bai, J. P.; Qiao, Y.; Paré, P. W.; Wang, S. M.; Wang, Z. L. Beneficial soil bacterium Bacillus subtilis (GB03) augments salt tolerance of white clover. Frontiers in Plant Science 2014, 5, 525. [Google Scholar] [CrossRef] [PubMed]
- Ferreira, N. C.; Mazzuchelli, R. D. C. L.; Pacheco, A. C.; Araujo, F. F. D.; Antunes, J. E. L.; Araujo, A. S. F. D. Bacillus subtilis mejora la tolerancia del maíz a salinidad. Ciência Rural 2018, 48, e20170910. [Google Scholar] [CrossRef]
- Ramírez Rodríguez, S. C.; Ortega Ortiz, H.; Fortis Hernández, M.; Nava Santos, J. M.; Orozco Vidal, J. A.; Preciado Rangel, P. Nanopartículas de quitosano mejoran la calidad nutracéutica de germinados de triticale. Revista Mexicana de Ciencias Agrícolas 2021, 12, 579–589. [Google Scholar] [CrossRef]
- Dzung, N. A.; Khanh, V. T. P.; Dzung, T. T. Research on impact of chitosan oligomers on biophysical characteristics, growth, development and drought resistance of coffee. Carbohydrate Polymers 2011, 84, 751–755. [Google Scholar] [CrossRef]
- Chatelain, P. G.; Pintado, M. E.; Vasconcelos, M. W. Evaluation of chitooligosaccharide application on mineral accumulation and plant growth in Phaseolus vulgaris. Plant Science 2014, 215, 134–140. [Google Scholar] [CrossRef]
- Proain. Como detectar las deficiencias de los nutrientes en la lechuga. México: [sin editorial] 2020.
- Preciado, P.; Rueda, E.; Valdez, L.; Reyes, J.; Gallegos, M.Y. Conductividad eléctrica de la solución nutritiva y su efecto en compuestos bioactivos y rendimiento de pimiento morrón (Capsicum annuum L.). Trop. Subtrop. Agroecosyst. 2021, 24, 1–12. [Google Scholar]
- Martínez-Robinson, K.; Martínez-Inzunza, A.; Rochín-Wong, S.; Rodríguez-Córdova, R.J.; Vásquez-García, S.R.; Fernández-Quiroz, D. Physicochemical study of chitin and chitosan obtained from California brown shrimp (Farfantepenaeus californiensis) exoskeleton. Biotecnia 2022, 24, 28–35. [Google Scholar]
- Stivers, L. Introducción a los suelos: El manejo de los suelos. USDA 2017, https://extension.psu.edu/introduccion-a-los-suelos-elmanejo-de-los-suelos.
- Cervantes, J.O. Acerca del desarrollo y control de microorganismos en la fabricación de papel. ConCiencia Tecnológica. https://www.redalyc.org/journal/944/94454631001/html.
- Pérez, B.B.A.; Alcántar-González, G.; Sánchez-García, P.; Tijerina-Chávez, L.; Castellanos-Ramos, J.Z.; Maldonado-Torres, R. Nitratos en soluciones nutritivas en el extracto celular de pecíolo de chile. Terra Latinoam. 2005, 23, 469–476. [Google Scholar]
- He, Y.; Terabayashi, K.; Namiki, T.H. Fundamental study for diagnosis on nutrient status of tomatoes cultured in hydroponics. Sci. Rep. Kyoto Prefect. Univ. Agric. 1994, 46, 7–14. [Google Scholar]
- Ali, U.; Sajid, N.; Khalid, A.; Riaz, L.; Rabbani, M.M.; Syed, J.H.; Malik, R.N. A review on vermicomposting of organic wastes. Environ. Prog. Sustain. 2015, 34, 1050–1062. [Google Scholar] [CrossRef]
- Reyes-Pérez, J.J.; Rivero-Herrada, M.; García-Bustamante, E.L.; Beltran-Morales, F.A.; Ruiz-Espinoza, F.H. Aplicación de quitosano incrementa la emergencia, crecimiento y rendimiento del cultivo de tomate (Solanum lycopersicum L.) en condiciones de invernadero. Biotecnia 2020, 22, 156–163. [Google Scholar] [CrossRef]
- Zapata-García, S.; Espinosa-Jiménez, P.J.; Salvador-Albaladejo, P.J.; Pérez-Pastor, A. Bioestimulación en pimiento bajo invernadero para una producción sostenible. Libro de actas del 11º Workshop en Investigación Agroalimentaria para jóvenes investigadores 2023, 32.
- Espinoza-Ahumada, C.A.; Gallegos-Morales, G.; Ochoa-Fuentes, Y.M.; Hernández-Castillo, F.D.; Méndez-Aguilar, R.; Rodríguez-Guerra, R. Microbial antagonists for the biocontrol of wilting and its promoter effect on the performance of serrano chili. Rev. Mex. Cienc. Agric. 2019, 10, 187–197. [Google Scholar]
- Holguin, R.V. Efecto de quitosano y consorcio simbiótico benéfico en el rendimiento de sorgo en la zona indígena “Mayos” en Sonora. Terra Latinoam. 2020. [CrossRef]
- El-Miniawy, S.M.; Ragab, M.E.; Youssef, S.M.; Metwally, A.A. Response of strawberry plants to foliar spraying of chitosan. Res. J. Agric. Biol. Sci. 2013, 9, 366–372. [Google Scholar]
- Reyes-Perez, J. J., Rivero-Herrada, M., Andagoya Fajardo, C.J., Beltrán-Morales, F.A., Hernández-Montiel, L. G., García Liscano, A. E., y Ruiz-Espinoza, F. H. (2021). Emergencia y características agronómicas del Cucumis sativus a la aplicación de quitosano, Glomus cubense y ácidos húmicos. Biotecnia, 23(3), 38-44.
Figure 1.
FTIR spectra of chitosan (UNPA) extracted from shrimp exoskeletons and chitosan (SIGMA) over a wavelength range of 4000 cm⁻¹ to 500 cm⁻¹.
Figure 1.
FTIR spectra of chitosan (UNPA) extracted from shrimp exoskeletons and chitosan (SIGMA) over a wavelength range of 4000 cm⁻¹ to 500 cm⁻¹.
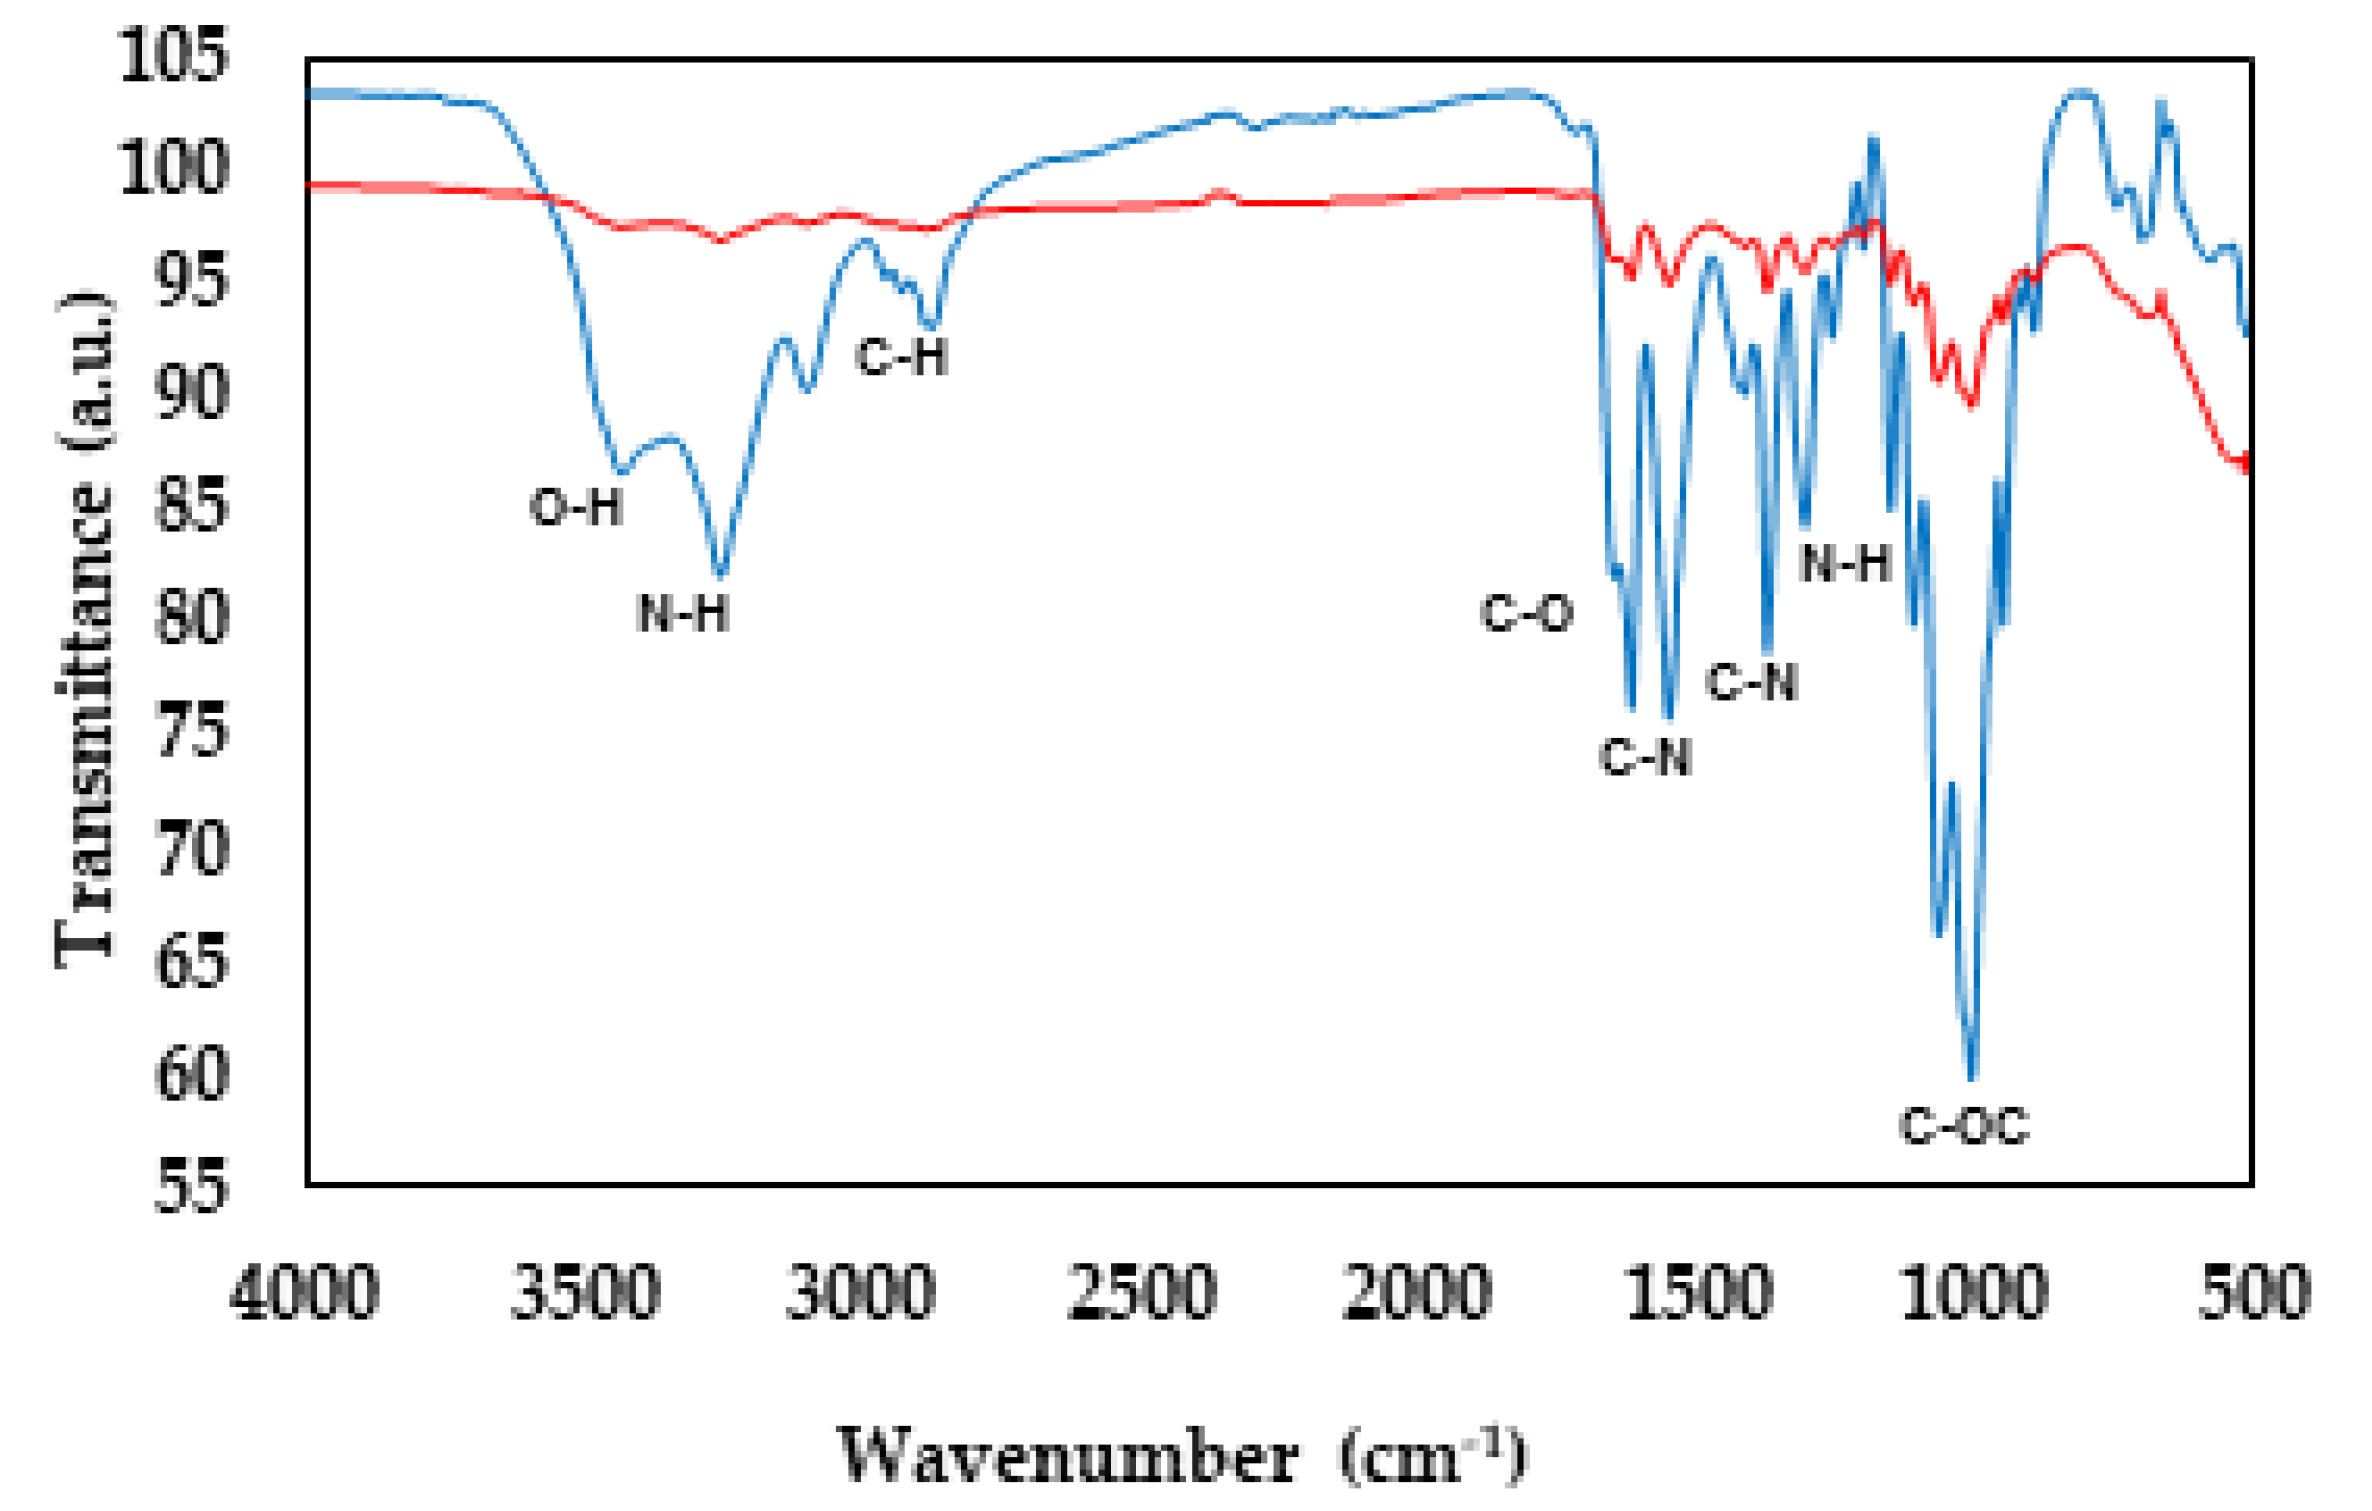
Figure 2.
Plant height (cm) (A), stem diameter (mm) (B), and number of leaves (C),in Chile Soledad (Capsicum annuum L.). Evaluated at 15, 30, and 45 days after sowing (DAS), with four treatments where: Q = UNPA chitosan, BS = Bacillus subtilis, Q+BS = UNPA chitosan + Bacillus subtilis, and T = Control. Columns with a common letter are not significantly different (Tukey, P < 0.05).
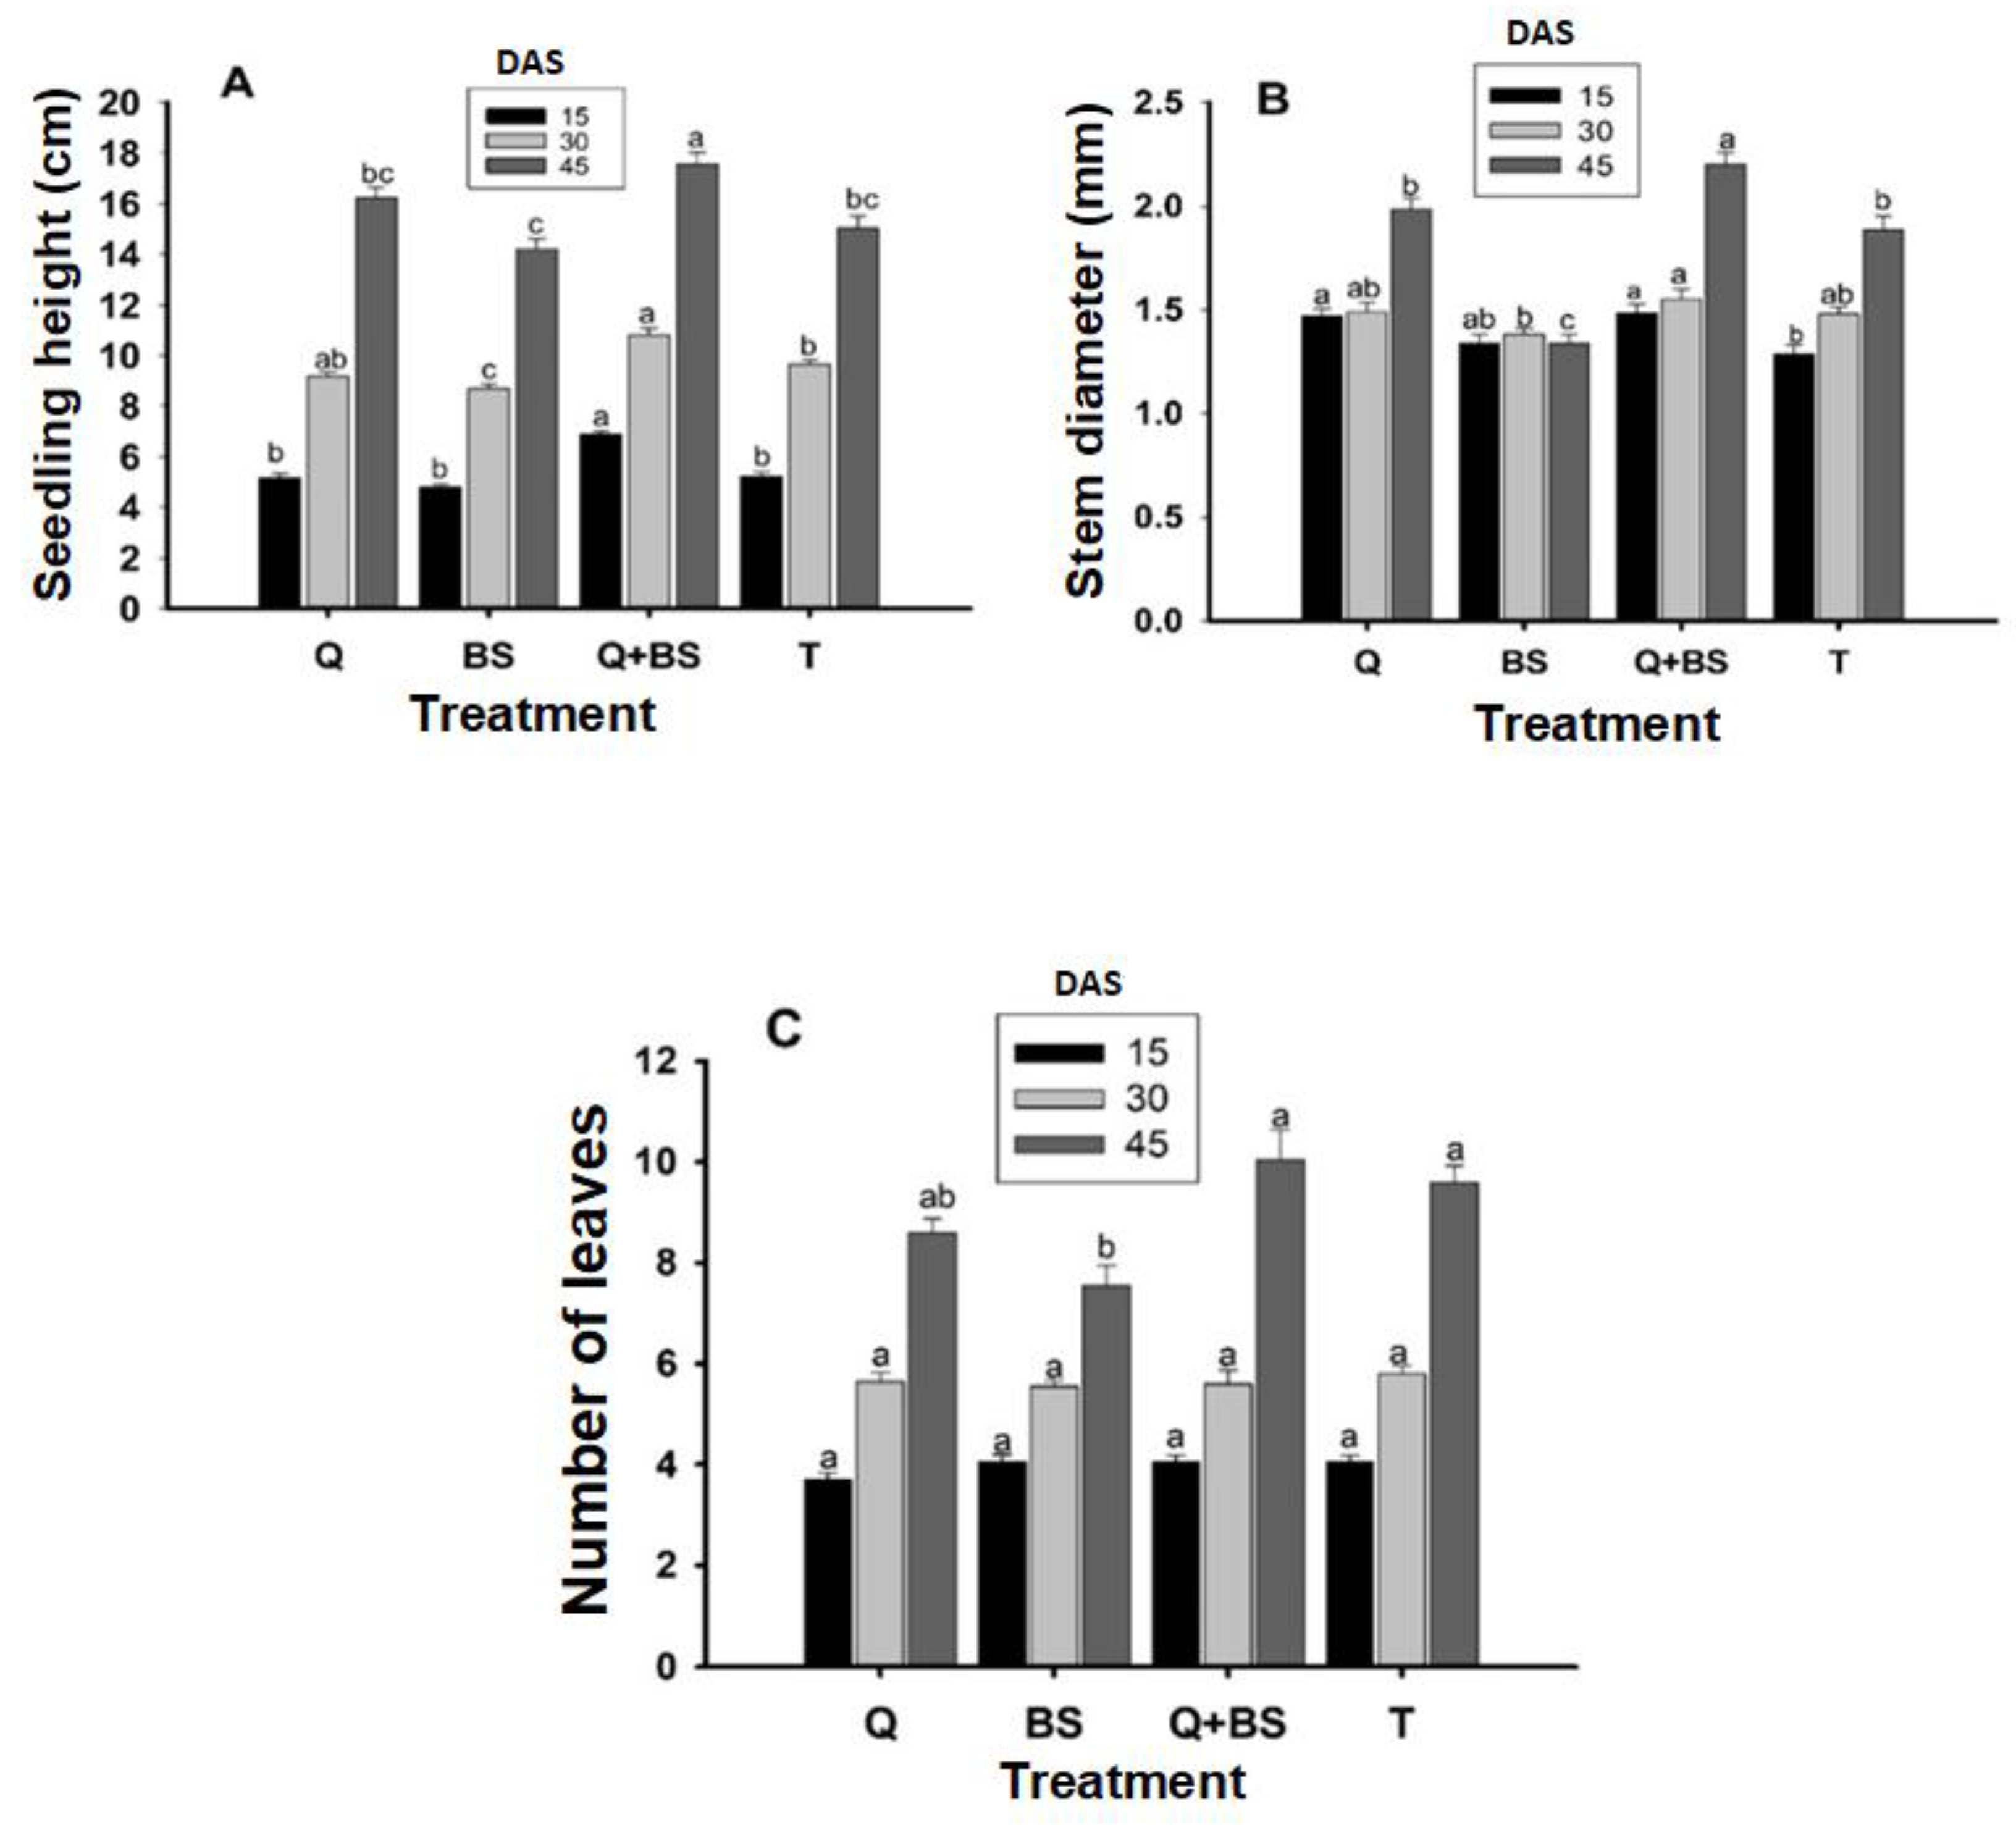
Figure 3.
Plant height (cm) (A), stem diameter (cm) (B), leaf area (cm²) (C), and number of shoots (D) in Soledad chili (Capsicum annuum L.). Evaluated from 15 to 105 days after transplanting (DAT), with four treatments where: Q = UNPA chitosan, BS = Bacillus subtilis, Q + BS = UNPA chitosan + Bacillus subtilis, and T = Control. Columns with a common letter are not significantly different (Tukey, P < 0.05).
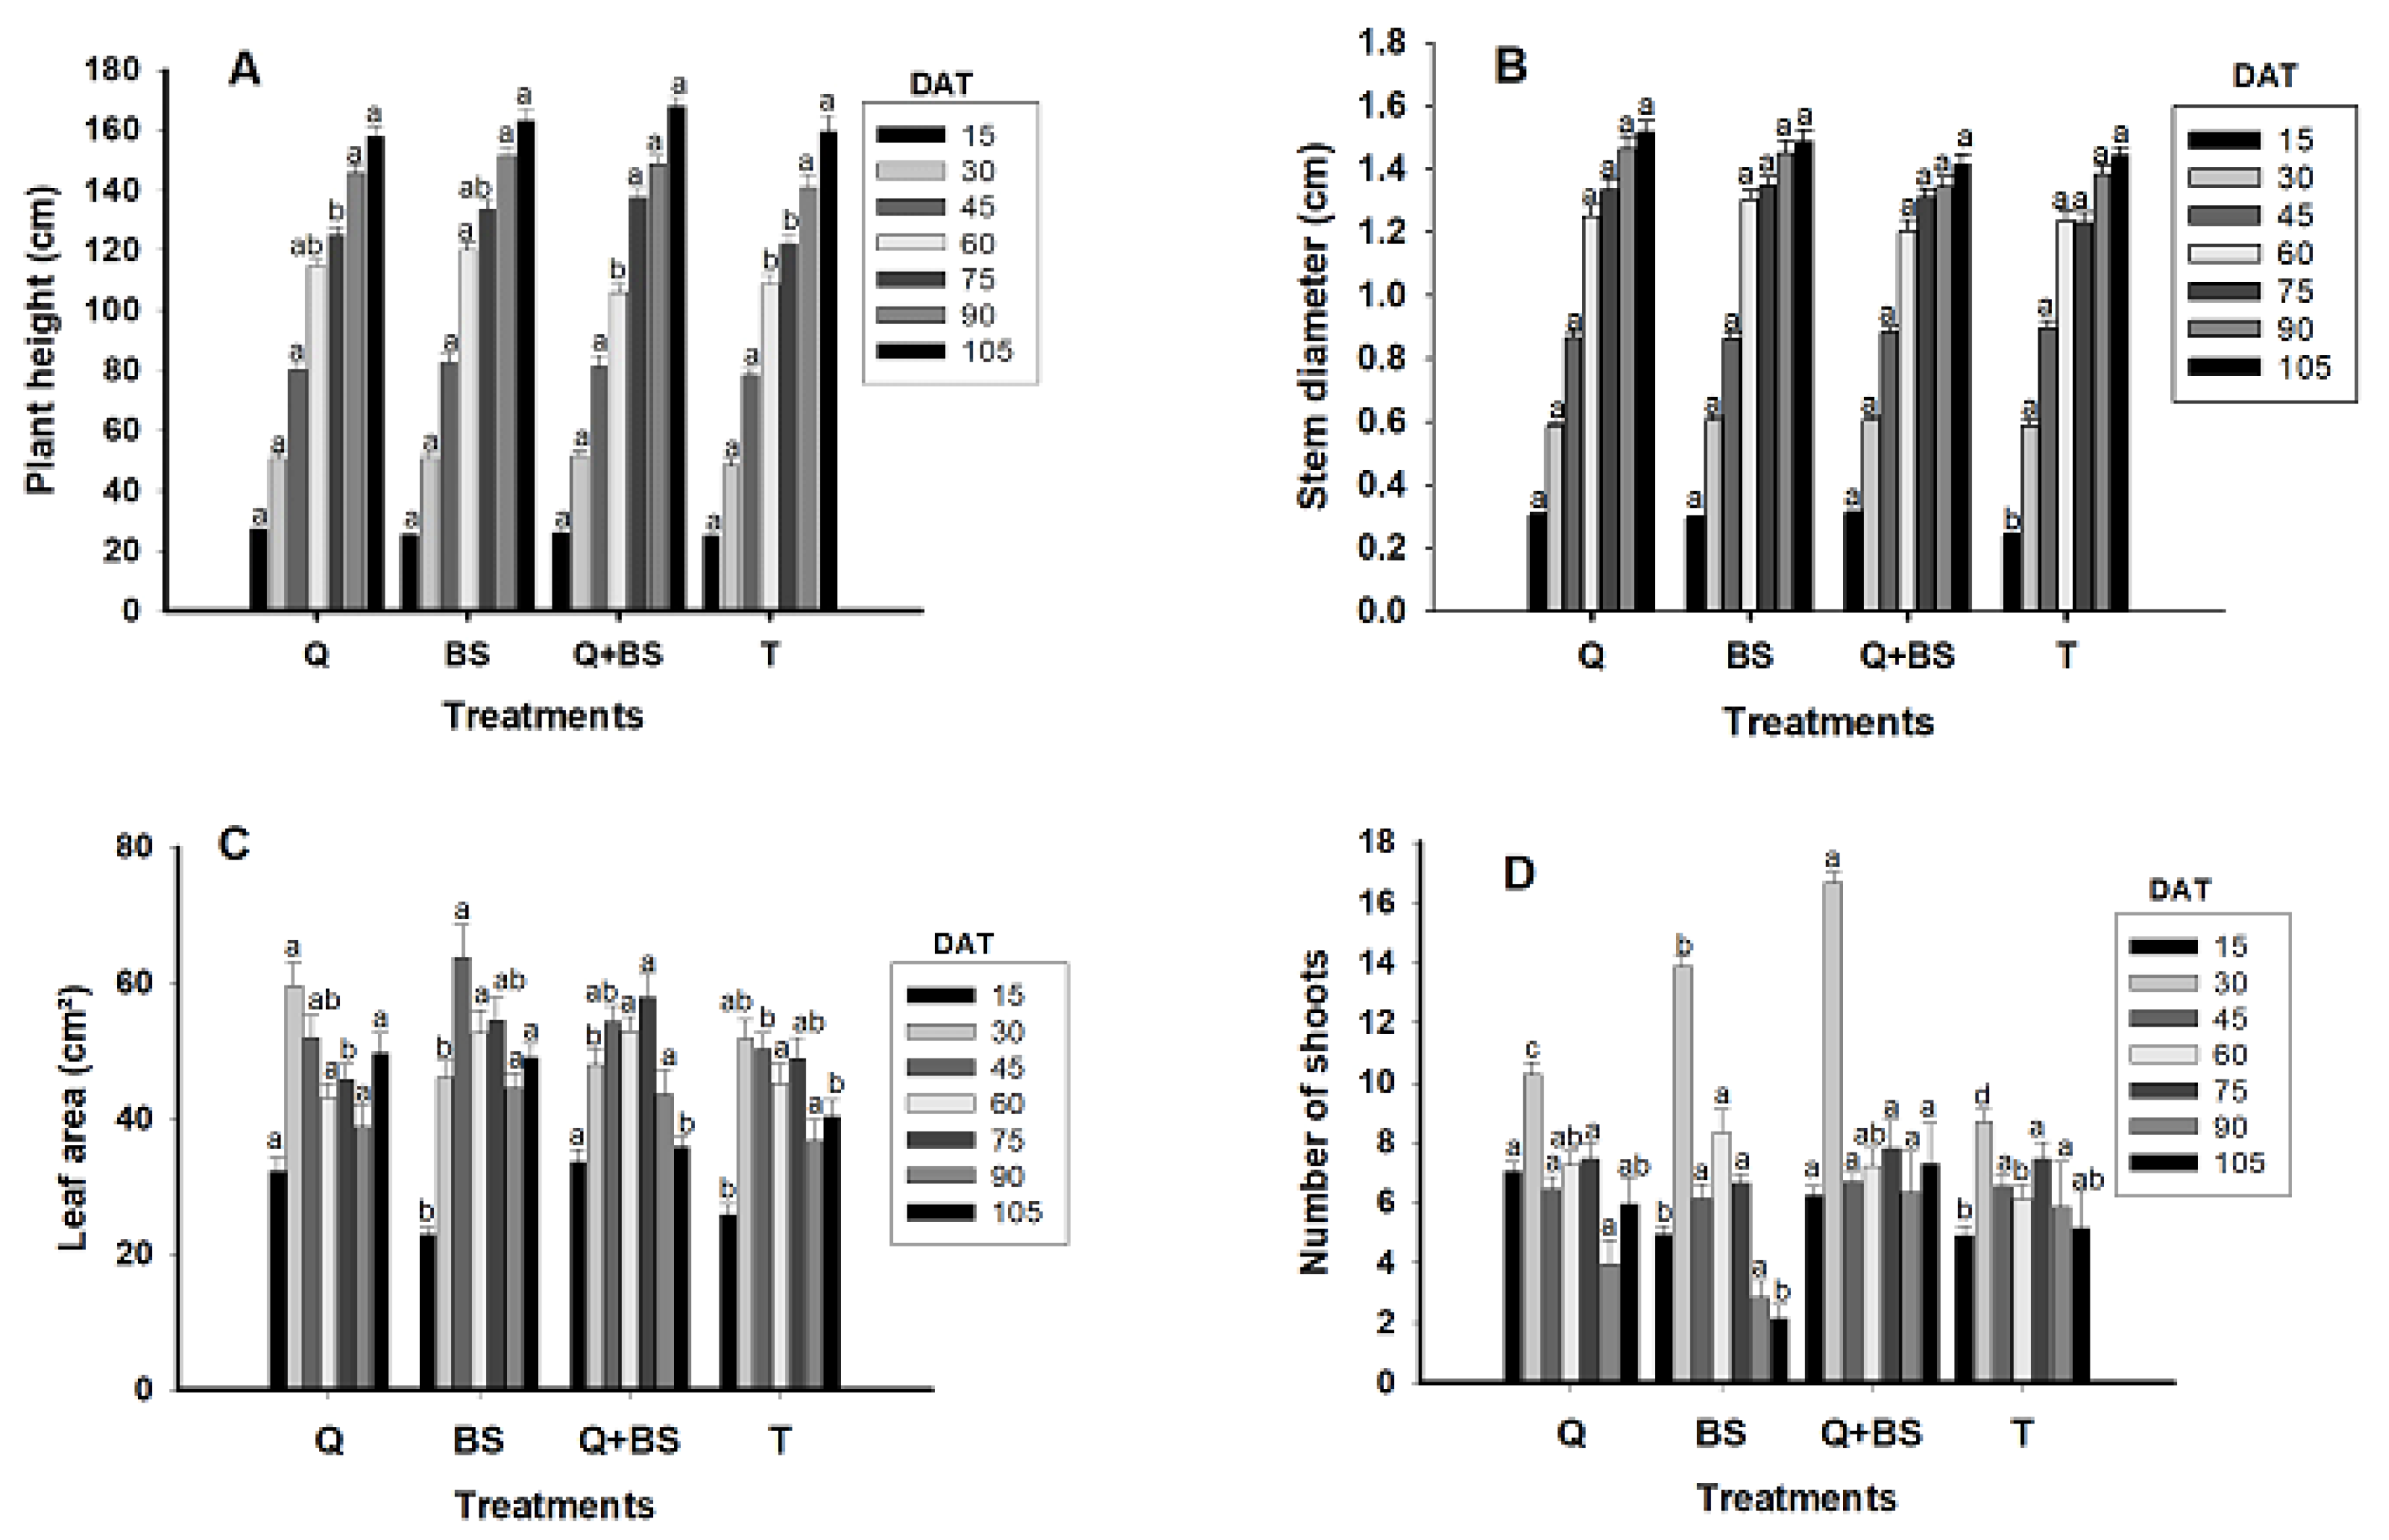
Figure 4.
Chlorophyll A (µg mL⁻¹) (A), chlorophyll B (µg mL⁻¹) (B), and chlorophyll A and B (µg mL⁻¹) (C) in Chile Soledad (Capsicum annuum L.). Evaluated at 30, 60, 90, and 105 days after transplanting (DAT), with four treatments where: Q = UNPA chitosan, BS = Bacillus subtilis, Q + BS = UNPA chitosan + Bacillus subtilis, and T = Control. Columns with a common letter are not significantly different (Tukey, P < 0.05).
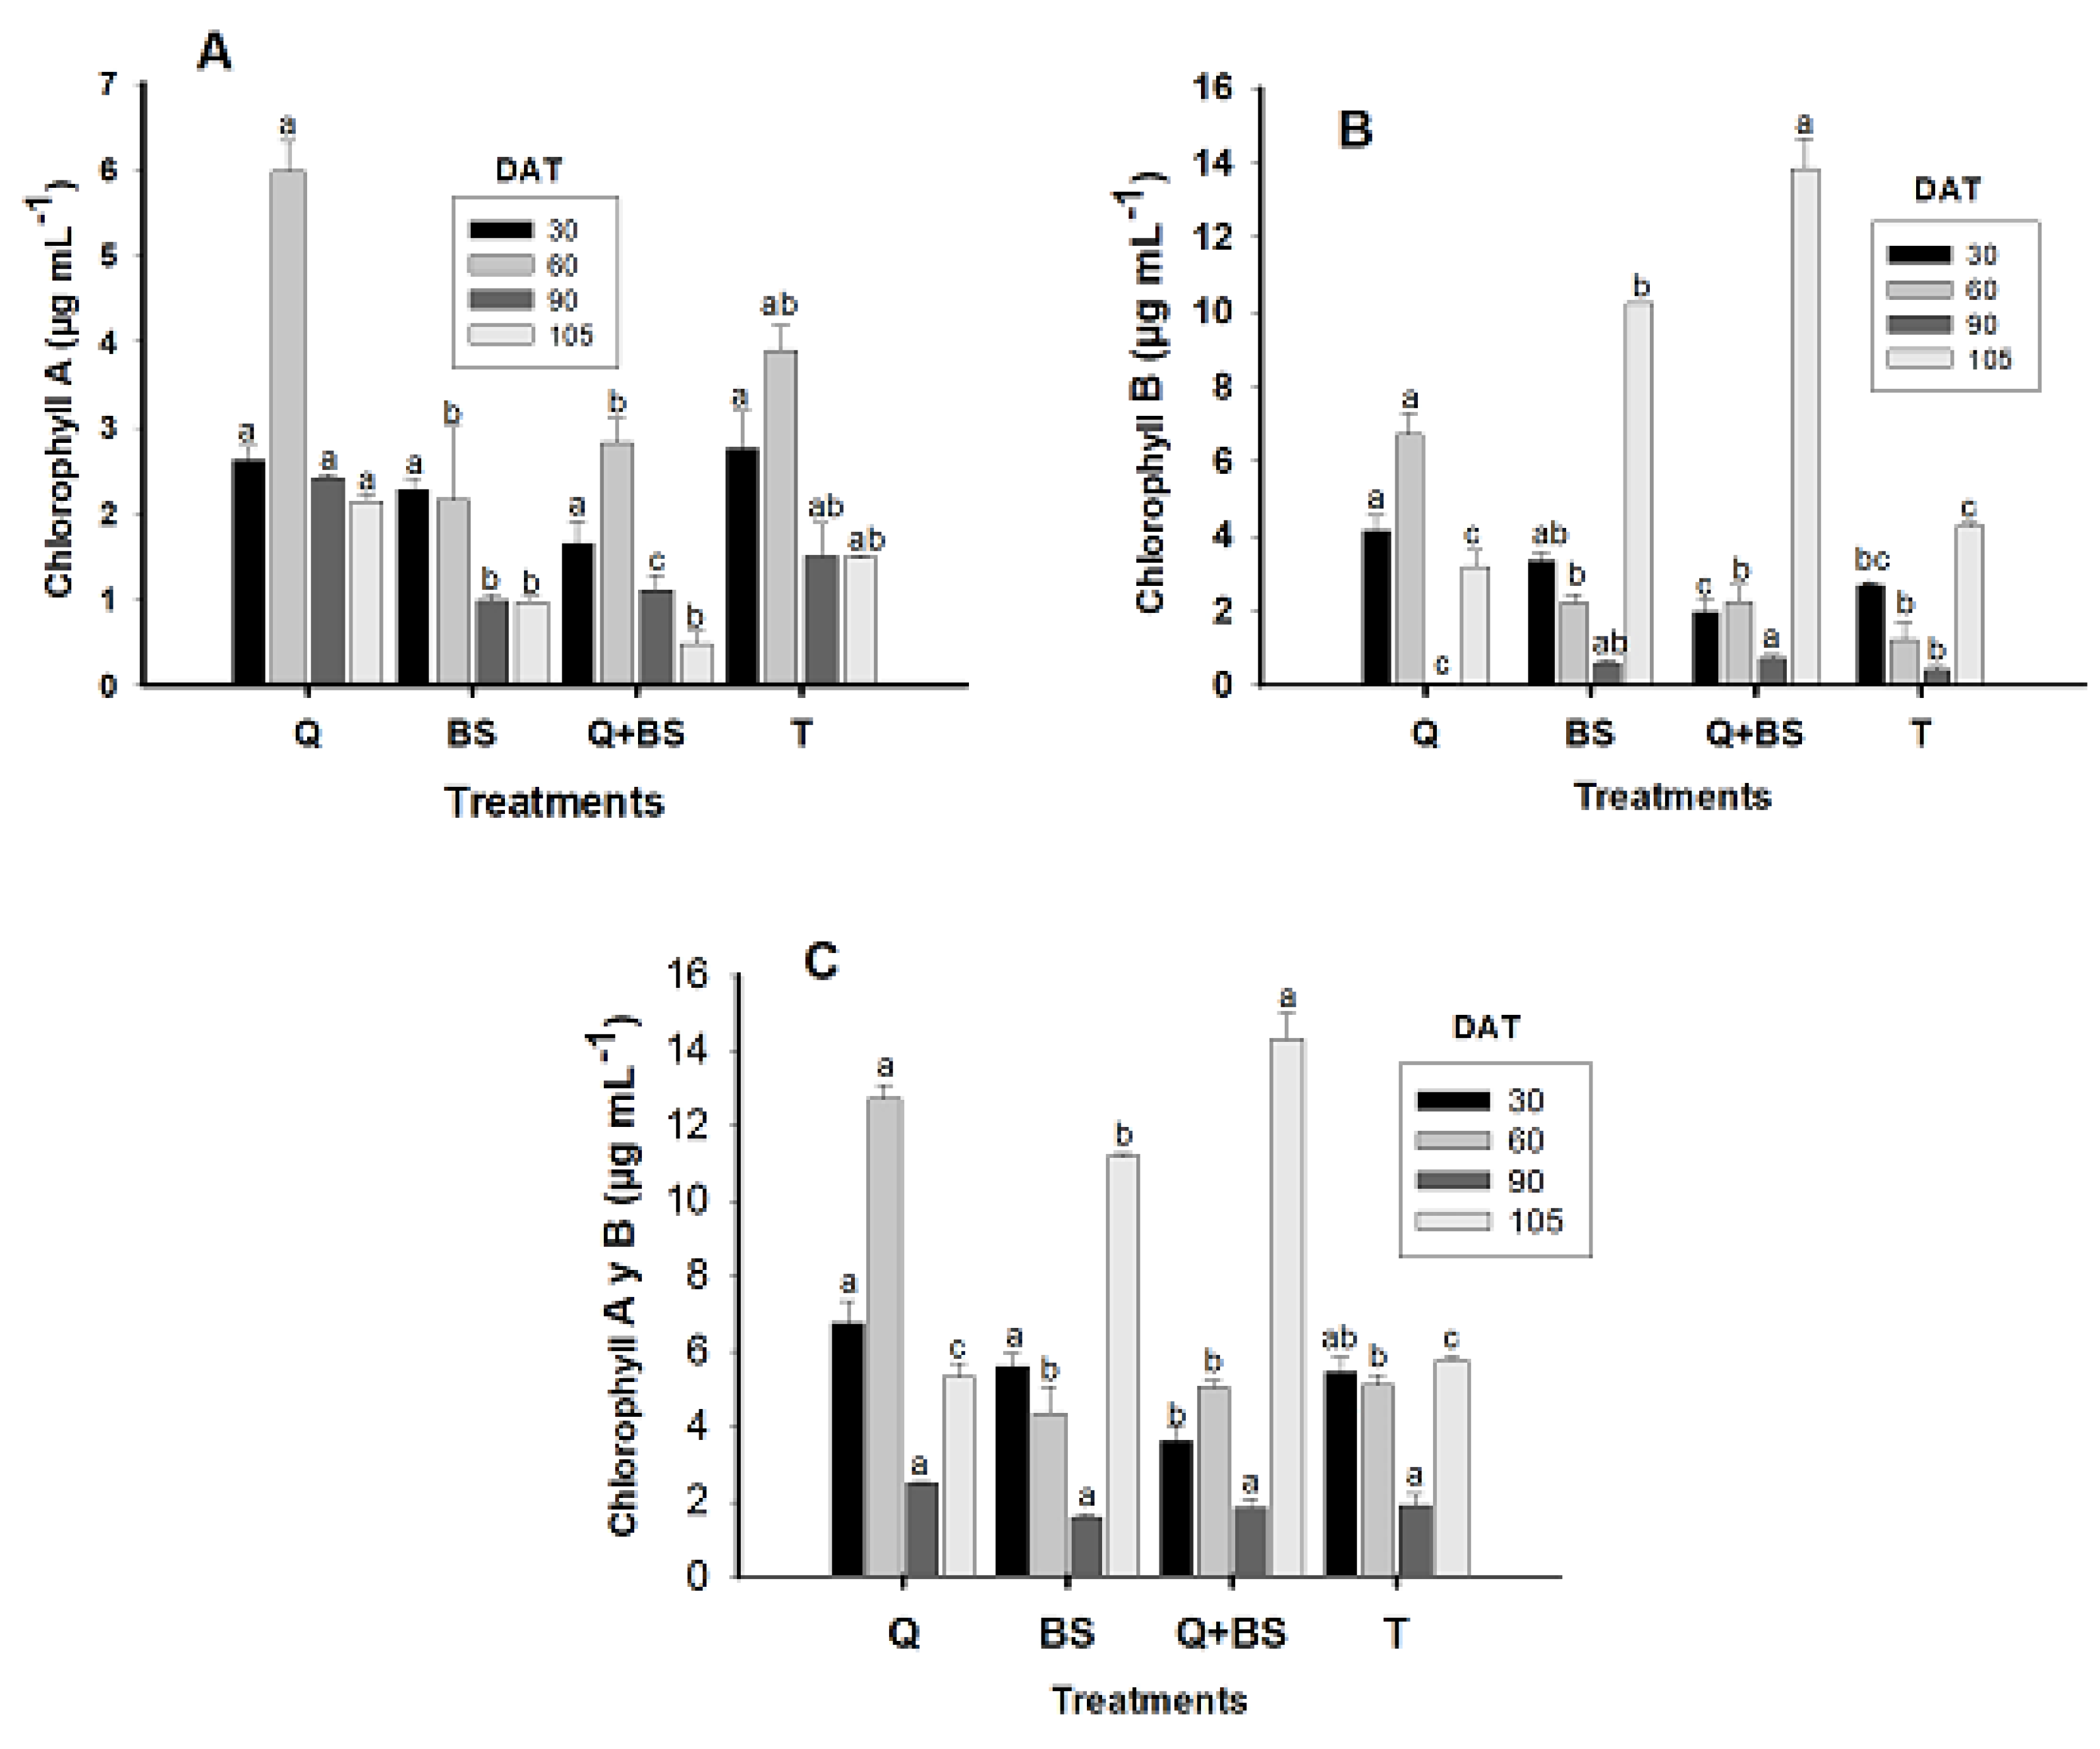
Figure 5.
Effect of electrical conductivity (A), pH (B), and Brix degrees (C) in Soledad chili (Capsicum annuum L.). Evaluated at 30, 60, 90, and 105 days after transplanting (DAT), with four treatments where: Q = UNPA Chitosan, BS = Bacillus subtilis, Q + BS = UNPA Chitosan + Bacillus subtilis, and T = Control. Columns with a common letter are not significantly different (Tukey, P < 0.05).
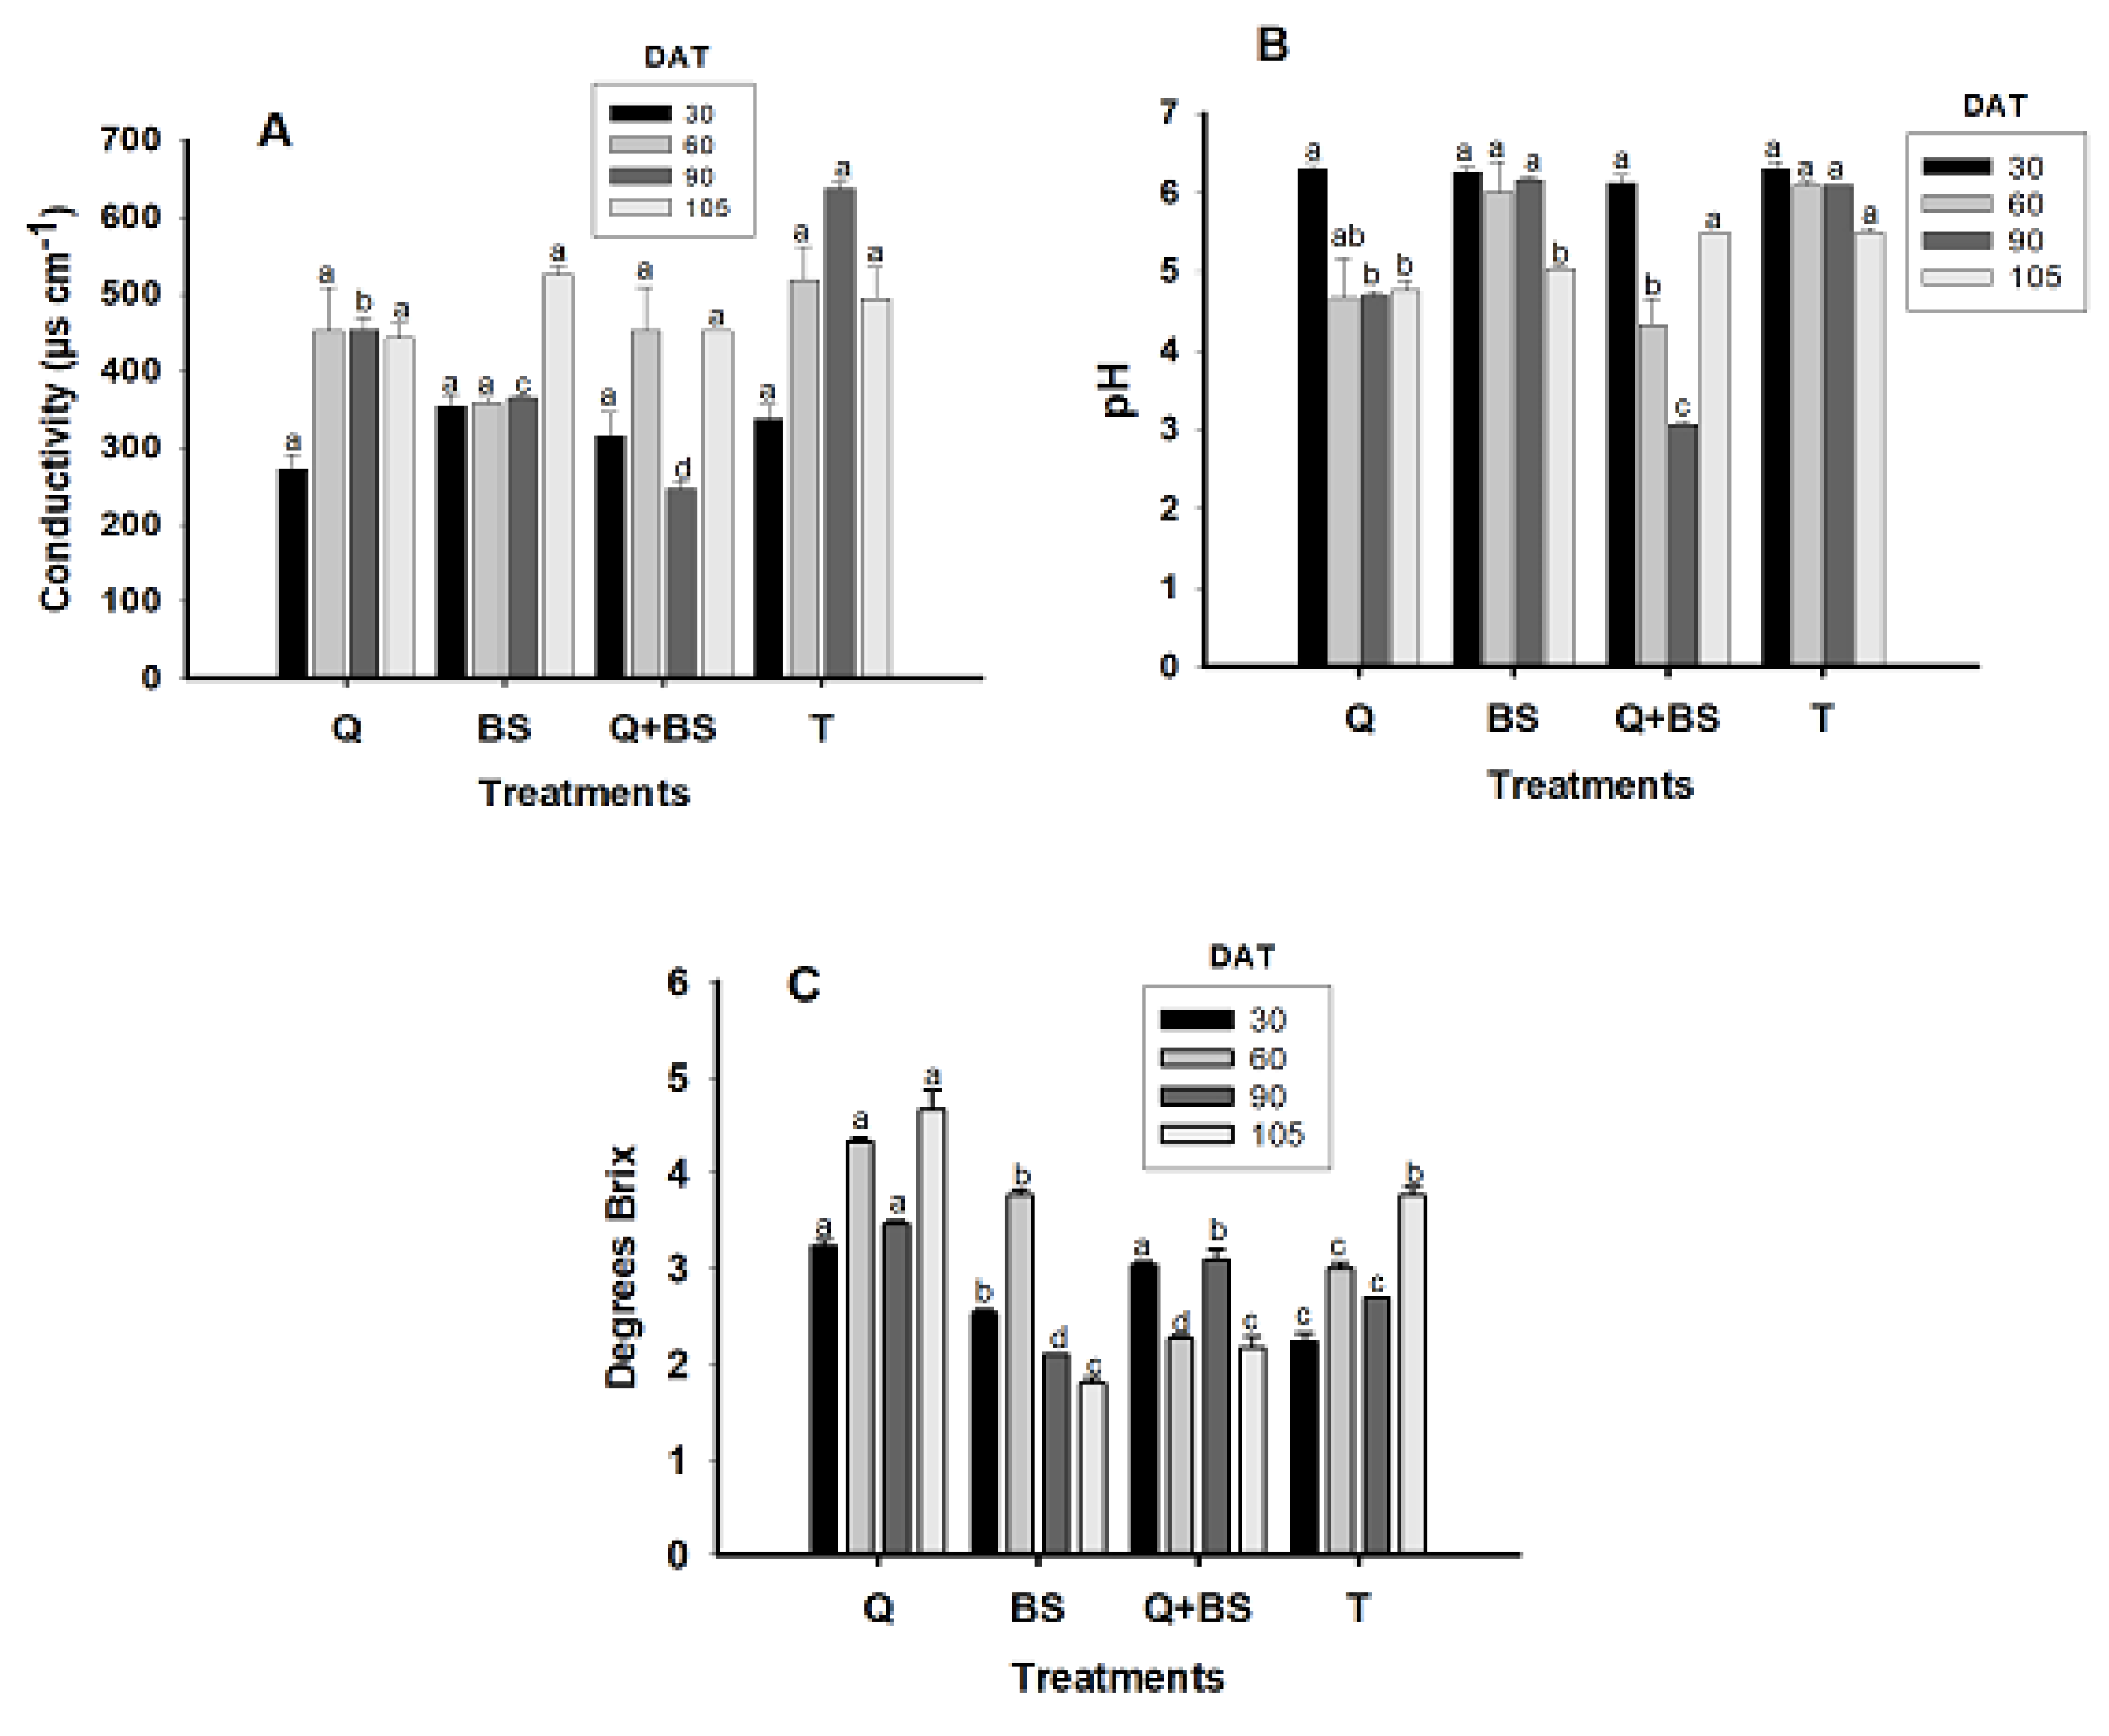
Figure 6.
Nutritional variables: Nitrates in sap (D), phosphorus in sap (E), and potassium in sap (F) in Soledad chili (Capsicum annuum L.). Evaluated at 30, 60, 90, and 105 days after transplanting (DAT), with four treatments where: Q = UNPA Chitosan, BS = Bacillus subtilis, Q + BS = UNPA Chitosan + Bacillus subtilis, and T = Control. Columns with a common letter are not significantly different (Tukey, P < 0.05).
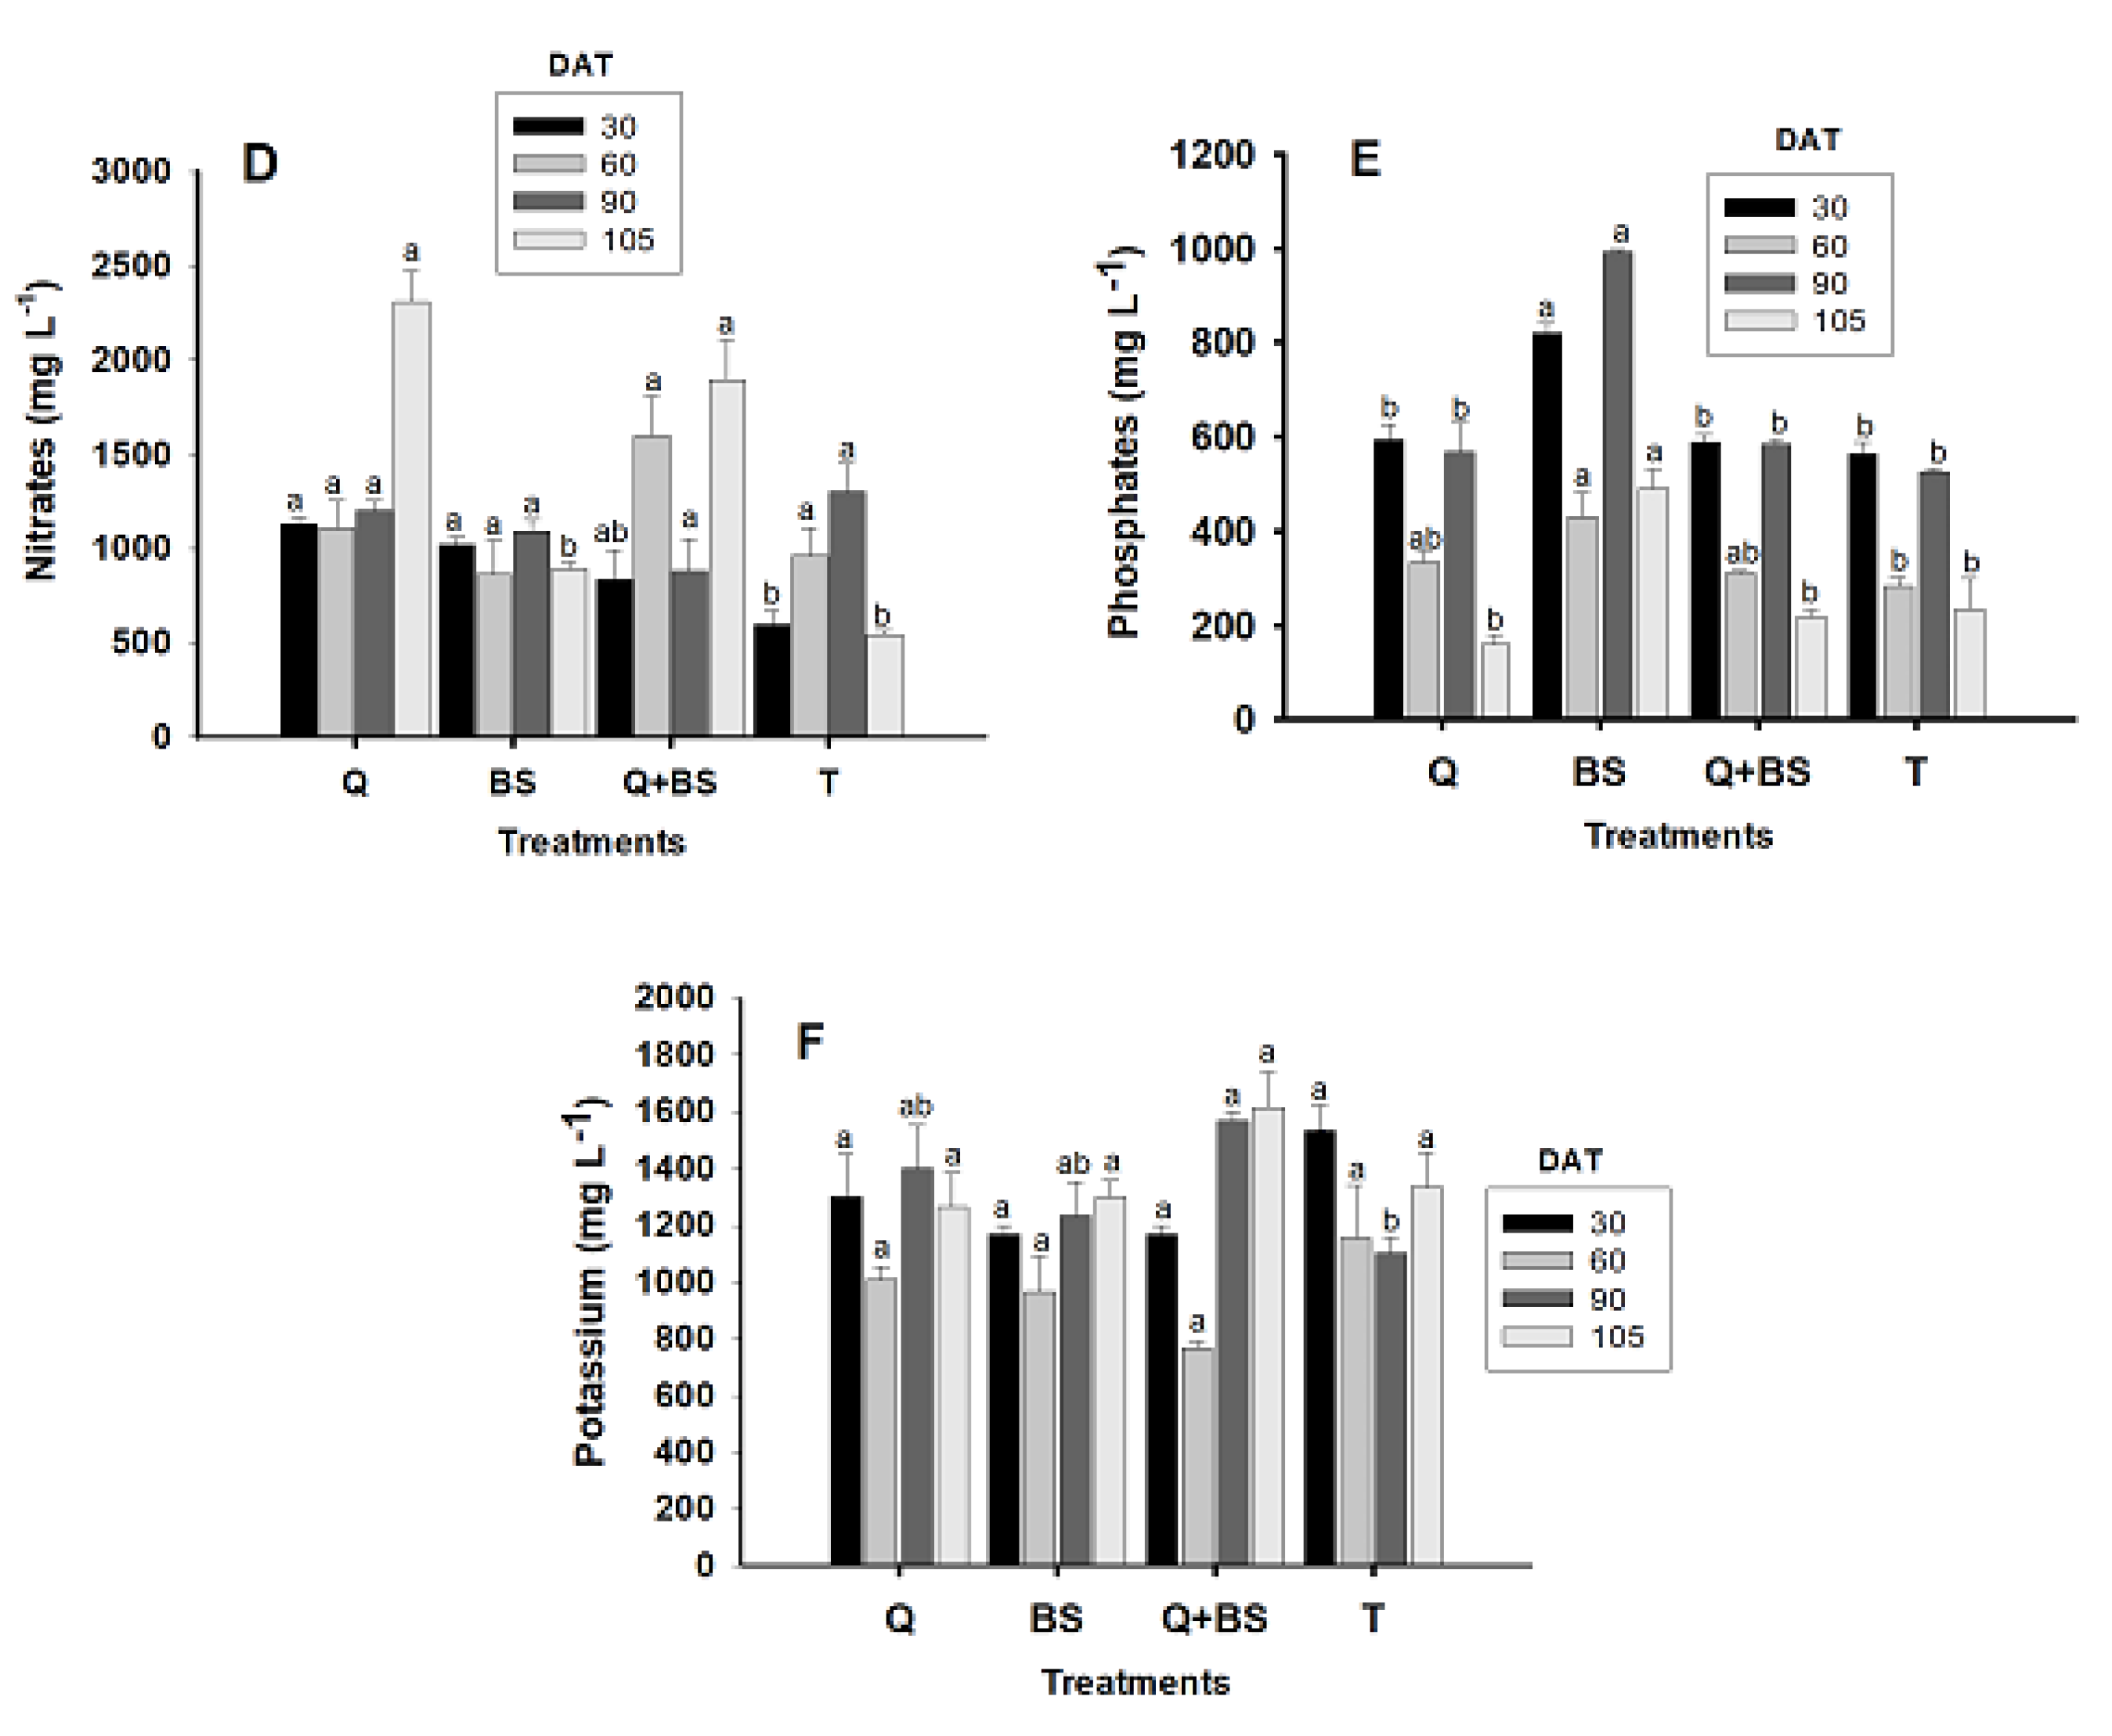
Figure 7.
Effect of the application of biofertilizers on the number of fruits (A) and weight in grams (B) in Soledad chile (Capsicum annuum L.) evaluated with four treatments where: Q = Chitosan UNPA, BS = Bacillus subtilis, Q + BS = Chitosan UNPA + Bacillus subtilis, and T = Control. Columns with a common letter are not significantly different (Tukey, P < 0.05).

Figure 8.
Morphological quality variables in fruits of Soledad chili (Capsicum annuum L.) from the first harvest: Fruit length (A1), fruit diameter (B1), fruit weight in grams (C1), and pericarp thickness (D1) classified by size (small, medium, and large) with four treatments where: Q = UNPA chitosan, BS = Bacillus subtilis, Q + BS = UNPA chitosan + Bacillus subtilis, and T = Control. Columns with a common letter are not significantly different (Tukey, P < 0.05).

Figure 9.
Physicochemical quality variables in fruits of Soledad chili (Capsicum annuum L.) from the first harvest: number of locules (E1), Brix degrees (F1), percentage of citric acid (G1), and pH (H1) classified by size (small, medium, and large) with four treatments where: Q = UNPA chitosan, BS = Bacillus subtilis, Q + BS = UNPA chitosan + Bacillu s subtilis, and T = Control. Columns with a common letter are not significantly different (Tukey, P < 0.05).
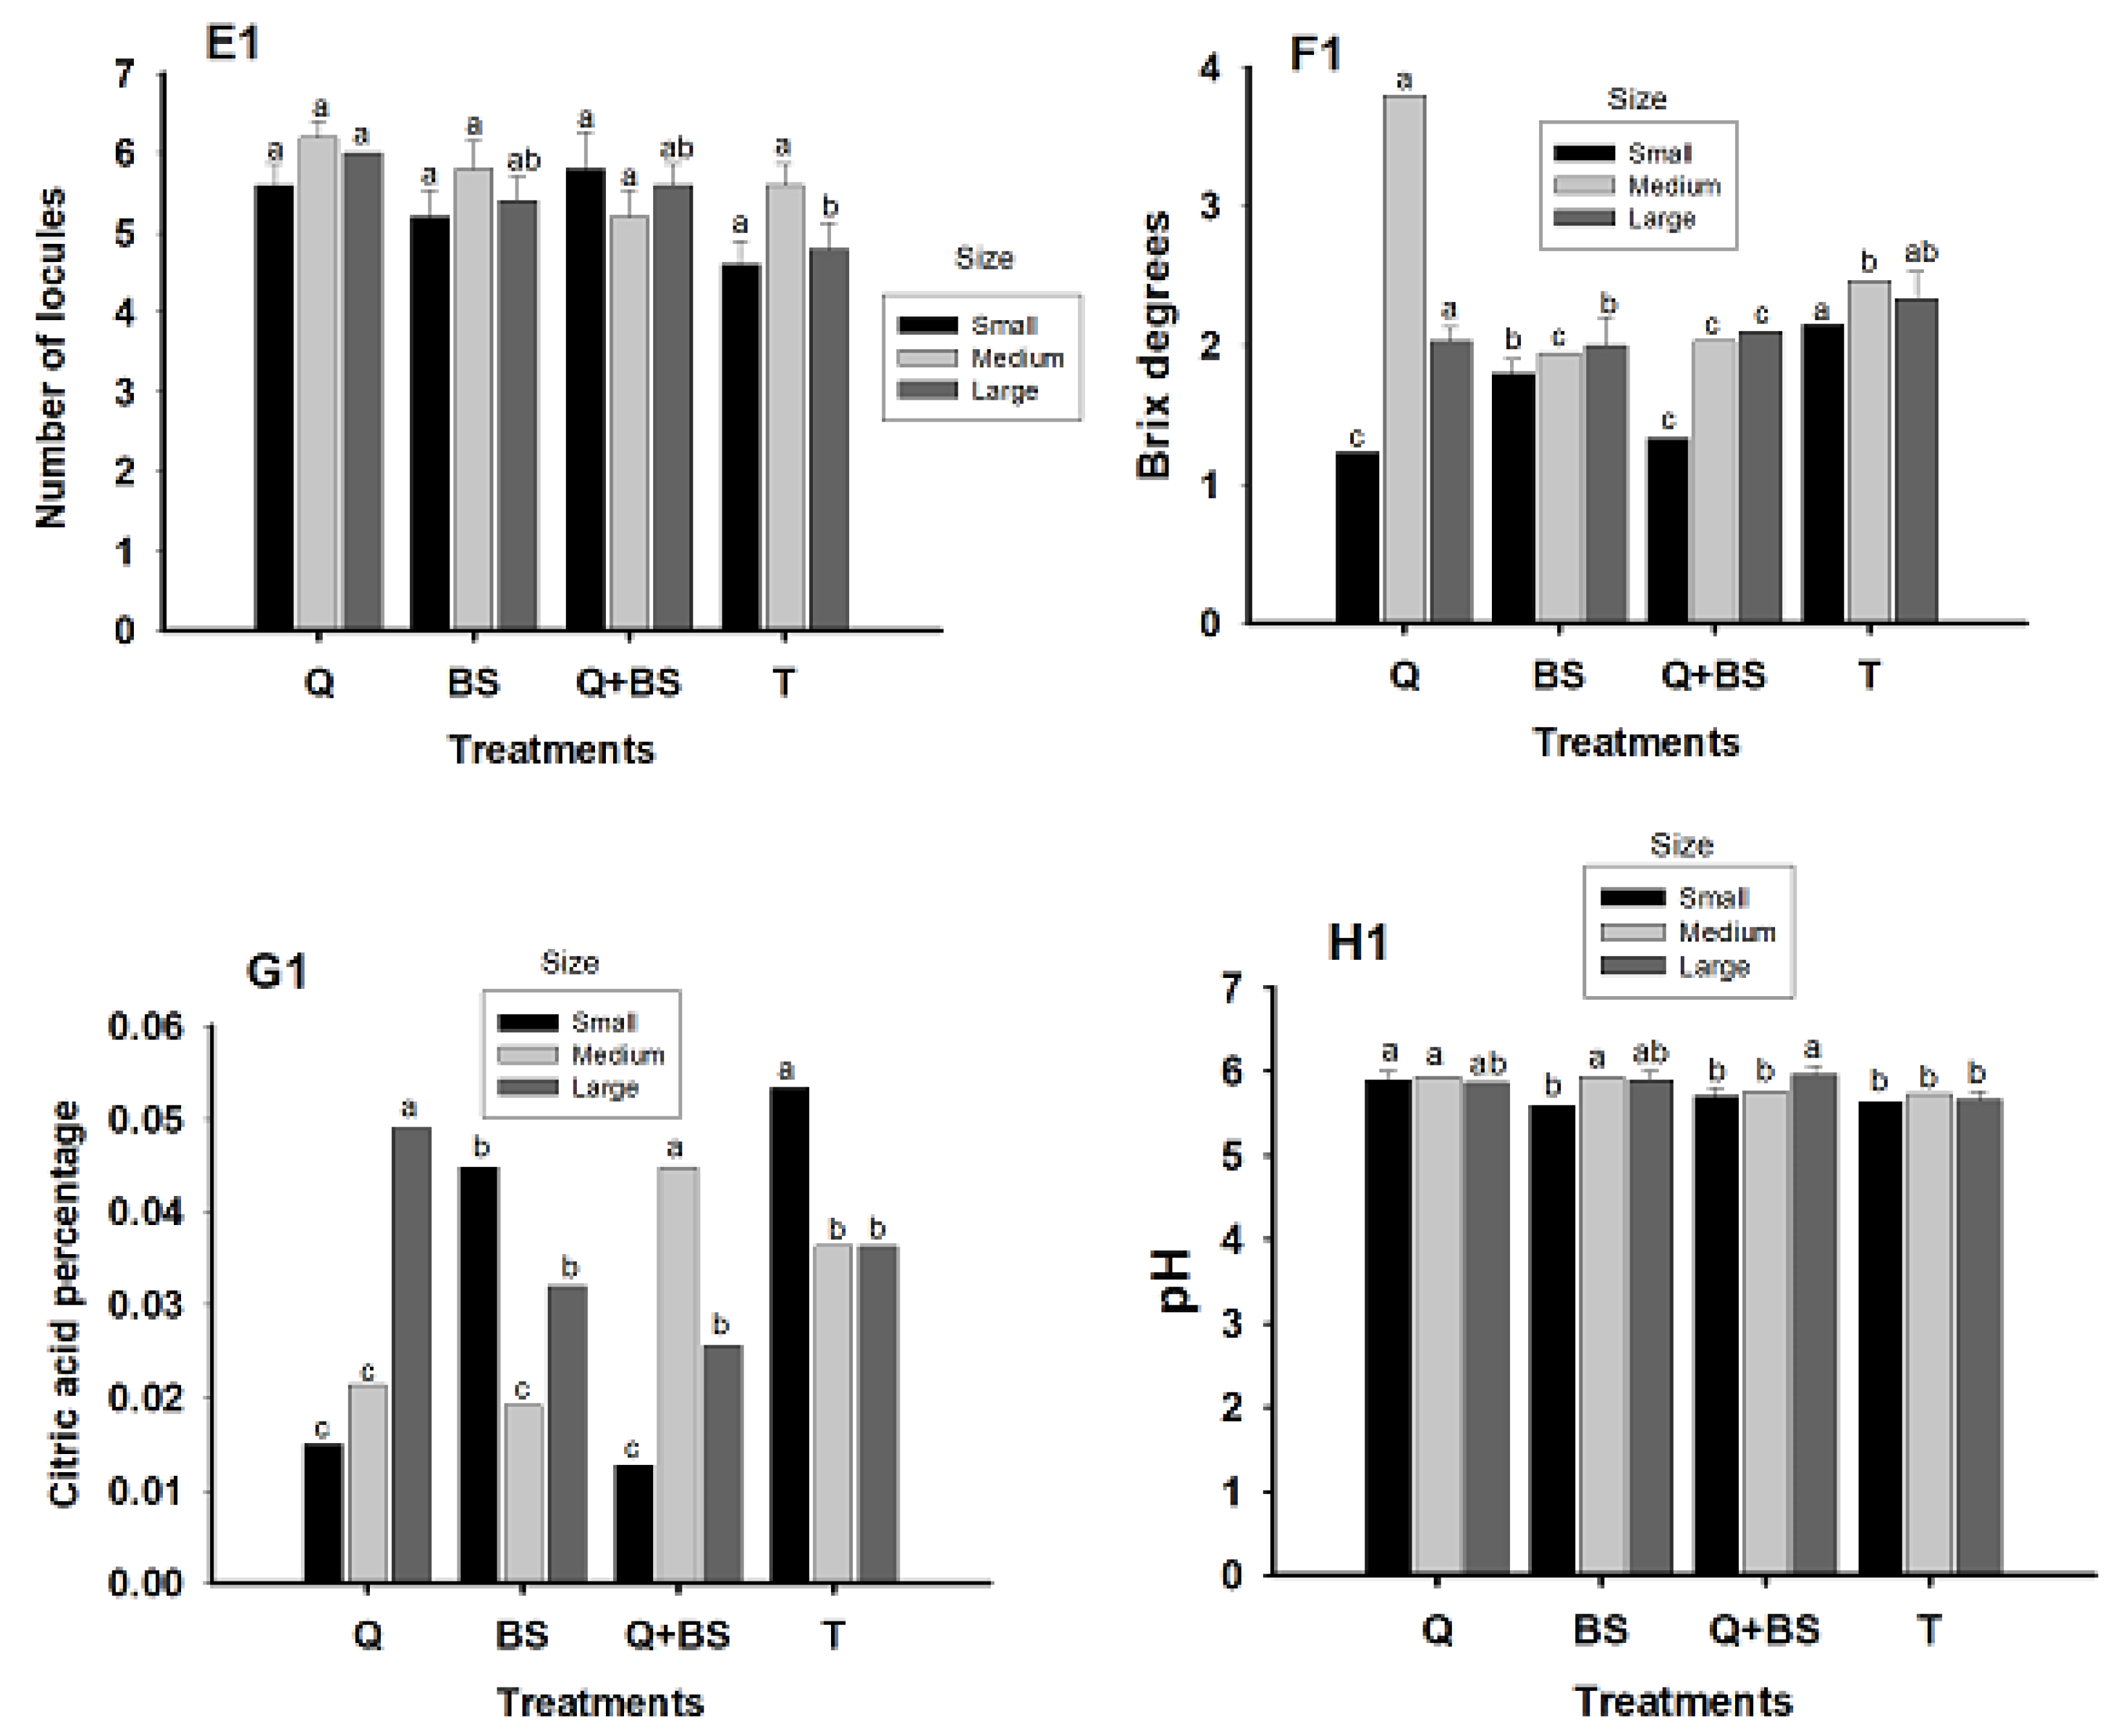
Figure 10.
Morphological quality variables of Soledad chile fruits (Capsicum annuum L.) from the second harvest include fruit length (A1), fruit diameter (B1), fruit weight in grams (C1), and pericarp thickness (D1) classified into small, medium, and large sizes across four treatments: Q = Chitosan UNPA, BS = Bacillus subtilis, Q + BS = Chitosan UNPA + Bacillus subtilis, and T = Control. Columns sharing a common letter are not significantly different (Tukey, P < 0.05).
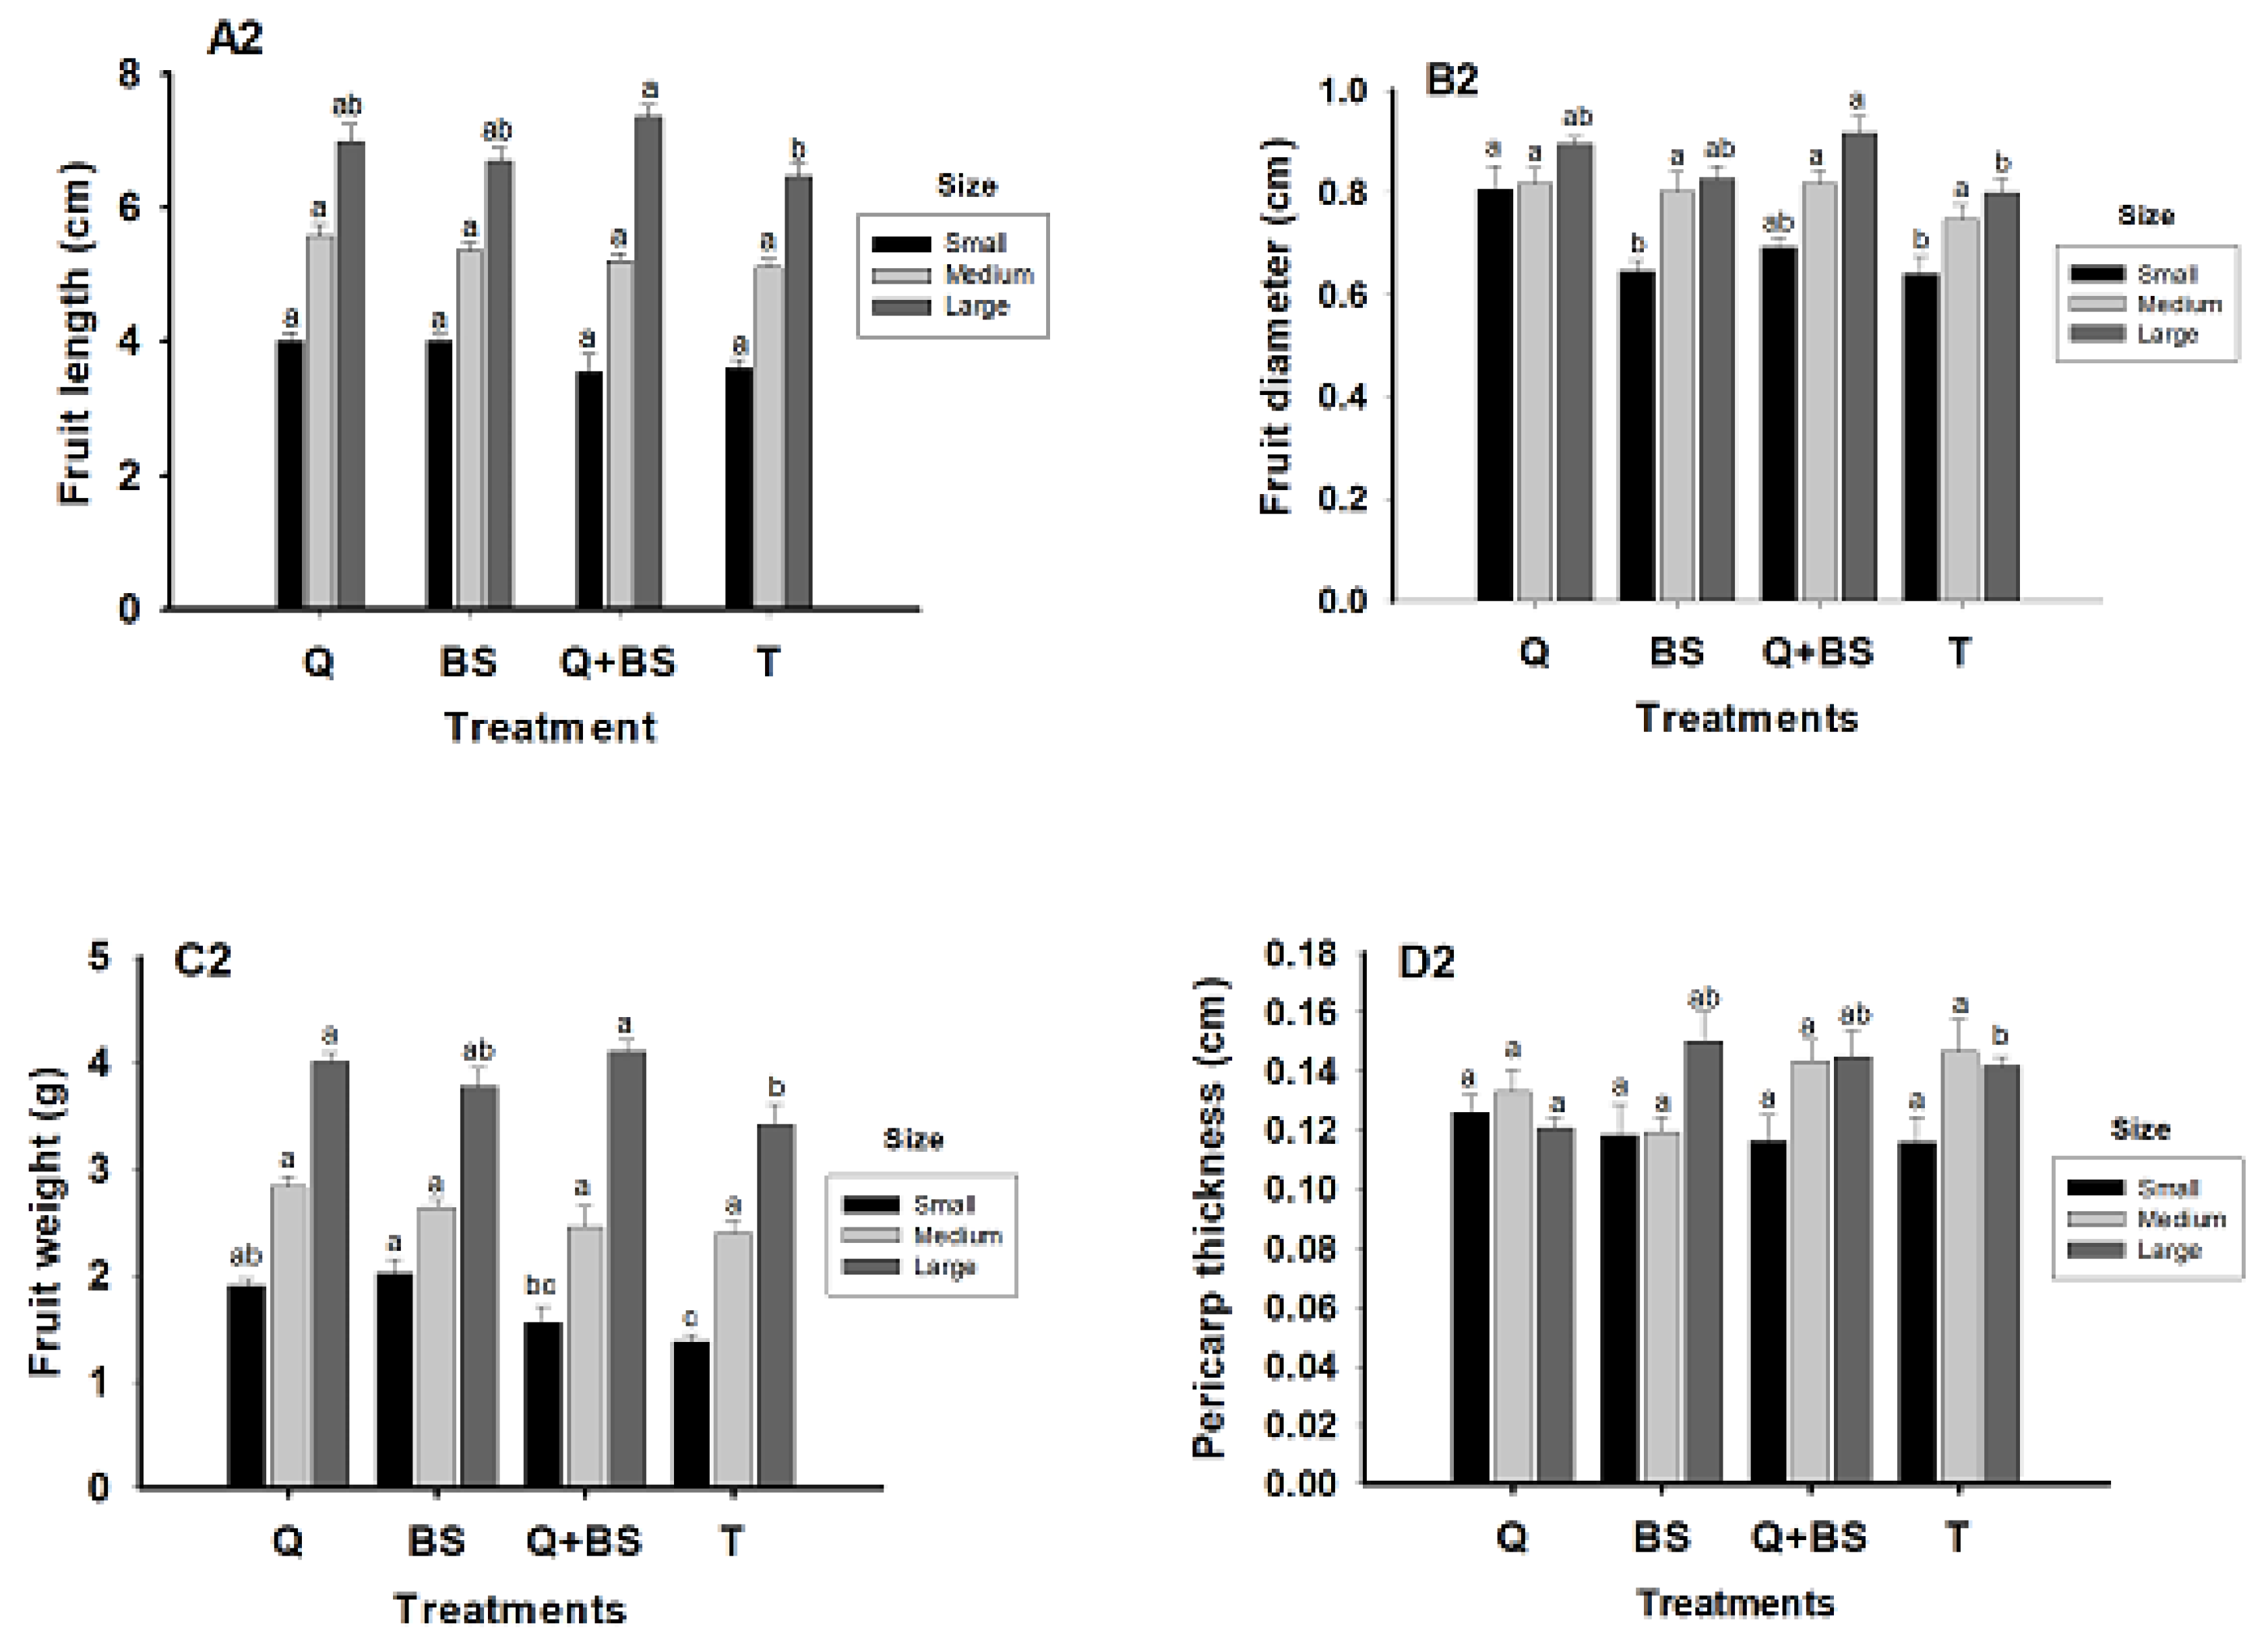
Figure 11.
Physicochemical quality variables of Soledad chile fruits (Capsicum annuum L.) from the second harvest include the number of locules (E2), Brix degrees (F2), percentage of citric acid (G2), and pH (H2), classified into small, medium, and large sizes across four treatments: Q = Chitosan UNPA, BS = Bacillus subtilis, Q + BS = Chitosan UNPA + Bacillus subtilis, and T = Control. Columns sharing a common letter are not significantly different (Tukey, P < 0.05).
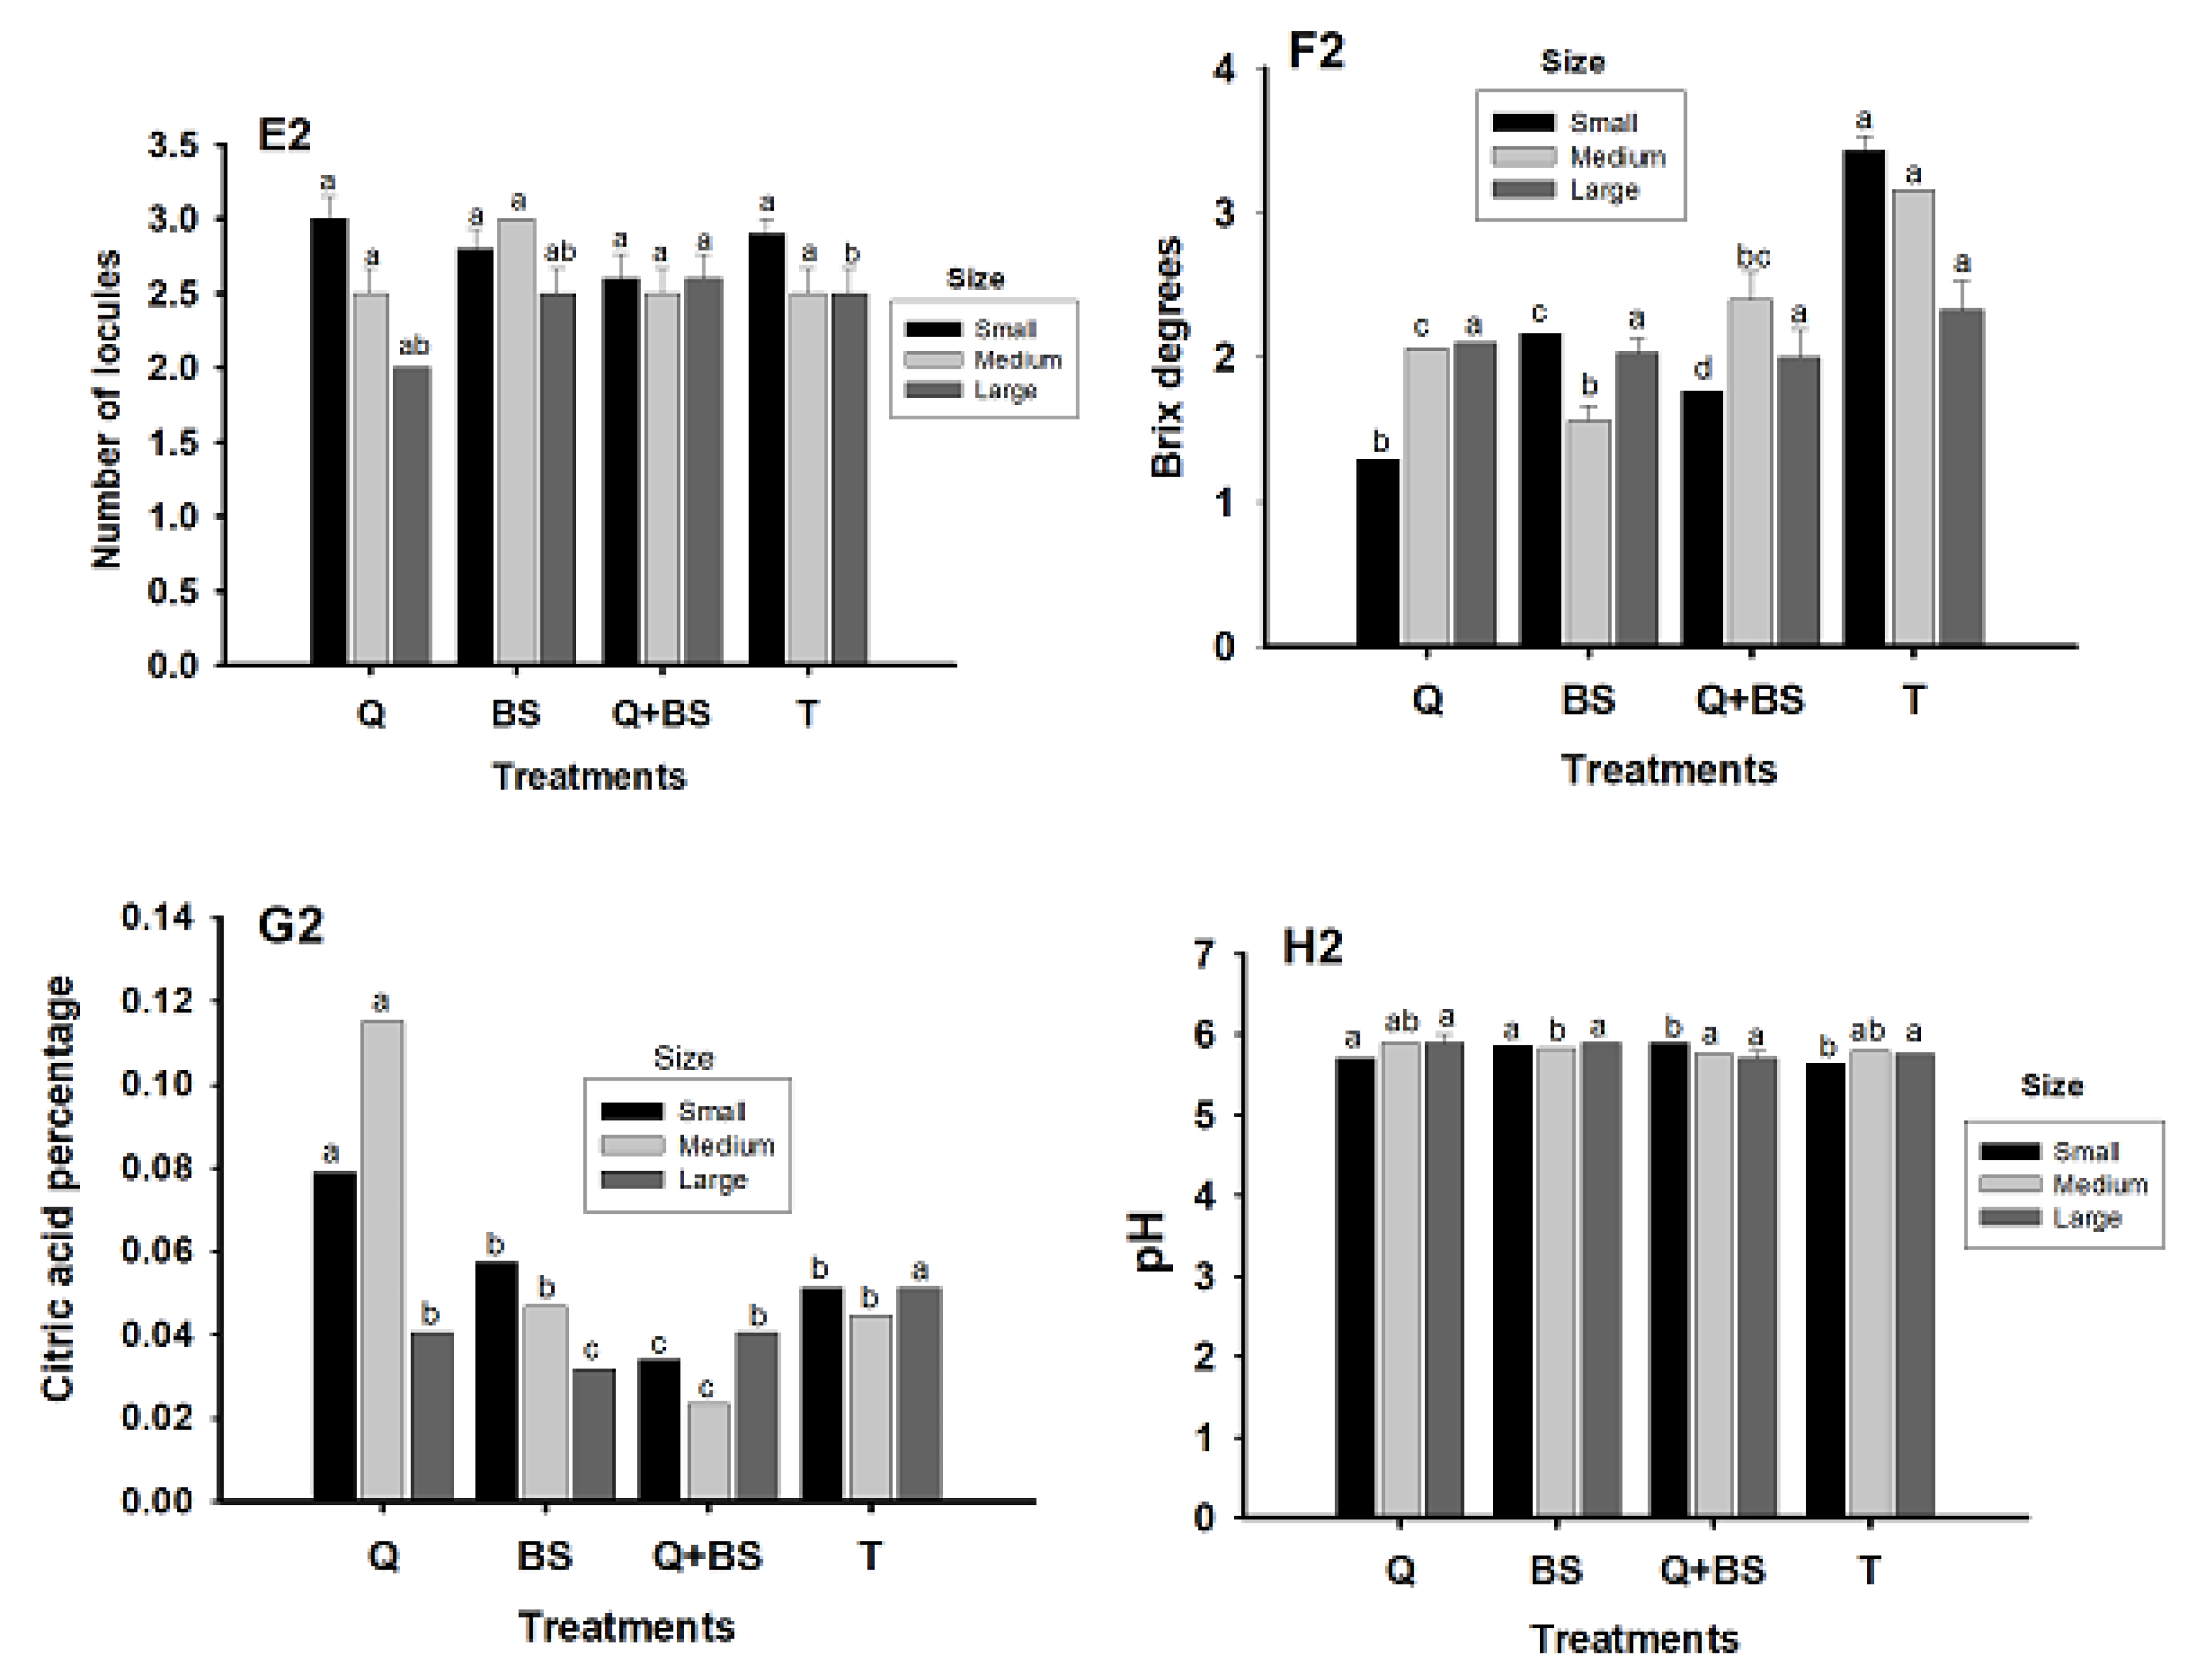
Figure 12.
Effect of the application of biofertilizers on the capsaicin content in Soledad chile cultivation (Capsicum annuum L.) from the first harvest (A1) and second harvest (A2), classified into small, medium, and large sizes across four treatments: Q = Chitosan, BS = Bacillus subtilis, Q + BS = Chitosan + Bacillus subtilis, and T = Control. Columns sharing a common letter are not significantly different (Tukey, P < 0.05).

Table 1.
Description of the treatments applied.
| Treatments | Description |
|---|---|
| Q (2 g/L) | UNPA Chitosan + Nutrient Solution |
| BS (0.015 g/L) | Bacillus subtilis + Nutrient Solution |
| Q (2 g/L) + BS (0.015 g/L) | UNPA Chitosan + Bacillus subtilis + Nutrient Solution |
| T | Nutrient Solution |
Table 2.
Content of minerals, protein, moisture, and pH in the different analyzed samples: shrimp exoskeleton, UNPA chitosan, and Sigma chitosan.
Table 2.
Content of minerals, protein, moisture, and pH in the different analyzed samples: shrimp exoskeleton, UNPA chitosan, and Sigma chitosan.
| Sample | %M | %DM | %P | %DP | %H | pH |
|---|---|---|---|---|---|---|
| Shrimp exoskeleton | 24.6 | 0 | 44.62 | 0 | 6.5 | 8.8 |
| Chitosan UNPA | 2.71 | 97.28 | 7.43 | 83.34 | 11.5 | 3.4 |
| Chitosan SIGMA | 4.5 | 95.46 | 8.92 | 80.01 | 11.33 | 3.4 |
1 Average of three repetitions: %M: Minerals, %DM: Demineralization, %P: Proteins, %Dp: Deproteinization, H: Moisture, pH: Hydrogen potential.
Table 3.
Color determination of the different analyzed samples: shrimp exoskeleton, UNPA chitosan, and Sigma chitosan.
Table 3.
Color determination of the different analyzed samples: shrimp exoskeleton, UNPA chitosan, and Sigma chitosan.
| Sample | Colorimetry | Color | COLOR CHART |
||
|---|---|---|---|---|---|
| L* | A* | B* | |||
| Shrimp exoskeleton | 62.23 | 1.17 | 16.3 | #A5947A |  |
| Chitosan UNPA | 75.63 | 0.56 | 3.46 | #BEBAB4 |  |
| Chitosan SIGMA | 65.56 | 4.8 | 12.1 | #B09C8A |  |
1 Average of three repetitions: %M: Minerals, %DM: Demineralization, %P: Proteins, %Dp: Deproteinization, H: Humidity, pH: Hydrogen potential.
Table 4.
Effect of treatments on the number of fruits of chile soledad (Capsicum annuum L.)1.
| TREATMENT | CUT 1 69 DAT |
CUT 2 85 DAT |
CUT 3 106 DAT |
|
|---|---|---|---|---|
| UNPA Chitosan | 16.0±3.47a | 46.85±4.94a | 41.55±4.11a | |
| Bacillus subtilis | 17.4±1.81a | 49.80±5.78a | 34.55±3.36a | |
| UNPA Chitosan + Bacillus subtilis | 22.0±3.08a | 35.15±2.39a | 35.75±2.19a | |
| Control | 19.35±3.09a | 18.45±2.34b | 19.95±1.43b |
1 Promedio de tres repeticiones: %M: Minerales, %DM: Desmineralización, %P: Proteínas, %Dp: Desproteinización, H: Humedad, pH: Potencial de hidrógeno.
Table 5.
Yield in grams (g) of fruits of chile soledad (Capsicum annuum L.)1.
| TREATMENT | CUT 1 69 DAT |
CUT 2 85 DAT |
CUT 3 106 DAT |
|
|---|---|---|---|---|
| UNPA Chitosan | 31.85±8.02a | 110.74±11.07a | 104.25±8.36a | |
| Bacillus subtilis | 34.05±3.96a | 106.43±11.40a | 60.90±6.38a | |
| UNPA Chitosan + Bacillus subtilis | 21.99±3.08a | 79.67±7.06a | 103.81±42.67a | |
| Control | 46.85±7.04a | 34.54±4.31b | 36.68±2.63a |
1 Promedio de tres repeticiones: %M: Minerales, %DM: Desmineralización, %P: Proteínas, %Dp: Desproteinización, H: Humedad, pH: Potencial de hidrógeno.
Disclaimer/Publisher’s Note: The statements, opinions and data contained in all publications are solely those of the individual author(s) and contributor(s) and not of MDPI and/or the editor(s). MDPI and/or the editor(s) disclaim responsibility for any injury to people or property resulting from any ideas, methods, instructions or products referred to in the content. |
© 2025 by the authors. Licensee MDPI, Basel, Switzerland. This article is an open access article distributed under the terms and conditions of the Creative Commons Attribution (CC BY) license (http://creativecommons.org/licenses/by/4.0/).
Copyright: This open access article is published under a Creative Commons CC BY 4.0 license, which permit the free download, distribution, and reuse, provided that the author and preprint are cited in any reuse.


