
Submitted:
05 February 2025
Posted:
06 February 2025
You are already at the latest version
Abstract
Zeolite Battery Research Africa (ZEBRA) batteries (Na-NiCl2 solid electrolyte batteries, SEBs) have commercial applications in, e.g., energy storage due to their low costs and recyclability, long lifetime and high safety. In commercial ZEBRA batteries, Ni electrode and beta’’-alumina solid electrolyte (BASE) have a > 70% share of the cell material costs. Na-ZnCl2 all liquid batteries (ALBs), which replace Ni with abundant and low-cost Zn and BASE electrolyte with molten salt electrolyte, could have lower costs, longer lifetime and higher safety, are therefore promising as grid storage. However, compared to SEBs, ALBs are in an early development stage, particularly on their molten salt electrolytes, which have significant effect on the battery performance. The physical and chemical properties of the salt electrolyte like melting temperatures and solubilities of electrode materials (i.e., Na and Zn metal) are vital for the molten salt electrolyte selection, battery cell design and optimization. In this work, the binary and ternary phase diagrams of salt mixtures containing NaCl, CaCl2, BaCl2, SrCl2, KCl, obtained via FactSage simulation and DSC measurements and the solubilities of electrode materials are presented and used for the selection of the molten salt electrolyte. There are multiple criteria for the selection of the molten salt electrolyte, including high electromotive force (EMF) for suitable electrochemical properties, low melting temperature for large charge/discharge range, low solubilities of electrode materials for low self-discharge, low material costs and high material abundance for easy scale-up. According to these criteria, the NaCl-CaCl2-BaCl2 and NaCl-SrCl2-KCl salt mixtures are selected as the two most promising ALB molten salt electrolytes, which are suggested to be tested in the ALB demonstrators under development.
Keywords:
Differential scanning calorimetry (DSC)
; FactSageTM thermodynamic simulation
; Phase diagram
; Solubilities of electrodes
; Zeolite Battery Research Africa (ZEBRA) battery
1. Introduction
ZEBRA batteries (Na-NiCl2 solid electrolyte batteries, SEBs) have commercial applications in e.g., energy storage, energy back up and transportation [1], due to their low costs and recyclability, long lifetime and high safety [2]. In commercial ZEBRA batteries, Ni electrode and beta’’-alumina solid electrolyte (BASE) have a > 70% share of the cell material costs [3]. By using abundant and low-cost Zn to replace Ni, the next-generation ZEBRA (Na-ZnCl2 SEB) battery could have much lower costs [4]. Na-ZnCl2 all liquid batteries (ALBs) replace (in addition to Zn replacement) the BASE electrolyte of the Na-ZnCl2 SEB with a molten salt electrolyte for even lower costs, longer lifetime and higher safety [5]. Compared to the commercial ZEBRA cells (operating at around 300°C), the Na-ZnCl2 ALB cells do not use a BASE primary electrolyte to reduce cell costs and make the scale-up easier [5,6]. It has a higher operating temperature of around 600°C to operate in all liquid state for better performance, e.g., to increase the possibility of charging and discharging at high current density [5,6].
In the commercial ZEBRA battery with a BASE primary electrolyte, AlCl3-NaCl-NiCl2 is used as molten salt electrolyte, which consists of a secondary electrolyte (NaAlCl4) with the melting temperature of about 150°C and partly active electrode components (NaCl and NiCl2) [3]. In our previous work an adapted ZEBRA battery (called here next-gen ZEBRA) has been intensively studied. The difference of the next-gen ZEBRA compared to ZEBRA is that Zn replaces Ni, which has the electrochemical reaction of ZnCl2 + Na ↔ 2NaCl + Zn (about 2 V at around 300°C) during charging/discharging [7,8]. Sieuw, et al. (2024) investigated the influence of precursor morphology and Zn cathode processing on performance and cycle life of the next-gen ZEBRA cell at 300°C [7]. Moreover, the dis-/charge cycling performance of Na-ZnCl2 cells was correlated with the ternary ZnCl2-NaCl-AlCl3 phase diagram, and mass transport through the secondary NaAlCl4 electrolyte was identified as an important contribution to the cell resistance [7]. These insights enable the optimization of the design of the battery cell, e.g., to have tailored cathode microstructures. Kumar, et al. (2023) studied the AlCl3-NaCl-ZnCl2 salt electrolyte of the next-gen ZEBRA (Na-ZnCl2) battery in depth [8]. Experimental and modeling methods were used to examine its binary and ternary phase diagrams and vapor pressures theoretically via FactSage simulation and experimentally via Differential Scanning Calorimetry (DSC) and a melting point apparatus (OptiMeltTM) [8]. These results have been successfully correlated with the cell performance and could be used in future cell improvement [7].
This simulation-assisted method based on thermodynamic simulation via FactSageTM and thermal analysis via DSC and OptiMeltTM has also been successfully applied for selection of a molten salt electrolyte for liquid metal batteries (LMBs) , which are another group of batteries using liquid metals and molten alts [9,10]. A low-melting-point NaCl-LiCl-KCl molten salt electrolyte was selected for a Na-based LMB (Na-LMB) based on the phase diagram and other experimental data [9]. The Na-LMB test cell with the selected molten salt electrolyte shows an energy efficiency of about 80% and a Coulombic efficiency of >97% [10]. Moreover, the Levelized Cost of Storage (LCOS) of the Na-LMB system with the selected NaCl-LiCl-KCl molten salt electrolyte was estimated to be 0.027~0.029 USD/kWh for scaled application conditions, based on a 1MW/5MWh demo energy storage plant made of 100 Ah cells [10].
Different from the ZEBRA battery, the AlCl3 salt cannot be used in the molten salt electrolyte of Na-ZnCl2 ALB, since it does not use a solid ceramic electrolyte to separate the Na electrode and molten salt electrolyte, and thus the molten salt electrolyte has a direct contact with the Na metal anode (see Figure 1 right). To avoid spontaneous reactions of the salt with Na which lead to co-reduction and safety issue, the chloride salts like CaCl2, BaCl2, KCl, SrCl2, LiCl, whose electromotive forces (EMFs) are higher than Na/NaCl [11] should be preferred. Moreover, another reason for not using AlCl3 is the safety issue caused by its very high vapor pressure (>>10 atm) at the operating temperature (around 600°C) of the ALB [8]. The above-mentioned chloride salts have low vapor pressures, and will therefore also be a preferred choice for the molten salt electrolyte for Na-ZnCl2 ALB. Moreover, to have a large operation range, the molten salt electrolyte needs to have a low melting temperature, since the formed NaCl during discharging increases the melting temperature of the salt mixture electrolyte fast. Xu, et al. (2016) [5] and Xu, et al. (2017) [6] used a eutectic NaCl-CaCl2 (50:50 mol%) electrolyte in their ALB cells (see Figure 1). CaCl2 has the EMF of 3.462 V, higher than but close to that of NaCl (3.424 V) [11]. The co-reduction of Ca in Na electrode was observed during charging [5,6,12]. This could lead to lower CaCl2 content in the molten salt electrolyte compared to the ideal charging (without co-reduction). The molten salt electrolyte with lower CaCl2 content than the eutectic mixture has an increased melting temperature, as shown in the NaCl-CaCl2 phase diagram [13]. The NaCl-CaCl2 (50:50 mol%) electrolyte used in the ALB cell of Xu, et al. (2016) [5] has a eutectic melting temperature of about 500°C [5,13]. The increased melting temperature could have significantly negative effects on the battery performance, e.g., a reduced charge/discharge range. The cell testing shows that the discharge flat voltage of the ALB cell at 560°C is in the range of about 1.4 V to 1.8 V, and the cycle coulombic efficiency achieved is about 90% at low discharge current densities (below 40 mA/cm2) [5]. In the ALB cell as shown in Figure 1, a porous ceramic diaphragm (blue line in Figure 1) is used to separate the molten salt electrolyte into two compartments and thus slow the Zn2+ transport down from bottom to top in order to reduce the self-discharge rate. The self-discharge of this ALB is mainly caused by reaction of Zn2+ with Na metal [5,6]. Thus, the solubility of Na metal in the molten salt electrolyte has a significant the effect on self-discharge. Although using the diaphragm, the self-discharge rate is still high. The open circuit voltage is about 1.83 V in the fully charged state. After leaving the cell at open circuit for 9 h, the open circuit voltage value drops to 1.69 V, while it decreases to 1.6 V after 10 h [5]. This means the charged cell is almost fully discharged after 10 h due to self-discharge. Overall, the molten salt electrolyte is a key part of the ALB and could significantly affect its storage performance, operation safety and economics. Besides some references on ALB with a NaCl-CaCl2 molten salt electrolyte, to our best knowledge, an in-depth study on the molten salt electrolyte for ALB has not been done and there is no available literature showing the methods and results on such molten salt ALB electrolyte selection.
To improve the cell design and fabrication of the Na-ZnCl2 ALB, recently some techniques like neutron imaging [14] and cell modeling [15] were developed and used. Sarma et al. (2024) [14] used in situ dynamic neutron radiography to develop a reusable, hermetically sealed, high temperature and sufficiently corrosion resistant cell, in order to enable long-term cycling of the Na-Zn battery in a realistic environment. The design as well as various approaches for assembling and filling the cell were also presented in their study [14]. Godinez-Brizuela et al. (2023) [15] developed a continuous multiphase model for liquid metal - molten salt batteries including LMBs and the ALB batteries studies in this work. It used the Na-ZnCl2 ALB with the NaCl-CaCl2 electrolyte as the model system. The simulation model can simulate the changes in electrode and electrolyte volume during charging and discharging, and resolve the spatial variations in the chemistry of the electrolyte that accompany the interfacial reactions. It was found that volume change and species redistribution were important in predicting the maximum theoretical capacity of the cell when neglecting other transport mechanisms. Weber et al. (2024) performed a risk assessment for the Na-ZnCl2 ALB according to ISO 12100 to minimize the risks involved in the battery fabrication and operation [16]. Hazard identification and risk evaluation were systematically addressed, including a thorough literature review, theoretical calculations and selected experiments. Cell overpressure was found to be one of the main risks. Overpressure might be caused either by mistakes in battery production (humidity) or operation (over-charge/discharge). In terms of cell housing, the feedthrough was identified as the weakest component. Its failure might lead to the release of hazardous aerosols to the environment. In this context, the candidate electrolyte components LiCl and BaCl2 were identified as dangerous salt components [16].
In this work, the promising molten salt electrolytes for the Na-ZnCl2 ALB cell containing NaCl, CaCl2, BaCl2, SrCl2 and/or KCl are selected based on the data such as EMFs of single salts, phase diagrams of salt mixtures and material costs, which are available in literature or obtained from simulation and experiments in this work. Since LiCl has high material cost [17] and the ALB uses large amount of salt electrolyte, LiCl is not considered for the molten salt electrolyte here. In this work, the promising molten salt electrolytes mentioned above were in-depth investigated with thermodynamic simulation via FactSageTM and thermal analysis via DSC. Moreover, the solubilities of Na and Zn electrodes in the selected promising molten salt electrolytes were measured with an analysis method based on salt titrations. Overall, this paper presents these simulated and measured data of the key thermal properties of salt systems for Na-ZnCl2 ALBs. These properties can be also used for the battery design, optimization and operation. The presented simulation and experimental methods for molten salt electrolyte selection used in this work could also be implemented with other salt-based electrolyte batteries.
2. Materials and Methods
This section describes the methods used to select the promising molten salt electrolytes in ALB based on their various characteristics such as phase diagrams for battery improvement. Chloride salt mixtures are promising molten salt electrolytes for molten salt batteries due to their high thermal and electrochemical stabilities, and low costs [5,9,18]. As shown in Figure 1 left, NaCl in the molten salt electrolyte acts as a source of Na forming negative electrode during charging. However, NaCl has a melting temperature of > 800°C [17]. Adding other chloride salts, the melting temperature can be significantly reduced due to the eutectic effect, for example eutectic NaCl-MgCl2-KCl has a melting temperature of <400°C [17]. Thus, in this work NaCl was investigated in combination with other chloride salts with low costs and high EMFs (i.e., CaCl2, BaCl2, SrCl2 and KCl) in binary and ternary systems, in order to select promising molten salt electrolytes based on the key factors like melting temperature, elctctrode solubilities (self-discharge), material costs and EMFs (co-reduction issue of the Na electrode). In this work, it is assumed in the selection of molten salt electrolytes that the porous ceramic diaphragm in the ideal ALB cell (see Figure 2) can perfectly prevent the diffusion of Zn2+ from bottom to top, i.e., prevent the main self-discharge reaction at the interface of Na electrode with Zn2+ in the salt as shown in Figure 1 left. Moreover, in charge/discharge of the ALB cell, the molten salt electolyte above the diaphragm has a higher melting temperature than that below the diaphragm, due to higher content of NaCl and lower contect of ZnCl2. Thus for simplicity, the molten salt electolyte selection in this work is based on the molten salt electolyte above the diaphragm of the ideal ALB cell, which does not contain ZnCl2.
In this work, firstly, the simulations via FactSage were performed to obtain the information like melting temperature (phase diagrams) and melting behavior for selection of the promising molten salt electrolytes. Secondly, the selected salt mixtures were prepared in moisture-free inert environment inside a glovebox and used in DSC experiments to evaluate the FactSage simulation results. After that, the experiments of the solubilities of the electrode materials (i.e., Na and Zn) in the selected salt mixtures were performed in an oven inside the glovebox. The metal solubilities were measured with a titration method developed by our DLR group previously [9].
2.1. FactSageTM Thermodynamic Simulation
FactSage® is a thermochemical database system with the modules of information, database, calculation and manipulation [19]. Based on the minimum Gibbs free energy and CalPhaD (Calculation of Phase Diagrams), the calculation modules contain the main function modules of FactSage, including Reaction, Predom, EpH, Equilib, Phase Diagram, and Optisage. FactSage gives access to databases of thermodynamic data for thousands of compounds as well as to evaluated and optimized databases for hundreds of liquid and solid metals, liquid and solid oxides, molten and solid salts, aqueous solutions [19].
This work utilizes Version 8.1 of FactSage. The Phase Diagram module and the database FTsalt were used to obtain the phase diagrams of selected binary/ternary salts of NaCl, CaCl2, BaCl2, SrCl2 and KCl. Moreover, the Equilib module was selected to plot ΔCp (J/K/mol) vs T (°C). The plots were compared with the DSC experiments performed to confirm the melting temperature and melting behavior.
2.2. Sample Preparation for DSC and Solubility Analysis
For Differential Scanning Calorimetry (DSC), anhydrous salts with a purity of 99.99% were used to prepare the salt mixtures. Due to the hygroscopicity of chloride salts (particularly CaCl2, BaCl2, SrCl2), the storage, weighing, mixing and sample preparation of the salts were carried out in a glovebox (GS Glovebox System Technik GmbH, Glovebox Mega 2, O2 < 0.5 ppm, H2O < 1 ppm) swept with ultra-high-purity argon gas (Ar 5.0, purity > 99.999%). All salt mixtures (~1 g) for thermal analysis were grinded in a ceramic mortar for at least 30 minutes by hand, so that they were mixed well with acceptable small salt particle size for thermal analysis with DSC.
For solubility analysis of Na and Zn electrode metals in the molten salts, anhydrous salts with a purity of 99% were used to prepare the salt mixtures. Same as the salt mixture samples for DSC, their storage, weighing, mixing and sample preparation were carried out in the glovebox swept with ultra-high-purity argon gas. Moreover, the Na and Zn metals with a purity of 99% were used in the measurements.
2.3. Differential Scanning Calorimetry (DSC) for Thermal Analysis
DSC is a powerful thermo-analytical technique to measure the melting temperature and phase change enthalpy of the tested sample such as a salt [20]. Normally in a DSC measurement the temperature of the sample is increased linearly and compared to a empty reference crucible (see Figure 3b). A sample of known mass (e.g. about 20 mg salt mixture in this work) is placed in a sample crucible and then heated and cooled at a constant rate (e.g. 10 K/min) under the sweeping of Ar 5.0 at 100 mL/min. The behavior of the heat flow inside the sample can reveal the thermal information about the melt, for example, glass transitions, phase changes, curing and melting. This method has been successfully used by many research groups including our group to measure e.g., the melting temperatures of the salt mixtures for thermal energy storage [21] or as of salt electrolytes in molten salt batteries like liquid metal batteries [9,10] and metal-chloride batteries [8].
A high Temperature DSC 404® (Netzsch) oven (see Figure 3a) was used to study the melting process of the selected salts. The holder inside the oven with two slots for the placement of crucibles is shown in Figure 3b. In this work, gold-plated stainless steel (SS) and Ni-based 2.4816 alloy crucibles from Netzsch were used in closed state with a maximum operation temperature of about 600°C (gold-platted stainless steel) and 650°C (Ni-based). Such high temperatures are required for this work since the salt electrolyte should be liquid at the ALB working temperature of around 600°C. Before testing the desired samples by DSC, a temperature calibration was carried out to ensure accurate readings of the instrument. Standard reference materials with known melting points were used to perform temperature calibration. Additionally, several baseline measurements were carried out before each sample measurement to ensure that the DSC instrument records a stable and accurate baseline. This involves running an empty pan with a reference pan so that it records a flat or near-zero heat flow signal. Inside the glovebox, a tool kit was used to seal the crucibles tightly (with or without salt sample). Subsequently, the crucibles were washed to rinse off any salt contaminants from the outer surface and dried before placing it in the DSC device. In every DSC measurement, 3-4 cycles were repeated for every salt sample in this work to get reliable results.
2.4. Solubility Measurement and Salt-Metal Post-Analysis
To measure the solubilities of Na and Zn electrode metals in the selected molten salt electrolytes (NaCl-CaCl2-BaCl2 37-45-18 mol%, NaCl-SrCl2-KCl 30.0-26.5-43.5 mol%), the electrode metal was in direct contact with the electrolyte at the ALB’s operating temperature (600°C) and the solubility was measured versus the time of contact until saturation was reached. The tests were performed in an Ar inert environment (H2O and O2 < 1 ppm) inside the glovebox, due to the salt mixture’s strong hygroscopicity. As shown in Figure 4, a specialized set-up (named HaloBat) was prepared for the tests. This experimental set-up consists of 1) an oven, 2) a stainless steel (SS) crucible containing the molten salt, and 3) a thermocouple to control the salt temperature with a temperature regulator. A quartz sampler as shown in Figure 4 (right) was used to collect salt samples. The amount of dissolved electrode metal in the electrolyte salt mixture was then analysed with titration by a commercial automatic titrator (Titrando, Metrohm, Germany).
2.4.1. Na Solubility Measurement
The Na solubilities of two selected molten salt electrolytes (NaCl-CaCl2-BaCl2 37-45-18 mol%, NaCl-SrCl2-KCl 30.0-26.5-43.5 mol%) at 600°C were studied. Anhydrous salts with a purity of 99% were used for mixture preparation in the glovebox. The mole percent mixture ratio was converted to weight percent and the balance was used to prepare 60 g of the required salt mixture inside the glovebox. The salt mixture was put into the SS crucible and heated to 600°C by the HaloBat. As shown in Figure 4, about 1 g Na metal was weighted and put into the inner steel tube, after the salt mixture in the SS crucible was completely molten. The added Na metal was melted immediately and floated on the molten salt due to its lower density. After adding the Na metal, salt samples (of 2-4 g) were taken after every half to one hour to determine the change of the concentration of dissolved Na, which were measured with direct titration by the automatic titrator Titrando. The Na concentration steadily increases with time until a constant value (i.e., the solubility) is obtained for the point with maximum amount of Na that can be dissolved in the salt.
For titration, the salt sample (1-2 g) was put in a sample beaker filled with 160 ml demineralized water. Afterwards, the beaker was attached to the automatic titrator and the impeller was used for completely dissolving the salt in the water to prepare the titration solution. During salt dissolution, all Na metal dissolved in the salt sample reacted with water to form sodium hydroxide according to the reaction 2Na + 2H2O → 2NaOH + H2. The solution was directly titrated against hydrochloric acid (HCl 0.01M) to get the equivalence point. Titration was automated by adjusting the dosing rate. At the equivalence point, the consumed volume of HCl (VHCl) was recorded. The consumed HCl is equal to the molar amount of the NaOH in the titration solution, i.e., dissolved Na in the salt sample, according to the reaction NaOH + HCl → NaCl + H2O. Thus, VHCl was used to calculate the concentration of dissolved Na with the following equation:
where CNa represents the concentration of dissolved Na (mol%);
VHCl is the consumed volume of HCl in L;
nsalt is the amount of the salt sample in mol.
The titration measurements on each salt sample were done twice to ensure the accuracy of the result and get the average values and measurement error bars.
2.4.2. Zn Solubility Measurement
The Zn solubilities of two selected molten salt electrolytes (NaCl-CaCl2-BaCl2 37-45-18 mol%, NaCl-SrCl2-KCl 30.0-26.5-43.5 mol%) at 600°C were also studied. As for the Na solubility measurements, 60 g of the prepared salt mixture was put into the SS crucible and heated to 600°C by the HaloBat set-up. Different to the Na solubility measurements with the inner steel tube containing the floating Na, an alumina crucible was used to contain about 1 g Zn metal (see Figure 5), since liquid Zn has a higher density than the molten salt, and good material compatibility with alumina (but not with SS). The alumina crucible with Zn was completely immersed in the molten salt after the salt is completely molten, so that the Zn metal was indirect contact with the molten salt. After that, salt samples (2-4 g) were taken after every half to one hour to determine the concentrations of dissolved Zn by back titration.
For titration, the salt sample (1-2 g) was put in the sample beaker with 160 ml demineralized water and 5 ml 0.1M HCl solution. The beaker was then attached to the automatic titrator and the impeller was used for completely dissolving the salt in the water to prepare the titration solution. During the salt dissolution, all Zn metal dissolved in the salt sample reacted with HCl to form ZnCl2 according to the reaction Zn + 2HCl → ZnCl2 + H2O. The solution with excess HCl was back titrated with 0.1M NaOH to get the equivalence point. Titration was automated by adjusting the dosing rate. At the equivalence point, the consumed volume of NaOH (VNaOH) was recorded. The molar amount of dissolved Zn (nZn in mol) can be calculated with the following equation:
After that, nZn in mol was used to calculate the concentration of dissolved Zn with the following equation:
where CZn represents the concentration of dissolved Zn (mol%).
As for the Na samples, the titration Zn measurements of each salt sample were done twice to ensure the accuracy of the result and to get the average values and measurement error bars.
3. Results and Discussion
3.1. FactSage Simulation
3.1.1. Binary Phase Diagrams
Figure 6 presents the binary system phase diagrams of NaCl with CaCl2, BaCl2, SrCl2, and KCl, which are simulated by FactSage. The phase diagrams show that the eutectic melting temperature of NaCl-CaCl2, NaCl-BaCl2, NaCl-SrCl2 and NaCl-KCl is about 506°C, 650°C, 560°C and 660°C, respectively. The eutectic melting temperatures and salt compositions are summarized in Table 1. These simulated melting temperatures and melting behaviors (see e.g., plot of Cp vs. T in Figure 7 bottom for eutectic NaCl–CaCl2) agree well with literature such as [22,23,24,25]. Comparison with own DSC measurement result on eutectic NaCl–CaCl2 in Figure 7 (measured melting temperature of 502°C for the eutectic NaCl–CaCl2 48-52 mol%) also shows good agreement. Compared to BaCl2 and KCl, the eutectic binary mixtures with CaCl2 and SrCl2 have much lower eutectic melting temperatures (below 600°C). Thus, in this work CaCl2 and SrCl2 are selected as the primary additive for NaCl to have a low melting temperature of the salt mixture as the ALB molten salt electrolyte. Since CaCl2 could have a co-reduction issue and SrCl2 could have the cost issue, BaCl2 and KCl could be the third salt mixed to further reduce the melting temperature and/or material costs. The ternary phase diagrams studied will be presented in Section 3.1.2.
3.1.2. Ternary Phase Diagrams
For the selected salts CaCl2, BaCl2, SrCl2, and KCl, all phase diagrams of the ternary salt systems with NaCl were also simulated with FactSage in this work. These five ternary systems (NaCl-CaCl2-BaCl2, NaCl-CaCl2-SrCl2, NaCl-CaCl2-KCl, NaCl-SrCl2-BaCl2, NaCl-SrCl2-KCl) were selected for further investigation, whereas NaCl-BaCl2-KCl was not selected because of the high minimum melting temperatures of the NaCl-BaCl2 and NaCl-KCl systems (see Subsection 3.1.1). NaCl is the necessary salt as the active electrode component, CaCl2 and SrCl2 are the primary additives and BaCl2 and KCl are the secondary additives to lower the melting temperature. All the simulated ternary phase diagrams are shown in Figure 8. In the phase diagrams, the yellow areas in the phase diagrams represent the salt compositions with melting temperature ≤600°C. The dark red line shows the salt composition change of the selected molten salt electrolyte for each studied ternary salt system during charging/discharging under assumption of no co-reduction of the Na electrode. These molten salt electrolytes were selected according to the largest potential allowed change of the NaCl mol% (i.e., largest potential charge/discharge range of the ALB cell) when they should be kept in all liquid state at the representative ALB operating temperaure of 600°C. The maximum and minimum allowed concentration of NaCl for Tm≤600°C (i.e., largest potential charge/discharge range of the ALB cell) are pointed with red and blue solid circles in the phase diagrams.
After comparison of all the potential charge/discharge ranges, the NaCl-CaCl2-BaCl2 (53 mol% NaCl change allowed), NaCl-CaCl2-SrCl2 (56 mol% NaCl change allowed) and NaCl-SrCl2-KCl (47 mol% NaCl change allowed) are pre-selected as the promising molten salt electrolytes. For final selection, the comparison of EMFs (co-reduction issue) and material costs as well as the solubilities of Na and Zn electrodes will be done in the following subsections.
Moreover, it is found that the midpoints of all the dark red lines between red and blue solid circles are very close to the minimum (eutectic) salt compositions of these studied ternary salt systems (pointed with datted red circles). All the minimum (eutectic) melting temperatures and corresponding salt compositions are summarized inTable 2. Since the molten salt electrolyte changes its composition in charge/discharge according to the dark red line in theory, for simplicity the minimum (eutectic) salt compositions were used in the study on the material costs as well as the solubilities of Na and Zn electrodes for the final selection of the molten salt electrolytes.
3.2. Comparison of EMFs (Co-Reduction) and Material Costs
As mentioned above, to avoid the reactions of the salt with Na, only the chloride salts, whose electromotive forces (EMFs) are higher than Na/NaCl, can be used in the molten salt electrolyte. Moreover, addition of more chloride salt with high EMFs in the molten salt electrolyte leads to less co-reduction during charging. One example of co-reduction is NaCl-CaCl2 (Ca2+ + 2e- → Ca), because Ca has the similar EMF as Na (see Table 3). Thus, the theoretical EMFs of the selected chloride salts available in literature [11] are compared. As shown in Table 3, the order of the theoretical EMF is BaCl2>KCl>SrCl2>CaCl2≈NaCl at 600°C, while that of the cost is SrCl2> BaCl2>KCl>CaCl2>>NaCl. Regarding the low material cost and large potential charge/discharge range, the pre-selected NaCl-CaCl2-BaCl2 salt mixture (eutectic salt mixture: 37.1-44.9-18.0 mol %, 0.32 USD/kg or 0.035 USD/mol) is the most promising ALB molten salt electrolyte (containing CaCl2) but has the issues of Ca co-reduction and salt composition change as mentioned above, while the NaCl-SrCl2-KCl salt mixture (eutectic salt mixture: 30.0-26.5-43.5 mol%, 0.61 USD/kg, or 0.056 USD/mol) could have much smaller co-reduction issue due to high EMFs of SrCl2 and KCl, and also large potential charge/discharge range (see its phase diagram inFigure 8) and not high material cost. Thus, these two ternary systems are selected finally for further study via DSC, melting behavior, and performance in test cells.
3.3. DSC Measurements and Simulated Cp vs. T
3.3.1. NaCl-CaCl2-BaCl2
The simulated melting temperature of the eutectic NaCl-CaCl2-BaCl2 (37.1-44.9-18.0 mol%) were verified with DSC measurement. The DSC curve in Figure 9 top shows that only one peak is observed when heating to above 600°C, which agrees well with the simulated Cp vs. T plot in Figure 9 bottom, while only a small secondary peak exists beside the main peak when cooling to room temperature. This means that the salt mixture is almost eutectic. The melting temperature of the salt mixture is 454°C (heating), which agrees with the simulated value of 446°C by FactSage in Figure 9 bottom. Such a low-melting-temperature and low-cost salt mixture (0.32 USD/kg) is promising as a molten salt electrolyte for ALB, and the NaCl-CaCl2-BaCl2 molten salt electrolyte is suggested to be used in the ALB test cell and the ALB demonstrators under development.
3.3.2. NaCl-SrCl2-KCl
The melting temperature and behavior of the simulated eutectic NaCl-SrCl2-KCl (30.0-26.5-43.5 mol%) were also verified with DSC measurement. The DSC curve in Figure 10 shows that only one peak (but not ideal) is observed when heating to above 600°C and also cooling to room temperature. During the cooling the melting peaks increase sharply and at varying temperatures which can be assigned to the subooling phenomenon. This means that the salt mixture is almost eutectic. The melting temperature of the salt mixture is 503-505°C (heating), which agrees well with the simulated value of 503°C shown in the ternary phase diagram (Table 2) and also the simulated Cp vs. T (not presented in this work). Such a low-melting-temperature salt mixture is promising as a molten salt electrolyte for ALB. Compared to NaCl-CaCl2-BaCl2, the NaCl-SrCl2-KCl molten salt electrolyte has less co-reduction issue due to high EMFs, and thus is also strongly suggested to be used in the ALB test cell and the ALB demonstrators under development.
3.4. Solubilities of Metal Electrodes in Selected Molten Salt Electrolytes
3.4.1. Na Solubilities
Figure 11 shows the concentrations of dissolved Na in selected NaCl-CaCl2-BaCl2 (37.1-44.9-18.0 mol%) molten salt electrolyte at 600°C with measurement error vs. time. In the first 5 hours, the concentration of dissolved Na has a fast increase with time. After 24 hours, the concentration of dissolved Na reaches the solubility limit in NaCl-CaCl2-BaCl2 (i.e., saturation concentration of dissolved Na). For all the measured concentrations, the measurement errors are smaller than 0.015 mol%, which is small compared to the concentrations of dissolved Na. The Na solubility in the selected NaCl-CaCl2-BaCl2 molten salt electrolyte at 600°C is around 1.2 mol%.
Figure 12 shows the change of the concentrations of dissolved Na in selected NaCl-SrCl2-KCl (30.0-26.5-43.5 mol%) molten salt electrolyte at 600°C with measurement error vs. time. In the first 2.5 hours, the concentration of dissolved Na increases fast to 0.15 mol%. After 18 hours, the concentration of dissolved Na reaches the saturation of about 0.22 mol%, i.e., the Na solubility in the selected NaCl-SrCl2-KCl molten salt electrolyte at 600°C is around 0.22 mol%, much lower than that in another selected NaCl-CaCl2-BaCl2 molten salt electrolyte.
To our knowledge, previous work on Na solubilities in NaCl, SrCl2 and KCl is generally limited. As shown in Table 4, the determined Na solubilities in the selected molten salt electrolytes are compared with the literature [9,18,26]. As mentioned in the review paper of MIT on liquid metal batteries [18], the Na solubility in molten NaCl is 2.1 mol% at 795°C. In our previous work, the Na solubility in LiCl-NaCl-KCl (59-5-36 mol%) is 0.09 and 0.15 mol % at 450°C and 560°C, respectively [9]. If the temperature is extended to 600°C using the activation energy of Na dissolution in this molten salt, the Na solubility in LiCl-NaCl-KCl (59-5-36 mol%) is 0.18 mol %. The Na solubility in eutectic NaCl-CaCl2 molten salt at 600°C is about 3.3 mol % [26]. In summary, Na has the similar high solubility in NaCl-CaCl2-BaCl2 (37.1-44.9-18.0 mol%) as the eutectic NaCl-CaCl2, and similar low solubility in NaCl-SrCl2-KCl (30.0-26.5-43.5 mol%) as e.g., LiCl-NaCl-KCl (59-5-36 mol%), at the studied operating temperature of ALB (600°C).
As conlcuded in literature [9,10,18], the self-discharge of the liquid metal - molten salt batteries is strongly related to the dissolution of metal electrodes (e.g.,Na) into the molten salt electrolytes (i.e., solubilities of metal electrodes in the molten salt electrolytes and dissolution/reaction kinetics). Regarding the high Na solubility in NaCl-CaCl2-BaCl2, which could enhance the self-discharge of the ALB, it is suggested to give special attention when using this molten salt electrolyte.
3.4.2. Zn Solubilities
Figure 13 shows the concentrations of dissolved Zn in the selected NaCl-CaCl2-BaCl2 (37.1-44.9-18.0 mol%) molten salt electrolyte at 600°C with measurement error vs. time. In the first hour, the concentration of dissolved Zn increases with time fast to 0.04 mol%. After that, the concentration of dissolved Zn reaches the solubility limit (i.e., saturation concentration of dissolved Zn). The measurement errors are about 0.01 mol%. The Zn solubility in the selected NaCl-CaCl2-BaCl2 molten salt electrolyte at 600°C is around 0.04 mol%.
Figure 14 shows the concentrations of dissolved Zn in selected NaCl-SrCl2-KCl (30.0-26.5-43.5 mol%) molten salt electrolyte at 600°C with measurement error vs. time. In the first hour, the concentration of dissolved Na increases to 0.05 mol%. After that, the concentration of dissolved Zn reaches saturation. Thus, the Na solubility in the selected NaCl-SrCl2-KCl molten salt electrolyte at 600°C is around 0.05 mol%, similar to that in the other selected NaCl-CaCl2-BaCl2 molten salt electrolyte.
The data of Zn solubilities in molten chlorides available in literature is very limited. Thus, the determined Zn solubilities in the two selected molten salt electrolytes are compared to the Zn and Mg solubilities in molten salts available in literature [18,27] (see Table 5). Corbett, et al. measured the solubilities of Zn metal in pure molten ZnCl2 and ZnI2, which is 0.61 and 0.87 mol % at 600°C, respectively [27]. Mentioned in the review paper on liquid metal batteries [18], the Mg solubility in molten MgCl2 is 0.20-1.2 mol% at 714-900°C (0.87 mol % at 800°C). If the temperature is extended to 600°C using the activation energy of Mg dissolution in this molten salt, the Mg solubility in molten MgCl2 is 0.07 mol %. Thus, it is concluded that the Zn solubilities in the selected molten salt electrolytes for ALB determined in this work are comparable with the Zn and Mg metal solubilities in chlorides limitedly available in literature.
Compared to the Na solubilities in the two selected molten salt electrolytes of ALB determined in this work, the Zn solubilities are smaller. This means that, compared to Na electrode, less attention issue may need to be paid to the Zn electrode for self-discharge due to its much lower solubility in the molten salt electrolyte.
4. Conclusions
In this work, the chlorides CaCl2, BaCl2, SrCl2 and KCl are selected together with NaCl to form a low melting temperature salt mixture as molten salt electrolyte for Na-ZnCl2 ALBs. The selection of the molten salt electrolyte is based on multiple criteria, including high electromotive force (EMF) for small co-reduction issue, low melting temperature for large charge/discharge range, low solubilities of Na and Zn electrodes for low self-discharge, low material costs and high material abundance for easy scale-up. The main conclusions and suggested future works are summarized as follow:
- Binary and ternary phase diagrams of these molten salt mixtures were simulated via FactSage and some of them were verified by DSC. Based on the melting temperatures obtained from the binary phase diagrams, CaCl2 and SrCl2 are selected as the primary additive for NaCl. CaCl2 could have a co-reduction issue of the Na electrode due to similar EMF as NaCl. SrCl2 is more expensive than other chlorides. BaCl2 and KCl are the third salt mixed to further reduce the co-reduction issue, melting temperature and/or material costs.
- Regarding the low material cost and melting temperature, the NaCl-CaCl2-BaCl2 (0.32 USD/kg) is one of the most promising ALB molten salt electrolyte but the co-reduction of Ca in the Na electrode could be an issue which should be examined in future work. The NaCl-SrCl2-KCl is expected to have the least co-reduction issue due to high EMFs. However, it has higher melting temperature and higher cost (0.61 USD/kg) due to the utilization of SrCl2. Thus, the eutectic mixtures of these two ternary systems were selected for further study via DSC and melting behavior.
- Melting temperatures and melting behaviors of eutectic NaCl-CaCl2-BaCl2 (eutectic 37.1-44.9-18.0 mol%, Teut=446°C) and NaCl-SrCl2-KCl (eutectic 30.0-26.5-43.5 mol%, Teut=503°C) were verified by DSC measurement and Cp vs. T simulation of FactSage. The measured melting temperatures agree with the simulated values well. This means that the simulated ternary phase diagram data have a good quality and FactSage could be used for further optimization of the molten salt electrolyte (e.g., optimized salt composition) and the overall cell designs.
- Na- and Zn solubilities in these two selected molten salt electrolytes (NaCl-CaCl2-BaCl2 37-45-18 mol%, NaCl-SrCl2-KCl 30.0-26.5-43.5 mol%) at 600°C were investigated with a home-made setup in the glovebox and an analysis method based on titration. To our best knowledge, these data are available in literature for the first time.
- The Na solubilities in the eutectic NaCl-CaCl2-BaCl2 and NaCl-SrCl2-KCl molten salt electrolyte at 600°C is 1.2 mol% and 0.22 mol%, respectively. Such high Na solubility in NaCl-CaCl2-BaCl2 can enhance the self-discharge of ALBs and it is suggested to pay special attention. For NaCl-SrCl2-KCl, the Na solubility is low.
- Zn solubilities in the eutectic NaCl-CaCl2-BaCl2 and NaCl-SrCl2-KCl molten salt electrolyte at 600°C is 0.04 mol% and 0.05 mol%, respectively. Compared to Na, Zn has much lower solubilities in the examined molten chlorides. Thus, the Zn solubility is likely not an important factor for self-discharge.
- More attention is suggested to be paid to the reaction of Na with ZnCl2 in the molten salt at the interface between Na metal and the molten salt electrolyte, which has been reported in literature [5] and can lead to fast self-discharge. It is suggested for future work to find the solutions to prevent fast self-discharge, e.g., finding and using a good-performance diaphragm.
- Overall, the NaCl-CaCl2-BaCl2 and NaCl-SrCl2-KCl salt mixtures are selected in this work and are considered the two most promising electrolytes for Na-ZnCl2 ALB. The NaCl-CaCl2-BaCl2 (eutectic 37.1-44.9-18.0 mol%) and NaCl-SrCl2-KCl (eutectic 30.0-26.5-43.5 mol%) molten salt electrolytes are suggested to be tested in the ALB demonstrators. Future work is suggested on optimization of the molten salt electrolyte by adding some NaCl in these two selected molten salt electrolytes for a larger operation range of the ALB cell based on the ternary phase diagrams obtained in this work and the cell tests.
Author Contributions
Conceptualization, W. Ding; methodology, W. Ding; validation, W. Ding, R. Hoffmann; investigation, W. Ding, R. Hoffmann; data curation, W. Ding; writing—original draft preparation, W. Ding; writing—review and editing, R. Hoffmann, O. S. Kjos, N. Weber, T. Weier, T. Bauer; supervision, W. Ding; project administration, W. Ding; funding acquisition, W. Ding, T. Bauer. All authors have read and agreed to the published version of the manuscript.
Data Availability Statement
Data is available on request.
Acknowledgments
This work is part of the ‘Solstice’ project which received funding from the European Union’s Horizon 2020 research and innovation programme under grant agreement No 963599. The author W. Ding thanks Akshata Barge (DLR) and Mohamed Farouk (DLR) for their work on experiments and simulations, Andrea Hanke (DLR) and Markus Braun (DLR) for their technical support on experiments, Camilla Sommerseth (SINTEF) and William Nash (HZDR) for discussion on molten salt electrolytes for the all-liquid batteries.
Conflicts of Interest
The authors declare no conflict of interest.
References
- Website of HORIEN (former FZSONICK). Available online: https://saltbattery.horien.com/company-profile/ (accessed on 11 December 2024).
- FZSONICK, Sodium Metal Chloride Battery System - Technical Overview. Available online: https://drive.google.com/file/d/1s4fwmsG_RT1mji_wQDWNyZIM05Rp090J/view (accessed on 11 December 2024).
- Galloway, R.C.; Dustmann, C.-H. ZEBRA battery – material cost, availability and recycling, MES-DEA GmbH, EVS 20, 2003.
- Lu, X.; et al. A novel low-cost sodium–zinc chloride battery. Energy Environ. Sci. 2013, 6, 1837–1843. [Google Scholar] [CrossRef]
- Xu, J.; et al. Na-Zn liquid metal battery. J. Power Sources 2016, 332, 274–280. [Google Scholar] [CrossRef]
- Xu, J.; et al. Electrode behaviors of Na-Zn liquid metal battery. J. Electrochem. Soc. 2017, 164, A2335–A2340. [Google Scholar] [CrossRef]
- Sieuw, L.; et al. Influence of precursor morphology and cathode processing on performance and cycle life of sodium-zinc chloride (Na-ZnCl2) battery cells. Energy Storage Mater. 2024, 64, 103077. [Google Scholar] [CrossRef]
- Kumar, S.; Ding, W.; et al. AlCl3-NaCl-ZnCl2 Secondary electrolyte in next-generation ZEBRA (Na-ZnCl2) battery. Batteries 2023, 9, 401. [Google Scholar] [CrossRef]
- Ding, W.; et al. Multicationic molten salt electrolyte of high-performance sodium liquid metal battery for grid storage. J. Power Sources 2023, 553, 232254. [Google Scholar] [CrossRef]
- Zhou, H.; et al. A sodium liquid metal battery based on the multi-cationic electrolyte for grid energy storage. Energy Storage Mater. 2022, 50, 572–579. [Google Scholar] [CrossRef]
- Hamer, W.J.; Malmberg, M.S.; Rubin, B. ; Theoretical electromotive forces for cells containing a single solid or molten chloride electrolyte. J. Electrochem. Soc. 1956, 103, 8. [Google Scholar] [CrossRef]
- Aurbach, D. Nonaqueous Electrochemistry, Marcel Dekker, New York, USA, 1999.
- Reis, B.H. PhD thesis: Development of a novel thermodynamic database for salt systems with potential as phase change materials, Brandenburg University of Technology, 2021. [CrossRef]
- Sarma, M.; et al. Reusable cell design for high-temperature (600 °C) liquid metal battery cycling. J. Electrochem. Soc. 2024, 171, 040531. [Google Scholar] [CrossRef]
- Godinez-Brizuela, O.E.; et al. A continuous multiphase model for liquid metal batteries. J. Energy Storage 2023, 73, 109147. [Google Scholar] [CrossRef]
- Weber, N.; et al. Risk assessment for Na-Zn liquid metal batteries. Open Research Europe 2024, 4, 236. [Google Scholar] [CrossRef]
- Ding, W.; Bonk, A.; Bauer, T. Molten chloride salts for next generation CSP plants: Selection of promising chloride salts & study on corrosion of alloys in molten chloride salts. AIP Conference Proceedings 2019, 2126, 200014. [Google Scholar]
- Kim, H.; et al. Liquid metal batteries: Past, present, and future. Chem Rev. 2013, 113, 2075–2099. [Google Scholar] [CrossRef] [PubMed]
- Bale, C.W.; et al. FactSage thermochemical software and databases — recent developments. Calphad 2009, 33, 295–311. [Google Scholar] [CrossRef]
- Höhne, G.W.H.; Hemminger, W.F.; Flammersheim, H.-J. Book: Differential scanning calorimetry, Springer, 2013.
- Villada, C.; et al. Simulation-assisted determination of the minimum melting temperature composition of MgCl2–KCl–NaCl salt mixture for next-generation molten salt thermal energy storage. Front. Energy Res. 2022, 10, 809663. [Google Scholar] [CrossRef]
- Igarashi, K.; Ohtani, H.; Mochinaga, J. Phase diagram of the system LaCl3-CaCl2-NaCl. Zeitschrift für Naturforschung.
- Janz, G.J.; Allen, C.B.; Bansal, N.P.; Murphy, R.M.; Tomkins, R.P.T. Physical properties data compilations relevant to energy storage. II. Molten salts: Data on single and multi-component systems; Publisher: U.S. Government Printing Office, 1979. [Google Scholar]
- Janz, G.J.; Tomkins, R.P.T. Physical properties data compilations relevant to energy storage. IV. Molten salts: Data on additional single and multi-component salt systems; Publisher: U.S. Government Printing Office, 1981. [Google Scholar]
- Qiao, Z.; Mo, W.; Wu, S.; Zhu, Y.; Hillert, M. Measurement and calculation of the phase diagram of the NaCl CaCl2 SrCl2 system. Calphad 1985, 9, 143–151. [Google Scholar] [CrossRef]
- Haarberg, G.M.; Thonstad, J. Electrochemical properties of metal-molten salt mixtures. J. Appl. Electrochem. 1989, 19, 789–801. [Google Scholar] [CrossRef]
- Corbett, J.D.; von Winbush, S.; Albers, F.C. The solubility of the post-transition metals in their molten halides. JACS 1957, 79, 3020–3024. [Google Scholar] [CrossRef]
Figure 1.
Schematics of a Na-ZnCl2 ALB cell with a NaCl-CaCl2 molten salt electrolyte at a fully charged state (left) [5] and a fully discharged state (right) with a porous ceramic diaphragm (blue line). It has the electrochemical reaction of ZnCl2 + Na (charged) ↔ 2NaCl + Zn (discharged) during charging/discharging.
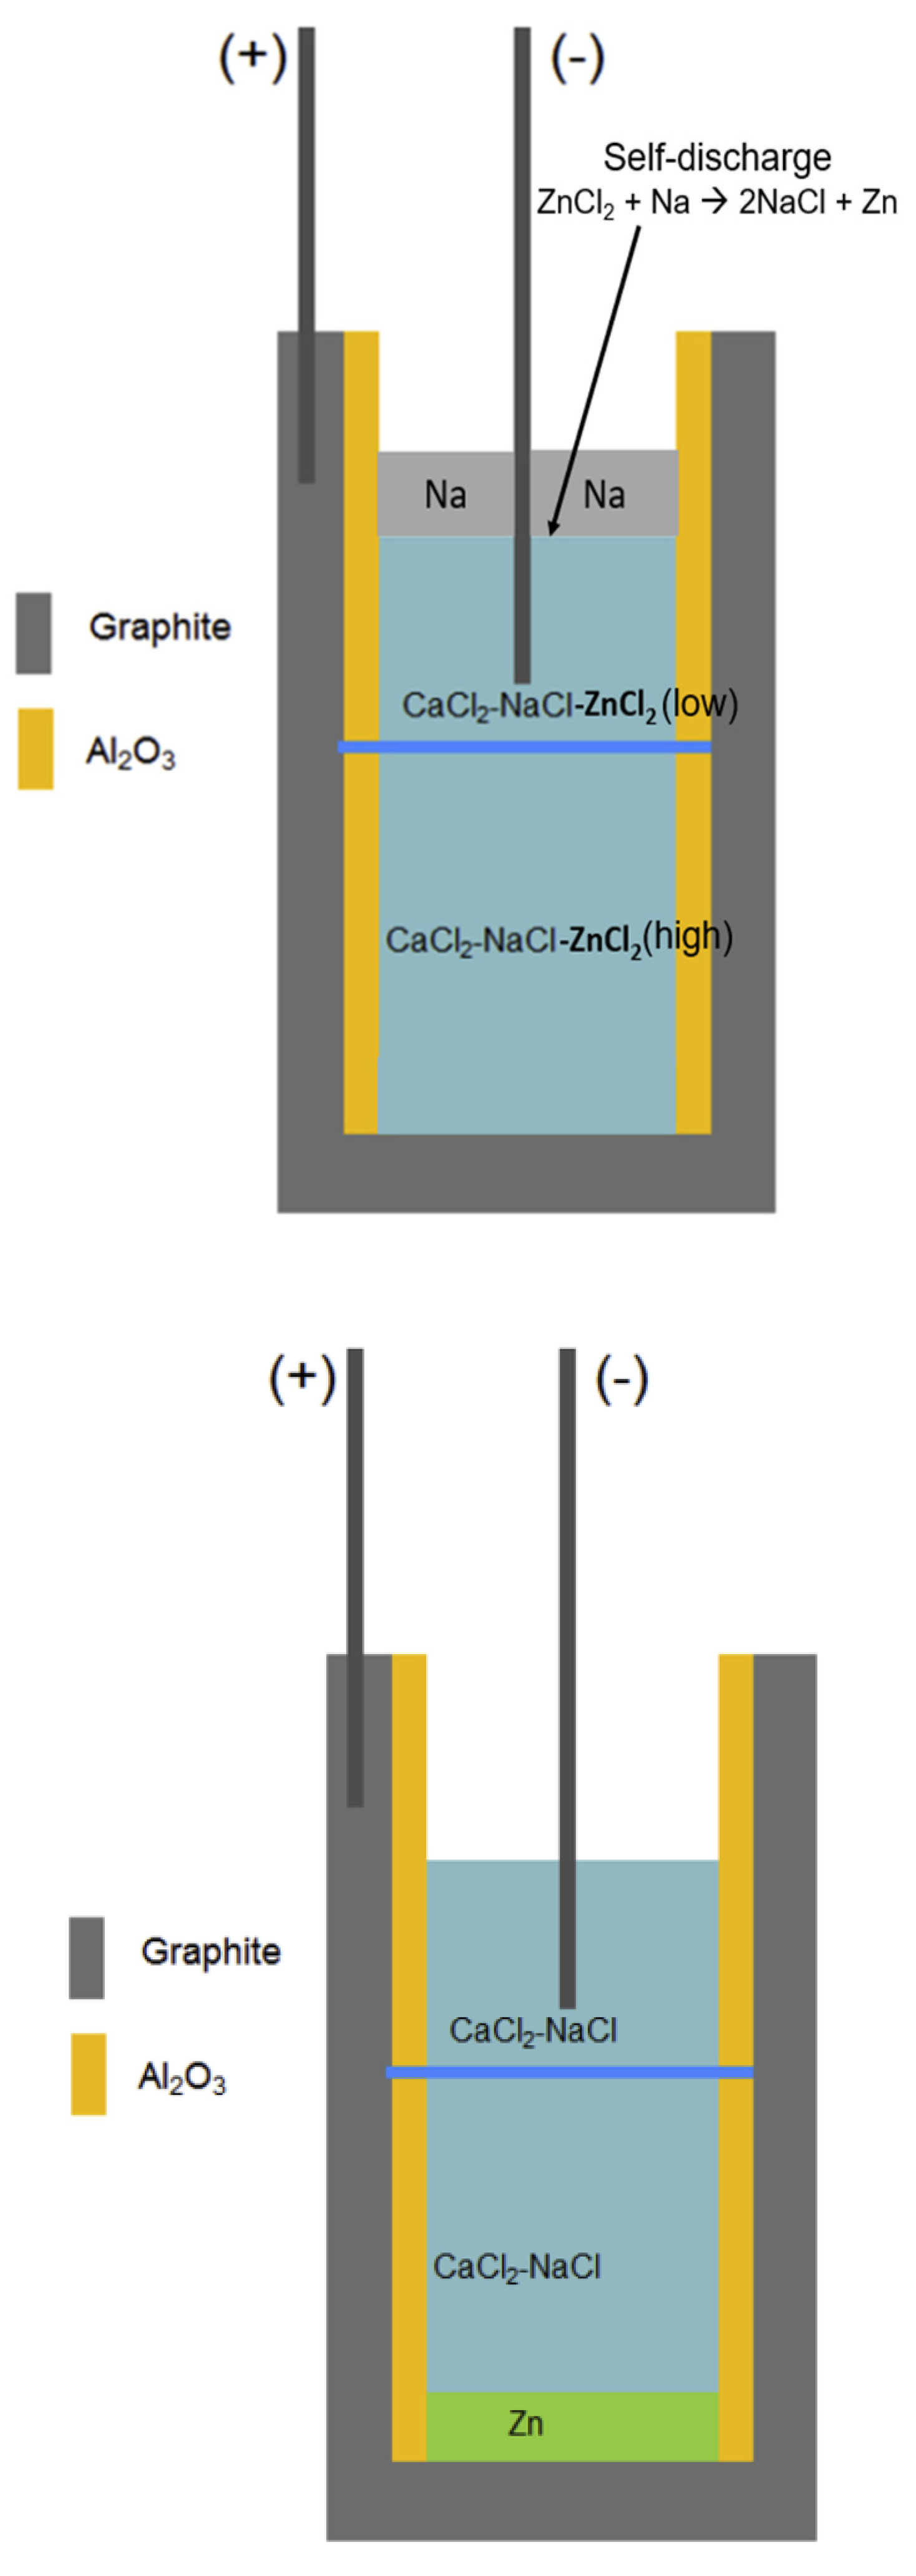
Figure 2.
Schematics of an ideal Na-ZnCl2 ALB cell with a NaCl-CaCl2 molten salt electrolyte and an ideal porous ceramic diaphragm (blue line), which can completely prevent the diffusion of Zn2+ from bottom to top (i.e., self-discharge).
Figure 2.
Schematics of an ideal Na-ZnCl2 ALB cell with a NaCl-CaCl2 molten salt electrolyte and an ideal porous ceramic diaphragm (blue line), which can completely prevent the diffusion of Zn2+ from bottom to top (i.e., self-discharge).
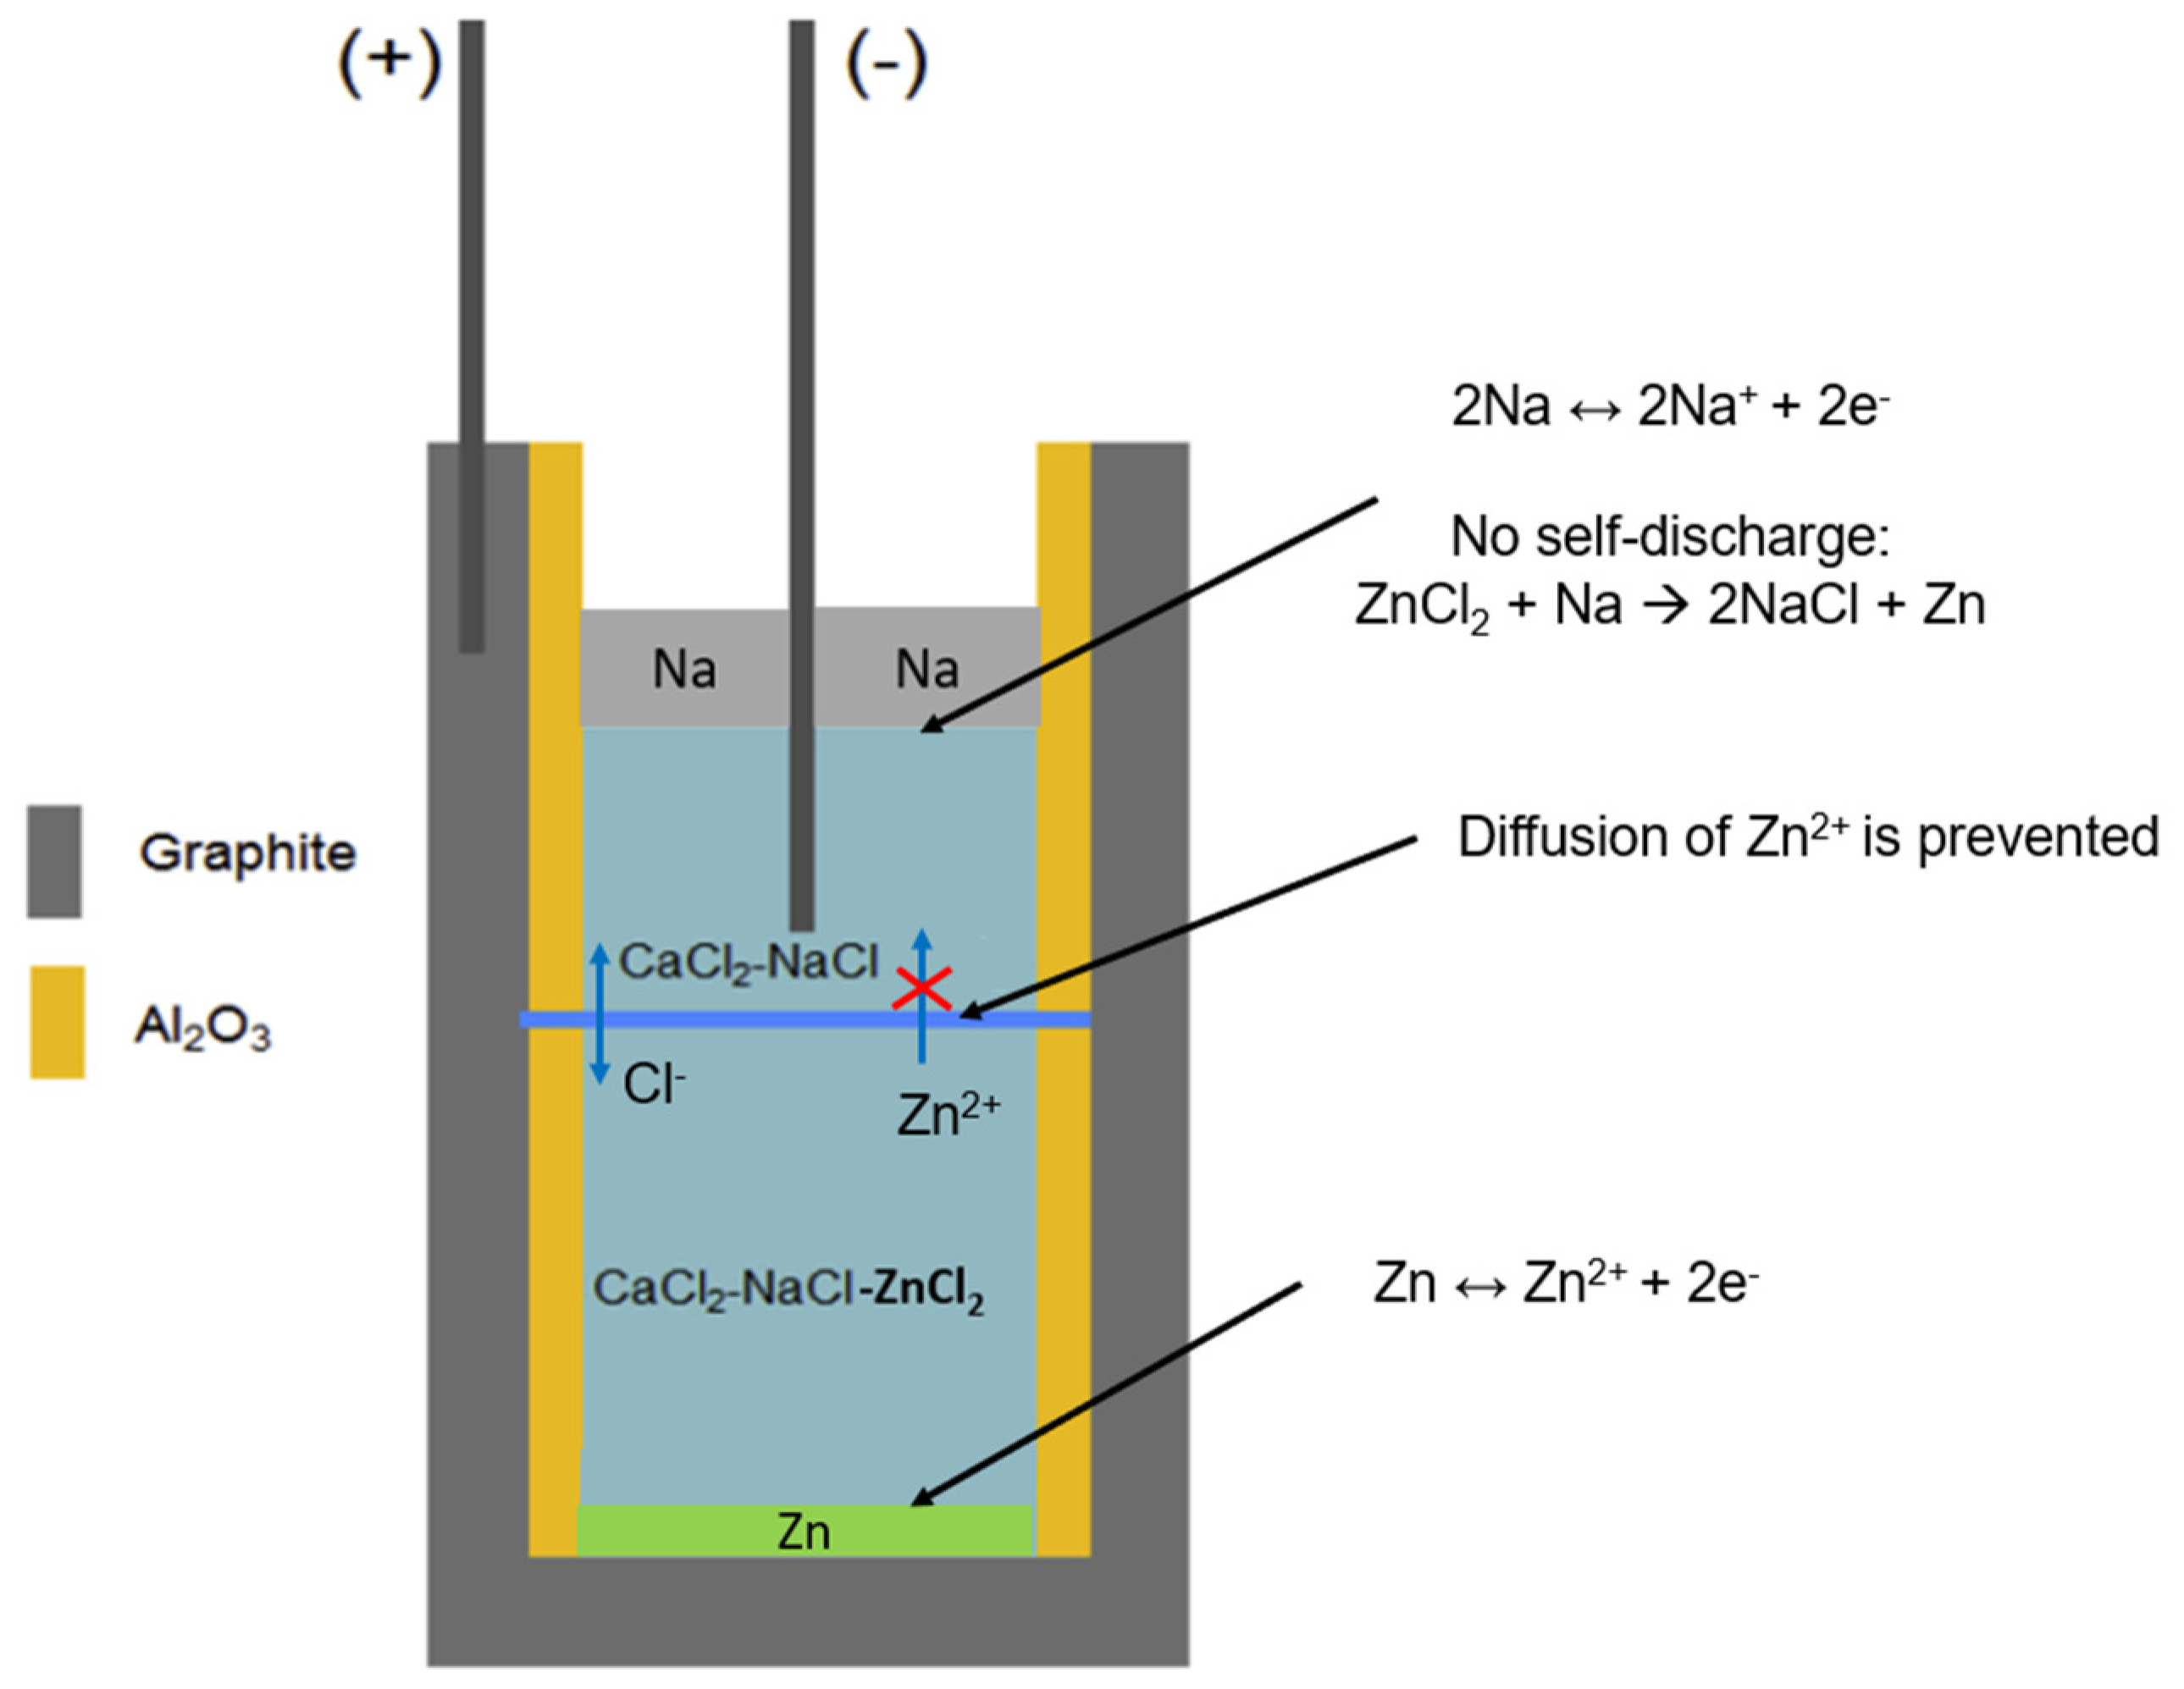
Figure 3.
(a) Netzsch DSC 404® for DSC measurements, (b) Ni-based alloy salt and reference crucibles on crucible holder of DSC.
Figure 3.
(a) Netzsch DSC 404® for DSC measurements, (b) Ni-based alloy salt and reference crucibles on crucible holder of DSC.
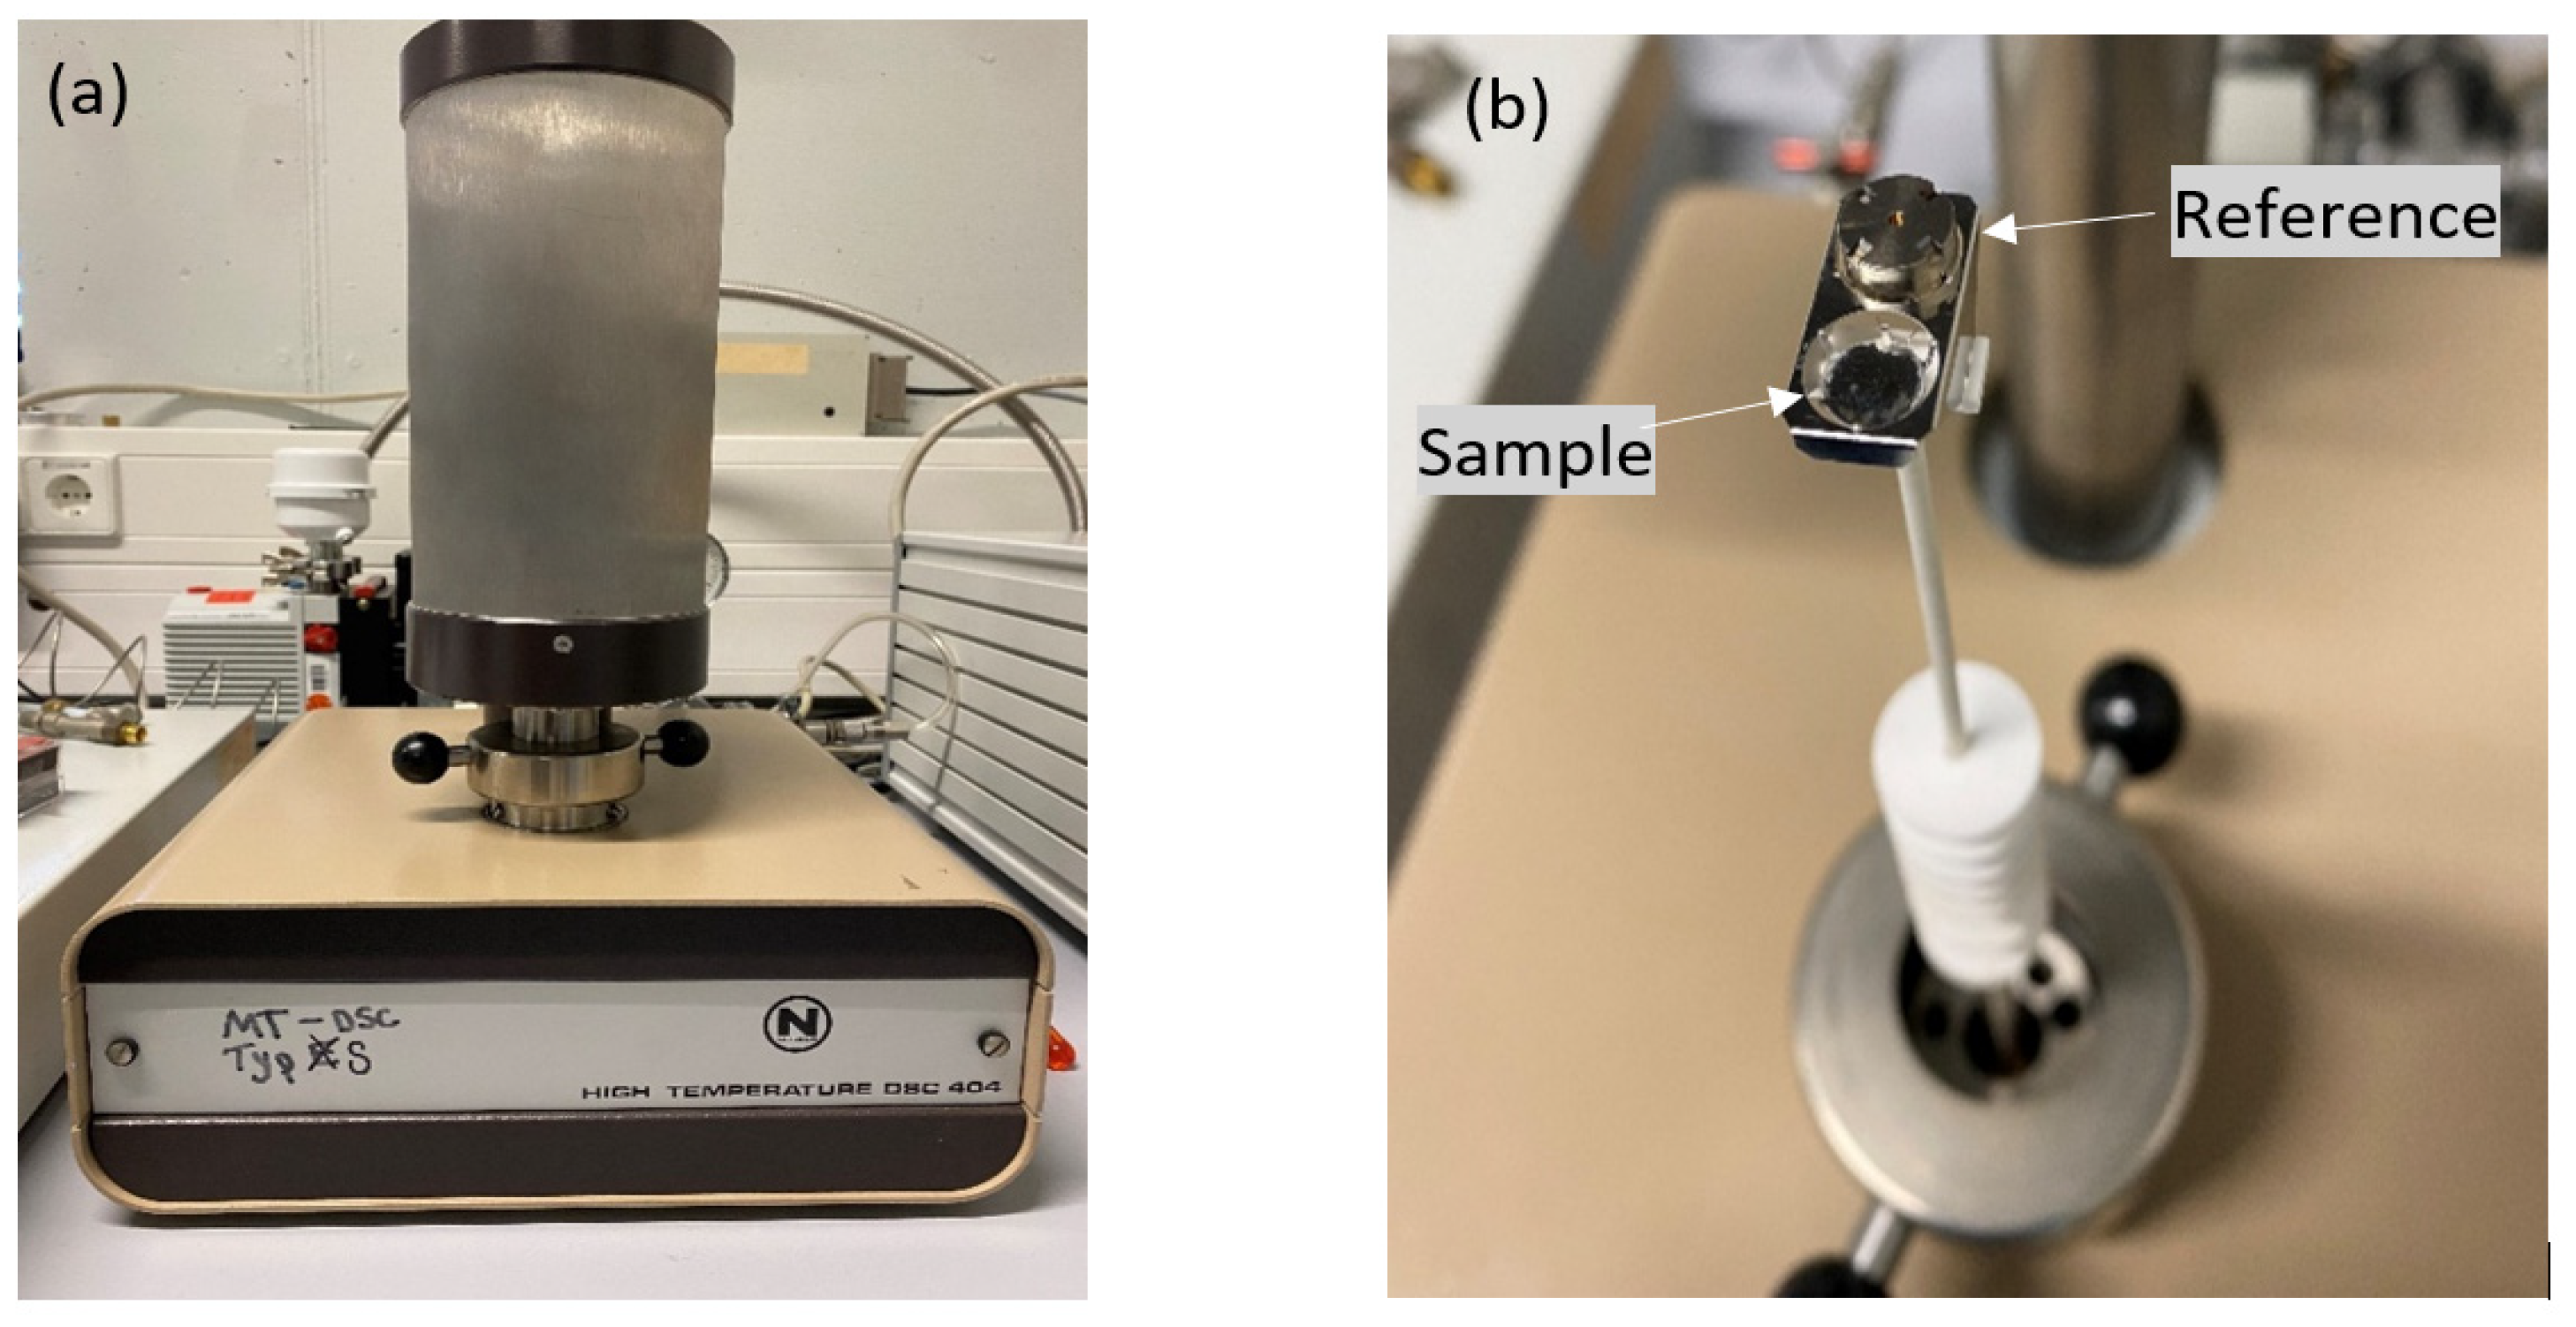
Figure 4.
Schematic of set-up with a Na metal holder (i.e., inner steel tube) for Na solubility measurements.
Figure 4.
Schematic of set-up with a Na metal holder (i.e., inner steel tube) for Na solubility measurements.
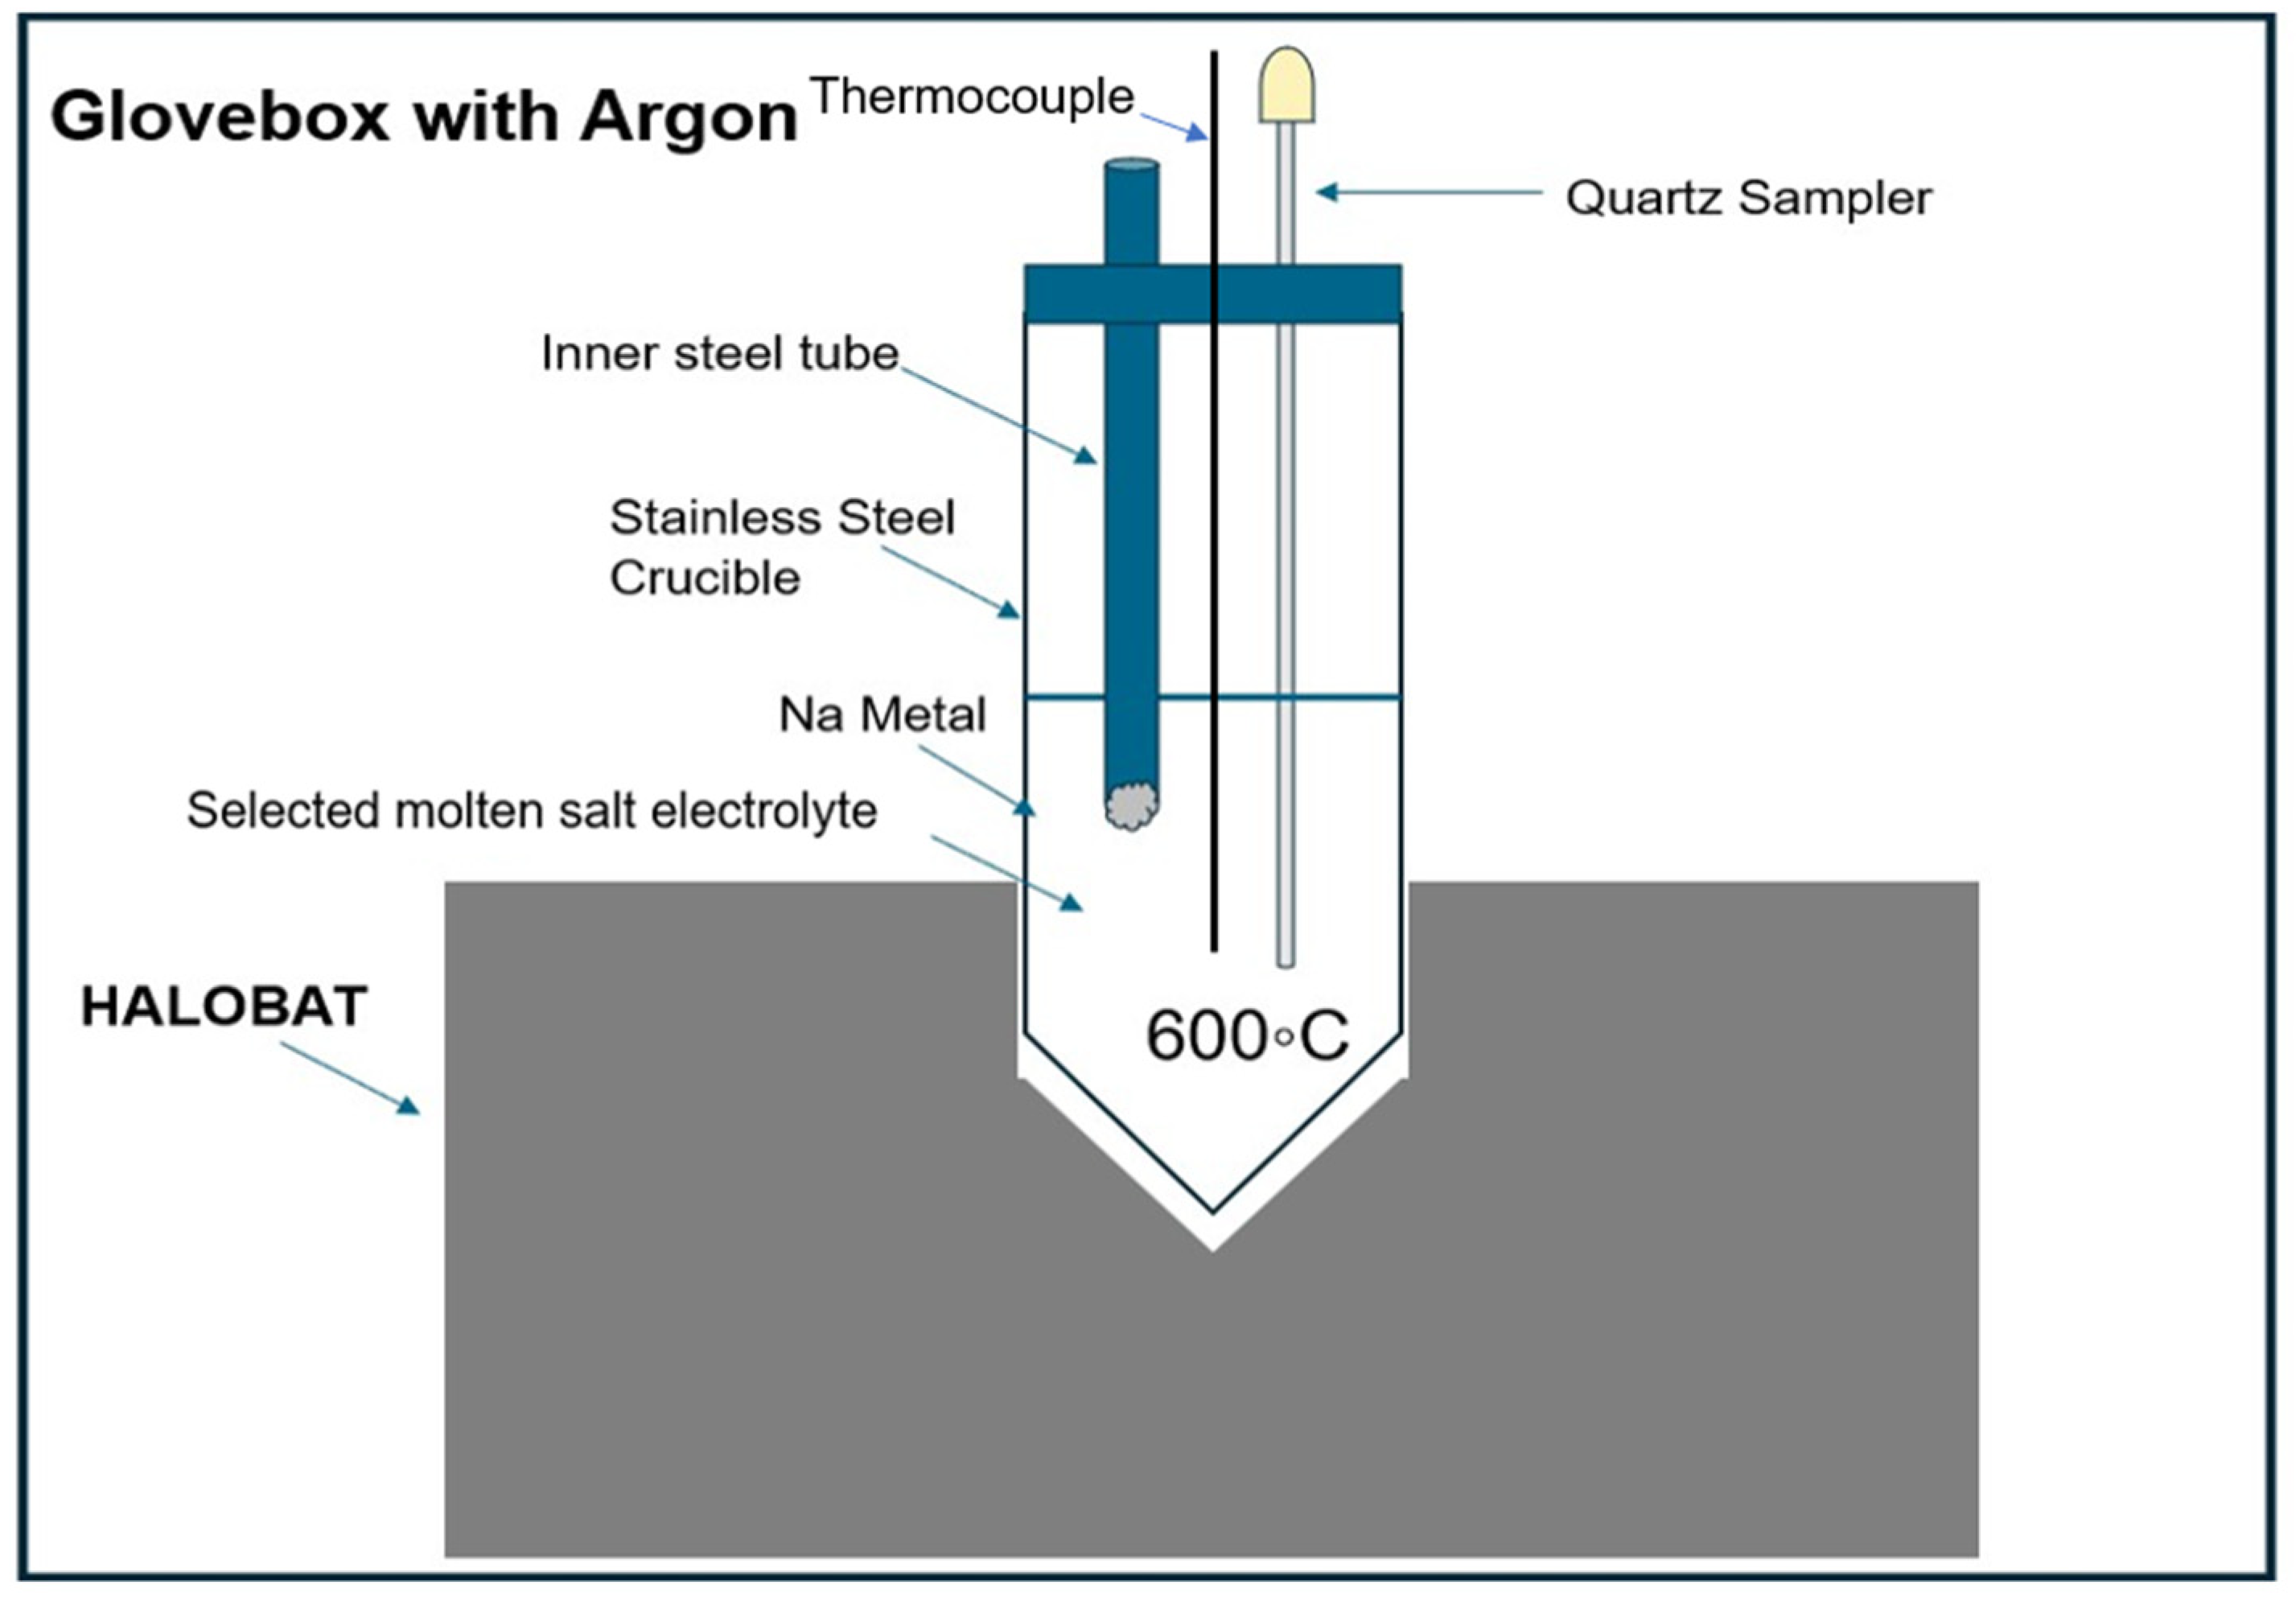
Figure 5.
Schematic of the set-up with a Zn metal holder (i.e., Alumina crucible) for Zn solubility measurements.
Figure 5.
Schematic of the set-up with a Zn metal holder (i.e., Alumina crucible) for Zn solubility measurements.
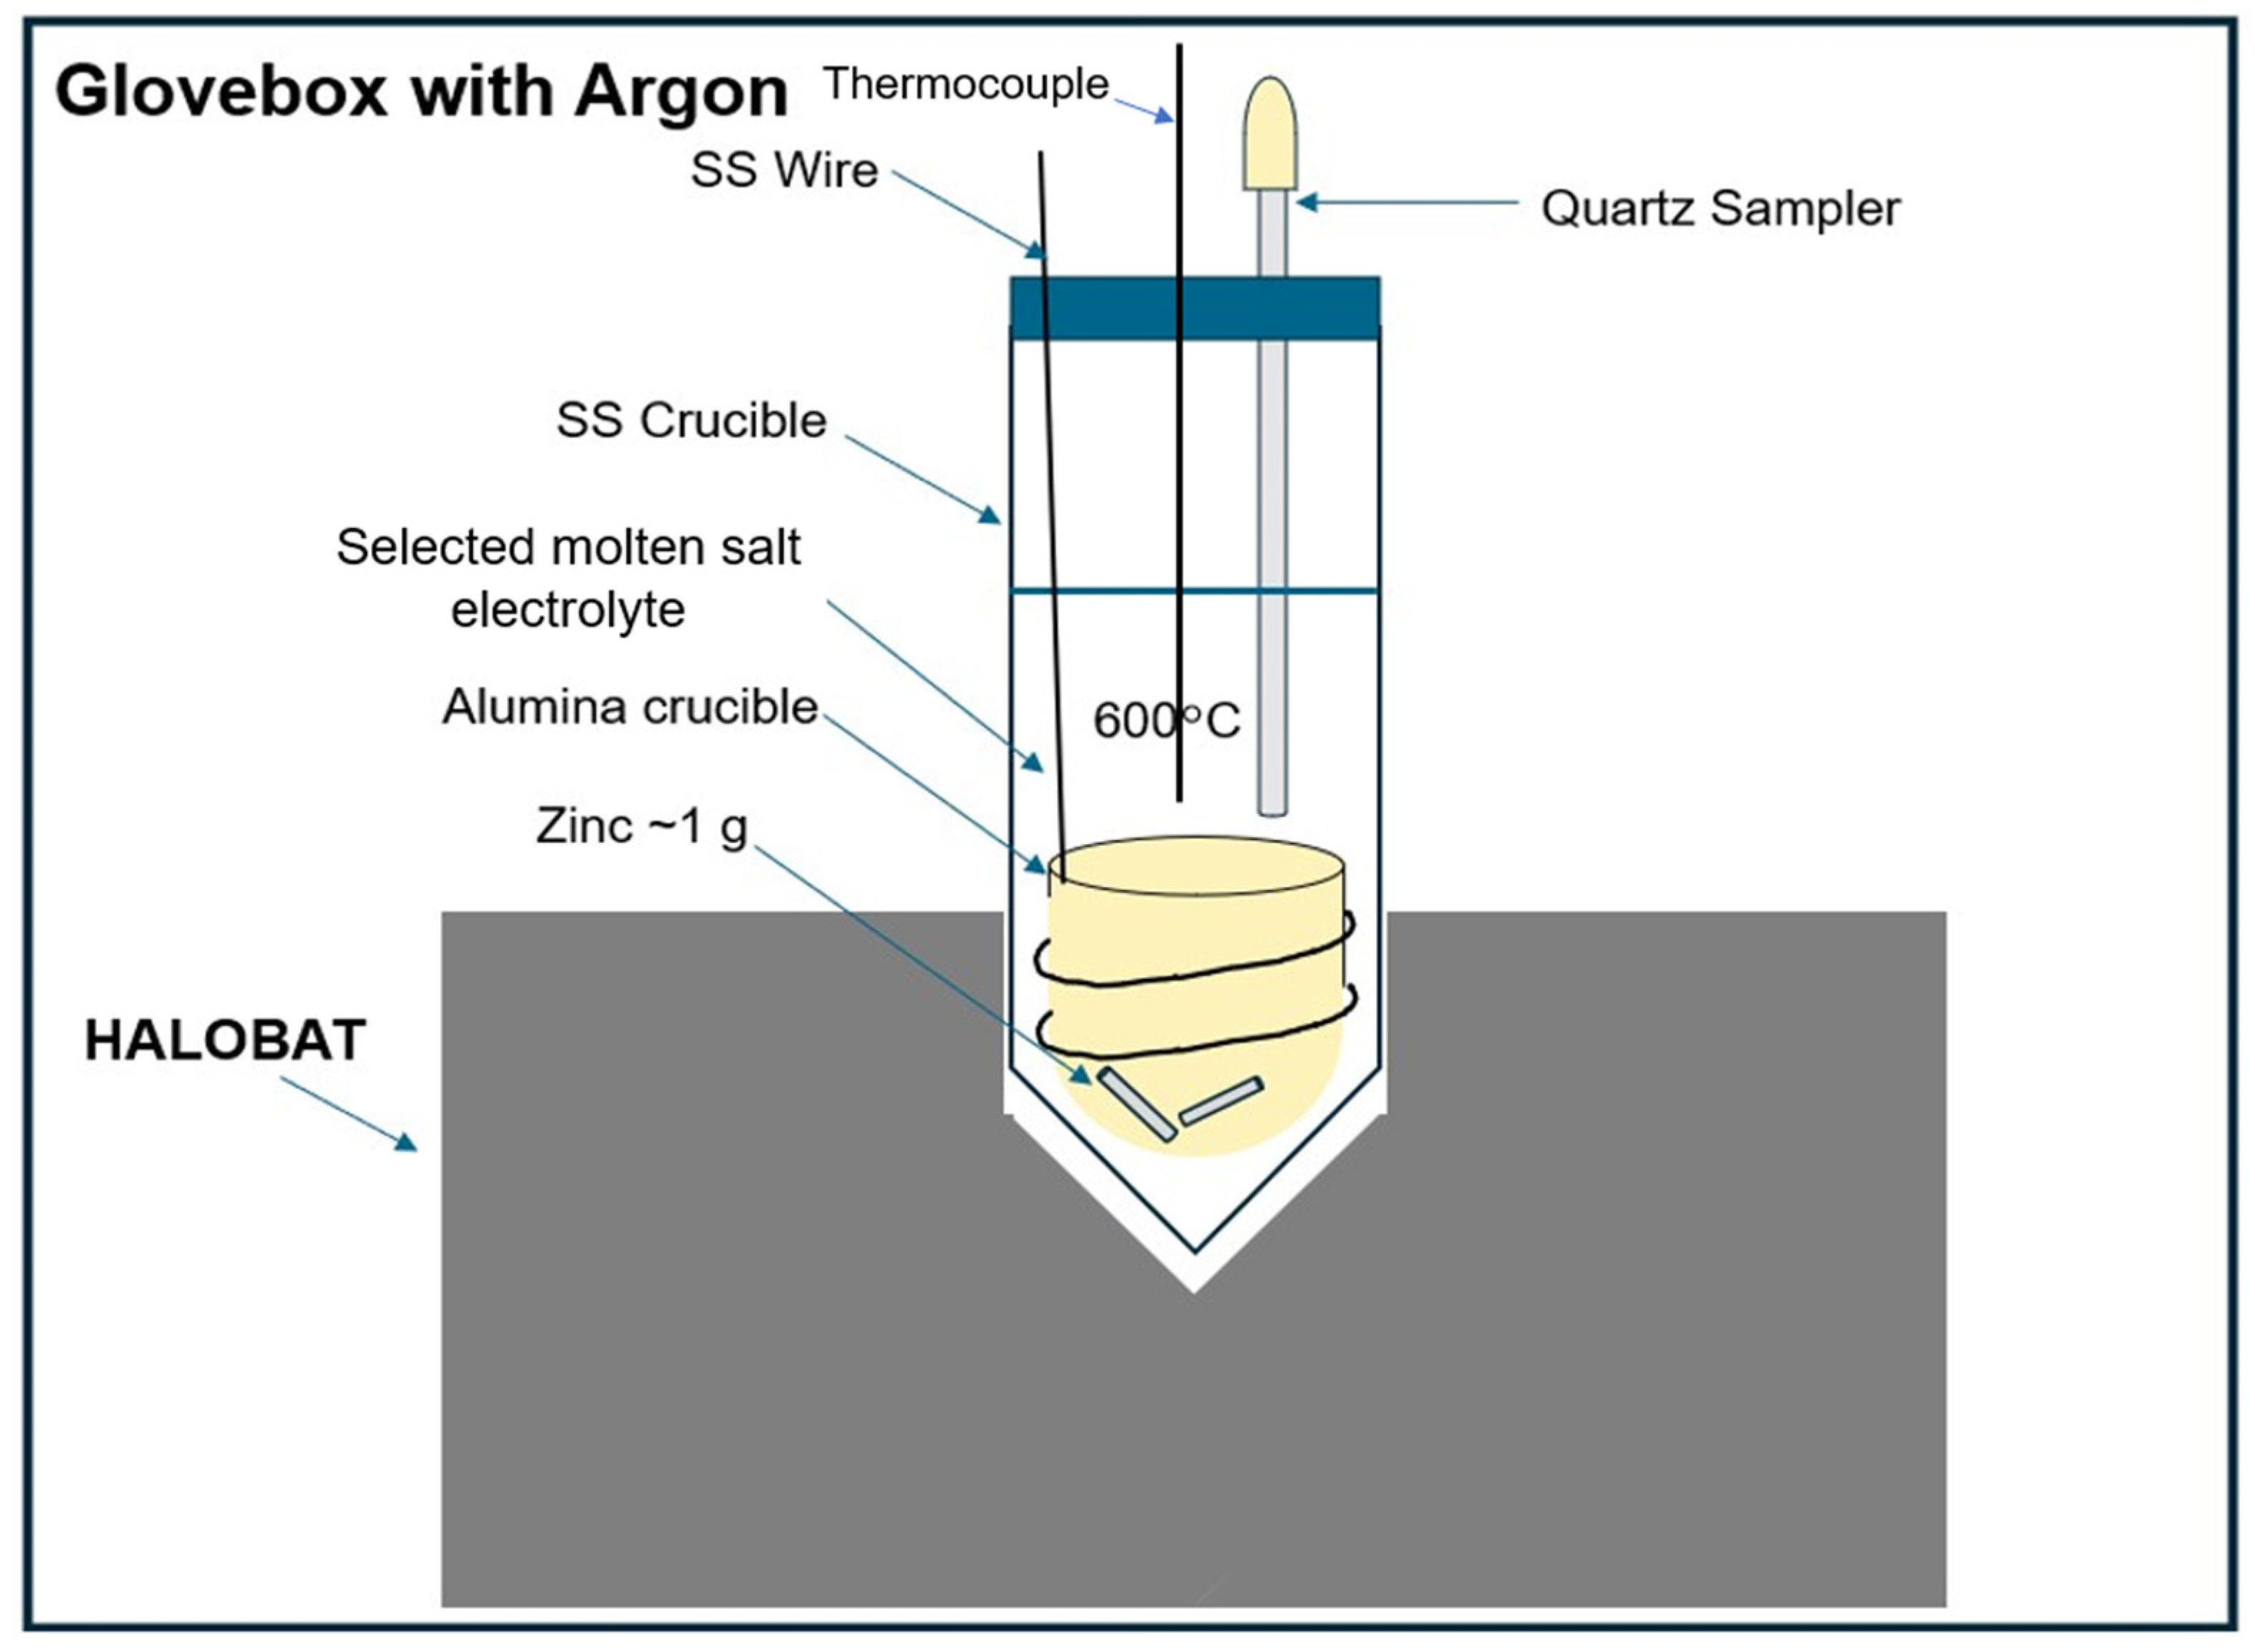
Figure 6.
Simulated phase diagram of a) NaCl-CaCl2, b) NaCl-BaCl2, c) NaCl-SrCl2, d) NaCl-KCl. The red lines show the expected ALB working temperature of 600°C.
Figure 6.
Simulated phase diagram of a) NaCl-CaCl2, b) NaCl-BaCl2, c) NaCl-SrCl2, d) NaCl-KCl. The red lines show the expected ALB working temperature of 600°C.
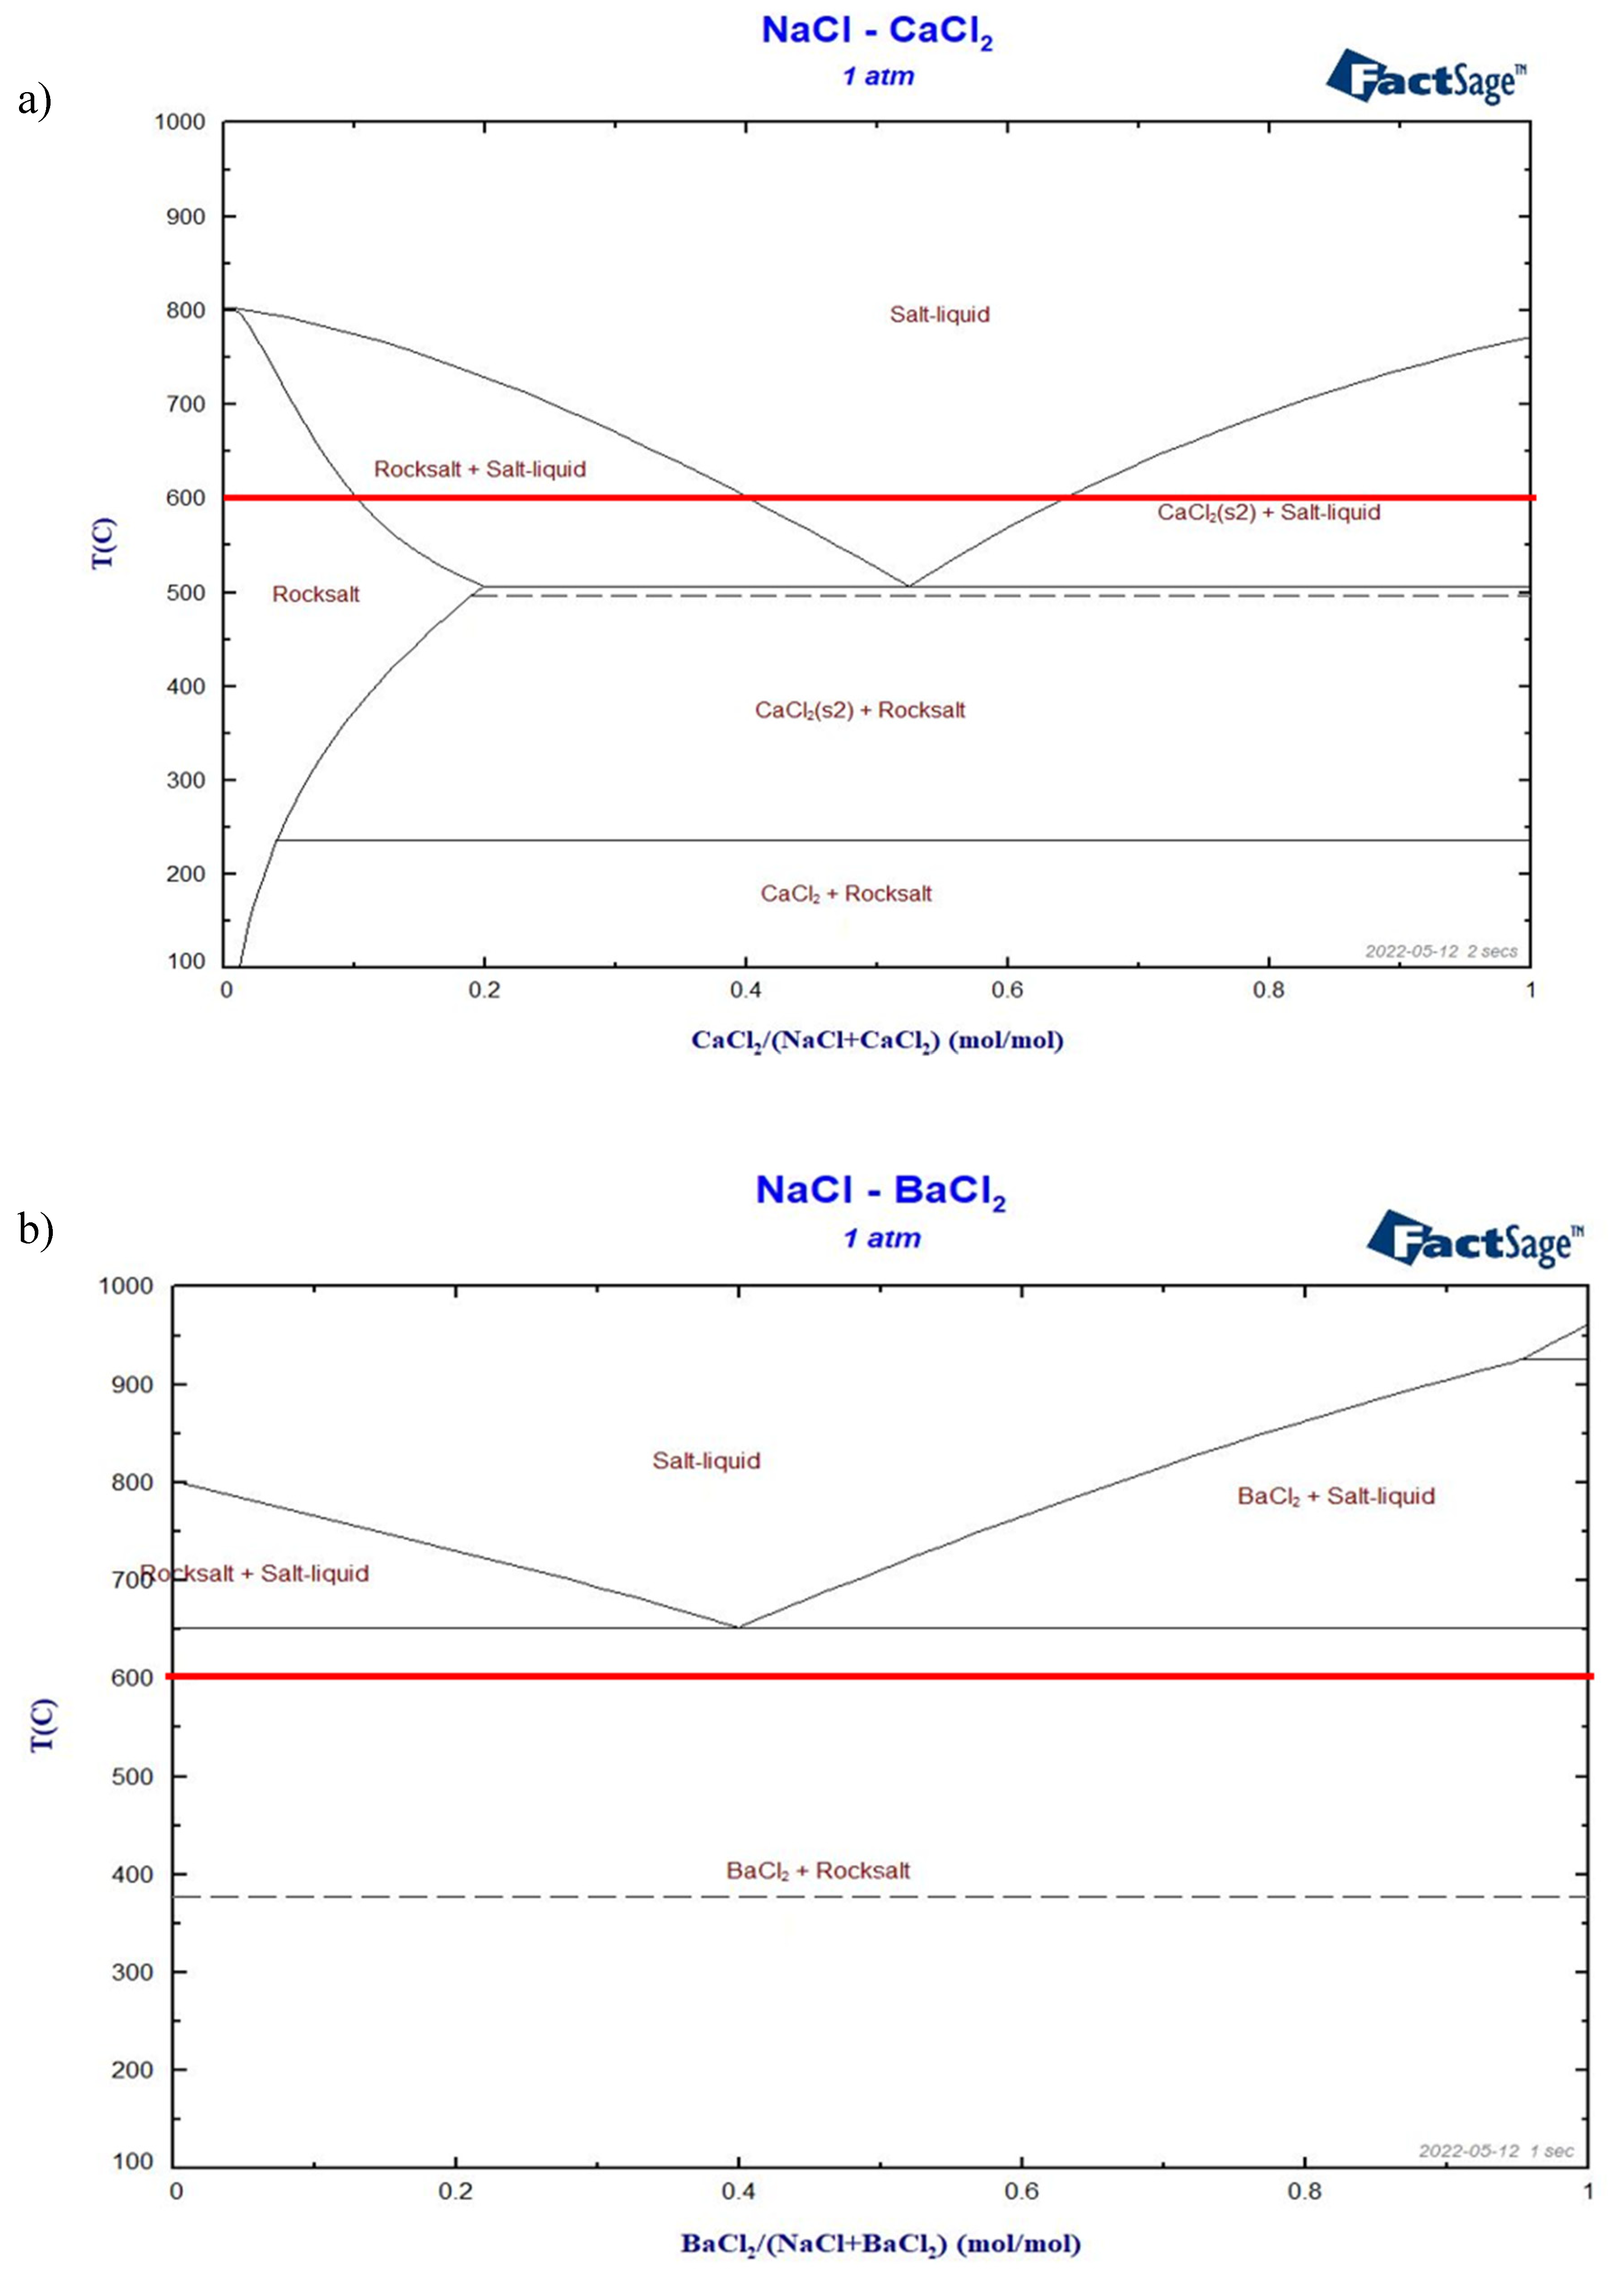
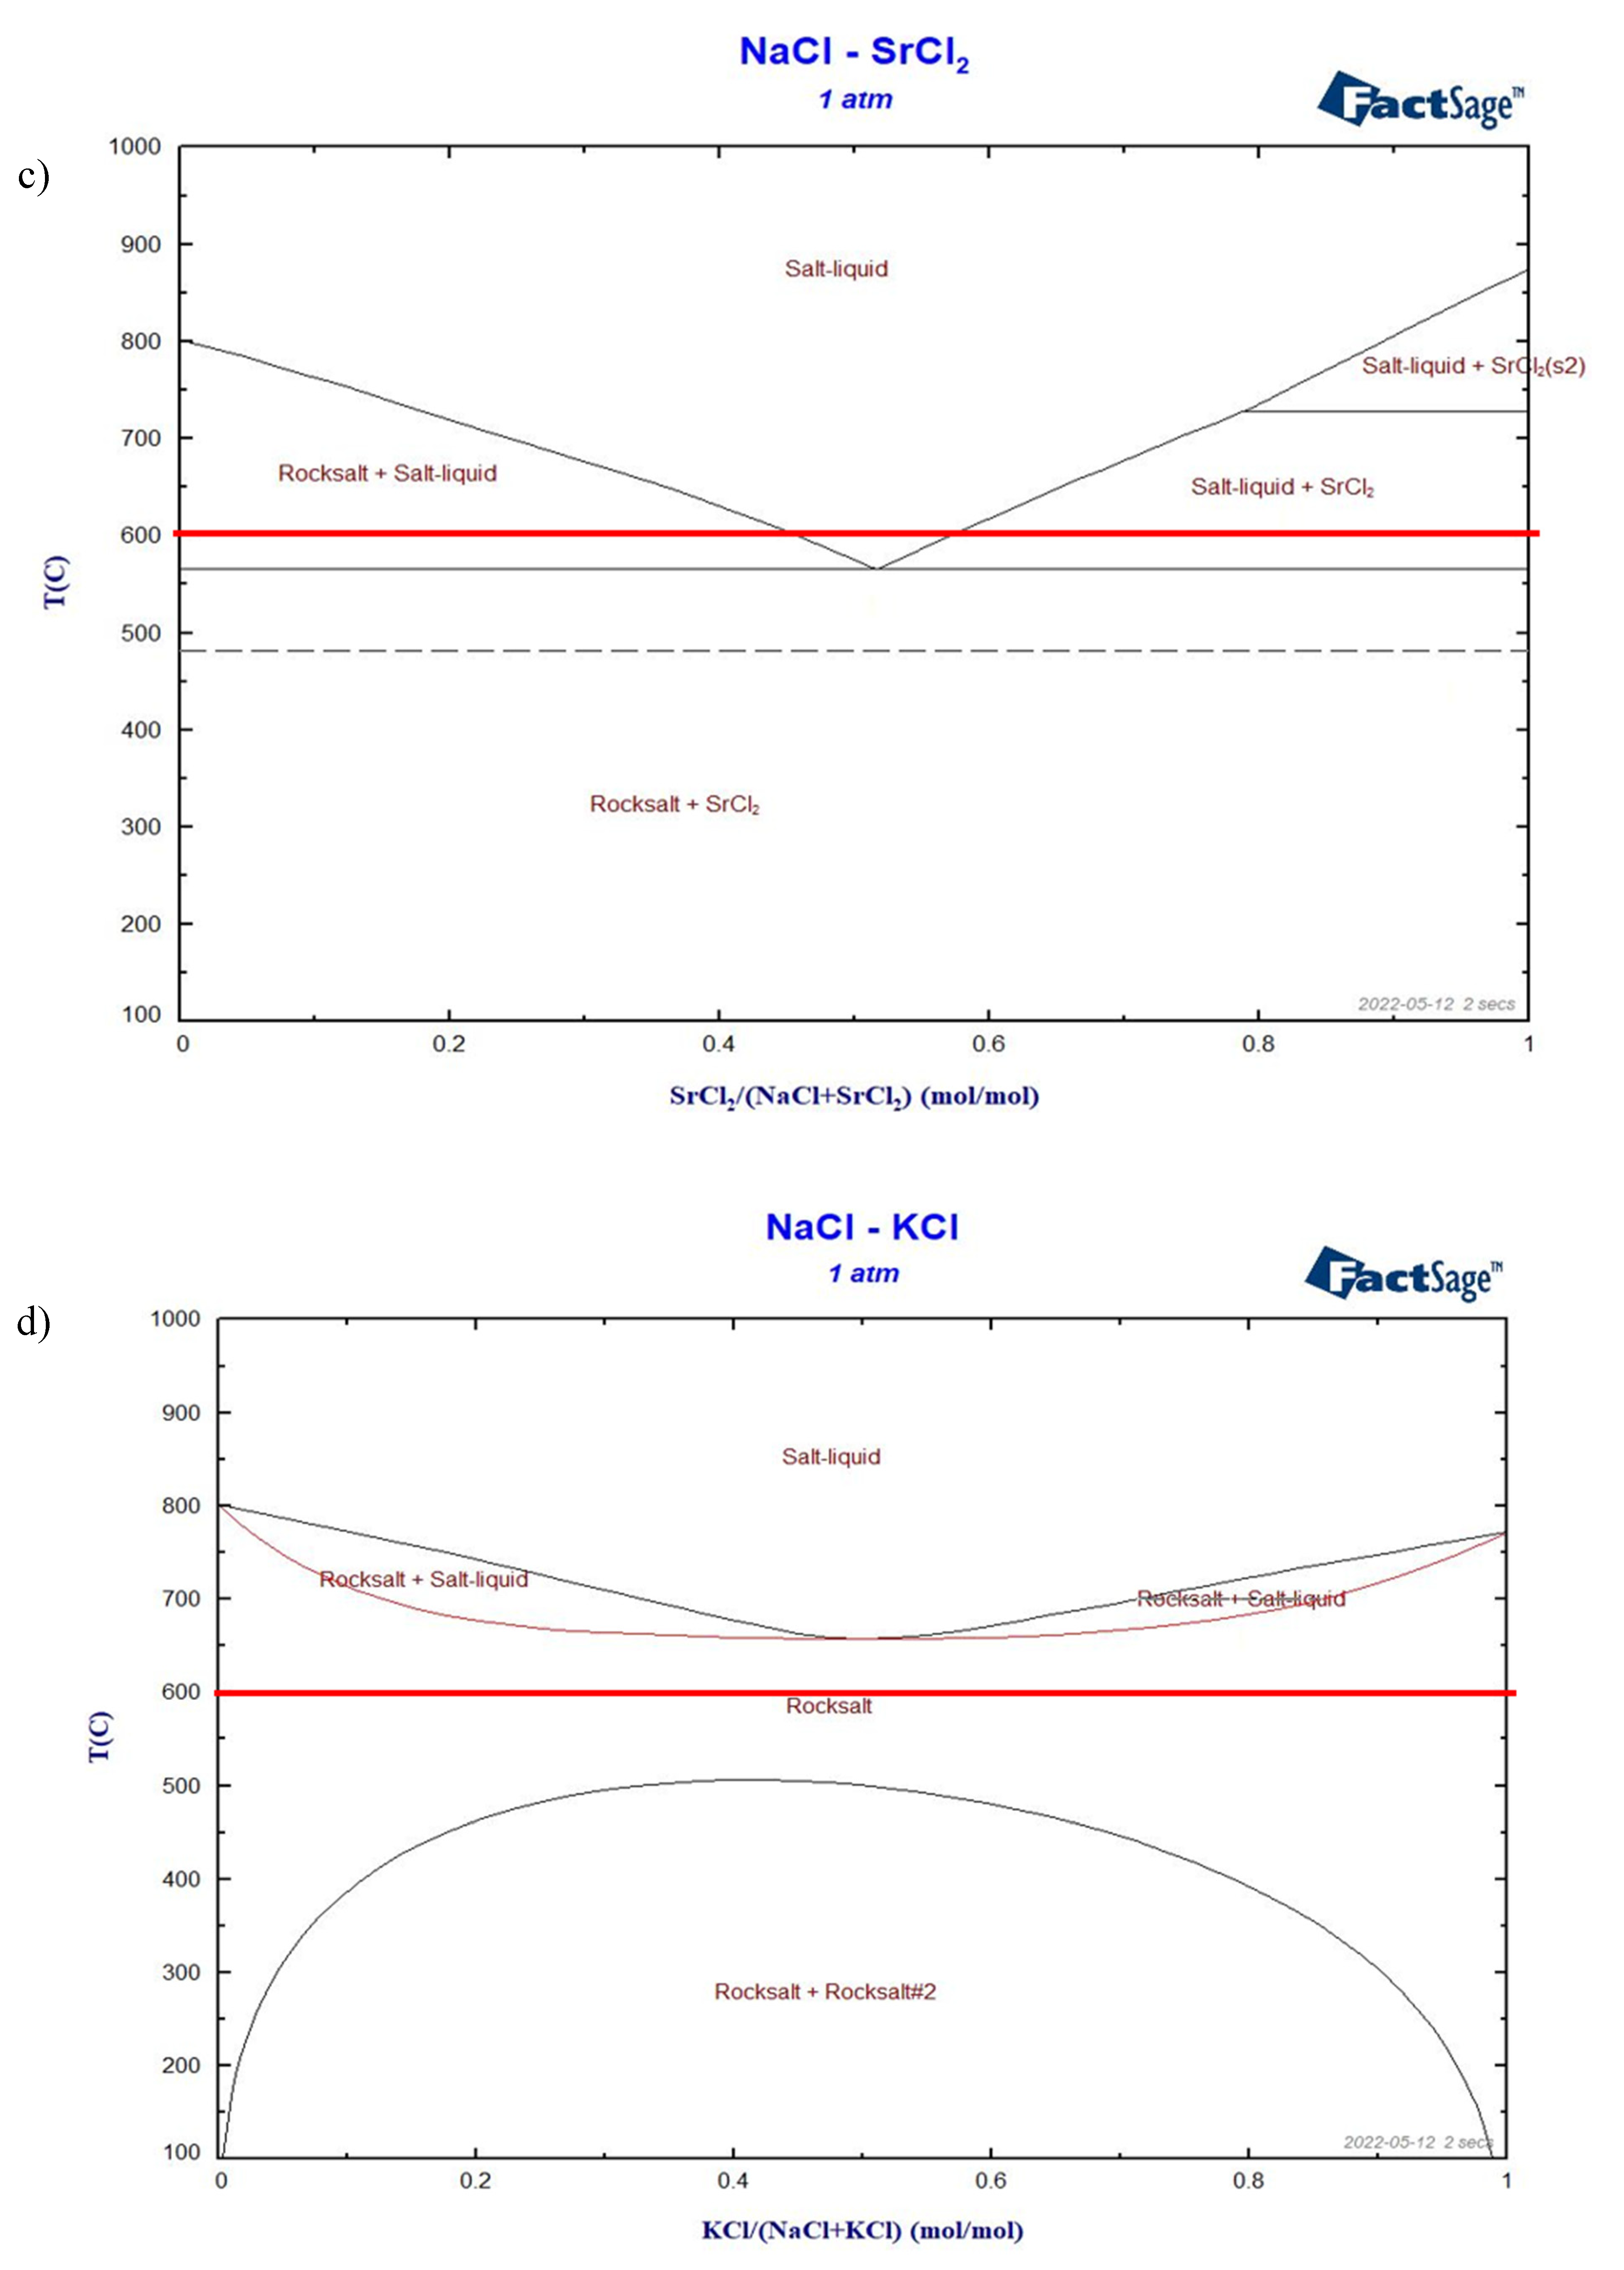
Figure 7.
DSC test result for the eutectic NaCl–CaCl2 48-52 mol% (top) and simulated Cp vs. T via FactSage (bottom).
Figure 7.
DSC test result for the eutectic NaCl–CaCl2 48-52 mol% (top) and simulated Cp vs. T via FactSage (bottom).
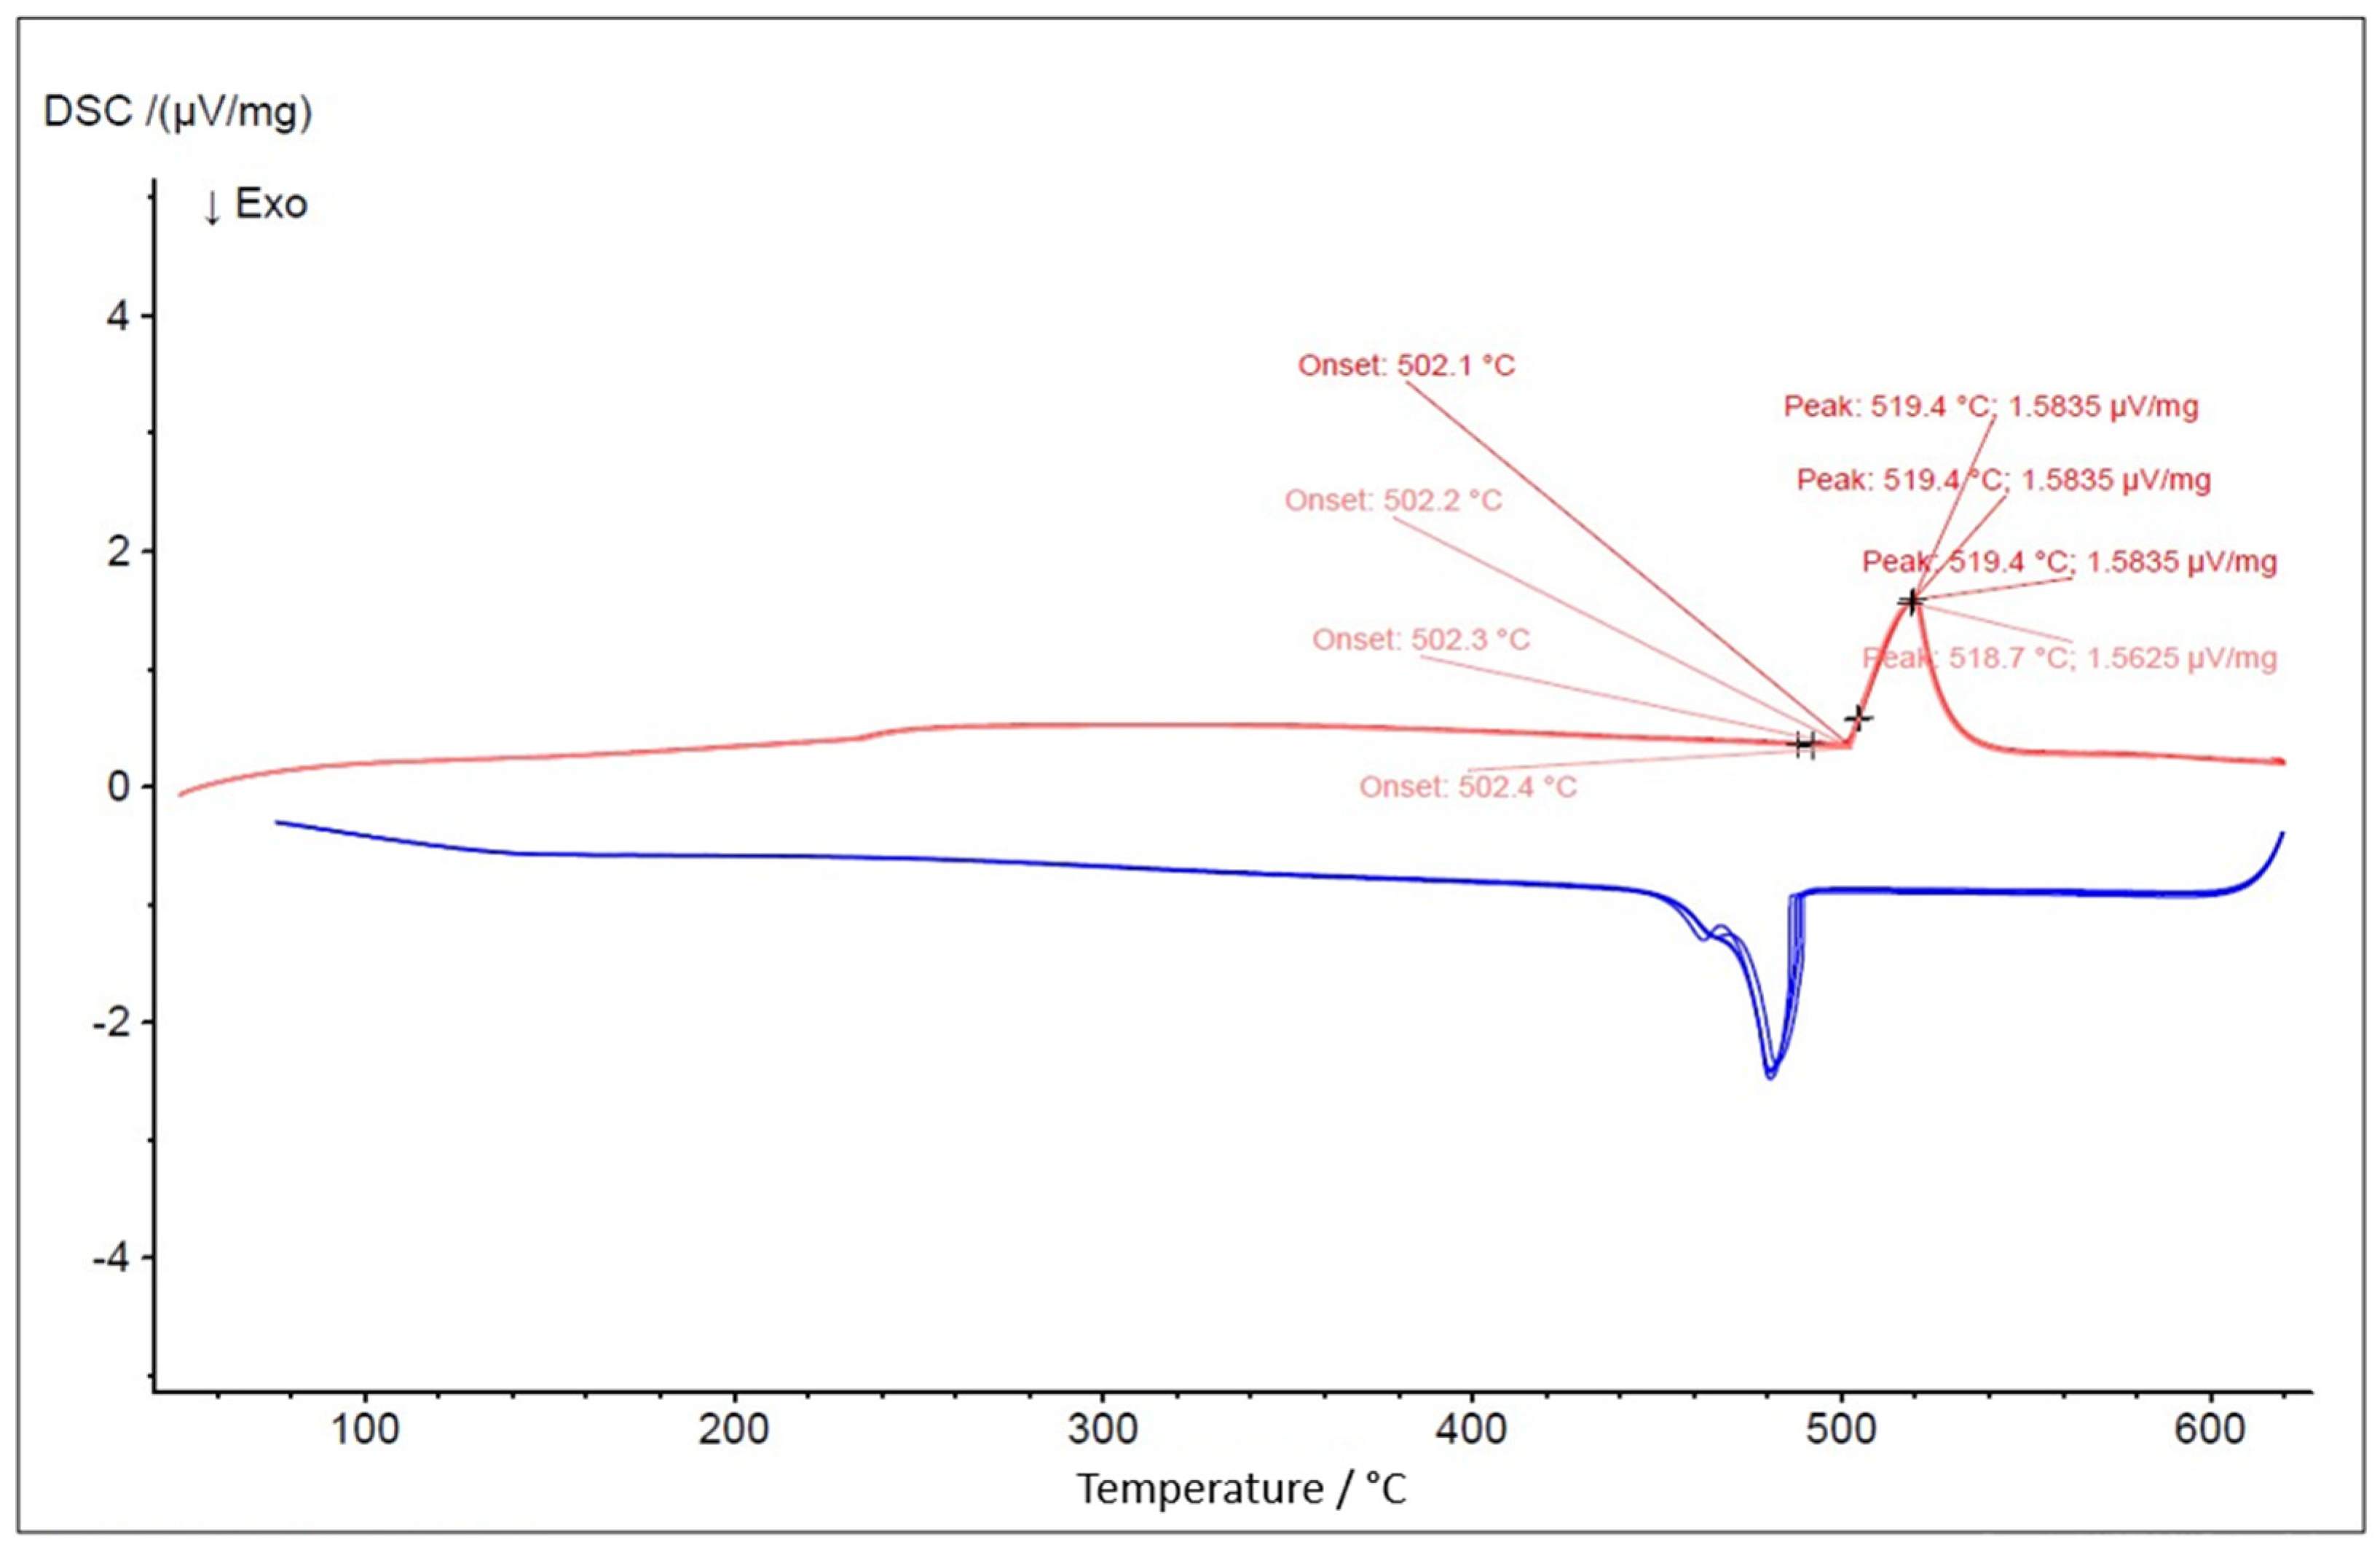
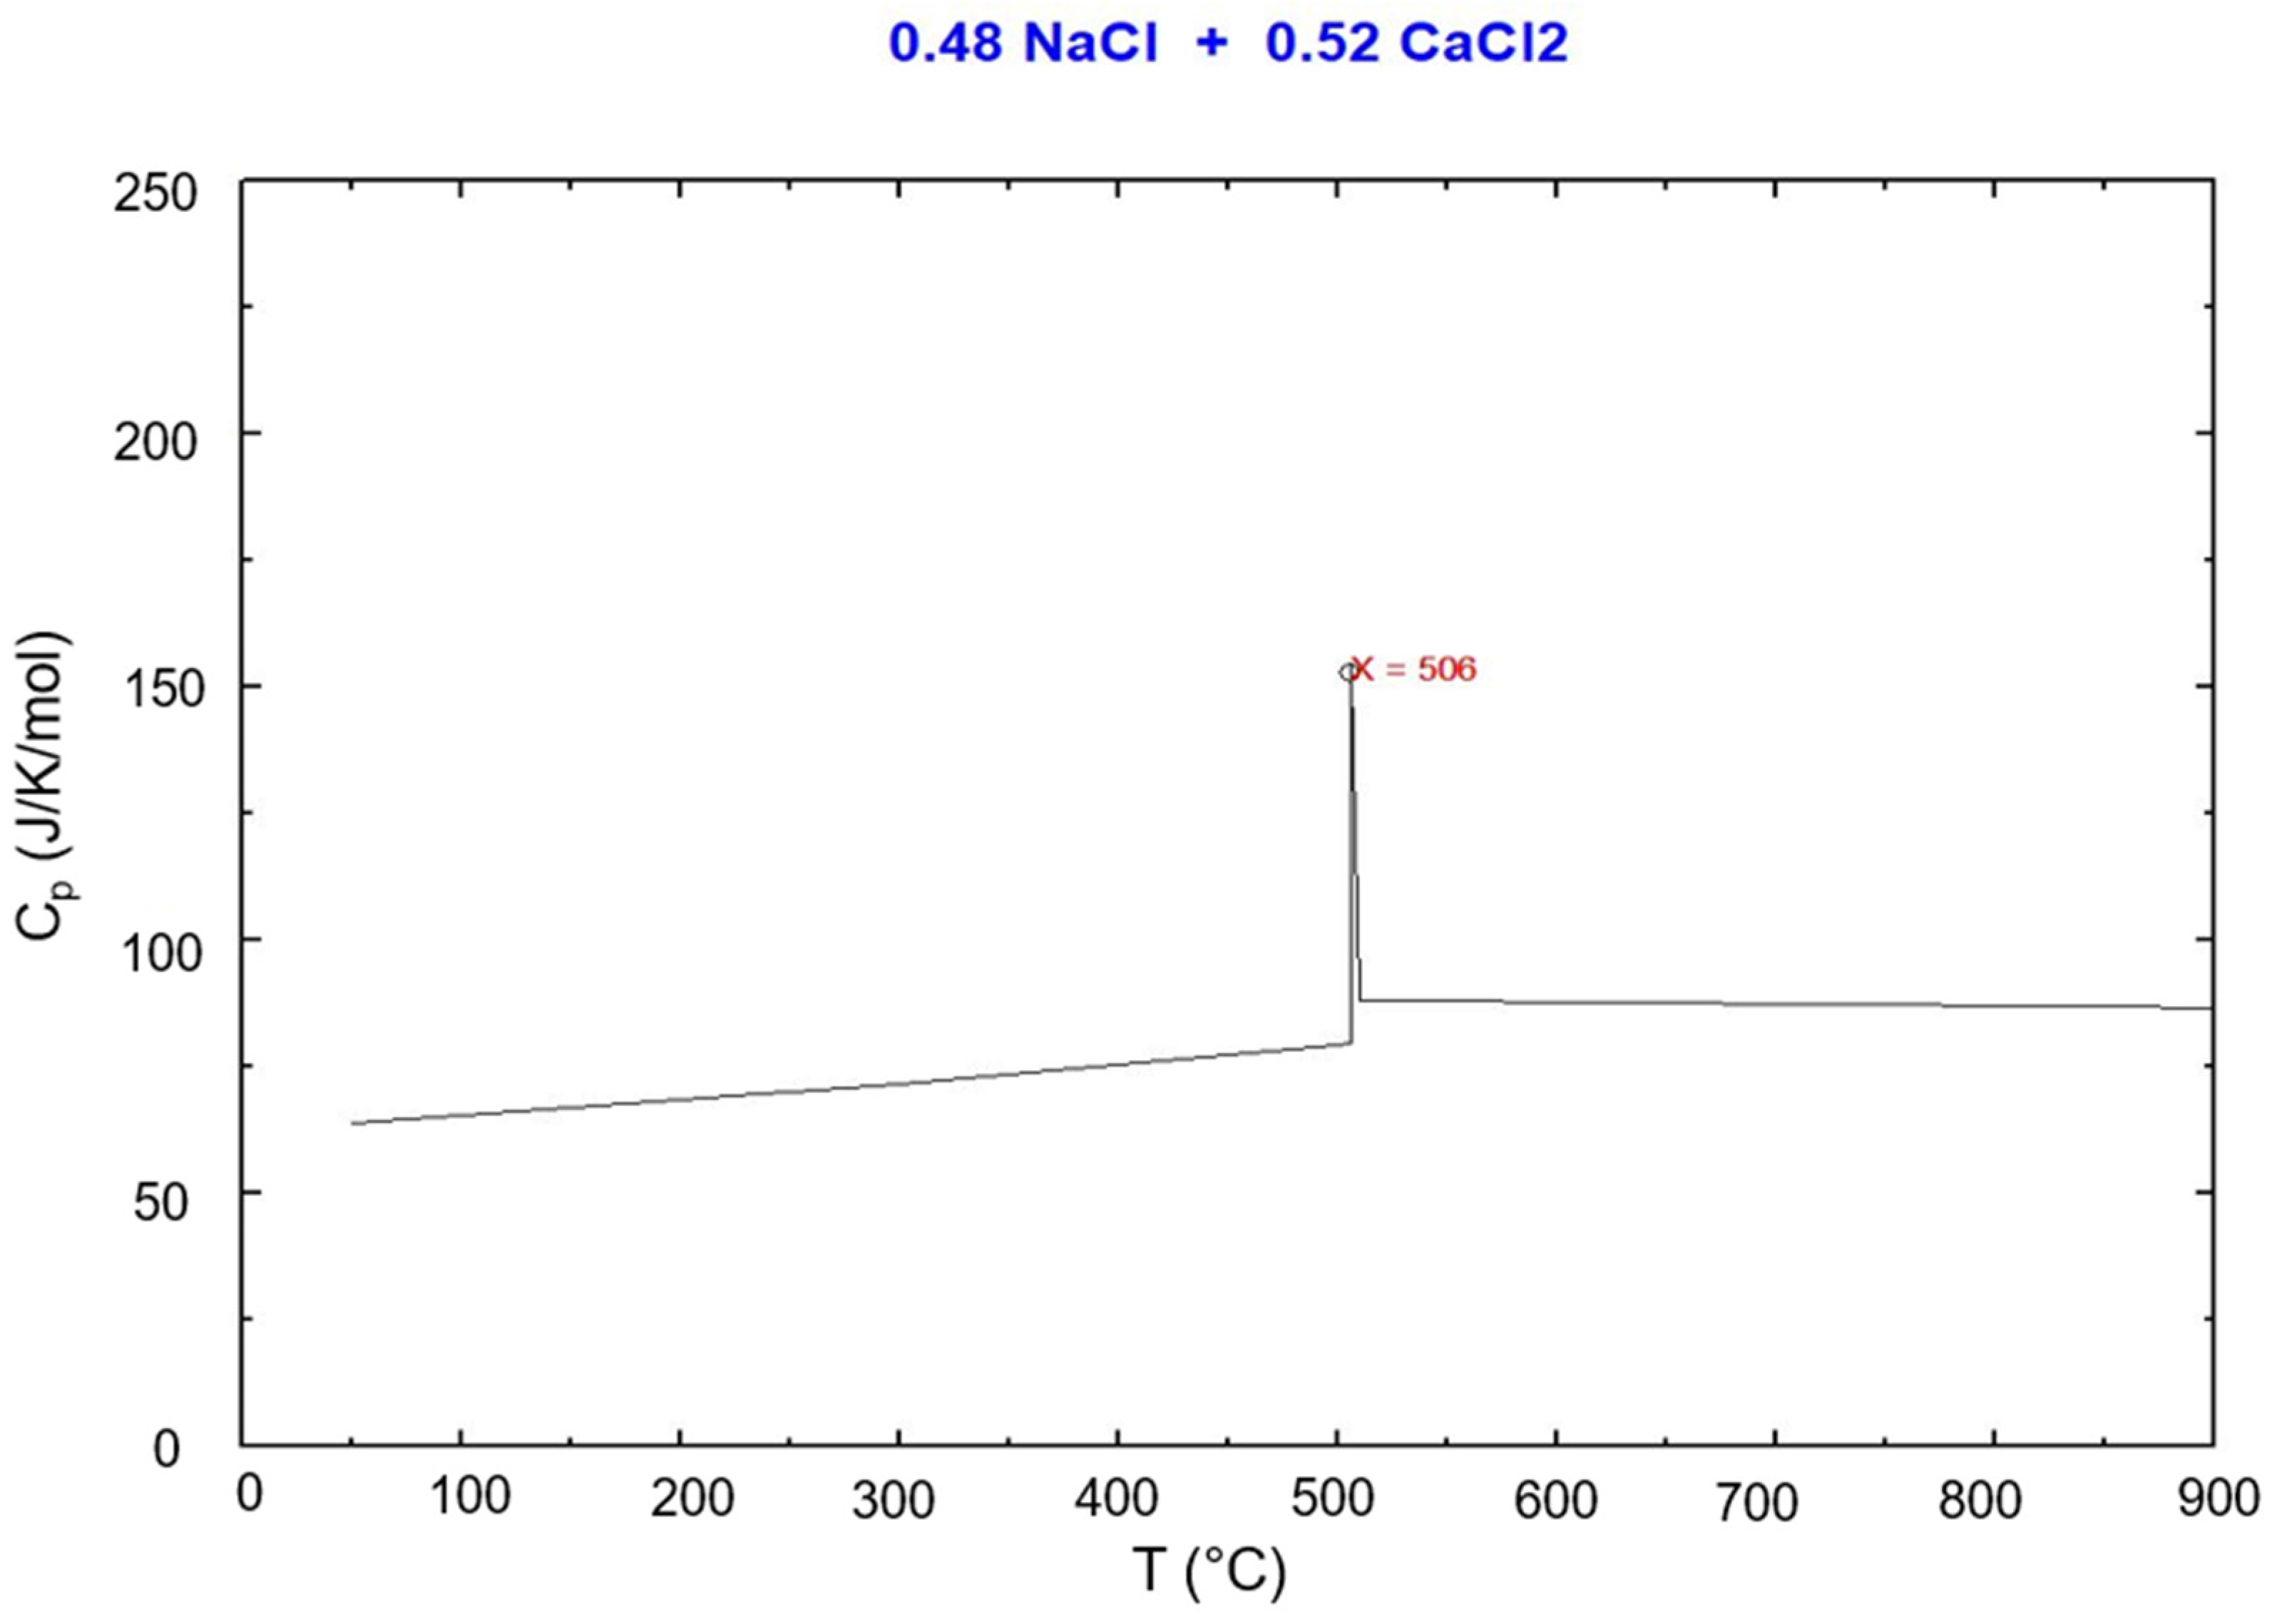
Figure 8.
Simulated ternary phase diagrams: a) NaCl-CaCl2-BaCl2, b) NaCl-CaCl2-SrCl2, c) NaCl-CaCl2-KCl, d) NaCl-SrCl2-BaCl2, e) NaCl-SrCl2-KCl. Yellow areas in the phase diagrams represent the salt composition with melting temperature not higher than 600°C. Dark red lines show the changing salt composition during charging/discharging. The minimum temperature (eutectic) composition is pointed out with a red dotted circle. The maximum and minimum allowed concentrations of NaCl for Tm≤600°C (i.e., largest potential charge/discharge ranges of the ALB cell) are pointed with red and blue solid circles in the phase diagrams.
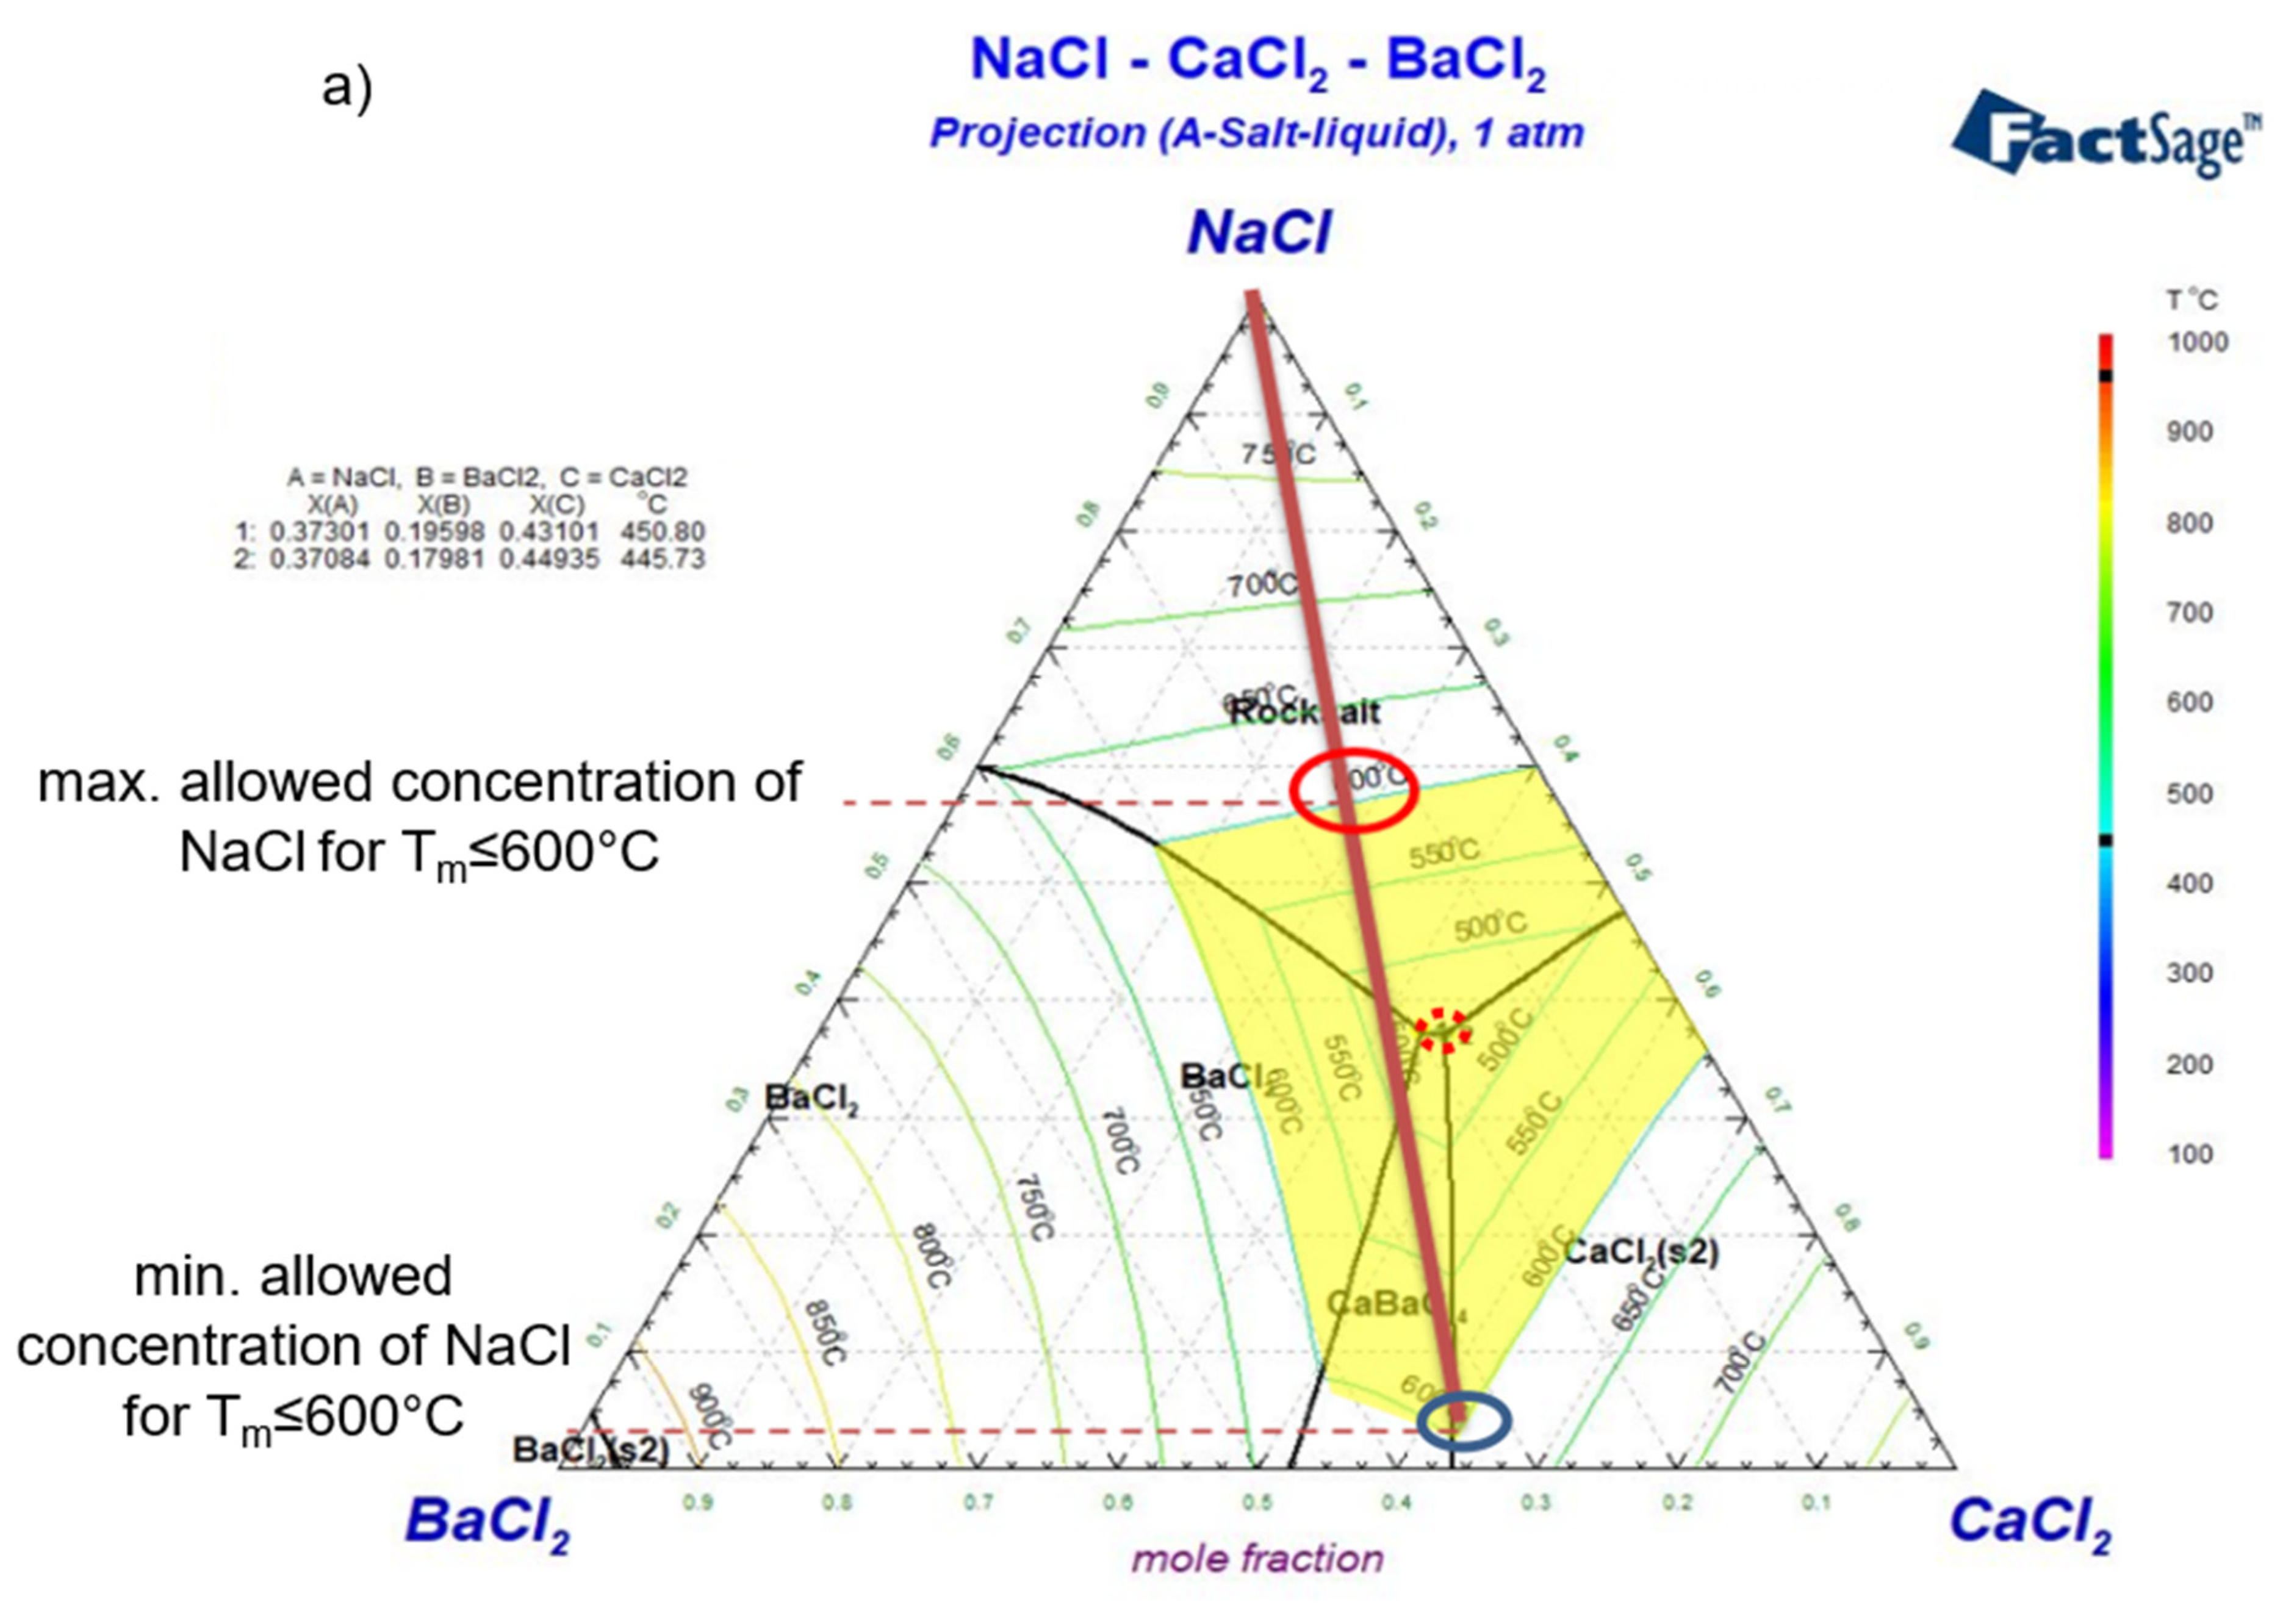
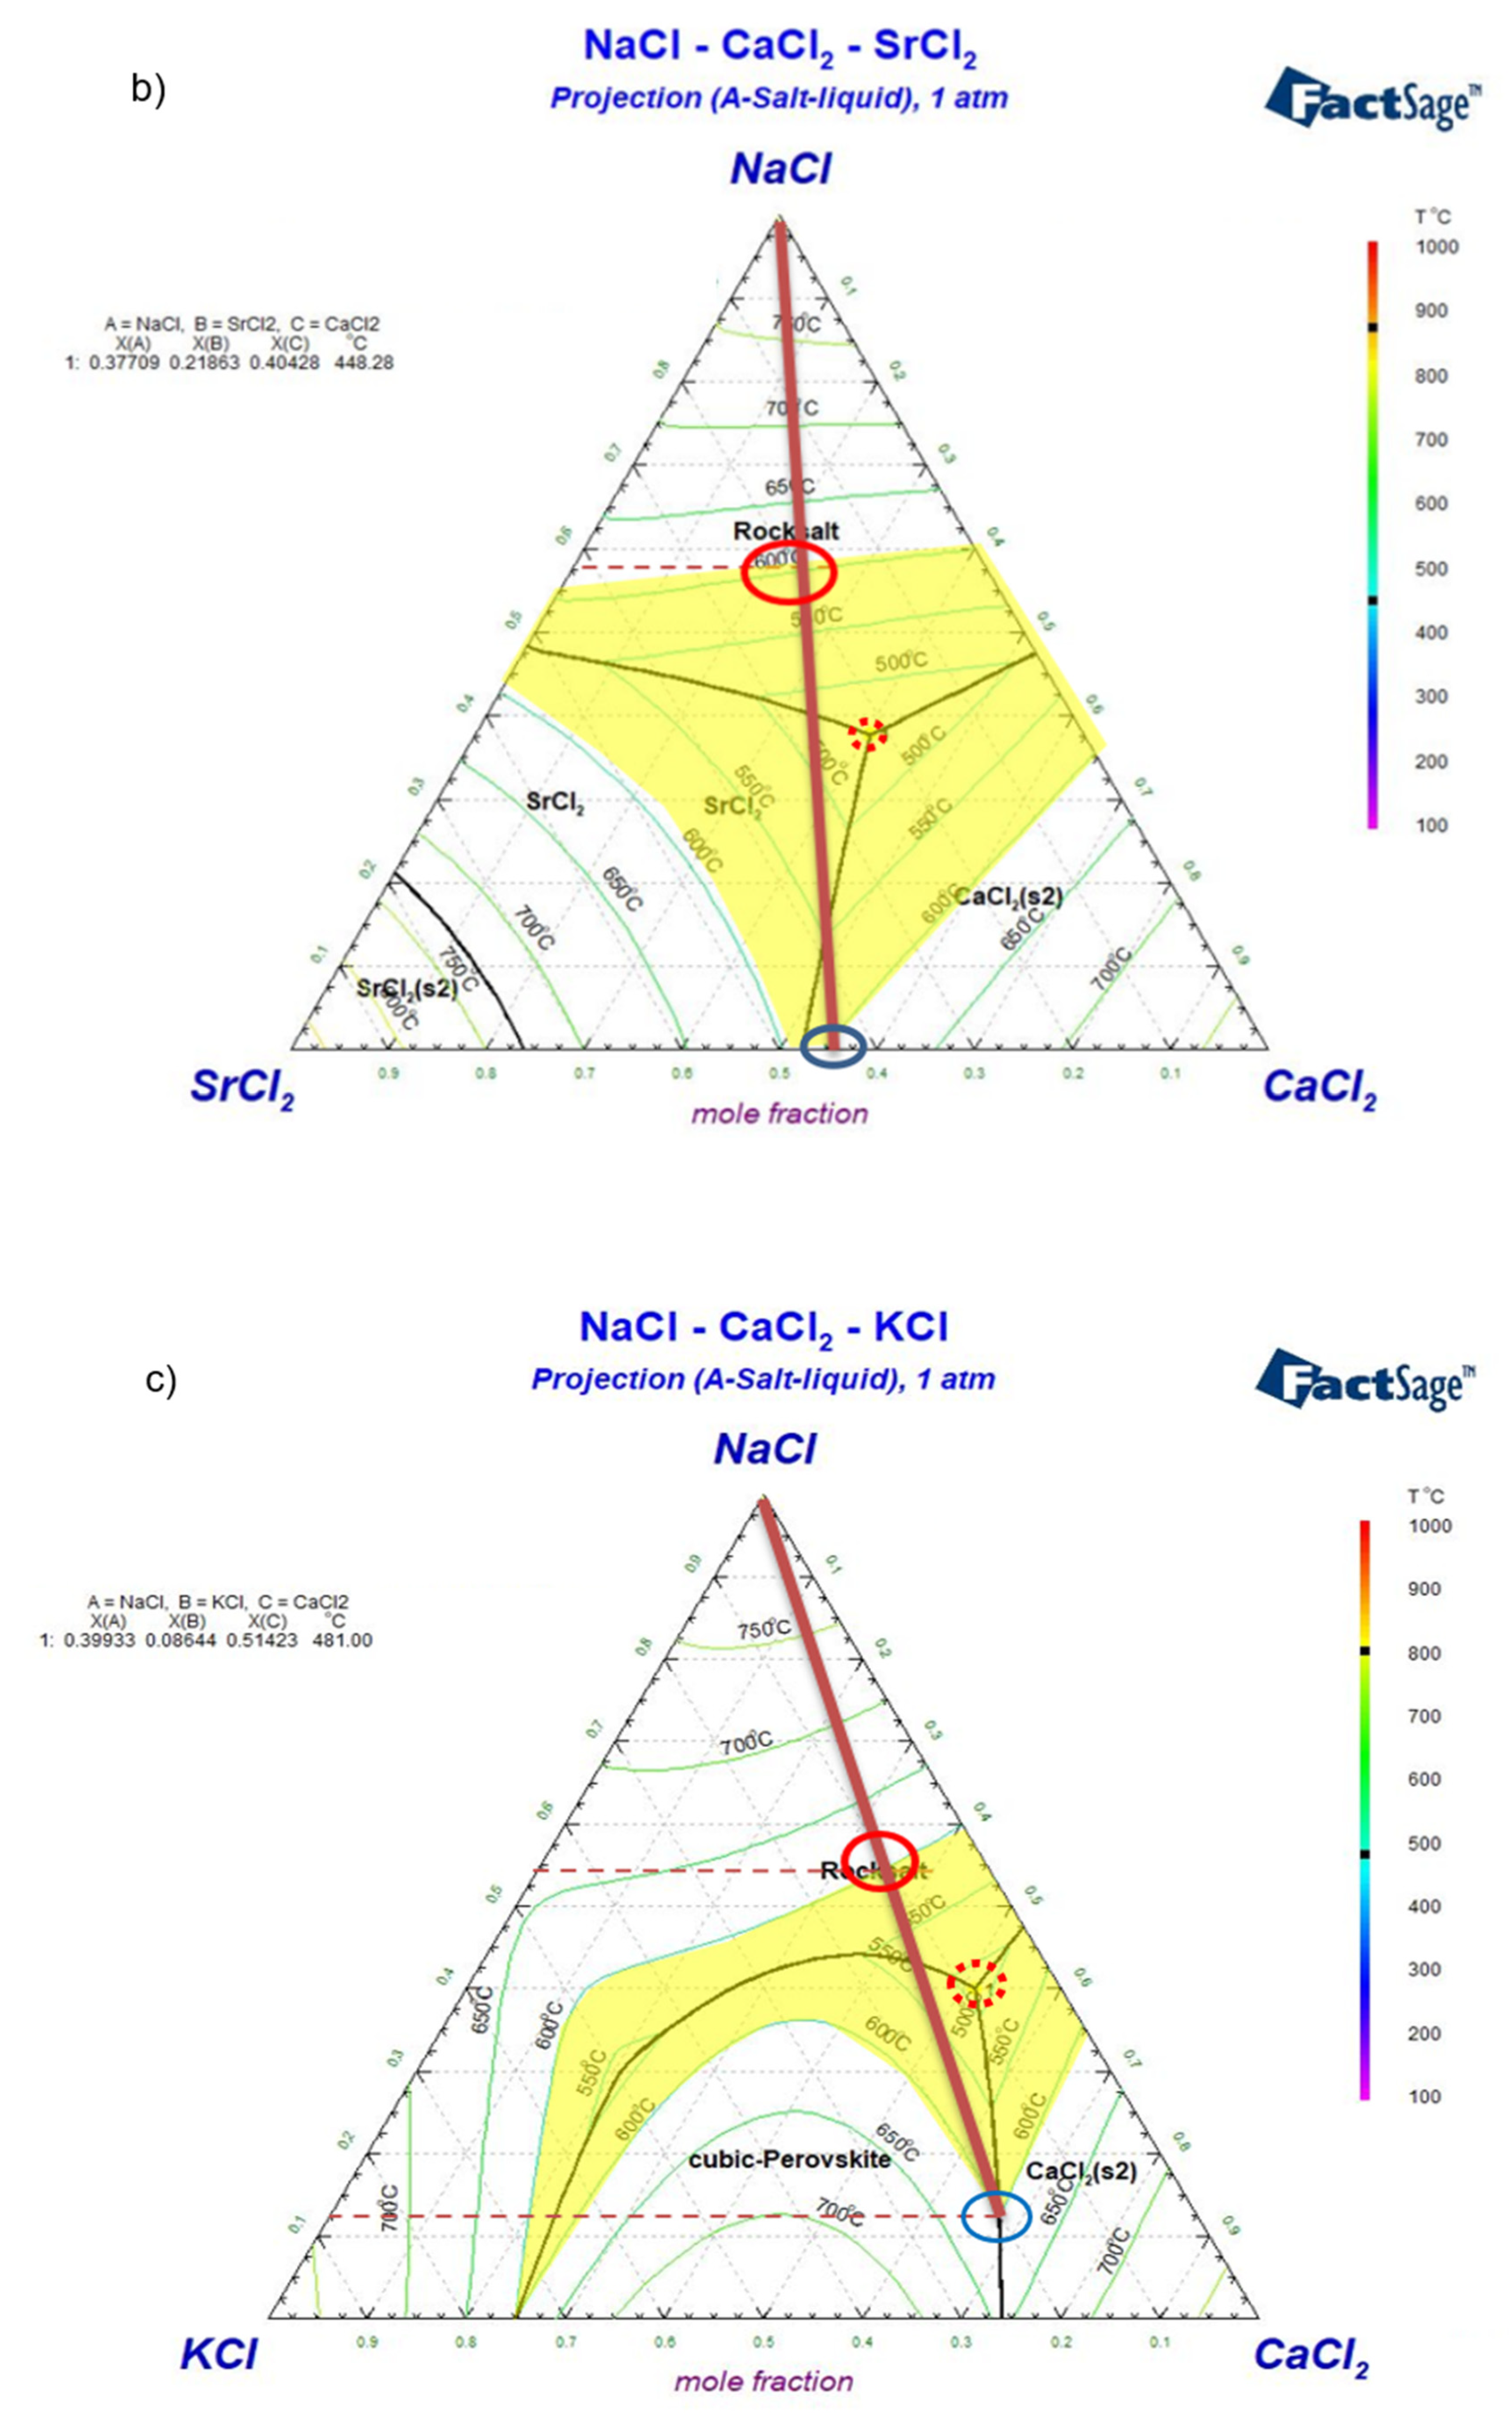
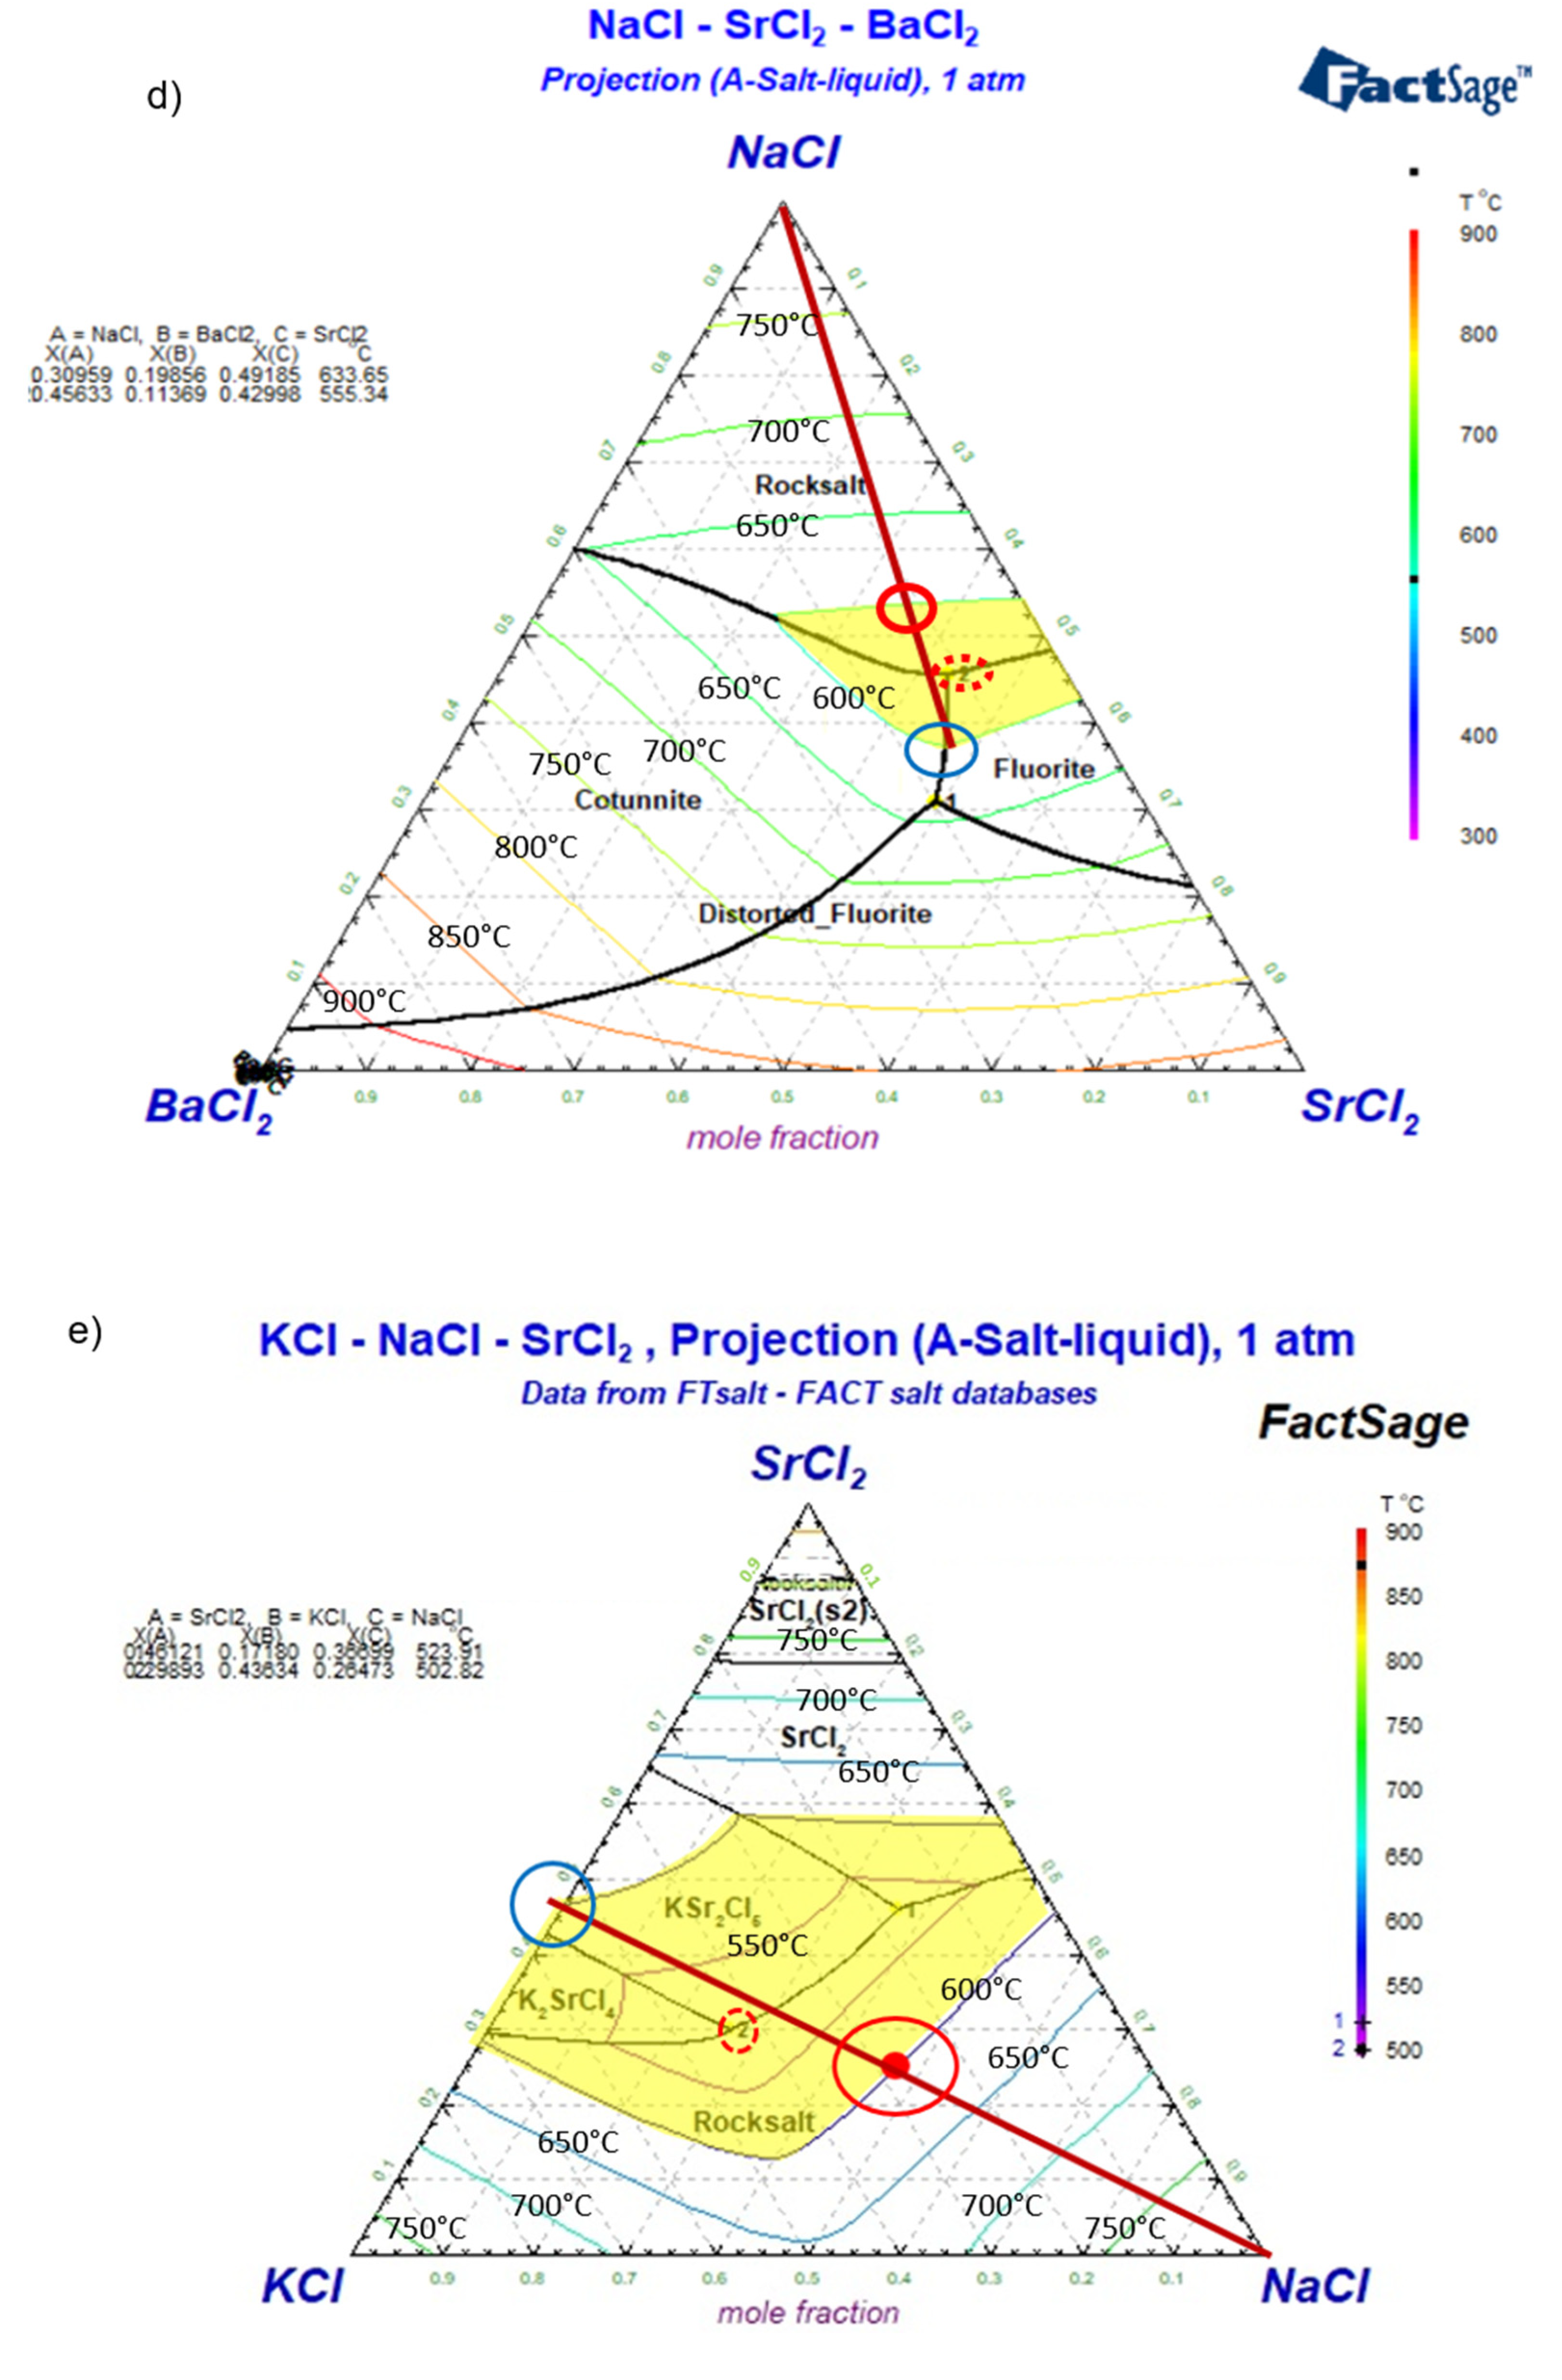
Figure 9.
DSC result (top) and simulated Cp vs. T (bottom) for the eutectic NaCl-CaCl2-BaCl2 (37.1-44.9-18.0 mol%).
Figure 9.
DSC result (top) and simulated Cp vs. T (bottom) for the eutectic NaCl-CaCl2-BaCl2 (37.1-44.9-18.0 mol%).
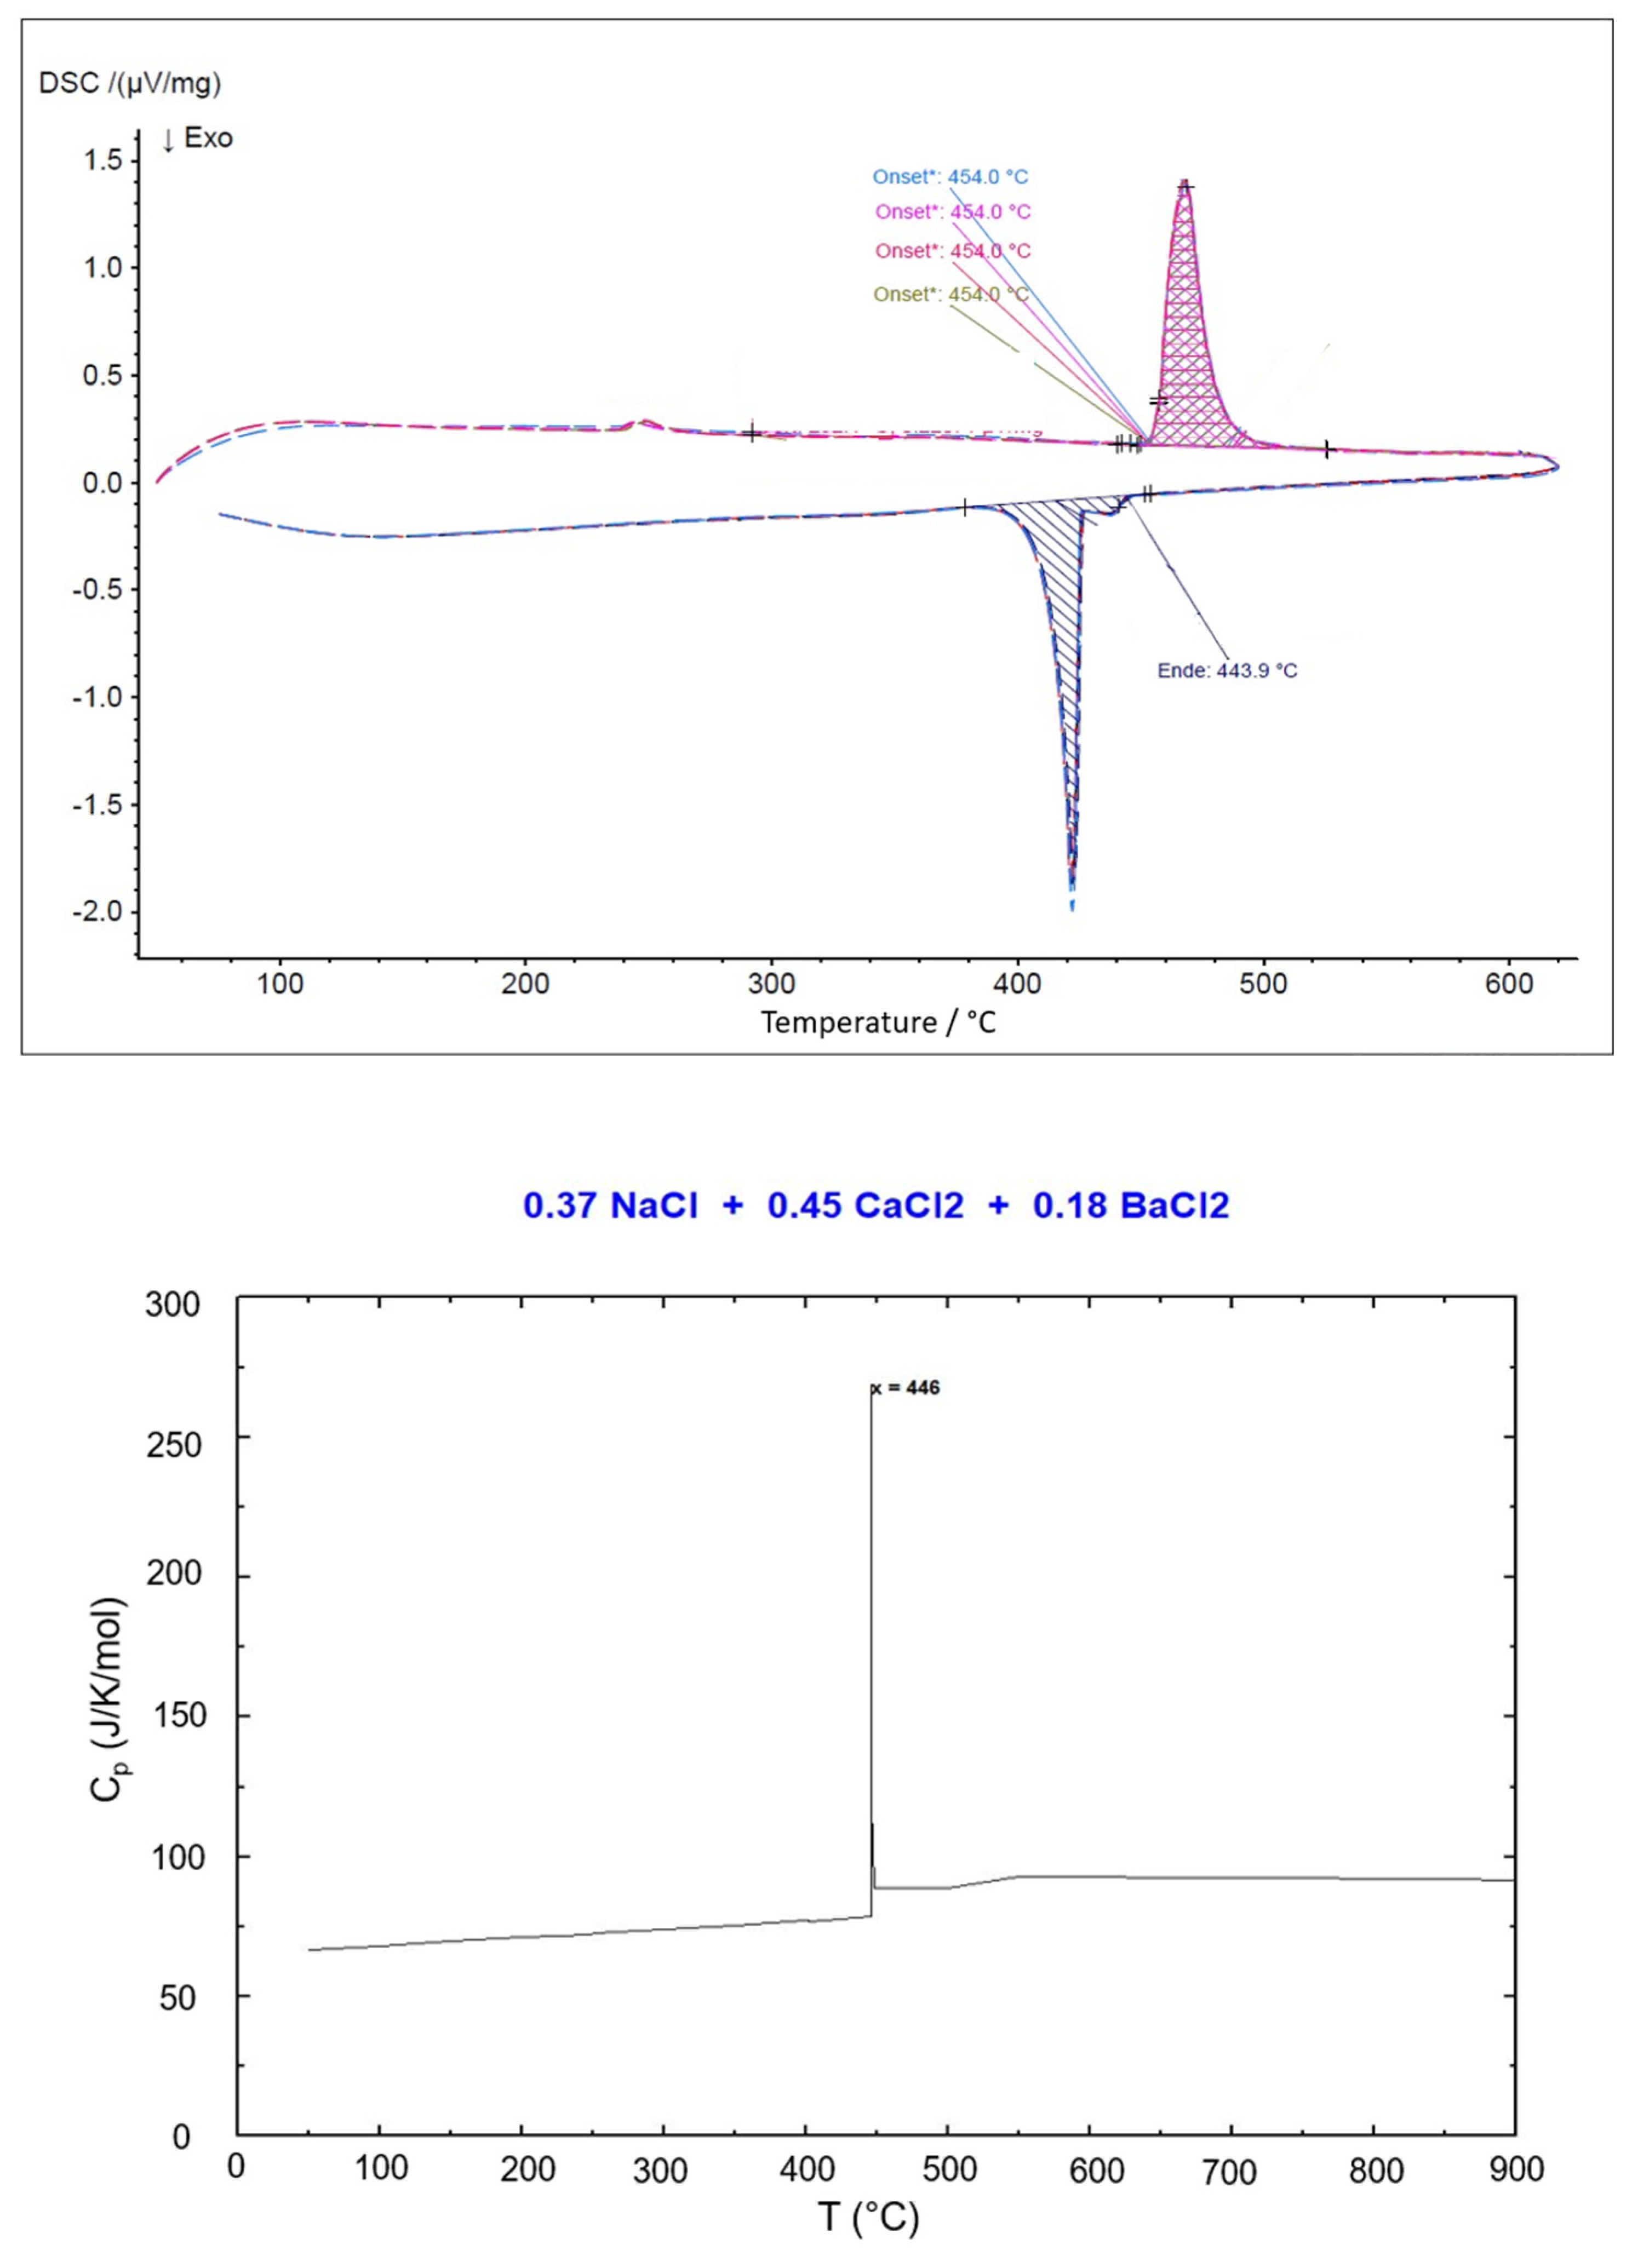
Figure 10.
DSC result for the eutectic NaCl-SrCl2-KCl (30.0-26.5-43.5 mol%).
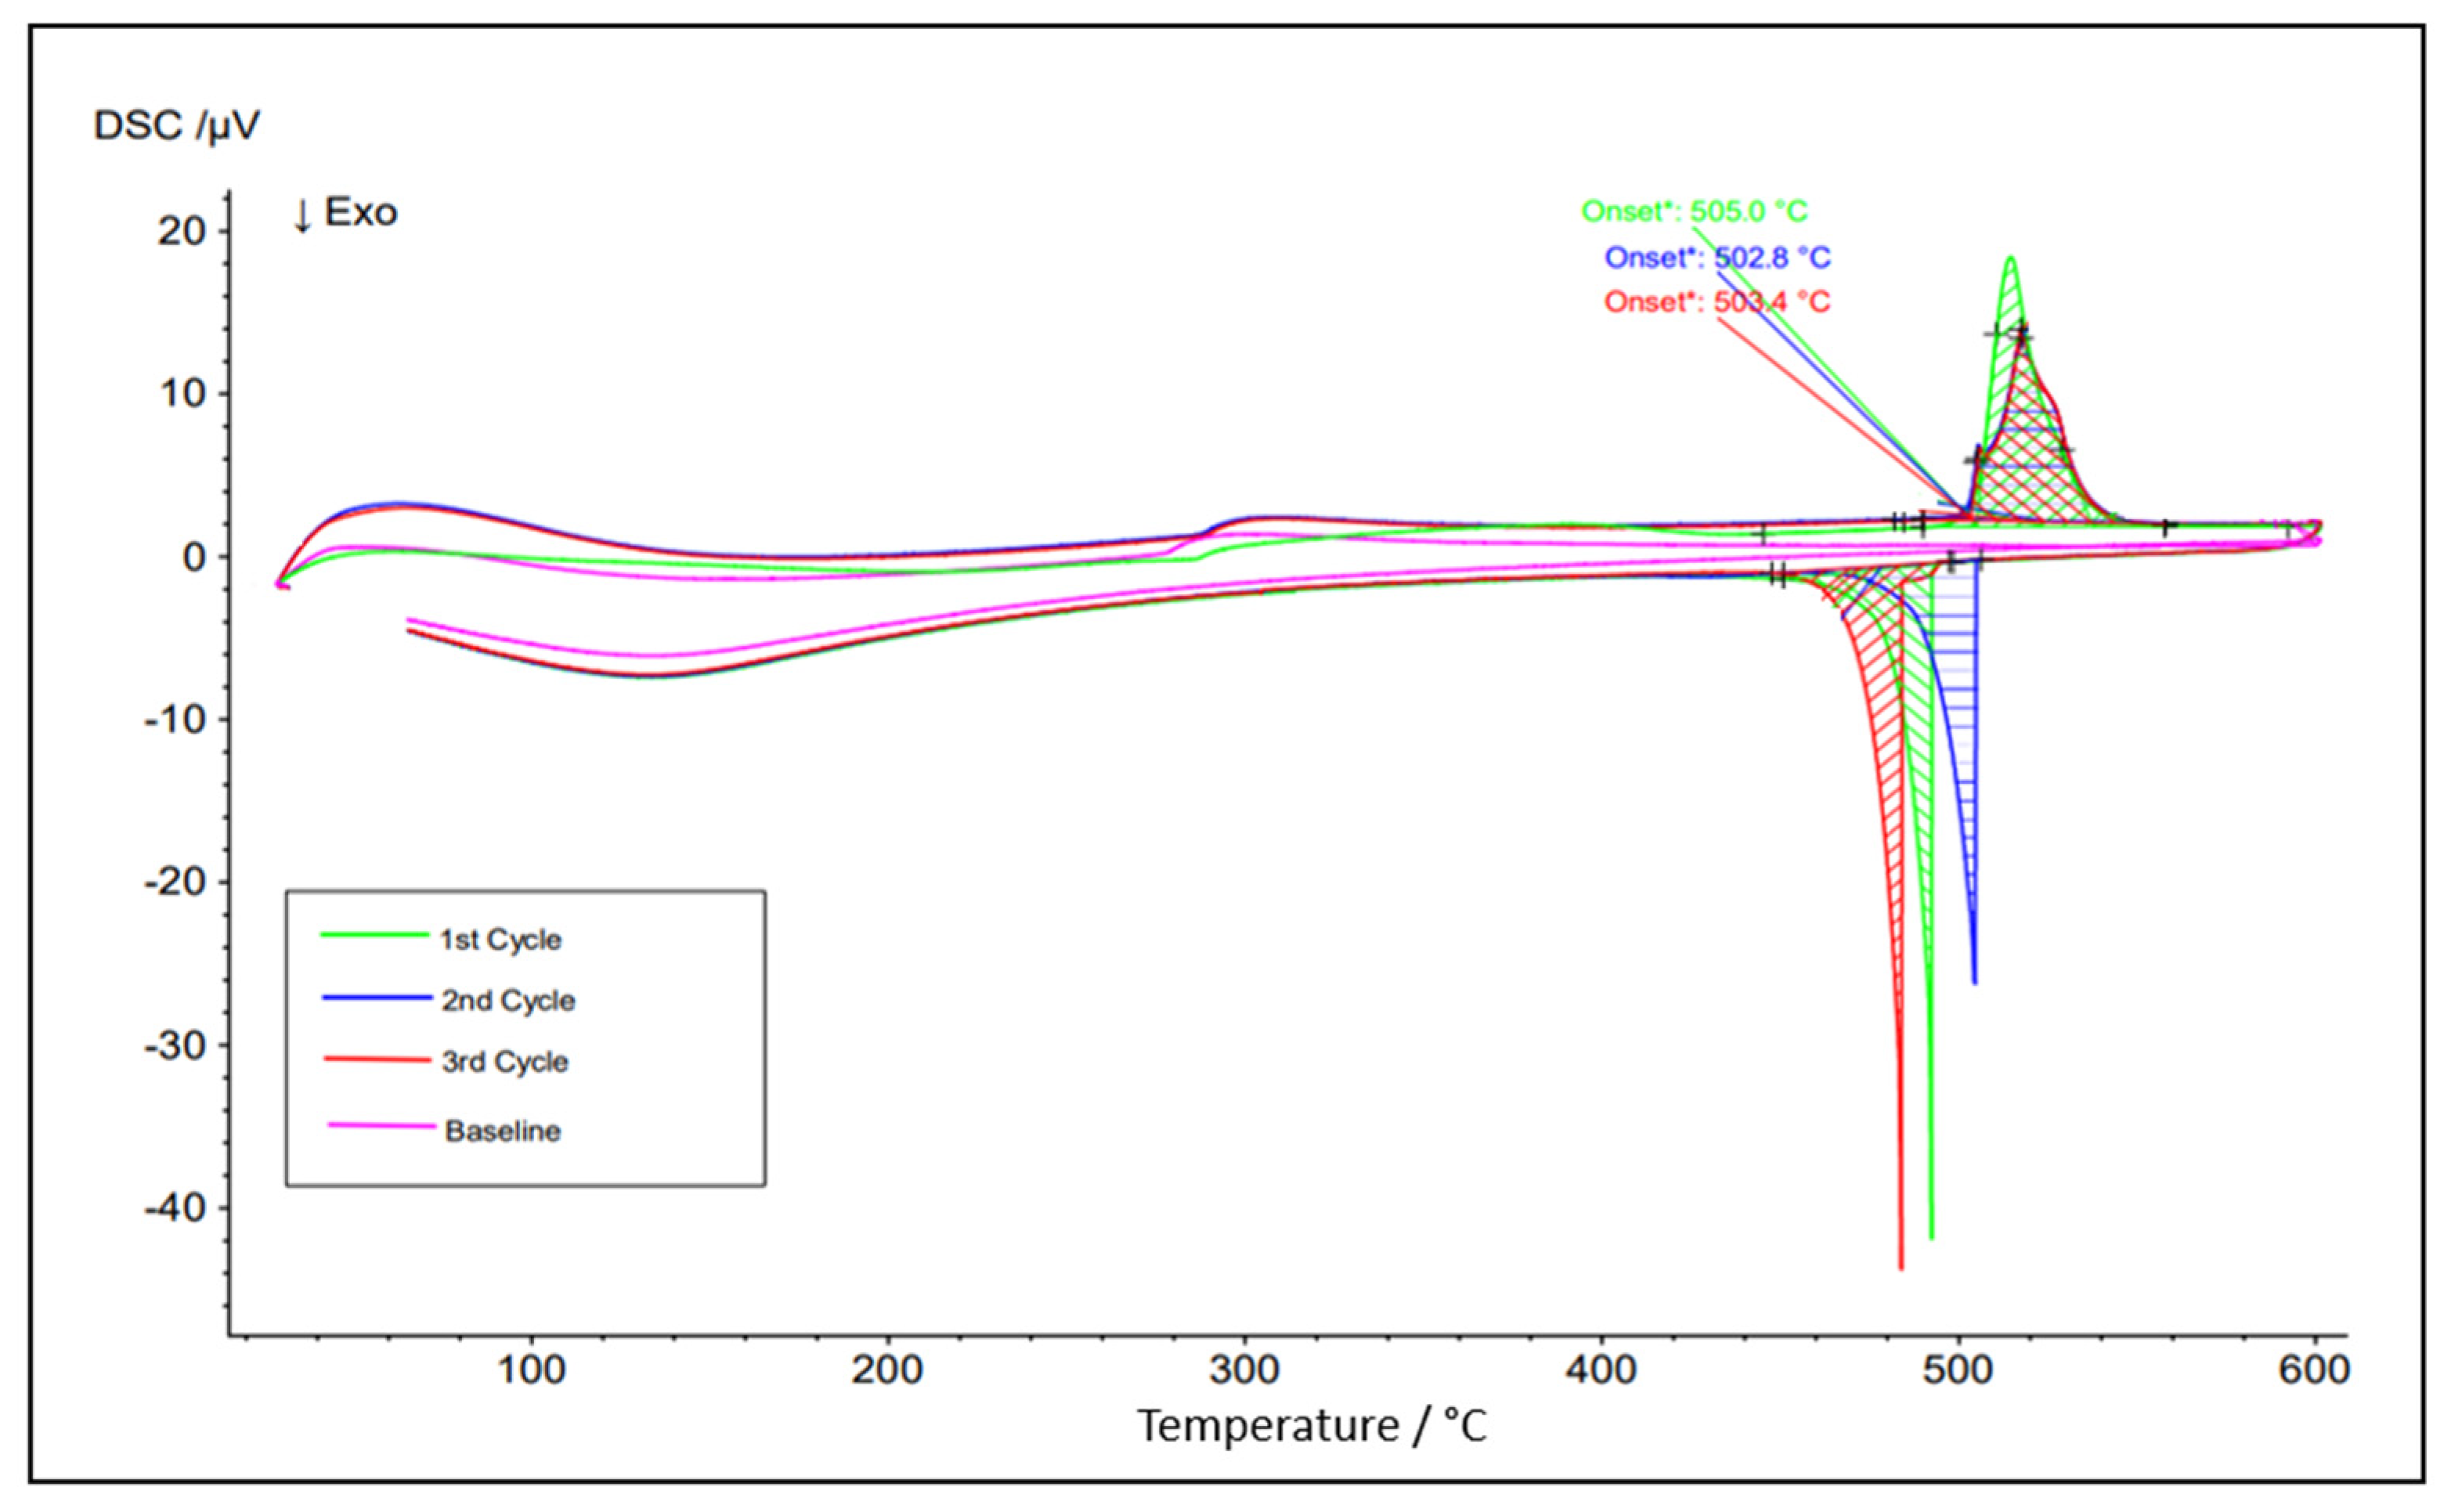
Figure 11.
Dissolved Na metal in selected NaCl-CaCl2-BaCl2 (37.1-44.9-18.0 mol%) molten salt electrolyte at 600°C with measurement error bar versus time. The measurement error bars are very small compared to the concentrations of dissolved Na.
Figure 11.
Dissolved Na metal in selected NaCl-CaCl2-BaCl2 (37.1-44.9-18.0 mol%) molten salt electrolyte at 600°C with measurement error bar versus time. The measurement error bars are very small compared to the concentrations of dissolved Na.
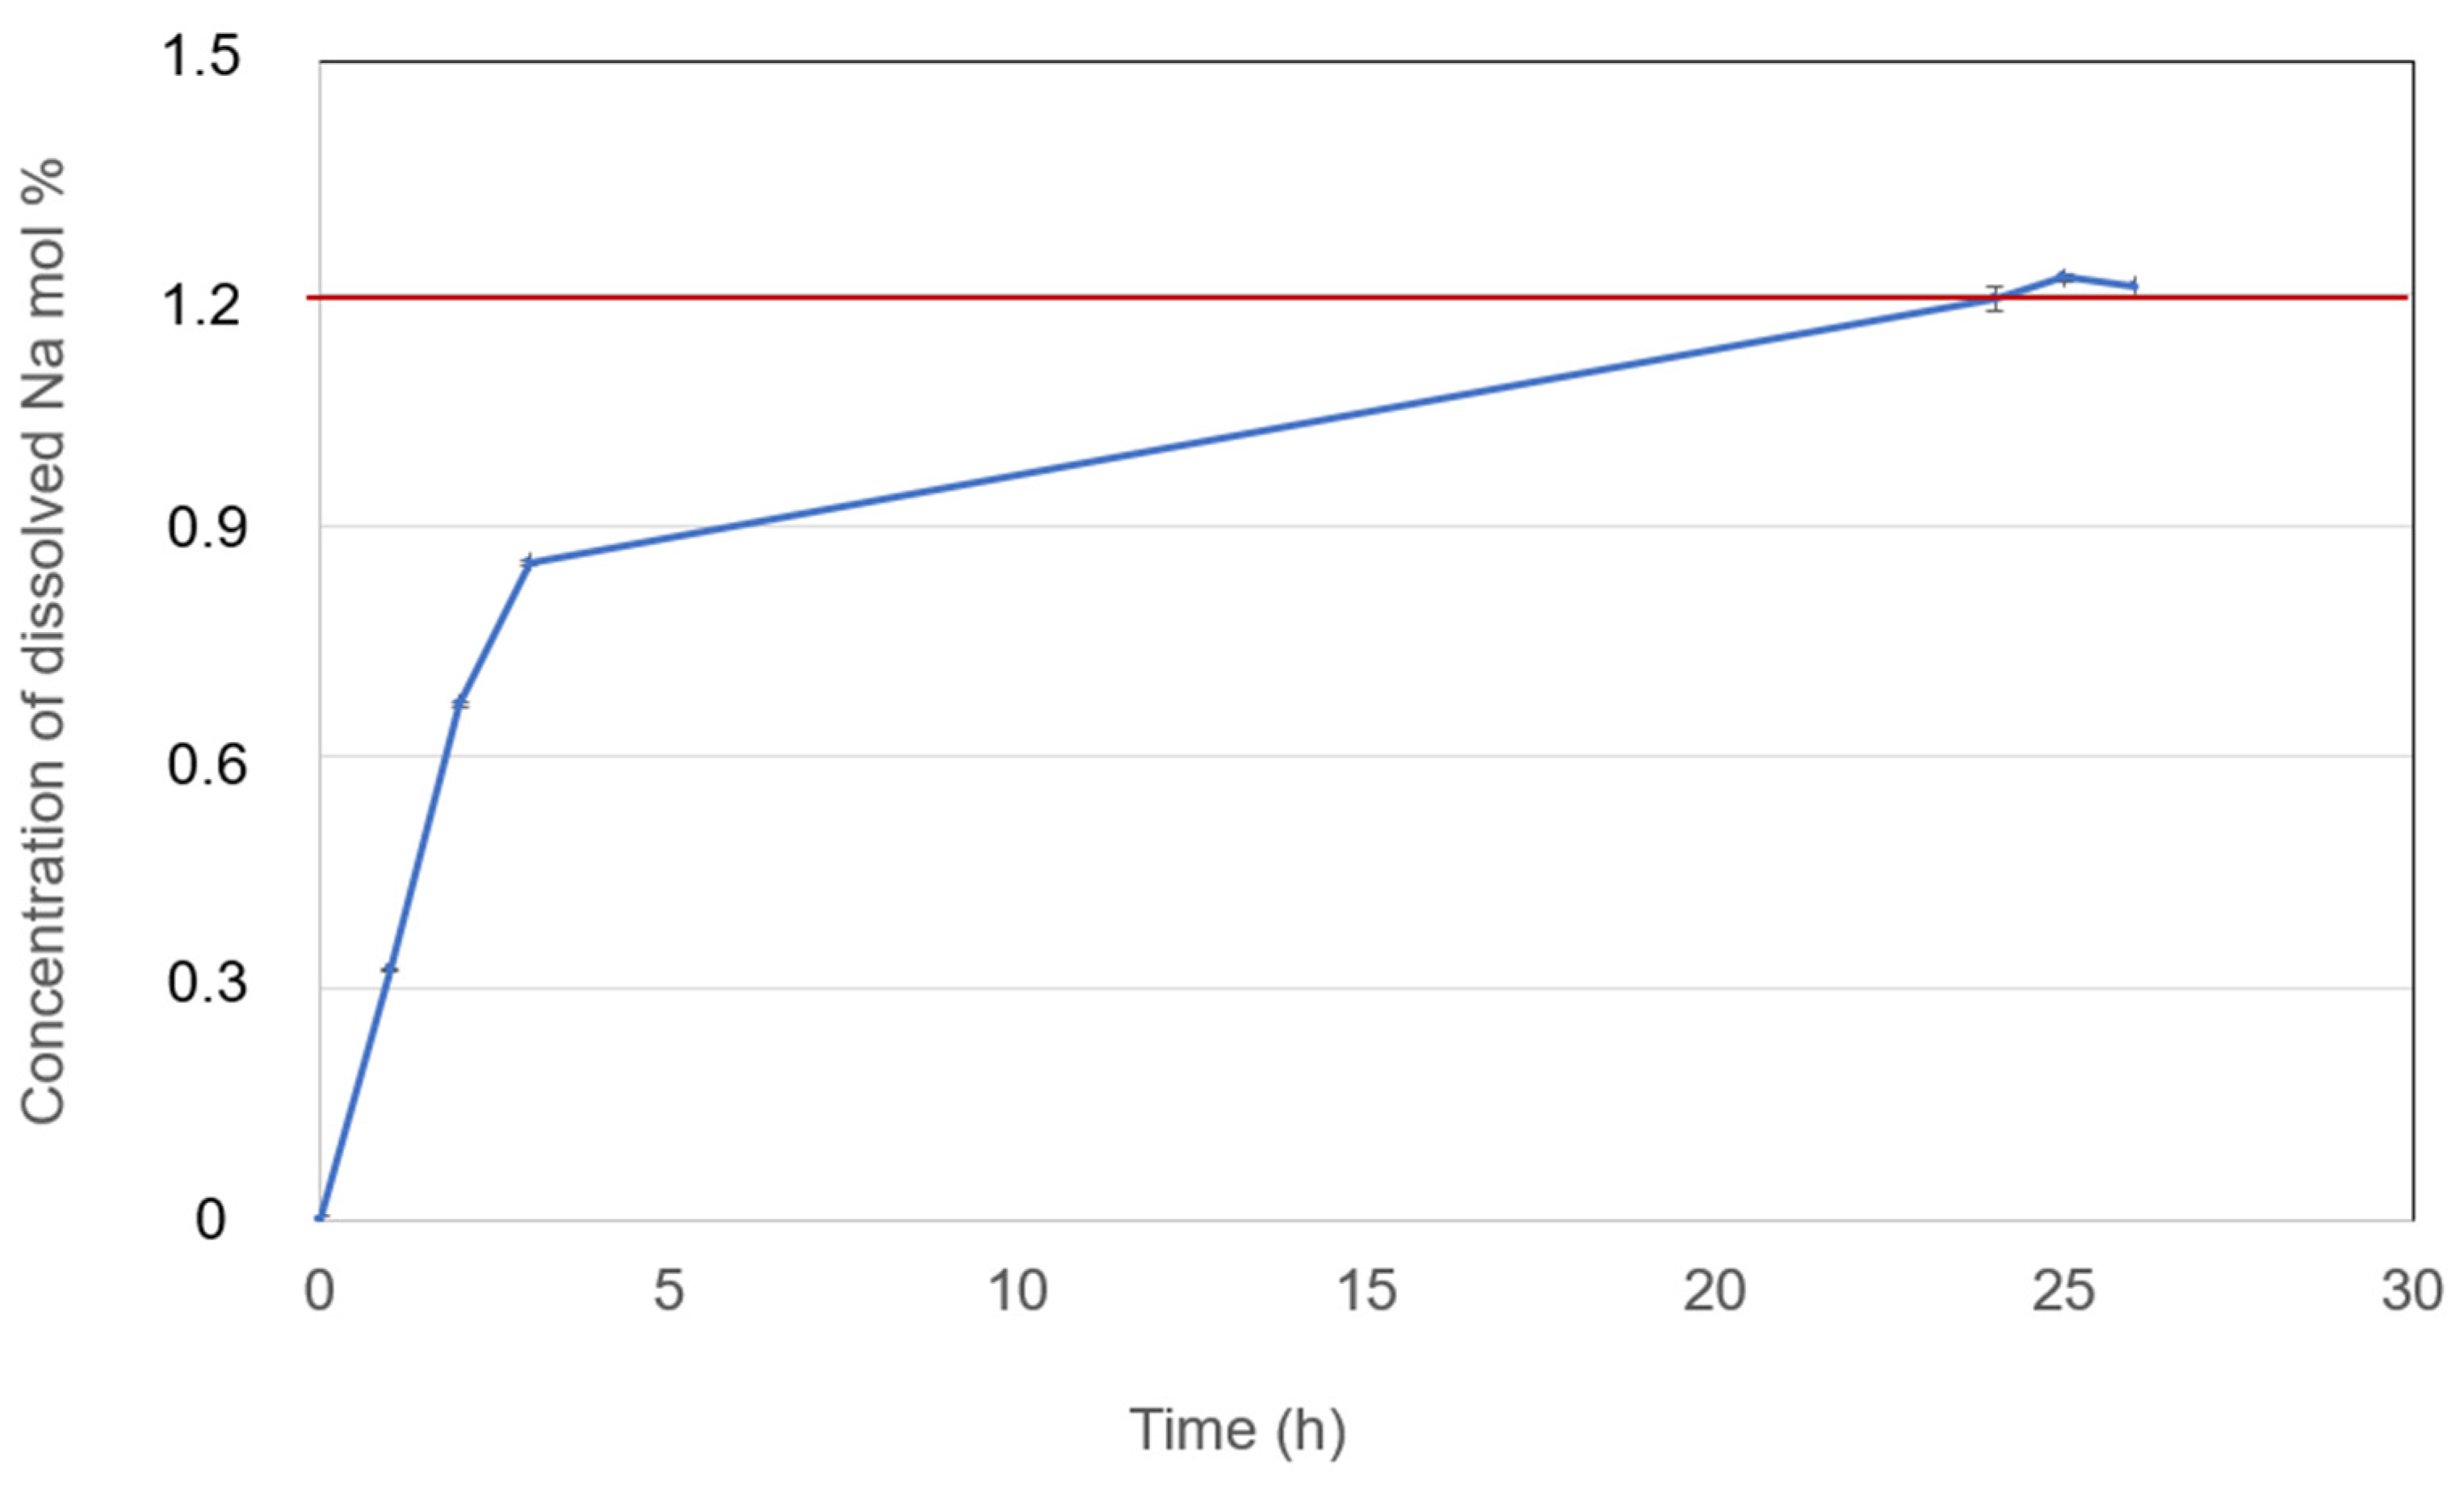
Figure 12.
Dissolved Na metal in selected NaCl-SrCl2-KCl (30.0-26.5-43.5 mol%) molten salt electrolyte at 600°C with measurement error bar versus time.
Figure 12.
Dissolved Na metal in selected NaCl-SrCl2-KCl (30.0-26.5-43.5 mol%) molten salt electrolyte at 600°C with measurement error bar versus time.
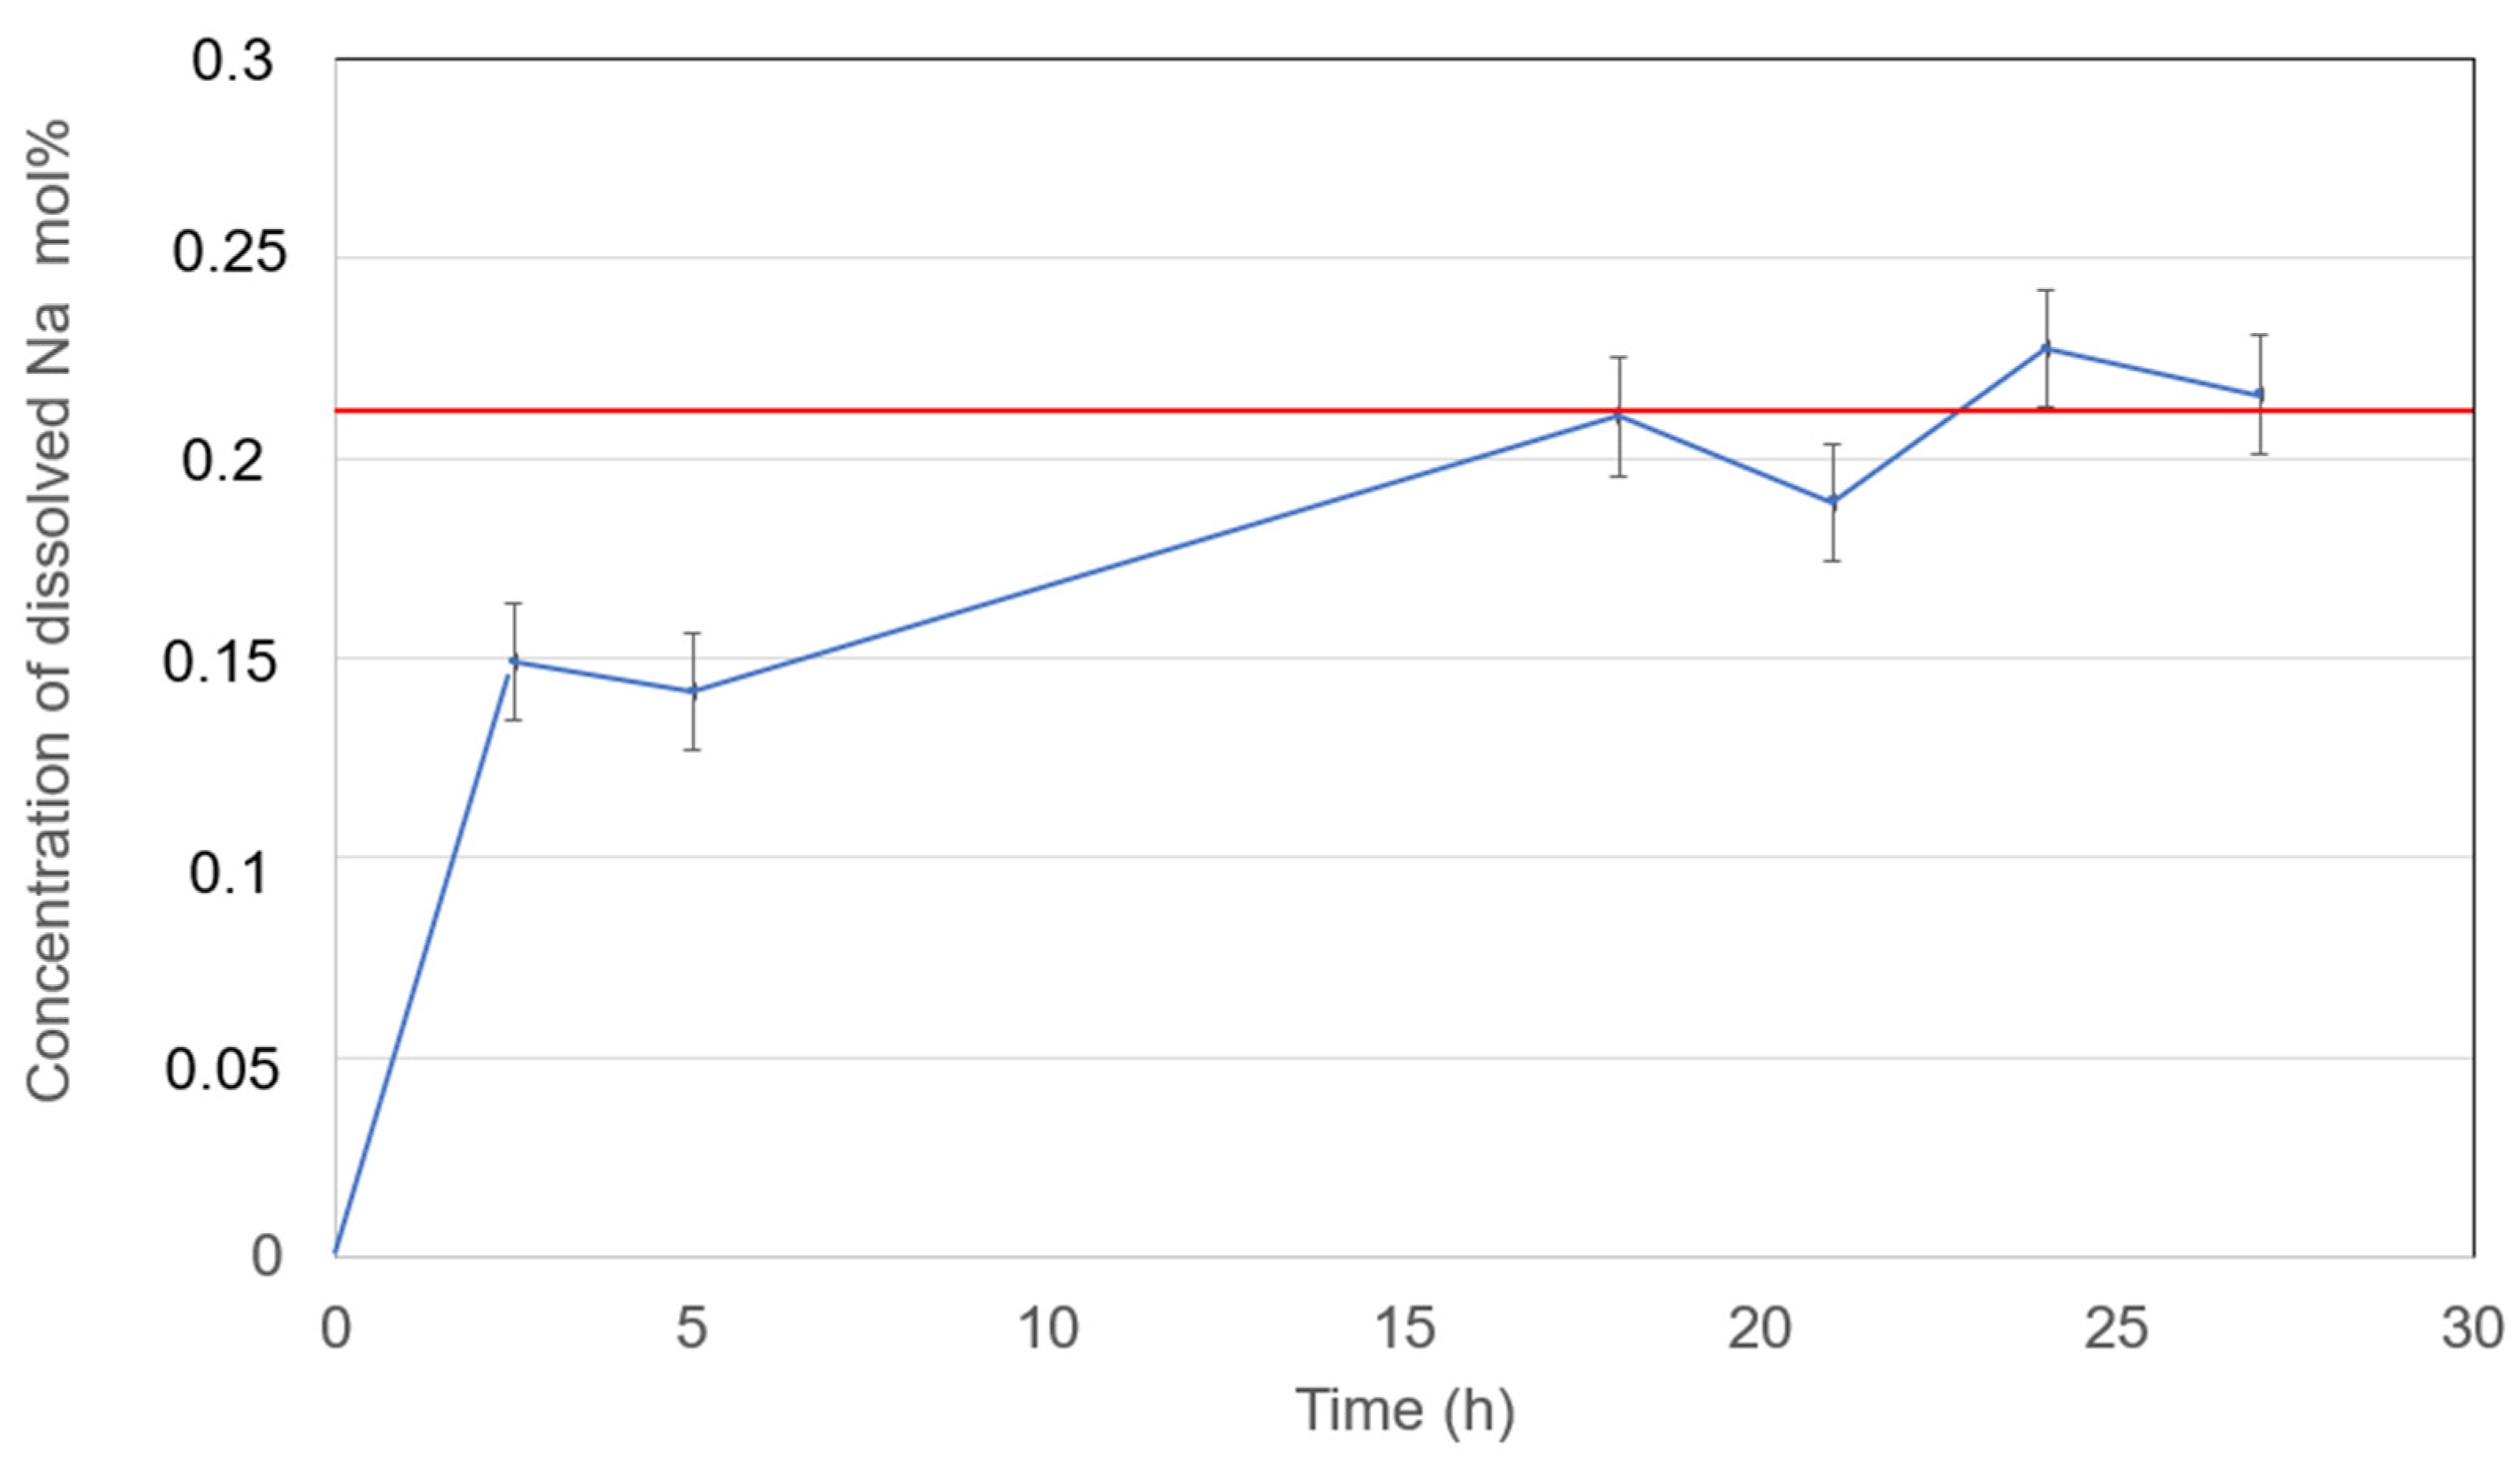
Figure 13.
Dissolved Zn metal in eutectic NaCl-CaCl2-BaCl2 (37.1-44.9-18.0 mol%) at 600°C with measurement error bar versus time.
Figure 13.
Dissolved Zn metal in eutectic NaCl-CaCl2-BaCl2 (37.1-44.9-18.0 mol%) at 600°C with measurement error bar versus time.
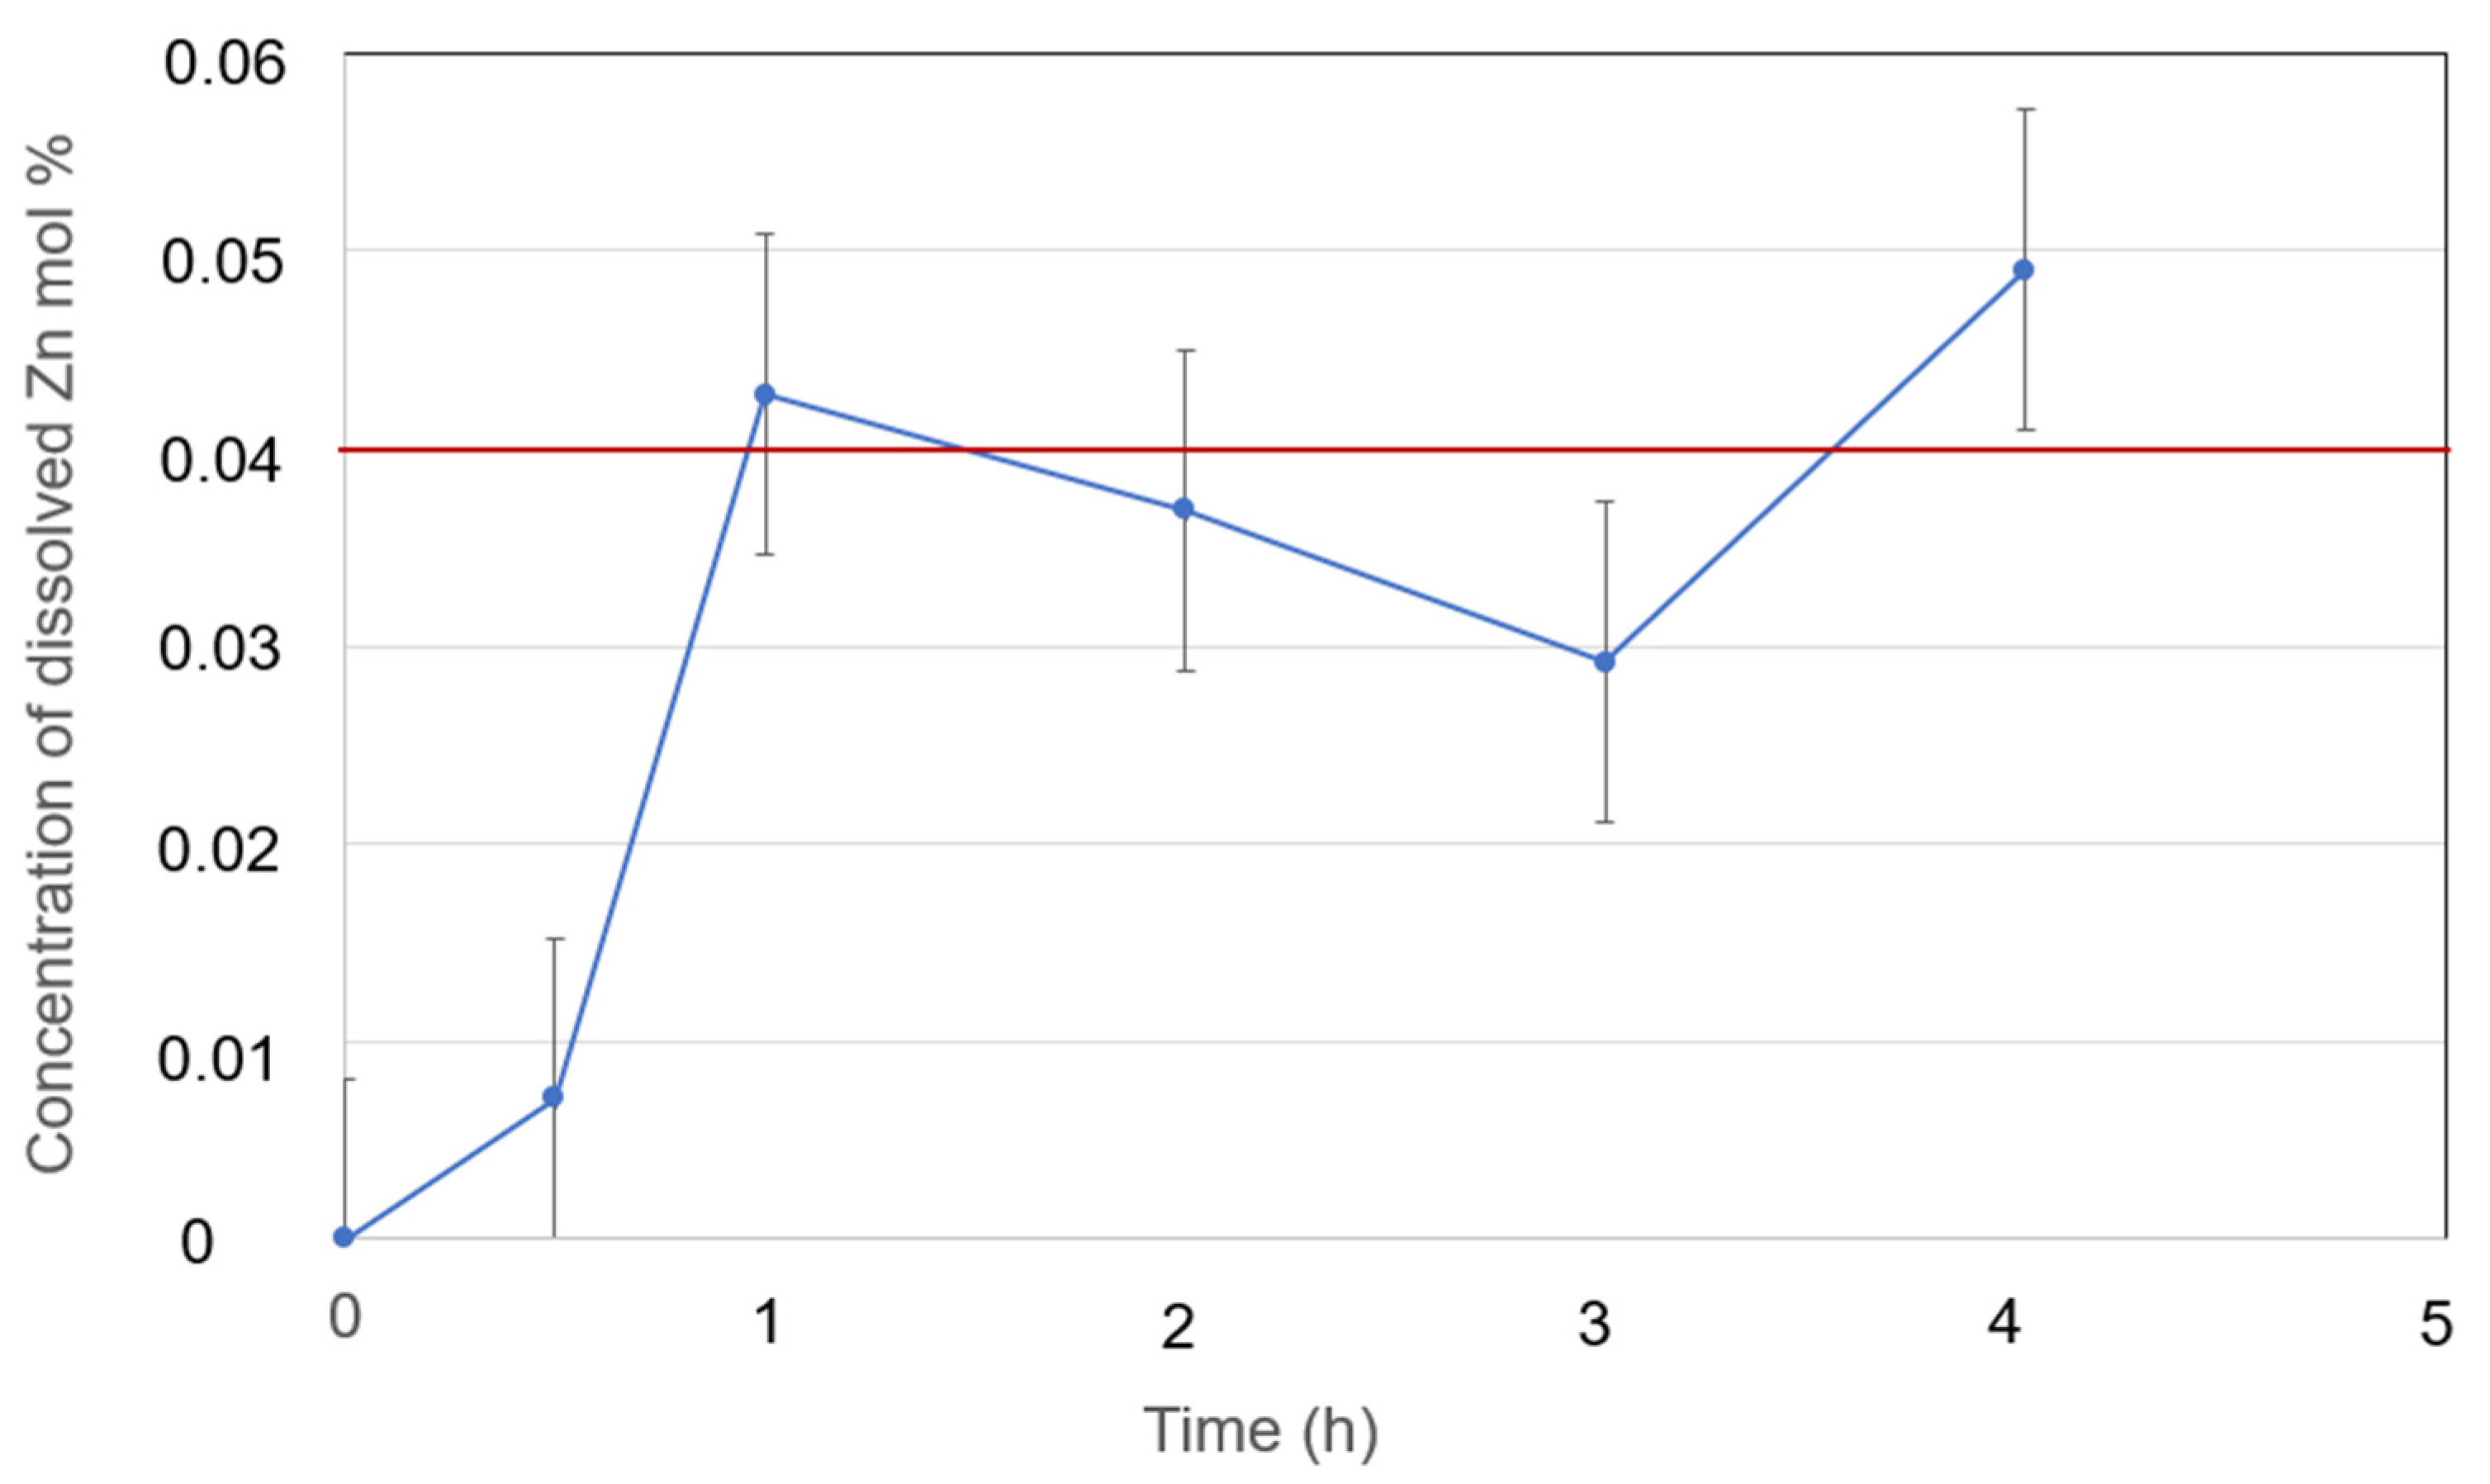
Figure 14.
Dissolved Zn metal in eutectic NaCl-SrCl2-KCl (30.0-26.5-43.5 mol%) at 600°C with measurement error bar versus time.
Figure 14.
Dissolved Zn metal in eutectic NaCl-SrCl2-KCl (30.0-26.5-43.5 mol%) at 600°C with measurement error bar versus time.
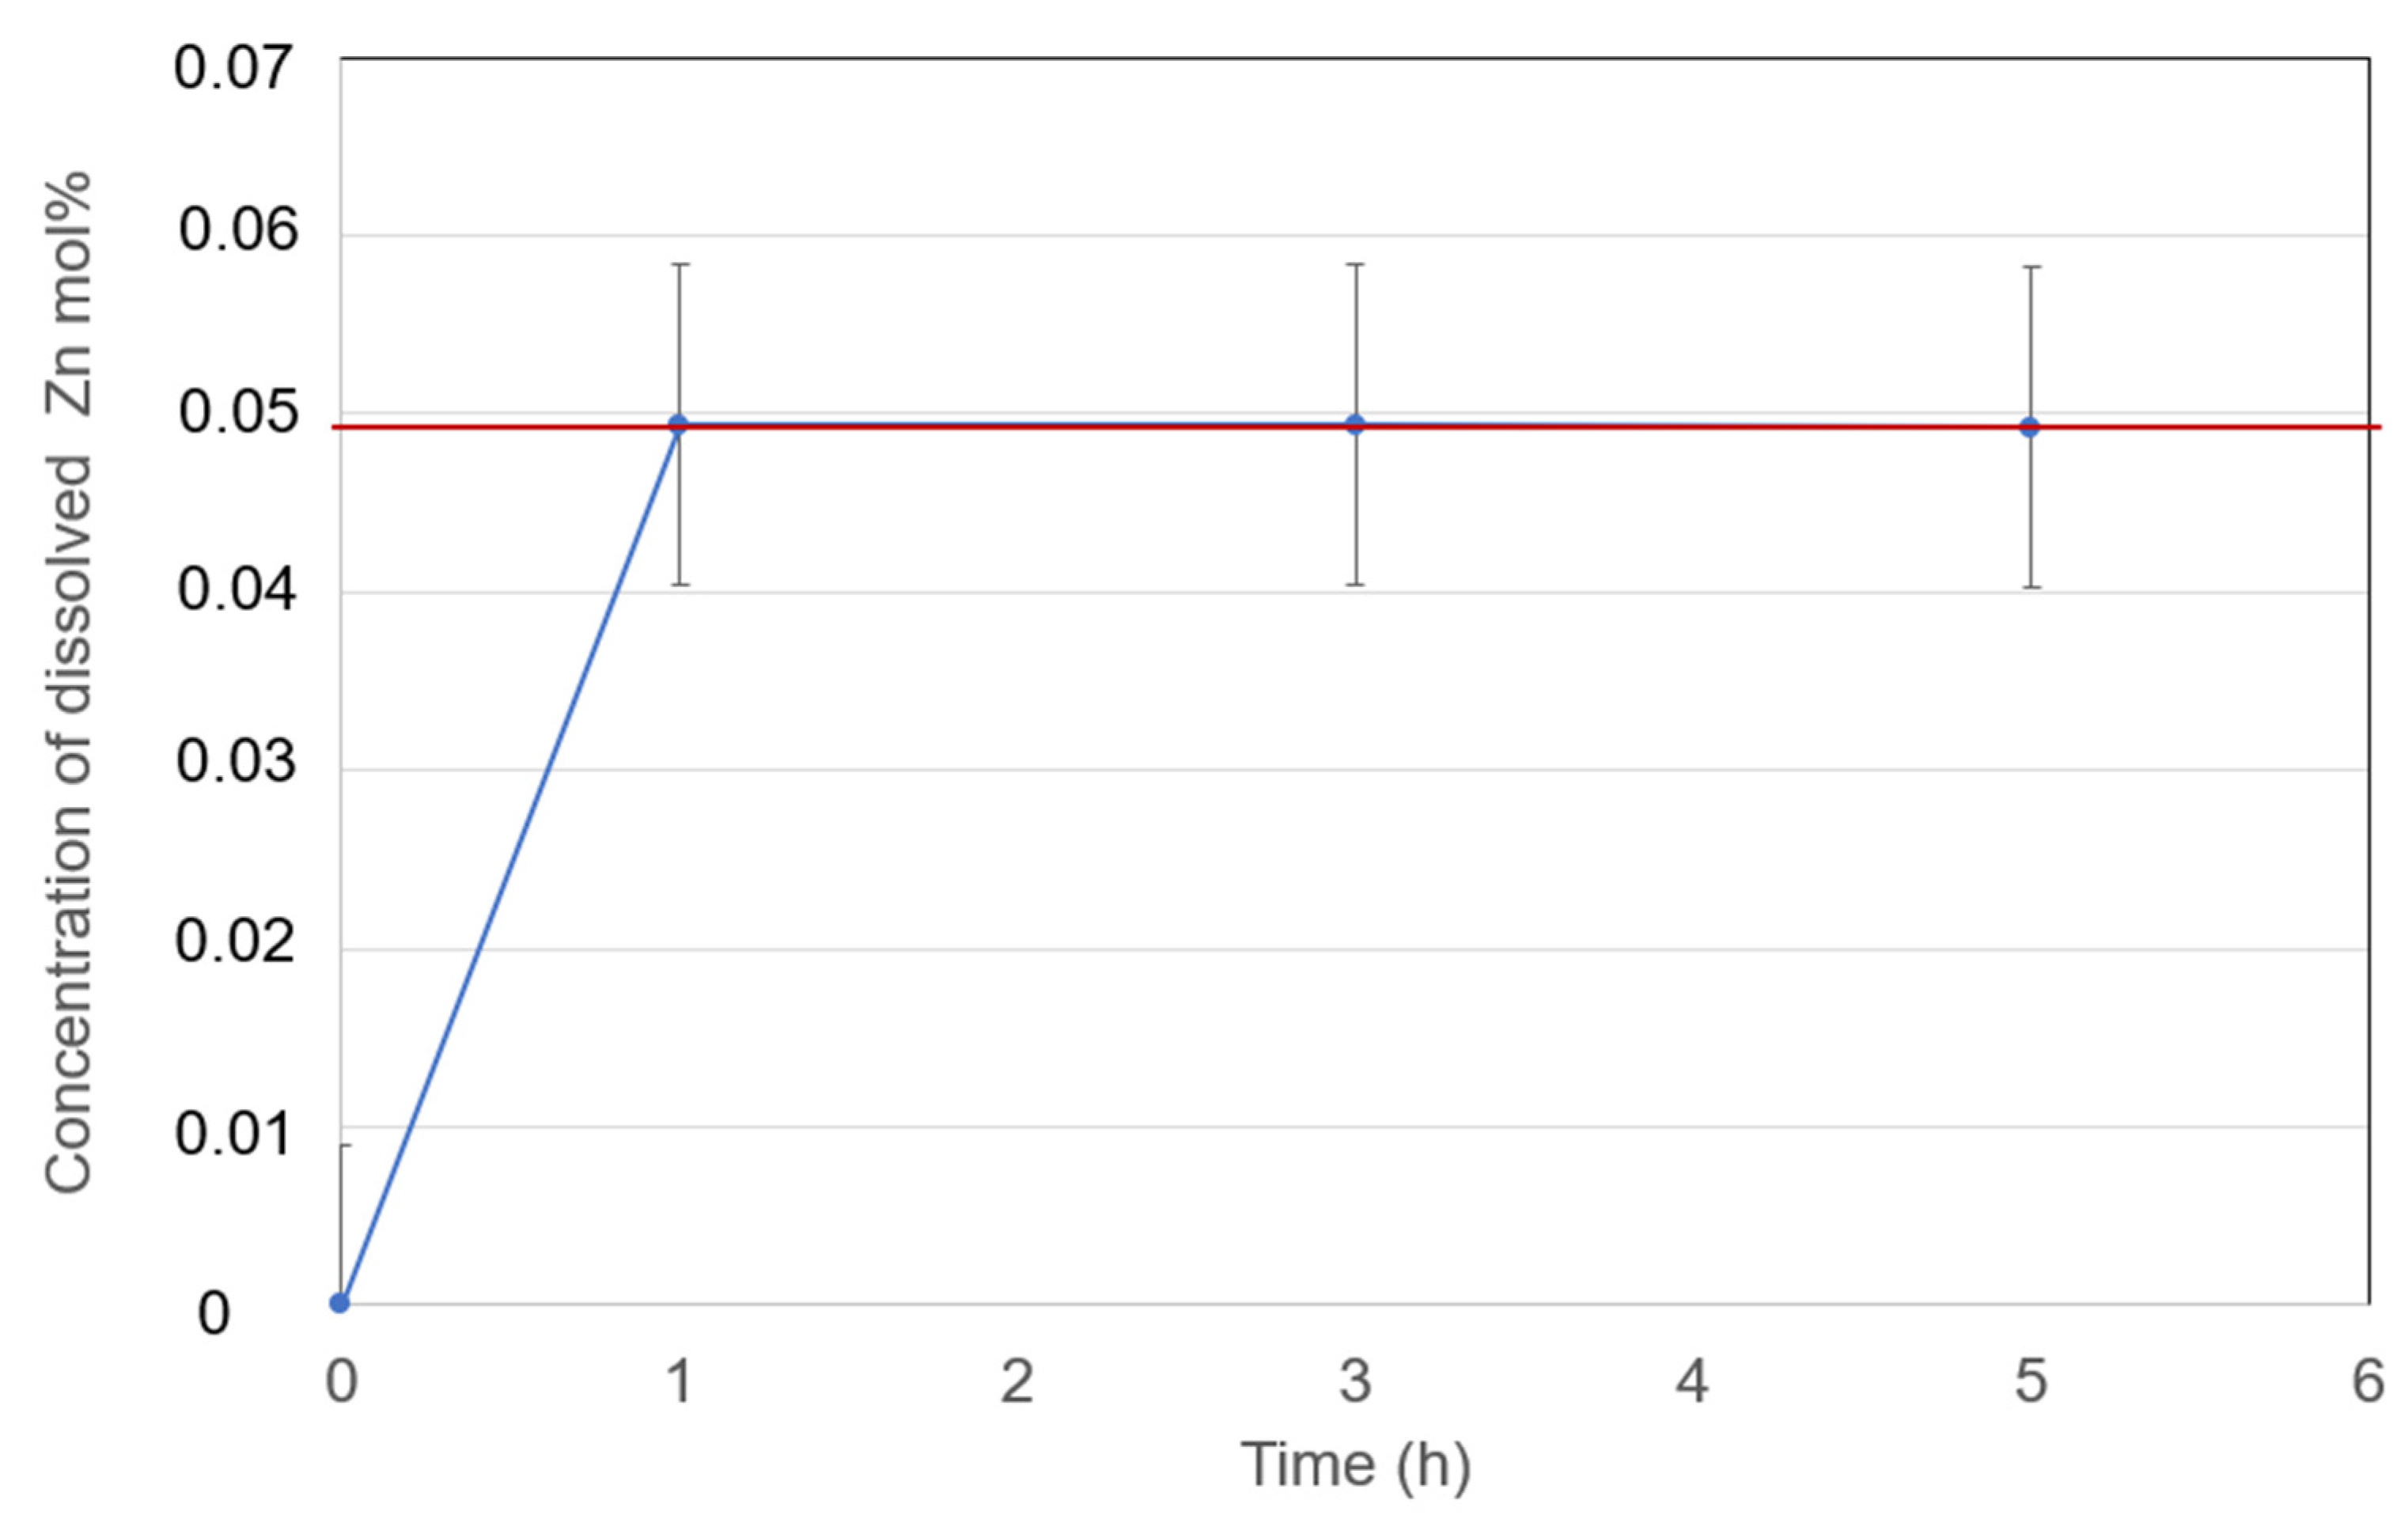

Table 1.
Comparison of simulated eutectic temperatures and salt compositions of selected binary systems with literature.
Table 1.
Comparison of simulated eutectic temperatures and salt compositions of selected binary systems with literature.
| Binary system | Eutectic temperature (°C) | Eutectic composition (NaCl mol %) | Soruce |
|---|---|---|---|
| NaCl-CaCl2 | 506 | 48 % | This work |
| NaCl-CaCl2 | 508 | 50 % | [22] |
| NaCl-CaCl2 | 500 | 48 % | [23] |
| NaCl-BaCl2 | 650 | 60 % | This work |
| NaCl-BaCl2 | 654 | 61 % | [24] |
| NaCl-SrCl2 | 560 | 48 % | This work |
| NaCl-SrCl2 | 560 | 48 % | [25] |
| NaCl-KCl | 660 | 50 % | This work |
| NaCl-KCl | 685 | 50 % | [23] |
Table 2.
Simulated eutectic temperatures and salt compositions of selected ternary systems.
| Ternary systems | Min. melting temperature (°C) | Eutectic composition (mol %) | Soruce |
|---|---|---|---|
| NaCl-CaCl2-BaCl2 | 446 | 37.1-44.9-18.0 | This work, FactSage |
| NaCl-CaCl2-BaCl2 | 454 | 37.1-44.9-18.0 | This work, DSC |
| NaCl-CaCl2-SrCl2 | 448 | 37.7-40.4-21.9 | This work, FactSage |
| NaCl-CaCl2-SrCl2 | 471 | 41.9-40.6-18.1 | [25] |
| NaCl-CaCl2-KCl | 481 | 40.0-51.4-8.6 | This work, FactSage |
| NaCl-CaCl2-KCl | 504 | 42-52-6 | [24] |
| NaCl-SrCl2-BaCl2 | 555 | 45.6-43.0-11.4 | This work, FactSage |
| NaCl-SrCl2-KCl | 503 | 30.0-26.5-43.5 | This work, FactSage |
| NaCl-SrCl2-KCl | 503-505 | 30.0-26.5-43.5 | This work, DSC |
Table 3.
Comparison of theoretical (EMFs of metal chlorides at 600°C [11] and their large-scale costs [17].
| Metal chlorides | EMF (V) at 600 °C | Cost (USD/kg) |
|---|---|---|
| BaCl2 | 3.728 | ~ 0.5 |
| KCl | 3.658 | ~ 0.4 |
| SrCl2 | 3.612 | ~ 1* |
| CaCl2 | 3.462 | ~ 0.3 |
| NaCl | 3.424 | ~ 0.06 |
*common large-scale commercial price from Alibaba.com.
Table 4.
Comparison of Na solubilities in molten chlorides obtianed in this work and available in literature.
Table 4.
Comparison of Na solubilities in molten chlorides obtianed in this work and available in literature.
| Molten chlorides | Na solubility (mol.%) | Source |
|---|---|---|
| NaCl-CaCl2-BaCl2 (37.1-44.9-18.0 mol%) | 1.2 (600°C) | This work |
| NaCl-SrCl2-KCl (30.0-26.5-43.5 mol%) | 0.22 (600°C) | This work |
| NaCl-CaCl2 (eutectic) | ~3.3 (600°C) | [26] |
| NaCl | 2.1 (795°C) | [18] |
| LiCl-NaCl-KCl (59-5-36 mol%) | 0.09 (450°C), 0.15 (560°C), 0.18 (600°C) | [9] |
Table 5.
Comparison of Zn solubilities in molten salts obtianed in this work and available in literature, and Mg solubilities in molten salts available in literature.
Table 5.
Comparison of Zn solubilities in molten salts obtianed in this work and available in literature, and Mg solubilities in molten salts available in literature.
| Metal in molten salts | Metal solubility (mol.%) | Source |
|---|---|---|
| Zn in NaCl-CaCl2-BaCl2 (37.1-44.9-18.0 mol%) | 0.04 (600°C) | This work |
| Zn in NaCl-SrCl2-KCl (30.0-26.5-43.5 mol%) | 0.05 (600°C) | This work |
| Zn in ZnCl2 | 0.187 (498°C), 0.61 (600°C) | [27] |
| Zn in ZnI2 | 0.28 (498°C), 0.87 (600°C) | [27] |
| Mg in MgCl2 | 0.20-1.2 (714-900°C), 0.07 (600°C) | [18] |
Disclaimer/Publisher’s Note: The statements, opinions and data contained in all publications are solely those of the individual author(s) and contributor(s) and not of MDPI and/or the editor(s). MDPI and/or the editor(s) disclaim responsibility for any injury to people or property resulting from any ideas, methods, instructions or products referred to in the content. |
© 2025 by the authors. Licensee MDPI, Basel, Switzerland. This article is an open access article distributed under the terms and conditions of the Creative Commons Attribution (CC BY) license (http://creativecommons.org/licenses/by/4.0/).
Copyright: This open access article is published under a Creative Commons CC BY 4.0 license, which permit the free download, distribution, and reuse, provided that the author and preprint are cited in any reuse.


