
Submitted:
04 February 2025
Posted:
05 February 2025
You are already at the latest version
Abstract
Background
Pharmaceutical expenditures play a pivotal role in healthcare systems, serving as indicators of innovation, equity, and fiscal sustainability. In South Korea, policies such as the Economic Evaluation Exemption (EEE) and Risk-Sharing Agreements (RSAs) aim to enhance access to innovative therapies. At the same time, these policies address rising healthcare costs. However, disparities in expenditure allocation across therapeutic areas persist.
Methods
This retrospective observational study analyzes pharmaceutical expenditures in South Korea from 2007 to 2022, focusing on new chemical entities (NCEs). Data were sourced from the IQVIA MIDAS Global Database, WHO Global Burden of Disease (GBD) database, and South Korea’s National Health Insurance records. Expenditure patterns were benchmarked against OECD and A8 countries using metrics such as Disability-Adjusted Life Years (DALYs, a metric combining years lost due to premature death and disability)
Results
South Korea introduced 276 NCEs by 2022, representing significant growth but remaining below the OECD average. NCE expenditure increased from 10.0% to 16.0% of total pharmaceutical spending between 2017 and 2022, while the A8 average rose from 26.2% to 48.1%. Despite high oncology expenditure aligning with disease burden, chronic diseases—such as musculoskeletal and cardiovascular conditions—were underfunded relative to their DALYs.
Conclusions
South Korea has made notable progress in aligning pharmaceutical spending with public health priorities, particularly in oncology. However, further policy refinements are needed to optimize resource allocation for chronic diseases and achieve equitable, sustainable healthcare outcomes. Expanding RSA frameworks and adopting global best practices—such as increased transparency in expenditure allocation—could address existing gaps more effectively.
Keywords:
Pharmaceutical expenditures
; new chemical entities (NCEs)
; disease burden
; DALYs
; South Korea
; OECD
; health policy
; healthcare
Introduction
Pharmaceutical expenditures serve as a cornerstone of healthcare systems, acting as a barometer of both innovation and equity. These expenditures reflect a system’s capacity to provide timely access to effective therapies while maintaining fiscal sustainability. Globally, as healthcare systems grapple with rising costs and increasing complexity, aligning pharmaceutical spending with public health objectives has become crucial for achieving sustainable and equitable outcomes [1,2]. Recent analyses indicate that oncology drugs account for 45% of pharmaceutical expenditures across OECD countries, despite representing less than 15% of the total disease burden [3]. This discrepancy highlights the growing importance of prioritizing resource allocation based on disease burden metrics.
Since the implementation of National Health Insurance (NHI), South Korea has introduced various policies aimed at optimizing healthcare outcomes while controlling costs. Notable initiatives include the Economic Evaluation Exemption (EEE), designed to accelerate access to high-cost, innovative drugs, and Risk-Sharing Agreements (RSAs), which distribute financial risks among stakeholders. Despite these efforts, resource allocation disparities persist. Oncology therapies dominate pharmaceutical expenditures, often at the expense of chronic diseases such as cardiovascular and neurological disorders [4,5]. These policies, while reflecting the government’s proactive approach to balancing affordability with the need for cutting-edge treatments, require further evaluation to address systemic challenges and identify areas for improvement.
Previous research underscores the importance of aligning healthcare spending with disease burden indicators. Chronic diseases, such as cardiovascular and neurological disorders, collectively account for over 30% of disability-adjusted life years (DALYs—a measure combining years lost due to premature death and disability) globally but are frequently underfunded relative to their impact [6,7]. Similar patterns are observed in South Korea, where oncology therapies dominate pharmaceutical expenditures, despite significant disease burdens posed by other conditions.
To address these disparities, this study undertakes a longitudinal analysis of South Korea’s pharmaceutical expenditures from 2007 to 2022. Leveraging global metrics such as DALYs from the WHO Global Burden of Disease (GBD) database and detailed expenditure data from IQVIA MIDAS, the study benchmarks South Korea’s performance against OECD and A8 countries. This comparative perspective not only highlights systemic gaps but also evaluates the effectiveness of South Korea’s policies in optimizing resource allocation [8].
By providing actionable insights, this study aims to support evidence-based policy making that fosters greater alignment between pharmaceutical spending and disease burden. The findings have implications not only for South Korea but also for other nations striving to balance healthcare innovation with equity and sustainability.
Method
Study Design and Objectives
This study employs a retrospective observational design to examine pharmaceutical expenditures and their alignment with disease burden metrics in South Korea compared to OECD and A8 countries. The primary objective was to evaluate expenditure patterns for new chemical entities (NCEs) introduced between 2007 and 2022 and their correlation with Disability-Adjusted Life Years (DALYs). By doing so, this study aims to identify policy gaps and propose actionable strategies for equitable healthcare resource allocation.
Data Sources
To ensure a robust and comprehensive analysis, data was sourced from the following key resources:
- IQVIA MIDAS Global Database: Provided detailed information on pharmaceutical sales, including expenditures and volumes, for South Korea and comparator countries [9]. This database was accessed through a Third-Party Access (TPA) agreement facilitated by the Korea Research-based Pharmaceutical Industry Association (KRPIA). The TPA agreement ensured access to granular pharmaceutical expenditure data, enabling a comprehensive analysis of both total and NCE-specific expenditures in OECD and A8 countries. This process included verification of consistency with domestic data sources, achieving concordance rates of 96.8% for total pharmaceutical expenditures and 94.8% for NCE-specific expenditures.
- WHO Global Burden of Disease (GBD) Data: Offered metrics on DALYs and mortality rates, categorized by disease groups and geographies, facilitating the evaluation of healthcare needs across various conditions [10].
-
South Korean National Health Insurance Data: Included extensive records of reimbursed pharmaceutical expenditures and ATC classification codes, accessed via the Health Insurance Review and Assessment Service (HIRA) and the National Health Insurance Service (NHIS) [11].
- o Total Pharmaceutical Expenditures: Data were collected from publicly available sources, such as the "Annual Reports on Drug Expenditure Claims" by HIRA and statistical summaries from the Korean Statistical Information Service (KOSIS). These datasets were cross-referenced with IQVIA MIDAS data to validate their accuracy, achieving over 95% concordance between domestic and global records [12].
- o New Chemical Entities (NCEs): The list of reimbursed NCEs was derived from the Ministry of Food and Drug Safety (MFDS) approval records and the Ministry of Health and Welfare (MoHW) reimbursement notifications [13]. Expenditure data for NCEs were initially obtained with the cooperation of the Korea Research-based Pharmaceutical Industry Association (KRPIA). Subsequently, these data were validated against figures from the IQVIA MIDAS database, ensuring consistency and accuracy.
-
o Public Data References:
- ▪ Health Insurance Review and Assessment Service (HIRA): Annual Reports on Drug Expenditure Claims [14].
- ▪ National Health Insurance Service (NHIS): Statistical Yearbook [15].
- ▪ Korean Statistical Information Service (KOSIS): National Statistics Database [16].
- ▪ Ministry of Food and Drug Safety (MFDS): Approval Records for Pharmaceuticals [17].
- ▪ Ministry of Health and Welfare (MoHW): Reimbursement Notifications [18].
For comparator countries (OECD and A8), all pharmaceutical expenditure and NCE-specific data were sourced exclusively from IQVIA MIDAS to maintain consistency and comparability in international analyses [19]. To align with the study’s scope, the analysis focused on expenditures within public reimbursement schemes, ensuring comparability across ATC classifications (Class I–III) and analysis periods.
Study Scope
The scope of the study was defined as follows:
- Geographic Scope: South Korea, 25 OECD countries (excluding South Korea), and eight high-income A8 countries (Canada, France, Germany, Italy, Japan, Switzerland, the United Kingdom, and the United States).
- Analysis Period: The analysis covered data from 2007 to 2022, with a particular focus on the most recent six years (2017–2022) to capture contemporary trends and patterns.
- Study Population: The study population comprised all NCEs introduced into public reimbursement schemes during the analysis period. These were identified based on ATC classifications and regulatory approvals as novel active substances.
Analytical Framework
The following analytical approaches were utilized to address the study objectives:
- Therapeutic Categorization: NCEs were classified using the WHO ATC system, enabling consistent comparisons across countries and therapeutic areas [20].
- Key Metrics: Pharmaceutical expenditures were analyzed as a proportion of total healthcare spending and assessed for alignment with disease burden metrics, including DALYs and mortality rates [21].
- Comparative Analysis: Descriptive statistics and trend analyses were conducted to benchmark South Korea’s expenditure patterns against OECD and A8 countries. Data normalization accounted for population size and GDP differences, allowing for meaningful cross-country comparisons [22].
Statistical Methods
Descriptive analyses summarized trends in pharmaceutical expenditures and their alignment with DALYs. Cross-country comparisons employed mean expenditure ratios and standard deviations to evaluate South Korea’s relative performance. While this study relied primarily on descriptive statistics due to its full-population analysis, supplementary regression analyses were used to explore the relationships between expenditure allocations and disease burden, with DALYs serving as the primary measure of disease impact [23].
This methodological framework ensures robust and transparent analyses, offering actionable insights for policymakers to optimize healthcare resource allocation and align expenditures with public health priorities.
Result
3.1. Overview of Analyzed Pharmaceuticals
This study focused on new chemical entities (NCEs) introduced into public insurance schemes between 2007 and 2022 in South Korea and comparator countries. By 2022, South Korea had introduced 276 NCEs, while OECD countries collectively introduced 639 NCEs. Over the recent six years (2017–2022), South Korea introduced 117 NCEs, averaging 19.5 per year, compared to 313 NCEs (52.2 per year) in OECD countries. These figures underscore a growing emphasis on innovative therapies in South Korea, despite its NCE adoption rate remaining lower than the OECD average. Addressing this disparity may require enhanced policies to accelerate the adoption of innovative treatments.
3.2. Total Pharmaceutical Expenditures and NCE Spending
Between 2017 and 2022, domestic pharmaceutical expenditures in South Korea increased from KRW 16.2 trillion to KRW 23 trillion. However, the share of pharmaceutical expenditure as a percentage of total healthcare spending decreased slightly from 25.1% in 2017 to 23.5% in 2022. NCE spending rose from KRW 1.6 trillion in 2017 (10.0% of total pharmaceutical spending and 2.5% of total healthcare spending) to KRW 3.7 trillion in 2022 (16.0% of total pharmaceutical spending and 3.8% of total healthcare spending). These trends demonstrate a growing prioritization of innovative therapies in South Korea, albeit at a slower pace compared to global peers (Refer to Table 1).
Analyzing OECD countries, total pharmaceutical expenditures rose from USD 2,316 billion during 2017–2019 to USD 2,765 billion during 2020–2022. NCE spending increased significantly during this period, from USD 806 billion (34.8% of total spending) in 2017–2019 to USD 1,404 billion (50.8% of total spending) in 2020–2022. The compound annual growth rate (CAGR) for NCE spending was 13.7%, reflecting an intensified focus on innovative treatments (Refer to Table 2). These findings highlight the strategic financial reallocation toward cutting-edge therapies in OECD countries.
Compared to A8 countries, South Korea’s NCE expenditure as a share of total pharmaceutical spending remains relatively lower. Between 2017 and 2022, South Korea’s NCE expenditure share increased from 10.0% to 16.0%. However, A8 countries showed a more significant increase during the same period, from 26.2% to 48.1%, averaging 38.0%. This disparity underscores structural differences in NCE spending, with South Korea exhibiting relatively constrained allocations due to possible systemic or budgetary limitations (Refer to Figure 1). Addressing these disparities may require policy adjustments to enhance financial prioritization of innovative therapies.
3.3. WHO Burden of Disease (GBD) Analysis
Major Causes of Death (Deaths Variable)
An analysis of major causes of death between 2017 and 2022, using Global Burden of Disease (GBD) indicators, identified malignant neoplasms (cancers) and cardiovascular diseases as the leading causes of death in both South Korea and A8 countries.
In South Korea, cancer accounted for 30.2% of deaths, followed by cardiovascular diseases (23.3%), neurological disorders (9.4%), respiratory infections and tuberculosis (8.1%), diabetes and kidney diseases (6.2%), and digestive diseases (4.9%).
Similarly, in A8 countries, cancer (27.3%) and cardiovascular diseases (26.9%) dominated as primary causes of death. Respiratory infections and tuberculosis (11.7%), neurological disorders (10.0%), and chronic respiratory diseases (5.2%) were additional significant contributors. Notably, chronic respiratory diseases were more prevalent in the US and UK, while digestive diseases were disproportionately higher in France (Refer to Figure 2). These patterns highlight geographic and systemic differences in public health priorities and disease management.
Disability-Adjusted Life Year (DALY) Analysis
The Disability-Adjusted Life Year (DALY) metric, developed by the WHO, integrates both premature mortality and years lived with disability to measure the overall disease burden. This study used GBD 2021 data at Level 2 classification (22 groups) to compare South Korea and A8 countries.
Between 2017 and 2022, cancer-related diseases exhibited the highest DALY share across all regions, averaging 17.4%. In South Korea, cancer accounted for 17.0% of DALY, followed by musculoskeletal disorders (13.1%), cardiovascular diseases (11.7%), and diabetes and kidney diseases (8.1%).
In A8 countries, cardiovascular diseases had a higher DALY share (14.4%), followed by musculoskeletal disorders (10.3%). Mental health disorders and neurological diseases were also significant, contributing 7.9% and 8.2%, respectively, to the total burden (Refer to Figure 3). These findings suggest that while cancer dominates the disease burden in South Korea, cardiovascular and mental health conditions may demand greater attention in A8 countries due to their higher relative impact.
3.4. Therapeutic Area-Specific NCE Expenditures
An analysis of therapeutic area-specific expenditures in South Korea between 2017 and 2022, based on the ATC (Anatomical Therapeutic Chemical) classification, shows that total pharmaceutical spending reached KRW 117.8 trillion, of which NCEs accounted for KRW 15.85 trillion or 13.5%.Among therapeutic areas, antineoplastic agents (ATC Class L) dominated NCE spending, representing 46.2% of the KRW 14.7 trillion spent on this category, with 98 NCEs listed. Alimentary tract and metabolism drugs (ATC Class A) and genitourinary system drugs (ATC Class G) followed, with NCE expenditure shares of 16.0% and 18.3%, respectively. In contrast, cardiovascular system drugs (ATC Class C) and miscellaneous agents (ATC Class V) had the lowest shares, at 2.4% and 0.2%, respectively. NCE listings were also concentrated in antineoplastic agents (35.5%), followed by alimentary tract and metabolism drugs (15.2%) and anti-infectives (12.0%) (Refer to Table 3).
In OECD countries, therapeutic area analysis revealed total pharmaceutical spending of USD 508.1 billion, with USD 221.0 billion allocated to NCEs, accounting for 33.9% of total spending. Anti-infectives (ATC Class J) had the highest NCE share at 79.2%, followed by blood and blood-forming organs (ATC Class B) at 66.3% and antineoplastic agents at 54.4% (Refer to Table 4).
In A8 countries, total pharmaceutical spending reached USD 457.5 billion, with USD 202.5 billion allocated to NCEs (44.3%). Anti-infectives (ATC Class J) again had the highest NCE share at 79.1%, followed by blood and blood-forming organs (67.9%) and antineoplastic agents (54.3%).
When comparing OECD, A8 countries, and South Korea, distinct differences in NCE spending were observed. For example, in alimentary tract and metabolism drugs (ATC Class A), OECD total pharmaceutical spending was USD 78.5 billion, of which USD 32.6 billion was allocated to NCEs, while South Korea spent USD 1.4 billion in this category, with NCEs accounting for USD 0.22 billion. Similarly, for antineoplastic agents, OECD countries allocated USD 68.8 billion to NCEs out of USD 126.6 billion total pharmaceutical spending, while South Korea spent USD 0.52 billion out of USD 1.1 billion. These disparities highlight structural differences in therapeutic area-specific spending (Refer to Figure 4). Addressing these differences may require targeted policies to prioritize therapeutic areas with lower NCE spending and better align with public health needs.
3.5. NCE Classification and Therapeutic Area Expenditures
Among NCEs in South Korea, the majority (58.0%) were categorized under "below average weighted price" agreements, which reflect reduced pricing strategies. These agreements accounted for 51.6% of NCE expenditures. Economic evaluation-performed drugs represented 26.8% of NCEs and accounted for 41.5% of expenditures, while economic evaluation-exempt drugs comprised 11.6% of NCEs and contributed 4.7% of expenditures (Refer to Table 5).
At the therapeutic area level, oncology (ATC Class L) accounted for the highest number of NCEs (98) and the largest expenditure share (KRW 6.8 trillion). Among oncology-related NCEs, economic evaluation-performed drugs contributed KRW 3.7 trillion, while below average weighted price drugs accounted for KRW 2.3 trillion. In contrast, musculoskeletal therapies (ATC Class M) and cardiovascular therapies (ATC Class C) had significantly smaller shares of NCE spending, reflecting their lower prioritization in public healthcare spending (Refer to Table 6).
Risk-sharing agreement (RSA) drugs represented 21.4% of all NCEs and accounted for 28.4% of total NCE expenditures, indicating their critical role in improving access to high-cost, innovative therapies (Refer to Table 7). Orphan drugs, which are primarily used for rare diseases, accounted for 33.0% of NCEs and contributed 18.2% of total expenditures, with oncology therapies dominating both categories (Refer to Table 8). These trends highlight South Korea's focus on oncology and high-cost therapies but suggest potential gaps in funding for other therapeutic areas.
4. Discussion
The findings of this study provide valuable insights into the evolving pharmaceutical expenditure landscape in South Korea, particularly in relation to new chemical entities (NCEs) and their alignment with public health priorities. By benchmarking South Korea against OECD and A8 countries, the study identifies areas where resource allocation can be optimized to achieve equitable and sustainable healthcare outcomes.
Between 2017 and 2022, NCE expenditures in South Korea grew significantly, increasing from 10.0% to 16.0% of total pharmaceutical spending. However, this remains below the A8 countries’ average of 38.0% during the same period [24]. These findings highlight opportunities for South Korea to enhance access to high-impact treatments across a broader range of therapeutic areas [25].
While oncology treatments accounted for a substantial share of expenditures, chronic conditions such as musculoskeletal and respiratory diseases, which contribute significantly to disability-adjusted life years (DALYs), received comparatively lower allocations [26]. To address this misalignment, targeted investments in underfunded areas, such as cardiovascular and nervous system drugs, are necessary to comprehensively meet public health needs and foster sustainable healthcare outcomes [27].
Risk-sharing agreements (RSAs) and orphan drug policies have proven effective in enhancing access to critical therapies, particularly for oncology and rare diseases. RSA drugs represented 28.4% of total NCE expenditures, underscoring their role in mitigating the financial impact of high-cost treatments. Expanding RSA frameworks to include chronic conditions with high DALY burdens, such as musculoskeletal and cardiovascular diseases, could promote equity in healthcare access [28]. Additionally, streamlining approval processes for orphan drugs may incentivize innovation and address unmet medical needs [29].
Comparative analysis with OECD and A8 countries reveals valuable lessons for South Korea’s pharmaceutical policies. Outcome-based reimbursement models and dynamic pricing strategies adopted internationally could guide further refinements. Collaborative efforts with global health agencies and data-sharing platforms can help align South Korea’s policies with global best practices while tailoring them to local healthcare priorities [30].
Despite these valuable insights, this study has limitations. While South Korea's pharmaceutical data includes detailed classifications of NCEs based on registration types, RSA agreements, and orphan drug designations, similar granular data were not consistently available for OECD and A8 countries. In many cases, information on specific drug types or RSA agreements remains confidential due to proprietary agreements between governments and pharmaceutical companies. Future research could benefit from obtaining more detailed data on NCE classifications and special management contracts in other countries. Analyzing these classifications and agreements across therapeutic areas could provide deeper insights into the relationship between drug registration types, special management contracts, and pharmaceutical spending, offering a more comprehensive understanding of global practices.
5. Conclusion
This study highlights South Korea’s progress in aligning pharmaceutical expenditures with public health priorities, particularly through increased spending on new chemical entities (NCEs). However, disparities between spending and disease burden remain, especially for chronic conditions. Refining policies to optimize resource allocation and expanding mechanisms like risk-sharing agreements (RSAs) can enhance equity and sustainability. Future research could explore the impact of drug registration types and management contracts across countries to provide deeper insights into global practices. Collaborative efforts and continued innovation will be essential to achieving a balanced and sustainable healthcare system.
Author Contributions
Seung-Rae Yu (Main Author): Designed the study, conducted data analysis and interpretation, compiled the results, and led the manuscript writing process. Soo-Young Choi: Collected and validated data and assisted with manuscript review and editing.
Funding
This research was supported by the Korea Research-based Pharmaceutical Industry Association (KRPIA).
Data Availability Statement
The data presented in this study are available on request from the corresponding author due to confidentiality agreements and proprietary restrictions associated with specific datasets.
Acknowledgments
The authors have no acknowledgments to report.
Conflicts of Interest
The authors declare no conflicts of interest.
References
- Tichy EM, Hoffman JM, Suda KJ, et al. National trends in prescription drug expenditures and projections for 2022. Am J Health Syst Pharm, 2022. [CrossRef]
- Tichy EM, Hoffman JM, Tadrous M, et al. National trends in prescription drug expenditures and projections for 2023. Am J Health Syst Pharm. [CrossRef]
- Linnér L, Eriksson I, Persson M, Wettermark B. Forecasting drug utilization and expenditure: ten years of experience in Stockholm. BMC Health Serv Res. 2020;20(1):410. Published 2020 May 11. [CrossRef]
- Arinaminpathy N, Batra D, Maheshwari N, et al. Tuberculosis treatment in the private healthcare sector in India: an analysis of recent trends and volumes using drug sales data. BMC Infect Dis, 2019. [CrossRef]
- Meyers DE, Meyers BS, Chisamore TM, et al. Trends in drug revenue among major pharmaceutical companies: A 2010-2019 cohort study. Cancer. 2022;128(2):311-316. [CrossRef]
- Park J, Moon K, Kim DS. Health Care Utilization and Anti-Cancer Drug Expenditure for Six Solid Cancers in Korea From 2007 to 2019. Front Oncol, 2022. [CrossRef]
- Lee H, Park D, Kim DS. Determinants of Growth in Prescription Drug Spending Using 2010-2019 Health Insurance Claims Data. Front Pharmacol. 2021;12:681492. Published 2021 May 31. [CrossRef]
- Health Systems in Transition. United Kingdom health system review. Health Syst. Transit. 2015, 17, 1–125. Available online: https://eurohealthobservatory.who.int/publications/i/united-kingdom-health-system-review-2015 (accessed on 23 January 2025).
- IQVIA MIDAS® Global Database. Comprehensive pharmaceutical sales data for South Korea and comparator countries. Available online: https://www.iqvia.com/solutions/commercialization/brand-strategy-and-management/market-measurement/midas (accessed on 24 January 2025).
- World Health Organization. Global Health Estimates: Life expectancy and leading causes of death and disability. Available online: https://www.who.int/data/global-health-estimates (accessed on 24 January 2025).
- Health Insurance Review; Assessment Service (HIRA). Statistics. Available online: https://www.hira.or.kr/eng/main.do (accessed on 24 January 2025).
- Korean Statistical Information Service (KOSIS). Available online: https://kosis.kr/eng/ (accessed on 24 January 2025).
- Ministry of Food and Drug Safety (MFDS). Approval Process for Pharmaceuticals. Available online: https://www.mfds.go.kr/eng/wpge/m_17/de011008l001.do (accessed on 24 January 2025).
- Ministry of Health and Welfare (MoHW). Available online: https://www.mohw.go.kr/eng/ (accessed on 24 January 2025).
- World Health Organization. Anatomical Therapeutic Chemical (ATC) Classification System. Available online: https://www.who.int/tools/atc-ddd-toolkit/atc-classification (accessed on 24 January 2025).
- Organisation for Economic Co-operation and Development (OECD). Pharmaceutical spending. Available online: https://www.oecd.org/health/pharmaceutical-spending.htm (accessed on 24 January 2025).
- Korea Research-based Pharmaceutical Industry Association (KRPIA). Available online: http://www.krpia.or.kr/eng/ (accessed on 24 January 2025).
- United Nations. Sustainable Development Goals: Good Health and Well-being. Available online: https://www.un.org/sustainabledevelopment/health/ (accessed on 24 January 2025).
- World Health Organization. Regional Office for the Western Pacific. Health Systems Strengthening. Available online: https://www.who.int/westernpacific/health-topics/health-systems-strengthening (accessed on 24 January 2025).
- Organisation for Economic Co-operation and Development (OECD). Health at a Glance 2023: OECD Indicators. Available online: https://www.oecd.org/health/health-at-a-glance/ (accessed on 24 January 2025).
- Ministry of Health and Welfare (MoHW). Pharmaceutical Policy Reports. Available online: https://www.mohw.go.kr/eng/hs/hs0106.jsp (accessed on 24 January 2025).
- Health Insurance Review; Assessment Service (HIRA). National Health Insurance Statistical Yearbook. Available online: https://www.hira.or.kr/eng/main.do (accessed on 24 January 2025).
- World Health Organization. Global Health Estimates: Leading causes of DALYs. Available online: https://www.who.int/data/global-health-estimates (accessed on 24 January 2025).
- Galkina Cleary E, Jackson MJ, Zhou EW, Ledley FD. Comparison of Research Spending on New Drug Approvals by the National Institutes of Health vs the Pharmaceutical Industry, 2010-2019. JAMA Health Forum, 2023. [CrossRef]
- Branning G, Vater M. Healthcare Spending: Plenty of Blame to Go Around. Am Health Drug Benefits 2016, 9, 445–447.
- Rodwin, MA. How the United Kingdom Controls Pharmaceutical Prices and Spending: Learning From Its Experience. Int J Health Serv. [CrossRef]
- Kakkar, AK. Pharmaceutical price regulation and its impact on drug innovation: mitigating the trade-offs. Expert Opin Ther Pat. [CrossRef]
- Schuhmacher A, Hinder M, von Stegmann Und Stein A, Hartl D, Gassmann O. Analysis of pharma R&D productivity - a new perspective needed. Drug Discov Today 2023, 28, 103726. [CrossRef]
- Ciulla M, Marinelli L, Di Biase G, et al. Healthcare Systems across Europe and the US: The Managed Entry Agreements Experience. Healthcare (Basel) 2023, 11, 447. [CrossRef]
- Vokinger, KN. Do Managed Entry Agreements Contribute to Lower Pharmaceutical Spending? JAMA Health Forum 2023, 4, e234610. [Google Scholar] [CrossRef] [PubMed]
Figure 1.
International Comparison of NCE Expenditure Share: South Korea, OECD, and A8 Countries (2017–2022).
Figure 1.
International Comparison of NCE Expenditure Share: South Korea, OECD, and A8 Countries (2017–2022).
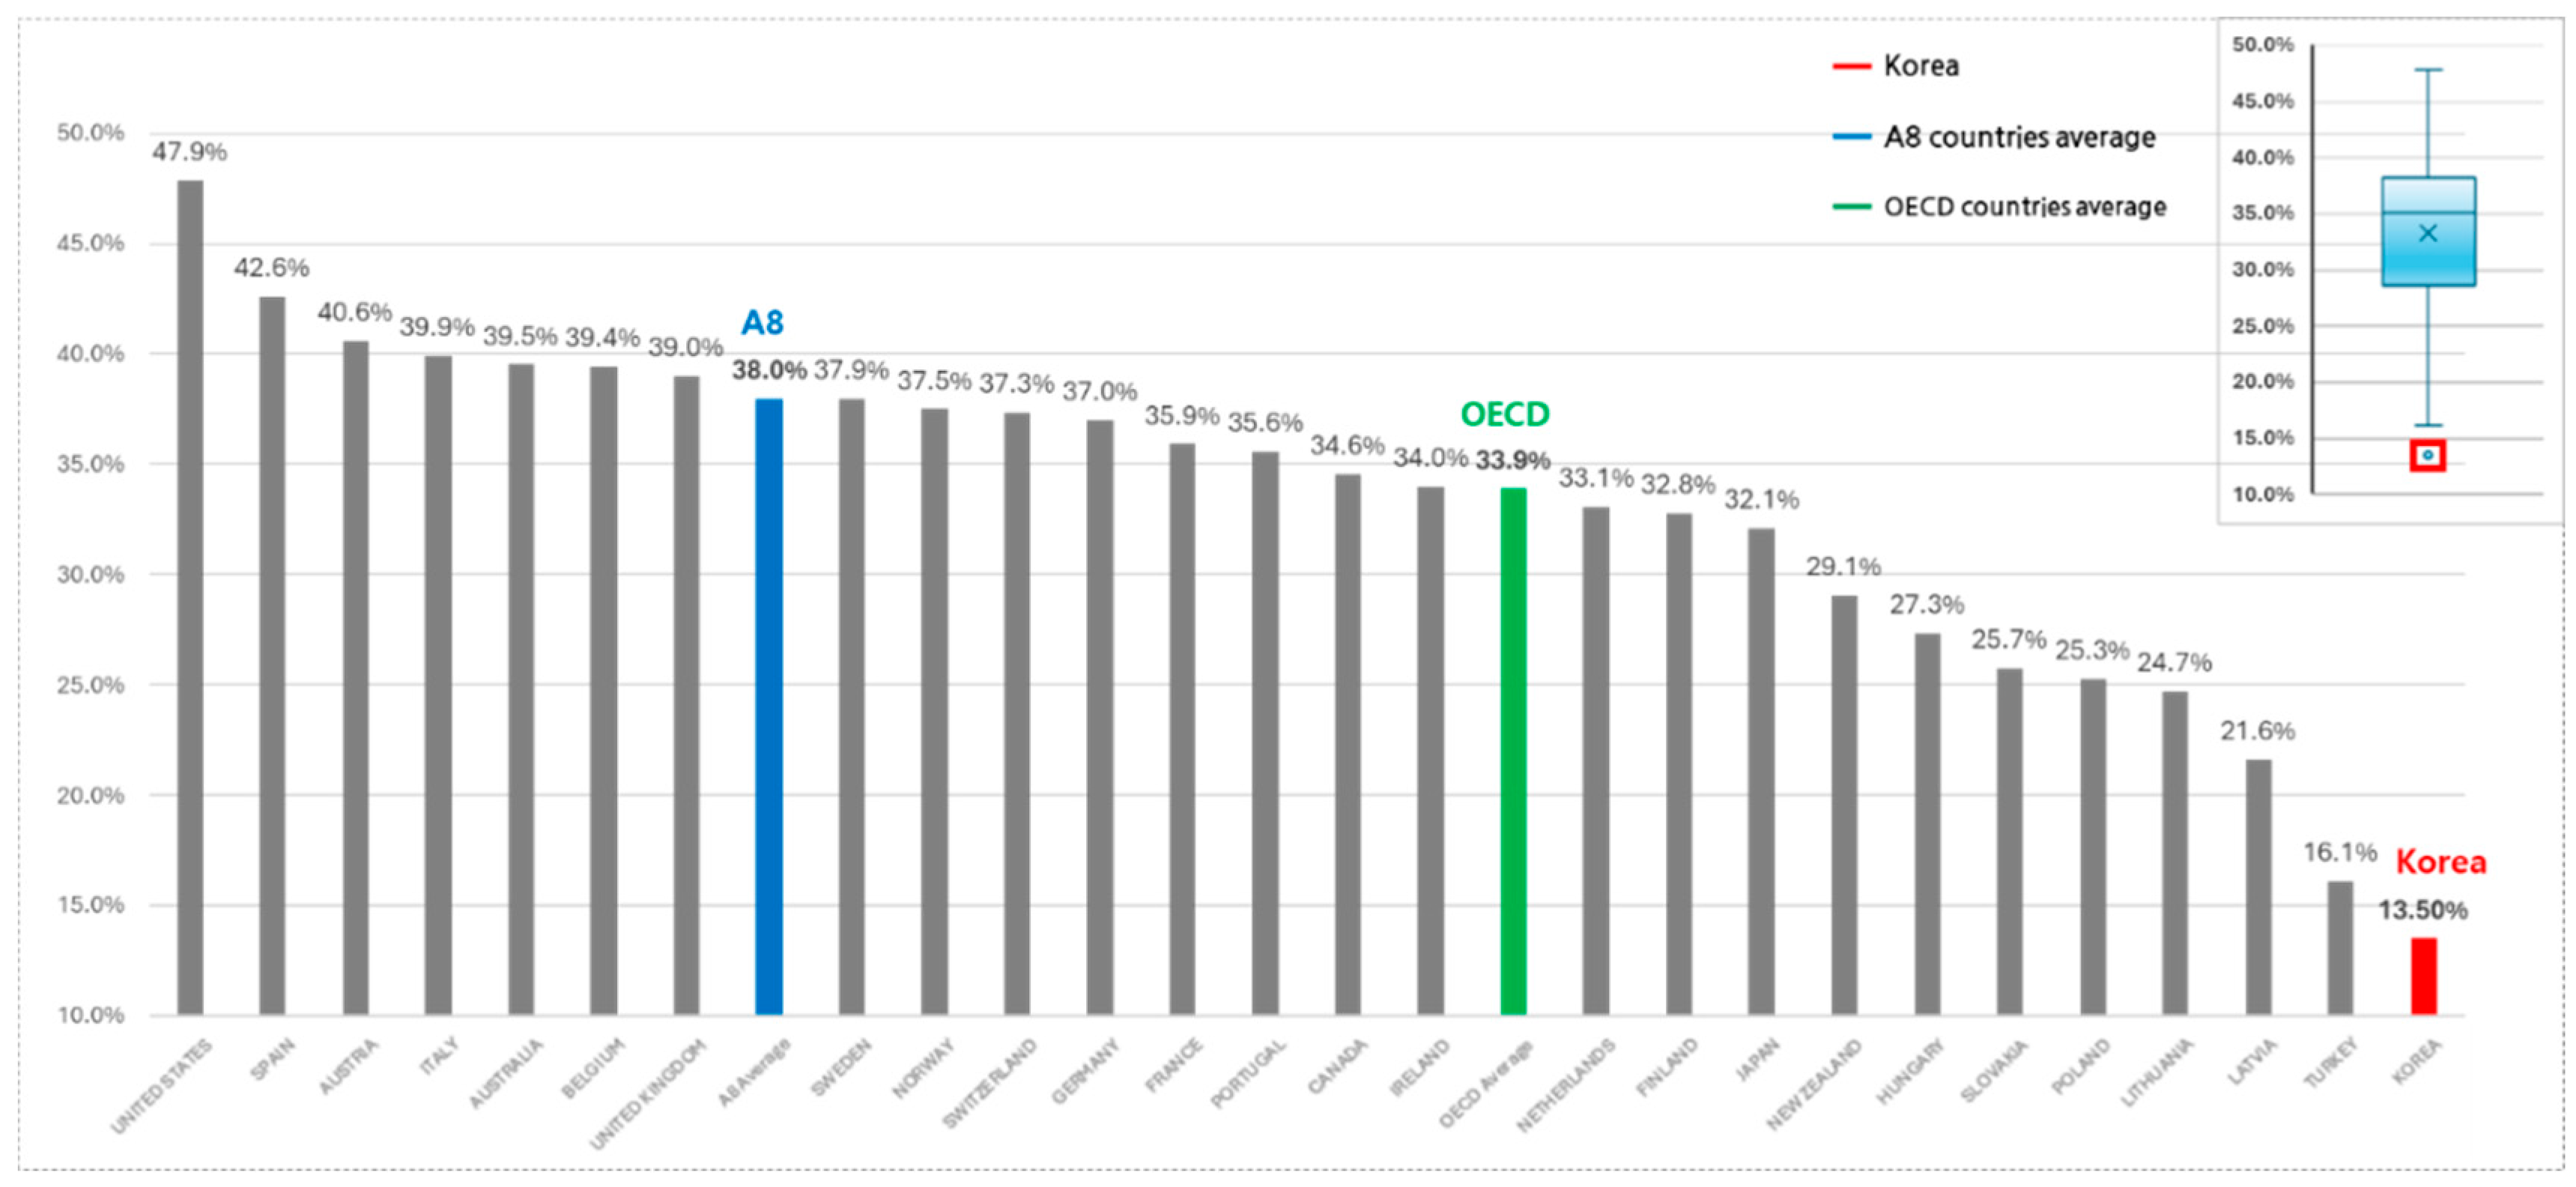
Figure 2.
Leading Causes of Mortality: A Comparative Analysis of South Korea and A8 Countries.
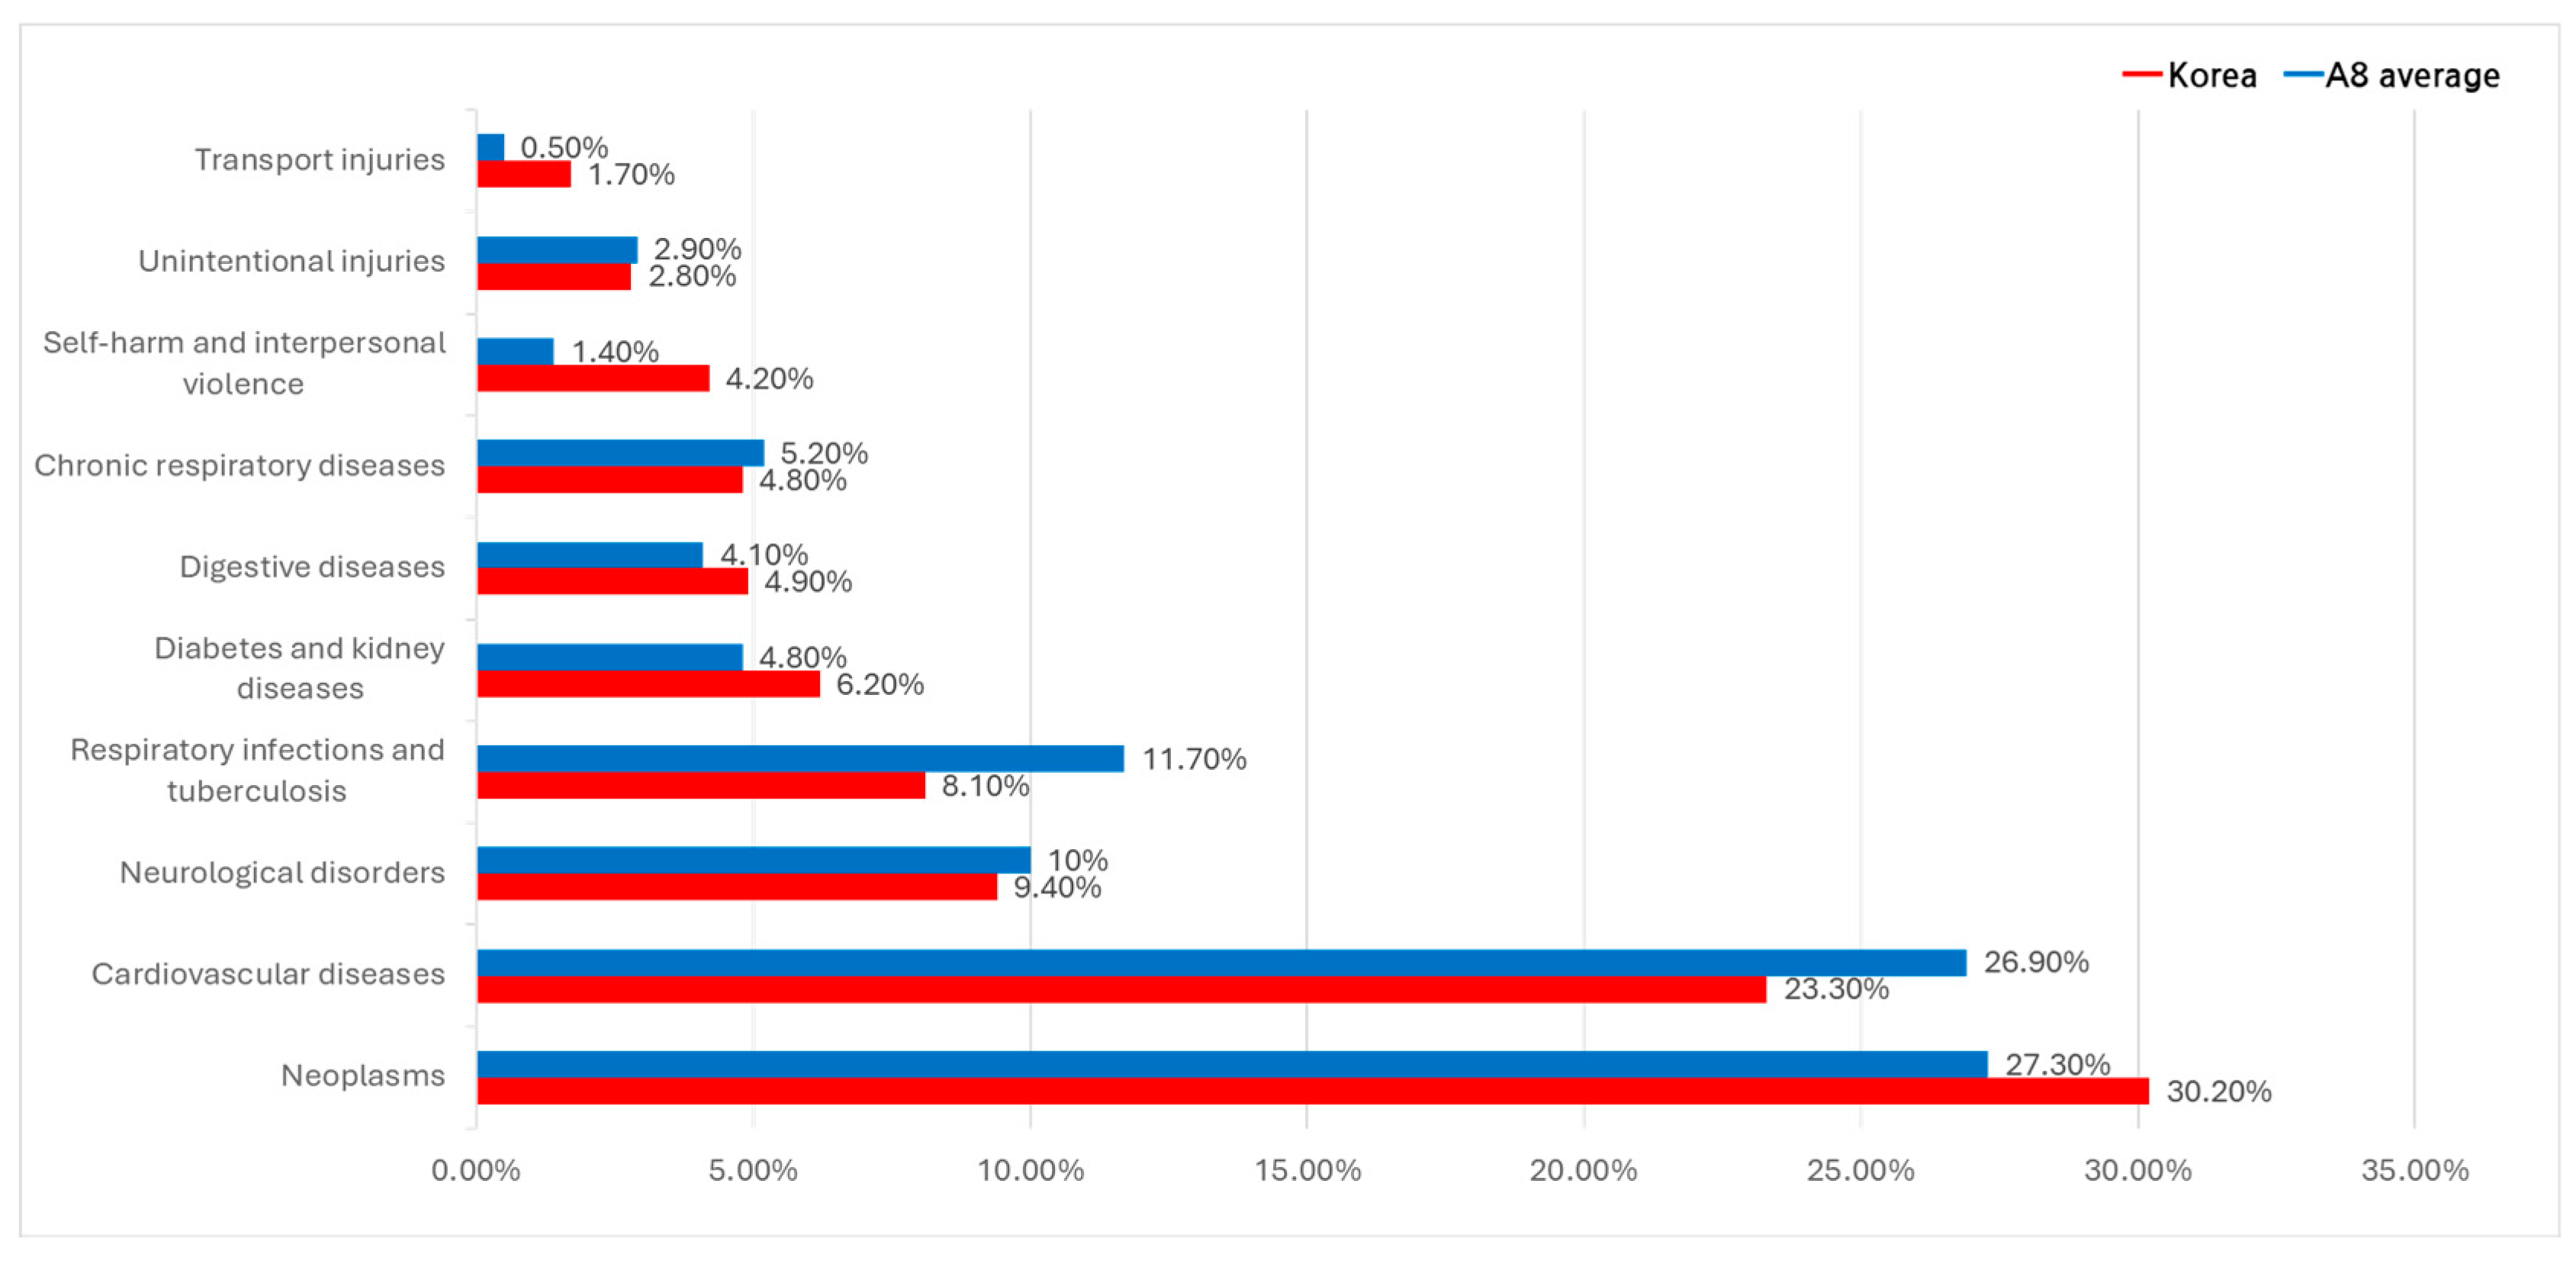
Figure 3.
Global Burden of Disease (DALY Share): Comparative Insights from South Korea and A8 Countries.
Figure 3.
Global Burden of Disease (DALY Share): Comparative Insights from South Korea and A8 Countries.
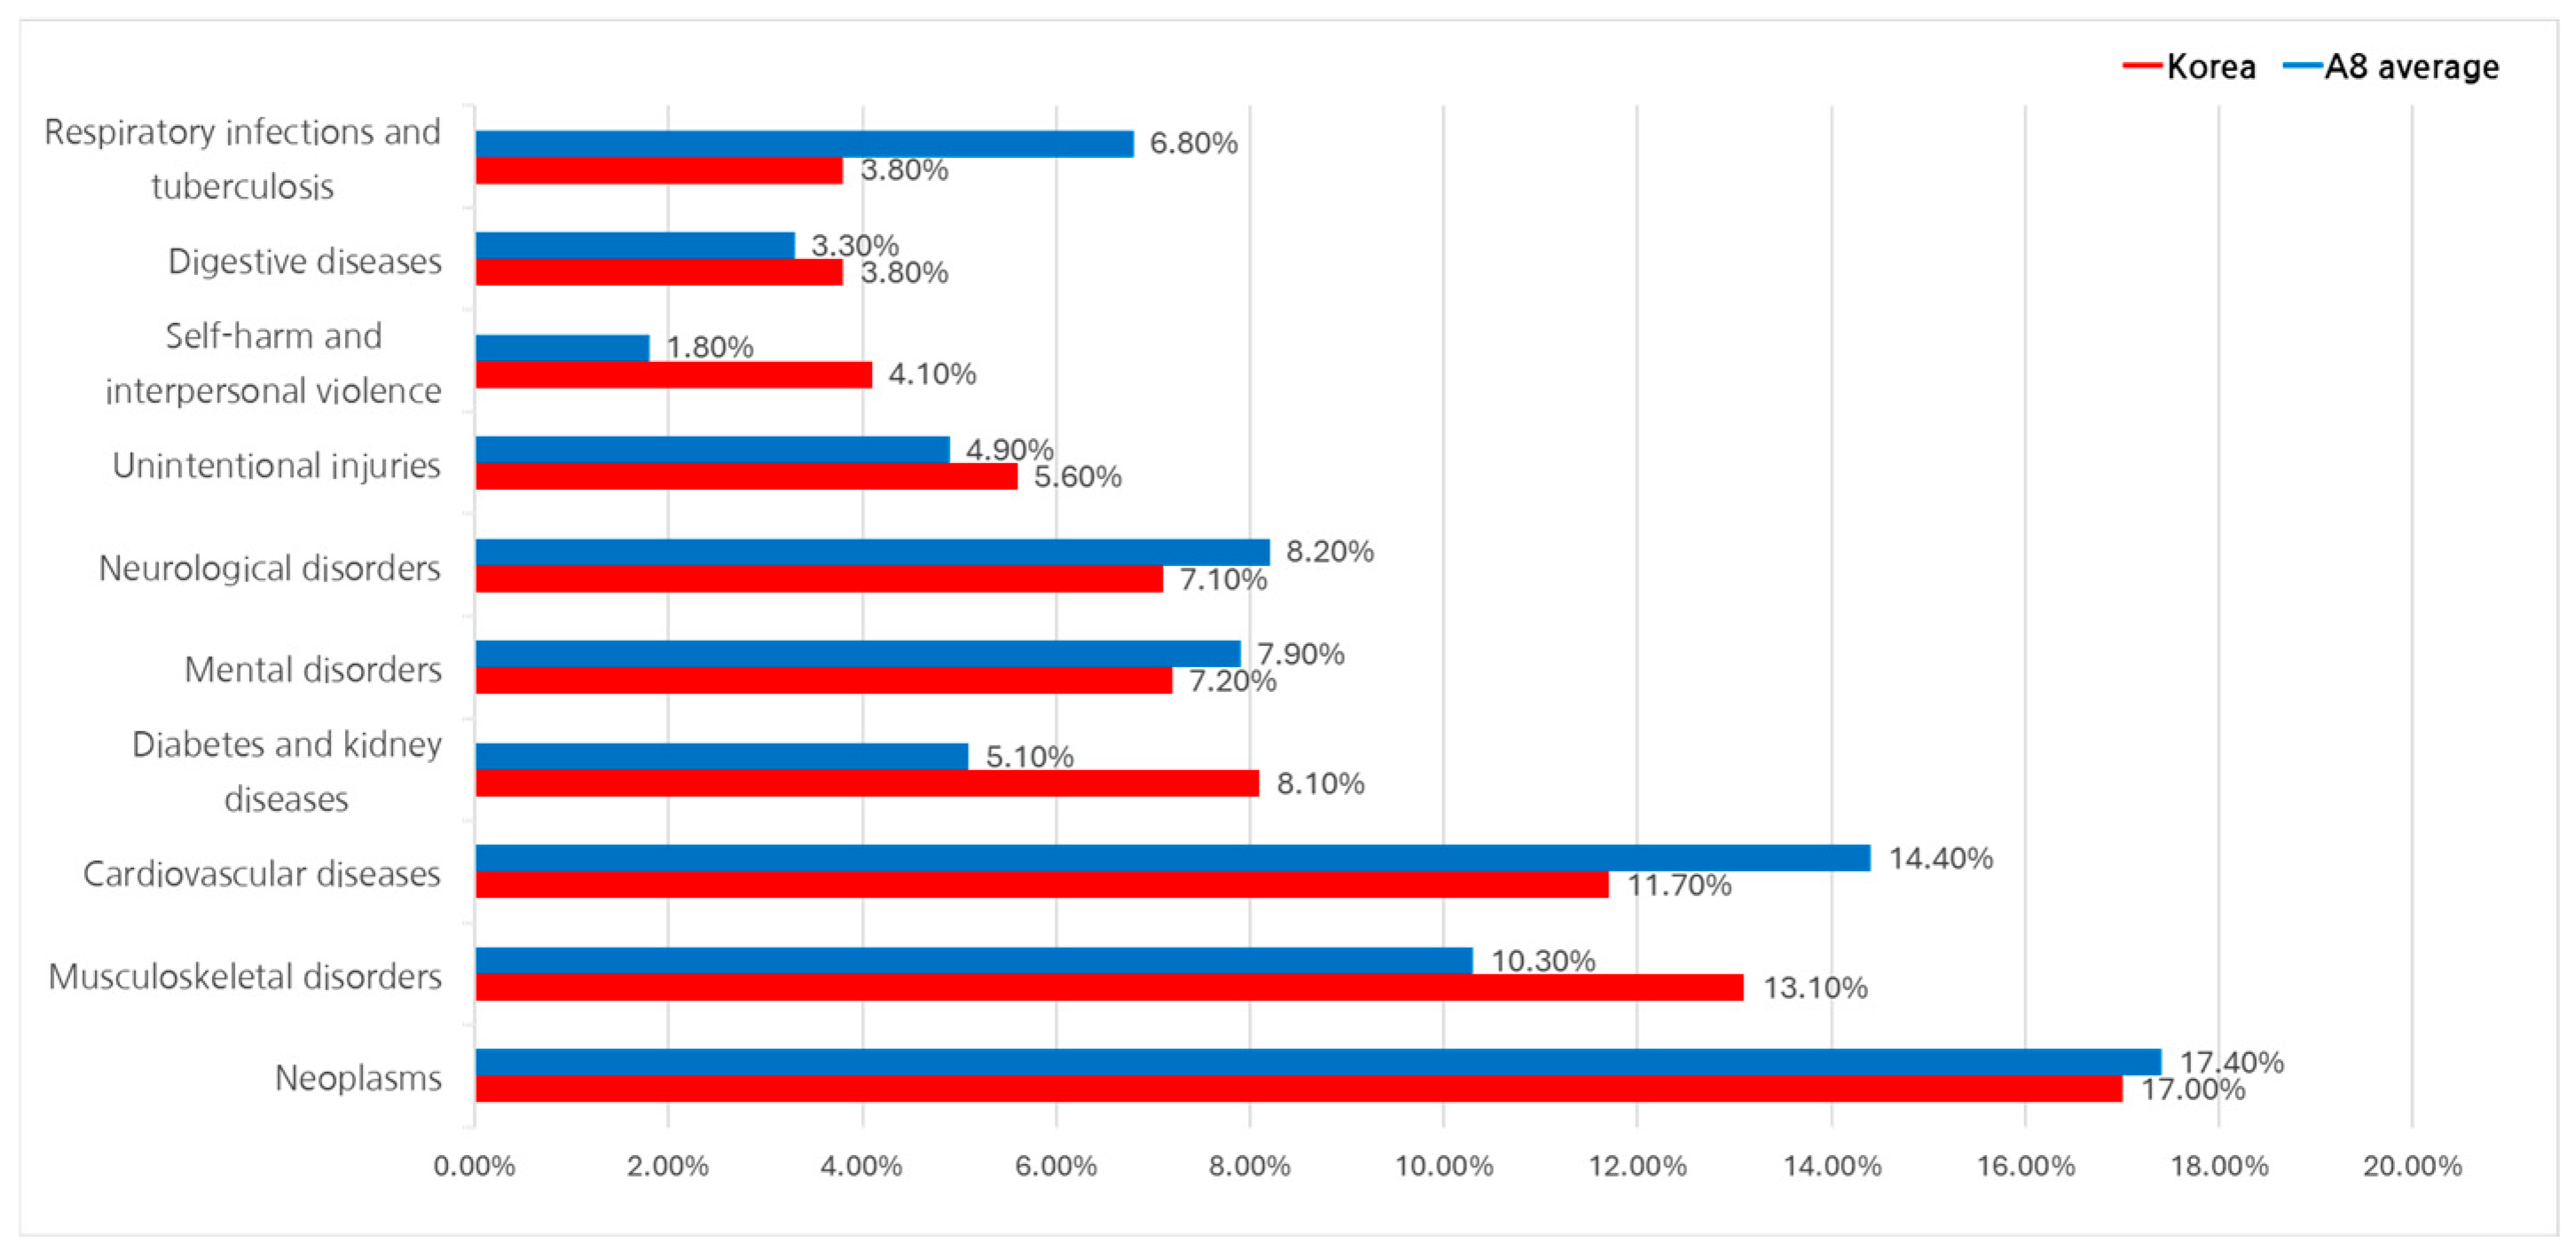
Figure 4.
Therapeutic Area-Specific NCE Spending: Cross-National Comparison of South Korea, OECD, and A8 Countries.
Figure 4.
Therapeutic Area-Specific NCE Spending: Cross-National Comparison of South Korea, OECD, and A8 Countries.
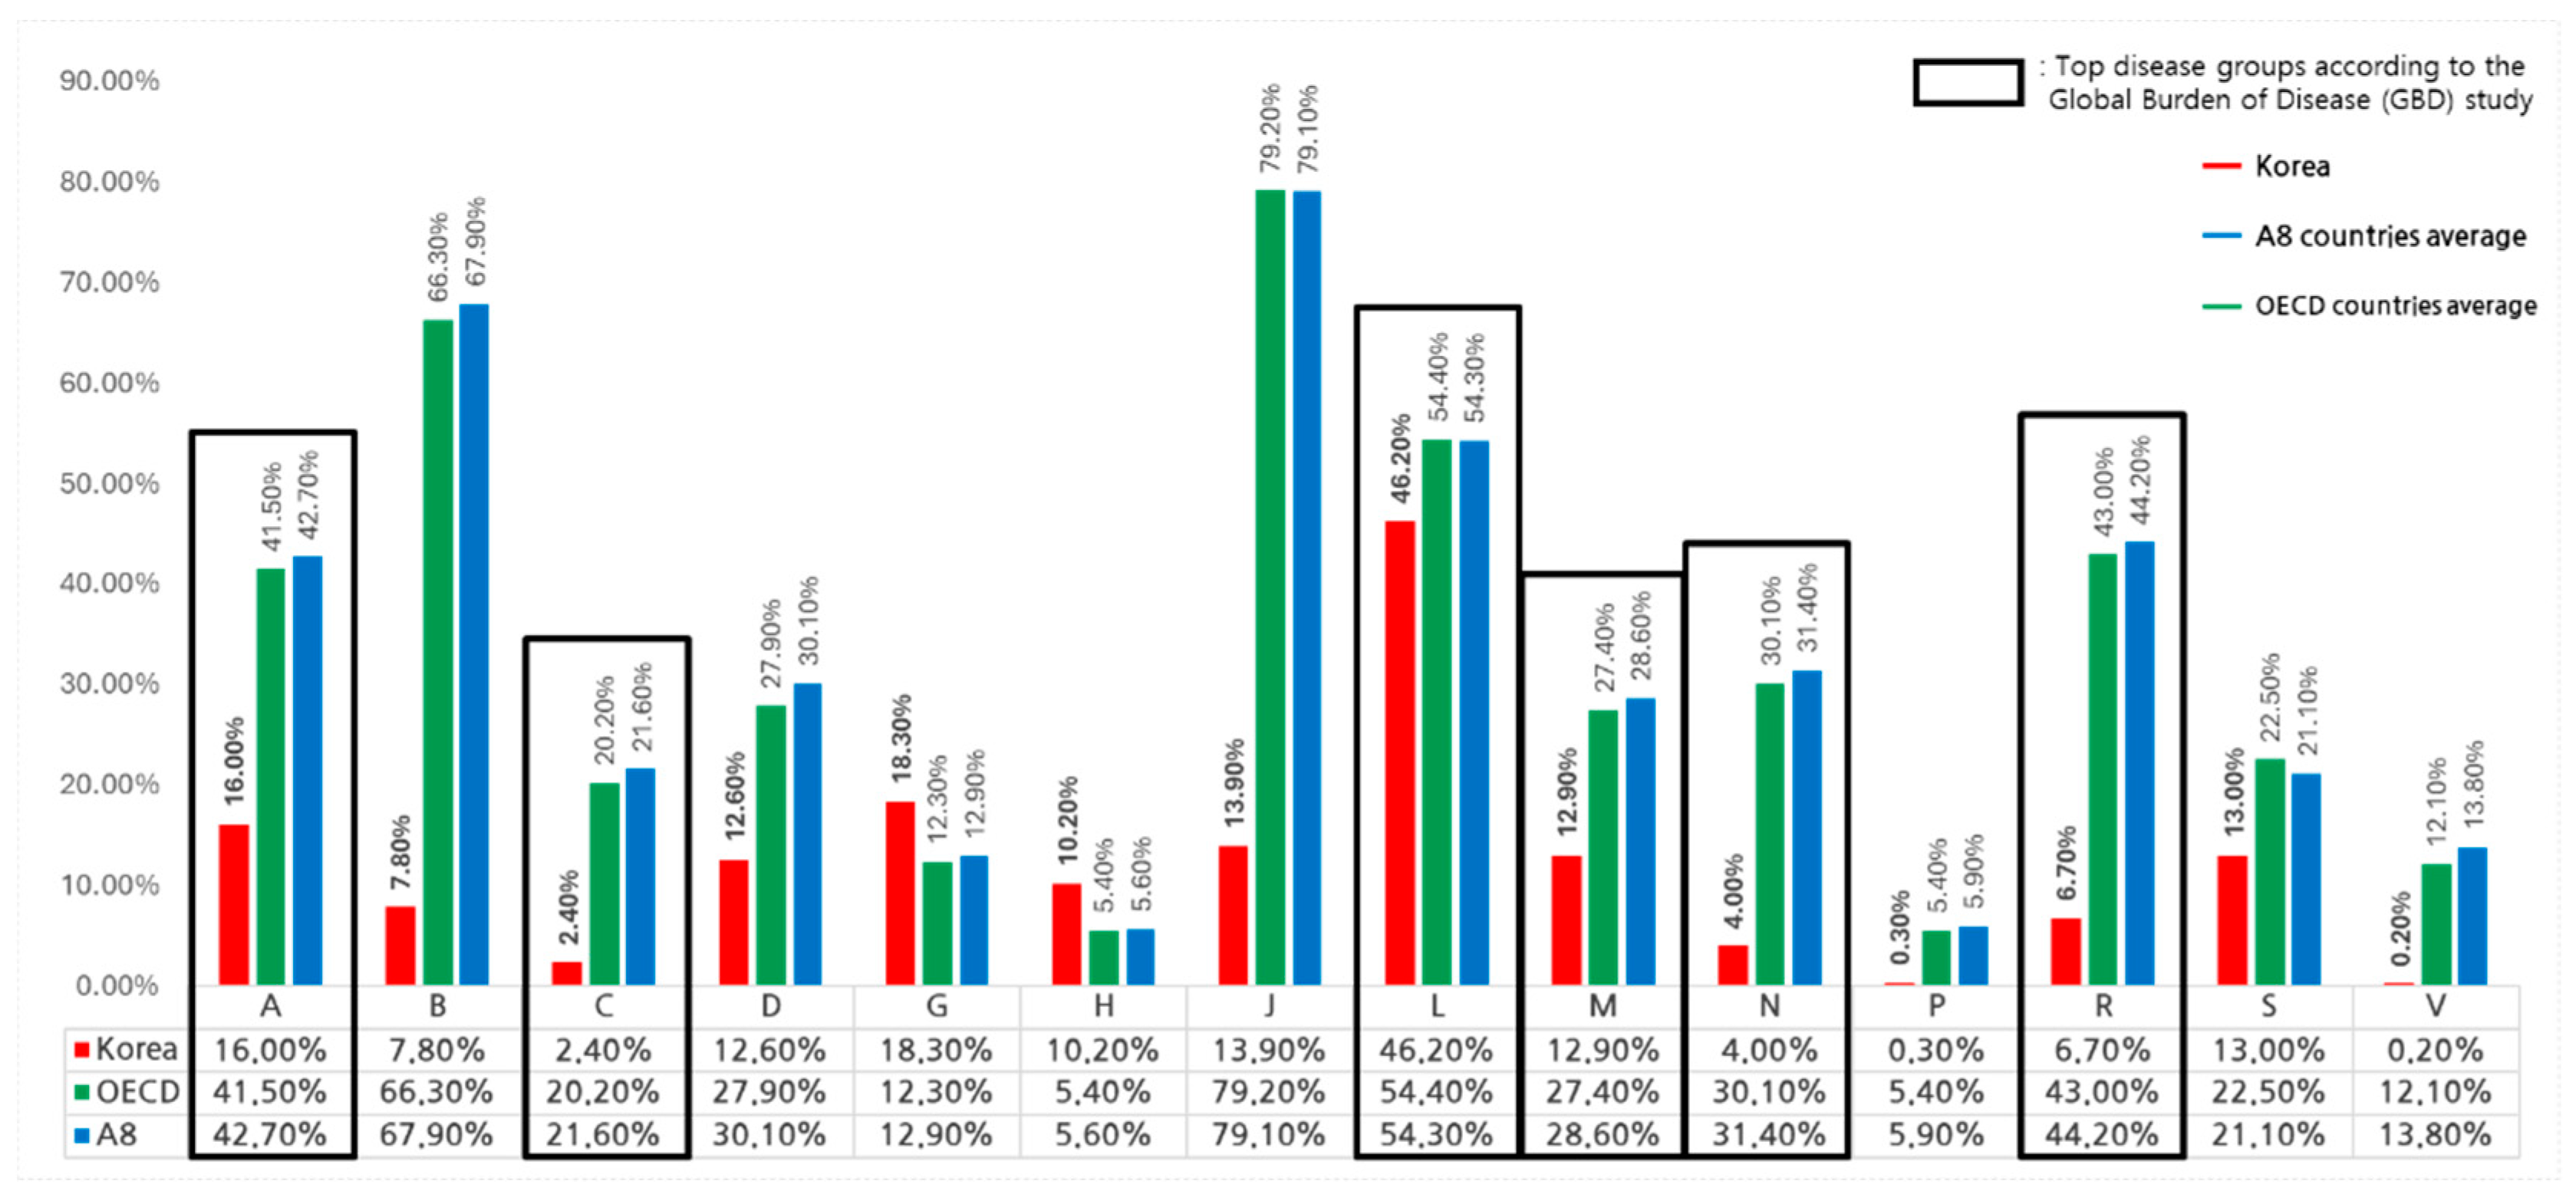

Table 1.
Total Healthcare and Pharmaceutical Expenditure in South Korea.
| Category | 2017-2019 | 2020-2022 | CAGR | Total | ||||||
| 2017 | 2018 | 2019 | Subtotal | 2020 | 2021 | 2022 | Subtotal | |||
| Healthcare Exp. (KRW, Bil.) | 64,611 | 72,571 | 80,316 | 217,498 | 81,124 | 88,140 | 98,121 | 267,384 | 8.7% | 484,882 |
| Pharma Exp. (KRW, Bil.) | 16,218 | 17,876 | 19,321 | 53,415 | 20,009 | 21,309 | 23,048 | 64,366 | 7.3% | 117,781 |
| NCE Exp. (KRW, Bil.) | 1,628 | 2,030 | 2,437 | 6,095 | 2,804 | 3,255 | 3,696 | 9,755 | 17.8% | 15,850 |
| Pharma/Health Exp. (%) | 25.1% | 24.6% | 24.1% | 24.6% | 24.7% | 24.2% | 23.5% | 24.1% | -1.3% | 24.3% |
| NCE/Pharma Exp. (%) | 10.0% | 11.4% | 12.6% | 11.4% | 14.0% | 15.3% | 16.0% | 15.2% | 9.8% | 13.5% |
| NCE/Health Exp. (%) | 2.5% | 2.8% | 3.0% | 2.8% | 3.5% | 3.7% | 3.8% | 3.6% | 8.4% | 3.3% |
KRW, Bil.: South Korean Won. Values are expressed in billions; Healthcare Exp.: Total healthcare expenditure; Pharma Exp.: Total pharmaceutical expenditure; NCE Exp.: Expenditure on new chemical entities (NCEs); CAGR: Compound Annual Growth Rate.
Table 2.
OECD Total Pharmaceutical and NCE Expenditures.
| Category | 2017-2019 | 2020-2022 | CAGR | Total | ||||||
| 2017 | 2018 | 2019 | Subtotal | 2020 | 2021 | 2022 | Subtotal | |||
| Pharma Exp. (USD, Bil.) | 734,560 | 771,040 | 810,224 | 2,315,825 | 849,471 | 915,501 | 1,000,201 | 2,765,173 | 6.40% | 5,080,998 |
| NCE Exp. (USD, Bil.) | 215,792 | 267,280 | 322,427 | 805,499 | 385,632 | 461,158 | 557,487 | 1,404,276 | 20.90% | 2,209,775 |
| NCE Share (Aggregate Avg., %) | 29.4% | 34.7% | 39.8% | 34.8% | 45.4% | 50.4% | 55.7% | 50.8% | 13.7% | 43.5% |
| NCE Share (Country Avg., %) | 23.5% | 28.4% | 31.8% | 28.1% | 34.6% | 38.2% | 42.6% | 38.7% | 13.1% | 33.9% |
USD, Bil.: United States Dollars. Values are expressed in billions; Pharma Exp.: Total pharmaceutical expenditure; NCE Exp.: Expenditure on new chemical entities (NCEs); CAGR: Compound Annual Growth Rate.
Table 3.
Total Pharmaceutical and NCE Spending by Therapeutic Area in South Korea.
| ATC Level 1 | Pharma Exp. (KRW, Bil.) | NCE Exp. (KRW, Bil.) | NCE Share (%) |
| Alimentary (A) | 18,225 | 2,919 | 16.0% |
| Blood & Hematopoietic (B) | 10,751 | 841 | 7.8% |
| Cardiovascular (C) | 22,470 | 540 | 2.4% |
| Dermatologicals (D) | 1,149 | 144 | 12.6% |
| Genitourinary (G) | 3,469 | 634 | 18.3% |
| Endocrine System (H) | 1,000 | 102 | 10.2% |
| Anti-infectives (J) | 11,817 | 1,640 | 13.9% |
| Antineoplastics (L) | 14,675 | 6,778 | 46.2% |
| Musculoskeletal (M) | 6,877 | 885 | 12.9% |
| Nervous System (N) | 11,827 | 472 | 4.0% |
| Antiparasitics (P) | 54 | 0.1 | 0.3% |
| Respiratory (R) | 5,143 | 345 | 6.7% |
| Sensory Organs (S) | 4,177 | 542 | 13.0% |
| Various (V) | 3,364 | 7 | 0.2% |
| Total | 117,781 | 15,850 | 13.5% |
KRW, Bil.: South Korean Won. Values are expressed in billions; Pharma Exp.: Total pharmaceutical expenditure; NCE Exp.: Expenditure on new chemical entities (NCEs); NCE Share (%): Proportion of NCE expenditure relative to total pharmaceutical expenditure.
Table 4.
Total Pharmaceutical and NCE Spending by Therapeutic Area in OECD Countries.
| ATC Level 1 | Pharma Exp. (USD, Bil.) | NCE Exp. (USD, Bil.) | NCE Share (%) |
| Alimentary (A) | 785 | 326 | 41.50% |
| Blood & Hematopoietic (B) | 341 | 226 | 66.30% |
| Cardiovascular (C) | 281 | 57 | 20.20% |
| Dermatologicals (D) | 111 | 31 | 27.90% |
| Genitourinary (G) | 151 | 19 | 12.30% |
| Endocrine System (H) | 112 | 6.1 | 5.40% |
| Anti-infectives (J) | 526 | 416 | 79.20% |
| Antineoplastics (L) | 1,266 | 688 | 54.40% |
| Musculoskeletal (M) | 154 | 42 | 27.40% |
| Nervous System (N) | 710 | 214 | 30.10% |
| Antiparasitics (P) | 6.5 | 0.3 | 5.40% |
| Respiratory (R) | 347 | 149 | 43.00% |
| Sensory Organs (S) | 129 | 29 | 22.50% |
| Various (V) | 48 | 5.9 | 12.10% |
| Total | 5,081 | 2,210 | 33.90% |
USD, Bil.: United States Dollars. Values are expressed in billions; Pharma Exp.: Total pharmaceutical expenditure; NCE Exp.: Expenditure on new chemical entities (NCEs); NCE Share (%): Proportion of NCE expenditure relative to total pharmaceutical expenditure.
Table 5.
NCE Expenditure by Reimbursement Type in South Korea.
| Category | Economic Evaluation Performed | Economic Evaluation Exempt | Below Avg. Weighted Price | Clinically Essential Drugs | Total |
|---|---|---|---|---|---|
| NCE Count | 74 | 32 | 160 | 10 | 276 |
| Share in NCE Count (%) | 26.8% | 11.6% | 58.0% | 3.6% | 100% |
| NCE Exp. (KRW, Bil.) | 6,582 | 739 | 8,184 | 345 | 15,850 |
| Share in NCE Exp. (%) | 41.5% | 5% | 51.6% | 2% | 100% |
| Share in Total Pharma Exp. (%) | 6% | 1% | 7% | 0.3% | 13.50% |
NCE: New Chemical Entities; NCE Count: Number of NCEs by reimbursement classification type; NCE Exp.: Expenditure on NCEs categorized by reimbursement classification; Total Pharma Exp.: Total pharmaceutical expenditure; Below Avg. Weighted Price: Drugs reimbursed below the average weighted price; Clinically Essential Drugs: Drugs classified as essential for clinical treatment; KRW, Bil.: South Korean Won. Values are expressed in billions.
Table 6.
NCE Expenditure by Reimbursement Type, Therapeutic Area in South Korea.
| ATC Level | Economic Evaluation Performed | Economic Evaluation Exempt | Below Avg. Weighted Price | Clinically Essential Drugs | NCE Total Exp. (KRW, Bil.) | Total Pharma Exp. (KRW, Bil.) |
| Alimentary (A) | 855 | 79 | 1,921 | 64 | 2,919 | 18,225 |
| Blood & Hematopoietic (B) | 273 | 33 | 514 | 21 | 841 | 10,751 |
| Cardiovascular (C) | 82 | - | 458 | - | 540 | 22,470 |
| Dermatologicals (D) | 144 | - | - | - | 144 | 1,149 |
| Genitourinary (G) | 161 | - | 473 | - | 634 | 3,469 |
| Endocrine System (H) | 49 | - | 53 | - | 102 | 1,000 |
| Anti-infectives (J) | 286 | 1 | 1,353 | - | 1,640 | 11,817 |
| Antineoplastics (L) | 3,746 | 450 | 2,340 | 242 | 6,778 | 14,675 |
| Musculoskeletal (M) | 398 | 167 | 320 | - | 885 | 6,877 |
| Nervous System (N) | 110 | 7 | 337 | 18 | 472 | 11,827 |
| Antiparasitics (P) | - | - | 0 | - | 0 | 54 |
| Respiratory (R) | 7 | - | 339 | - | 345 | 5,143 |
| Sensory Organs (S) | 466 | - | 76 | - | 542 | 4,177 |
| Various (V) | 5 | 2 | 0 | - | 7 | 3,364 |
| Total | 6,582 | 739 | 8,184 | 345 | 15,850 | 117,781 |
NCE Total Exp.: Expenditure on new chemical entities (NCEs); Total Pharma Exp.: Total pharmaceutical expenditure; Below Avg. Weighted Price: Drugs reimbursed below the average weighted price; Clinically Essential Drugs: Drugs classified as essential for clinical treatment; KRW, Bil.: South Korean Won. Values are expressed in billions.
Table 7.
NCE Expenditure by classification of RSA or Orphan Drug in South Korea.
| Category | RSA Inclusion | Orphan Drug Designation | Total | ||
| RSA Included | RSA Excluded | Orphan Drugs | Non-Orphan Drugs | ||
| NCE Count | 59 | 217 | 91 | 185 | 276 |
| Share in NCE Count (%) | 21.40% | 78.60% | 33.00% | 67.00% | 100% |
| NCE Exp. (KRW, Bil.) | 4,504 | 11,346 | 2,890 | 12,960 | 15,850 |
| Share in NCE Exp. (%) | 28.4% | 71.6% | 18.2% | 81.8% | 100% |
| Share in Total Pharma Exp. (%) | 3.8% | 9.6% | 2.5% | 11.0% | 13.5% |
RSA: Risk-Sharing Agreements; NCE: New Chemical Entities; NCE Count: Number of NCEs by RSA and orphan drug classification; NCE Exp.: Expenditure on NCEs categorized by RSA and orphan drug classification; Total Pharma Exp.: Total pharmaceutical expenditure; KRW, Bil.: South Korean Won. Values are expressed in billions.
Table 8.
NCE Expenditure by classification of RSA or Orphan Drug, Therapeutic Area in South Korea.
| ATC Level 1 | RSA Inclusion | Orphan Drug Designation | NCE Total Exp. (KRW, Bil.) | Total Pharma Exp. (KRW, Bil.) | ||
| RSA Included | RSA Excluded | Orphan Drugs | Non-Orphan Drugs | |||
| Alimentary (A) | 79 | 2,840 | 296 | 2,624 | 2,919 | 18,225 |
| Blood (B) | 42 | 799 | 102 | 739 | 841 | 10,751 |
| Cardiovascular (C) | - | 540 | 47 | 493 | 540 | 22,470 |
| Dermatologicals (D) | 144 | - | - | 144 | 144 | 1,149 |
| Genitourinary (G) | - | 634 | - | 634 | 634 | 3,469 |
| Endocrine (H) | - | 102 | 13 | 89 | 102 | 1,000 |
| Anti-infectives (J) | 1 | 1,639 | 67 | 1,573 | 1,640 | 11,817 |
| Antineoplastics (L) | 4,061 | 2,717 | 2,144 | 4,634 | 6,778 | 14,675 |
| Musculoskeletal (M) | 167 | 717 | 193 | 692 | 885 | 6,877 |
| Nervous System (N) | 7 | 465 | 26 | 447 | 472 | 11,827 |
| Antiparasitics (P) | - | 0.1 | - | 0.1 | 0.1 | 54 |
| Respiratory (R) | - | 345 | - | 345 | 345 | 5,143 |
| Sensory Organs (S) | - | 542 | - | 542 | 542 | 4,177 |
| Various (V) | 2 | 5 | 2 | 5 | 7 | 3,364 |
| Total | 4,504 | 11,346 | 2,890 | 12,960 | 15,850 | 117,781 |
RSA: Risk-Sharing Agreements; NCE Total Exp.: Expenditure on new chemical entities (NCEs); Total Pharma Exp.: Total pharmaceutical expenditure; KRW, Bil.: South Korean Won. Values are expressed in billions.
Disclaimer/Publisher’s Note: The statements, opinions and data contained in all publications are solely those of the individual author(s) and contributor(s) and not of MDPI and/or the editor(s). MDPI and/or the editor(s) disclaim responsibility for any injury to people or property resulting from any ideas, methods, instructions or products referred to in the content. |
© 2025 by the authors. Licensee MDPI, Basel, Switzerland. This article is an open access article distributed under the terms and conditions of the Creative Commons Attribution (CC BY) license (http://creativecommons.org/licenses/by/4.0/).
Copyright: This open access article is published under a Creative Commons CC BY 4.0 license, which permit the free download, distribution, and reuse, provided that the author and preprint are cited in any reuse.


