Preprint
Article

This version is not peer-reviewed.

Otolith Shape as An Alternative Method to Identify Small Bigeye Tuna (Thunnus obesus) and Yellowfin Tuna (Thunnus albacares)

Submitted:

04 February 2025

Posted:

04 February 2025

You are already at the latest version

Abstract

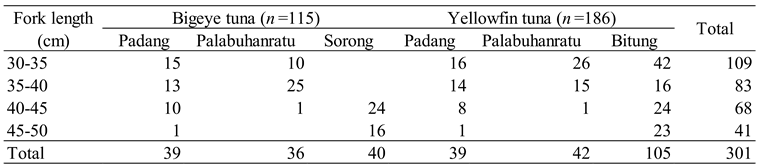
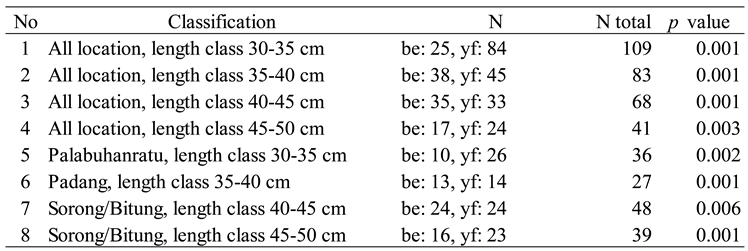
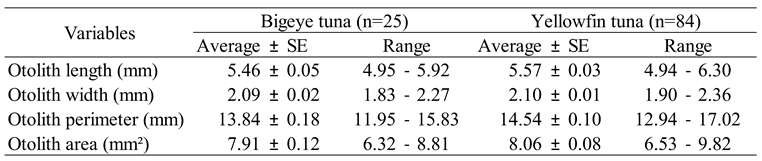
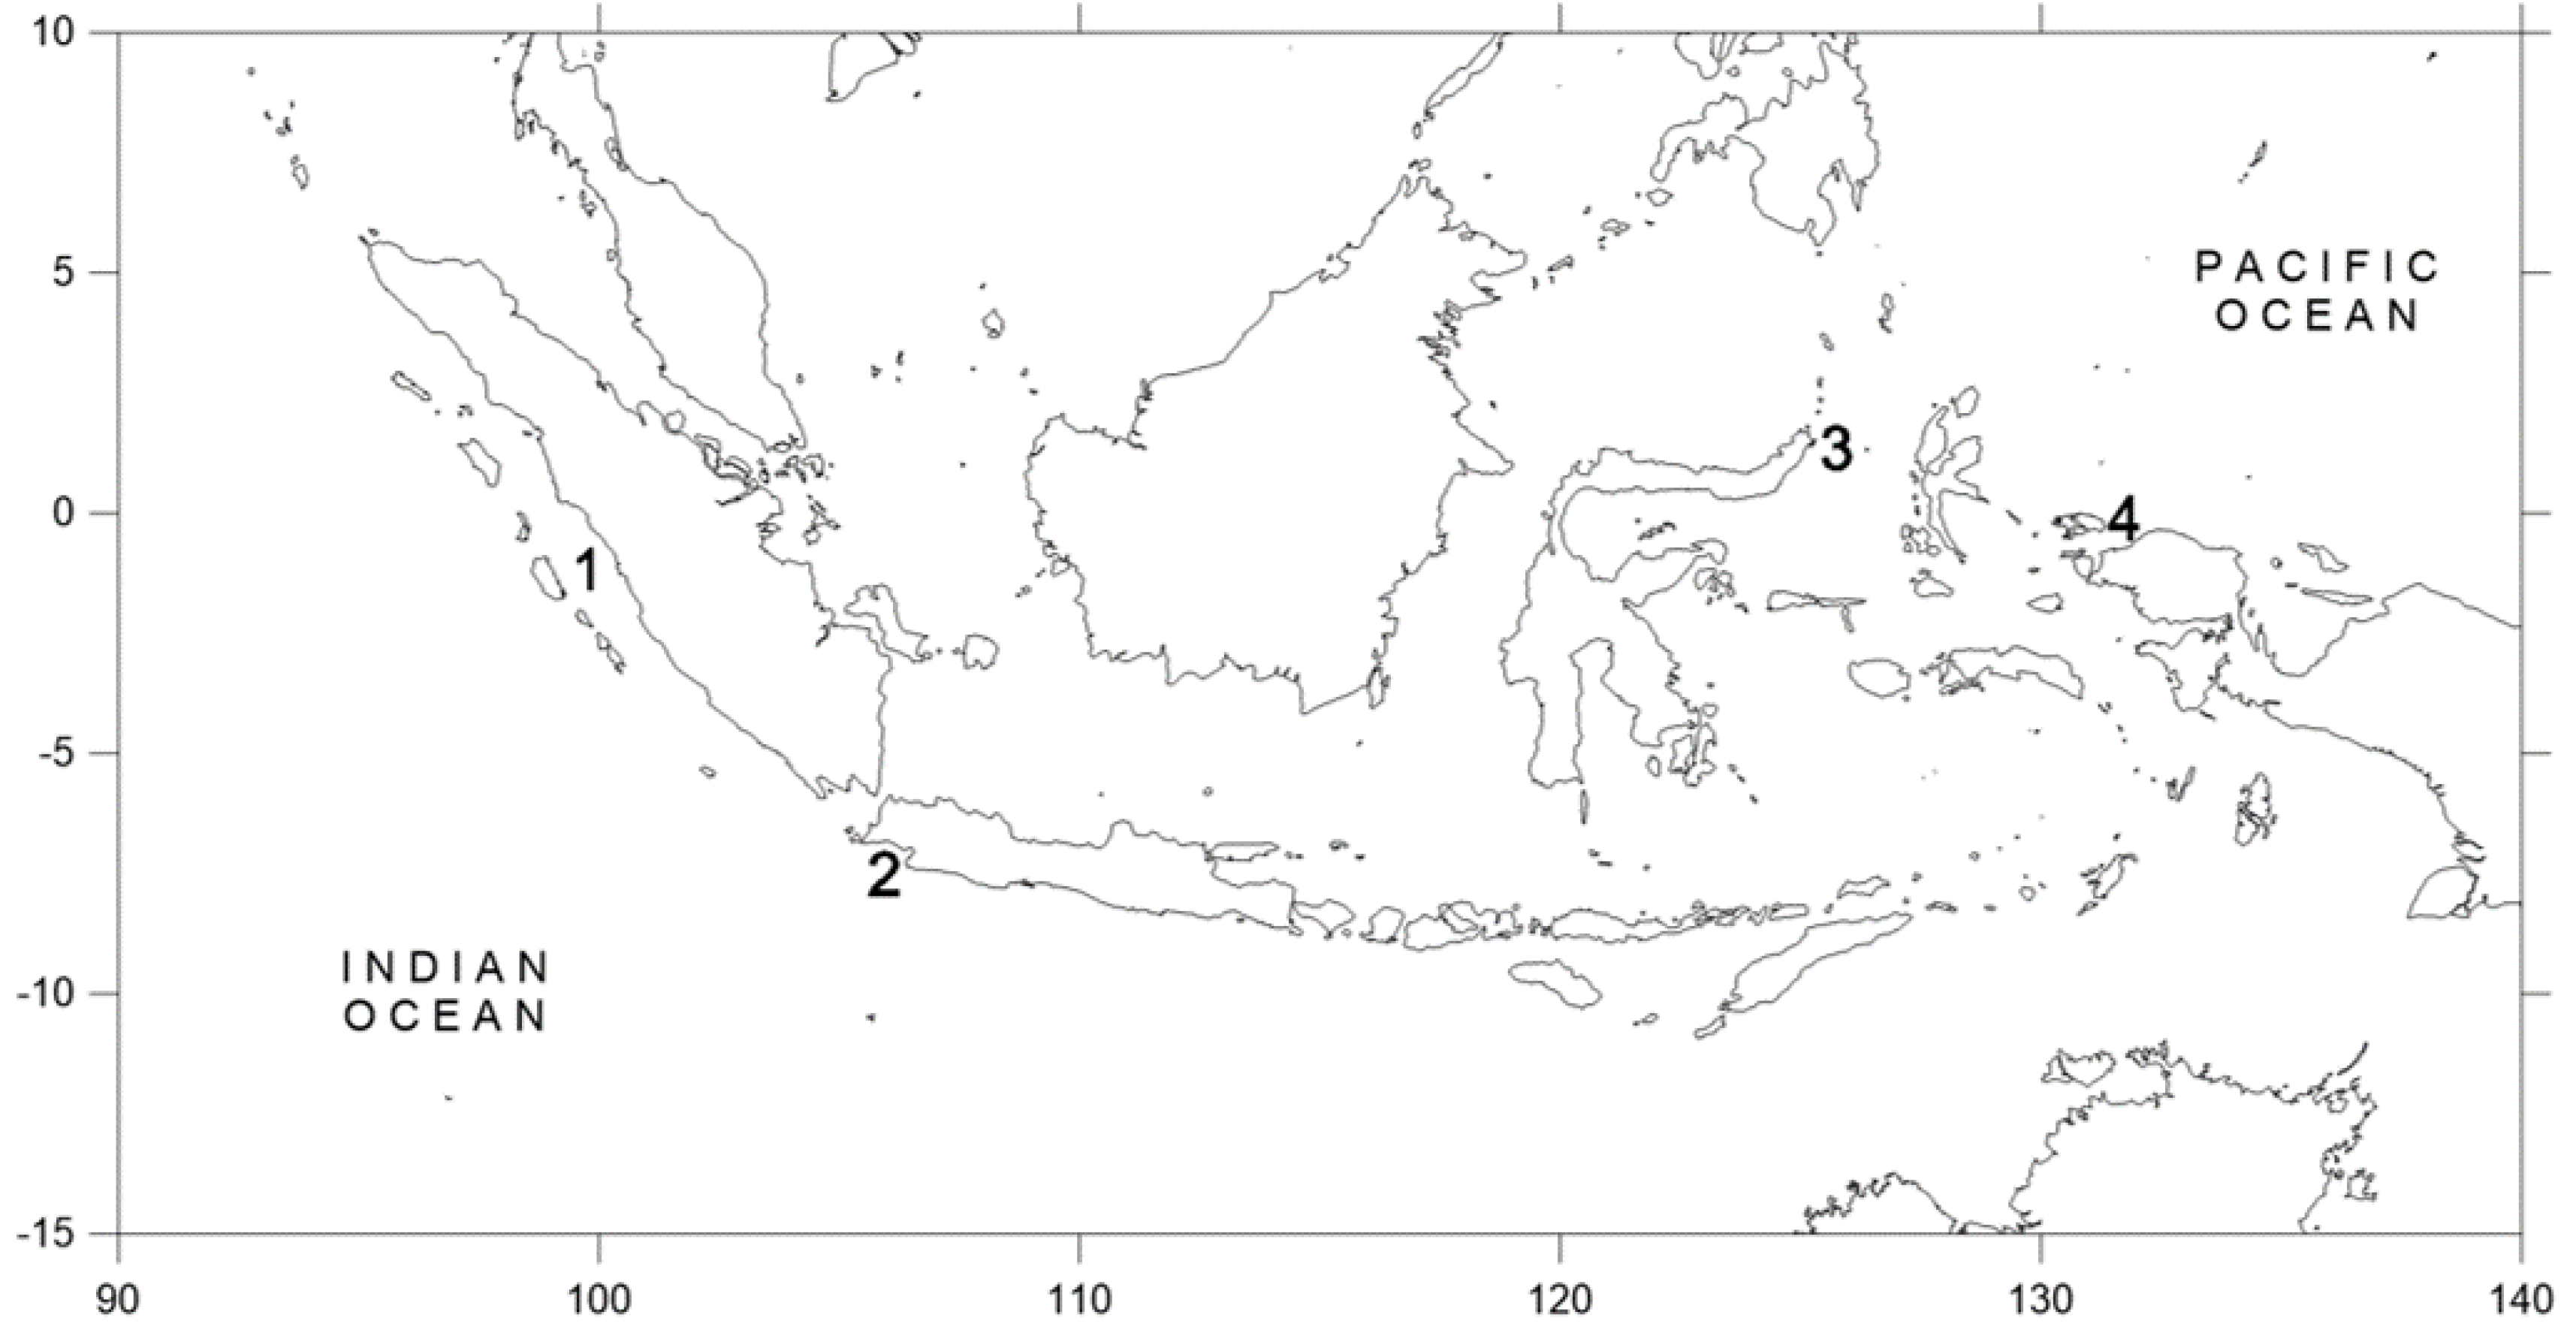
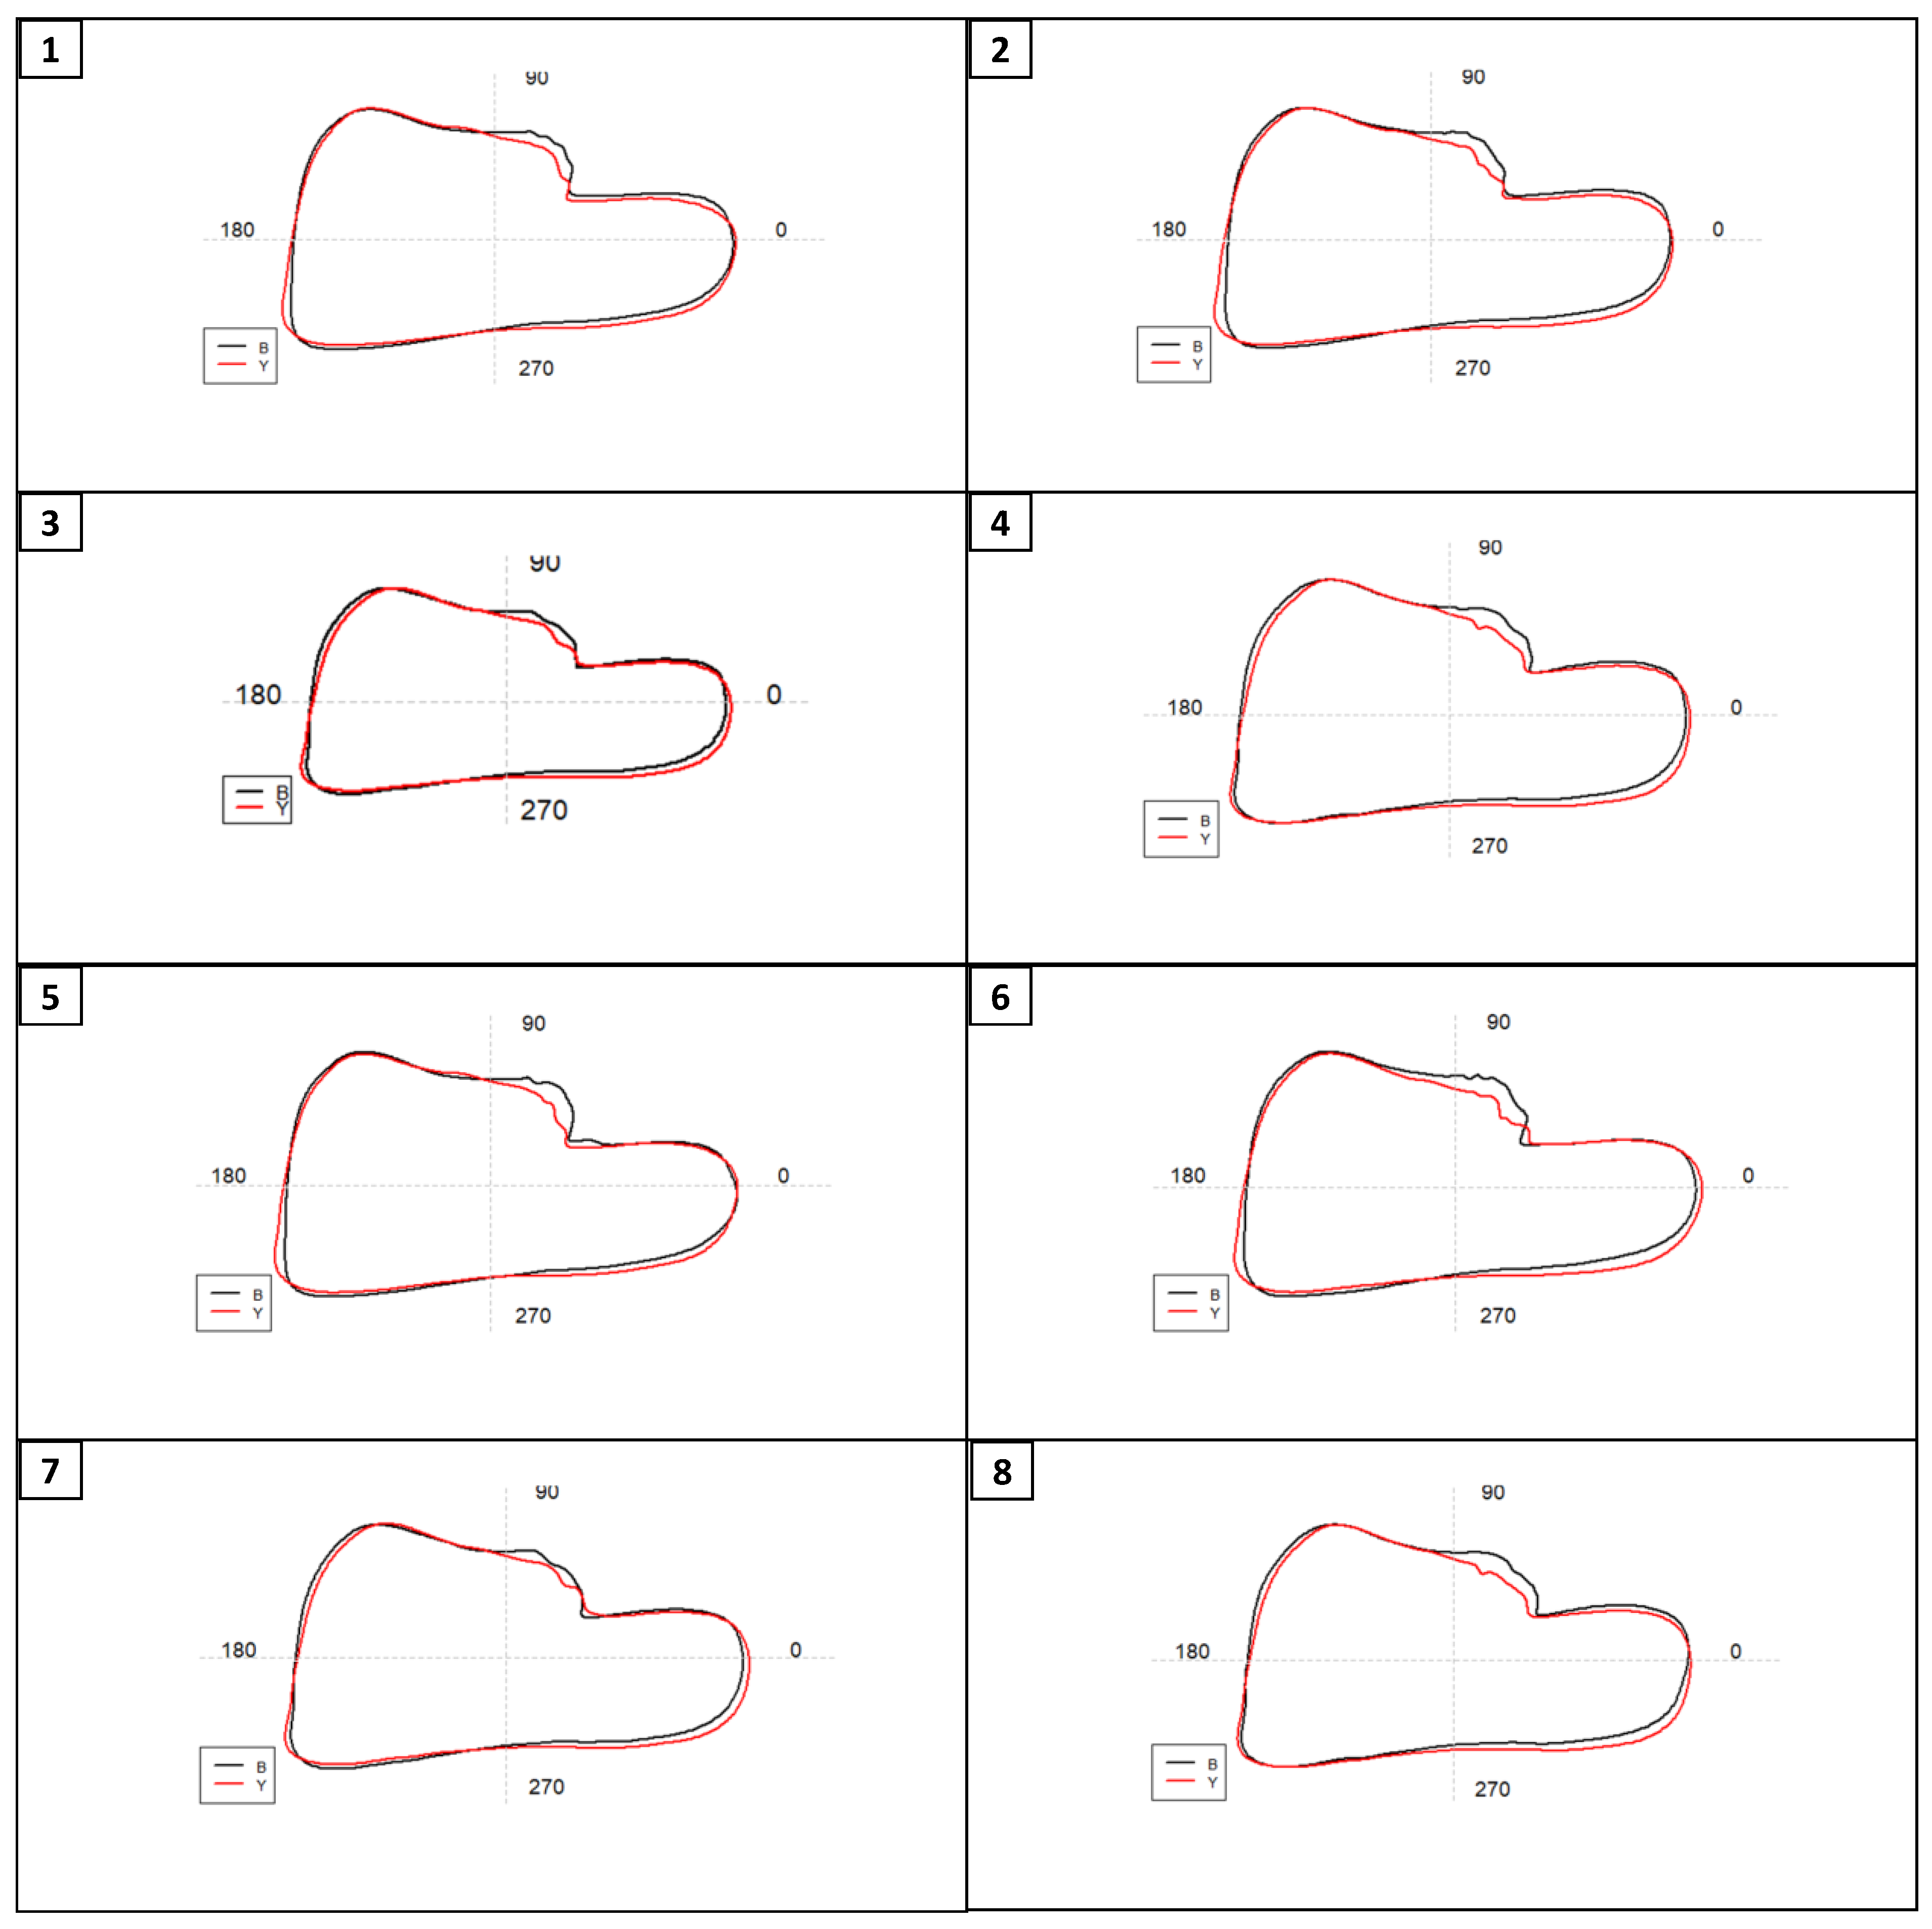
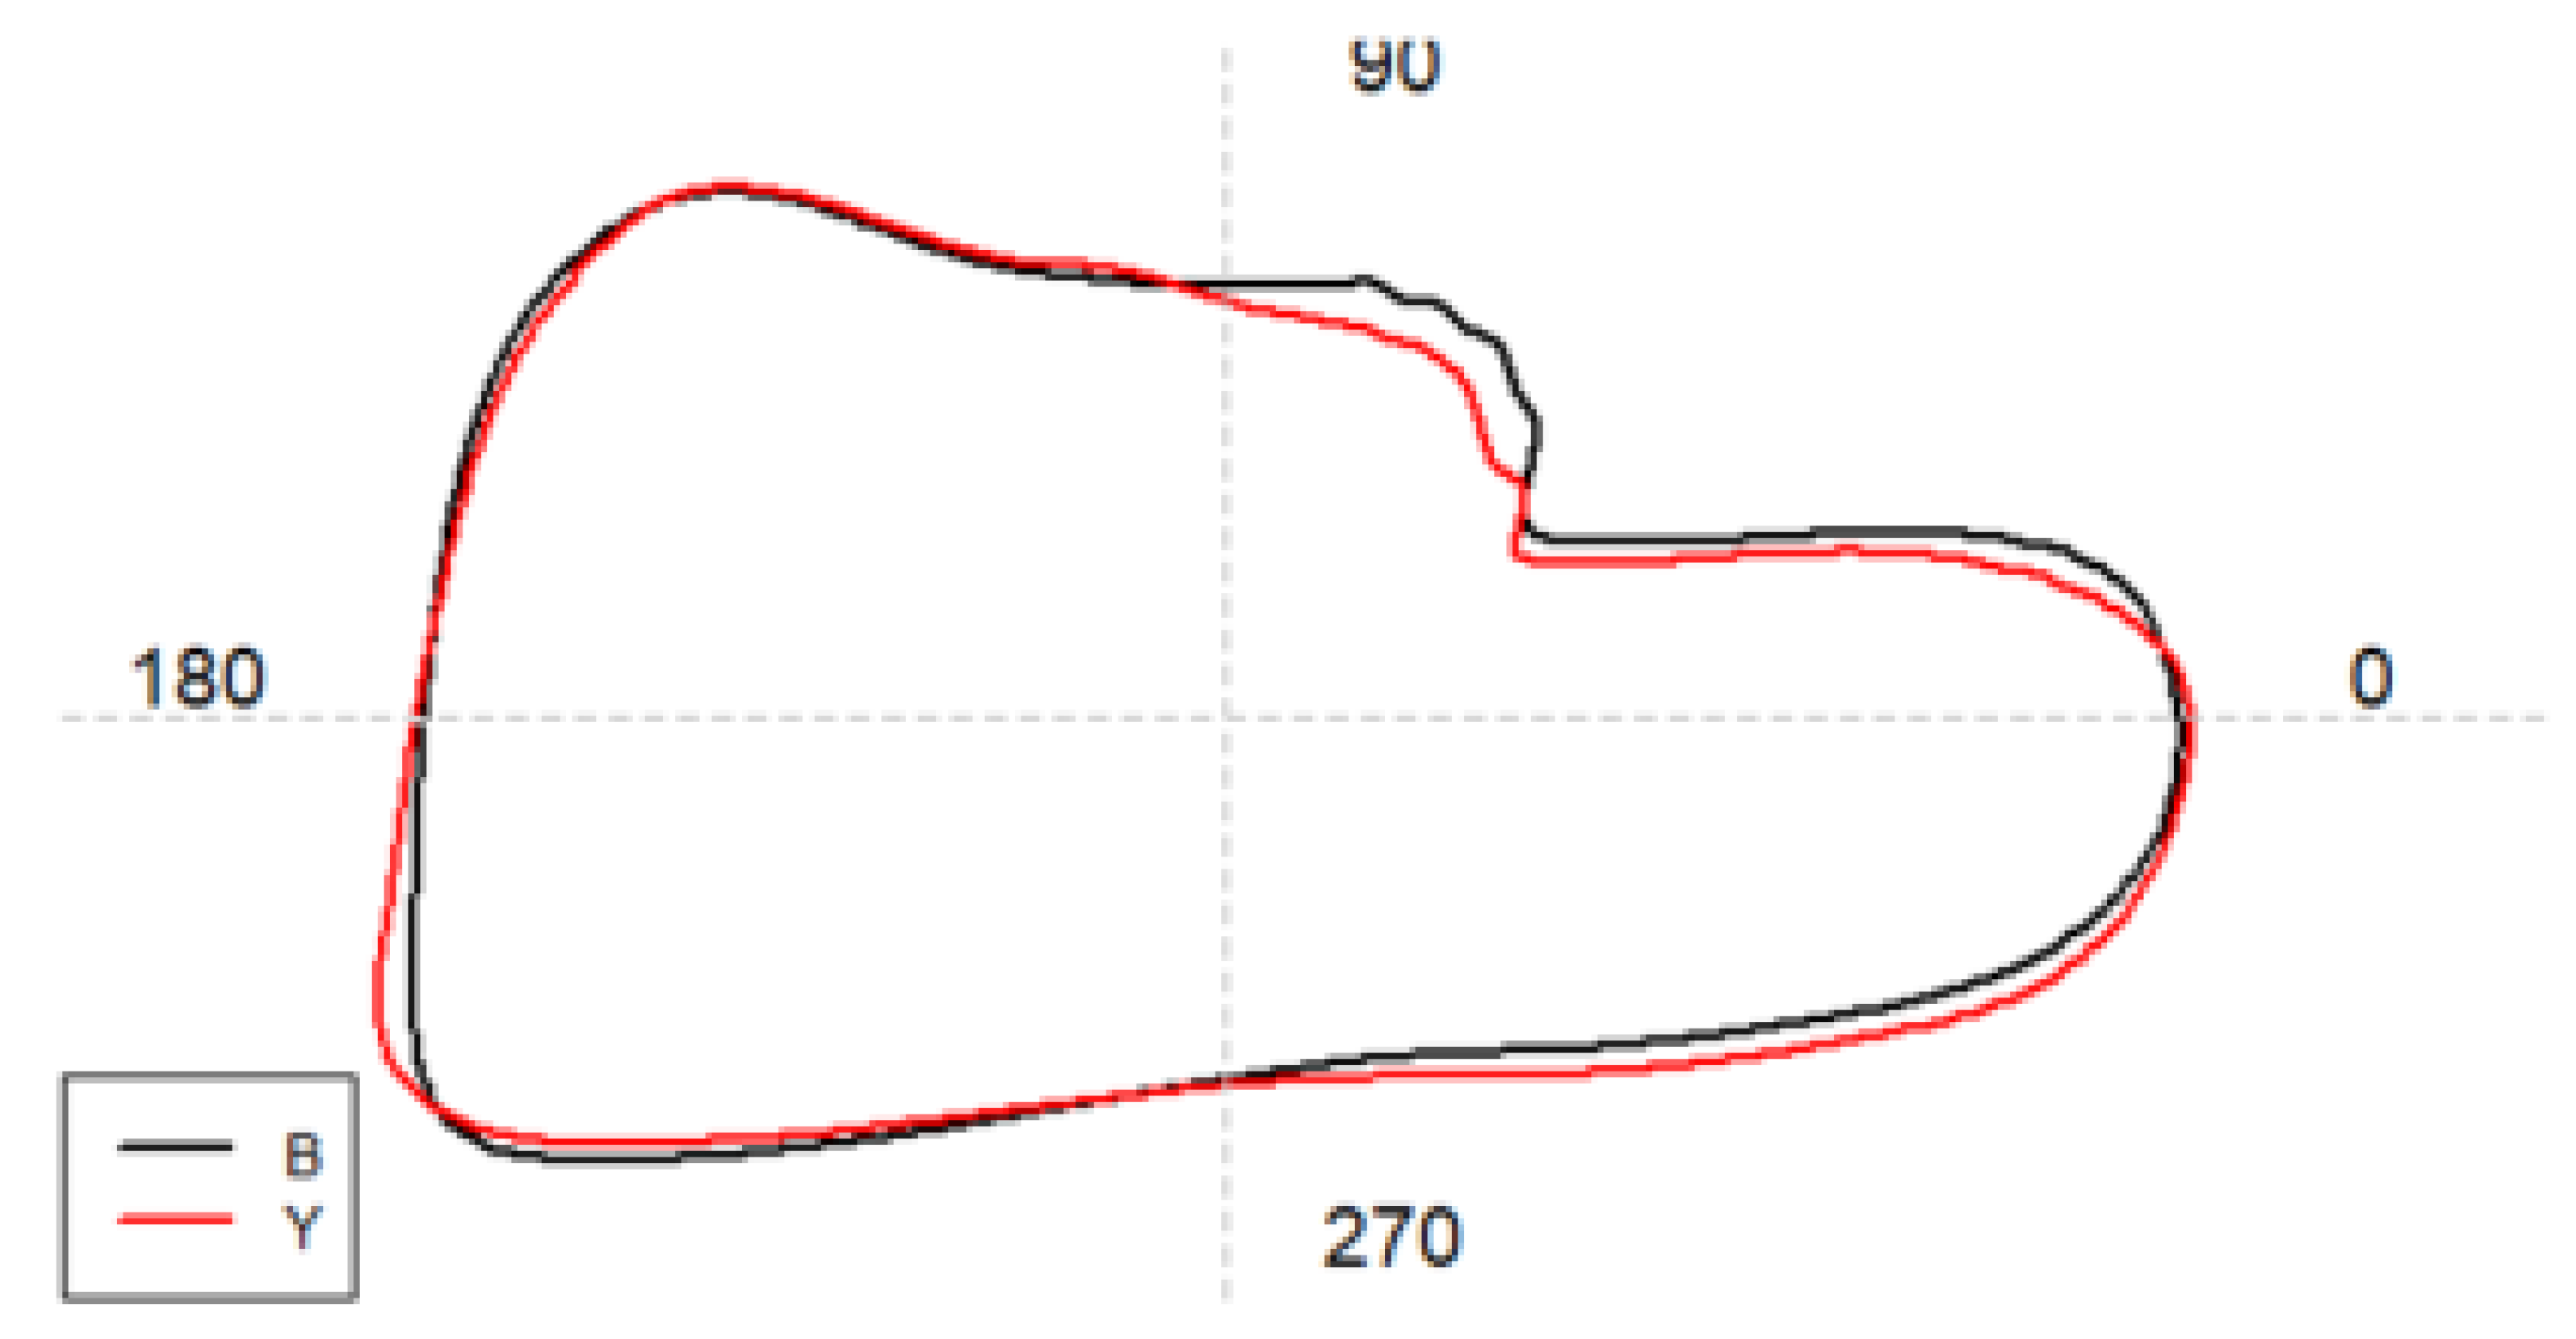
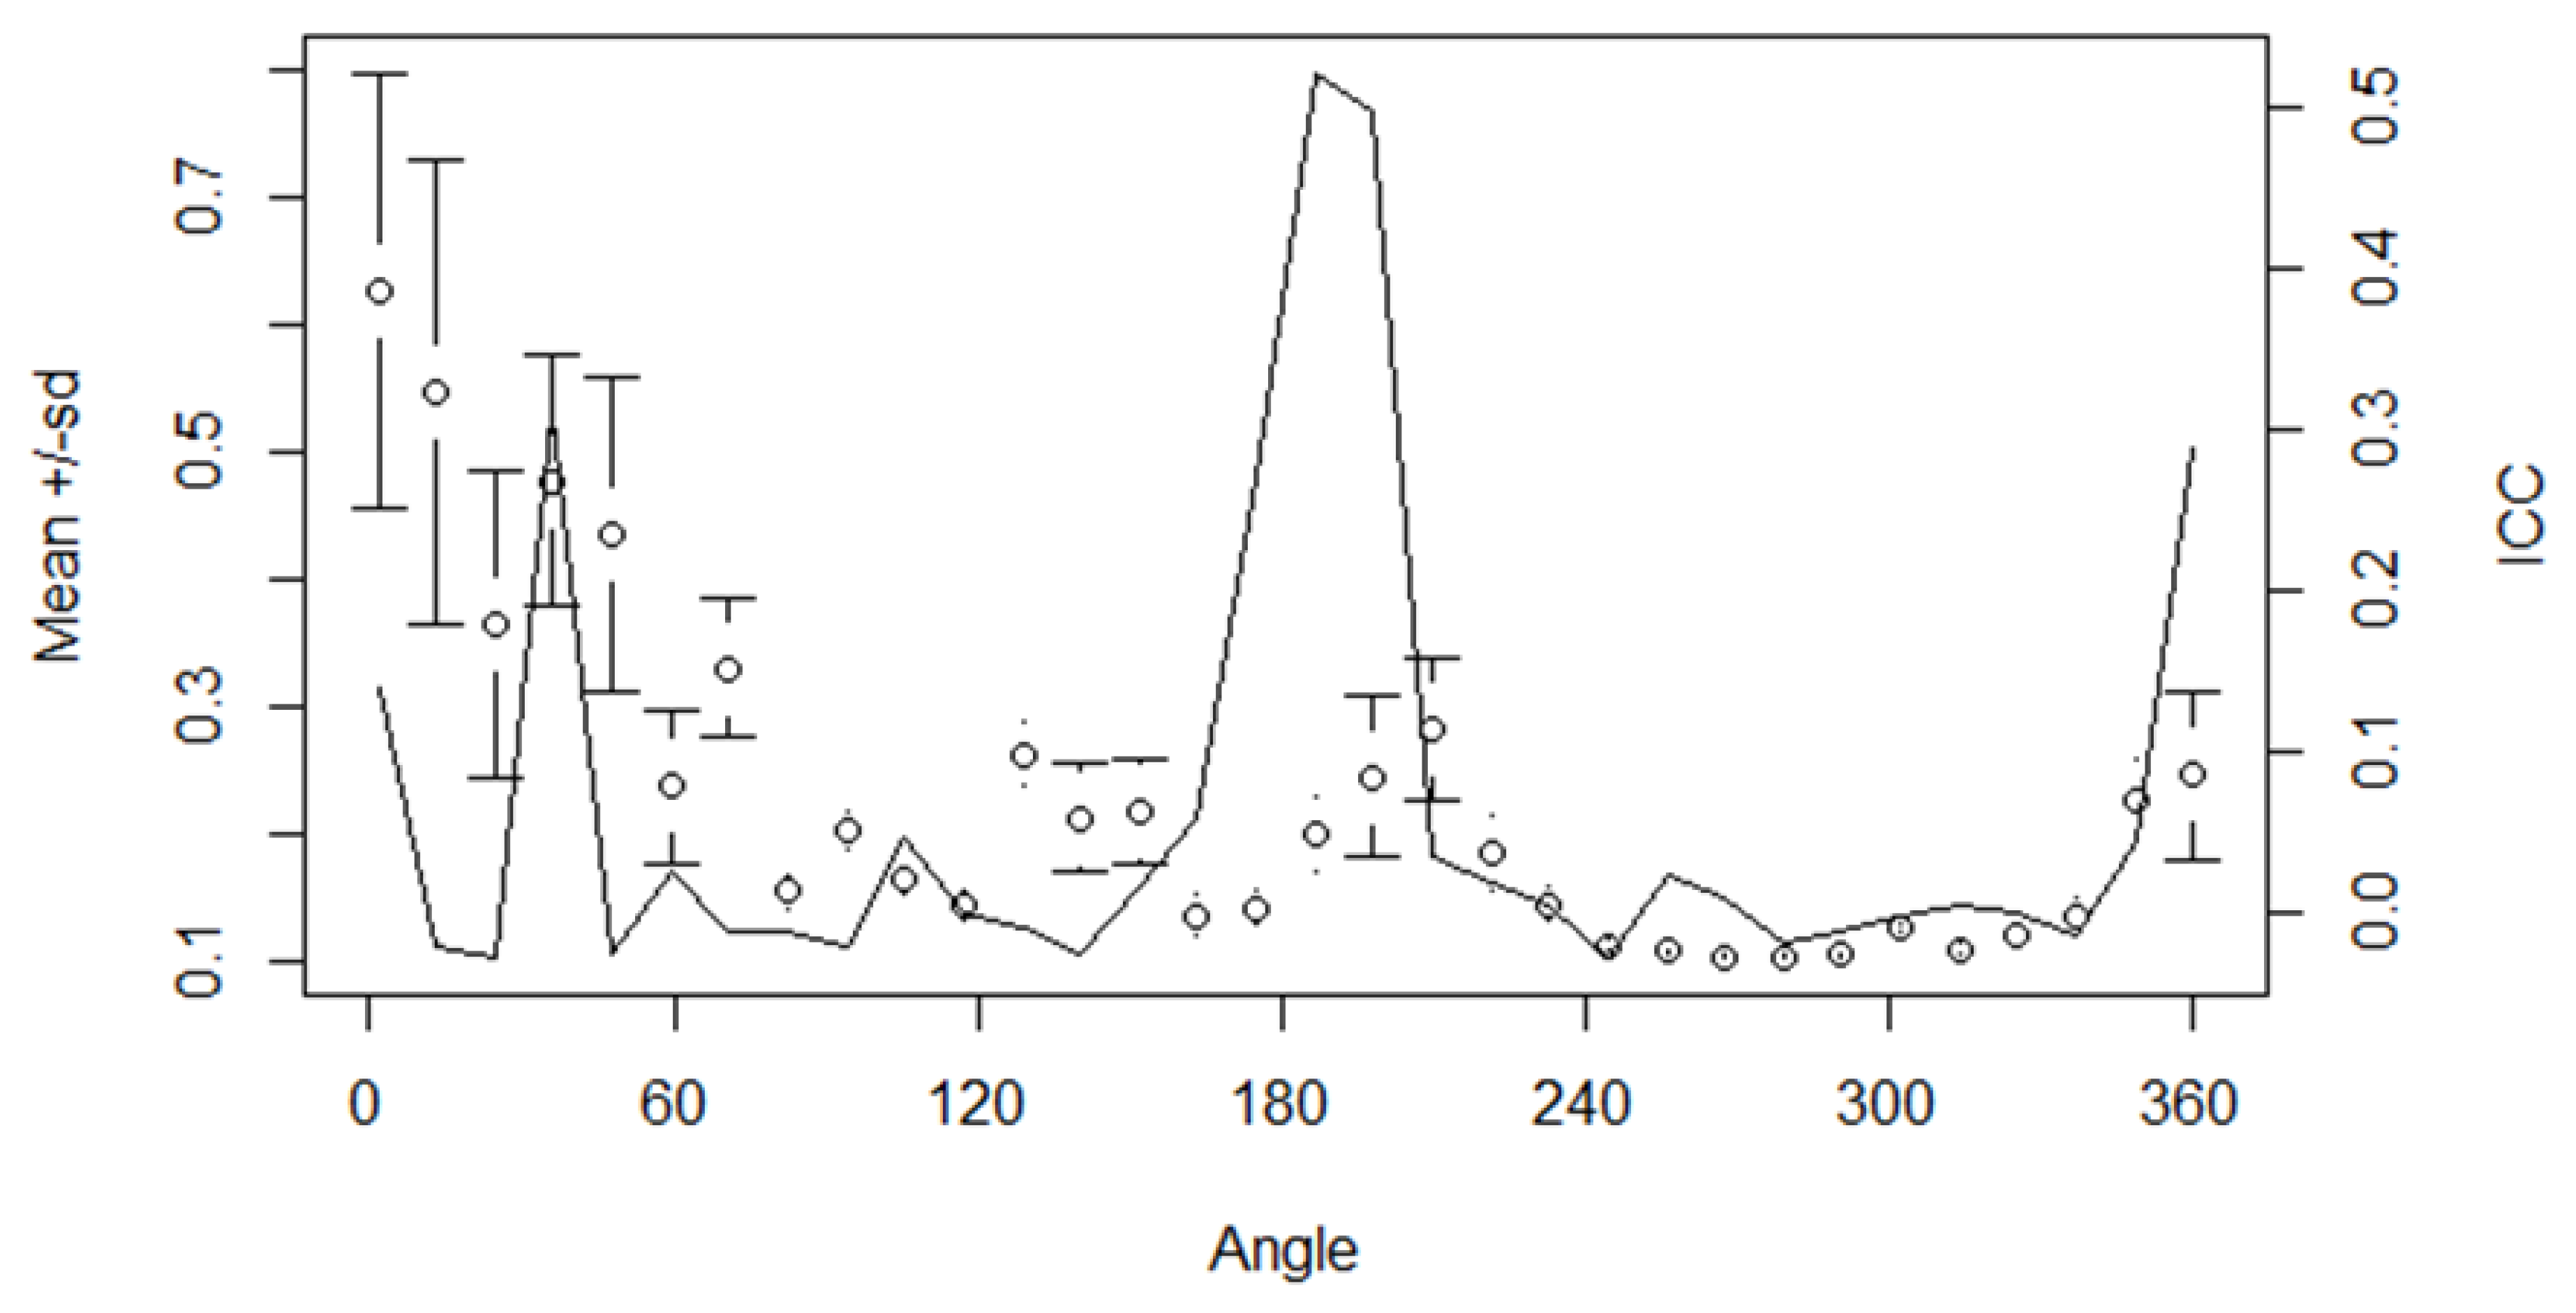
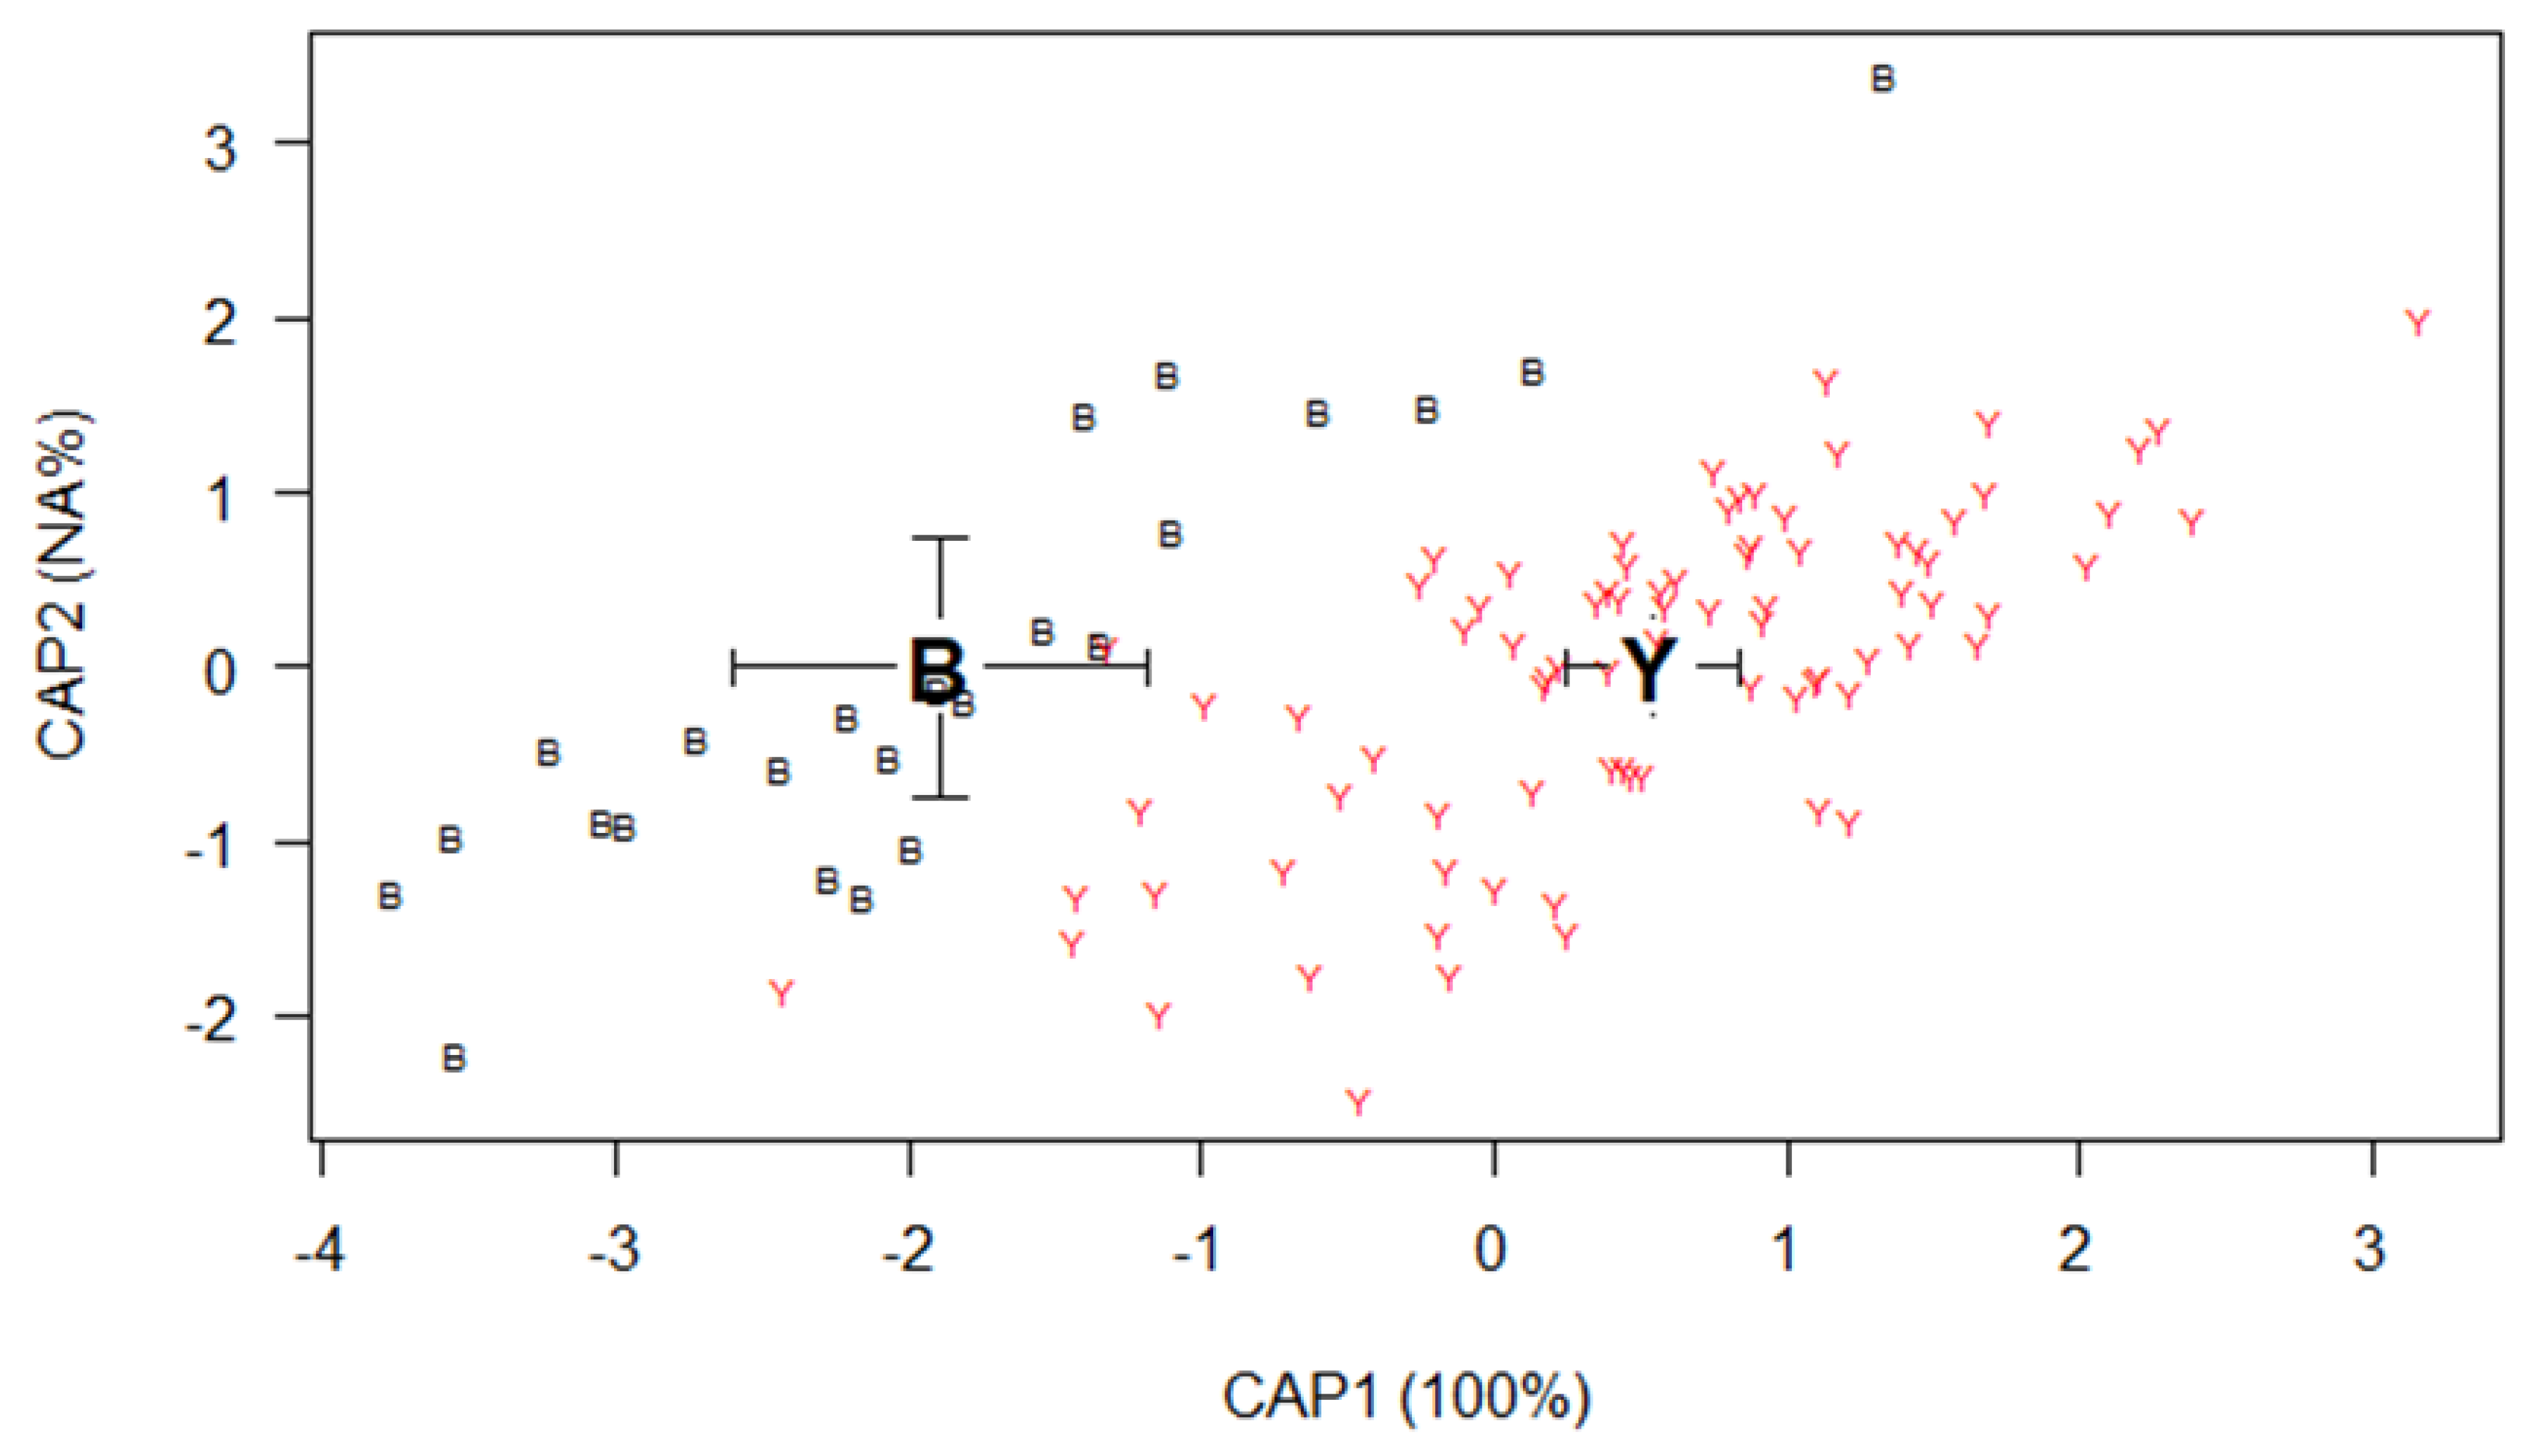
Context. Fish identification is one of the important aspects in fisheries management. This process is occasionally challenging for small/juvenile bigeye tuna (Thunnus obesus) and yellowfin tuna (Thunnus albacares) due to their similar characteristics in size and external appearance. One method to identify fish quickly and cheaply is by otolith shape analysis. Aims. This study aims to identify small bigeye tuna and yellowfin tuna using otolith shape analysis. Methods. A total of 115 bigeye tuna otoliths and 186 yellowfin tuna otoliths were collected from several fishing ports in Indonesia. Statistical analysis of the otolith shape using multivariate analysis in eight classifications based on locations and length class. Key results. There is a significant difference between the shape of otolith bigeye tuna and yellowfin tuna in all eight classifications (p<0.05). The difference in the otolith shape of this otolith is detected in the rostrum and antirostrum. This difference be present in all locations, particular locations, and in several length classes. Conclusion. Otolith shape analysis can be used for distinguishing between bigeye tuna and yellowfin tuna. Implications. The results of this study indicate that otolith shape analysis had potential to use as a method to identify small bigeye tuna and yellowfin tuna.

Keywords: 
;  ;  ;  

Introduction

Tuna is an important resource for the fishing industry in Indonesia. In addition to export commodities, tuna is also used domestically as an important food source. These types of tuna include bigeye tuna (Thunnus obesus) and yellowfin tuna (Thunnus albacares). Bigeye (T. obesus) and yellowfin tuna (T. albacares) are economically important fish for tuna fisheries in Indonesia. From the Indian Ocean, the production of both is the largest compared to other types of big tuna such as albacore (T. alalunga) and southern bluefin tuna (T. maccoyii). In the period 2009-2018, the catch of bigeye tuna reached 260 thousand tons and yellowfin tuna by 272 thousand tons. Meanwhile, the catch of albacore is only 92 thousand tons, and the catch of southern bluefin tuna is even smaller, which is only 6 thousand tons [1].
In general, tuna products for export destination are large size with excellent flesh quality. This large tuna is usually caught using longline and handline. As for domestic needs, small-sized tuna products with good quality (less than export quality). These small tunas are usually caught using purse seine and troll-line [2]. In general, the destination countries for tuna product exports from Indonesia are Japan and the European Union [3].
Identification of fish species is very important in fisheries management. One of them is to understand the production and the status of the fishery [4,5]. Inaccuracy of species identification can lead to miss management of the fishery. This condition will cause overexploitation and depletion of the species [6].
One of the problems in tuna fisheries is identifying the small fish between bigeye and yellowfin tuna. In medium and large fish, bigeye and yellowfin tuna are easy to distinguish from their external appearances. Not so for these two types for small size fish which it shapes and appearance of these two species are very similar. This difficulty will increase if the external appearance of the fish is damaged due to interaction with fishing gear and handling on board [7].
In the good condition, small bigeye and yellowfin tuna are possible to distinguish by expert in fish identification. However, for common person or staff, it is difficult to distinguish these two species since they show similar appearances. Small-scale trader in fish market named them as “baby tuna” to refer small bigeye and yellowfin tuna. One way to identify these species is by genetic analysis. In addition, observing the liver can also distinguish these two species. Three rounded lobes of bigeye tuna liver are about the equal size. While on the yellowfin tuna liver, right lobe is longer and thinner than middle and left lobes [8].
Another method to identify fish species is by otolith shape analysis. This method has been applied for several fisheries such as: redfish (Sebastidae) in Russian waters [9], gobies (Gobiidae) in Black Sea [10,11], and several fish families in Arabian Gulf . This study aims to determine the effectiveness of otolith shape analysis to identify small bigeye and yellowfin tuna. The results of this study are expected to provide an alternative method to identify small bigeye and yellowfin tuna.

Materials and methods

Data collection

Otoliths samples of bigeye and yellowfin tuna were collected in June 2013 and July 2014 in four locations in Indonesia: Padang (West Sumatra), Palabuhanratu (West Java), Bitung (North Sulawesi), and Sorong (West Papua) (Figure 1). This sampling was part of ACIAR project on the population structure of bigeye and yellowfin tuna in Indonesia. This project was research collaboration between CSIRO-Australia and KKP-Indonesia [12].

Otolith shape analysis

The image of the whole otolith was taken using a stereo microscope (Leica M80) connected to a digital camera. The magnification used is 6.5 times against a black background. This image capture is equipped with information on the image density scale (pixel) with the unit length (mm). The image is then edited to the brightness level so that the outline of the otolith is clearly visible using ImageJ software. This image manipulation was carried out to obtain accurate otolith morphometric data. In shooting, the otolith is positioned with the postrostrum on the left and the ventral on the bottom.

Statistical analysis

In this research, otolith shape of bigeye tuna was compared with it of yellowfin tuna in eight simulations, i.e.: All locations with length class of 30-35 cm, All locations with length class of 35-40 cm, All locations with length class of 40-45 cm, All locations with length class of 45-50 cm, Palabuhanratu with length class of 30-35 cm, Padang with length class of 35-40 cm, Sorong and Bitung with length class of 40-45 cm, and Sorong and Bitung with length class of 45-50 cm. Sorong and Bitung are grouped together because they are close together and have the same fishing area. Other alternative simulations were not conducted due to the lack or insufficient number of samples.

Results

A total of 301 otoliths were collected consisting of 115 bigeye tuna otoliths and 186 yellowfin tuna otoliths (Table 1).
Table 1. Fork length of bigeye tuna (T. obesus) and yellowfin tuna (T. albacares) from all locations.
Preprints 148201 i001
In general, the otolith shape analysis showed the difference between otolith shape of bigeye tuna and yellowfin tuna in all eight classifications (Figure 2). These differences mainly occurred in rostrum and antirostrum. The length of yellowfin tuna rostrum is longer than it of bigeye tuna. Whereas the length of bigeye tuna antirostrum is longer than it of yellowfin tuna. ANOVA-like permutation test of otolith shape showed significant difference (p<0.05) between bigeye and yellowfin tuna (Table 2).
Table 2. ANOVA-like permutation test of otolith shape between bigeye tuna (be) and yellowfin tuna (yf).
Preprints 148201 i002
Case study from all locations with length class 30-35 cm
For fish with a length class of 30-35 cm, a total of 109 otoliths were collected consisting of 25 bigeye tuna otoliths and 84 yellowfin tuna otoliths. The results showed that the average sizes of yellowfin tuna otolith were larger than bigeye tuna otolith (Table 3).
Table 3. Otolith variables of bigeye tuna (T. obesus) and yellowfin tuna (T. albacares) from all locations.
Preprints 148201 i003
Average otolith shape analysis showed that there is a difference in the distance from the centre to the Rostrum (R) and Antirostrum (Ar) section. This distance from the centre to the two parts in bigeye tuna is longer than the distance in yellowfin tuna. Meanwhile, the distance from the centre to the Postrostrum (Pr) and Excisura major (Em) sections is relatively the same (Figure 3).
The distance from the center and outer boundary of the otolith is also calculated from the mean wavelet coefficient and the interclass correlation (ICC) at each coordinate that represents the outer portion of the otolith. The results of the analysis also show that the high value is at an angle of ~ 30° (R/Rostrum) and an angle of ~ 80° (Ar/Antirostrum). Therefore, these two parts have high variations between the two species (Figure 4).
The variation of bigeye and yellowfin tuna otolith were tested using multivariate statistical cluster analysis using the canonical analysis of principle coordinate (CAP). The analysis showed that the variation in the shape of the otolith could only be explained from the first axis (CAP1) (Figure 5). This occurred because it only compares two variables i.e., bigeye and yellowfin tuna otolith. Furthermore, testing the variation of the otolith shape was also carried out by the ANOVA-like permutation test (n = 1,000). The ANOVA test results showed that there was significantly difference in the otolith shape of bigeye and yellowfin tuna with length 30-35 cm from all locations (P = 0.001).

Discussion

Tuna fisheries is one of the important commodities for the fisheries sector in the Indian Ocean. Total tuna production in the Indian Ocean was 10.3 million tons in 2000-2018 [13]. The countries with the largest production are Taiwan, Spain, and Indonesia. These three countries account for more than a third of the total tuna production in the Indian Ocean.
In Indonesia, tuna fisheries are an important source of business for both small and industrial scale fishermen. Apart from being an important source of food, tuna fisheries also provide an important source of employment and income for fishing communities in Indonesia [14,15]. Two species of tuna that are important for tuna fisheries in Indonesia are bigeye tuna (Thunnus obesus) and yellowfin tuna (Thunnus albacares).
These two fish account for about 85% of the total production of large tuna groups in Indonesia [13]. The other two types are albacore (Thunnus alalunga) and southern bluefin tuna (Thunnus maccoyii). Like other tunas, bigeye and yellowfin tuna are oceanic, long-distance migratory fish that found throughout the world's oceans [16,17]. This fish is able to dive to a depth of up to 250 m, but is mostly found at depths of up to 100 m [18,19].
Both fish can grow to a fork length of 161 cm for bigeye tuna and 152 cm for yellowfin tuna. The biological parameters for bigeye tuna were Linf = 161 cm FL, k = 0.24/yr, and t0 = -2.26 yr. Meanwhile, the biological parameters for yellowfin tuna were Linf = 152 cm FL, k = 0.40/yr, and t0 = -0.55 yr [20]. The longevity for bigeye tuna is 12.6 years [21] and 15 years for yellowfin tuna [20].
The status of the bigeye tuna fishery in the Indian Ocean is not overfished but subject to overfishing since If the utilization rate remains at current levels, there is a risk of exceeding the maximum sustainable yield (MSY) in the next few years. Therefore, measurable efforts are needed to reduce the catch by 10% of the current catch so that it does not exceed the MSY value. In addition, monitoring, data collection, reporting, and analysis activities need to be continued and improved in quality to reduce the uncertainty factor in the stock estimation process [1].
Meanwhile, the status of the yellowfin tuna fishery is in a state of overfished and subject to overfishing since This is due to the very large catches of the previous three years. This condition is worsened by the low recruitment rate that has occurred for several years. Therefore, the Indian Ocean Tuna Commission (IOTC) issued a special resolution to restore the status of the yellowfin tuna stock to recover. This resolution expressly obliges member states to reduce yellowfin tuna catches by 5-15% of 2014 catches [1].

Shape analysis

Shape analysis is an activity to obtain, process, and analyse an image automatically using digital equipment. The results obtained can then be classified in various fields and needs [22]. Some fields that use shape analysis for their activities are health, biology, physics, engineering, agriculture, fisheries, and others.
In the health sector, shape analysis is used to determine the level of good sleep quality. In this case, form analysis investigated changes in amygdala structure (play important role in emotion) between patients with insomnia and healthy controls. This study succeeded in determining the location of changes in the amygdala associated with the severity of insomnia using the shape analysis method [23]. In the field of biology, analysis is used to identify and verify cells. The process is by identifying the object through the study of the angles and shape of an object. This shape analysis technique can improve the process of cell verification and identification [24].
In physics, shape analysis is used to determine the growth of crystals in different solutions. In this study, it was found that crystal growth was strongly influenced by acetone solution compared to other solutions [25]. In the field of engineering, shape analysis is used to determine the response of the shape index to the level of variation of the building in detail at various scales. In this study, the shape analysis method was shown to contribute to reducing problems caused by differences in scale [26]. In agriculture, shape analysis is used to determine the geographic variability of dwarf honeybee (Apis florea). The study shows that shape analysis can effectively differentiate populations based on wing shape [27].
In fisheries, shape analysis is widely used in several studies. The object that is usually used in shape analysis is the otolith. Otolith shape analysis can be used to determine age, stock identification, species identification, and others. Previous study showed that otolith shape analysis was used to determine the age of eel (Anguilla anguilla). The study showed that the structure and size of the otolith shape were closely related to the eel age. The otolith shape of the adult eel is more dented than the young eel, which tends to be round [28]. This technique also successful in determining the age and growth pattern of juvenile red snapper (Lutjanus campechanus) [29] and Belanger’s croaker (Johnius belangerii) [30].
Otolith shape analysis was also used to identify fish stocks. This technique is done by comparing the shape of the otolith in the same species from several different locations. This method was successful in identifying haddock (Melanogrammus aeglefinus) [31], common coral trout (Plectropomus leopardus) [32], southern blue whiting (Micromesistius australis) [33], horse mackerel (Trachurus trachurus) [34], and catfishes that belong to genus Mystus [35].
Otoliths are commonly used for species identification processes because these parts sustain or experience less damage than other body parts. This resistant ability because otoliths have a special calcareous structure consisting of calcium carbonate and other types of salts that are stored in a protein matrix [36]. With this resistance, otoliths can identify the fish species found in stomach content [37].
Several methods are used in the study of fish stock discrimination such as genetics, microchemistry, and tagging. These methods proved capable of separating different fish stocks. However, the analysis of these methods is generally expensive, time-consuming, and requires specialized laboratories [38]. While the otolith shape analysis method is relatively cheaper, shorter in time, and easier to implement [39]. This method only needs special software in the analysis process [40]. Particular matter that needs to be considered in applying this otolith shape analysis is the need to choose the most appropriate statistical test to analyse the results [41].
In general, morphometric analysis can be classified into two methods, namely the landmark method and the outline method. The landmark method is based on anatomical points or landmarks for morphometric analysis. While the outline method is used to identify the different patterns in the otolith shape [42]. Therefore, this study uses the outline method to determine the differences in the otolith shape of bigeye tuna and yellowfin tuna.
Simple fish identification method can be conducted by meristic and morphometric methods. The meristic method is to analyse quantifiable characteristics such as the number of gills rakers and the number of spines on the dorsal fins. While the morphometric method is to analyse the characteristics that can be measured such as fork length and whole weight. Both methods can classify fish into taxa levels. Even in some fish, this method is able to classify to the species level [43,44,45].
However, in some cases, this method is difficult to implement. As in small bigeye and yellowfin tuna have very identical meristic and morphometric characteristics. The conditions can be more difficult if the external appearance of the fish is damaged due to interactions with fishing gear or during fish processing on board [46]. This situation makes it more difficult to identify these two species only from meristic and morphometric approaches.
One way to identify the difference between small bigeye and yellowfin tuna is examine at the liver. Liver has three lobes with relatively the same length. While in yellowfin tuna liver, the right lobe is longer and thinner than the other two lobes [8].
The more complicated method used to identify fish species is genetic analysis. Genetic analysis is the whole process of observing living things which includes aspects of genetics and molecular biology [47]. This method is able to distinguish canned bigeye and yellowfin tuna [48].
This study showed that otolith shape analysis was able to identify bigeye tuna and yellowfin tuna. Therefore, this method can be used as an alternative if other methods such as morphometric, meristic, and genetic cannot be performed. In addition, this otolith shape analysis also has advantages because the process is simpler, faster, and cheaper.

Funding

This study was funded by Australian Centre for International Agricultural Research (ACIAR) (Project: FIS/2009/059).

Data Availability Statement

The data that support this study will be shared upon reasonable request to the corresponding author.

Acknowledgments

The authors are grateful to all team members from Research Centre for Fisheries (Jakarta), Research Institute for Marine Fisheries (Jakarta), and Research Institute for Tuna Fisheries (Bali) for sample collection. The authors thank Naomi Clear (CSIRO) for sample processing in the laboratory. The authors also thank Robert Walch and Simon Karpinskyj (Walch Optics) for image analysis.

Conflicts of Interest

The authors declare that they have no conflict of interest.

References

  1. IOTC. Report of the 22nd Session of the IOTC Working Party on Tropical Tunas, Stock Assessment Meeting; Indian Ocean Tuna Commission: Mahe, Seychelles, 2020. [Google Scholar]
  2. Alimina, N.; Wiryawan, B.; Monintja, D.R.O.; Nurani, T.W.; Taurusman, A.A. Comparing different small-scale tuna fishery suppliers: a case study on trolling line and pole and line in Southeast Sulawesi, Indonesia. Aquaculture, Aquarium, Conservation & Legislation 2015, 8, 500–506. [Google Scholar]
  3. Wiranthi, P.E.; Aminudin, I.; Dewi, E.R. A Gravity Model for Indonesian Canned Tuna Exports to The European Union Market: An Application of PPML Estimator. SRIWIJAYA INTERNATIONAL JOURNAL OF DYNAMIC ECONOMICS AND BUSINESS 2019, 3, 31. [Google Scholar] [CrossRef]
  4. Lleonart, J.; Taconet, M.; Lamboeuf, M. Integrating information on marine species identification for fishery purposes. Marine Ecology Progress Series 2006, 316, 231–238. [Google Scholar] [CrossRef]
  5. Tillett, B.J.; Field, I.C.; Bradshaw, C.J.A.; Johnson, G.; Buckworth, R.C.; Meekan, M.G.; Ovenden, J.R. Accuracy of species identification by fisheries observers in a north Australian shark fishery. Fisheries Research 2012, 127, 109–115. [Google Scholar] [CrossRef]
  6. Garcia-Vazquez, E.; Machado-Schiaffino, G.; Campo, D.; Juanes, F. Species misidentification in mixed hake fisheries may lead to overexploitation and population bottlenecks. Fisheries Research 2012, 114, 52–55. [Google Scholar] [CrossRef]
  7. Wiryanti, J.; Glynn, G.F.; Limpus, L.G. Improved quality control for the handling and processing of fresh and frozen tuna at sea and on shore; Southeast Asian Fisheries Development Centre (SEAFDEC): Singapore, 1997; p. 168. [Google Scholar]
  8. Fukofuka, S.; Itano, D.G. Handbook for the Identification of Yellowfin and Bigeye Tunas in Fresh, but Less Than Ideal Condition (v6); Western and Central Pacific Fisheries Commission: Noumea, New Caledonia, 2006. [Google Scholar]
  9. Afanasyev, P.K.; Orlov, A.M.; Rolsky, A.Y. Otolith Shape Analysis as a Tool for Species Identification and Studying the Population Structure of Different Fish Species. Biology Bulletin 2017, 44, 952–959. [Google Scholar] [CrossRef]
  10. Bănaru, D.; Morat, F.; Creteanu, M. Otolith shape analysis of three gobiid species of the Northwestern Black Sea and characterization of local populations of Neogobius melanostomus. Cybium : Revue Internationale d’Ichtyologie 2017, 41, 325–333. [Google Scholar]
  11. Lin, Y.-J.; Al-Abdulkader, K. Identification of fish families and species from the western Arabian Gulf by otolith shape analysis and factors affecting the identification process. Marine and Freshwater Research 2019. [Google Scholar] [CrossRef]
  12. Proctor, C.; Lester, R.; Clear, N.; Grewe, P.; Moore, B.; Eveson, J.; Lestari, P.; Wujdi, A.; Taufik, M. ; Wudianto; et al. Population structure of yellowfin tuna (Thunnus albacares) and bigeye tuna (T. obesus) in the Indonesian region; Australian Centre for International Agricultural Research: Canberra, Australia, 2019. [Google Scholar]
  13. IOTC. IOTC Online Data Querying Service. Indian Ocean Tuna Commission: 2020.
  14. Duggan, D.E.; Kochen, M. Small in scale but big in potential: Opportunities and challenges for fisheries certification of Indonesian small-scale tuna fisheries. Marine Policy 2016, 67, 30–39. [Google Scholar] [CrossRef]
  15. Borland, M.E.; Bailey, M. A tale of two standards: A case study of the Fair Trade USA certified Maluku handline yellowfin tuna (Thunnus albacares) fishery. Marine Policy 2019, 100, 353–360. [Google Scholar] [CrossRef]
  16. Meltzer, E. GLOBAL OVERVIEW OF STRADDLING AND HIGHLY MIGRATORY FISH STOCKS - THE NONSUSTAINABLE NATURE OF HIGH SEAS FISHERIES. Ocean Development and International Law 1994, 25, 255–344. [Google Scholar] [CrossRef]
  17. Reygondeau, G.; Maury, O.; Beaugrand, G.; Fromentin, J.M.; Fonteneau, A.; Cury, P. Biogeography of tuna and billfish communities. Journal of Biogeography 2012, 39, 114–129. [Google Scholar] [CrossRef]
  18. Bigelow, K.A.; Hampton, J.; Miyabe, N. Application of a habitat-based model to estimate effective longline fishing effort and relative abundance of Pacific bigeye tuna (Thunnus obesus). Fisheries Oceanography 2002, 11, 143–155. [Google Scholar] [CrossRef]
  19. Dagorn, L.; Bach, P.; Josse, E. Movement patterns of large bigeye tuna (Thunnus obesus) in the open ocean, determined using ultrasonic telemetry. Marine Biology 2000, 136, 361–371. [Google Scholar] [CrossRef]
  20. Farley, J.; Krusic-Golub, K.; Eveson, P.; Clear, N.; Roupsard, F.; Sanchez, C.; Nicol, S.; Hampton, J. Age and growth of yellowfin and bigeye tuna in the western and central Pacific Ocean from otoliths. Age 2020, 11, 20. [Google Scholar]
  21. Hampton, J.; Williams, P. A description of tag-recapture data for bigeye tuna (Thunnus obesus) in the western and central Pacific Ocean. Inter. Comm. Conser. Atlan. Tunas, Coll. Vol. Sci. Pap 2005, 57, 85–93. [Google Scholar]
  22. Da Fontoura Costa, L.; Cesar Jr, R.M. Shape Analysis and Classification. 2010, 10. 1201. [Google Scholar] [CrossRef]
  23. Gong, L.; Liao, T.; Liu, D.; Luo, Q.; Xu, R.; Huang, Q.; Zhang, B.; Feng, F.; Zhang, C. Amygdala Changes in Chronic Insomnia and Their Association with Sleep and Anxiety Symptoms: Insight from Shape Analysis. Neural Plasticity 2019, 2019, 8549237. [Google Scholar] [CrossRef]
  24. Micheas, A.C.; Neil, I.F.; Lack, S.A.; Wikle, C.K. Cell identification and verification of QPF ensembles using shape analysis techniques. Journal of Hydrology 2007, 343, 105–116. [Google Scholar] [CrossRef]
  25. Lynch, A.; Verma, V.; Zeglinski, J.; Bannigan, P.; Rasmuson, Å. Face indexing and shape analysis of salicylamide crystals grown in different solvents. CrystEngComm 2019, 21, 2648–2659. [Google Scholar] [CrossRef]
  26. Basaraner, M.; Cetinkaya, S. SHAPE ANALYSIS OF MULTI-SCALE BUILDING FEATURES. Proceedings of 7th International Conference on Cartography and GIS, Sozopol, BULGARIA, Jun 18-23; pp. 426–433.
  27. Koca, A.O.; Moradi, M.G.; Deliklitas, O.; Ucan, A.; Kandemir, I. Discrimination of dwarf honey bee (Apis florea, Fabricius 1876) populations in Iran using elliptic Fourier wing cell shape analysis. Journal of Apicultural Research 2018, 57, 195–202. [Google Scholar] [CrossRef]
  28. Doering, P.; Ludwig, J. Shape Analysis of Otoliths—a Tool for Indirect Ageing of Eel,Anguilla anguilla (L.)? Internationale Revue der gesamten Hydrobiologie und Hydrographie 1990, 75, 737–743. [Google Scholar] [CrossRef]
  29. Beyer, S.G.; Szedlmayer, S.T. The use of otolith shape analysis for ageing juvenile red snapper, Lutjanus campechanus. Environmental Biology of Fishes 2010, 89, 333–340. [Google Scholar] [CrossRef]
  30. Ye, Z.J.; Zhang, C.; Panhwar, S.K.; Li, Z.G.; Wan, R. Ageing Belanger's croaker, Johnius belangerii (Cuvier, 1830), based on otolith shape analysis. Journal of Applied Ichthyology 2015, 31, 27–31. [Google Scholar] [CrossRef]
  31. Begg, G.A.; Brown, R.W. Stock identification of haddock Melanogrammus aeglefinus on Georges bank based on otolith shape analysis. Transactions of the American Fisheries Society 2000, 129, 935–945. [Google Scholar] [CrossRef]
  32. Bergenius, M.A.J.; Begg, G.A.; Mapstone, B.D. The use of otolith morphology to indicate the stock structure of common coral trout (Plectropomus leopardus) on the Great Barrier Reef, Australia. Fishery Bulletin 2006, 104, 498–511. [Google Scholar]
  33. Leguá, J.; Plaza, G.; Pérez, D.; Arkhipkin, A. Otolith shape analysis as a tool for stock identification of the southern blue whiting, Micromesistius australis. Latin american journal of aquatic research 2013. [Google Scholar] [CrossRef]
  34. Stransky, C.; Murta, A.G.; Schlickeisen, J.; Zimmermann, C. Otolith shape analysis as a tool for stock separation of horse mackerel (Trachurus trachurus) in the Northeast Atlantic and Mediterranean. Fisheries Research 2008, 89, 159–166. [Google Scholar] [CrossRef]
  35. Nair, S.M.; Gangan, S.S.; Raut, S.; Raghavan, R.; Kumar, A.P.; Singh, L.K.; Jaiswar, A.K. Otoliths as taxonomic tool to identify catfishes of the genus Mystus (Teleostei: Bagridae) from India. Indian Journal of Fisheries 2021, 68, 1–8. [Google Scholar] [CrossRef]
  36. Battaglia, P.; Malara, D.; Romeo, T.; Andaloro, F. Relationships between otolith size and fish size in some mesopelagic and bathypelagic species from the Mediterranean Sea (Strait of Messina, Italy). Scientia Marina 2010, 74, 605–612. [Google Scholar] [CrossRef]
  37. Bremm, C.; Schulz, U. Otolith atlas of fish of the Sinos River. Brazilian Journal of Biology 2014, 74, 274–282. [Google Scholar] [CrossRef]
  38. Bostanci, D.; Polat, N.; Kurucu, G.; Yedier, S.; Kontaş, S.; Darçin, M. Using otolith shape and morphometry to identify four Alburnus species (A. chalcoides, A. escherichii, A. mossulensis and A. tarichi) in Turkish inland waters. Journal of Applied Ichthyology 2015, 31, 1013–1022. [Google Scholar] [CrossRef]
  39. Farias, I.; Vieira, A.R.; Gordo, L.S.; Figueiredo, I. Otolith shape analysis as a tool for stock discrimination of the black scabbardfish, Aphanopus carbo Lowe, 1839 (Pisces: Trichiuridae), in Portuguese waters. Scientia Marina 2009, 73, 47–53. [Google Scholar] [CrossRef]
  40. Randon, M.; Le Pape, O.; Ernande, B.; Mahé, K.; Volckaert, F.A.; Petit, E.J.; Lassalle, G.; Le Berre, T.; Réveillac, E. Complementarity and discriminatory power of genotype and otolith shape in describing the fine-scale population structure of an exploited fish, the common sole of the Eastern English Channel. PloS one 2020, 15, e0241429. [Google Scholar] [CrossRef] [PubMed]
  41. Tracey, S.R.; Lyle, J.M.; Duhamel, G. Application of elliptical Fourier analysis of otolith form as a tool for stock identification. Fisheries Research 2006, 77, 138–147. [Google Scholar] [CrossRef]
  42. Cadrin, S.X.; Kerr, L.; Mariani, S. Stock identification methods : applications in fishery science, 2nd edition / edited by Steven Cadrin, Lisa A. Kerr, Stefano Mariani. ed.; Academic Press: 2013.
  43. de Astarloa, J.M.D.; Bezzi, S.I.; Castro, M.G.; Mabragana, E.; Hernandez, D.; Delpiani, S.M.; Figueroa, D.E.; Cousseau, M.B.; Antoni, M.Y.D.; Tringali, L. Morphological, morphometric, meristic and osteological evidence for two species of hake (Actinopterygii: Gadiformes: Merluccius) in Argentinean waters. Journal of Fish Biology 2011, 78, 1336–1358. [Google Scholar] [CrossRef]
  44. Haniffa, M.A.; Abiya, J.S.; Milton, J.; Ramesh, K.; Bhat, A.A.; Chelliah, A. Morphometric, meristic and ISSR marker systems for species identification and evolutionary analysis in five Indian Channids. Biochemical Systematics and Ecology 2014, 55, 131–136. [Google Scholar] [CrossRef]
  45. Quist, M.C.; Bower, M.R.; Hubert, W.A.; Parchman, T.L.; McDonald, D.B. Morphometric and Meristic Differences among Bluehead Suckers, Flannelmouth Suckers, White Suckers, and Their Hybrids: Tools for the Management of Native Species in the Upper Colorado River Basin. North American Journal of Fisheries Management 2009, 29, 460–467. [Google Scholar] [CrossRef]
  46. Amandè, M.J.; Ariz, J.; Chassot, E.; de Molina, A.D.; Gaertner, D.; Murua, H.; Pianet, R.; Ruiz, J.; Chavance, P. Bycatch of the European purse seine tuna fishery in the Atlantic Ocean for the 2003–2007 period. Aquatic Living Resources 2010, 23, 353–362. [Google Scholar] [CrossRef]
  47. Begg, G.A.; Keenan, C.P.; Sellin, M.J. Genetic variation and stock structure of school mackerel and spotted mackerel in northern Australian waters. Journal of Fish Biology 1998, 53, 543–559. [Google Scholar] [CrossRef]
  48. Bojolly, D.; Doyen, P.; Le Fur, B.; Christaki, U.; Verrez-Bagnis, V.; Grard, T. Development of a qPCR Method for the Identification and Quantification of Two Closely Related Tuna Species, Bigeye Tuna (Thunnus obesus) and Yellowfin Tuna (Thunnus albacares), in Canned Tuna. Journal of Agricultural and Food Chemistry 2017, 65, 913–920. [Google Scholar] [CrossRef]
Figure 1. Sampling locations for bigeye tuna (T. obesus) and yellowfin tuna (T. albacares) in Padang (1), Palabuhanratu (2), Bitung (3), and Sorong (4).
Preprints 148201 g001
Figure 2. Mean otolith shape based on Wavelet reconstruction between bigeye tuna (B) and yellowfin tuna (Y).
Preprints 148201 g002
Figure 3. Mean otolith shape based on wavelet reconstruction of bigeye tuna (B) and yellowfin tuna (Y).
Preprints 148201 g003
Figure 4. Mean (+/- standard deviation) of the wavelet coefficient and the interclass correlation (ICC) shows in black line.
Preprints 148201 g004
Figure 5. Canonical value for otolith shape of bigeye tuna (T. obesus) and yellowfin tuna (T. albacares) based on wavelet coefficient. Big letters show the mean canonical value and small letters represent individual fish of each species.
Preprints 148201 g005
Disclaimer/Publisher’s Note: The statements, opinions and data contained in all publications are solely those of the individual author(s) and contributor(s) and not of MDPI and/or the editor(s). MDPI and/or the editor(s) disclaim responsibility for any injury to people or property resulting from any ideas, methods, instructions or products referred to in the content.
Copyright: This open access article is published under a Creative Commons CC BY 4.0 license, which permit the free download, distribution, and reuse, provided that the author and preprint are cited in any reuse.
Prerpints.org logo

Preprints.org is a free preprint server supported by MDPI in Basel, Switzerland.

Subscribe

Disclaimer

Terms of Use

Privacy Policy

Privacy Settings

© 2025 MDPI (Basel, Switzerland) unless otherwise stated