2.1. Research Methodology
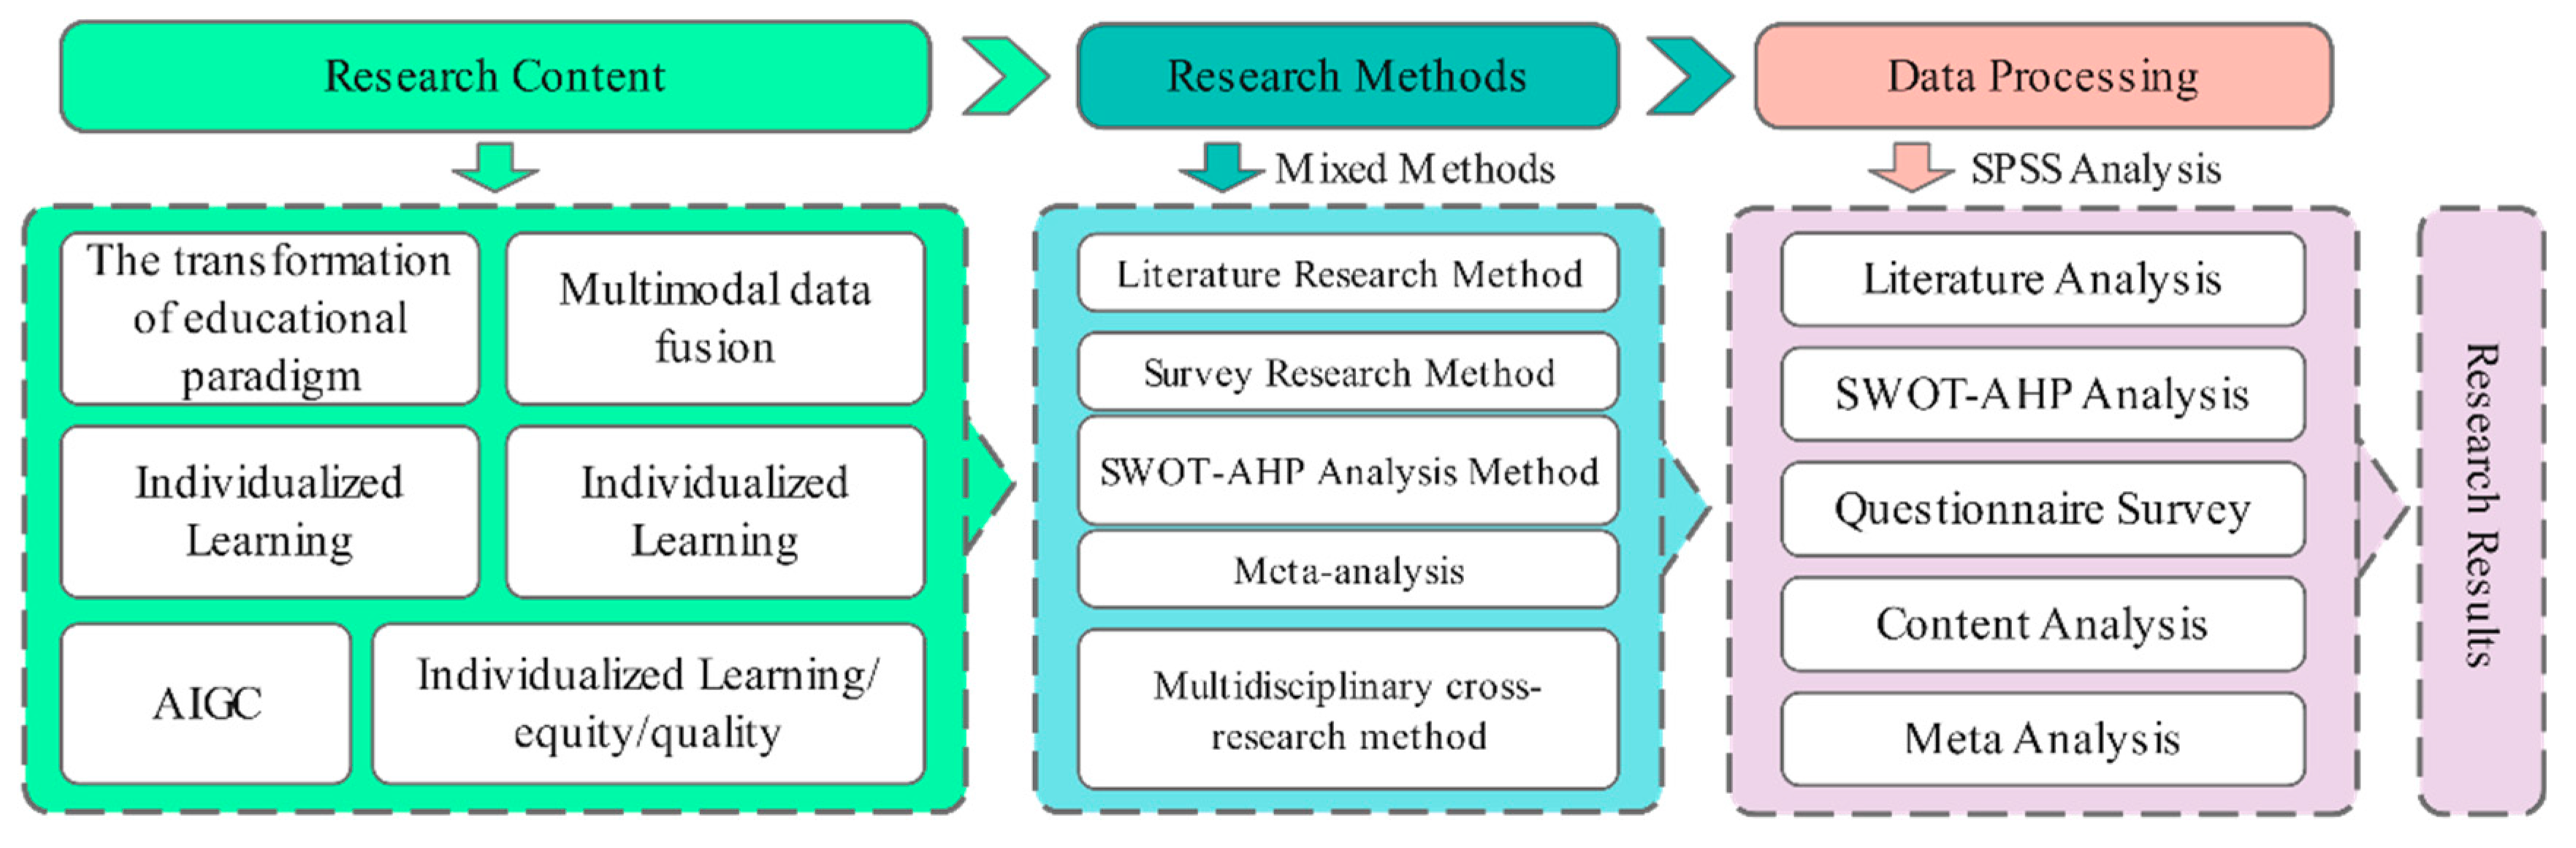
To thoroughly explore the role and challenges of Artificial Intelligence Generated Content (AIGC)-driven Personalized learning in promoting educational sustainability, this study decided to adopt a mixed research method of literature review and questionnaire survey (the questionnaire design is based on SWOT-AHP) to combine the advantages of these two research methods in the research design[
96]. This method provides a broad understanding from a macro perspective and explores the relationship between individual student experiences and behaviours from a micro perspective, providing more comprehensive and detailed data and results for the study as a whole[
97].
First, we will send more than 1,000 online questionnaires to students at Chinese universities. The questionnaire design will be based on the results of a preliminary literature review[
39,
43,
78,
79,
80,
81,
82,
83,
84,
85,
86,
87,
88,
89,
90,
91,
92,
93,
94]. The SWOT analysis framework was also used to ensure that the content of the questionnaire design covered several key areas of AIGC technology application, such as Personalized access to resources, the use of intelligent tutoring systems, and the changes in the quality of teaching and learning brought about by AIGC. At the same time, to ensure the quality and validity of the data, special attention was paid during the questionnaire design phase to avoid leading questions and to use different types of questions, such as multiple choice and scale questions, to improve the authenticity and completeness of the responses[
98].
Secondly, we will conduct a detailed data analysis of the collected data. We will use SPSS version 28 statistical software for detailed data analysis. First, we will ensure the reliability and credibility of the data through reliability and validity analysis[
99]. Secondly, descriptive statistical analysis is used to understand the essential characteristics of the sample[
100]. Thirdly, by analysing multiple response frequencies,[
100]To explore the attitudes and views of the Chinese university community towards the use of AIGC-supported Personalized learning and then to examine the specific contributions and challenges of AIGC-supported Personalized learning to educational sustainability through exploratory factor analysis and, fourth, through the Analytic Hierarchy Process (AHP) combined with the four dimensions of SWOT analysis (Strengths, Weaknesses, Opportunities and Threats). The AHP analysis mainly uses the frequency and response rate of the options in the questionnaire to directly calculate the normalised weight, avoiding the complexity of the traditional pairwise comparison matrix and consistency testing steps to efficiently and accurately obtain the weight distribution[
101].
Finally, based on the results of the above data analysis and through specific discussions, we will answer the three questions investigated in this research and conclude. This part of the content is not just a simple report of the data we have collected but a combination of literature analysis and actual data analysis to draw our conclusions and point out recommendations with practical significance[
102]. For example, what is the specific attitude of the Chinese student group towards Personalized learning through AIGC? If AIGC-based Personalized learning helps improve students' learning efficiency, we will further explore the success factors. Conversely, suppose AIGC-based Personalized learning has opposing challenges and impacts students' learning. In that case, we need to analyse the underlying reasons and consider how to improve and overcome these challenges.
2.2. Research Samples
We conducted a study on the impact of Artificial Intelligence Generated Content (AIGC)-driven Personalized learning on educational sustainability among Chinese college students, for which a detailed online questionnaire was specially designed.This study aims to comprehensively understand college students' experiences and the effectiveness of AIGC technology in learning and explore the challenges and opportunities this emerging technology may bring.
To ensure that the sample was broadly representative, we used a snowball sampling technique[
103]; colleges and universities in different regions, levels and types across China were selected as sampling points, with a particular focus on the group of college students using Artificial Intelligence Generated Content (AIGC) technology in Chinese universities. Questionnaires were distributed to students at these schools via online and social media channels to students from different regions of China using AIGC. These users were then encouraged to recruit other students who met the research criteria to join their social networks. This strategy not only helped to reach a specific but widespread audience but also helped to improve the sample's diversity, coverage and representativeness [
104].
Upon completing the survey, we collected 928 valid questionnaires.This response reflects the participants' high awareness and support for this study and demonstrates the effectiveness of our questionnaire design and distribution strategy, which can provide a solid basis for subsequent data analysis. In the process of eliminating invalid questionnaires, we strictly screened according to pre-set criteria, including but not limited to checking whether the questionnaire was completed, whether there were logical inconsistencies, whether the time taken to complete the questionnaire was reasonable, etc., to ensure that each questionnaire entering the analysis stage had a high degree of authenticity and reliability. Specifically, we assessed the validity of the questionnaire based on the following points: Completeness: all required questions must be answered; for non-required questions, the importance is determined according to the project's needs. Submission time: Ensure the questionnaire submission time is within the official launch period, excluding early or late submissions. Response time: set a reasonable minimum and maximum response time, considering the length and complexity of the questionnaire. Response times that are too short or too long will be regarded as abnormal and eliminated[
105].
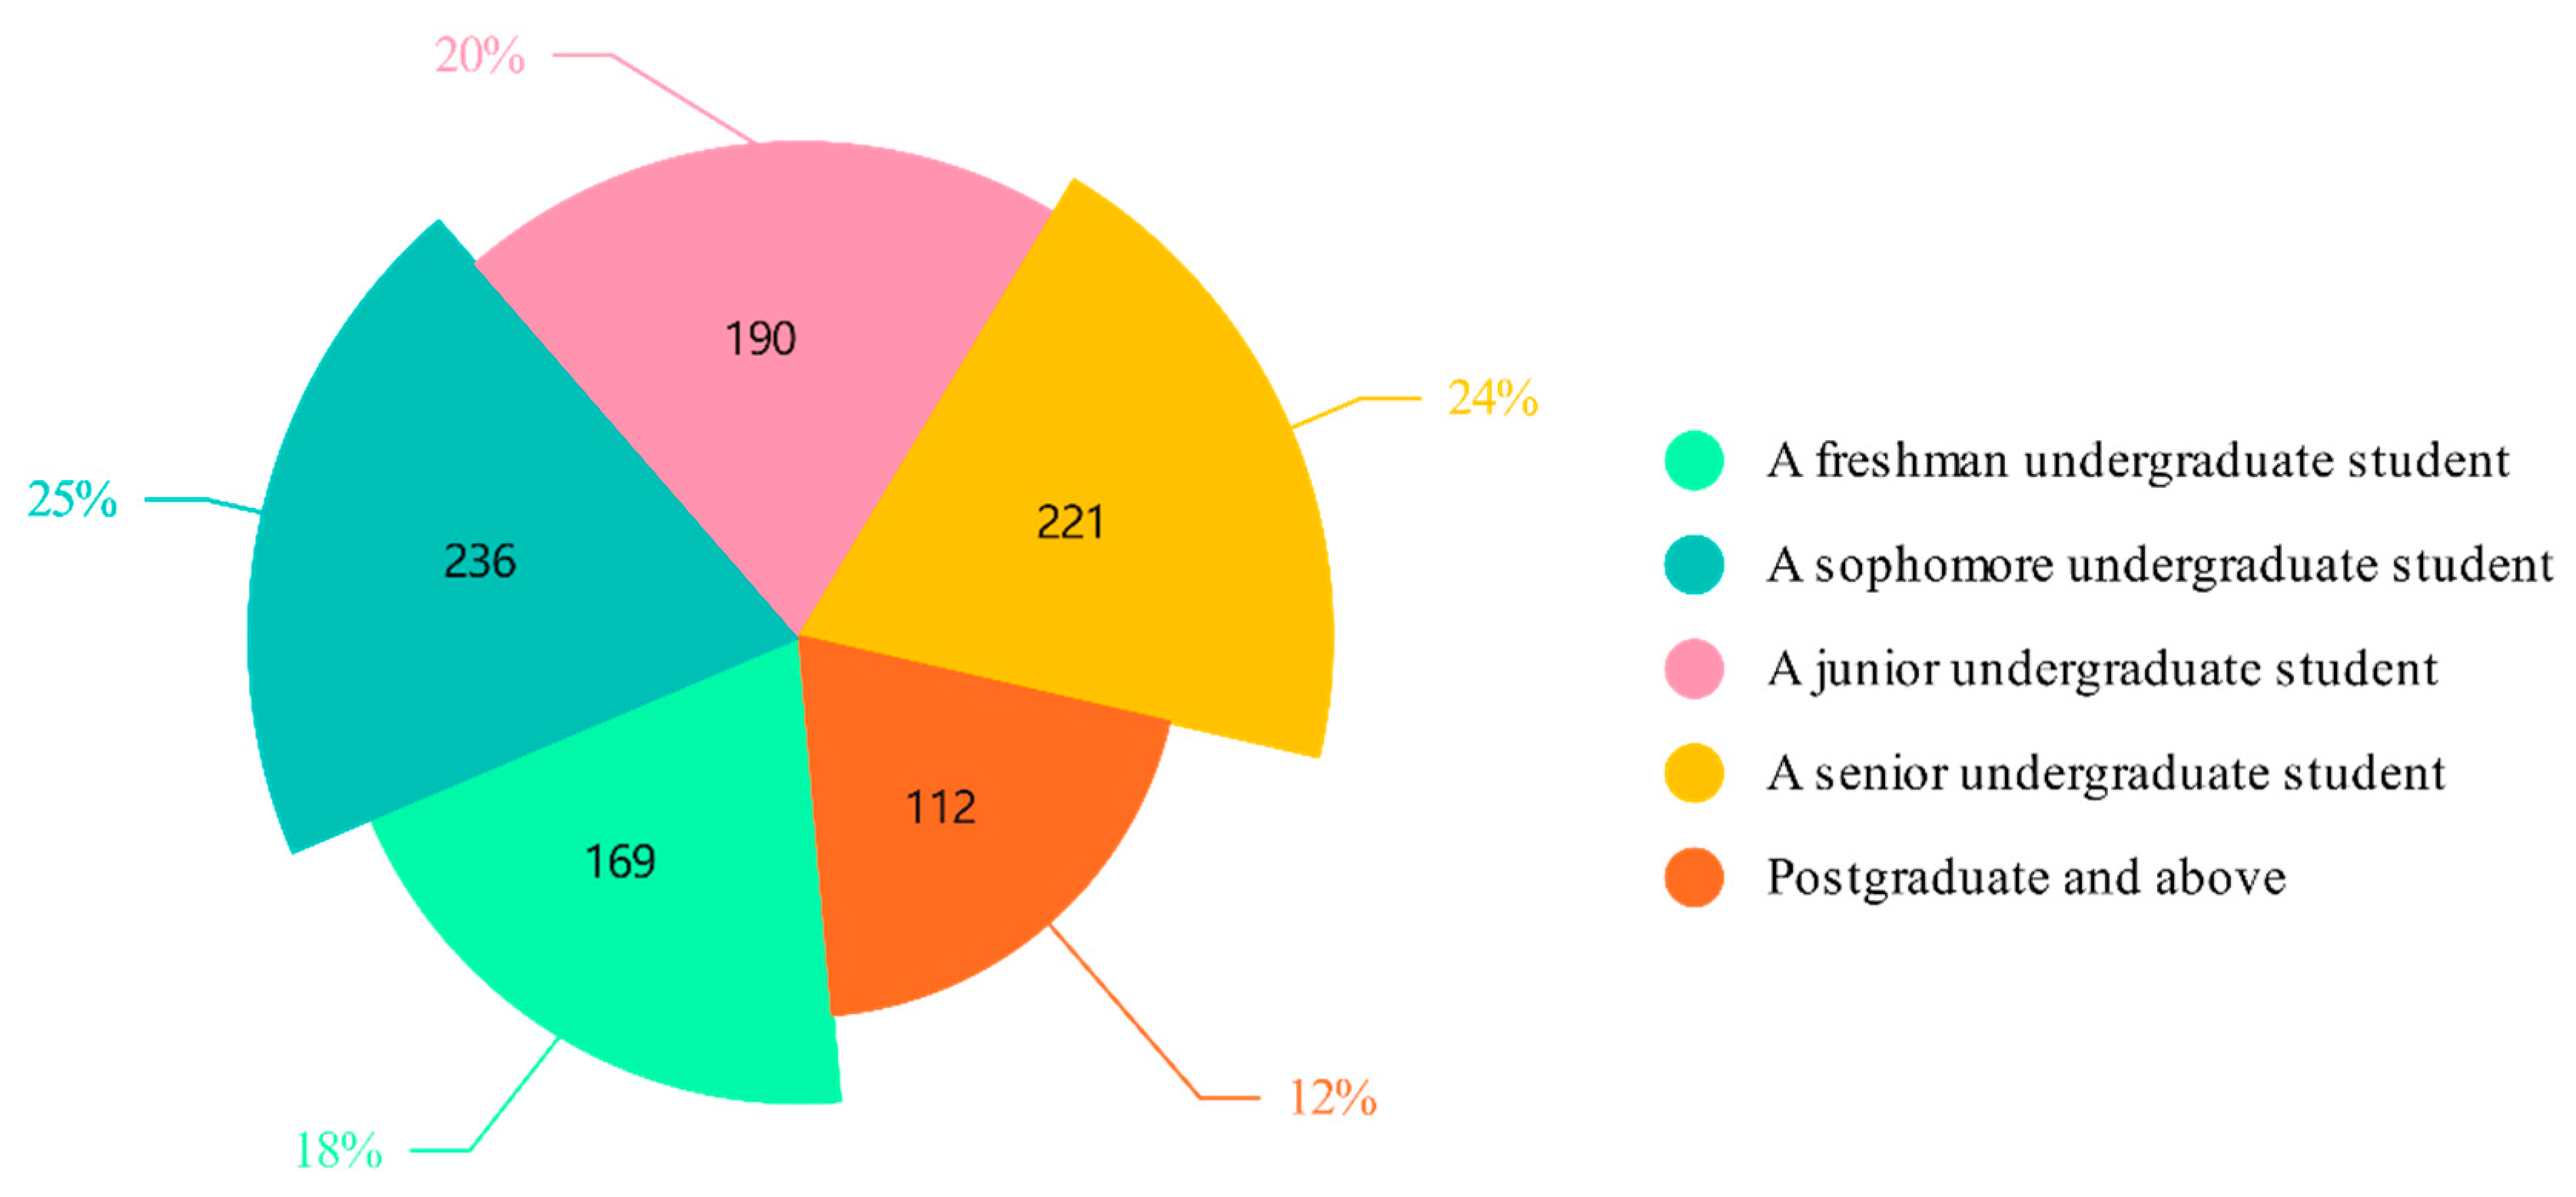
Next, a specific analysis of the grade composition of the participants who responded to the questionnaire is presented. From the valid questionnaires that were returned, the grade distribution of the participants shows specific characteristics that provide a valuable perspective for understanding the attitudes and use of AIGC technology among students in different grade levels (N = 928).
Figure 3 below shows the detailed grade distribution:
2.3. Questionnaire Design
This study designed a questionnaire based on a SWOT analysis [
106]to address existing research shortcomings and encourage further development. This methodology not only helped to achieve broader coverage of the target group but also saved time and money while ensuring that the sample size was large enough to support the validity of statistical inference and ensure the accuracy and reliability of subsequent data analysis. More importantly, we carefully designed the questionnaire's content through systematic literature review and analysis to ensure its scientific and targeted nature.
The design of the questionnaire was preceded by an extensive literature review covering the main theoretical and empirical findings on AIGC and its application in the field of education. This literature provided us with a solid theoretical foundation which helped us to define the specific dimensions of 'educational sustainability' - inclusiveness, equity and quality - and to establish operational definitions for these concepts. For example, inclusiveness is understood as the ability of AIGC to promote mutual understanding and cooperation between students from different cultural backgrounds; equity focuses on whether technology can reduce inequalities in educational opportunities due to various economic conditions; and quality refers to whether Personalized learning pathways can effectively meet individual learning needs. Based on an extensive literature review, we constructed a multi-dimensional questionnaire covering the technical characteristics of AIGC and user perceptions, usage experiences, and potential impacts. On this basis, we carefully selected or adapted a set of representative questions to ensure that they reflect current research hotspots and practical application scenarios' challenges.
The questionnaire for this study was designed in two parts. We started with the research questions for this study and designed the first part of the questionnaire accordingly. That is, the first three Likert scale questions in the questionnaire were developed based on the question of whether students recognise the contribution of AIGC-based Personalized learning to educational sustainability[
107](Five responses: strongly agree, agree, neither agree nor disagree, disagree, strongly disagree, scored as 5, 4, 3, 2, 1 respectively). The second part aims to fully understand students' views on the contribution and challenges of AIGC-driven Personalized learning to educational sustainability. In the second part of the questionnaire, we introduced the SWOT analysis framework (see
Table 1) [
107]. Such a framework not only helps us identify what exactly is driving the business but also allows us to identify potential risks and opportunities for improvement. We have developed four questions from the SWOT analysis model: strengths, weaknesses, opportunities and threats[
108], to Explore how students perceive the contribution and challenges of AIGC-led Personalized learning to educational sustainability.
The questionnaire for this study was designed using a two-stage methodology. Firstly, student attitudes were measured directly using carefully constructed scale questions, and secondly, a SWOT analysis framework was used for more detailed exploration. By creating a questionnaire structure in this way, the whole questionnaire is focused and flexible enough to respond to complex real-life situations, providing strong support for understanding and promoting AIGC-led Personalized learning. See
Table 2 for the specific questionnaire:
2.4. Questionnaire Feedback and Data Processing
After the survey was completed, we collected the questionnaires from the respondents and successfully recovered 928 valid questionnaires, giving an effective recovery rate of 92.8%. The data obtained were verified, confirmed and entered into SPSS software version 28. To ensure the quality of the data, we first verified and confirmed the questionnaires, eliminating any invalid samples that could affect the accuracy of the results.
The cleaned data were then imported into SPSS software version 25 for analysis. A reliability and validity analysis was first conducted to assess the reliability and validity of the questionnaire [
108], followed by a descriptive statistical analysis summarising the essential characteristics of the sample[
109]. This was followed by a descriptive statistical analysis summarising the crucial characteristics of the sample[
110]. A multiple response frequency and exploratory factor analysis were then carried out, showing the number of times each option was selected and its proportion, which helps to understand the differences between the different categories[
111]. Finally, an Analytic Hierarchy Process (AHP) calculation was performed to assess the relative importance of other options in the four dimensions of Strengths, Weaknesses, Opportunities and Threats (SWOT).
2.4.1. Reliability and Validity Analysis
According to the Cronbach's alpha coefficient table data presented in
Table 3, the Cronbach's alpha coefficient of the scale is 0.735 both before and after standardisation, indicating that both meet the standard of good reliability.
A total of 928 valid questionnaires and a relatively large sample size helped improve the stability and reliability of the reliability assessment. The calculated Cronbach's alpha coefficient of 0.735 is already entirely satisfactory for a scale with only three questions.
We then performed a statistical summary of the deleted analysis items. According to
Table 4, the statistical summary of the deleted analysis items, we first observed the average value after each item was deleted. We can see that the mean values of the three items "sustainability of education" (7.694), "equity of sustainability of education" (7.633), and "quality of sustainability of education" (7.635) are all high and similar, indicating that the respondents' positive evaluation of AIGC-driven Personalized learning in each dimension of educational sustainability is relatively consistent. Secondly, the variance data (3.926 to 4.04) show that the variance of the scale fluctuates less after each item is deleted, indicating that the degree of dispersion or variation in the scale does not change after an item is deleted. This supports the stability and reliability of the scale in measuring the same.
We then interpret the total variance component (see
Table 5). The data presented in the interpretation of the total variance component of the validity analysis provide key information on the eigenvalues of the principal components, the percentage of variance explained and their cumulative percentage.
The variance interpretation ratio measures the extent to which each principal component contributes to the total. It indicates the magnitude of the role of the principal component when the data is varied. It then reflects the proportion of the total variance in the data that a principal component can explain, which helps determine the number of principal components to retain. When interpreting the eigenroot of Component 1, which is 1.96, its variance interpretation rate is as high as 65.337%, and the cumulative percentage is also 65.337%. This means that component 1 accounts for most of the data variation that can be explained in the dataset. The eigenvalues of component 3 are 0.530.9, their variance interpretation rates are 17.02% and 16.961%, respectively, and the cumulative percentages reach 83.039% and 100%, respectively. Although components 2 and 3 are not as important as component 1, they also play a significant role in explaining the variation in the data. Overall, these three principal components explain the dataset (with a cumulative percentage of 100%), indicating that factor analysis is adequate and that the extracted principal components reflect the information in the original data. In particular, the high variance explained by Component 1 indicates that it is the most critical factor in the data set and is worthy of further in-depth study.
Finally, the table of factor load coefficients is a tool for assessing validity (see
Table 6). By examining the factor load coefficients and the commonality (common factor variance) after rotation, we can gain an in-depth understanding of the loading of each observed variable on the potential factors, thereby verifying the rationality of the scale design and the stability of the factor structure.
Specifically, the rotated factor loadings reflect the strength of the association between the observed variables and their corresponding factors. In this example, factor 1 covers the three key aspects of educational sustainability: sustainability, equity and quality. The loadings of the observations are all high, at 0.809, 0.813 and 0.803, respectively, all above the commonly accepted threshold of 0.5. These variables have a substantial load on 1, i.e. they can effectively reflect the broad characteristics of educational sustainability represented by factor 1. The degree of commonality (common factor) indicates the extent to which the observations are explained by their potential factors. In this case, the commonalities are 0.654, 0.662 and 0.644, all close to or above 6, further confirming the power of Factor 1 on these observed variables. A high degree of commonality means that most of the information in the observed variables can be captured by their corresponding factors, indicating internal consistency and construct validity.
2.4.2. Descriptive Analysis
According to the descriptive statistics in
Table 7, a descriptive statistical analysis was conducted on the three variables 'inclusiveness of education for sustainability', 'equity of education for sustainability' and 'quality of education' in the study, using 928 sample data in the context of Personalized learning driven by motivation. The sample size for each variable is 928, ensuring the data analysis's adequacy and representativeness. The rating system uses a 5-point Likert scale (strongly disagree to agree) covering the lowest to highest rating range firmly.
The mean scores for sustainability inclusiveness and fairness were 3.787 and 3.8846, respectively, close to the upper middle of the scale, indicating that the respondents rated AIGC-led Personalized learning positively regarding the different dimensions of educational sustainability. The standard deviations were 1.169, 1.159 and 1.145, respectively, indicating some dispersion in the distribution, but the degree of dispersion was relatively small, indicating that the respondents' evaluations were relatively concentrated and there were no extremes. 4 This further confirms the trend reflected in the mean, i.e. a higher rating by most respondents. The standard deviation reflects the degree of dispersion of the data. Its values (inclusiveness 1.368, fairness 1.344, quality 1.311) mirror the standard deviation results, indicating that the data distribution is relatively concentrated. The kurtosis values are -0.089, 0.136 and 0.066, respectively, all close to 0 and close to a normal distribution, with no apparent peaks or troughs. The skewness values are -0.873, -0.976 and -0.928, respectively, all of which are negative and have large absolute values, indicating that the data distribution is skewed to the left, with the frequency of low scores slightly higher than that of high scores but overall still within an acceptable range. The coefficients of variation (CV) are 0.309, 0.301 and 0.298, respectively, all of which are less than 0.5, indicating that the degree of dispersion of the data is relatively small compared to the mean and that the consistency of the ratings is high.
2.4.3. Multiple Response Frequency Analysis
Table 8 shows the Multiple Response Frequency Analysis table, which shows the frequency distribution of the options, including the number of cases, the response rate and penetration rate, and the significance P value. The response rate is the proportion of all options selected for each option in a multiple-choice question. For example, if 10 people answer a multiple choice question, but 36 options are chosen, of which 8 are option a, the response rate for a = 8/36. The popularity rate is the proportion of each option selected for the valid sample. For example, if 10 people answer a multiple choice question with 8 options, of which 8 are option a, the popularity rate for a = 8/10—both the response rate and the popularity rate focus on analysing the higher-order items.
First, there is a consensus among the dominant participants that AIGC-driven Personalized learning has apparent advantages in terms of efficient organisation and access to learning resources (63.47% penetration rate), content that is more in line with personal interests and needs (59.806% penetration rate), and significantly improved equity in education (60.022% penetration rate). These benefits are highly statistically significant (p<0.001), indicating recognition. In addition, better stimulation of interest in learning and creativity (55.388% penetration rate) and promotion of lifelong learning (48.707% penetration rate) are also essential benefits; although the penetration rates are slightly lower, they are also statistically significant.
In terms of disadvantages, interruptions in learning due to technical problems (45.797% prevalence) were the main challenge faced by participants, followed by difficulties in getting immediate help (54.634% prevalence) and insufficiently rich or updated learning content (57.759% prevalence). These disadvantages are also statistically significant and reflect some problems with the practical application of Driven Personalized Learning. In contrast, the lack of a sense of personal interaction (28.987% prevalence) and the high demands on students' ability to learn independently (28.879% prevalence) are also challenges, but the prevalence rates are relatively low, and the statistical significance may be weak.
Regarding opportunities, participants believe that strengthening integration with other educational technologies (69.289% penetration rate) is the most important direction for future AIGC-supported Personalized learning that integrates meaning. Providing more interdisciplinary learning resources (53.233% penetration rate) and increasing interactivity and social functions (51.616% penetration rate) are essential development directions. Although improving the level of intelligence of algorithms (38.4% penetration rate) and ensuring continuous updates (37.177% penetration rate) were also mentioned, the relatively low penetration rates may reflect the relatively low expectations of the participants or a certain level of satisfaction with the intelligence of the technology and the quality of the content.
Regarding threats, high technical costs and maintenance fees (59.052% prevalence) are the main factors hindering the widespread use of AIGC-based Personalized learning. In addition, privacy and data security issues (41.703% prevalence), teacher and student emotions (44.397% prevalence), lack of support and training resources (50.754% prevalence), and algorithmic bias and fairness issues (45.366% prevalence) are also essential threats. These statistically significant factors indicate barriers to adopting AIGC-based Personalized learning.
The results of the KMO test in
Table 9 show that the KMO value is 0.627. At the same time, the results of the Bartlett sphericity test show that the significance p-value is 0.000***, which is significant at this level. This rejects the null hypothesis; the variables are correlated, so the factor analysis is valid. The questionnaire's data structure is valid and can be used for the subsequent factor analysis.
Table 10 below shows the factor loadings, which can be used to analyse the importance of the hidden variables in each principal component. Suppose we have identified n factors. Factors i with significant factor loadings for a, b, c and d can be assigned to an element (which can be renamed for clarity).
In exploratory factor analysis, the rotated factor loadings table provides key information revealing the relationship between variables and potential factors. An in-depth study of this table provides an accurate interpretation and understanding of the AIGC-driven factor structure across the four dimensions of strengths, weaknesses, opportunities and threats.
2.4.4. SWOT-AHP Analysis
To explore the role and challenges of AIGC-driven Personalized learning in promoting educational sustainability, this study conducted a SWOT-AHP analysis of questions 4 to 7 of the questionnaire. This study used a normalised weight instead of a comparison matrix, mainly based on data collection methods and computational efficiency considerations. The questionnaire directly provides the frequency and response rate of the options, which already reflects the relative importance of the options, so there is no need to make a subjective comparison by constructing a comparison matrix. Normalised weighting is more concise and efficient as it can directly generate weights based on response and prevalence rates. This avoids the computational complexity and consistency checking steps of the comparison matrix when there are many options, making it more suitable for processing large amounts of questionnaire data and deriving weighting results. The specific steps are:
(1)Internal factor weight calculation
For each option under each SWOT dimension (Strengths S, Weaknesses W, Opportunities O and Threats T), the relative weight is determined by standardisation based on popularity (i.e. the percentage of effective samples selecting that option):
Example: Option A has a popularity of 63.47% on the Advantages dimension and a total popularity of 287.40%. Its internal weight is:
(2)SWOT category weight calculation
The overall importance is determined based on the proportion of total responses in each dimension:
Example: The total number of responses for the benefit dimension is 2,667, and the total number of responses for the sample is 9,229. The weight of the main category is:
(3)Comprehensive priority ranking
Combine the internal weights with the category weights to calculate the global priority:
Example: The combined weight of opportunity A (technology integration) is:
(4)Results and analysis
Table 11.
Strengths
| options (as in computer software settings) |
Count (N) |
Penetration rate (%) |
Internal weighting (%) |
| A |
589 |
63.47 |
22.08 |
| B |
555 |
59.81 |
20.80 |
| C |
557 |
60.02 |
20.88 |
| D |
514 |
55.39 |
19.27 |
| E |
452 |
48.71 |
16.95 |
| (grand) total |
2,667 |
287.40 |
100.00 |
Table 12.
Weaknesses
| options (as in computer software settings) |
Count (N) |
Penetration rate (%) |
Internal weighting (%) |
| A |
425 |
45.80 |
21.20 |
| B |
269 |
28.99 |
13.42 |
| C |
507 |
54.63 |
25.28 |
| D |
536 |
57.76 |
26.74 |
| E |
268 |
28.88 |
13.37 |
| (grand) total |
2,005 |
216.06 |
100.00 |
Table 13.
Opportunities
| options (as in computer software settings) |
Count (N) |
Penetration rate (%) |
Internal weighting (%) |
| A |
643 |
69.29 |
27.73 |
| B |
494 |
53.23 |
21.30 |
| C |
479 |
51.62 |
20.65 |
| D |
357 |
38.47 |
15.40 |
| E |
345 |
37.18 |
14.88 |
| (grand) total |
2,318 |
249.79 |
100.00 |
Table 14.
Threats
| options (as in computer software settings) |
Count (N) |
Penetration rate (%) |
Internal weighting (%) |
| A |
387 |
41.70 |
17.28 |
| B |
548 |
59.05 |
24.47 |
| C |
412 |
44.40 |
18.42 |
| D |
471 |
50.75 |
21.02 |
| E |
421 |
45.37 |
18.80 |
| (grand) total |
2,239 |
241.27 |
100.00 |
Table 15.
SWOT Category Weight Table
Table 15.
SWOT Category Weight Table
| dimension (math.) |
Total number of responses (N) |
Weighting of broad categories (%) |
| Strengths (S) |
2,667 |
28.89 |
| Weaknesses (W) |
2,005 |
21.73 |
| Opportunities (O) |
2,318 |
25.11 |
| Threat (T) |
2,239 |
24.26 |
| (grand) total |
9,229 |
100.00 |
Table 16.
Comprehensive priority top 5 ranking table
Table 16.
Comprehensive priority top 5 ranking table
| rankings |
considerations |
SWOT dimension |
Weighting of broad categories (%) |
Internal weighting (%) |
Combined weight (%) |
| 1 |
Opportunity A (technology integration) |
O |
25.11 |
27.73 |
6.97 |
| 2 |
Strength A (efficient resources) |
S |
28.89 |
22.08 |
6.38 |
| 3 |
Strength C (Educational Equity) |
S |
28.89 |
20.88 |
6.03 |
| 4 |
Strength B (Not Specified) |
S |
28.89 |
20.80 |
6.01 |
| 5 |
Threat B (High Cost) |
T |
24.26 |
24.47 |
5.94 |
(5)Statistical validation
Chi-square test of the distribution of options for the dominant dimension The result of the significance test is:
Indicates that the difference in option choice is highly statistically significant. Consistency of weights: The sum of the weights within all dimensions is 100%, and the sum of the weights of the main categories is 100%. There is no cumulative error in the calculation process.
Verification of the response rate: The response rates for the high-weight options (e.g. Opportunity A, Advantage A) (69.29%, 63.47%) are significantly higher than the average, supporting the rationality of their priority.